the sheltered genetic load linked to the s-locus in plants ... crossed individuals sharing alleles...
TRANSCRIPT

1
The sheltered genetic load linked to the S-locus in plants: new insights from theoretical and 1
empirical approaches in sporophytic self-incompatibility 2
Llaurens V.*, Gonthier L*, Billiard S.* 3
4
5
6
Corresponding author: Sylvain Billiard 7
Email : [email protected] 8
9
10
* Laboratoire de Génétique et Evolution des Populations Végétales, UMR CNRS 8016 11
Université des Sciences et Technologies de Lille - Lille1 12
F-59655 Villeneuve d'Ascq cedex 13
France 14
15
Keywords: inbreeding depression, genetic load, self-incompatibility overcome 16
Running title: Sheltered load linked to sporophytic self-incompatibility locus 17
18
Genetics: Published Articles Ahead of Print, published on September 14, 2009 as 10.1534/genetics.109.102707
2
Abstract 19
Inbreeding depression and mating systems evolution are closely linked, because the purging of 20
deleterious mutations and the fitness of individuals may depend on outcrossing vs. selfing rates. 21
Further, the accumulation of deleterious mutations may vary among genomic regions, especially for 22
genes closely linked to loci under balancing selection. Sporophytic self-incompatibility (SSI) is a 23
common genetic mechanism in Angiosperm that enables hermaphrodite plants to avoid selfing and 24
promote outcrossing. The SSI phenotype is determined by the S-locus and may depend on dominance 25
relationships among alleles. Since most individuals are heterozygous at the S-locus and recombination 26
is suppressed in the S-locus region, it has been suggested that deleterious mutations could accumulate 27
at genes linked to the S-locus, generating a ‘sheltered load’. In this paper, we first theoretically 28
investigate the conditions generating sheltered load in SSI. We show that deleterious mutations can 29
accumulate in linkage with specific S-alleles, and particularly if those S-alleles are recessive. Secondly, 30
we looked for the presence of sheltered load in Arabidopsis halleri using CO2 gas treatment to 31
overcome self-incompatibility. By examining the segregation of S-alleles and measuring the relative 32
fitness of progeny, we found significant sheltered load associated with the most dominant S-allele 33
(S15) out of three S-alleles tested. This sheltered load seems to be expressed at several stages of the 34
life-cycle and to have a larger effect than genomic inbreeding depression. 35
36

3
Introduction 37
The main genetic mechanism causing inbreeding depression is believed to be the expression of 38
recessive mildly deleterious mutations in inbred individuals (CHARLESWORTH and CHARLESWORTH 39
1999). Those deleterious mutations are generally supposed to be distributed throughout the genome. 40
However, some genomic regions where loci under balancing selection are present may be more 41
inclined than others to accumulate deleterious mutations and could lead to the formation of what is 42
generally called a “sheltered load” (UYENOYAMA 1997, VAN OOSTERHOUT 2009). The sheltered load 43
has been suggested as a potential reason why MHC genes, mating-type systems in fungi and self-44
incompatibility systems in plants generally show longer terminal branches in their genealogies than 45
expected (RICHMAN 2000). Despite its potential importance, the extent of the sheltered load is still 46
largely unknown. 47
Homomorphic self-incompatibility is widely distributed among Angiosperm families (DE 48
NETTANCOURT 2001; IGIC et al. 2008). Self-incompatibility (SI) is controlled by genes under strong 49
balancing selection. SI prevents self-fertilization and promotes outcrossing by the presence of a gamete 50
recognition system involving proteins expressed in both the pollen and the pistil. The proteins 51
controlling the recognition system are generally encoded by genes located in a single genomic region, 52
the S-locus. Each plant in a self-incompatible population expresses an S-specificity and is unable to 53
mate with other plants expressing the same specificity. In species with gametophytic self-54
incompatibility (GSI), the S-specificity is controlled by interactions between protein expressed in the 55
pollen’s haploid genome, the male gametophyte, and the pistil’s diploid genome. In species with 56
sporophytic self-incompatibility (SSI), S-specificity is controlled by interactions between gene 57
products of the diploid sporophyte expressed on the pollen coat with those on the stigmatic surface. In 58
this mating system, three reasons may facilitate the accumulation of recessive deleterious mutations in 59
this region, namely a “sheltered load” (UYENOYAMA 1997). First, high heterozygote frequencies are 60
expected in populations at the S-locus but also at other linked loci in the S-locus genomic region 61
(KAMAU et al. 2007). Second, negative frequency dependent selection, a form of balancing selection, 62
4
is the main selective force acting on the S-locus and on linked genes (CASTRIC AND VEKEMANS 2004). 63
Third, the recombination rate is low in the S-locus region (CASSELMAN et al. 2000; CHARLESWORTH et 64
al. 2003). Such a sheltered load may have important evolutionary consequences for SI evolution: it can 65
slow down the rate of emergence of new S-alleles (UYENOYAMA 2003), considerably extend the 66
conditions for the persistence of GSI (PORCHER and LANDE 2005) and, finally, substantially increase 67
the inbreeding depression in a small population (GLÉMIN et al. 2001), which can have large 68
consequences for endangered species and the viability of their populations. 69
The magnitude of the sheltered load should depend on the size of the genomic region in which 70
heterozygosity is enforced because of linkage to the S-locus, and also on the number of genes affecting 71
fitness in that region. From an analysis of recombination rates in the S-locus genomic region in 72
Arabidopsis lyrata, a species with SSI, KAWABE et al. (2006) suggested that the number of genes in 73
the S-genomic region is probably not high enough for a large sheltered load to have an impact on 74
fitness compared to the overall genomic load. DOWD et al. (2000) indeed found only thirteen genes 75
near the S-locus in Petunia inflata. However, two studies have demonstrated the existence of 76
transmission ratio distortion of some S-alleles in Arabidopsis lyrata (BECHSGAARD et al. 2004, 77
LEPPALA et al. 2008). The authors proposed that this could be indirect evidence of the existence of a 78
sheltered load. To the best of our knowledge, the existence of sheltered load in SI species was 79
specifically demonstrated so far only in Solanum carolinense, a species with GSI: STONE (2004) 80
crossed individuals sharing alleles at the S-locus, using bud pollination to overcome self-81
incompatibility. By looking at seed number and genotype of the progeny, a sheltered load linked to 82
only two out of seven S-alleles investigated was detected. Direct evidence and estimations of the extent 83
of the sheltered load are thus lacking. 84
In SSI, complex dominance interactions among S-alleles are usually observed (Ipomoea trifida, 85
KOWYAMA et al. 1994, Brassica campestris, HATAKEYAMA et al. 1998, A. Lyrata, MABLE et al. 2003, 86
and A. halleri, LLAURENS et al. 2008a). The effect of these dominance interactions on the occurrence 87
of a sheltered genetic load have been investigated neither theoretically nor empirically, but may 88

5
potentially be large. Indeed, recessive S-alleles are expected to be more often homozygous in natural 89
populations than dominant alleles (SCHIERUP et al. 1997), and so may rapidly purge strongly 90
deleterious recessive mutations, and thus should limit the sheltering effect. The sheltered load could 91
thus differ depending on the dominance levels of the associated S-alleles. 92
In this study, we first investigated the theoretical conditions for the accumulation of a sheltered load in 93
a SSI system, using stochastic simulations. Then, we empirically tested the existence and strength of S-94
linked sheltered load in relation to dominance levels in SSI. We focused on A. halleri, a member of the 95
Brassicaceae family. In this family, the S-locus region includes two major genes: SCR (also called SP-96
11), encoding a cysteine-rich protein of the pollen envelope, and SRK, encoding a receptor kinase 97
located across the membrane of the papilla cells. High heterozygote frequencies at the S-locus have 98
been found in several species like Brassica insularis (GLÉMIN et al. 2005) or Arabidopsis lyrata 99
(SCHIERUP et al. 2006). The SRK and SCR genes are tightly linked, since they are located close to each 100
other, and recombination suppression in the S-locus region has been suggested in several studies: in 101
Brassica (CASSELMAN et al. 2000) and in Arabidopsis lyrata (KAMAU and CHARLESWORTH 2005, 102
KAWABE et al. 2006). The conditions thus may be suitable for the existence of sheltered genetic load in 103
A. halleri. We performed controlled pollinations in A. halleri to specifically measure the magnitude of 104
the potential sheltered load of three S-alleles with different dominance levels: a dominant, an 105
intermediate and a recessive allele. To evaluate the effect of the sheltered load on these crosses, we 106
looked at the number of seeds produced, as well as at the development and the genotype at the S-locus 107
of the progeny. 108
109
6
Materials and methods 110
Simulations 111
We aim at testing whether a sheltered genetic load could accumulate in the S-locus region, and 112
whether its strength depends on the dominance of the linked S-allele. We thus studied the frequencies 113
of deleterious mutations at loci completely linked to a sporophytic self-incompatibility locus. We 114
simulated a panmictic population of N diploid individuals with non-overlapping generations. Each 115
individual is defined by its genotype in a genomic region within which there is no recombination. This 116
region contains the S-locus, as well as locus we called “D-locus”, at which two alleles could segregate: 117
0 and 1. Allele 1 is deleterious and completely or partially recessive. 118
The life cycle in our simulations had four steps: (i) gametogenesis: N adult individuals produced 119
infinity of ovules and pollen; (ii) syngamy: The frequency of each S-locus genotype in seeds was 120
deterministically computed following the general equations given in BILLIARD et al. (2007). Crosses 121
between ovules and pollen were compatible when the specificities expressed in pollen and stigmas 122
were different. We define φi as the proportion of allele Si associated with allele 1 at the D-locus. Since 123
genotypic frequency change during syngamy only depends on the genotype at the S-locus, φi is 124
constant during syngamy. For any {i, j}, the proportion of the four possible genotypes at the D-locus 125
among genotypes SiSj were computed as φi φj and (1- φi )(1- φj) for homozygotes at the D-locus, and 126
φi(1- φi ) and φj(1- φi ) for heterozygotes. During this step, the frequency of allele 1 in the whole 127
population may have changed by hitch-hiking if the frequency of alleles Si or Sj changed. The 128
reproduction regime used was the “fecundity selection” model (VEKEMANS et al. 1998), which 129
assumes that frequency-dependent selection acts through both pollen and pistil; (iii) viability selection 130
and regulation: we assumed that the survival probability p of a zygote depends on its genotype at the 131
D-locus: for heterozygous individuals p = (1-h s) while for homozygotes p = (1-s), where s and h are 132
respectively the selection and the dominance coefficients of allele 1 relative to allele 0. To form the 133
next generation, we randomly drew zygotes following multinomial sampling with the genotypic 134
frequencies after syngamy as parameters; we computed p for this zygote and randomly determined 135

7
whether this individual survived. We repeated these steps until N surviving individuals were obtained; 136
(iv) mutation: we defined the mutation rate µ from allele 0 to allele 1 at the D-locus, and the reverse 137
mutation rate η from allele 1 to allele 0. We randomly drew the total number of mutations occurring in 138
the population following a Poisson distribution. We then randomly assigned each mutation to a single 139
chromosome, with replacement. The mutation rates were fixed to µ=10-4 and η = 10-5 or 10-7 per 140
chromosome per generation. 141
We used a simple model of SSI, with hierarchical dominance interactions, similar to those observed in 142
A. halleri (LLAURENS et al. 2008a). Three dominance classes were assumed with five S-alleles (two 143
alleles in the most dominant and the intermediate dominance classes, one allele in the most recessive 144
class) or eight S-alleles (respectively four, three and one allele in the dominant, intermediate and 145
recessive classes). The alleles in the most dominant class were codominant relative to each other and 146
dominant over all alleles of the intermediate and the recessive classes. The alleles in the intermediate 147
dominance class were also codominant relative to each other and dominant over the allele in the most 148
recessive class. The same dominance relationships were assumed in both pollen and pistil. We also 149
assumed that no new S-allele could appear by mutation during simulations. The size of the population 150
was however large enough (N = 1000) to avoid S-alleles loss by drift during the simulations. 151
At the initial state, only allele 0 occurs at the D-locus. We first ran simulations without deleterious 152
mutations until deterministic equilibrium was reached for S-alleles frequencies, defined by the time 153
when all allelic frequencies changes in one generation were lower than 10-3. Mutations at the D-locus 154
were then allowed. Each simulation was performed with 100 independent replicates of 100,000 155
generations and the frequency of the deleterious alleles was recorded every 1,000 generations. We will 156
use the term “fixation within an allelic family” when all haplotypes of a given S-allele Si are carrying 157
the same deleterious mutation at the D-locus, in other words when φi = 1. We estimated the frequency 158
spectrum of the deleterious allele in the whole population as i
n
ii f∑
=
≡Φ1
ϕ , with n the total number of S-159
alleles in the population and fi the frequency of allele Si in the whole population. 160
161
8
Plant material 162
Arabidopsis halleri (Brassicaceae) is a diploid species taxonomically closely related to the two model 163
species, A. thaliana, and A. lyrata (CLAUSS and KOCH 2006). It is a European species growing both in 164
mountainous areas and on heavy-metal polluted areas. We used plants issued from seeds collected in a 165
single natural population of A. halleri located in Nivelle (France) whose mating pattern has been 166
extensively studied (LLAURENS et al. 2008b). In this population, the selfing rate was estimated to be 167
null, based on progeny analyses from natural pollinations. In controlled self-pollinations performed on 168
the plants grown in the greenhouse, fruits were formed after only ~3% of pollinations (LLAURENS et al. 169
2008a). These results demonstrated that the self-incompatibility system is functional in individuals 170
from this population. 171
172
Overcoming self-incompatibility 173
We used the following experimental procedure to disentangle the effect of reduced fitness caused by 174
sheltered load of deleterious mutations, from inbreeding depression due to mildly deleterious 175
mutations located throughout the whole genome (genomic load or background inbreeding depression). 176
Three different categories of crosses were performed by manual transfer of pollen from different donor 177
plants to stigmas: (1) Selfing crosses (S): enforced selfing with pollen from the same plant; (2) 178
Incompatible crosses (I): enforced incompatible crosses with pollen from a different individual sharing 179
the same genotype at the S-locus, and (3) Control crosses (C): outcrossing with pollen from an 180
individual with a different genotype at the S-locus, crosses are hence performed between compatible 181
individuals. The decline in fitness, measured by the difference in the number and development of 182
seeds, in offspring derived from selfing vs. incompatible crosses was interpreted as the effect of 183
deleterious mutations located genome-wide. We hypothesized that offspring from enforced selfing 184
should be affected by both genomic and sheltered loads while offspring from enforced incompatible 185
crosses should be affected by sheltered load only. Finally, offspring from outcrossing controls should 186
experience neither the background inbreeding depression nor the sheltered load. We assumed that the 187
9
phenotypic measurements of the control, incompatible and selfed crosses were estimators of the fitness 188
components of outbred individuals, ˆoutbredw , incompatible but outbred, ˆ incompatiblew and inbred 189
individuals, ˆ inbredw . We defined the sheltered genetic load and genomic inbreeding depression as 190
ˆ ˆ ˆlocusS outbred incompatiblew wδ = − and ˆ ˆ ˆGenomic outbred inbredw wδ = − respectively. We thus inferred the contribution 191
of the sheltered load relative to the genomic inbreeding depression by computingˆ
ˆlocusS
genomic
δδ
. 192
Genotypes at the S-locus were determined by PCR targeted for the pistil-expressed SRK gene, with S-193
allele specific primers as described below. We will use the abbreviation S instead of S-allele AhSRK 194
throughout the paper for simplification. We used two sets of five individuals with genotype [S01 S15] 195
and [S01 S02]. A previous study on this population showed that the S-allele S01 was the most recessive 196
allele, S02 had intermediate dominance level and S15 had a high dominance level (LLAURENS et al. 197
2008a). The individual used for the control crosses had genotype [S04 S20]. For each plant, we 198
performed twenty self-pollinations, eight incompatible crosses (two with each of the four other plants 199
of the same S-locus genotype), and four control crosses. In some cases, pollinations were not 200
successful and we thus performed the same cross several times. In summary, we performed 469 201
crosses, collected 1200 seeds, measured and genotyped 872 offspring. 202
All crosses were performed under CO2 gas treatment in order to overcome self-incompatibility, as 203
described in NAKANISHII et al. (1969). Although this method is commonly used by seed companies to 204
maintain inbred lines of Brassicaceae, we used this method for the first time in A. halleri. We 205
performed controlled pollinations under a binocular magnifying glass. Anthers of pollen donors were 206
collected with tweezers and the recipient pistil was dusted with pollen. The pollinated plants were then 207
placed overnight in an atmosphere with 5% CO2. Pistils were marked individually and measured seven 208
days after pollination. We considered a cross successful when the size of the silique after seven days 209
was larger than 6.1 mm and seed development was observed (LLAURENS et al. 2008a). We collected 210
seeds and grew the offspring in a greenhouse under constant temperature T=20°C and photoperiod 16h 211

10
day/ 8h night. Offspring from the three crosses categories were randomly placed on the greenhouse 212
tables. 213
To check our controlled pollinations for contamination by pollen from other sources, we determined 214
some of the offspring genotypes at seven neutral markers, to ensure that they were compatible with the 215
genotypes of the parents. In total, 87 offspring from six selfed, 55 offspring from six incompatible 216
crosses, and 13 offspring from one control cross were tested for seven microsatellite loci (NGA112, 217
NGA361, GC22, MDC16, ICE13, H117 and Athzfpg) following the method described in LLAURENS et 218
al. (2008b). We detected inconsistent genotype in only 3.2 % of the offspring analyzed, possibly due to 219
contaminated pollination. 220
221
Estimation of genomic inbreeding depression and sheltered load via phenotypic traits 222
We assessed the reproductive success of offspring from the different categories of crosses, based on 223
several fitness measures. We expect a priori that fitness depends on the cross type in the following 224
order: outbredleincompatibinbred www ˆˆˆ << , that is the fitness measures from selfing crosses is expected to be 225
lower than for incompatible crosses, themselves lower than control crosses. Here we measured seven 226
phenotypic traits as an estimation of the fitness, and we expect that for there should be significant 227
differences in phenotypic values in the following order S<I<C (or the reverse, depending on the 228
measured phenotypic trait). Hence, if such a trend is significant in our measure, we will conclude that 229
our hypothesis that outbredleincompatibinbred www ˆˆˆ << is verified. 230
As the fitness effects associated with the overcoming of self-incompatibility may differ depending on 231
the maternal strain, maternal-effects were controlled by performing two kinds of analysis, depending 232
on the considered fitness trait. The number of seeds per fruit and the seed germination rates were 233
analyzed with Page’s trend test (PAGE, 1963) using the software StatXact8. Page’s trend test is a non 234
parametric test, used for ordered correlated variables when there are more than two related samples. It 235
was applied here since we measured the number of seeds per fruit and the germination rate for 236
different types of cross, for five mothers only. It specifically tests the hypothesis H0: S=I=C against 237
11
the alternative H1: S<I<C (or the reverse). If H0 is rejected, it means that at least one of the categories 238
of variable is significantly lower with respect to any others. When the test was significant, multiple 239
comparisons were performed using the Page’s trend tests, with Bonferroni correction. 240
The length and width of the biggest leaf measured two weeks after germination, the appearance time of 241
the first leaf, as well as the germination and cotyledon appearance times were compared by a two-way 242
ANOVA, with the maternal identity and the cross type as fixed effects. The two variables 243
“germination time” and “first leaf appearance time” were transformed in logarithm for normality. 244
When there was a significant mother x cross interaction and no clear trend in the means was detected, 245
our expectation S<I<C was considered invalidated. When a significant effect of the types of cross was 246
detected without interaction between mother and cross types, a Dunnett multiple comparisons test was 247
performed, using the incompatible cross as reference. 248
Finally, the offspring fitness estimate was compared depending on their genotype at the S-locus. A 249
three-way ANOVA was performed on the genotypes of offspring from the selfing and incompatible 250
crosses only. The three factors tested were: the maternal identity, the cross type, and the genotype at 251
the S-locus. In cases where there was no interaction, a Dunnett multiple comparisons test was 252
performed with the heterozygote genotype as a reference. 253
The relative effect of the sheltered load compared to the effect of background inbreeding depression 254
was also computed. For fitness parameters with significantly different values for the three categories of 255
crosses, we estimated the contribution of the sheltered load relative to the genomic inbreeding 256
depression by computing ˆ
ˆlocusS
genomic
δδ
(as described above). 257
258
Estimation of background inbreeding depression and sheltered load via segregation bias 259
To detect early-acting inbreeding depression, we computed the segregation of S-alleles in the 260
offspring. We extracted DNA from offspring leaves collected two weeks after germination. Leaf 261
samples were oven-dried at 55°C, and DNA was extracted using the Nucleospin® Multi-96 Plant 262

12
extraction kit from Macherey-Nagel®. We used S-allele specific primers to amplify only one S-allele 263
(for details see LLAURENS et al. 2008a). The reaction mixture (15µL) contained 20 ng DNA, 1X buffer 264
(Applied biosystem®), 2 or 2.5 mM of MgCl2 (depending on the primer pair), 200 µM of Fermentas® 265
DNTP mix, 200 µg/mL of BSA, 0.2 µM of each microsatellite primer, and 0.025 U/µL of Taq 266
polymerase (Amplitaq DNA polymerase, Applied biosystem®). The amplification was carried out for 267
5 min at 95°C, followed by 35 cycles of 40 s at 95°C, 40 s at annealing temperature (specific for each 268
pair of primer), 40 s at 72°C, and one cycle of 10 min at 72°C and performed in MJ research PTC 200 269
thermocycler®. PCR products were mixed with loading dye then loaded into a 2% agarose, subjected 270
to 110 MV current and visualized with ethidium bromide. The PCR products were sized by 271
comparison with a sizing marker. We used DNA from an individual carrying the targeted S-allele as 272
positive control for each PCR. 273
We looked for evidence of segregation distortion in the offspring at the S-locus. As a first test, χ2 tests 274
were used to check for discrepancy from Mendelian expectations in the genotypic frequencies in the 275
offspring. To estimate the strength of the sheltered load, we used the observed genotypic frequencies 276
change in incompatible crosses. We estimated S, the selection coefficient of the deleterious mutations 277
associated with allele Sb, and their dominance level H, assuming that the sheltered load acts during the 278
sporophytic stage only. In other words, we assumed that the initial frequencies of genotypes SaSa, 279
SaSb and SbSb in zygotes produced by a cross between two parents SaSb were 1/4, 1/2, 1/4, 280
respectively. We assumed that the fitness of these genotypes in zygotes are respectively, 1, 1-H S and 281
1-S such as the genotypic frequencies in offspring after selection are respectively 1 1
4 w,
1 (1 )
2
HS
w
− and 282
1 (1 )
4
S
w
−with w the mean fitness among all genotypes. Using the observed genotypic frequencies in 283
offspring, we computed H and S. 284
285
Results 286
A sheltered genetic load can occur 287
13
The frequency spectrum of a completely recessive (h = 0) deleterious allele linked to the S-locus in our 288
simulations, with a selection coefficient s = 0.1, is shown in Figure 1 in a finite population with 289
N=1000 diploid individuals, with forward and backward mutation rates set to μ = 10-4 and η = 10-5, 290
respectively. The existence of three modes in the frequency spectrum (Fig. 1) corresponds to three 291
cases: i) the deleterious allele is absent from the population or at very low frequency, corresponding to 292
the mutation-selection-drift balance; ii) the deleterious allele has a frequency of 0.11, which is the 293
overall mode of the simulation; iii) the frequency of the deleterious allele reaches about 0.2. To explain 294
this pattern, we looked at the influence of the dominance level of the associated S-allele on the 295
probability of fixation of the linked deleterious allele within S-alleles by estimating the distribution of 296
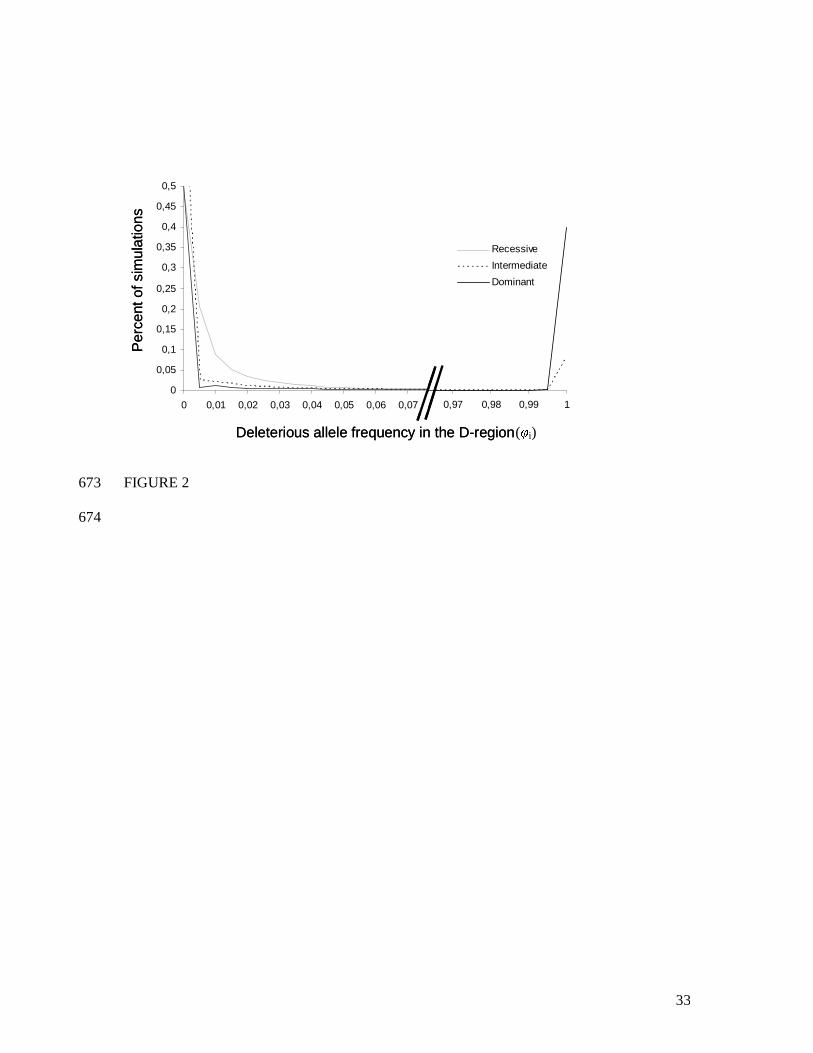
φi in our simulations for all alleles Si (Fig. 2). Figure 2 shows that most often, a given S-allele is not 297
linked with a deleterious allele. Figure 2 also shows that S-alleles with different dominance levels 298
differed greatly in their probability of fixation of the deleterious alleles: φi=1 in 38% of the 299
simulations for a dominant allele, in 8 % of the simulations for an intermediate dominance S-allele and 300
in no simulations for the recessive S-allele. Since we assumed two selectively equivalent S-alleles in 301
the dominant and intermediate classes, and because no simulations showed simultaneous fixation of 302
the deleterious mutation with both S-alleles of the same dominance class, this means that there is a 303
76% probability that all copies of one of the two dominant S-alleles would be associated with the 304
deleterious allele, and a 16% probability that one of the intermediate S-alleles would become fixed for 305
a deleterious allele. The probability of fixation of the deleterious allele thus depended strongly on the 306
dominance level of the linked S-allele. We therefore predict that most of the genetic load should be 307
associated with dominant S-alleles. 308
We further looked at the impact of the dominance level of the deleterious mutation at the D-locus on 309
sheltered load by performing simulations in which h = 0.2, without changing the value of the other 310
parameters. Figure 3 top-left shows that, contrarily to the case where h = 0, the deleterious mutation 311
frequency remains low mainly due to the balance between mutation and selection. Decreasing the 312
backward mutation η (Fig. 3 top-right) shows a similar frequency spectrum, with the exception that 313

14
some simulations showed a frequency of the deleterious mutation close to 0.1. Increasing the total 314
number of S-alleles in the population from five to eight (Fig. 3 bottom graphs) gave very different 315
results. For both values of η, the sheltered load may be large (Fig. 3 bottom left and right). Especially, 316
for the lowest value of η, the frequency of the deleterious mutation is, in most cases, higher than 0.05. 317
In this case, the frequency distribution shows four modes. The left mode represents the mutation-318
selection balance in which the deleterious mutation reaches a low frequency but is not associated with 319
a specific S-haplotype. The three other modes show that the sheltered load associated to an S-allele is 320
highly variable and may be complex and difficult to interpret. Indeed, the frequency of deleterious 321
mutations depends on the number and on the relative dominance of the S-alleles with which they are 322
linked to. These results show that a large sheltered load can occur even if the deleterious mutations are 323
not completely recessive and that it can be shared among several S-alleles. 324
We found a small discrepancy between the observed genotypic frequencies in the simulations and the 325
expected frequencies without sheltered load. For instance, in the case with the largest sheltered load 326
(the bottom right graph in Fig. 3), the discrepancies were only about -2.3%, -0.004% and +1.7% 327
respectively for the dominant, intermediate and recessive S-alleles. However, other simulations 328
showed that for small populations, the discrepancies can be much larger, with a much higher frequency 329
than expected for the recessive allele, and much lower frequencies for the dominant and the 330
intermediate S-alleles (not shown). This suggests that the sheltered load may modify the frequencies of 331
S-haplotypes and thus modified their dynamics in the populations. 332
333
Segregation of S-alleles 334
We compared segregation of S-alleles in self and incompatible crosses for maternal plants of genotype 335
[S01 S15] and [S01 S02] (Tab. 1). S01 has been identified as the most recessive allele in A. halleri, S15 336
is dominant over S01 and S02, and S02 dominant over S01 only (LLAURENS et al. 2008a). The 337
segregation of S-alleles in self and incompatible crosses in the case of the maternal genotype [S01 S15] 338
departed highly significantly from Mendelian expectations, with an excess of [S01 S01] homozygotes 339

15
and deficiency of [S15 S15] homozygotes and [S01 S15] heterozygotes (Tab. 1). There was thus a 340
segregation bias against allele S15. No such significant departure from the Mendelian segregation was 341
found for genotype [S01 S02] except for the incompatible cross category, which showed an excess of 342
[S01 S01] homozygotes and a corresponding lack of [S01 S02] heterozygotes (Tab. 1). 343
We checked the segregation of the studied S-alleles S01, S02 and S15 in compatible crosses by 344
studying the control crosses. For the cross [S01 S15] x [S04 S20], we found no significant departure 345
from Mendelian expectations (Chi2 test: P = 0.085) although S15 had a slightly lower frequency than 346
expected (58 offspring from the compatible crosses carry allele S15, while 77 carry allele S01), which 347
departs marginally significantly from the mendelian expectations (Exact binomial cumulative 348
probability: P = 0.061). This last result suggests that S15 may carry a partially recessive sheltered load. 349
For the crossing [S01 S02] x [S04 S20] a negative segregation bias for S04 was detected (P = 0.02). 350
Our results hence suggest that the S-alleles used in this study S01, S02 and S15 were apparently not 351
associated with strong segregation distorters in genetically compatible cross. Assuming that selection 352
occurs during sporophytic stage, we estimated the selection and the dominance coefficients for allele 353
S15 respectively as S = 0.468 and H = 0.864. These results suggest that the deleterious mutations 354
linked to alleles S15 have large effect on fitness and are not fully recessive. 355
356
Effect of the type of cross on fitness components 357
We compared six fitness traits in the offspring from the three categories of crosses for the two different 358
maternal genotypes (Tab. 2A and 2B). Concerning the maternal genotype [S01 S15], we initially found 359
a strong interaction effect between mother and cross categories. However, this interaction was due 360
almost exclusively to the offspring of one mother (Maternal ID 5012) from control crosses (Appendix 361
1). We discarded all measures from individual 5012 and interaction effect was not significant anymore, 362
except for the germination time (Tab. 2A). Overall, results with or without mother 5012 gave the same 363
results (Appendix 1). In short, for the maternal genotype [S01 S15], we found that the mean number of 364

16
seeds per cross, and the length and width of the largest leaf were different among cross categories 365
(Tab. 2A). The germination time, the cotyledon appearance time and the appearance time of the first 366
leaf showed no significant difference between self and incompatible crosses, but both were 367
significantly different from the control. Finally, the germination rate showed no significant differences 368
between all cross categories. When there was a significant difference among the three types of crosses, 369
we computed ˆ
ˆlocusS
genomic
δδ
. This ratio ˆ
ˆlocusS
genomic
δδ
indicated that the decline in fitness due to the sheltered 370
genetic load explains ~60% or more of the decline in fitness compared to the genomic load (Tab. 2A). 371
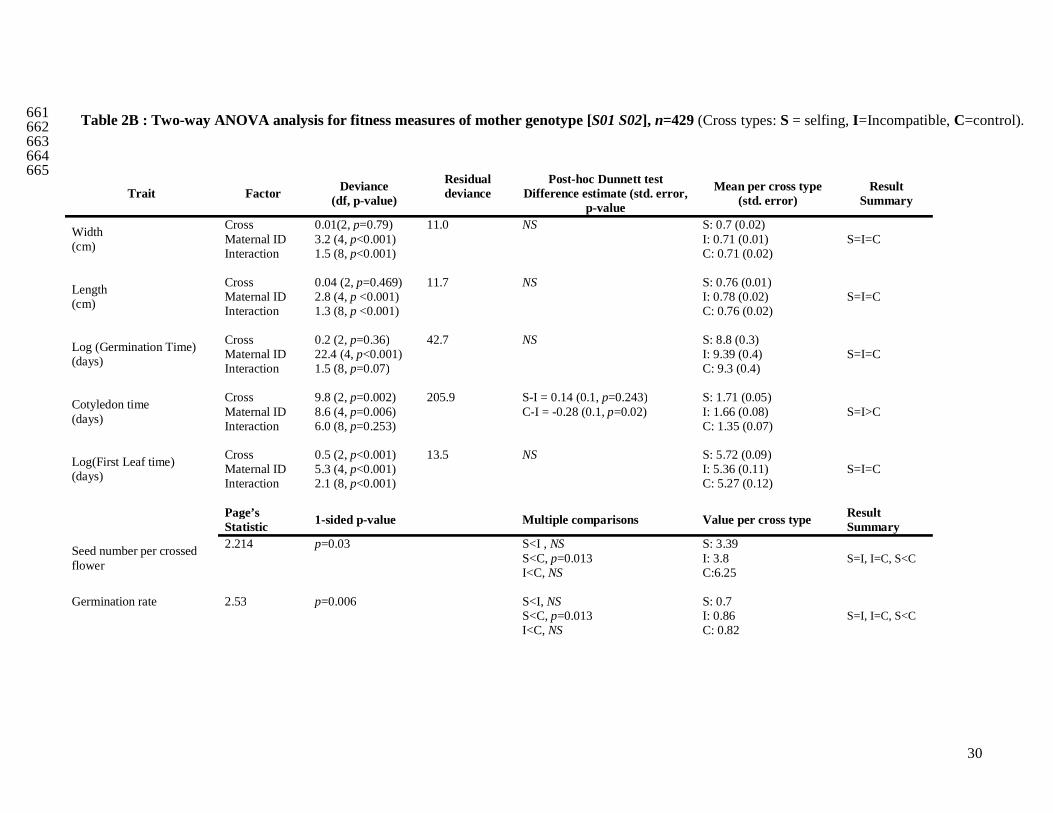
For the maternal genotype [S01 S02], no clear patterns between the three categories of crosses were 372
found, mainly because of strong interaction effects (Tab. 2B). However, we showed that for the 373
appearance time of cotyledons, seed number per cross and the germination rate, differences between 374
selfing and control crosses were significantly different (Tab. 2B). In summary, concerning genotype 375
[S01 S15], for three out of seven measured traits (Seed number per crossed flower, leaf length and 376
width), we observed the expected trend S<I<C, and for three other traits (germination time, cotyledon 377
appearance time and first leaf time) we observed S=I<C or S=I>C. For genotype [S01 S02] such trends 378
were absent. Altogether, these results suggest that the expectation about fitness 379
outbredleincompatibinbred www ˆˆˆ << is verified for the maternal genotype [S01 S15] and not for [S01 S02]. 380
381
Effect of the genotype at S-locus on fitness components 382
Table 3 shows the extent of the differences in fitness-related variables between selfing and 383
incompatible crosses associated with the S-locus genotype of the offspring, for the offspring of the 384
maternal genotype [S01 S15] (the analysis was also performed for the maternal genotype [S01 S02] but 385
results were not significant, and thus not shown). Concerning the maternal genotype [S01 S15], for all 386
measured traits, the interactions were not significant and thus not presented here for simplicity. As 387
shown in Table 3, homozygous [S15 S15] individuals showed significantly lower width and length of 388

17
the largest leaf than heterozygotes [S01 S15] and homozygotes [S01 S01]. They also showed a slower 389
time until the appearance of the first leaf than homozygotes [S01 S01]. No significant differences were 390
found for the germination time and the appearance time of cotyledons. Hence, our results seem 391
concordant to what we may expect from our theoretical results: sheltered load should be higher in the 392
dominant allele S15 than in the recessive allele S01 or in the intermediate allele S02. Our results also 393
suggest that the sheltered load associated with allele S15 should be mostly recessive since the fitness 394
traits of genotype [S01 S15] was never significantly different from those of genotype [S01 S01]. 395
396
Discussion 397
The sheltered load hypothesis in SSI 398
Few theoretical studies investigated the extent of a sheltered load associated to the S-locus in GSI 399
(UYENOYAMA 2003). Here, we have, for the first time, investigated theoretically the conditions 400
favoring and the dynamics of the accumulation of deleterious mutations linked to the S-locus region 401
assuming SSI. Our model showed that in SSI, deleterious recessive mutations would accumulate in a 402
region closely linked to S-alleles, particularly when: (1) the deleterious mutations are recessive or 403
partially recessive; (2) the number of S-alleles in the population is large; (3) the reverse mutation rate η 404
is low. The probability of fixation of a deleterious mutation in a population, apart from the selection 405
coefficient of the mutation and the backward and forward mutations rates, largely depends on the 406
inbreeding coefficient, the dominance coefficient h and the size of the population (BATAILLON and 407
KIRKPATRICK 2000, GLÉMIN et al. 2001). We can easily explain the observed patterns of sheltered load 408
in simulations by considering these latter parameters. First, the purging of recessive deleterious 409
mutations is higher when homozygotes are produced each generation. In SSI, the more recessive an 410
allele, the higher the expected frequency of homozygous individuals for that allele (BILLIARD et al. 411
2007). Hence, the sheltered load was never found to be linked with the recessive S-alleles and was 412
most often found to be linked with the dominant S-alleles. This effect is modulated by the value of the 413
dominance coefficient of the deleterious mutation: if h is high, then purging is effective even in 414
18
heterozygotes. Second, we showed that the number of S-alleles in the population has a large impact on 415
the presence and amount of sheltered load. This can be explained in terms of the “effective size” of 416
each S-allele (VEKEMANS and SLATKIN 1994; BECHSGAARD et al. 2004). Indeed, at equilibrium and 417
without genetic load, it is expected that all S-alleles from a given dominance class will have the same 418
frequency (isoplethy) which is a direct consequence of negative frequency-dependent selection. Hence, 419
the higher the number of alleles in a given dominance class, the lower the frequency of each S-allele at 420
equilibrium. This should lead to a higher sheltered load associated with S-alleles, since the fixation 421
probability of a deleterious mutation is higher for a lower effective size of each S-allele. Furthermore, 422
when the number of alleles increases in the population, the heterozygotes frequency is higher leading 423
to an increase in the probability of fixation of a deleterious mutation within an allelic family. Third, 424
when there is positive linkage disequilibrium between the deleterious allele and a given S-allele, hitch-425
hiking effect mutually occurs. In particular, negative frequency dependent selection that occurs on the 426
S-allele will tend to make the frequency of the deleterious allele increase when rare, limiting the 427
purging and further contributing to the maintenance of the sheltered load (Glémin et al. 2001). In short, 428
our theoretical results suggest that the sheltered load is more likely to exist in linkage with the most 429
dominant S-alleles, and that no sheltered load is expected with the most recessive alleles (Fig. 2). 430
These results hold true when deleterious mutations are only partially recessive (Fig. 3). 431
432
Experimental evidence of sheltered load in A. halleri 433
Our results obtained with controlled pollination and forced fertilization between compatible and 434
incompatible individuals of A. halleri first showed that there may be a significant level of background 435
inbreeding depression. Indeed, for [S01 S15], the fitness-related variables of offspring derived from 436
self crosses were significantly different from the incompatible crosses for three traits out of seven 437
(Tab. 2A) and significantly different from the compatible crosses for six traits out of seven. Second, 438
the experimental results suggest the existence of a large sheltered load associated with the S15 allele. 439
Indeed, we showed that three fitness-related variables in the offspring from incompatible crosses had 440
19
intermediate values relative to offspring from the self and control crosses (Tab. 2A). Furthermore, in 441
the case of two other variables, the values for the incompatible crosses were intermediate, even if not 442
significant. The differences observed between Incompatible and Control crosses may arise from a 443
biparental inbreeding effect, since all plants used in this experiment came from the same population. 444
However, this hypothesis could neither explain the segregation bias nor the genotypic effect on the 445
phenotypic traits (Tab. 3). 446
The differences between fitness-related variables were mainly due to genotypes bearing S15 (Tab. 3). 447
Furthermore, we showed segregation bias against S15 in offspring from both self and incompatible 448
crosses (Tab. 1). Our study in SSI corroborates with the results obtained in GSI in Solanum 449
carolinense (i) by STONE (2004), who found a sheltered load associated to two alleles at the S-locus 450
and (ii) by MENA-ALI et al. (2009), who showed some variations in the strength of the sheltered load 451
carried by different S-alleles. 452
Our results further suggest, first, that the sheltered load is mainly linked to allele S15, and second, that 453
the sheltered load linked to allele S02 is low or nonexistent since neither a clear pattern of difference 454
between crosses have been found nor a clear segregation bias (Tab. 3). These empirical results are 455
consistent with our theoretical results since S15 is dominant while allele S02 has an intermediate 456
dominance level. 457
458
When does the sheltered load act in the life cycle? 459
Based on the segregation bias data, while there is a clear deficiency of allele S15 in the offspring of the 460
selfed and incompatible crosses (Tab. 1), it is not possible to disentangle whether the sheltered load is 461
mainly expressed at gametic or zygotic stages. Indeed, the observed discrepancy between the observed 462
genotypic frequencies and the expectations under mendelian segregation can be explained by the 463
expression of deleterious alleles either in pollen and ovules only, in zygotes only, or both. We used the 464
Bechsgaard et al. (2004)’s statistical framework to compare gametic and zygotic effects but our results 465
did not show significant differences between the two hypotheses (see supplemental data). However, 466
20
our results based on phenotypic traits measurements suggest at least a zygotic effect of the sheltered 467
load. Indeed, the largest differences among the three types of crosses in the phenotypic traits were 468
observed for the seed number, the width and length of the largest leaf. On the one hand, the differences 469
in seed number may be explained by either a gametic effect or a sporophytic effect or both, through 470
ovules or zygotes selective abortion respectively. On the other hand, the differences observed for all 471
the other phenotypic traits measured suggest that the sheltered load has a sporophytic effect. However, 472
the next stages of the plant life cycle have not been investigated here. Other stages that have a great 473
importance for the fitness of the progeny like number of flower, male and female fertility could also be 474
affected by the effect of the sheltered load and require further study. MENA-ALI et al. (2009) indeed 475
showed that sheltered load may have an effect on the number of flowers and on the seed set in 476
Solanum carolinense, a species with GSI. 477
478
Genetic bases of the sheltered load. 479
Based on analysis of recombination rates in the genomic region surrounding the S-locus, KAWABE et 480
al. (2006) suggested that only a few genes are susceptible to contribute to the sheltered load. It was 481
therefore suggested that the sheltered load is unlikely to be a major influence on fitness as compared 482
with the genomic load. Indeed, the number of genes linked to the S-locus is quite low according to 483
estimates of the size of the region undergoing S-locus influenced recombination suppression: based on 484
UYENOYAMA (2005), the S-locus co-segregating region in Brassica is about 0.3Mb and the gene 485
density is 15 per 100 kb, suggesting that we may expect about 45 co-segregating genes with the S-486
locus. However, even though the total number of these genes is low, some of these genes may have 487
important functions, as for example, a gene influencing seed dormancy in Papaver rhoeas as shown by 488
LANE and LAWRENCE (1995). As a consequence, a single mutation in one of these genes could have a 489
severe effect at the individual level. 490
Our theoretical model suggested that the fixation of deleterious mutations linked to the S-locus is 491
possible, so that even if the region co-segregating with the S-locus is small, some mutations can be 492
21
fixed. Moreover, our empirical results in A. halleri suggest that, at least for allele S15, the sheltered 493
load is large enough to be detected through segregation bias and some phenotypic traits (Tab. 3). 494
Hence, the deleterious mutations linked to S15 in A. halleri must have a large effect, as compared to 495
the mildly deleterious mutations responsible of the background inbreeding depression. 496
The sheltered load is usually thought to be caused by recessive mutations (STONE 2004, PORCHER and 497
LANDE 2005). However, the expression time and intensity of the sheltered load can be more complex. 498
First, as shown above, we can not exclude that the sheltered load acts at gametic stage. Secondly, if the 499
sheltered load indeed acts during sporophytic early stages of the life cycle, then the dominance level of 500
the sheltered load may be high, as estimated by H , which suggests that deleterious mulations 501
responsible may not be totally recessive, which is corroborated by our theoretical results since a 502
sheltered load can accumulate with partially recessive deleterious mutations (Fig. 3). Finally, the 503
genotypic effects on the leaf size and appeareance time suggest that the dominance of the sheltered 504
load is low at this stage: indeed no significant differences was detected between the genotypes [S01 505
S01] and [S01 S15] while the difference between [S01 S15] and [S15 S15] was significant (Tab. 3). 506
507
Evolutionary consequences of the sheltered genetic load 508
The sheltered load could play an important role in the maintenance of self-incompatibility system. 509
PORCHER and LANDE (2005) showed that a large sheltered load combined with high background 510
inbreeding depression may enlarge the conditions for the maintenance of the gametophytic self-511
incompatibility system. It would now be interesting to estimate if the sheltered load and background 512
inbreeding depression allow the persistence of the sporophytic self-incompatibility system. Indeed, as 513
shown here, we expect that the sheltered load should only be large for dominant S-alleles and almost 514
absent for recessive or intermediate S-alleles. Hence, we would expect there to be a smaller influence 515
of sheltered load on the maintenance of SI in an SSI system than in a GSI system, due to the reduced 516
or absent sheltered load associated with the most frequent S-alleles in a population. 517

22
The sheltered load could also influence the dynamics of self-incompatibility alleles: since a new S-518
allele should share deleterious alleles with its ancestor, the sheltered load is thought to slow down the 519
appearance of new alleles (UYENOYAMA 2003). Our results indicate that the sheltered genetic load 520
depends on the level of dominance of the associated S-allele. Hence, if the sheltered load is large, we 521
can expect that the differentiation rate of the S-alleles should differ among dominance classes, with a 522
slower rate in dominant than in recessive S-allelic class. 523
524
Acknowledgements 525
This work was supported by an ATIP research grant from the life science department of the CNRS, 526
and the research grant ANR-06-BLAN-0128-01 from the French National Research Agency to the 527
self-incompatibility team lead by Xavier Vekemans. The PhD of VL was supported by a grant from 528
CNRS and Région Nord-Pas de Calais. The authors wish to thank Adeline Courseaux for technical 529
support and Angélique Bourseaux, Eric Schmitt and Robert Dron for the plants care in greenhouse. We 530
also thank Deborah Charlesworth, Fabrice Roux, Vincent Castric and Xavier Vekemans for useful 531
comments on the manuscript. We thank Sylvain Glémin and Mathilde Dufaÿ for helpful comments, as 532
well as Thierry Gaude for introduction to the CO2 treatment technique. We finally with to thank two 533
anonymous reviewers for their valuable suggestions. 534
535
536

23
References 537
538
BATAILLON, T., and M. KIRKPATRICK, 2000 Inbreeding depression due to mildly deleterious mutations 539
in finite populations: size does matter. Genetical Research 75: 75-21. 540
BECHSGAARD, J., T. BATAILLON and M. H. SCHIERUP, 2004 Uneven segregation of sporophytic self-541
incompatibility alleles in Arabidopsis lyrata. Journal of Evolutionary Biology 542
17: 554-561. 543
BILLIARD, S., V. CASTRIC and X. VEKEMANS, 2007 A General Model to Explore Complex Dominance 544
Patterns in Plant Sporophytic Self-Incompatibility Systems. Genetics 175: 1351–1369. 545
CASSELMAN, A. L., J. VREBALOV, J. A. CONNER, A. SINGHAL, J. GIOVANNONI et al., 2000 Determining 546
the Physical Limits of the Brassica S Locus by Recombinational Analysis. The Plant Cell 12: 547
23–33. 548
CASTRIC, V., AND X., VEKEMANS, 2004 Plant self-incompatibility in natural populations: a critical 549
assessment of recent theoretical and empirical advances". Molecular Ecology, 13: 2873-2889. 550
CHARLESWORTH, D., C. BARTOLOME, M. H. SCHIERUP, and B. K. MABLE, 2003. Haplotype structure 551
of the stigmatic self-incompatibility gene in natural populations of Arabidopsis lyrata. 552
Molecular Biology and Evolution 20: 1741–1753. 553
CHARLESWORTH, B., and D. CHARLESWORTH, 1999 The genetic basis of inbreeding depression. 554
Genetical Research 74: 329-340. 555
CLAUSS, M. J., and M. A. KOCH, 2006 Poorly known relatives of Arabidopsis thaliana. Trends in Plant 556
Science 11: 449-459. 557
DE NETTANCOURT, D., 2001 Incompatibility and incongruity in wild and cultivated plants. Springer-558
Verlag, Berlin. 559
DOWD, P.E., A.G. MCCUBBIN, X. WANG, J. A. VERICA et al., 2000 Use of Petunia inflata as a model 560
for the study of Solanaceous type self-incompatibility. Annals of botany 85 (supp. A): 87-93. 561
24
GLÉMIN, S., T. BATAILLON, J. RONFORT, A. MIGNOT and I. OLIVIERI, 2001 Inbreeding depression in 562
small populations of self-incompatible plants. Genetics 159: 1217-1229. 563
GLÉMIN, S., T. GAUDE, M. L. GUILLEMIN, M. LOURMAS, I. OLIVIERI et al., 2005 Balancing selection in 564
the wild: testing population genetics theory of self-incompatibility in the rare species Brassica 565
insularis. Genetics 171: 279-289. 566
HATAKEYAMA, K., M. WATANABE, T. TAKASAKI, K. OJIMA and K. HINATA, 1998 Dominance 567
relationships between S-alleles in self-incompatible Brassica campestris L. Heredity 80: 241-568
247. 569
IGIC, B., R. LANDE and J. R. KOHN, 2008 Loss of self-incompatibility and its evolutionary 570
consequences. . International Journal of Plant Sciences 169: 93-104. 571
KAMAU, E., B. CHARLESWORTH and D. CHARLESWORTH, 2007 Linkage disequilibrium and 572
recombination rate estimates in the self-incompatibility region of Arabidopsis lyrata. Genetics 573
176: 2357-2369. 574
KAMAU, E., and D. CHARLESWORTH, 2005 Balancing Selection and Low Recombination Affect 575
Diversity near the Self-Incompatibility Loci of the Plant Arabidopsis lyrata. Current Biology 576
15: 1773–1778. 577
KAWABE, A., B. HANSSON, A. FORREST, J. HAGENBLAD and D. CHARLESWORTH, 2006 Comparative 578
gene mapping in Arabidopsis lyrata chromosomes 6 and 7 and A. thaliana chromosome IV: 579
evolutionary history, rearrangements and local recombination rates. Genetical Research 580
Cambridge 88: 45-56. 581
KOWYAMA, Y., H. TAKASHASI, K. MURAOKA, T. TANI, K. HARA et al., 1994 Number, frequency & 582
dominance relationships of dominance relationships of S-alleles in diploid Ipomoea trifida. 583
Heredity 73: 275-283. 584
LANE, M. D., and M. J. LAWRENCE, 1995 The population genetics of the self-Incompatibility 585
polymorphism in Papaver rhoeas. An association between incompatibility genotype and seed 586
dormancy. Heredity 75: 92-97. 587
25
LEPPALA, J., J. S. BECHSGAARD, M. H. SCHIERUP and O. SAVOLAINEN, 2008 Transmission ratio 588
distortion in Arabidopsis lyrata: effects of population divergence and the S-locus. Heredity 589
100: 71-78. 590
LLAURENS, V., S. BILLIARD, J.-B. LEDUCQ, V. CASTRIC and X. VEKEMANS, 2008a Does frequency-591
dependent selection with complex dominance interactions accurately predict allelic frequencies 592
at the self-incompatibility locus in Arabidopsis halleri? Evolution 62:2545–2557 593
LLAURENS, V., V. CASTRIC, F. AUSTERLITZ and X. VEKEMANS, 2008b High paternal diversity in the 594
self-incompatible herb Arabidopsis halleri despite clonal reproduction and spatially restricted 595
pollen dispersal. Molecular Ecology 17: 1577-1588. 596
MABLE, B. K., M. H. SCHIERUP and D. CHARLESWORTH, 2003 Estimating the number, frequency, and 597
dominance of S-alleles in a natural population of Arabidopsis lyrata (Brassicaceae) with 598
sporophytic control of self-incompatibility. Heredity 90: 422-431. 599
MENA-ALI, J. I., L. H. KESER and A. G. STEPHENSON, 2009 The effect of sheltered load on 600
reproduction in Solanum carolinense, a species with variable self-incompatibility. Sexual Plant 601
Reproduction 22:63–7 602
NAKANISHII, T., Y. ESASHI and K. HINATA, 1969 Control of self-incompatibility by CO2 gas in 603
Brassica. Plant and cell physiology 10: 925-927. 604
NAKANISHII, T., and K. HINATA, 1973 An effective time for CO2 gas treatment in overcoming self-605
incompatibility in Brassica. Plant and cell physiology 14: 873-879. 606
PAGE, E. B., 1963 Ordered hypotheses for multiple treatments: A significance test for linear ranks. 607
Journal of the American Statistical Association 58, 216-230 608
PORCHER, E., and R. LANDE, 2005 Loss of gametophytic self-incompatibility with evolution of 609
inbreeding depression. Evolution 59: 46–60. 610
RICHMAN, A., 2000 Evolution of balanced genetic polymorphism. Molecular Ecology 9:1953-1963. 611
26
SCHIERUP, M. H., J. S. BECHSGAARD, L. H. NIELSEN and F. B. CHRISTIANSEN, 2006 Selection at Work 612
in Self-Incompatible Arabidopsis lyrata: Mating Patterns in a Natural Population. Genetics 613
172: 477–484. 614
SCHIERUP, M. H., X. VEKEMANS and F. B. CHRISTIANSEN, 1997 Evolutionary dynamics of sporophytic 615
self-incompatibility alleles in plants. Genetics 147: 835-846. 616
STONE, J. L., 2004 Sheltered load associated with S-alleles in Solanum carolinense. Heredity 92: 335-617
342. 618
UYENOYAMA, M. K., 1997 Genealogical structure among alleles regulating self-incompatibility in 619
natural populations of flowering plants. Genetics 147: 1389-1400. 620
UYENOYAMA, M. K., 2003 Genealogy-dependent variation in viability among self-incompatibility 621
genotypes. Theoretical Population Biology 63: 281-293. 622
UYENOYAMA, M. K., 2005 Evolution under tight linkage to mating type. New Phytologist 165: 63–70. 623
VAN OOSTERHOUT, C., 2009 A new theory of MHC evolution: beyond selection on the immune genes. 624
Proceedings of the Royal Society-B 276: 657-665 625
VEKEMANS, X., M. H. SCHIERUP and F. B. CHRISTIANSEN, 1998 Mate availability and fecundity 626
selection in multi-allelic self-incompatibility systems in plants. Evolution 52: 19-29. 627
VEKEMANS, X., and M. SLATKIN, 1994 Gene and allelic genealogies at a gametophytic self-628
incompatibility locus. Genetics 137: 1157-1165. 629
630
27
Figures list 631
632
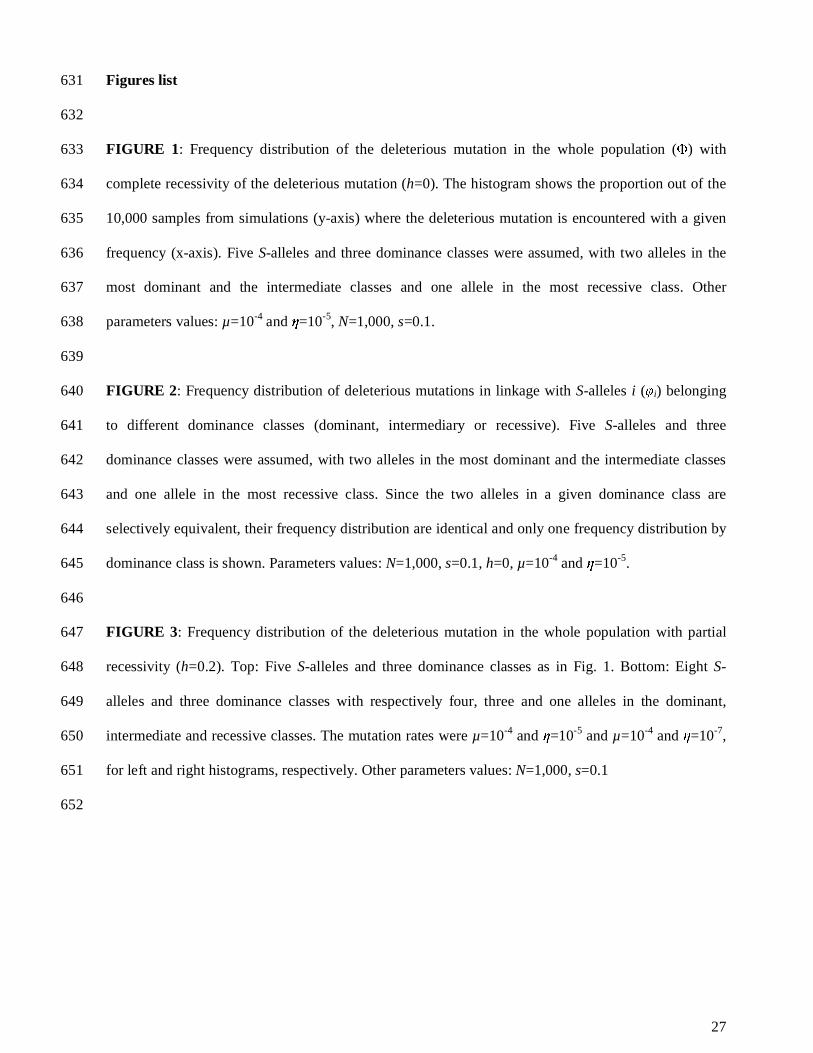
FIGURE 1: Frequency distribution of the deleterious mutation in the whole population (Φ) with 633
complete recessivity of the deleterious mutation (h=0). The histogram shows the proportion out of the 634
10,000 samples from simulations (y-axis) where the deleterious mutation is encountered with a given 635
frequency (x-axis). Five S-alleles and three dominance classes were assumed, with two alleles in the 636
most dominant and the intermediate classes and one allele in the most recessive class. Other 637
parameters values: µ=10-4 and η=10-5, N=1,000, s=0.1. 638
639
FIGURE 2: Frequency distribution of deleterious mutations in linkage with S-alleles i (φi) belonging 640
to different dominance classes (dominant, intermediary or recessive). Five S-alleles and three 641
dominance classes were assumed, with two alleles in the most dominant and the intermediate classes 642
and one allele in the most recessive class. Since the two alleles in a given dominance class are 643
selectively equivalent, their frequency distribution are identical and only one frequency distribution by 644
dominance class is shown. Parameters values: N=1,000, s=0.1, h=0, µ=10-4 and η=10-5. 645
646
FIGURE 3: Frequency distribution of the deleterious mutation in the whole population with partial 647
recessivity (h=0.2). Top: Five S-alleles and three dominance classes as in Fig. 1. Bottom: Eight S-648
alleles and three dominance classes with respectively four, three and one alleles in the dominant, 649
intermediate and recessive classes. The mutation rates were µ=10-4 and η=10-5 and µ=10-4 and η=10-7, 650
for left and right histograms, respectively. Other parameters values: N=1,000, s=0.1 651
652

28
TABLE 1: Genotypic frequencies at the S-locus in the offspring of the Selfing and Incompatible crosses and Mendelian segregation tests (Chi² test). 653
654
Mother Genotype Cross type Offspring genotype Total number of offspring p-value (Chi² test) [S01 S01] [S01 S15] [S15 S15]
[S01 S15] Selfing 0.391 0.466 0.143 160 p <0.001 Incompatible 0.367 0.438 0.195 128 p <0.001 All 0.381 0.453 0.166 288 p <0.001 [S01 S01] [S01 S02] [S02 S02]
[S01 S02] Selfing 0.208 0.528 0.264 231 p = 0.33 Incompatible 0.350 0.390 0.260 123 p = 0.02 All 0.257 0.480 0.262 354 p = 0.75
655
656

29
657
658
Trait Factor Deviance (df, p-value)
Residual deviance
Post-hoc Dunnett test Difference estimate (std.
error, p-value
Mean per cross type (std. error)
Result Summary
ˆ
ˆlocusS
genomic
δδ
Width (cm)
Cross 5.2 (2, p<0.001) 9.8 S - I = -0.08 (0.02, p<0.001) S: 0.57 (0.014) S<I<C 0.68 Maternal ID 1.06 (3, p<0.001) C -I = 0.17 (0.02, p<0.001) I: 0.67 (0.015)
Interaction 0.07 (6, p=0.87) C: 0.83 (0.015)
Length (cm)
Cross 4.5 (2, p<0.001) 12.5 S-I = -0.1 (0.02, p<0.001) S: 0.65 (0.02) S<I<C 0.6 Maternal ID 1.5 (3, p<0.001) C-I = 0.15 (0.02, p<0.001) I: 0.76 (0.02)
Interaction 0.13 (6, p = 0.69) C: 0.91 (0.02)
Log (Germination Time) (days)
Cross 1.7 (2, p<0.001) 38.7 S-I = 0.17 (0.10, p=0.18) S: 8.3 (0.29) S=I<C . Maternal ID 6.4 (3, p<0.001) C-I = 3.89 (0.14, p=0.03) I: 7.89 (0.32)
Interaction 2.9 (6, p<0.001) C: 9.22 (0.31)
Cotyledon time (days)
Cross 7.4 (2, p=0.001) 205.9 S-I = 0.11 (0.09, p=0.41) S: 1.81 (0.06) S=I>C . Maternal ID 0.6 (3, p=0.758) C-I = -0.23 (0.1, p=0.036) I: 1.7 (0.07)
Interaction 6.0(6, p=0.089) C: 1.48 (0.07)
Log(First Leaf time) (days)
Cross 5.3 (2, p<0.001) 16.7 S-I = 0.03 (0.07, p=0.88) S: 6.58 (0.13) S=I>C . Maternal ID 0.6 (3 , p=0.005) C-I = -0.27 (0.09, p=0.004) I: 6.27 (0.12)
Interaction 0.4 (6 , p=0.2) C: 4.97 (0.12)
Page’s
Statistic 1-sided p-value Multiple comparisons Value per cross type Result
Summary
Seed number per crossed flower
S<I, p=0.013 S: 2.25 S<I<C 0.82 3.162 p<0.001 S<C, p=0.013 I: 3.73
I<C, p=0.013 C: 10.3
Germination rate S: 0.9
S=I=C . 0 p=0.557 NS I: 1 C:0.74
659 660
Table 2A : Two-way ANOVA analysis for fitness measures of mother genotype [S01 S15], n=374 (Cross types: S = selfing, I=Incompatible, C=control).
30
661 662 663 664
665
Trait Factor Deviance (df, p-value)
Residual deviance
Post-hoc Dunnett test Difference estimate (std. error,
p-value
Mean per cross type (std. error)
Result Summary
Width (cm)
Cross 0.01(2, p=0.79) 11.0 NS S: 0.7 (0.02) S=I=C
Maternal ID 3.2 (4, p<0.001) I: 0.71 (0.01)
Interaction 1.5 (8, p<0.001) C: 0.71 (0.02)
Length (cm)
Cross 0.04 (2, p=0.469) 11.7 NS S: 0.76 (0.01) S=I=C Maternal ID 2.8 (4, p <0.001) I: 0.78 (0.02)
Interaction 1.3 (8, p <0.001) C: 0.76 (0.02)
Log (Germination Time) (days)
Cross 0.2 (2, p=0.36) 42.7 NS S: 8.8 (0.3) S=I=C Maternal ID 22.4 (4, p<0.001) I: 9.39 (0.4)
Interaction 1.5 (8, p=0.07) C: 9.3 (0.4)
Cotyledon time (days)
Cross 9.8 (2, p=0.002) 205.9 S-I = 0.14 (0.1, p=0.243) S: 1.71 (0.05) S=I>C Maternal ID 8.6 (4, p=0.006) C-I = -0.28 (0.1, p=0.02) I: 1.66 (0.08)
Interaction 6.0 (8, p=0.253) C: 1.35 (0.07)
Log(First Leaf time) (days)
Cross 0.5 (2, p<0.001) 13.5 NS S: 5.72 (0.09) S=I=C Maternal ID 5.3 (4, p<0.001) I: 5.36 (0.11)
Interaction 2.1 (8, p<0.001) C: 5.27 (0.12)
Page’s Statistic 1-sided p-value Multiple comparisons Value per cross type Result
Summary
Seed number per crossed flower
2.214 p=0.03 S<I , NS S: 3.39 S=I, I=C, S<C S<C, p=0.013 I: 3.8
I<C, NS C:6.25 Germination rate 2.53 p=0.006 S<I, NS S: 0.7
S=I, I=C, S<C S<C, p=0.013 I: 0.86 I<C, NS C: 0.82
Table 2B : Two-way ANOVA analysis for fitness measures of mother genotype [S01 S02], n=429 (Cross types: S = selfing, I=Incompatible, C=control).
31
666 667 668
Trait Factor Deviance (df, p-value)
Residual deviance
Post-hoc Dunnett test Difference estimate (std. error, p-value
Mean per Genotype (std. error) Result Summary
Width (cm)
Cross 0.67 (1, p<0.001) 6.4 [S01S01] – [S15S15] = 0.06 (0.03, p=0.052) [S01S01]: 0.62 (0.02) [S01 S01]= [S01 S15]> [S15 S15]
Maternal ID 0.86 (4, p<0.001) [S01S15] – [S15S15] = 0.06 (0.03, p = 0.054) [S01S15]: 0.62 (0.02) Genotype 0.14 (2, p=0.067) [S15S15]: 0.57 (0.03)
Length (cm)
Cross 0.76 (1, p<0.001) 13.2 [S01S01] – [S15S15] = 0.07 (0.03, p=0.038) [S01S01]: 0.72 (0.02) [S01 S01]= [S01 S15]> [S15 S15]
Maternal ID 1.22 (4, p<0.001) [S01S15]– [S15S15] = 0.07(0.03, p = 0.034) [S01S15]: 0.72 (0.02) Genotype 0.21 (2, p=0.04) [S15S15]: 0.65 (0.03)
Log (Germination Time) (days)
Cross 0.2 (1, p=0.13) 25.6 NS [S01S01]: 8.5 (0.03) [S01 S01]= [S01 S15]= [S15 S15]
Maternal ID 8.1 (4, p<0.001) [S01S15]: 8.1 (0.03) Genotype 0.3 (2, p=0.29) [S15S15]: 8.9 (0.05)
Cotyledon time (days)
Cross 0.76 (1, p=0.253) 147.0 NS [S01S01]: 1.84 (0.07) [S01 S01]= [S01 S15]= [S15 S15]
Maternal ID 1.2 (4, p=0.724) [S01S15]: 1.7 (0.07) Genotype 1.29 (2, p=0.331) [S15S15]: 1.7 (0.11)
Log(First Leaf time) (days)
Cross 0.1 (1, p=0.10) 11.7 [S01S01] – [S15S15] = -0.11 (0.04, p=0.012) [S01S01]: 6.2 (0.14) [S01 S01]= [S01 S15] [S01 S01]>[S15 S15] [S01 S15]= [S15 S15]
Maternal ID 0.4 (4, p=0.07) [S01S15]– [S15S15] = -0.08 (0.04, p = 0.06) [S01S15]: 6.4 (0.13) Genotype 0.4 (2, p=0.01) [S15S15]: 6.9 (0.22)
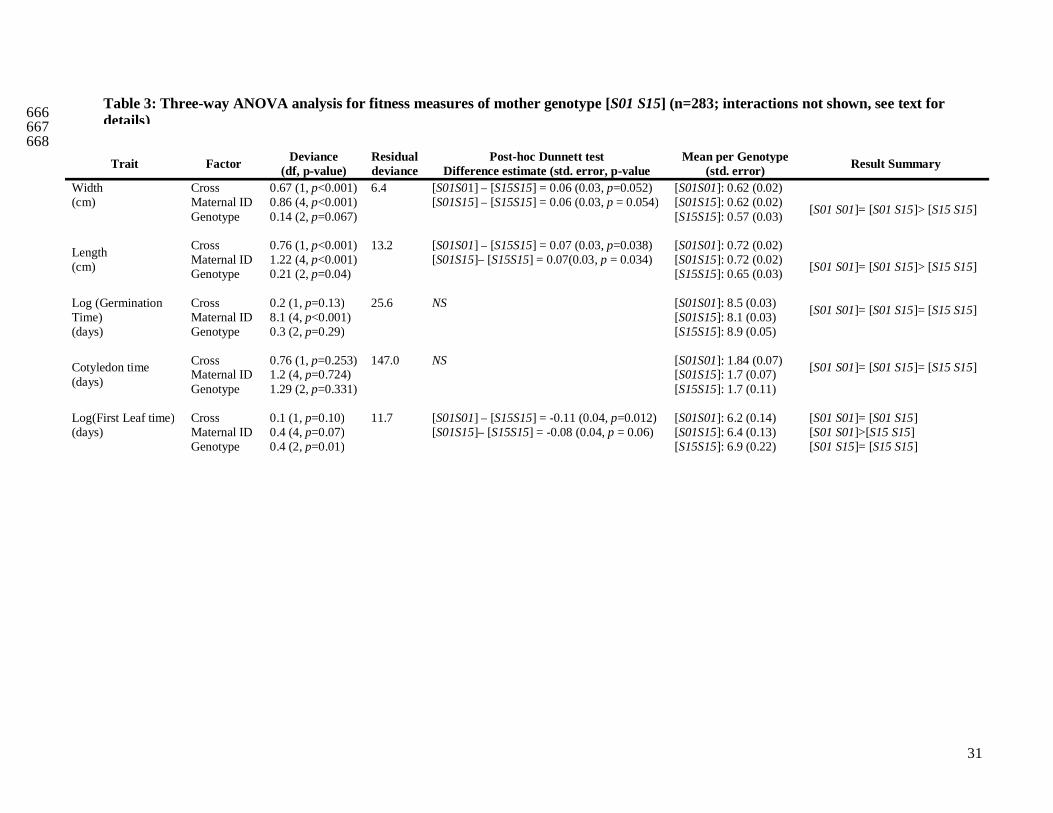
Table 3: Three-way ANOVA analysis for fitness measures of mother genotype [S01 S15] (n=283; interactions not shown, see text for details)

32
669
FIGURE 1 670
671
672
(Φ)
33
FIGURE 2 673
674
0,97 0,98 0,99 1
Recessive
Intermediate
Dominant
0
0,05
0,1
0,15
0,2
0,25
0,3
0,35
0,4
0,45
0,5
0 0,01 0,02 0,03 0,04 0,05 0,06 0,07
Deleterious allele frequency in the D-region
Per
cent
of s
imul
atio
ns
0,97 0,98 0,99 1
Recessive
Intermediate
Dominant
0
0,05
0,1
0,15
0,2
0,25
0,3
0,35
0,4
0,45
0,5
0 0,01 0,02 0,03 0,04 0,05 0,06 0,07
Deleterious allele frequency in the D-region
Per
cent
of s
imul
atio
ns
(φi)

34
675
676
FIGURE 3677
(Φ)

35
Trait
Factor Deviance (df, p-value)
Residual deviance
Significant interactions (Maternal ID
x Cross type)
Post-hoc Dunnett test Difference estimate (std. error, p-value)
Mean per cross type (std. error) Result Summary
Width (cm)
Cross 4.9 (2, p<0.001) 10.3 5012 x C S - I = -0.11 (0.05, p=0.065) S: 0.57 (0.014) S<I<C
Maternal ID 1.6 (4, p<0.001) C -I = 0.19 (0.07, p=0.007) I: 0.67 (0.015) Interaction 0.7 (8, p=0.001) C: 0.83 (0.015)
Length (cm)
Cross 3.8 (2, p<0.001) 13.2 5012 x C S-I = -0.11 (0.06, p=0.094) S: 0.66 (0.02) S=I, I=C, S<C
Maternal ID 1.6 (4, p<0.001) C-I = 0.08 (0.08, p=0.459) I: 0.77 (0.02) Interaction 1.05 (8, p<0.001) C: 0.89 (0.02)
Log(Germination Time) (days)
Cross 1.23 (2, p=0.003) 41.7 5012 x C 5026 x C
S-I = 0.17 (0.1, p=0.17) S: 8.5 (0.27) S=I<C
Maternal ID 8.42 (4, p<0.001) C-I = 0.33 (0.1, p=0.027) I: 8.1 (0.3) Interaction 3.36 (8, p<0.001) C: 9.3 (0.3)
Cotyledon time (days)
Cross 6.7 (2, p=0.001) 217.3 5037 x S S-I = 0.10 (0.09, p=0.399) S: 1.8 (0.06) S=I>C
Maternal ID 0.8 (4, p=0.758) C-I = -0.2 (0.09, p=0.051) I: 1.7 (0.07) Interaction 6.9 (8, p=0.089) C: 1.5 (0.06)
Log(First Leaf time) (days)
Cross 4.8 (2, p<0.001) 18.3 5012 x C S-I = 0.03 (0.07, p=0.88) S: 6.57 (0.11) S=I>C
Maternal ID 0.8 (4 , p=0.002) C-I = -0.27 (0.09, p=0.004) I: 6.26 (0.12) Interaction 1.2 (8 , p<0.001) C: 5.12 (0.12)
678
Appendix Table 1 : Two-way ANOVA analysis for fitness measures of mother genotype [S01 S15], including mother 5012 (n=424).