the shale revolution and natural gas in transportation€¦ · 23/06/2014 · the shale revolution...
TRANSCRIPT

The Shale Revolution and Natural Gas in TransportationNatural Gas in Transportation
Institute of Transportation Studies, University of California, Davis
Presentation to the California Energy CommissionPresentation to the California Energy Commission
June 23, 2014
1

US Shale Gas Is Prolific and Supply Abundance Will Be Sustainable Abundance Will Be Sustainable
2

Sources of US Shale Oil and Gas Are Proliferating and Will Continue to Expand
U.S. shale and tight oil production
million barrels of oil per day40
U.S. dry shale gas production
billion cubic feet per day
3.0
3.5
4.0Eagle Ford (TX)
Bakken (MT & ND)
Spraberry (TX & NM Permian)
Bonespring (TX & NM Permian)
Wolfcamp (TX & NM Permian) 30
35
40
Marcellus (PA & WV)
Haynesville (LA & TX)
Eagle Ford (TX)
Fayetteville (AR)
2.0
2.5
Delaware (TX & NM Permian)
Yeso‐Glorieta (TX & NM Permian)
Niobrara‐Codell (CO, WY)
Haynesville
Marcellus
20
25
Fayetteville (AR)
Barnett (TX)
Woodford (OK)
Bakken (ND)
Antrim (MI, IN, & OH)
1.0
1.5Woodford (OK)
Granite Wash (OK & TX)
Austin Chalk (LA & TX)
Monterey (CA)
5
10
15Rest of US 'shale'
0.0
0.5
2000 2002 2004 2006 2008 2010 2012 2014
0
5
2000 2002 2004 2006 2008 2010 2012 2014
3
Sources: EIA derived from state administrative data collected by DrillingInfo Inc. Data are through March 2014 and represent EIA’s official tight oil & shale gas estimates, but are not survey data. State abbreviations indicate primary state(s).

California Supply Disposition• Indigenous production declines longer term, resulting in higher imports.
• California pull on Canadian gas is expected to increase substantially.
Source: BIPP CES RWGTM

California Demand by Sector• Modest growth is forecast in the Status Quo Case due to aggressive RPS g Q gg
goals and end-use efficiency programs.
5

Low Natural Gas Prices Appear To Make Shift to Natural Gas for Heavy Trucks Shift to Natural Gas for Heavy Trucks
Make SenseS Curve Start to Diesel Fuel Leading Some Analysts to Argue Natural Gas Will Follow Same Course
Estimated NGVs as % new HDV sales in the USDiesel’s share of new Class 8 trucks sales in US, 1950‐2010
50%
60%
70%
80%
90%
100%
%
75%
100%
0%
10%
20%
30%
40%
50%
13 15 17 19 21 23 25 27 29 31 33 35 37 39
%
25%
50%
Source: MacKay, Wards Auto, Westport, Ayres‐Ayres‐Warr, Citi Research
201
201
201
201
202
202
202
202
202
203
203
203
203
203
Base Complete turnover Slow adoption0%
1950 1960 1970 1980 1990 2000 2010
6

But Is A Shift to LNG Fuel for Heavy-Duty Freight Trucks Truly Commercial?
7

Uncertainty in Price Differential with Oil
8

Price ForecastsPrice Forecasts
9

Class 8 TrucksVehicle costs and Fuel Breakeven priceVehicle costs and Fuel Breakeven price
Comparison of Alternative Fuel Vehicles
Breakeven Prices of LNG ($/DGE) Function of:• Type of engine• Driving cycle • Annual driving
intensityintensity
DOE Prices
Assumptions:Diesel $4/gal
*Savings in diesel hybrids are realized from reduced fuel use, the more expensive the fuel the better your savings, while saving in NGVs are realized from using a cheaper fuel. The cheaper the LNG the higher the savings.
Diesel $4/gal2
10
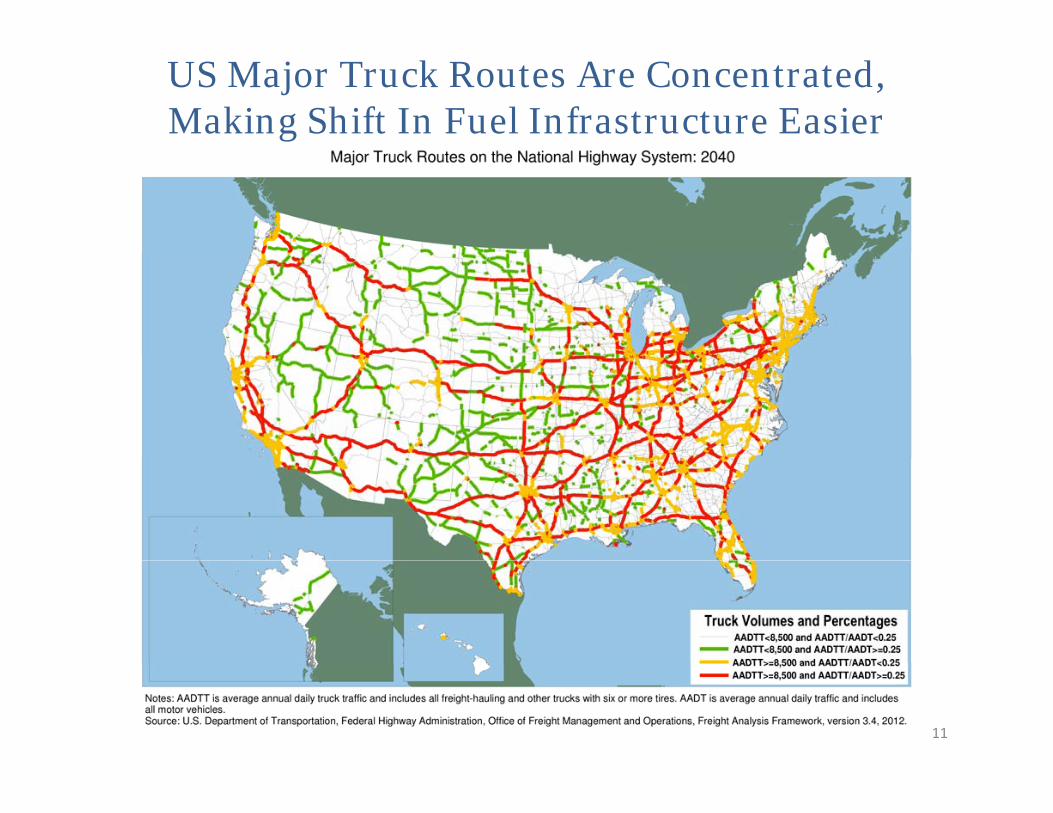
US Major Truck Routes Are Concentrated, Making Shift In Fuel Infrastructure Easier
11

Optimization Model Objectivep j1) Identify if the build-out of LNG and CNG supply chains
are sustainable as a commercially profitable venture in th U it d St t d if h t i th t tthe United States and if so, what is the most cost-effective supply chain configuration of LNG infrastructure, based:
a. Distance to existing natural gas infrastructure (i.e. existing pipelines, existing liquefaction plants and stations)
b. Distance to Supply locations (i.e. natural gas trading points or hubs)
c. Distance to Demand locations (i.e. refueling stations and ports)
2) Identify important, profitable routes which will support future network growth $$future network growth
$$$
$$$$
12
2 LNG Pathways

Key Initial Findings and h hThoughts
1. Even natural gas fuels (LNG) may require some ki d f i t b id t i iti t b ild tkind of assistance or subsidy to initiate build out2. Success of LNG in the Heavy-duty freight market highly sensitive to initial level of penetration rate, g y p ,but once launched in key markets could be successful3. Chicken-Egg problem implies station & mini-LNG plant technology still too expensive (high plant technology still too expensive (high liquefaction costs) 4. This problem is not unique to Natural Gas, it is a problem which all future transportation fuels face in problem which all future transportation fuels face in competing with incumbent fuels5. Further investigation…(Dynamic Model,
h i il i iStochastic Inputs, Oil Price Scenarios, CNG Technology)
13

New LNG Station Static System
Build-out Scenarios
New Liquefaction Plant Static SystemBuild‐out Scenarios
+ Existing Stations & Plants& Plants
14LNG Box in more remote areas
1) Bigger Size 2) More Stations More Plants in Metropolitan Cities (Intercity short haul)

Station Fuel Price Difference with No Refueling Station Subsidy
< $0$0 $0 50
1% 6%
$0 ‐ $0.50> $1
11% 16%
1521% 26%

Station Fuel Price Difference under 50% Refueling Station Subsidy
< $0$0 $0 50
1% 6%
$0 ‐ $0.50> $1
11% 16%
1621% 26%

Additional Thoughts On Modeling lResults
• This modeling solution does not account This modeling solution does not account for perceived quality of LNG trucks or constraints on their availability.y
• Supplier may have to consider a diesel-minus pricing package to shippers (third p g p g ppparty hedging?)
• Policy incentives from environmental ydrivers or need to limit flaring; enabling to renewable natural gas

Renewable natural gas potential in California California CA Production Potential
S
10 bcf/yr
Manure
14 6 bcf/yr
2012 CA vehicular NG consumption
MSW (food waste)
/y 14.6 bcf/yr14.7 bcf
WWTPLandfill Gas9.6 bcf/yr
WWTP2022 projection from AEO2104
55 bcf/yr
Technical Potential
Existing capacity (all end uses)Existing capacity (all end uses)

Methane leaks in ContextMethane leaks in Context
Rosa Dominguez-FausRosa Dominguez-Faus
Post-doctoral Researcher
iUC Davis ITS
19

Methane leaksMethane leaks
20
Source: http://www.epa.gov/gasstar/tools/videos.html

LCA power generation(100y GWP)(100y GWP)
Source: ICF 2012
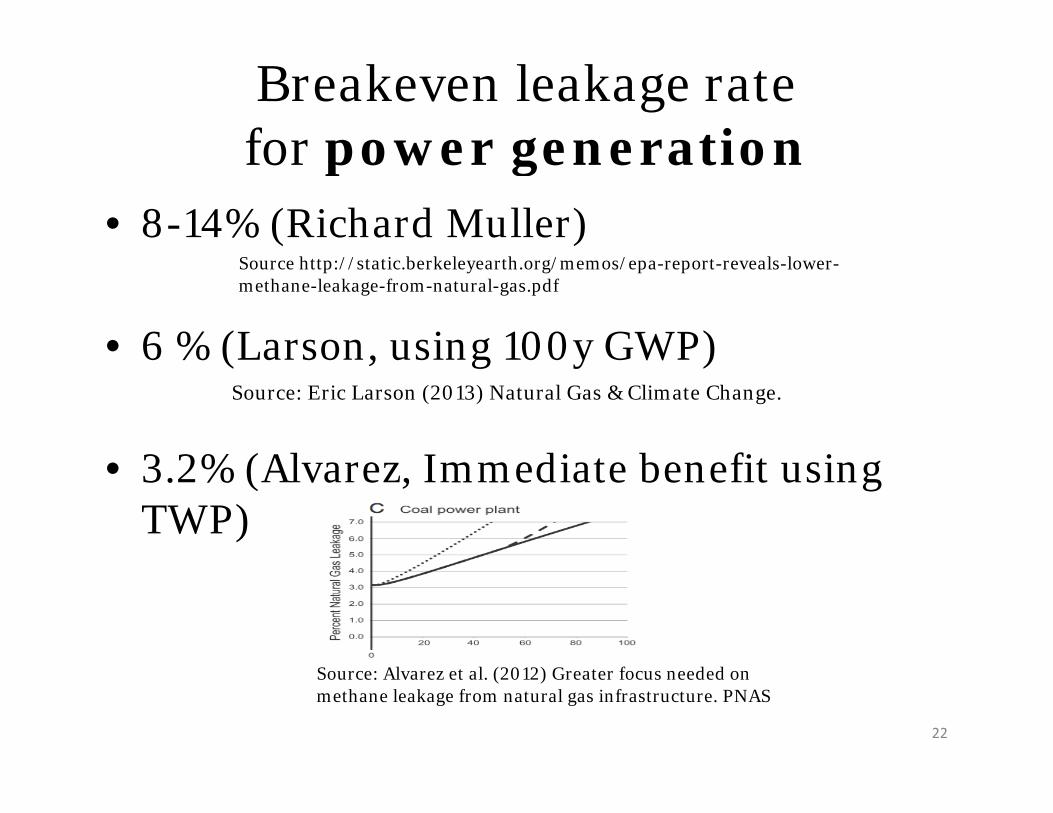
Breakeven leakage rate for power generationfor power generation
• 8-14% (Richard Muller)
• 6 % (Larson, using 100y GWP)
Source http://static.berkeleyearth.org/memos/epa-report-reveals-lower-methane-leakage-from-natural-gas.pdf
6 % (Larson, using 100y GWP)
% (Al I di t b fit i
Source: Eric Larson (2013) Natural Gas & Climate Change.
• 3.2% (Alvarez, Immediate benefit using TWP)
22
Source: Alvarez et al. (2012) Greater focus needed on methane leakage from natural gas infrastructure. PNAS

Breakeven Leakage Rate for gTransportation is:
1 6%(LDV)1.6%(LDV)1% (HDV- bus)
Source: Alvarez et al. (2012) Greater focus needed on methane leakage from t l i f t t PNAS
23
natural gas infrastructure. PNAS
Caveats: HDV not well represented, dated technology, 20% GHG in vehicle, NGVs 20% less efficient than diesel vehicles

Actual Rate?Actual Rate?
EPA/EIA= 1 5% EPA/EIA= 1.5% Source: EPA Greenhouse Gas Inventory 2014 (2009)EIA N l G D ( )EIA Natural Gas Data (2009)
E t l ti b d i t i d EF
EPA methodology criticized• Extrapolation based on inventories and EF
from 1990 data• Corrected based on NG STAR program
24
• Emission factors Underestimation

Recent scientific literatureRecent scientific literature
Actual leakage 25-75% higher than
EPA’s estimateEPA s estimateSource: Brandt et al. 2014. Methane Leaks from North American Natural Gas Systems. Science 343 ,733.
EPA: 1 5% EPA: 1.5%
Corrected: 1.85% -2.63 %5 325

Corrected 2.25% -2.95 %
EPA 1.5% This Study 2.5%
2.5% leakage means benefits in transportation after 40 in LDV (using CNG)
26Caveats: 20% GHG in vehicle, HDV not represented- NGVs are 20% less efficient than diesel
Source: Alvarez et al. (2012) Greater focus needed on methane leakage from natural gas infrastructure. PNAS

Majority of emissions are from the exhaust 6% l k ( % hi h h EPA’ )2.6% leakage (75% higher than EPA’s)
20% lower mpg Same mpg
27

Short and Long Lived Climate llPollutants
Source: http://igsd org/documents/PrimeronShort
28
Source: http://igsd.org/documents/PrimeronShort-LivedClimatePollutantsFeb192013.pdf

EPA Natural Gas STAR ProgramEPA Natural Gas STAR Program
29Oil and gas 4% of all GHG in 2011

Where are the leaks?
Distribution
Production TransmissionGathering and ProcessingProduction TransmissionGathering and Processing
30

Technology Paybackgy y
Source: EPA Natural Gas STAR Program. NRDC leaking profits

Obama: Green completions bli b ( 6)obligatory by Jan 2015 (2016)
• Green completions, closed loop systems that capture liquids and i f h ll d i “ l i ” i gases coming out of the well during “completions” using temporary
processing equipment brought to a well site, then routing fluids and gases to a tank for separation to enable sale of gas and condensate.
Hi i ll h fl id d fl i b k f h ll h • Historically, the fluids and gases flowing back out of the well have been routed to an open air pit or perhaps a tank, allowing substantial amounts of methane to vent directly into the atmosphere.
l ti d k (68 B f ) • completions and workovers (68 Bcf ).
• cleanups of low pressure wells (also known as liquids unloading)(237 Bcf/year )
1 5
2
0
0.5
1
1.5
Source: NRDC leaking profits
0

EPA Natural Gas STAR ProgramEPA Natural Gas STAR Program
10% of what is being emitted
Source: EPA Natural Gas Star Programhttp://www.epa.gov/gasstar/accomplishments/index.html

Examples:Devon Energy and Northern Natural GasDevon Energy and Northern Natural Gas
3% of 2010 earnings
34
