the set-ups or the big picturecatdir.loc.gov/catdir/samples/wiley031/00021217.pdf · the set-ups or...
TRANSCRIPT

8
1THE SET-UPS OR THE
BIG PICTURE
Trading is easy. Only buy stocks that are going up. If they don’tgo up, then don’t buy them.
—Will Rogers
This chapter covers the set-ups for profitable trading—looking at the bigpicture to determine where the market is in its overall development.After this, technical tools are used to pick exact entry techniques, stoploss protection in the event you are wrong, and likely targets for themove. Just as is true for real estate, the most important factor in trad-ing is location, location, location. In addition, add timing, timing, andtiming. The set-up gives you an overall picture on where the market isin its stage of development—a key factor when looking at short-term re-versal and continuation patterns. Ideally, you enter the market in thezone that has the greatest probability of being a successful trade. Ex-pressed another way: Go long in the buy or support zones and short ortake profits in the sell or resistance zones. Ideas such as accumulation,distribution, buy zones, and sell zones will be explained in this chapter.
TRADING VERSUS INVESTING
The first step in investing is to study the basic market fundamentals.Economic factors may take a number of years to be ref lected in themarket so a longer term view is important. However, trading involves astudy of the technical factors that govern short-term market movementsas well as the psychological makeup of the buyers and sellers in themarket. Trading involves more risk than long-term investing, but it alsooffers opportunity for greater profits.
008-027 5/31/00 12:06 PM Page 8

THE SET-UPS OR THE BIG PICTURE 9
THE ULTIMATE TIMING TOOL FOR ALL MARKETS
Short-term trades that have gone sour or ones that I failed to get out ofbecome my long-term investments. You may have heard the expression:“You know it has to go back up.” Let me assure you that the market doesnot have to do anything. If I had to tell you the exact time and price thatthe market will turn back up, it would be when I abandon the trade andnot one minute before. Learn this market principle well because it willsave you many dollars. This principle has, in fact, made me many dol-lars. I have had investors call me hoping for some assurance that theparticular market they are in will turn back up. My response is alwaysthe same, “Let me know when you liquidate because that is the time Iwill buy.” If a trade is not acting right, get out. Don’t stay with a posi-tion. Your capital will remain intact for another trade. Learn to lovesmall losses.
TECHNOLOGY REVOLUTION
We occasionally hear people say: “Markets have changed since the tech-nology revolution” or “If I get enough expensive software and computerstracking all these indicators, surely I can make money in these mar-kets.” Markets have always behaved in the same manner becausehuman nature is constant. The same forces are still at work: fear andgreed and supply and demand. Markets go through cycles. Nothing haschanged. Two equity charts, one from today and one from 1950 with theprices removed would have similar characteristics. Markets in 1950were just as volatile on a percentage basis as they are today.
The technology revolution has not made a difference in trading ex-cept execution cost and ease of order placement. Although informationis available more rapidly, traders’ win/ loss ratio remains at around 80%losers/20% winners. One important big difference is the execution costand ease of order placement. The execution cost can make a big differ-ence in the bottom line. Ease of execution may actually hurt your bot-tom line. Having fast computers, expensive software, or working withthe latest hot techniques such as “chaos” or “space age technology” willnot necessarily add to your bottom line.
Many indicators that massage market data come up with indexesproviding essentially the same information. They tell you the extent ofan overbought/oversold situation. Indicators are usually lagging, thus,you enter the market late and exit late—a losing situation. Learn toread the forces at work by studying the charts and chart patterns.
The technology revolution has put a damper on the “Rainbow Mer-chants” who promise instant riches if you follow their formulas. The av-erage stock owner now has the capability of checking the formulas with
008-027 5/31/00 12:06 PM Page 9

10 THE ULTIMATE TRADING GUIDE
inexpensive software such as Omega®. However, the promise of instantwealth lures even the best of us. The Holy Grail simply does not exist. Ifit did someone would have taken all the “chips” and we would no longerhave markets. You can achieve a technical edge by studying the charts,but you must deal with your own psychological makeup. Some peoplecould not make money if you gave them next week’s Wall Street Journal.Know who you are.
A successful trader must have knowledge. However, having knowl-edge does not automatically make you a successful trader. There is agiant chasm between knowledge and a successful trader. Few of us areable to make that leap and those that do must be on the alert or theywill fall back into the abyss. One of the authors has been up and downthe investment mountain so many times he has lost count. The last timehe came down he made a promise that if he ever got even half way backup the mountain he was not coming back down. Incidentally, if enoughof you buy this book, it will take that author out of the valley.
Money buys us freedom, nothing more and nothing less. Once youachieve a certain level of wealth, collecting additional “things” does notadd to your happiness or give added freedom. If you collect too manythings, you actually lose some freedom. Trading markets can be fun,but like a golf game, it may become an obsession.
STAGES OF MARKET ACTION
All speculative markets have the following basic movements:
1. Accumulation (congestion)—the bottom of a market.2. Run up or thrust up.3. Distribution (congestion)—the top of a market.4. Run down or thrust down.
A fundamental understanding of these different stages of marketaction is critical if you are to be successful as a trader (Figure 1.1).About 85% of the time markets are in the congestion phase and youshould trade for modest profits. Different phases of market action willbe examined so that you will know the stage of the market, when totrade for quick profits during the congestion phase and when to hold onfor the big run up or run down. First, examine the big picture and lookfor set-ups. This is normally done by studying the longer time frame barcharts. Next, f ine tune your analysis by studying the shorter time framecharts for the final part of the picture. This will assist you in knowingwhere to enter the market, where to take profits, and most importantly,when to abandon ship when one is obviously on the wrong side of a
008-027 5/31/00 12:06 PM Page 10

THE SET-UPS OR THE BIG PICTURE 11
trade. By closely examining bar charts, you can see which direction themarket is likely to take. Reading the news is generally dangerous. Readthe charts instead and always think supply or demand or greed andfear. A chart reveals a number of things: When demand is greater thansupply, the market goes up until the two are in balance. A chart also isan expression of greed and fear. Compare the two emotions and askyourself which is the stronger one:
• Greed: “Gee, I wish I had bought more, this trade could havebeen worth a million bucks.”
• Fear: “Oh brother, if this market goes down any more, I will loseeverything I have.”
Fear is a stronger emotion than greed and that is why markets fallfaster than they go up.
Markets may enter reaccumulation and/or redistribution phasesafter a run up or run down. Newton’s theory is at work here. A body inmotion tends to remain in motion. Translated, a trend once startedtends to continue with periodic periods of rest or digestion. The basicWave Theory of 5 waves up or down (covered more extensively in Chap-ter 2), expands on this type of market action. That is the reason mar-kets normally go out of a phase in the same direction as they entered.Until further evidence based on chart action suggests otherwise, youshould trade in the direction of the market prior to its entry into con-gestion. Be alert for trend change after a second or third mark up/markdown in one direction.
These patterns may differ in specifics but repeat over and over againin all speculative markets. Some stocks remained locked in congestion
FIGURE 1.1 Four states of market action.
008-027 5/31/00 12:06 PM Page 11

for years. These are generally ones that simply have poor fundamentals.They are likely to remain there. Trade stocks that are moving.
Accumulation Set-Up
Phase 1 Selling Climax
The accumulation set up generally begins with a selling climax (Figure1.2). This is the first sign of market selling exhaustion and the begin-ning of accumulation. A selling climax is characterized by several downbars of relatively wide ranges with the last bar having the biggest rangewith a big increase in volume.
A sharp rally follows the selling climax. This rally exceeds any pre-vious rally in the prior down move in both time and distance. This is arequirement prior to the market entering into accumulation action. Un-less you have this sharp rally, the question is still open regardingwhether or not the downturn is over.
A test of the low after this sharp rally follows. This movement downmay hold at a higher level or make a slightly lower bottom.
Phase 2 Zones of Support and Resistance
The market will now enter a stage where supply and demand are essen-tially equally balanced. Zones of support and resistance are establishedduring this phase. A zone of support is in the range of the low bar of aselling climax or a subsequent low as shown in Figure 1.3. A zone of re-sistance is the exact opposite. If this is accumulation, volume will begin
12 THE ULTIMATE TRADING GUIDE
FIGURE 1.2 Accumulation stage.
008-027 5/31/00 12:06 PM Page 12

THE SET-UPS OR THE BIG PICTURE 13
to increase on the up days and be somewhat less on the down days. To-ward the end of this phase, the market tops and bottoms may be higherthan previous rallies and reactions.
Several attempts are made at new lows with significant rallies inbetween after the sharp rally. After two to three attempts to make newlows without success, be particularly alert for a wide range bar up. Thistype action indicates people are buying strongly each time the marketapproaches these lows. The third time signifies that the market has ahigh probability of a break out to the upside. A rallying tendency to-ward the end of the accumulation set-up is probable. A potential buyingpoint is on the second or third dip into the accumulation zone.
A sign of strength occurs when the market exceeds one or two previ-ous tops by a significant amount. A significant amount is defined as atleast one average bar range above one or more previous tops. The mag-nitude of the top penetration of one or more prior market tops is indica-tive of accumulation set-up completion. A small penetration of priortops with quick fall back implies some supply and a possible move backto the lower zone of support. Conversely, a significant penetration thathas follow through implies demand. The market should hold above theseprior tops for several bars for added confirmation. This indicates accu-mulation is over and the market may enter the run up phase.
After the sign of strength, markets generally move back to about the50% correction point of the prior market swing. This is the beginning of
FIGURE 1.3 Zones of support and resistance.
008-027 5/31/00 12:06 PM Page 13

the run up phase. Run up or run down is frequently referred to asthrust. Resist the urge to buy when the market is making new highs.Impulsive buyers who believe they will not be on board for the big movefrequently do this. There are innumerable opportunities in other stocksthat are in the accumulation phase in preparation for a breakout to theup side. Enter the market on your terms rather than chasing it. Chas-ing the markets and buying at tops often results in being stopped outwhen the market has its normal correction.
To summarize:
1. First rally after a selling climax rarely holds.2. If any buys are made in the early accumulation set-up, small
profit opportunities are likely until accumulation is complete.3. The best profit opportunities are from buying toward the end of
completion of the accumulation set-up.4. The greatest profits are achieved during the run up and run
down phases of the markets.
Take Profits
If the market is in obvious congestion, the profit-taking points are inthe zone of resistance. Liquidation orders should be placed ahead oftime as these zones are frequently entered and immediately drop away.The profit opportunity may quickly disappear if the liquidation order isnot in the market. A bad trading habit is to wait and see how the mar-ket acts when it reaches the target or resistance zone. This may be doneif the lower time frame is closely monitored.
Terminal Shakeout
A market may have a terminal shakeout at the end of the accumulationset-up (Figure 1.4). This is characterized by the market breakingbelow the entire range of accumulation with an increase volume. Thisis followed by an equally rapid recovery of the entire loss. It may thenback off slightly, go dead and then take off with expanded volume andthrust. The terminal shakeout traps the crowd who sells new lows.These trades can quickly result in significant loss. This type action isalso called a V bottom.
Distribution Set-Up
Phase 1 Buying Climax
The distribution set-up generally begins with a buying climax (Figure1.5). This is the first sign of market buying exhaustion and the beginning
14 THE ULTIMATE TRADING GUIDE
008-027 5/31/00 12:06 PM Page 14

THE SET-UPS OR THE BIG PICTURE 15
of distribution. A buying climax is characterized by several up bars ofrelatively wide ranges with the last bar having the biggest range with abig increase in volume.
A sharp reaction follows the buying climax. This reaction exceedsany previous reaction in the prior up move in both time and distance.This is a requirement prior to the market entering into distribution.
FIGURE 1.4 Terminal shakeout.
FIGURE 1.5 Distribution stage.
008-027 5/31/00 12:06 PM Page 15

16 THE ULTIMATE TRADING GUIDE
Unless you have this sharp reaction, the question is still open regardingwhether or not the up move is over.
A test of the high after this sharp reaction follows. This movementup may hold at a lower level or make a slightly higher top.
Phase 2 Zones of Support and Resistance
The market will now enter a stage where supply and demand are essen-tially equally balanced. If this is distribution, the volume will begin toincrease on the down bars and be somewhat less on the up bars. Towardthe end of this phase, the tops and bottoms may be lower than previousrallies and reactions.
Several attempts are made at new highs with significant reactionsafter the sharp reaction. After two to three unsuccessful attempts tomake new highs, be alert for a wide range bar down. This type action in-dicates aggressive selling each time the market approaches these highs.The third rally failure signifies that the market has a high probability ofa break out to the downside. A potential selling point is on the second orthird rally to the zone of resistance.
A sign of weakness occurs when the market falls below one or twoprevious bottoms by a significant amount. A significant amount is de-fined as at least one average bar range below two to three previous bot-toms. The magnitude of penetration off one or more prior marketbottoms is indicative of distribution set-up completion. A small pene-tration of prior bottoms followed by quick rallies implies demand and apossible move back to the higher resistance levels. Conversely, a signif-icant penetration that follows through implies supply. Market shouldhold below these prior bottoms for several bars for added confirmation.This indicates the distribution stage is over and the market may enterthe run down phase.
After the sign of weakness, markets generally move back to aboutthe 50% correction point of the prior market swing. This is the begin-ning of the run down phase. You should resist the urge to buy whenthe market is making new lows. Impulsive sellers who believe theywill not be on board for the big move frequently do this. There are in-numerable opportunities in other stocks that are in the distributionphase in preparation for a breakout to the down side. Enter the marketon your terms rather than chasing it. Chasing the markets and sellingat bottoms often results in being stopped out when the market has itsnormal correction.
Summarizing:
1. The first reaction after a buying climax is generally followed bya significant rally. However, remember markets fall faster thanthey climb.
008-027 5/31/00 12:06 PM Page 16

THE SET-UPS OR THE BIG PICTURE 17
2. If any sells are made in the early distribution set-up, then smallprofits are likely until distribution is complete.
3. The best profit opportunities are selling toward the end of theaccumulation set-up phase.
4. The greatest profits are achieved by trading the run up and rundown phases of the markets.
Take Profits
If the market is in obvious distribution, the profit-taking points are inthe zone of support. The zone of support is in the area around the priorbottoms of the congestion area. Liquidation orders should be placedahead of time because these zones are frequently entered and immedi-ately move away. If the liquidation order is not in the market, the profitopportunity may quickly disappear. A wait and see approach when mar-kets enter the support zone has its hazards. Monitoring the lower timeframe may be of assistance.
Reaccumulation
Trading the markets would be easy if you could assume that after a buy-ing climax the market enters a distribution set-up and that the next movewill be down. This is not reality. True, the market will enter congestion,but this area of congestion may be reaccumulation. A market may have abuying climax which signifies the run up is over. This does not mean thatthe market is going to go down. This is simply an area of digestion or rest-ing while supply-and-demand forces decide whether the next move will be
FIGURE 1.6 Reaccumulation.
008-027 5/31/00 12:06 PM Page 17

18 THE ULTIMATE TRADING GUIDE
up or down. Look for the market to have several rallies and reactions.After the second or third rally in this congestion, the range and loca-tion of the bars in the trading zone will frequently give an indication ondirection of the next move. Markets generally move out of congestion inthe same direction that they entered congestion. Figure 1.6 on page 17shows a stock entering congestion after a buying climax. If you tradeat all in this zone of congestion, buy dips and sell rallies until point E.Note that the lows are higher and the market is trading and holding forseveral bars near the top of the trading rage. This implies reaccumula-tion with another run up likely. The basic ideas are the same, only inreverse for redistribution.
Run Up and Run Down Stages
The run up and run down phases are the most profitable (Figure 1.7).However, these moves occur only about 15% of the time between the con-gestion zones. The parallel movement theory works extremely well inrunning markets. Fundamentally, this theory is that rallies and reac-tions will equal previous rallies and reactions. Buy on equal reactionpoints and take profits at equal movement rallies or thrusts. The rundown phase is roughly the mirror image of the run up phase. Down mar-kets generally fall quicker and deeper than up markets. Fear is a greateremotion than greed.
FIGURE 1.7 Run up stage.
008-027 5/31/00 12:06 PM Page 18

THE SET-UPS OR THE BIG PICTURE 19
Market Exhaustion
After an extended up move or even a move of three bars in one direc-tion, the markets are often in their most vulnerable position and sub-ject to a correction and may be the beginning of a new trend. A strongreversal bar at this point is the place to take a nibble on the short side.Get out of the position if the market fails to follow through in the nextcouple of days. A lower opening is the first sign of exhaustion and per-haps end of move.
Five ways to tell when an up market may be entering congestion:
1. Market has 2 wide-range bars down.2. The market is unable to make a new high for 10 bars.3. The market has non-overlapping days counter to the prevailing
trend. A non-overlapping bar is when the high of a bar is lessthan the low of the top bar. This may occur three to four barsafter the top bar.
4. The market has a sharp spring or upthrust after an extendedrun. A spring is when the market goes to a new low, finds no sup-ply, then aggressively rallies. An upthrust is when the marketgoes to a new high, f inds no demands, and falls rapidly. Chapter6 discusses these concepts in more detail.
5. The market has a 75% retracement or greater of last thrust.
End of Move
The end of a price movement is signaled when the high price of a movecannot be exceeded by three attempts to breakthrough to new highs. Thisis usually preceded by shortening of the upward thrusts. This is pre-sumptive evidence that the upward move is over either temporarily orpermanently. This is a point to either take profits or move stops in tight.
HOW TO MAKE MONEY WITH THIS THEORY
The big question is how does one use the preceding information to makemoney in the markets. Before you are through with this book, this ques-tion will have some answers. The goal is for you to see and recognize theset-ups and patterns at the time they occur and not in hindsight. Any-one can see them after the fact. What follows is a method that might beused. Rules are given. Charts show patterns and places to use the rulesfor buy/sell entries.
Identify the congestion action as one of reaccumulation or redistribu-tion by the direction of the last run up or run down. Markets generally
008-027 5/31/00 12:06 PM Page 19

20 THE ULTIMATE TRADING GUIDE
go out of congestion in the same direction from which they entered. As-sume this to be the case until the congestion pattern suggests other-wise.
Figure 1.8 shows a stock in reaccumulation. Buy zones (Figure 1.9)may be defined as follows (sell zones are the opposite):
• At or below a 50% correction of the run up, or• In the support zone.
FIGURE 1.8 Reaccumulation.
FIGURE 1.9 Buy entry patterns.
008-027 5/31/00 12:06 PM Page 20

THE SET-UPS OR THE BIG PICTURE 21
Long entry is made once the market enters the support zone byusing the following rules:
• Closing above two or more prior closes with a wide range bar andexpansion of volume. A wide range bar is one that is greater thanthe 10-day average range of the bars.
• Buy on a half range breakout from the opening. Compute 50% ofthe prior days range and add that to the opening.
• Buy on the second or third pullback to the support zone. Bewareof doing this on the fourth pullback as markets usually breakthrough on the fourth testing of an area.
• A close on day of entry above the prior day’s high and opening isfurther confirmation of strength.
• A market unable to make a new high for 10 bars raises a red f lag.• Buy after a two to three bar movements into the support zone.
You must be alert and have the ability to act quickly or the oppor-tunity will be missed on the good trades. The bad trades will giveyou plenty of time to act. The time window for good trades is fre-quently very narrow.
Stop
Two stop points are suggested: An average range below the prior reac-tion point low, or an entry bar range below the low of entry bar. Thisstop is moved up as soon as some breathing room develops. Liquidate theposition if market does not respond within about three bars. Do notwait for the stop to be hit.
Target
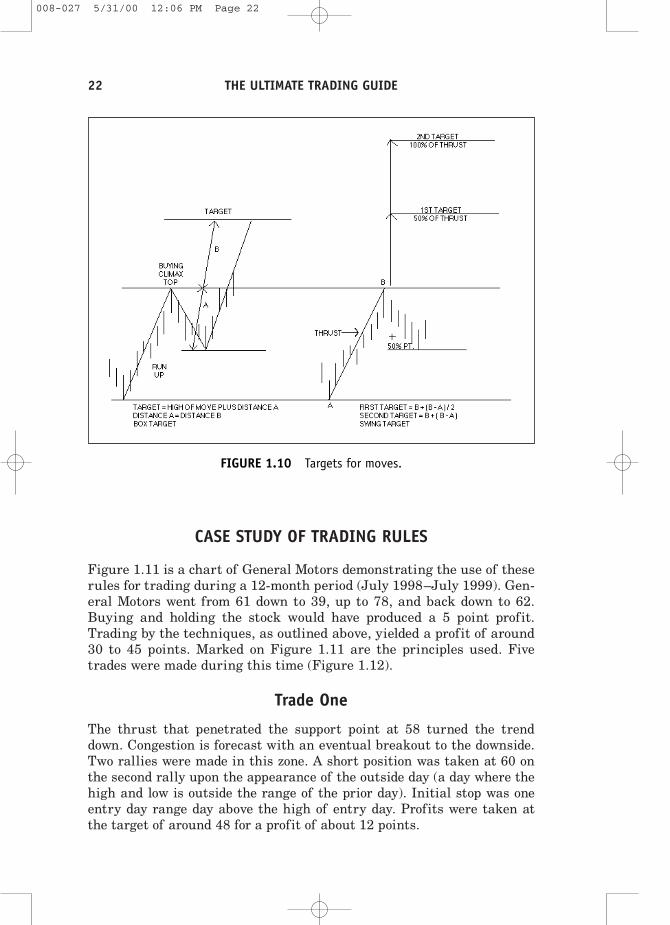
The target or profit objective shown in Figure 1.10 is:
• Box target. The width of the box of the accumulation pattern(B = A), or
• Swing target. 50% of the run-up movement or thrust added to thehigh of the move for first objective or 100% for second objective.
Once the market reaches the target zone, either liquidate at marketor on evidence that supply is overcoming demand.
These targets will be used throughout this book. If in a positionand the market enters the objective area, you should be alert to eithertake profits or at least tighten the stops.
008-027 5/31/00 12:06 PM Page 21
22 THE ULTIMATE TRADING GUIDE
CASE STUDY OF TRADING RULES
Figure 1.11 is a chart of General Motors demonstrating the use of theserules for trading during a 12-month period (July 1998–July 1999). Gen-eral Motors went from 61 down to 39, up to 78, and back down to 62.Buying and holding the stock would have produced a 5 point profit.Trading by the techniques, as outlined above, yielded a profit of around30 to 45 points. Marked on Figure 1.11 are the principles used. Fivetrades were made during this time (Figure 1.12).
Trade One
The thrust that penetrated the support point at 58 turned the trenddown. Congestion is forecast with an eventual breakout to the downside.Two rallies were made in this zone. A short position was taken at 60 onthe second rally upon the appearance of the outside day (a day where thehigh and low is outside the range of the prior day). Initial stop was oneentry day range day above the high of entry day. Profits were taken atthe target of around 48 for a profit of about 12 points.
FIGURE 1.10 Targets for moves.
008-027 5/31/00 12:06 PM Page 22

THE SET-UPS OR THE BIG PICTURE 23
Trade Two
The market had three rallies in this second zone of congestion. Shortwas taken on the wide range down bar after the third rally at 48. Prof-its were taken at the target for a profit of about 7.5 points. A wide range
FIGURE 1.11 GM.TXT-Daily (September 15, 1999). Created with TradeStation2000i by Omega Research © 1999.
FIGURE 1.12 GM.TXT-Daily (November 30, 1998). Created with TradeStation2000i by Omega Research © 1999.
008-027 5/31/00 12:06 PM Page 23

24 THE ULTIMATE TRADING GUIDE
down bar is one where the range is greater than the average range andmarket closes below the opening and prior close.
Trade Three
Congestion did not take place again until the market reached 62 (Figure1.13). A buy was made at either the 50% point of the correction or on thewide bar up from the 50% point. Profit taken at target of 9 to 13 points.
Trade Four
This trade (Figure 1.14) was a loser if purchased at the 50% point of therun up. However, if bought at the high of the low bar of the prior thrust,it yielded a small profit. The position was liquidated when it was notedthat the wide range down bar implied distribution and not accumula-tion. The profit at most was 4 points, loss may have been 3 points with aone range stop from point of entry.
FIGURE 1.13 GM.TXT-Daily (April 15, 1999). Created with TradeStation 2000i byOmega Research © 1999.
008-027 5/31/00 12:06 PM Page 24

THE SET-UPS OR THE BIG PICTURE 25
Trade Five
The up thrust on the third rally with subsequent movement to the low ofthe range clearly defined this area as distribution. A short was made onone of the two pull backs. Note that short was made on a pullback orrally. The trade was liquidated at the 64 area for a profit of 5 to 7 points.
TO TRADE OR NOT TO TRADE
Your money is not at risk when it is not in the market. This style of trad-ing limits exposure to around 10% to 15% of the time. You will be out ofthe market 85% to 90% of the time. A position may be held through an ac-cumulation/distribution period. There is nothing wrong with this ap-proach. However, by so doing, the potential exists for giving back asubstantial amount of the profits. The pattern may be distribution ratherthan reaccumulation. You must examine many charts to prove to yoursatisfaction that this is a valid approach and is suitable to your style andcomfort level of trading.
This approach involves some judgment. You should attempt to mecha-nize as many rules as possible to keep the judgment down to a minimum.
FIGURE 1.14 GM.TXT-Daily (June 30, 1999). Created with TradeStation 2000i byOmega Research © 1999.
008-027 5/31/00 12:06 PM Page 25
26 THE ULTIMATE TRADING GUIDE
Trade the Markets That Are Moving
For active trading, you should look for stocks and/or futures that aremoving or trending and not dull sideways moving equities. The definitionof a moving equity is somewhat subjective. There are many sources thatrank stocks that are out performing others and are moving. InvestorsBusiness Daily is a great source for finding stocks that are moving.
Moving equities might be vehicles that:
• Have expanded volatility.• Have made new four-week highs.• Stocks that are in the run up phase• Slope of a 20-day moving average of closes is decidedly up/down.• The leaders in their particular sector of the market.
CONCLUSION
Remember, the name of the game is to be profitable, not to catch 90% ofevery move. Learn to be satisfied with small chunks of the market.Enter the market on pattern set-ups and take profits at targets or atthe first sign of supply overcoming demand.
These same principles work in any time frame, including day trading.There is something here for every time-frame trader. If your perspectiveis longer term, go to the weekly charts. Many false moves will be made,but that is what stops are for. The only way you will make money withtrading is to look at numerous charts and mark your buy/sell, take prof-its, and stop loss points on them. This makes the idea yours rather thanours. You might then be successful in your trading. One of the most diffi-cult things you will ever do is liquidate a position toward the end of therun up phase or at a buying climax. Develop the attitude of being a niceperson: When everyone is wanting to buy, sell them some.
The General Motors study is only an example of how you build atrading system based on the supply/demand forces of the market. Markup many charts with the things you see relating to supply/demand orbuying and selling climaxes. Read Popular Delusions and the Madnessof Crowds by Charles Mackay. Written 160 years ago, the principles arejust as true today as in 1841. Don’t trust your memory. Keep a log bookon your trading activities. Write down what you see every day and fre-quently review your notes. Keep two charts: One on what you did, an-other one on what should have been done. Learn by comparing. Showthe principles occurring at market turning points. Hindsight analysisis usually at least 90% correct. The goal is to see the patterns as theyare taking place and take appropriate action.
008-027 5/31/00 12:06 PM Page 26

THE SET-UPS OR THE BIG PICTURE 27
NOTE
Some of the ideas regarding supply and demand are based on the pio-neering studies of Wyckoff, Tubbs, and Larsen. Further studies byWyckoff are available from the Stock Market Institute in Phoenix, Ari-zona and Stocks and Commodities Magazine. The Tubbs and Larsencourses came from a private collection.
008-027 5/31/00 12:06 PM Page 27