the senescent microenvironment promotes the emergence of
TRANSCRIPT
Received: November 14, 2014; Revised: July 2, 2015; Accepted: July 8, 2015
© The Author 2015. Published by Oxford University Press. All rights reserved. For Permissions, please email: [email protected].
1180
Carcinogenesis, 2015, Vol. 36, No. 10, 1180–1192
doi:10.1093/carcin/bgv101Advance Access publication July 13, 2015Original Manuscript
original manuscript
The senescent microenvironment promotes the emergence of heterogeneous cancer stem-like cellsLuis Jaime Castro-Vega1,2,†, Karina Jouravleva1,2,†, Paola Ortiz-Montero3, Win-Yan Liu1,2, Jorge Luis Galeano3, Martha Romero4, Tatiana Popova5, Silvia Bacchetti6, Jean Paul Vernot3 and Arturo Londoño-Vallejo1,2,* 1UMR3244, Telomeres and Cancer Laboratory, “Labellisé Ligue”, Institut Curie, Paris 75248, France, 2UPMC University, Paris 75005, France, 3Cellular and Molecular Physiology Group, Instituto de Investigaciones Biomédicas, Faculty of Medicine, Universidad Nacional de Colombia, Bogotá DC 111311, Colombia, 4Department of Pathology, Hospital Universitario-Fundación Santa Fe de Bogotá, Bogotá 110111, Colombia, 5U830 Genetics and Cancer Biology, Institut Curie, Paris 75248, France and 6Department of Experimental Oncology, Istituto Regina Elena, Rome 00158, Italy
*To whom correspondence should be addressed. Tel: +33 0 156246611; Fax: +33 0 156246674; Email: [email protected]
†These authors contributed equally to this work.
Abstract
There is a well-established association between aging and the onset of metastasis. Although the mechanisms through which age impinges upon the malignant phenotype remain uncharacterized, the role of a senescent microenvironment has been emphasized. We reported previously that human epithelial cells that undergo telomere-driven chromosome instability (T-CIN) display global microRNA (miR) deregulation and develop migration and invasion capacities. Here, we show that post-crisis cells are not able to form tumors unless a senescent microenvironment is provided. The characterization of cell lines established from such tumors revealed that these cells have acquired cell autonomous tumorigenicity, giving rise to heterogeneous tumors. Further experiments demonstrate that explanted cells, while displaying differences in cell differentiation markers, are all endowed of enhanced stem cell properties including self-renewal and multilineage differentiation capacity. Treatments of T-CIN+ cells with senescence-conditioned media induce sphere formation exclusively in cells with senescence-associated tumorigenicity, a capacity that depends on miR-145 repression. These results indicate that the senescent microenvironment, while promoting further transdifferentiations in cells with genome instability, is able to propel the progression of premalignant cells towards a malignant, cell stem-like state.
IntroductionCancers of epithelial origin (carcinomas) are the most frequent type of malignancy in humans, with their incidence and aggres-siveness increasing with age (1). This observation raises the question as to whether the aging process itself contributes to tumor progression (2). In this regard, telomere biology seems to play a pivotal role since shortening of telomeres has been asso-ciated with cellular senescence and organismal aging (2–4) as well as with cancer incidence and mortality (5,6).
In the multistep carcinogenesis model, telomere shorten-ing has been observed together with increased chromosome
instability (CIN) in early precancerous conditions (7–9). Experimental models have also shown that a transient period of telomere instability followed by reactivation of telomerase contributes to the acquisition of the metastatic phenotype (10). Also, we have previously shown that telomere-driven chromo-some instability (T-CIN) in human epithelial kidney cells (HEK cells) induces a global microRNA (miR) deregulation and the acquisition of phenotypes suggesting metastatic capability (11).
On the other hand, senescent cells display the so-called senes-cence-associated secretory phenotype (SASP) which comprises
Downloaded from https://academic.oup.com/carcin/article-abstract/36/10/1180/316403by gueston 14 April 2018
L.J.Castro-Vega et al. | 1181
the secretion of a large variety of cytokines, growth factors (GF) and enzymes that are expected to alter the surrounding micro-environment in a paracrine fashion (landmark publications on the composition and activities of SASP can be found in recent reviews (12,13)). In particular, it has been shown that senescent fibroblasts can promote tumor progression and tumorigenesis by pre-malignant cells (14). SASP can also impact the differentiation status of tumor cells (15) and induce an epithelial-to-mesenchy-mal transition (EMT) (16). On the other hand, cancer-associated fibroblasts, which may comprise senescent fibroblasts, promote the tumorigenesis of premalignant cells (17,18). Nevertheless, the contribution of senescence to the progression of premalig-nant epithelial cells is still largely uncharacterized. Interestingly, it has been suggested that a genotoxic-induced SASP could con-tribute to the emergence of cancer stem-like cells within a popu-lation of irradiated (or doxorubicin-treated) multiple myeloma cells (19), thus providing a potential explanation for the high fre-quency of MM relapse after anticancer therapy (19). Whether a senescent microenvironment would promote the emergence of cancer stem-like cells in epithelial tissues remains unexplored.
In the present study, we examined the impact of a telomere-driven senescent microenvironment on the tumorigenic poten-tial of immortal epithelial cells having undergone T-CIN. Our data demonstrate the prominent role of senescence as a per-missive microenvironment for the full transformation of T-CIN cells. Notably, this progression in tumor capacity is associated with the manifestation of enhanced stem-like properties. We also show that SASP influences the plasticity of the T-CIN cells, but not that of CIN cells. Our results support the notion that telomere-driven senescence in stromal cells stimulates the pro-gression of T-CIN premalignant cells towards the acquisition of a stemness-like, highly tumorigenic state, thus providing a mech-anistically plausible explanation for the increased incidence of deadly carcinomas with advancing age.
Methods
Cell lines and transfectionsHuman embryonic epithelial kidney cells (HEK cells) were obtained and transformed with a plasmid carrying ER-SV40 and a neo resistant cassette immediately after isolation, as described (20). Cells were directly sent to the Londoño lab 12 years ago for a collaborative work (21). Immortalized HEK cells derived from clone HA1 (Early and post-crisis cells) and HA5 (Early and Late) were cultured as described previously (11). ‘Explanted’ cell lines were established by putting in culture flasks tissue slices obtained from the tumors formed by PC1 and PC2 in immunocompromised mice. Explanted cells were maintained in complemented minimum essential medium (MEMα),
as the other HEK cells. For this work, the identity of all HEK derivatives was established by STR analysis as described below. Primary and hTERT (human telomerase reverse transcriptase) immortalized foreskin fibroblasts HCA2 (isolated in, and directly obtained from, Dr Olivia Pereira Smith laboratory) were maintained in Iscove’s modified Dulbecco’s media + glutamax culture media (Invitrogen), supplemented with 10% fetal bovine serum (FBS) in a humidified 5% CO2 atmosphere at 37°C. To obtain fully tumorigenic HEK cells, HA1 cells immortalized with hTERT were transfected with pBabe-Puro RasG12V (Harvey rat sarcoma viral oncogene homolog, mutated G12V) (as described in 22). A clone with the highest level of expression of the protein (not shown) was used for the experiments described here. To restore miR-145 expression, cells were transfected with 50 nM hsa-miR-145 mimic (ID MC11480) or negative control #1 pre-miR (ID AM17110) (Life Technologies) using Lipofectamine 2000 as transfection reagent (Invitrogen). To deplete miR-145, cells were transfected with 50 nM anti-miR-145 miRNA Inhibitors (ID MH11480) or negative control #1 (ID AM17010) (Life Technologies).
ImmunoblottingSubconfluent cells were harvested by trypsinization, washed with cold phosphate-buffered saline (PBS) and lysed in radioimmunoprecipitation assay buffer with protease inhibitors (Roche). Protein quantifications were performed using the Pierce BCA Protein Assay kit (Thermo scientific), and 20–40 µg protein were analyzed in 4–12% Bis–Tris gels (Invitrogen). Transfer was performed for 2 h at 25 V and blocking with 5% milk or bovine serum albumin for 1–2 h. Primary antibodies were incubated at 4°C overnight. Detection was performed using the ECL plus kit (Amersham). For quantifi-cation, the intensity of the specific band was normalized by the intensity of the band revealed with antibodies against β-actin.
Tumorigenicity assaysHEK cell lines were expanded and then harvested by trypsinization for 5–10 min at 37°C in an incubator. Cells were washed with PBS 1×, centri-fuged for 5 min at 800 g, resuspended in culture medium without serum and kept on ice until use. A volume of 0.2 ml of the cell suspension containing from 103 to 5 × 10⁶ (as indicated) was used for subcutaneous injections in the flanks of severe combined immunodeficiency (SCID) mice (6- to 8-week-old). For coinjection experiments, a suspension containing 2.5 × 10⁶ of both HEK cells and either presenescent, senescent or hTERT-immortalized HCA2 fibroblasts was used. Animals were kept under specific pathogen–free envi-ronment conditions and inspected for tumor growth at least two times a week for at least 3 months. Tumor masses were measured in two axes using a precision caliper (HERMANN Medizintechnik, ref H102-31710). The tumor volume was calculated using the formula: tumor volume [mm3] = (length [mm]) × (width [mm])2 × 0.52. Animals were killed at the end of the observa-tion period or when tumors reached a volume of 1200 mm3. Institutional and National guidelines for the care and use of animals were followed. The institutional ethics committee board (CEEA-IC) approved all the protocols.
Soft agar colony formation assayA solution of autoclaved sterile agar 3.3% (Sigma) was melted in a micro-wave and cooled to 40°C in a water bath. This solution is then enriched with Dulbecco's modified Eagle's medium 2× (Gibco) and 20% FBS also warmed to the same temperature and 1.5 ml were poured in MW6 plates (Nalge Nunc International). This bottom layer is incubated at room tem-perature under the hood until solidified. A second agar solution of 1.3%, also containing Dulbecco's modified Eagle's medium 2× with 10% FBS, was prepared in a similar way. Each cell line (3 × 10⁵ cells per plate) was resuspended in this top solution layer and 1.5 ml were carefully seeded per well. Colonies (400 µm) were scored under microscopy visualization after 20 days. Assays were done at least twice independently.
ImmunofluorescenceFor F-actin staining, 2 × 10⁴ cells per well were seeded on microscope slides (Thermo scientific). The next day, cells were washed with PBS 1× and fixed in 3% formaldehyde and 2% sucrose for 15 min. Then, cells were washed twice and permeabilized for 10 min. Stock solutions of phalloi-din–tetramethylrhodamine isothiocyanate (TRITC) conjugates (Sigma) have been made in dimethyl sulfoxide at 0.5 mg/ml and were used at a concentration of 1:400 in PBS for 40 min at room temperature. Cells were
Abbreviations
EMT epithelial-to-mesenchymal transitionFBS fetal bovine serumGF growth factorGAP genome alteration printHEK cells human epithelial kidney cells hTERT telomerase reverse transcriptase miR microRNAMET minimum essential medium MEMα mesenchymal-to-epithelial transition PBS phosphate-buffered saline PCR polymerase chain reaction SASP senescence-associated secretory phenotype SCID severe combined immunodeficiencySCM senescence-conditioned mediaT-CIN telomere-driven chromosome instability
Downloaded from https://academic.oup.com/carcin/article-abstract/36/10/1180/316403by gueston 14 April 2018
1182 | Carcinogenesis, 2015, Vol. 36, No. 10
washed several times to remove the conjugate and stained with 0.5 mg/ml 4′,6-diamidino-2-phenylindole.
Migration/invasion assaysWound healing assays were performed in cells at 75% confluence. At least 10 images at each time point in two independent experiments were cap-tured at 0, 6 and 12 h. For transwell migration assays, filters (8.0 µm pore size) and multiwell-6 format plates (BD Biosciences) were used. A total of 2 × 10⁵ non-starved cells are seeded the day before. Chambers are rinsed with media without serum 2–4 h before the initiation of the assay. Chemotaxis was induced using medium with FBS 10% on the bottom side of the chambers. Cells were allowed to migrate for a period of 12 h after which they were fixed with methanol 15 min and then stained with crys-tal violet 0.2% in water for 1 h. Cells were removed from the upper side of the chamber with cotton swabs. A total of 10 images from two inde-pendent experiments were taken for quantifications using an inverted microscope. For invasion assays, a coat of growth factor reduced matrigel (BD Biosciences) diluted one-third in media without serum was applied in the upper side of the chambers and incubated for 1 h. For this assay, 2 × 10³ cells were seeded in multiwell 24 format plates (BD Biosciences) and allowed to traverse the matrigel for a period of 72 h. Fixation, staining and analyses were performed in a similar way as in the migration assay.
Flow cytometryA total of 1 × 10⁵ cells were harvested after trypsinization, washed twice and resuspended in 500 µl PBS 1× containing albumin 0.5%. Cells were stained with 5 µl of CD44-APC (BD Biosciences) and 5 µl of CD24-FITC (BD Biosciences) for 20 min and washed again to remove the excess of antibodies. A mesen-chymal stem cell line was used as positive control for the expression of CD44 and negative control for CD24. Conversely, the epithelial cell line MCF7 was used as positive control for CD24 and negative for CD44. The cytometric analysis was carried out using a fluorescence-activated cell sorting (FACS) Aria-II flow cytometer. Data were collected from 10 000 to 20 000 events for each sample. The analysis was performed using the software FACS Diva. Signal amplification was decreased to normalize the dot plot for analysis, and compensation was used to exclude overlap between the two signals.
Analysis of miR expressionFor pre-miRs, a total of 178 precursors were analyzed using the MiRmaid miRNA Precursors RT-qPCR primer set (Eurogentec) as described pre-viously (11). The analyses were performed using R software with Bioconductor packages and custom functions defined at the Institut Curie Bioinformatics group (http://bioinfo.curie.fr/projects/ema), as described (11). Specific miRs were analyzed by polymerase chain reaction (PCR), as described in the following paragraph.
RT-qPCROne microgram of total RNA, isolated with miRNeasy Mini Kit (Qiagen) according to manufacturer’s instructions, was treated with DNAse I (Invitrogen) and used for the reverse transcription with oligo-dT priming and SuperScript III reverse transcriptase (Invitrogen). The resulting cDNA was diluted 1:4 and assessed by qPCR using SybrGreen GoTaq mastermix (Promega). Measurements were done in a Roche instrument LC480. RT minus control was included to ensure against contaminating transcript. For each sample, qPCR reactions were done in triplicate, and the entire analysis was done twice independently. The fold change was calculated as the relative expression of the gene of interest to the expression of β2-microglobulin (housekeeping) using the 2−ΔCT method (23).
Pre-miRs were measured using a RT-qPCR based platform as described (11). Briefly, the expression of 178 precursors was examined using the MiRmaid miRNA Precursors RT–qPCR primer set (Eurogentec) following the manufacture’s protocol recommendations. Universal RT reactions from 1 µg of RNA starting material were purified and then amplified using specific pre-miR primers using the ABI Prism 7500 thermal cycler (Applied Biosystems). The geometric mean of three control genes (5S, TBP, HBMS) was used for normalization. Unsupervised classification was performed using a set of 87 pre-miRs that showed the most variable expression.
The expression analysis of the miR-200 family, miR-143 and miR-145 (mature strands) was performed using the RT–quantitative PCR (RT–qPCR)
miRCURY system from (EXIQON). Briefly, 250 ng of DNase-treated RNA was used to prepare complementary DNAs in three independent RT reactions, and qPCR reactions were carried out using miR-specific locked nucleic acid primers in a 7500 Real Time PCR system. The mean expression of mem-bers of the hsa-Let7 family was used as endogenous control for normali-zation. Relative quantifications were calculated with the 2−ΔΔCT method.
Sphere formation assayCells were in the exponential phase of growing the day of the assay and harvested by trypsinization. A total of 2 × 10⁴ cells per well were seeded in triplicates in low cell binding multiwell plates (MW6) (Nalge Nunc Interanational), containing a solution of medium without serum, supple-mented with recombinant human GF epidermal growth factor (Gibco; Ref. PHG0315) and fibroblast growth factor (FGF) basic (Gibco; Ref. PHG0266) at a final concentration of 20 ng/ml, and supplemented with B-27 (Gibco; Ref. 17504) and methylcellulose 0.8% (R&D Systems). Cells were incubated in a humidified 5% CO2 atmosphere at 37°C during 7–10 days after which the spheres (>100 µm) were counted and reported as the mean number of spheres after seeding 2 × 10³ cells/cm2 surface area.
Differentiation assaysFor adipogenic differentiation, 2 × 10⁴ cells were seeded in a 24-well format plate and cultured in complete culture medium until they reached 100% con-fluence. Positive controls included bone marrow mesenchymal stem cells isolated from normal volunteer donors. After third passage, mesenchymal stem cells were plated at 2 × 10⁴ cells/1.5 cm2 and cultured to reach 90% conflu-ence in Iscove’s modified Dulbecco’s media culture medium to induce osteo-genic, adipogenic and chondrogenic differentiation as described previously. The medium was replaced with adipogenic induction medium containing incomplete culture medium MEMα (Sigma–Aldrich) supplemented with 10% FBS, 1 mM dexamethasone (Sigma), 0.5 mM isobutylmethylxanthine (Sigma), 200 μM indomethacin (Sigma–Aldrich), 10 μg/ml insulin (Sigma–Aldrich). After 3 days, maintenance medium containing MEMα, 10% FBS and 10 μg/ml insulin, was added to the cells. Three cycles of induction and maintenance were completed. After 10 days, cells were washed twice with PBS 1×, followed by fixation with formalin for 30 min (Sigma–Aldrich) and stained with 0.35% oil red O solution for 1 h (Sigma–Aldrich). Plates were washed three times with PBS 1× and dried, and the number of oil red-O positive colonies were observed with an inverted microscope (24,25). Osteogenic differentiation was induced by culturing the cells in osteogenic induction medium containing incomplete culture medium MEMα (Sigma–Aldrich) supplemented with 10% FBS, 100 nM dexamethasone (Sigma–Aldrich), 0.2 mM ascorbic-2-phosphate (Sigma–Aldrich) and 10 mM β-glycerophosphate (Sigma–Aldrich). Medium was changed every 3–4 days. After 10 days, cells were assessed for alkaline phosphatase activity using an alkaline phosphatase staining kit (Chemicon International). The cells were washed twice with PBS 1×, followed by fixation with formalin for 2 min (Sigma–Aldrich) and washed again three times with PBS 1× and 0.05% Tween-20. About 0.5 ml of alkaline phosphatase reagent was added to the cells and they were incubated at room temperature for 15 min. Finally, cells were examined with an inverted microscope (26). For chondrogenic differentiation, 5 × 10⁴ cells were plated in a 24-well plate and cultured in complete chondrogenic medium, containing MEMα and 10 ng/ml TGFβ-1 (Sigma–Aldrich). The medium was changed three times a week. After 10 days, the cells were washed twice with PBS 1×, followed by fixation with formalin for 5 min (Sigma–Aldrich) and stained with 0.1% Safranin O for 3 min (Sigma–Aldrich). Plates were washed three times with PBS 1× and the cells were observed with an inverted microscope (27). Differentiation states were also evaluated by measuring expression level of genes associated with adipogenic (PPARγ; C/EBP-alpha), osteogenic (Runx2; APL) and chondrogenic (AGGRECAN; SOX9) differentiation by RT-qPCR 10 days after induction.
Beta-galactosidase assayCells seeded in MW6 plates were washed once with PBS 1×, then fixed for 3–5 min at room temperature in a solution containing 0.2% glutaralde-hyde and 2% paraformaldehyde in PBS 1×. Next, cells were washed again twice with PBS 1× and incubated at 37°C with the β-gal substrate in an acidic buffer (pH 6.0). The development of a perinuclear blue color, which is indicative of senescent cells, was followed using a standard light micro-scope and photographs were taken 24 h after.
Downloaded from https://academic.oup.com/carcin/article-abstract/36/10/1180/316403by gueston 14 April 2018
L.J.Castro-Vega et al. | 1183
Single nucleotide polymorphism whole genome array (CytoScan)Affymetrix Cytoscan HD arrays were hybridized with labeled DNA from PC1, PC2 and the four explanted cell lines. Analyses were performed using the genome alteration print (GAP) utility (28). Briefly, the GAP method detects absolute segmental copy numbers and genotype status in complex cancer genome profiles measured by single nucleotide polymorphism arrays. The method is based on pattern recognition of alteration profiles represented by the GAP patterns. The GAP pattern for each tumor genome is a two-dimen-sional table of alteration segments characterized by copy number variation and allelic imbalance values. Copy number interpretation of the GAP pattern is based on the closest model pattern, which is the model of copy number alterations for a given ploidy (http://bioinfo-out.curie.fr/projects/snp_gap/).
Short tandem repeats analysisShort tandem repeats analysis was carried out to ascertain the identity of cell lines obtained after CIN and out of xenografts. A geneprint10 kit from Promega (B9510) was used following the manufacturer’s instructions. Samples were run in an Applied Biosystems Genetic Analyzers 3100 and analyzed in Genemapper 5 (Lifetechnologies). The list of markers used and the corresponding alleles are shown in Supplementary Table 1, available at Carcinogenesis Online.
AntibodiesThe following antibodies with their respective specifications were used: mouse monoclonal 419 (LT-SV40; provided by Dr Silvia Bacchetti) dilution 1:1000; mouse monoclonal Beta-actin (Santa Cruz Biotechnology; Ref. sc-47778) dilution 1:30 000; mouse monoclonal RAS (BD transduction laboratories; Ref. 610001) dilution 1:500; rabbit polyclonal Nanog (Abcam; Ref. ab21624) dilution 1:500; rabbit polyclonal Sox2 (Millipore; Ref. AB5603) dilution 1:500; mouse monoclonal Oct3/4 (Santa Cruz Biotechnology; Ref sc-5279) dilution 1:500.
PCR primersThe following primers were used: OCT4 Forward: AGTTTGTGCCAGGGTTTTTG; OCT4 Reverse: ACTTCACCTTCCCTCCAACC; NANOG Forward: CCTGTGATTTGTGGGCCT; NANOG Reverse: GACAGTCT CCGTGTGAGGCAT; SOX2 Forward: GTATCAGGAGTTGTCAAGGCAGAG; SOX2 Reverse: TCCTAGTCTTAAAGAGGCAGCAAAC; KLF4 Forward: TATGACCCACACTGCCAGAA; KLF4: Reverse: TGGGAACTTGACCATGATTG; E-cadherin Forward: TGGACAGGGAGGATTTTGAG; E-cadherin Reverse: ACCCACCTCTAAGGCCATCT; ZEB1 Forward: AAGAATTCACAGTGGAGAG AAGCCA; ZEB1 Reverse: GGTTTCTTGCAGTTTGGGCATT; ZEB2 Forward: TGTAGATGGTCCAGAAGAAATG; ZEB2 Reverse: CCATTGTTAATTGCGG TCT; MYC Forward: CGGAACTCTTGTGCGTAAGG; MYC Reverse: CTCAGCCAAGGTTGTGAGGT; VIM Forward: CGAGGACGAGGAGAGCAGGAT TTCTC; VIM Reverse: GGTATCAACCAGAGGGAGTGA; ZO1 Forward: ACAAAGGAGAGGTGTTCCGTGTT; ZO1 Reverse: CGTTCTACCTCCTTAT GATTTTTACCA; CD44 Forward: GCATTGCAGTCAACAGTCGAA; CD44 Reverse: CGTTGAGTCCACTTGGCTTTC; B2MG Forward: TGCTGTCTCCATG TTTGATGTATCT; B2MG Reverse: TCTCTGCTCCCCACCTCTAAGT; PPARγ Forward: GGCTTCATGACAAGGGAGTTTC; PPARγ Reverse: AACTCAAACTTG GGCTCCATAAAG; C/EBP-α Forward: CTTGTGCCTTGGAAATGCAA; C/EBP-α Reverse: GCTGTAGCCTCGGGAAGGA; RUNX2 Forward: TTACCTACACCC CGCCAGTC; RUNX2 Reverse: TGCTGGTCTGGAAGGGTCC; ALP Forward: ATGGGATGGGTGTCTCCACA; ALP Reverse: CCACGAAGGGGAACTTGTC; AGGRECAN Forward: CGAAACATCACTGAGGGTGAAG; AGGRECAN Reverse: GTGGCCTCTCCAGTCTCATTCT; SOX9 Forward: TTTCCAAGACACAAACATGA; SOX9 Reverse: AAAGTCCAGTTTCTCGTTGA.
Statistical analysisPaired-wise comparisons for gene expression levels, sphere formation, colony formation and migration and invasion capacities were carried out using a two-tailed t test.
Results
The senescent microenvironment uncovers the tumorigenic potential of post-crisis HEK cells
T-CIN post-crisis HEK cells derived from the ER-SV40 clone HA1 were obtained after spontaneous reactivation of telomerase in
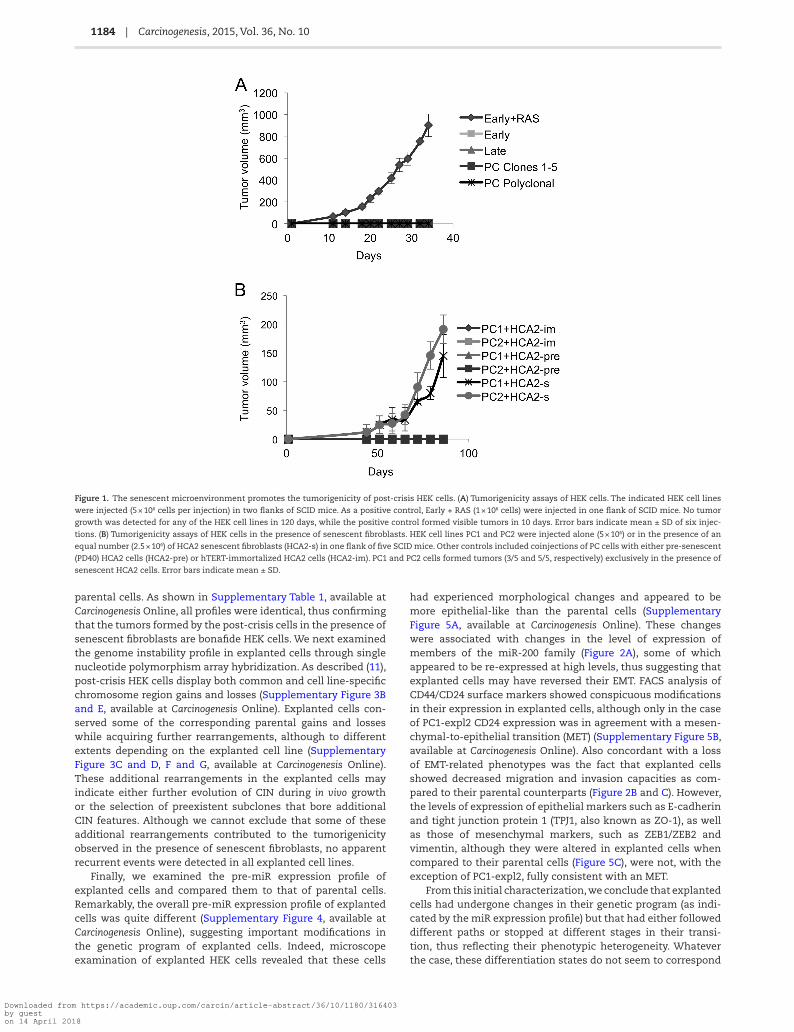
several independent experiments and have been previously char-acterized regarding genome instability, gene expression includ-ing microRNAs and phenotypical traits (11) (Supplementary Figure 1A and B, available at Carcinogenesis Online). Since post-crisis HEK cells display several attributes generally associated with tumorigenesis such as immortality, altered differentia-tion program and enhanced migration/invasive capacity (11), we tested whether these cells had any tumorigenic potential by injecting them subcutaneously into immunocompromised mice. We also tested post-crisis HEK cells derived from ER-SV40 polyclonal populations that were immortalized by the exog-enous expression of telomerase, introduced before (Early, CIN−) or after (Late, CIN+) the initiation of telomere instability. Unless otherwise indicated, ‘Early’ and ‘Late’ were derived from the ER-SV40 HA5 clone. As a positive control of tumorigenicity, Early cells were transfected with a construct driving the expression of an oncogenic form of RAS (Supplementary Figure 1C, available at Carcinogenesis Online), as described (22). While RAS-transformed cells rapidly formed tumors when 5 × 10⁶ cells were injected sub-cutaneously in nude or SCID mice, we did not observe any tumor formation with any of the other tested HEK cells even when monitored for a period of 12 months (Figure 1A). In agreement with this apparent lack of tumorigenicity, all cell lines, with the exception of the RAS-transformed positive control, also failed to form colonies in semisolid media (Supplementary Figure 1D, available at Carcinogenesis Online).
Taking into account the published evidence on the impact of the senescent microenvironment on tumorigenicity (14,15,18), we coinjected post-crisis EMT+ HEK cells subcutaneously with an equivalent number of senescent fibroblasts (HCA2-s, Supplementary Figure 2A and B, available sat Carcinogenesis Online) into SCID mice. In two independent experiments, the same two (out of five) post-crisis HEK cell lines formed tumors after a latency period of over 3 months (Supplementary Figure 2C and D, available at Carcinogenesis Online), indicating that these two particular post-crisis cell lines, PC1 and PC2, had tumorigenic potential, albeit only manifested in the presence of a senescent microenvironment. To ascertain that the senes-cent state on HCA2 cells was crucial in the induction of tumo-rigenicity, we carried out experiments where PC1 and PC2 were coinjected with pre-senescent (PD40) HCA2 fibroblasts as well as with HCA2 fibroblasts that had been immortalized with hTERT. As shown in Figure 1B, only the presence of senescent fibro-blasts allowed the formation of tumors by PC1 and PC2. Thus, a senescent microenvironment promotes the tumorigenicity of post-crisis HEK cells. Of note, the same post-crisis cells did not form tumors when injected (alone) subcutaneously into irradi-ated mice carrying very short telomeres (terc−/−, G3) (data not shown), suggesting the existence of key differences between human and mouse senescent microenvironments.
Cells explanted from tumors have undergone transdifferentiation
We have previously shown that PC1 and PC2 cells have under-gone a miR-200-dependent EMT as a consequence of T-CIN (11). In order to examine the characteristics of cells that formed tumors, we established four cell lines, two from PC1-derived tumors (PC1-expl1 and -expl2) and two from PC2-derived tumors (PC2-expl1 and -expl2) (Supplementary Figure 3A, avail-able at Carcinogenesis Online). Of note, the PC2-expl2 cell line was lost in the course of the first passages and therefore material from this cell line was only available for some of the following analyses. To ascertain the origin of explanted cell lines, we com-pared their short tandem repeat allelic profile to the one in the
Downloaded from https://academic.oup.com/carcin/article-abstract/36/10/1180/316403by gueston 14 April 2018
1184 | Carcinogenesis, 2015, Vol. 36, No. 10
parental cells. As shown in Supplementary Table 1, available at Carcinogenesis Online, all profiles were identical, thus confirming that the tumors formed by the post-crisis cells in the presence of senescent fibroblasts are bonafide HEK cells. We next examined the genome instability profile in explanted cells through single nucleotide polymorphism array hybridization. As described (11), post-crisis HEK cells display both common and cell line-specific chromosome region gains and losses (Supplementary Figure 3B and E, available at Carcinogenesis Online). Explanted cells con-served some of the corresponding parental gains and losses while acquiring further rearrangements, although to different extents depending on the explanted cell line (Supplementary Figure 3C and D, F and G, available at Carcinogenesis Online). These additional rearrangements in the explanted cells may indicate either further evolution of CIN during in vivo growth or the selection of preexistent subclones that bore additional CIN features. Although we cannot exclude that some of these additional rearrangements contributed to the tumorigenicity observed in the presence of senescent fibroblasts, no apparent recurrent events were detected in all explanted cell lines.
Finally, we examined the pre-miR expression profile of explanted cells and compared them to that of parental cells. Remarkably, the overall pre-miR expression profile of explanted cells was quite different (Supplementary Figure 4, available at Carcinogenesis Online), suggesting important modifications in the genetic program of explanted cells. Indeed, microscope examination of explanted HEK cells revealed that these cells
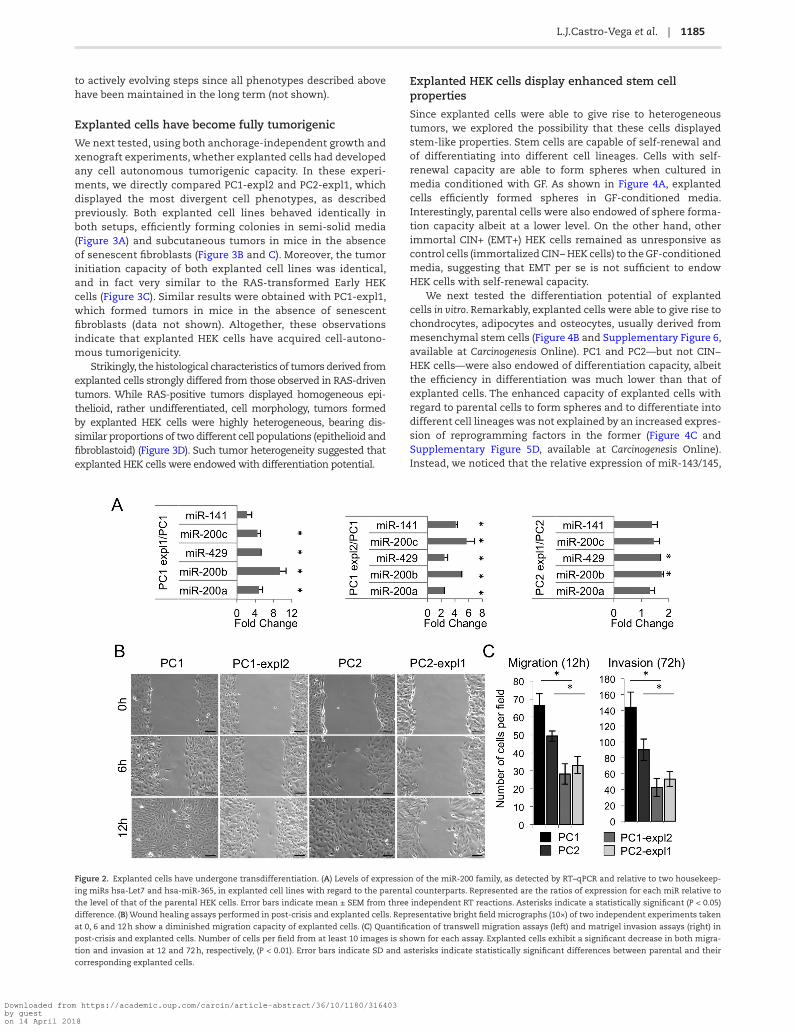
had experienced morphological changes and appeared to be more epithelial-like than the parental cells (Supplementary Figure 5A, available at Carcinogenesis Online). These changes were associated with changes in the level of expression of members of the miR-200 family (Figure 2A), some of which appeared to be re-expressed at high levels, thus suggesting that explanted cells may have reversed their EMT. FACS analysis of CD44/CD24 surface markers showed conspicuous modifications in their expression in explanted cells, although only in the case of PC1-expl2 CD24 expression was in agreement with a mesen-chymal-to-epithelial transition (MET) (Supplementary Figure 5B, available at Carcinogenesis Online). Also concordant with a loss of EMT-related phenotypes was the fact that explanted cells showed decreased migration and invasion capacities as com-pared to their parental counterparts (Figure 2B and C). However, the levels of expression of epithelial markers such as E-cadherin and tight junction protein 1 (TPJ1, also known as ZO-1), as well as those of mesenchymal markers, such as ZEB1/ZEB2 and vimentin, although they were altered in explanted cells when compared to their parental cells (Figure 5C), were not, with the exception of PC1-expl2, fully consistent with an MET.
From this initial characterization, we conclude that explanted cells had undergone changes in their genetic program (as indi-cated by the miR expression profile) but that had either followed different paths or stopped at different stages in their transi-tion, thus reflecting their phenotypic heterogeneity. Whatever the case, these differentiation states do not seem to correspond
Figure 1. The senescent microenvironment promotes the tumorigenicity of post-crisis HEK cells. (A) Tumorigenicity assays of HEK cells. The indicated HEK cell lines
were injected (5 × 10⁶ cells per injection) in two flanks of SCID mice. As a positive control, Early + RAS (1 × 10⁶ cells) were injected in one flank of SCID mice. No tumor
growth was detected for any of the HEK cell lines in 120 days, while the positive control formed visible tumors in 10 days. Error bars indicate mean ± SD of six injec-
tions. (B) Tumorigenicity assays of HEK cells in the presence of senescent fibroblasts. HEK cell lines PC1 and PC2 were injected alone (5 × 10⁶) or in the presence of an
equal number (2.5 × 10⁶) of HCA2 senescent fibroblasts (HCA2-s) in one flank of five SCID mice. Other controls included coinjections of PC cells with either pre-senescent
(PD40) HCA2 cells (HCA2-pre) or hTERT-immortalized HCA2 cells (HCA2-im). PC1 and PC2 cells formed tumors (3/5 and 5/5, respectively) exclusively in the presence of
senescent HCA2 cells. Error bars indicate mean ± SD.
Downloaded from https://academic.oup.com/carcin/article-abstract/36/10/1180/316403by gueston 14 April 2018
L.J.Castro-Vega et al. | 1185
to actively evolving steps since all phenotypes described above have been maintained in the long term (not shown).
Explanted cells have become fully tumorigenic
We next tested, using both anchorage-independent growth and xenograft experiments, whether explanted cells had developed any cell autonomous tumorigenic capacity. In these experi-ments, we directly compared PC1-expl2 and PC2-expl1, which displayed the most divergent cell phenotypes, as described previously. Both explanted cell lines behaved identically in both setups, efficiently forming colonies in semi-solid media (Figure 3A) and subcutaneous tumors in mice in the absence of senescent fibroblasts (Figure 3B and C). Moreover, the tumor initiation capacity of both explanted cell lines was identical, and in fact very similar to the RAS-transformed Early HEK cells (Figure 3C). Similar results were obtained with PC1-expl1, which formed tumors in mice in the absence of senescent fibroblasts (data not shown). Altogether, these observations indicate that explanted HEK cells have acquired cell-autono-mous tumorigenicity.
Strikingly, the histological characteristics of tumors derived from explanted cells strongly differed from those observed in RAS-driven tumors. While RAS-positive tumors displayed homogeneous epi-thelioid, rather undifferentiated, cell morphology, tumors formed by explanted HEK cells were highly heterogeneous, bearing dis-similar proportions of two different cell populations (epithelioid and fibroblastoid) (Figure 3D). Such tumor heterogeneity suggested that explanted HEK cells were endowed with differentiation potential.
Explanted HEK cells display enhanced stem cell properties
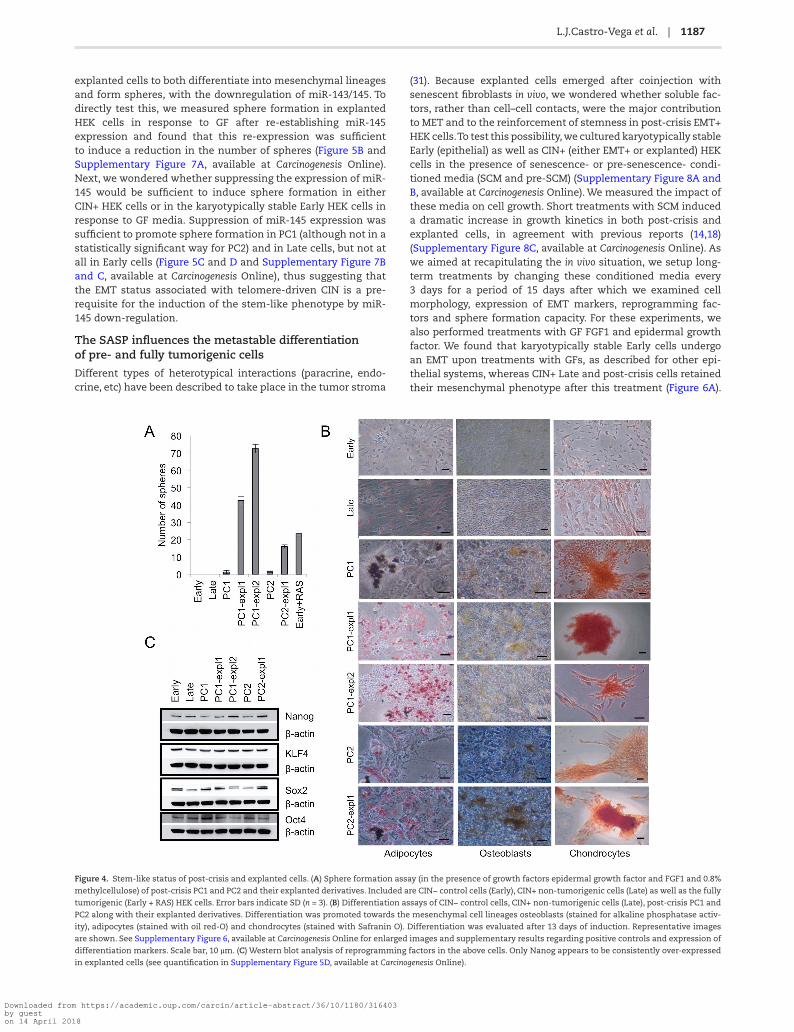
Since explanted cells were able to give rise to heterogeneous tumors, we explored the possibility that these cells displayed stem-like properties. Stem cells are capable of self-renewal and of differentiating into different cell lineages. Cells with self-renewal capacity are able to form spheres when cultured in media conditioned with GF. As shown in Figure 4A, explanted cells efficiently formed spheres in GF-conditioned media. Interestingly, parental cells were also endowed of sphere forma-tion capacity albeit at a lower level. On the other hand, other immortal CIN+ (EMT+) HEK cells remained as unresponsive as control cells (immortalized CIN− HEK cells) to the GF-conditioned media, suggesting that EMT per se is not sufficient to endow HEK cells with self-renewal capacity.
We next tested the differentiation potential of explanted cells in vitro. Remarkably, explanted cells were able to give rise to chondrocytes, adipocytes and osteocytes, usually derived from mesenchymal stem cells (Figure 4B and Supplementary Figure 6, available at Carcinogenesis Online). PC1 and PC2—but not CIN− HEK cells—were also endowed of differentiation capacity, albeit the efficiency in differentiation was much lower than that of explanted cells. The enhanced capacity of explanted cells with regard to parental cells to form spheres and to differentiate into different cell lineages was not explained by an increased expres-sion of reprogramming factors in the former (Figure 4C and Supplementary Figure 5D, available at Carcinogenesis Online). Instead, we noticed that the relative expression of miR-143/145,
Figure 2. Explanted cells have undergone transdifferentiation. (A) Levels of expression of the miR-200 family, as detected by RT–qPCR and relative to two housekeep-
ing miRs hsa-Let7 and hsa-miR-365, in explanted cell lines with regard to the parental counterparts. Represented are the ratios of expression for each miR relative to
the level of that of the parental HEK cells. Error bars indicate mean ± SEM from three independent RT reactions. Asterisks indicate a statistically significant (P < 0.05)
difference. (B) Wound healing assays performed in post-crisis and explanted cells. Representative bright field micrographs (10×) of two independent experiments taken
at 0, 6 and 12 h show a diminished migration capacity of explanted cells. (C) Quantification of transwell migration assays (left) and matrigel invasion assays (right) in
post-crisis and explanted cells. Number of cells per field from at least 10 images is shown for each assay. Explanted cells exhibit a significant decrease in both migra-
tion and invasion at 12 and 72 h, respectively, (P < 0.01). Error bars indicate SD and asterisks indicate statistically significant differences between parental and their
corresponding explanted cells.
Downloaded from https://academic.oup.com/carcin/article-abstract/36/10/1180/316403by gueston 14 April 2018

1186 | Carcinogenesis, 2015, Vol. 36, No. 10
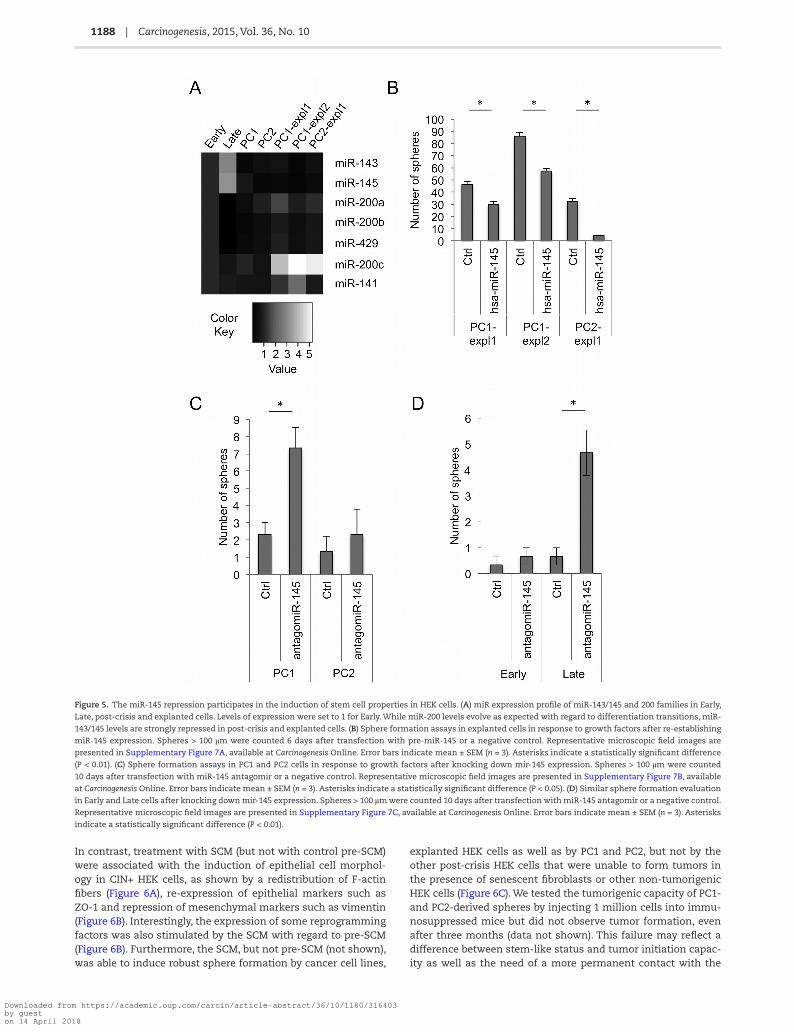
which targets these reprogramming factors and has been pro-posed to control the stem cell properties in some types of cancer cells (29,30), was highly repressed in post-crisis and explanted
cells when compared with EMT+, CIN+ HEK cells, which were unable to form spheres and to differentiate (Figure 5A). This observation suggested a connection between the capacity of
Figure 3. Explanted cells are highly tumorigenic. (A) Agar colony formation assay showing high colony formation capacity of explanted cells PC1-expl1 and PC2-expl1
similar to the positive control Early + RAS. Error bars indicate SD (n = 6). (B) Tumorigenicity assays of same cell lines as in A. Curves represent tumor growth in SCID
mice following the injection of 1 × 10⁶ cells into one mouse flank. Error bars indicate mean ± SD (n = 6). (C) Tumorigenicity assay as in B using decreasing number of cells
for injections. The tumor initiation capacity was even higher in explanted cells when 1 × 10³ cells were injected (n = 4). (D) Histopathology analyses of tumors formed
by Early + RAS and explanted cells. Hematoxylin and eosin stain (H&E) shows the morphological aspect. Immunostaining for the epithelial markers pancytokeratins
and E-cadherin as well as the mesenchymal marker alpha smooth muscle actin (SMA), were performed using specific antibodies to detect the human proteins. White
arrows point to the fibroblastoid cells. Scale bars, 200 µm for SMA, 20 µm for all other stainings.
Downloaded from https://academic.oup.com/carcin/article-abstract/36/10/1180/316403by gueston 14 April 2018
L.J.Castro-Vega et al. | 1187
explanted cells to both differentiate into mesenchymal lineages and form spheres, with the downregulation of miR-143/145. To directly test this, we measured sphere formation in explanted HEK cells in response to GF after re-establishing miR-145 expression and found that this re-expression was sufficient to induce a reduction in the number of spheres (Figure 5B and Supplementary Figure 7A, available at Carcinogenesis Online). Next, we wondered whether suppressing the expression of miR-145 would be sufficient to induce sphere formation in either CIN+ HEK cells or in the karyotypically stable Early HEK cells in response to GF media. Suppression of miR-145 expression was sufficient to promote sphere formation in PC1 (although not in a statistically significant way for PC2) and in Late cells, but not at all in Early cells (Figure 5C and D and Supplementary Figure 7B and C, available at Carcinogenesis Online), thus suggesting that the EMT status associated with telomere-driven CIN is a pre-requisite for the induction of the stem-like phenotype by miR-145 down-regulation.
The SASP influences the metastable differentiation of pre- and fully tumorigenic cells
Different types of heterotypical interactions (paracrine, endo-crine, etc) have been described to take place in the tumor stroma
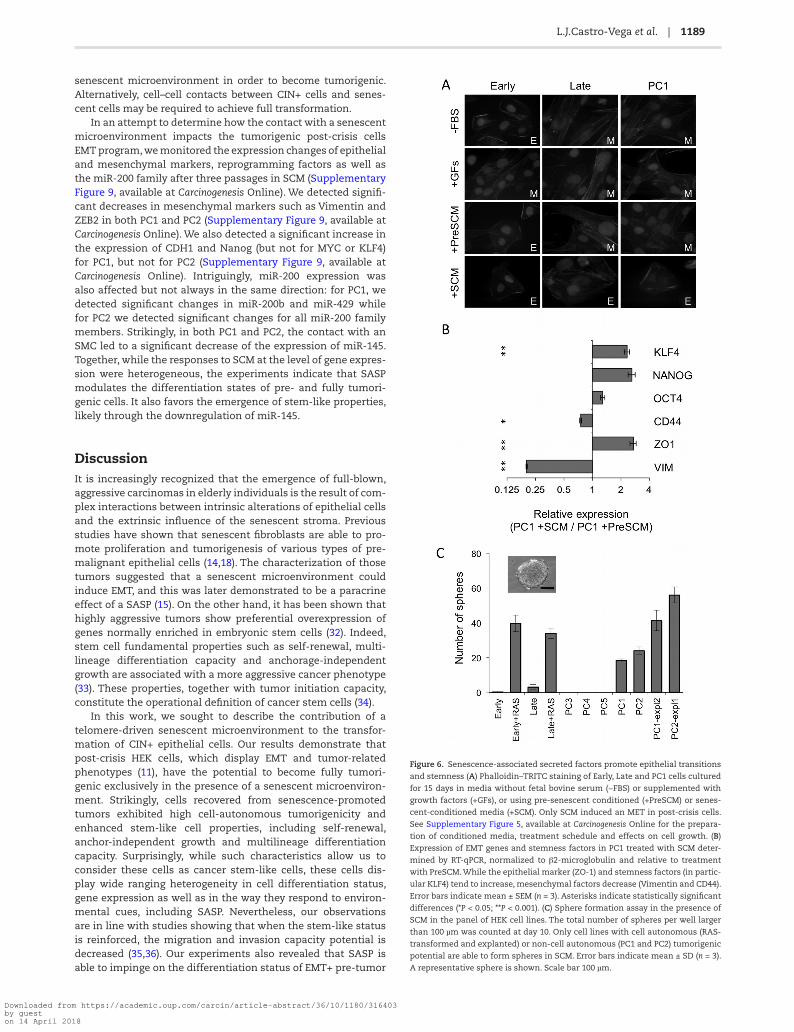
(31). Because explanted cells emerged after coinjection with senescent fibroblasts in vivo, we wondered whether soluble fac-tors, rather than cell–cell contacts, were the major contribution to MET and to the reinforcement of stemness in post-crisis EMT+ HEK cells. To test this possibility, we cultured karyotypically stable Early (epithelial) as well as CIN+ (either EMT+ or explanted) HEK cells in the presence of senescence- or pre-senescence- condi-tioned media (SCM and pre-SCM) (Supplementary Figure 8A and B, available at Carcinogenesis Online). We measured the impact of these media on cell growth. Short treatments with SCM induced a dramatic increase in growth kinetics in both post-crisis and explanted cells, in agreement with previous reports (14,18) (Supplementary Figure 8C, available at Carcinogenesis Online). As we aimed at recapitulating the in vivo situation, we setup long-term treatments by changing these conditioned media every 3 days for a period of 15 days after which we examined cell morphology, expression of EMT markers, reprogramming fac-tors and sphere formation capacity. For these experiments, we also performed treatments with GF FGF1 and epidermal growth factor. We found that karyotypically stable Early cells undergo an EMT upon treatments with GFs, as described for other epi-thelial systems, whereas CIN+ Late and post-crisis cells retained their mesenchymal phenotype after this treatment (Figure 6A).
Figure 4. Stem-like status of post-crisis and explanted cells. (A) Sphere formation assay (in the presence of growth factors epidermal growth factor and FGF1 and 0.8%
methylcellulose) of post-crisis PC1 and PC2 and their explanted derivatives. Included are CIN− control cells (Early), CIN+ non-tumorigenic cells (Late) as well as the fully
tumorigenic (Early + RAS) HEK cells. Error bars indicate SD (n = 3). (B) Differentiation assays of CIN− control cells, CIN+ non-tumorigenic cells (Late), post-crisis PC1 and
PC2 along with their explanted derivatives. Differentiation was promoted towards the mesenchymal cell lineages osteoblasts (stained for alkaline phosphatase activ-
ity), adipocytes (stained with oil red-O) and chondrocytes (stained with Safranin O). Differentiation was evaluated after 13 days of induction. Representative images
are shown. See Supplementary Figure 6, available at Carcinogenesis Online for enlarged images and supplementary results regarding positive controls and expression of
differentiation markers. Scale bar, 10 µm. (C) Western blot analysis of reprogramming factors in the above cells. Only Nanog appears to be consistently over-expressed
in explanted cells (see quantification in Supplementary Figure 5D, available at Carcinogenesis Online).
Downloaded from https://academic.oup.com/carcin/article-abstract/36/10/1180/316403by gueston 14 April 2018
1188 | Carcinogenesis, 2015, Vol. 36, No. 10
In contrast, treatment with SCM (but not with control pre-SCM) were associated with the induction of epithelial cell morphol-ogy in CIN+ HEK cells, as shown by a redistribution of F-actin fibers (Figure 6A), re-expression of epithelial markers such as ZO-1 and repression of mesenchymal markers such as vimentin (Figure 6B). Interestingly, the expression of some reprogramming factors was also stimulated by the SCM with regard to pre-SCM (Figure 6B). Furthermore, the SCM, but not pre-SCM (not shown), was able to induce robust sphere formation by cancer cell lines,
explanted HEK cells as well as by PC1 and PC2, but not by the other post-crisis HEK cells that were unable to form tumors in the presence of senescent fibroblasts or other non-tumorigenic HEK cells (Figure 6C). We tested the tumorigenic capacity of PC1- and PC2-derived spheres by injecting 1 million cells into immu-nosuppressed mice but did not observe tumor formation, even after three months (data not shown). This failure may reflect a difference between stem-like status and tumor initiation capac-ity as well as the need of a more permanent contact with the
Figure 5. The miR-145 repression participates in the induction of stem cell properties in HEK cells. (A) miR expression profile of miR-143/145 and 200 families in Early,
Late, post-crisis and explanted cells. Levels of expression were set to 1 for Early. While miR-200 levels evolve as expected with regard to differentiation transitions, miR-
143/145 levels are strongly repressed in post-crisis and explanted cells. (B) Sphere formation assays in explanted cells in response to growth factors after re-establishing
miR-145 expression. Spheres > 100 µm were counted 6 days after transfection with pre-miR-145 or a negative control. Representative microscopic field images are
presented in Supplementary Figure 7A, available at Carcinogenesis Online. Error bars indicate mean ± SEM (n = 3). Asterisks indicate a statistically significant difference
(P < 0.01). (C) Sphere formation assays in PC1 and PC2 cells in response to growth factors after knocking down mir-145 expression. Spheres > 100 µm were counted
10 days after transfection with miR-145 antagomir or a negative control. Representative microscopic field images are presented in Supplementary Figure 7B, available
at Carcinogenesis Online. Error bars indicate mean ± SEM (n = 3). Asterisks indicate a statistically significant difference (P < 0.05). (D) Similar sphere formation evaluation
in Early and Late cells after knocking down mir-145 expression. Spheres > 100 µm were counted 10 days after transfection with miR-145 antagomir or a negative control.
Representative microscopic field images are presented in Supplementary Figure 7C, available at Carcinogenesis Online. Error bars indicate mean ± SEM (n = 3). Asterisks
indicate a statistically significant difference (P < 0.01).
Downloaded from https://academic.oup.com/carcin/article-abstract/36/10/1180/316403by gueston 14 April 2018
L.J.Castro-Vega et al. | 1189
senescent microenvironment in order to become tumorigenic. Alternatively, cell–cell contacts between CIN+ cells and senes-cent cells may be required to achieve full transformation.
In an attempt to determine how the contact with a senescent microenvironment impacts the tumorigenic post-crisis cells EMT program, we monitored the expression changes of epithelial and mesenchymal markers, reprogramming factors as well as the miR-200 family after three passages in SCM (Supplementary Figure 9, available at Carcinogenesis Online). We detected signifi-cant decreases in mesenchymal markers such as Vimentin and ZEB2 in both PC1 and PC2 (Supplementary Figure 9, available at Carcinogenesis Online). We also detected a significant increase in the expression of CDH1 and Nanog (but not for MYC or KLF4) for PC1, but not for PC2 (Supplementary Figure 9, available at Carcinogenesis Online). Intriguingly, miR-200 expression was also affected but not always in the same direction: for PC1, we detected significant changes in miR-200b and miR-429 while for PC2 we detected significant changes for all miR-200 family members. Strikingly, in both PC1 and PC2, the contact with an SMC led to a significant decrease of the expression of miR-145. Together, while the responses to SCM at the level of gene expres-sion were heterogeneous, the experiments indicate that SASP modulates the differentiation states of pre- and fully tumori-genic cells. It also favors the emergence of stem-like properties, likely through the downregulation of miR-145.
DiscussionIt is increasingly recognized that the emergence of full-blown, aggressive carcinomas in elderly individuals is the result of com-plex interactions between intrinsic alterations of epithelial cells and the extrinsic influence of the senescent stroma. Previous studies have shown that senescent fibroblasts are able to pro-mote proliferation and tumorigenesis of various types of pre-malignant epithelial cells (14,18). The characterization of those tumors suggested that a senescent microenvironment could induce EMT, and this was later demonstrated to be a paracrine effect of a SASP (15). On the other hand, it has been shown that highly aggressive tumors show preferential overexpression of genes normally enriched in embryonic stem cells (32). Indeed, stem cell fundamental properties such as self-renewal, multi-lineage differentiation capacity and anchorage-independent growth are associated with a more aggressive cancer phenotype (33). These properties, together with tumor initiation capacity, constitute the operational definition of cancer stem cells (34).
In this work, we sought to describe the contribution of a telomere-driven senescent microenvironment to the transfor-mation of CIN+ epithelial cells. Our results demonstrate that post-crisis HEK cells, which display EMT and tumor-related phenotypes (11), have the potential to become fully tumori-genic exclusively in the presence of a senescent microenviron-ment. Strikingly, cells recovered from senescence-promoted tumors exhibited high cell-autonomous tumorigenicity and enhanced stem-like cell properties, including self-renewal, anchor-independent growth and multilineage differentiation capacity. Surprisingly, while such characteristics allow us to consider these cells as cancer stem-like cells, these cells dis-play wide ranging heterogeneity in cell differentiation status, gene expression as well as in the way they respond to environ-mental cues, including SASP. Nevertheless, our observations are in line with studies showing that when the stem-like status is reinforced, the migration and invasion capacity potential is decreased (35,36). Our experiments also revealed that SASP is able to impinge on the differentiation status of EMT+ pre-tumor
Figure 6. Senescence-associated secreted factors promote epithelial transitions
and stemness (A) Phalloidin–TRITC staining of Early, Late and PC1 cells cultured
for 15 days in media without fetal bovine serum (−FBS) or supplemented with
growth factors (+GFs), or using pre-senescent conditioned (+PreSCM) or senes-
cent-conditioned media (+SCM). Only SCM induced an MET in post-crisis cells.
See Supplementary Figure 5, available at Carcinogenesis Online for the prepara-
tion of conditioned media, treatment schedule and effects on cell growth. (B)
Expression of EMT genes and stemness factors in PC1 treated with SCM deter-
mined by RT-qPCR, normalized to β2-microglobulin and relative to treatment
with PreSCM. While the epithelial marker (ZO-1) and stemness factors (in partic-
ular KLF4) tend to increase, mesenchymal factors decrease (Vimentin and CD44).
Error bars indicate mean ± SEM (n = 3). Asterisks indicate statistically significant
differences (*P < 0.05; **P < 0.001). (C) Sphere formation assay in the presence of
SCM in the panel of HEK cell lines. The total number of spheres per well larger
than 100 µm was counted at day 10. Only cell lines with cell autonomous (RAS-
transformed and explanted) or non-cell autonomous (PC1 and PC2) tumorigenic
potential are able to form spheres in SCM. Error bars indicate mean ± SD (n = 3).
A representative sphere is shown. Scale bar 100 µm.
Downloaded from https://academic.oup.com/carcin/article-abstract/36/10/1180/316403by gueston 14 April 2018
1190 | Carcinogenesis, 2015, Vol. 36, No. 10
or cancer cells. Moreover, SASP treatments uncovered stem-like properties only in CIN+ HEK cells with tumorigenic potential and not in CIN+ HEK cells unable to form tumors even in the presence of a senescent microenvironment. However, it remains to be shown whether SASP is sufficient to promote tumorigenic-ity since SCM-induced spheres from CIN+ HEK cells did not form tumors (not shown), suggesting that cell–cell contacts may also be required in this particular context.
The transformation model of HEK cells that combines, step-by-step, p53/Rb inactivation, telomere-driven CIN, spontane-ous immortalization and the senescent microenvironment, allowed us to produce cells bearing all the characteristics that define cancer stem cells (Supplementary Figure 10, available at Carcinogenesis Online). At least two hypotheses explaining the emergence of cancer stem cells have been proposed. The first one states that normal stem cells are the targets of transforming changes (mutations or epigenetic modifications) that produce tumor-initiating cells. The second, perhaps less accepted, sug-gests that when somatic terminally differentiated cells become tumorigenic, they are somehow dedifferentiated and endowed of a more restrictive multipotentiality (34,37). During this pro-cess, differentiation state transitions are proposed to fuel the acquisition of malignant and stem-like characteristics by trans-formed cells (38,39), through mechanisms that are comparable to those intervening in the generation of induced pluripotent stem cells (iPS cells), in particular the over-expression of the miR-200 family (more specifically miR-200c) (40–42), an event also present during the conversion of EMT+ HEK cells into stem-like cells.
On the other hand, and up to now, the relative contributions of the transforming events mentioned above in the making of cancer stem cells have remained elusive. We and others have shown that telomere dysfunction leads to a major perturba-tion in the cell differentiation program (11,43,44). We now show that although telomere-driven CIN is sufficient to induce EMT through perturbations in miR-200 expression (11), exposure to a senescent microenvironment is required for these cells to form tumors and to further engage in the process that leads to the acquisition of stem cell characteristics. Our data suggest that in this process, the progressive suppression of miR-145, which is initiated in response to CIN (11) and reinforced by the exposure to the senescent microenvironment (this article), plays an impor-tant role in the road to stemness of cancer cells. Interestingly, the low expression of miR-145 is associated with poor progno-sis in several types of epithelial cancers (45–47) and has been suggested to control the emergence of cancer stem-like cells in prostate and lung cancers (30,48). That suppression of miR-145 was not enough to induce sphere formation capacity in CIN-HEK cells indicates that other phenomena associated with CIN, such as EMT, are critical in the process. The stochasticity of genetic and epigenetic processes associated with CIN, independently of the immortalization process itself, is underlined by both the fact that only two out of five post-crisis HEK cells were able to consistently form tumors in a senescent microenvironment but also by the wide heterogeneity of explanted cells. These pro-cesses do confer some degree of metastability to premalignant cells, as demonstrated by the limited but ascertained capacity of the post-crisis cells to form spheres in senescence-conditioned media and to differentiate into mesenchymal lineages. Thus, it is tempting to speculate that during the process of in vivo car-cinogenesis, CIN+/EMT+ cells bearing stem-like characteristics will be favored when in the presence of the senescent micro-environment and that this process is more likely to occur with increasing age.
Thus, our observations may help to explain the long-stand-ing link between aging and the incidence of aggressive carci-nomas. Taking into consideration that the metastatic capacity is most likely determined at earlier stages of tumorigenesis (49,50), our results may be relevant to the situation in vivo since the transformation model of HEK cells fits the parallel progres-sion model of primary tumors (51). Following this model, the telomere-driven crisis in early pre-malignant lesions would lead to the activation of the EMT program, producing cells that, in the absence of external cues, do not survive or potentially stay into a dormant state in tissues or eventually reach the circula-tion, as suggested by the fact that circulating tumor cells display this EMT-like phenotype (52). With aging, the senescent micro-environment promotes either reactivation of dormant premalig-nant cells at the site of tumor initiation or the progression into the stemness state of newly produced EMT+ cells, thus favor-ing tumor growth with extension to neighboring tissues or the dissemination of cells to distant sites where colonization (MET) may occur with production of macroscopic metastases (53). Further interconversions may be expected to occur in locally advanced tumors and overt metastases, as illustrated by the capacity of SASP to modulate these phenotypes in fully malig-nant cells. It has been proposed that this phenotypic plasticity is a prominent characteristic of metastatic cells and that adapta-tion rather than mutation/selection is at play in a continuously evolving process (54,55).
In conclusion, our results give further support to the idea that failure of telomere maintenance mechanisms in prema-lignant epithelial cells (56), on one hand, and telomere-driven senescence in the associated stromal cells, on the other (57), both contribute to the high incidence of aggressive carcinomas with advancing age. These observations may help to explain the delay between the emergence of primary tumors and advanced disease as well as the absence of new driving mutations in metastases (58,59). They also illustrate the way a high degree of genetic and non-genetic (phenotypic) heterogeneity, which characterizes most human epithelial tumors, may have a com-mon origin (60,61). Further investigations will be required to dis-sect the underlying mechanisms that directly command these complex processes.
Supplementary materialSupplementary Tables 1 and 2 and Figures 1–10 can be found at http://carcin.oxfordjournals.org/
FundingL.J.C.V. was the recipient of ALBAN (E06D103001CO) and FRM (FDT20090916974) PhD fellowships. K.J. is a recipient of a French Ministry of Research PhD fellowship. Work in the ‘Telomere and Cancer’ laboratory was supported by the INCa PAIR-Prostate program, the Ligue National Contra le Cancer (programme Labellisation), L’Association contre la recherche contre le Cancer (ARC) and the ECOS-Nord program of the French Foreign Affaires Ministry (Action ECOS n°: C12S01). Work in the Cellular and Molecular Physiology Group of Universidad Nacional was supported by the Patrimonio Autonomo Fondo Nacional de Financiamiento para la Ciencia, la Tecnologia y la Innovacion, Francisco José de Caldas (contract RC-692–2013).
AcknowledgementsL.J.C.V., J.P.V. and A.L.V. conceived and designed the study. L.J.C.V., P.O.M., K.J., W.Y.L. and J.L.G. carried out the experiments.
Downloaded from https://academic.oup.com/carcin/article-abstract/36/10/1180/316403by gueston 14 April 2018
L.J.Castro-Vega et al. | 1191
M.R. performed the histopathological analysis. T.P. carried out the GAP analyses. S.B. contributed with reagents and materials. J.P.V. and A.L.V. supervised the study. All the authors analyzed and interpreted the results. L.J.C.V., J.P.V. and A.L.V. wrote the article.Conflict of Interest Statement: None declared.
References 1. Armitage, P. et al. (1954) The age distribution of cancer and a multi-
stage theory of carcinogenesis. Br. J. Cancer, 8, 1–12. 2. Campisi, J. (2013) Aging, cellular senescence, and cancer. Annu. Rev.
Physiol., 75, 685–705. 3. Harley, C.B. et al. (1990) Telomeres shorten during ageing of human
fibroblasts. Nature, 345, 458–460. 4. Frenck, R.W. et al. (1998) The rate of telomere sequence loss in human
leukocytes varies with age. Proc Natl Acad Sci USA, 95, 5607–5610. 5. DePinho, R.A. (2000) The age of cancer. Nature, 408, 248–254. 6. Willeit, P. et al. (2010) Telomere length and risk of incident cancer and
cancer mortality. JAMA, 304, 69–75. 7. Chin, K. et al. (2004) In situ analyses of genome instability in breast
cancer. Nat. Genet., 36, 984–988. 8. Meeker, A.K. et al. (2002) Telomere shortening is an early somatic DNA
alteration in human prostate tumorigenesis. Cancer Res., 62, 6405–6409. 9. van Heek, N.T. et al. (2002) Telomere shortening is nearly universal in
pancreatic intraepithelial neoplasia. Am. J. Pathol., 161, 1541–1547. 10. Ding, Z. et al. (2012) Telomerase reactivation following telomere dys-
function yields murine prostate tumors with bone metastases. Cell, 148, 896–907.
11. Castro-Vega, L.J. et al. (2013) Telomere crisis in kidney epithelial cells promotes the acquisition of a microRNA signature retrieved in aggres-sive renal cell carcinomas. Carcinogenesis, 34, 1173–1180.
12. Velarde, M.C. et al. (2013) Senescent cells and their secretory pheno-type as targets for cancer therapy. Interdiscip. Top Gerontol., 38, 17–27.
13. Coppe, J.P. et al. (2010) The senescence-associated secretory phenotype: the dark side of tumor suppression. Annu. Rev. Pathol., 5, 99–118.
14. Krtolica, A. et al. (2001) Senescent fibroblasts promote epithelial cell growth and tumorigenesis: a link between cancer and aging. Proc. Natl. Acad. Sci. USA, 98, 12072–12077.
15. Parrinello, S. et al. (2005) Stromal-epithelial interactions in aging and cancer: senescent fibroblasts alter epithelial cell differentiation. J. Cell Sci., 118, 485–496.
16. Coppe, J.P. et al. (2008) Senescence-associated secretory phenotypes reveal cell-nonautonomous functions of oncogenic RAS and the p53 tumor suppressor. PLoS Biol., 6, 2853–2868.
17. Olumi, A.F. et al. (1999) Carcinoma-associated fibroblasts direct tumor progression of initiated human prostatic epithelium. Cancer Res., 59, 5002–5011.
18. Bavik, C. et al. (2006) The gene expression program of prostate fibro-blast senescence modulates neoplastic epithelial cell proliferation through paracrine mechanisms. Cancer Res., 66, 794–802.
19. Cahu, J. et al. (2012) Senescence-associated secretory phenotype favors the emergence of cancer stem-like cells. Cell Death Dis., 3, e446.
20. Stewart, N. et al. (1991) Expression of SV40 large T antigen, but not small t antigen, is required for the induction of chromosomal aberra-tions in transformed human cells. Virology, 180, 49–57.
21. der-Sarkissian, H. et al. (2004) The shortest telomeres drive karyotype evolution in transformed cells. Oncogene, 23, 1221–1228.
22. Hahn, W.C. et al. (1999) Creation of human tumour cells with defined genetic elements. Nature, 400, 464–468.
23. Schmittgen, T.D. et al. (2008) Analyzing real-time PCR data by the com-parative C(T) method. Nat. Protoc., 3, 1101–1108.
24. Farmer, S.R. (2006) Transcriptional control of adipocyte formation. Cell Metab., 4, 263–273.
25. Rosen, E.D. (2005) The transcriptional basis of adipocyte development. Prostaglandins Leukot. Essent. Fatty Acids, 73, 31–34.
26. Phillips, J.E. et al. (2006) Glucocorticoid-induced osteogenesis is negatively regulated by Runx2/Cbfa1 serine phosphorylation. J. Cell Sci., 119, 581–591.
27. Chen, W.H. et al. (2009) In vitro stage-specific chondrogenesis of mes-enchymal stem cells committed to chondrocytes. Arthritis Rheum., 60, 450–459.
28. Popova, T. et al. (2009) Genome Alteration Print (GAP): a tool to visual-ize and mine complex cancer genomic profiles obtained by SNP arrays. Genome Biol., 10, R128.
29. Xu, N. et al. (2009) MicroRNA-145 regulates OCT4, SOX2, and KLF4 and represses pluripotency in human embryonic stem cells. Cell, 137, 647–658.
30. Huang, S. et al. (2012) miR-143 and miR-145 inhibit stem cell character-istics of PC-3 prostate cancer cells. Oncol Rep., 28, 1831–1837.
31. Tlsty, T.D. et al. (2006) Tumor stroma and regulation of cancer develop-ment. Annu. Rev. Pathol., 1, 119–150.
32. Ben-Porath, I. et al. (2008) An embryonic stem cell-like gene expres-sion signature in poorly differentiated aggressive human tumors. Nat. Genet., 40, 499–507.
33. Chaffer, C.L. et al. (2011) A perspective on cancer cell metastasis. Sci-ence, 331, 1559–1564.
34. Gupta, P.B. et al. (2009) Cancer stem cells: mirage or reality? Nat. Med., 15, 1010–1012.
35. Tsuji, T. et al. (2008) Epithelial-mesenchymal transition induced by growth suppressor p12CDK2-AP1 promotes tumor cell local invasion but suppresses distant colony growth. Cancer Res., 68, 10377–10386.
36. Celia-Terrassa, T. et al. (2012) Epithelial-mesenchymal transition can suppress major attributes of human epithelial tumor-initiating cells. J. Clin. Invest., 122, 1849–1868.
37. Friedmann-Morvinski, D. et al. (2014) Dedifferentiation and reprogram-ming: origins of cancer stem cells. EMBO Rep., 15, 244–253.
38. Mani, S.A. et al. (2008) The epithelial-mesenchymal transition gener-ates cells with properties of stem cells. Cell, 133, 704–715.
39. Polyak, K. et al. (2009) Transitions between epithelial and mesenchymal states: acquisition of malignant and stem cell traits. Nat. Rev. Cancer, 9, 265–273.
40. Li, R. et al. (2010) A mesenchymal-to-epithelial transition initiates and is required for the nuclear reprogramming of mouse fibroblasts. Cell Stem Cell, 7, 51–63.
41. Samavarchi-Tehrani, P. et al. (2010) Functional genomics reveals a BMP-driven mesenchymal-to-epithelial transition in the initiation of somatic cell reprogramming. Cell Stem Cell, 7, 64–77.
42. Wang, G. et al. (2013) Critical regulation of miR-200/ZEB2 pathway in Oct4/Sox2-induced mesenchymal-to-epithelial transition and induced pluripotent stem cell generation. Proc. Natl. Acad. Sci. USA, 110, 2858–2863.
43. Pucci, F. et al. (2013) Short telomeres in ESCs lead to unstable differen-tiation. Cell Stem Cell, 12, 479–486.
44. Hirashima, K. et al. (2013) Telomere length influences cancer cell dif-ferentiation in vivo. Mol. Cell Biol., 33, 2988–2995.
45. Larne, O. et al. (2013) miQ--a novel microRNA based diagnostic and prognostic tool for prostate cancer. Int. J. Cancer, 132, 2867–2875.
46. Campayo, M. et al. (2013) Low miR-145 and high miR-367 are associated with unfavourable prognosis in resected nonsmall cell lung cancer. Eur. Respir. J., 41, 1172–1178.
47. Karakatsanis, A. et al. (2013) Expression of microRNAs, miR-21, miR-31, miR-122, miR-145, miR-146a, miR-200c, miR-221, miR-222, and miR-223 in patients with hepatocellular carcinoma or intrahepatic cholangiocarcinoma and its prognostic significance. Mol. Carcinog., 52, 297–303.
48. Yu, M. et al. (2013) Circulating breast tumor cells exhibit dynamic changes in epithelial and mesenchymal composition. Science, 339, 580–584.
49. Husemann, Y. et al. (2008) Systemic spread is an early step in breast cancer. Cancer Cell, 13, 58–68.
50. Rhim, A.D. et al. (2012) EMT and dissemination precede pancreatic tumor formation. Cell, 148, 349–361.
51. Klein, C.A. (2009) Parallel progression of primary tumours and metas-tases. Nat. Rev. Cancer, 9, 302–312.
52. Hu, J. et al. (2014) MiR-145 regulates cancer stem-like properties and epithelial-to-mesenchymal transition in lung adenocarcinoma-initiat-ing cells. Tumour Biol., 35, 8953–8961.
53. Giancotti, F.G. (2013) Mechanisms governing metastatic dormancy and reactivation. Cell, 155, 750–764.
54. Scheel, C. et al. (2007) Adaptation versus selection: the origins of meta-static behavior. Cancer Res., 67, 11476–11479.
Downloaded from https://academic.oup.com/carcin/article-abstract/36/10/1180/316403by gueston 14 April 2018
1192 | Carcinogenesis, 2015, Vol. 36, No. 10
55. Chaffer, C.L. et al. (2015) How does multistep tumorigenesis really pro-ceed? Cancer Discov., 5, 22–24.
56. Meeker, A.K. et al. (2004) Telomere length abnormalities occur early in the initiation of epithelial carcinogenesis. Clin. Cancer Res., 10, 3317–3326.
57. Heaphy, C.M. et al. (2013) Prostate cancer cell telomere length variabil-ity and stromal cell telomere length as prognostic markers for metas-tasis and death. Cancer Discov., 3, 1130–1141.
58. Bernards, R. et al. (2002) A progression puzzle. Nature, 418, 823. 59. Jones, S. et al. (2008) Comparative lesion sequencing provides insights
into tumor evolution. Proc. Natl. Acad. Sci. USA, 105, 4283–4288. 60. Kreso, A. et al. (2014) Evolution of the cancer stem cell model. Cell Stem
Cell, 14, 275–291. 61. Burrell, R.A. et al. (2013) The causes and consequences of genetic het-
erogeneity in cancer evolution. Nature, 501, 338–345.
Downloaded from https://academic.oup.com/carcin/article-abstract/36/10/1180/316403by gueston 14 April 2018