the select sector spdr trust - bankchb.com · important notice regarding change in investment...
TRANSCRIPT
Important Notice Regarding Change in Investment Policy
THE SELECT SECTOR SPDR® TRUST
The Consumer Discretionary Select Sector SPDR® Fund
The Consumer Staples Select Sector SPDR® Fund
The Energy Select Sector SPDR® Fund
The Financial Select Sector SPDR® Fund
The Health Care Select Sector SPDR® Fund
The Industrial Select Sector SPDR® Fund
The Materials Select Sector SPDR® Fund
The Real Estate Select Sector SPDR® Fund
The Technology Select Sector SPDR® Fund
The Utilities Select Sector SPDR® Fund
(the “Select Sector SPDR Funds”)
Supplement dated May 1, 2017 to the Prospectus dated January 31, 2017
Certain aspects of the policy regarding the lending of portfolio securities
of the Select Sector SPDR Funds have been updated.
Accordingly, effective immediately, the paragraph on page 79 of the Prospectus entitled “Lending of Securities”, in section
entitled “ADDITIONAL STRATEGIES INFORMATION, within the sub-section entitled “Non-Principal Strategies” is hereby
deleted in its entirety and replaced with the following:
Lending of Securities. Each Fund may lend its portfolio securities in an amount not to exceed forty percent (40%) of the value of its net
assets via a securities lending program through its securities lending agent, State Street Bank and Trust Company (“State Street” or the
“Lending Agent”), to brokers, dealers and other financial institutions desiring to borrow securities to complete transactions and for other
purposes. A securities lending program allows a Fund to receive a portion of the income generated by lending its securities and
investing the respective collateral. A Fund will receive collateral for each loaned security which is at least equal to 102% of the market
value of that security, marked to market each trading day. In the securities lending program, the borrower generally has the right to vote
the loaned securities; however, a Fund may call a loan to vote proxies, for example, if a material issue affecting the investment is to be
voted upon. Security loans may be terminated at any time by a Fund.
Accordingly, effective immediately, the paragraph on pages 89-90 of the Prospectus entitled “Securities Lending Risk”, in
section entitled “ADDITIONAL RISK INFORMATION, within the sub-section entitled “Non-Principal Risks” is hereby
deleted in its entirety and replaced with the following:
Securities Lending Risk. Each Fund may lend portfolio securities with a value of up to 40% of its net assets. For these purposes, net
assets does not include the value of assets received as collateral for such loans. Such loans may be terminated at any time, and a Fund
will receive cash or other obligations as collateral. Any such loans must be continuously secured by collateral in cash or cash
equivalents maintained on a current basis in an amount at least equal to the market value of the securities loaned by a Fund. In a loan
transaction, as compensation for lending its securities, a Fund will receive a portion of the dividends or interest accrued on the securities
held as collateral or, in the case of cash collateral, a portion of the income from the investment of such cash. In addition, a Fund will
receive the amount of all dividends, interest and other distributions on the loaned securities. However, the borrower has the right to vote
the loaned securities. A Fund may call a loan to vote proxies, for example, if a material issue affecting the investment is to be voted
upon. Should the borrower of the securities fail financially, a Fund may experience delays in recovering the securities or exercising its
rights in the collateral. Loans are made only to borrowers that are deemed by the securities lending agent to be of good financial
standing. In a loan transaction, a Fund will also bear the risk of any decline in value of securities acquired with cash collateral. A Fund
will attempt to minimize this risk by limiting the investment of cash collateral to high quality instruments of short maturity.
PLEASE RETAIN THIS SUPPLEMENT FOR FUTURE REFERENCE
SSSLENPROSUPP1
Prospectus
The Consumer Discretionary Select Sector SPDR® Fund (XLY)
The Consumer Staples Select Sector SPDR® Fund (XLP)
The Energy Select Sector SPDR® Fund (XLE)
The Financial Select Sector SPDR® Fund (XLF)
The Health Care Select Sector SPDR® Fund (XLV)
The Industrial Select Sector SPDR® Fund (XLI)
The Materials Select Sector SPDR® Fund (XLB)
The Real Estate Select Sector SPDR® Fund (XLRE)
The Technology Select Sector SPDR® Fund (XLK)
The Utilities Select Sector SPDR® Fund (XLU)
Principal U.S. Listing Exchange: NYSE Arca, Inc.
January 31, 2017
The U.S. Securities and Exchange Commission has not approved or disapproved these securitiesor passed upon the accuracy or adequacy of this Prospectus. Any representation to the contrary isa criminal offense. Shares in the Funds are not guaranteed or insured by the Federal Deposit InsuranceCorporation or any other agency of the U.S. Government, nor are Shares deposits or obligations ofany bank. It is possible to lose money by investing in the Funds.

FUND SUMMARIES
The Consumer Discretionary Select Sector SPDR Fund. . . . . . 1
The Consumer Staples Select Sector SPDR Fund. . . . . . . . . . . 9
The Energy Select Sector SPDR Fund. . . . . . . . . . . . . . . . . . . . . 16
The Financial Select Sector SPDR Fund . . . . . . . . . . . . . . . . . . . 23
The Health Care Select Sector SPDR Fund . . . . . . . . . . . . . . . . 31
The Industrial Select Sector SPDR Fund. . . . . . . . . . . . . . . . . . . 39
The Materials Select Sector SPDR Fund. . . . . . . . . . . . . . . . . . . 47
The Real Estate Select Sector SPDR Fund . . . . . . . . . . . . . . . . . 54
The Technology Select Sector SPDR Fund. . . . . . . . . . . . . . . . . 62
The Utilities Select Sector SPDR Fund . . . . . . . . . . . . . . . . . . . . 70
Additional Strategies Information . . . . . . . . . . . . . . . . . . . . . . . . . . . . 78
Additional Risk Information . . . . . . . . . . . . . . . . . . . . . . . . . . . . . . . . . 80
Management . . . . . . . . . . . . . . . . . . . . . . . . . . . . . . . . . . . . . . . . . . . . . . 91
Additional Index Information . . . . . . . . . . . . . . . . . . . . . . . . . . . . . . . . 97
Additional Purchase and Sale Information . . . . . . . . . . . . . . . . . . . . . 99
Distribution and Service Plan . . . . . . . . . . . . . . . . . . . . . . . . . . . . . . . . 100
Distributions . . . . . . . . . . . . . . . . . . . . . . . . . . . . . . . . . . . . . . . . . . . . . . 101
Portfolio Holdings Disclosure . . . . . . . . . . . . . . . . . . . . . . . . . . . . . . . . 101
Additional Tax Information . . . . . . . . . . . . . . . . . . . . . . . . . . . . . . . . . . 102
General Information. . . . . . . . . . . . . . . . . . . . . . . . . . . . . . . . . . . . . . . . 106
Premium/Discount Information . . . . . . . . . . . . . . . . . . . . . . . . . . . . . . 106
Financial Highlights . . . . . . . . . . . . . . . . . . . . . . . . . . . . . . . . . . . . . . . . 106
Where to Learn More About the Funds . . . . . . . . . . . . . . . . . . . . . . . Back Cover
Table of Contents

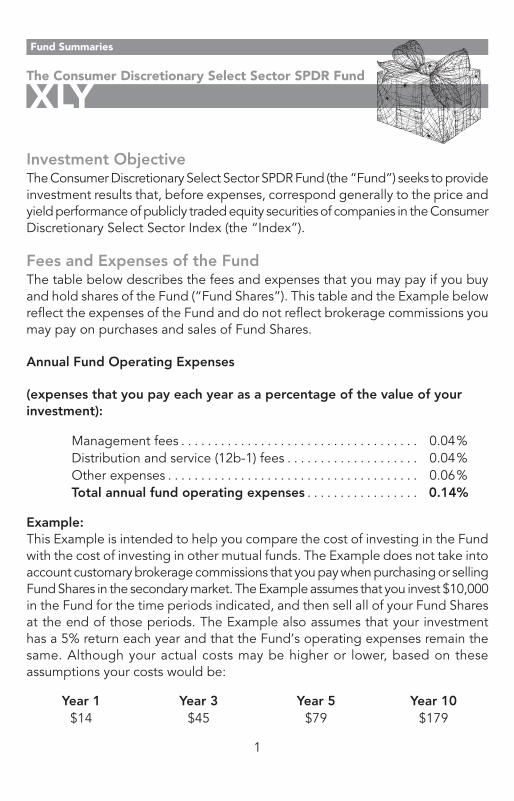
Investment ObjectiveThe Consumer Discretionary Select Sector SPDR Fund (the “Fund”) seeks to provideinvestment results that, before expenses, correspond generally to the price andyield performance of publicly traded equity securities of companies in the ConsumerDiscretionary Select Sector Index (the “Index”).
Fees and Expenses of the FundThe table below describes the fees and expenses that you may pay if you buyand hold shares of the Fund (“Fund Shares”). This table and the Example belowreflect the expenses of the Fund and do not reflect brokerage commissions youmay pay on purchases and sales of Fund Shares.
Annual Fund Operating Expenses
(expenses that you pay each year as a percentage of the value of yourinvestment):
Management fees . . . . . . . . . . . . . . . . . . . . . . . . . . . . . . . . . . . . 0.04%Distribution and service (12b-1) fees . . . . . . . . . . . . . . . . . . . . 0.04%Other expenses . . . . . . . . . . . . . . . . . . . . . . . . . . . . . . . . . . . . . . 0.06%Total annual fund operating expenses . . . . . . . . . . . . . . . . . 0.14%
Example:This Example is intended to help you compare the cost of investing in the Fundwith the cost of investing in other mutual funds. The Example does not take intoaccount customary brokerage commissions that you pay when purchasing or sellingFund Shares in the secondary market. The Example assumes that you invest $10,000in the Fund for the time periods indicated, and then sell all of your Fund Sharesat the end of those periods. The Example also assumes that your investmenthas a 5% return each year and that the Fund’s operating expenses remain thesame. Although your actual costs may be higher or lower, based on theseassumptions your costs would be:
Year 1 Year 3 Year 5 Year 10$14 $45 $79 $179
Fund Summaries
The Consumer Discretionary Select Sector SPDR Fund
XLY
1
Portfolio Turnover:The Fund pays transaction costs, such as commissions, when it buys and sellssecurities (or “turns over” its portfolio). A higher portfolio turnover rate may indicatehigher transaction costs and may result in higher taxes when Fund Shares areheld in a taxable account. These costs, which are not reflected in Annual FundOperating Expenses or in the Example, affect the Fund’s performance. Duringthe most recent fiscal year, the Fund’s portfolio turnover rate was 10% of theaverage value of its portfolio.
The Fund’s Principal Investment StrategyIn seeking to track the performance of the Index, the Fund employs a replicationstrategy, which means that the Fund typically invests in substantially all of thesecurities represented in the Index in approximately the same proportions asthe Index.
Under normal market conditions, the Fund generally invests substantially all, butat least 95%, of its total assets in the securities comprising the Index. The Fundwill provide shareholders with at least 60 days’ notice prior to any material changein this 95% investment policy. In addition, the Fund may invest in cash and cashequivalents or money market instruments, such as repurchase agreements andmoney market funds (including money market funds advised by SSGA FundsManagement, Inc. (“SSGA FM” or the “Adviser”), the investment adviser to theFund).
The Index includes securities of companies from the following industries: media;retail (specialty, multiline, internet and catalog); hotels, restaurants and leisure;textiles, apparel and luxury goods; household durables; automobiles; autocomponents; distributors; leisure products; and diversified consumer services.The Index is one of ten Select Sector Indexes developed and maintained inaccordance with the following criteria: (1) each of the component securities inthe Index is a constituent company of the S&P 500 Index; and (2) the Index iscalculated by S&P Dow Jones Indices LLC (“S&P DJI”) based on methodologyproprietary to S&P DJI and BofA Merrill Lynch Research (“BofA Merrill Lynch”)(S&P DJI and BofA Merrill Lynch, collectively, the “Index Provider”) using a “modifiedmarket capitalization” methodology, which means that modifications may be made
Fund Summaries
XLY
2
to the market capitalization weights of single stock concentrations in order toconform to the requirements of the Internal Revenue Code of 1986, as amended(the “Internal Revenue Code” or “IRC”). As of November 30, 2016, the Indexwas composed of 86 stocks.
The Index is sponsored by the Index Provider and compiled by S&P DJI (the“Index Compilation Agent”). Neither entity is affiliated with the Fund or the Adviser.The Index Compilation Agent determines the composition of the Index and relativeweightings of the securities in the Index based on the Index methodology. TheIndex Provider publishes information regarding the market value of the Index.
Principal Risks of Investing in the FundAs with all investments, there are certain risks of investing in the Fund. FundShares will change in value, and you could lose money by investing in the Fund.An investment in the Fund is not insured or guaranteed by the Federal DepositInsurance Corporation or any other government agency.
Passive Strategy/Index Risk: The Fund is managed with a passive investmentstrategy, attempting to track the performance of an unmanaged index ofsecurities, regardless of the current or projected performance of the Indexor of the actual securities comprising the Index. This differs from anactively-managed fund, which typically seeks to outperform a benchmarkindex. As a result, the Fund’s performance may be less favorable than thatof a portfolio managed using an active investment strategy. The structureand composition of the Index will affect the performance, volatility, andrisk of the Index and, consequently, the performance, volatility, and risk ofthe Fund.
Index Tracking Risk: While the Adviser seeks to track the performance ofthe Index as closely as possible (i.e., achieve a high degree of correlationwith the Index), the Fund’s return may not match or achieve a high degreeof correlation with the return of the Index due to operating expenses,transaction costs, cash flows, regulatory requirements and operationalinefficiencies. For example, the Adviser anticipates that it may take severalbusiness days for additions and deletions to the Index to be reflected inthe portfolio composition of the Fund.
Fund Summaries
XLY
3
Consumer Discretionary Sector Risk: The Fund’s assets will be concentratedin the consumer discretionary sector, which means the Fund will be moreaffected by the performance of the consumer discretionary sector than afund that is more diversified. The success of consumer product manufacturersand retailers is tied closely to the performance of the overall domestic andglobaleconomy, interest rates, competitionandconsumerconfidence.Successdepends heavily on disposable household income and consumer spending.Also, companies in the consumer discretionary sector may be subject tosevere competition, which may have an adverse impact on their respectiveprofitability. Changes in demographics and consumer tastes can also affectthe demand for, and success of, consumer products and services in themarketplace.
Equity Investing Risk: The market prices of equity securities owned by theFund may go up or down, sometimes rapidly or unpredictably. The valueof a security may decline for a number of reasons that may directly relateto the issuer and also may decline due to general industry or market conditionsthat are not specifically related to a particular company. In addition, equitymarkets tend to move in cycles, which may cause stock prices to fall overshort or extended periods of time.
Non-Diversification Risk: As a “non-diversified” fund, the Fund may holda smaller number of portfolio securities than many other funds. To the extentthe Fund invests in a relatively small number of issuers, a decline in themarket value of a particular security held by the Fund may affect its valuemore than if it invested in a larger number of issuers. The value of FundShares may be more volatile than the values of shares of more diversifiedfunds.
Large-Capitalization Securities Risk: Returns on investments in securitiesof large companies could trail the returns on investments in securities ofsmaller andmid-sizedcompanies. Largercompaniesmaybeunable to respondas quickly as smaller and mid-sized companies to competitive challengesor to changes in business, product, financial, or market conditions. Largercompanies may not be able to maintain growth at the high rates that maybe achieved by well-managed smaller and mid-sized companies.
Fund Summaries
XLY
4

Market Risk: The Fund’s investments are subject to changes in generaleconomic conditions, and general market fluctuations and the risks inherentin investment in securities markets. Investment markets can be volatile andprices of investments can change substantially due to various factors including,but not limited to, economic growth or recession, changes in interest rates,changes in the actual or perceived creditworthiness of issuers, and generalmarket liquidity. The Fund is subject to the risk that geopolitical events willdisrupt securities markets and adversely affect global economies and markets.
Fund PerformanceThe following bar chart and table provide an indication of the risks of investingin the Fund by showing changes in the Fund’s performance from year to yearand by showing how the Fund’s average annual returns for certain time periodscompare with the average annual returns of the Index, and the S&P 500 Index.The S&P 500 Index is a well-known, broad-based securities market index thatincludes common stocks of approximately 500 companies from a number of sectorsrepresenting a significant portion of the market value of all stocks publicly tradedin the United States. The Fund’s past performance (before and after taxes) is notnecessarily an indication of how the Fund will perform in the future. Updatedperformance information is available by calling 1-866-732-8673 or visiting ourwebsite at www.sectorspdrs.com.
Annual Total Returns (years ended 12/31)
-60%
-40%
-20%
0%
20%
40%
60%
2007
-13.36%
2008
-33.43%
2009
41.16%
2010
27.39%
2011
5.95%
2012
23.58%
2013
42.72%
2014
9.49%
2015
9.94%
2016
5.88%
Ann
ual R
etur
n
Highest Quarterly Return: 19.24% (Q3, 2009)Lowest Quarterly Return: -22.81% (Q4, 2008)
Fund Summaries
XLY
5
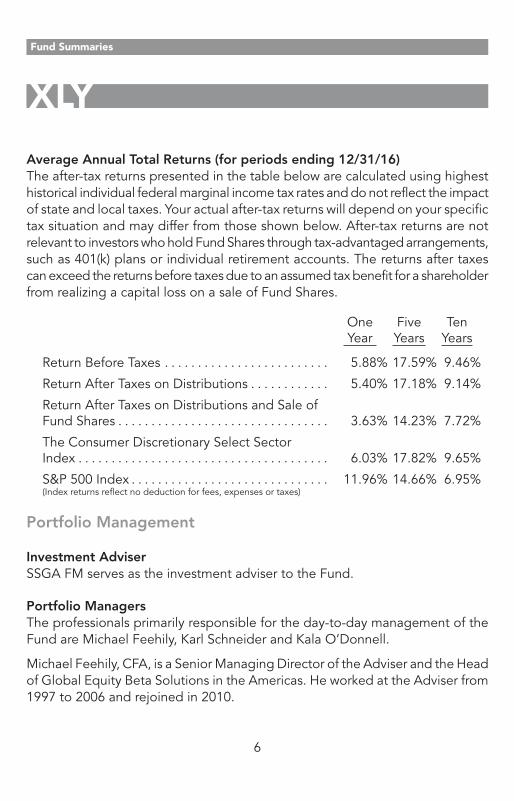
Average Annual Total Returns (for periods ending 12/31/16)The after-tax returns presented in the table below are calculated using highesthistorical individual federal marginal income tax rates and do not reflect the impactof state and local taxes. Your actual after-tax returns will depend on your specifictax situation and may differ from those shown below. After-tax returns are notrelevant to investors who hold Fund Shares through tax-advantaged arrangements,such as 401(k) plans or individual retirement accounts. The returns after taxescan exceed the returns before taxes due to an assumed tax benefit for a shareholderfrom realizing a capital loss on a sale of Fund Shares.
OneYear
FiveYears
TenYears
Return Before Taxes . . . . . . . . . . . . . . . . . . . . . . . . . 5.88% 17.59% 9.46%
Return After Taxes on Distributions . . . . . . . . . . . . 5.40% 17.18% 9.14%
Return After Taxes on Distributions and Sale ofFund Shares . . . . . . . . . . . . . . . . . . . . . . . . . . . . . . . . 3.63% 14.23% 7.72%
The Consumer Discretionary Select SectorIndex . . . . . . . . . . . . . . . . . . . . . . . . . . . . . . . . . . . . . . 6.03% 17.82% 9.65%
S&P 500 Index . . . . . . . . . . . . . . . . . . . . . . . . . . . . . . 11.96% 14.66% 6.95%(Index returns reflect no deduction for fees, expenses or taxes)
Portfolio Management
Investment AdviserSSGA FM serves as the investment adviser to the Fund.
Portfolio ManagersThe professionals primarily responsible for the day-to-day management of theFund are Michael Feehily, Karl Schneider and Kala O’Donnell.
Michael Feehily, CFA, is a Senior Managing Director of the Adviser and the Headof Global Equity Beta Solutions in the Americas. He worked at the Adviser from1997 to 2006 and rejoined in 2010.
Fund Summaries
XLY
6

Karl Schneider, CAIA, is a Vice President of the Adviser and Deputy Head ofGlobal Equity Beta Solutions in the Americas. He joined the Adviser in 1997.
Kala O’Donnell, CFA, is a Vice President of the Adviser and a Senior PortfolioManager in the Global Equity Beta Solutions Group. She joined the Adviser in1995.
Purchase and Sale InformationThe Fund will issue (or redeem) Fund Shares to certain institutional investors (typicallymarket makers or other broker-dealers) only in large blocks of 50,000 Fund Sharesknown as “Creation Units.” Creation Unit transactions are typically conductedin exchange for the deposit or delivery of in-kind securities and/or cash constitutinga substantial replication, or a representation, of the securities included in theFund’s benchmark Index.
Individual Fund Shares may only be purchased and sold on the NYSE Arca, Inc.(the “Exchange”), other national securities exchanges, electronic crossing networksand other alternative trading systems through your broker-dealer at market prices.Because Fund Shares trade at market prices rather than at net asset value (“NAV”),Fund Shares may trade at a price greater than NAV (premium) or less than NAV(discount).
Tax InformationThe Fund’s distributions are expected to be taxed as ordinary income, qualifieddividend income and/or capital gains, unless you are investing through atax-advantaged arrangement, such as a 401(k) plan or individual retirement account.Any withdrawals made from such tax-advantaged arrangement may be taxableto you.
Payments to Broker-Dealers and Other FinancialIntermediariesIf you purchase Fund Shares through a broker-dealer or other financial intermediary(such as a bank), the Adviser, the Distributor or their affiliates may pay the financialintermediary for certain activities related to the Fund, including educational trainingprograms, conferences, the development of technology platforms and reportingsystems, or other services related to the sale or promotion of the Fund. These
Fund Summaries
XLY
7

payments may create a conflict of interest by influencing the broker-dealer orother intermediary and your salesperson to recommend the Fund over anotherinvestment. Ask your salesperson or visit your financial intermediary’s websitefor more information.
Fund Summaries
XLY
8
Investment ObjectiveThe Consumer Staples Select Sector SPDR Fund (the “Fund”) seeks to provideinvestment results that, before expenses, correspond generally to the price andyield performance of publicly traded equity securities of companies in the ConsumerStaples Select Sector Index (the “Index”).
Fees and Expenses of the FundThe table below describes the fees and expenses that you may pay if you buyand hold shares of the Fund (“Fund Shares”). This table and the Example belowreflect the expenses of the Fund and do not reflect brokerage commissions youmay pay on purchases and sales of Fund Shares.
Annual Fund Operating Expenses
(expenses that you pay each year as a percentage of the value of yourinvestment):
Management fees . . . . . . . . . . . . . . . . . . . . . . . . . . . . . . . . . . . . 0.04%Distribution and service (12b-1) fees . . . . . . . . . . . . . . . . . . . . 0.04%Other expenses . . . . . . . . . . . . . . . . . . . . . . . . . . . . . . . . . . . . . . 0.06%Total annual fund operating expenses . . . . . . . . . . . . . . . . . 0.14%
Example:This Example is intended to help you compare the cost of investing in the Fundwith the cost of investing in other mutual funds. The Example does not take intoaccount customary brokerage commissions that you pay when purchasing or sellingFund Shares in the secondary market. The Example assumes that you invest $10,000in the Fund for the time periods indicated, and then sell all of your Fund Sharesat the end of those periods. The Example also assumes that your investmenthas a 5% return each year and that the Fund’s operating expenses remain thesame. Although your actual costs may be higher or lower, based on theseassumptions your costs would be:
Year 1 Year 3 Year 5 Year 10$14 $45 $79 $179
Fund Summaries
The Consumer Staples Select Sector SPDR Fund
XLP
9
Portfolio Turnover:The Fund pays transaction costs, such as commissions, when it buys and sellssecurities (or “turns over” its portfolio). A higher portfolio turnover rate may indicatehigher transaction costs and may result in higher taxes when Fund Shares areheld in a taxable account. These costs, which are not reflected in Annual FundOperating Expenses or in the Example, affect the Fund’s performance. Duringthe most recent fiscal year, the Fund’s portfolio turnover rate was 4% of the averagevalue of its portfolio.
The Fund’s Principal Investment StrategyIn seeking to track the performance of the Index, the Fund employs a replicationstrategy, which means that the Fund typically invests in substantially all of thesecurities represented in the Index in approximately the same proportions asthe Index.
Under normal market conditions, the Fund generally invests substantially all, butat least 95%, of its total assets in the securities comprising the Index. The Fundwill provide shareholders with at least 60 days’ notice prior to any material changein this 95% investment policy. In addition, the Fund may invest in cash and cashequivalents or money market instruments, such as repurchase agreements andmoney market funds (including money market funds advised by SSGA FundsManagement, Inc. (“SSGA FM” or the “Adviser”), the investment adviser to theFund).
The Index includes securities of companies from the following industries: foodand staples retailing; household products; food products; beverages; tobacco;and personal products. The Index is one of ten Select Sector Indexes developedand maintained in accordance with the following criteria: (1) each of the componentsecurities in the Index is a constituent company of the S&P 500 Index; and (2)the Index is calculated by S&P Dow Jones Indices LLC (“S&P DJI”) based onmethodology proprietary to S&P DJI and BofA Merrill Lynch Research (“BofAMerrill Lynch”) (S&P DJI and BofA Merrill Lynch, collectively, the “Index Provider”)using a “modified market capitalization” methodology, which means thatmodifications may be made to the market capitalization weights of single stockconcentrations in order to conform to the requirements of the Internal RevenueCode of 1986, as amended (the “Internal Revenue Code” or “IRC”). As of November30, 2016, the Index was composed of 37 stocks.
Fund Summaries
XLP
10
The Index is sponsored by the Index Provider and compiled by S&P DJI (the“Index Compilation Agent”). Neither entity is affiliated with the Fund or the Adviser.The Index Compilation Agent determines the composition of the Index and relativeweightings of the securities in the Index based on the Index methodology. TheIndex Provider publishes information regarding the market value of the Index.
Principal Risks of Investing in the FundAs with all investments, there are certain risks of investing in the Fund. FundShares will change in value, and you could lose money by investing in the Fund.An investment in the Fund is not insured or guaranteed by the Federal DepositInsurance Corporation or any other government agency.
Passive Strategy/Index Risk: The Fund is managed with a passive investmentstrategy, attempting to track the performance of an unmanaged index ofsecurities, regardless of the current or projected performance of the Indexor of the actual securities comprising the Index. This differs from anactively-managed fund, which typically seeks to outperform a benchmarkindex. As a result, the Fund’s performance may be less favorable than thatof a portfolio managed using an active investment strategy. The structureand composition of the Index will affect the performance, volatility, andrisk of the Index and, consequently, the performance, volatility, and risk ofthe Fund.
Index Tracking Risk: While the Adviser seeks to track the performance ofthe Index as closely as possible (i.e., achieve a high degree of correlationwith the Index), the Fund’s return may not match or achieve a high degreeof correlation with the return of the Index due to operating expenses,transaction costs, cash flows, regulatory requirements and operationalinefficiencies. For example, the Adviser anticipates that it may take severalbusiness days for additions and deletions to the Index to be reflected inthe portfolio composition of the Fund.
Consumer Staples Sector Risk: The Fund’s assets will be concentrated inthe consumer staples sector, which means the Fund will be more affectedby the performance of the consumer staples sector than a fund that is morediversified. Consumer staples companies are subject to government regulationaffecting their products which may negatively impact such companies’
Fund Summaries
XLP
11

performance. For instance, government regulations may affect thepermissibility of using various food additives and production methods ofcompanies that make food products, which could affect company profitability.Tobacco companies may be adversely affected by the adoption of proposedlegislation and/or by litigation. Also, the success of food, beverage, householdand personal product companies may be strongly affected by consumerinterest, marketing campaigns and other factors affecting supply and demand,including performance of the overall domestic and global economy, interestrates, competition and consumer confidence and spending.
Equity Investing Risk: The market prices of equity securities owned by theFund may go up or down, sometimes rapidly or unpredictably. The valueof a security may decline for a number of reasons that may directly relateto the issuer and also may decline due to general industry or market conditionsthat are not specifically related to a particular company. In addition, equitymarkets tend to move in cycles, which may cause stock prices to fall overshort or extended periods of time.
Non-Diversification Risk: As a “non-diversified” fund, the Fund may holda smaller number of portfolio securities than many other funds. To the extentthe Fund invests in a relatively small number of issuers, a decline in themarket value of a particular security held by the Fund may affect its valuemore than if it invested in a larger number of issuers. The value of FundShares may be more volatile than the values of shares of more diversifiedfunds.
Large-Capitalization Securities Risk: Returns on investments in securitiesof large companies could trail the returns on investments in securities ofsmaller andmid-sizedcompanies. Largercompaniesmaybeunable to respondas quickly as smaller and mid-sized companies to competitive challengesor to changes in business, product, financial, or market conditions. Largercompanies may not be able to maintain growth at the high rates that maybe achieved by well-managed smaller and mid-sized companies.
Market Risk: The Fund’s investments are subject to changes in generaleconomic conditions, and general market fluctuations and the risks inherentin investment in securities markets. Investment markets can be volatile andprices of investments can change substantially due to various factors including,
Fund Summaries
XLP
12

but not limited to, economic growth or recession, changes in interest rates,changes in the actual or perceived creditworthiness of issuers, and generalmarket liquidity. The Fund is subject to the risk that geopolitical events willdisrupt securities markets and adversely affect global economies and markets.
Fund PerformanceThe following bar chart and table provide an indication of the risks of investingin the Fund by showing changes in the Fund’s performance from year to yearand by showing how the Fund’s average annual returns for certain time periodscompare with the average annual returns of the Index, and the S&P 500 Index.The S&P 500 Index is a well-known, broad-based securities market index thatincludes common stocks of approximately 500 companies from a number of sectorsrepresenting a significant portion of the market value of all stocks publicly tradedin the United States. The Fund’s past performance (before and after taxes) is notnecessarily an indication of how the Fund will perform in the future. Updatedperformance information is available by calling 1-866-732-8673 or visiting ourwebsite at www.sectorspdrs.com.
Annual Total Returns (years ended 12/31)
-30%
-20%
-10%
0%
10%
20%
30%
40%
2007
12.49%
2008
-14.98%
2009
14.21%
2010
13.86%
2011
14.00%
2012
10.72%
2013
26.27%
2014
15.86%
2015
6.83%
2016
5.00%
Ann
ual R
etur
n
Highest Quarterly Return: 14.59% (Q1, 2013)Lowest Quarterly Return: -12.29% (Q4, 2008)
Average Annual Total Returns (for periods ending 12/31/16)The after-tax returns presented in the table below are calculated using highesthistorical individual federal marginal income tax rates and do not reflect the impactof state and local taxes. Your actual after-tax returns will depend on your specific
Fund Summaries
XLP
13
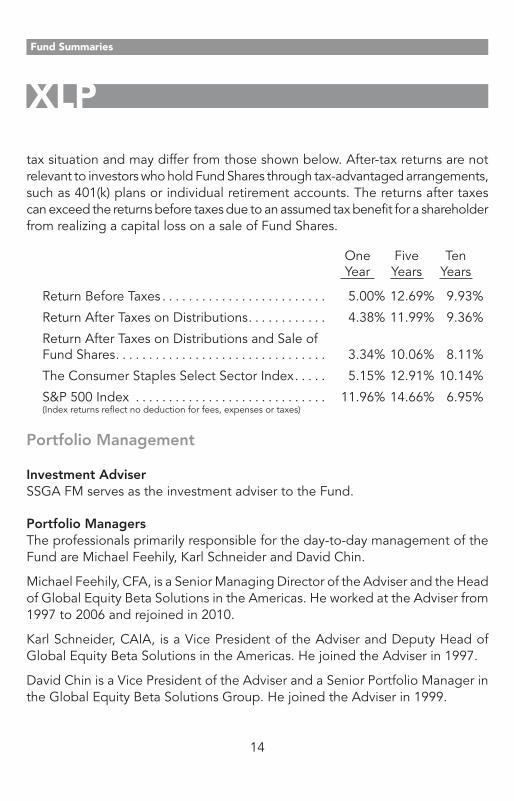
tax situation and may differ from those shown below. After-tax returns are notrelevant to investors who hold Fund Shares through tax-advantaged arrangements,such as 401(k) plans or individual retirement accounts. The returns after taxescan exceed the returns before taxes due to an assumed tax benefit for a shareholderfrom realizing a capital loss on a sale of Fund Shares.
OneYear
FiveYears
TenYears
Return Before Taxes . . . . . . . . . . . . . . . . . . . . . . . . . 5.00% 12.69% 9.93%
Return After Taxes on Distributions. . . . . . . . . . . . 4.38% 11.99% 9.36%
Return After Taxes on Distributions and Sale ofFund Shares. . . . . . . . . . . . . . . . . . . . . . . . . . . . . . . . 3.34% 10.06% 8.11%
The Consumer Staples Select Sector Index. . . . . 5.15% 12.91% 10.14%
S&P 500 Index . . . . . . . . . . . . . . . . . . . . . . . . . . . . . 11.96% 14.66% 6.95%(Index returns reflect no deduction for fees, expenses or taxes)
Portfolio Management
Investment AdviserSSGA FM serves as the investment adviser to the Fund.
Portfolio ManagersThe professionals primarily responsible for the day-to-day management of theFund are Michael Feehily, Karl Schneider and David Chin.
Michael Feehily, CFA, is a Senior Managing Director of the Adviser and the Headof Global Equity Beta Solutions in the Americas. He worked at the Adviser from1997 to 2006 and rejoined in 2010.
Karl Schneider, CAIA, is a Vice President of the Adviser and Deputy Head ofGlobal Equity Beta Solutions in the Americas. He joined the Adviser in 1997.
David Chin is a Vice President of the Adviser and a Senior Portfolio Manager inthe Global Equity Beta Solutions Group. He joined the Adviser in 1999.
Fund Summaries
XLP
14

Purchase and Sale InformationThe Fund will issue (or redeem) Fund Shares to certain institutional investors (typicallymarket makers or other broker-dealers) only in large blocks of 50,000 Fund Sharesknown as “Creation Units.” Creation Unit transactions are typically conductedin exchange for the deposit or delivery of in-kind securities and/or cash constitutinga substantial replication, or a representation, of the securities included in theFund’s benchmark Index.
Individual Fund Shares may only be purchased and sold on the NYSE Arca, Inc.(the “Exchange”), other national securities exchanges, electronic crossing networksand other alternative trading systems through your broker-dealer at market prices.Because Fund Shares trade at market prices rather than at net asset value (“NAV”),Fund Shares may trade at a price greater than NAV (premium) or less than NAV(discount).
Tax InformationThe Fund’s distributions are expected to be taxed as ordinary income, qualifieddividend income and/or capital gains, unless you are investing through atax-advantaged arrangement, such as a 401(k) plan or individual retirement account.Any withdrawals made from such tax-advantaged arrangement may be taxableto you.
Payments to Broker-Dealers and Other FinancialIntermediariesIf you purchase Fund Shares through a broker-dealer or other financial intermediary(such as a bank), the Adviser, the Distributor or their affiliates may pay the financialintermediary for certain activities related to the Fund, including educational trainingprograms, conferences, the development of technology platforms and reportingsystems, or other services related to the sale or promotion of the Fund. Thesepayments may create a conflict of interest by influencing the broker-dealer orother intermediary and your salesperson to recommend the Fund over anotherinvestment. Ask your salesperson or visit your financial intermediary’s websitefor more information.
Fund Summaries
XLP
15

Investment ObjectiveThe Energy Select Sector SPDR Fund (the “Fund”) seeks to provide investmentresults that, before expenses, correspond generally to the price and yieldperformance of publicly traded equity securities of companies in the Energy SelectSector Index (the “Index”).
Fees and Expenses of the FundThe table below describes the fees and expenses that you may pay if you buyand hold shares of the Fund (“Fund Shares”). This table and the Example belowreflect the expenses of the Fund and do not reflect brokerage commissions youmay pay on purchases and sales of Fund Shares.
Annual Fund Operating Expenses
(expenses that you pay each year as a percentage of the value of yourinvestment):
Management fees . . . . . . . . . . . . . . . . . . . . . . . . . . . . . . . . . . . . 0.04%Distribution and service (12b-1) fees . . . . . . . . . . . . . . . . . . . . 0.04%Other expenses . . . . . . . . . . . . . . . . . . . . . . . . . . . . . . . . . . . . . . 0.06%Total annual fund operating expenses . . . . . . . . . . . . . . . . . 0.14%
Example:This Example is intended to help you compare the cost of investing in the Fundwith the cost of investing in other mutual funds. The Example does not take intoaccount customary brokerage commissions that you pay when purchasing or sellingFund Shares in the secondary market. The Example assumes that you invest $10,000in the Fund for the time periods indicated, and then sell all of your Fund Sharesat the end of those periods. The Example also assumes that your investmenthas a 5% return each year and that the Fund’s operating expenses remain thesame. Although your actual costs may be higher or lower, based on theseassumptions your costs would be:
Year 1 Year 3 Year 5 Year 10$14 $45 $79 $179
Fund Summaries
The Energy Select Sector SPDR Fund
XLE
16
Portfolio Turnover:The Fund pays transaction costs, such as commissions, when it buys and sellssecurities (or “turns over” its portfolio). A higher portfolio turnover rate may indicatehigher transaction costs and may result in higher taxes when Fund Shares areheld in a taxable account. These costs, which are not reflected in Annual FundOperating Expenses or in the Example, affect the Fund’s performance. Duringthe most recent fiscal year, the Fund’s portfolio turnover rate was 6% of the averagevalue of its portfolio.
The Fund’s Principal Investment StrategyIn seeking to track the performance of the Index, the Fund employs a replicationstrategy, which means that the Fund typically invests in substantially all of thesecurities represented in the Index in approximately the same proportions asthe Index.
Under normal market conditions, the Fund generally invests substantially all, butat least 95%, of its total assets in the securities comprising the Index. The Fundwill provide shareholders with at least 60 days’ notice prior to any material changein this 95% investment policy. In addition, the Fund may invest in cash and cashequivalents or money market instruments, such as repurchase agreements andmoney market funds (including money market funds advised by SSGA FundsManagement, Inc. (“SSGA FM” or the “Adviser”), the investment adviser to theFund).
The Index includes securities of companies from the following industries: oil, gasand consumable fuels; and energy equipment and services. The Index is one often Select Sector Indexes developed and maintained in accordance with thefollowing criteria: (1) each of the component securities in the Index is a constituentcompany of the S&P 500 Index; and (2) the Index is calculated by S&P Dow JonesIndices LLC (“S&P DJI”) based on methodology proprietary to S&P DJI and BofAMerrill Lynch Research (“BofA Merrill Lynch”) (S&P DJI and BofA Merrill Lynch,collectively, the “Index Provider”) using a “modified market capitalization”methodology, which means that modifications may be made to the marketcapitalization weights of single stock concentrations in order to conform to therequirements of the Internal Revenue Code of 1986, as amended (the “InternalRevenue Code” or “IRC”). As of November 30, 2016, the Index was composedof 36 stocks.
Fund Summaries
XLE
17
The Index is sponsored by the Index Provider and compiled by S&P DJI (the“Index Compilation Agent”). Neither entity is affiliated with the Fund or the Adviser.The Index Compilation Agent determines the composition of the Index and relativeweightings of the securities in the Index based on the Index methodology. TheIndex Provider publishes information regarding the market value of the Index.
Principal Risks of Investing in the FundAs with all investments, there are certain risks of investing in the Fund. FundShares will change in value, and you could lose money by investing in the Fund.An investment in the Fund is not insured or guaranteed by the Federal DepositInsurance Corporation or any other government agency.
Passive Strategy/Index Risk: The Fund is managed with a passive investmentstrategy, attempting to track the performance of an unmanaged index ofsecurities, regardless of the current or projected performance of the Indexor of the actual securities comprising the Index. This differs from anactively-managed fund, which typically seeks to outperform a benchmarkindex. As a result, the Fund’s performance may be less favorable than thatof a portfolio managed using an active investment strategy. The structureand composition of the Index will affect the performance, volatility, andrisk of the Index and, consequently, the performance, volatility, and risk ofthe Fund.
Index Tracking Risk: While the Adviser seeks to track the performance ofthe Index as closely as possible (i.e., achieve a high degree of correlationwith the Index), the Fund’s return may not match or achieve a high degreeof correlation with the return of the Index due to operating expenses,transaction costs, cash flows, regulatory requirements and operationalinefficiencies. For example, the Adviser anticipates that it may take severalbusiness days for additions and deletions to the Index to be reflected inthe portfolio composition of the Fund.
Energy Sector Risk: The Fund’s assets will be concentrated in the energysector, which means the Fund will be more affected by the performanceof the energy sector than a fund that is more diversified. Issuers in energy-related industries can be significantly affected by fluctuations in energy pricesand supply and demand of energy fuels. Markets for various energy-related
Fund Summaries
XLE
18
commodities can have significant volatility, and are subject to control ormanipulation by large producers or purchasers. Companies in the energysector may need to make substantial expenditures, and to incur significantamounts of debt, in order to maintain or expand their reserves. Oil andgasexplorationandproductioncanbesignificantlyaffectedbynaturaldisastersas well as changes in exchange rates, interest rates, government regulation,world events and economic conditions. These companies may be at riskfor environmental damage claims.
Equity Investing Risk: The market prices of equity securities owned by theFund may go up or down, sometimes rapidly or unpredictably. The valueof a security may decline for a number of reasons that may directly relateto the issuer and also may decline due to general industry or market conditionsthat are not specifically related to a particular company. In addition, equitymarkets tend to move in cycles, which may cause stock prices to fall overshort or extended periods of time.
Non-Diversification Risk: As a “non-diversified” fund, the Fund may holda smaller number of portfolio securities than many other funds. To the extentthe Fund invests in a relatively small number of issuers, a decline in themarket value of a particular security held by the Fund may affect its valuemore than if it invested in a larger number of issuers. The value of FundShares may be more volatile than the values of shares of more diversifiedfunds.
Large-Capitalization Securities Risk: Returns on investments in securitiesof large companies could trail the returns on investments in securities ofsmaller andmid-sizedcompanies. Largercompaniesmaybeunable to respondas quickly as smaller and mid-sized companies to competitive challengesor to changes in business, product, financial, or market conditions. Largercompanies may not be able to maintain growth at the high rates that maybe achieved by well-managed smaller and mid-sized companies.
Market Risk: The Fund’s investments are subject to changes in generaleconomic conditions, and general market fluctuations and the risks inherentin investment in securities markets. Investment markets can be volatile andprices of investments can change substantially due to various factors including,but not limited to, economic growth or recession, changes in interest rates,
Fund Summaries
XLE
19
changes in the actual or perceived creditworthiness of issuers, and generalmarket liquidity. The Fund is subject to the risk that geopolitical events willdisrupt securities markets and adversely affect global economies and markets.
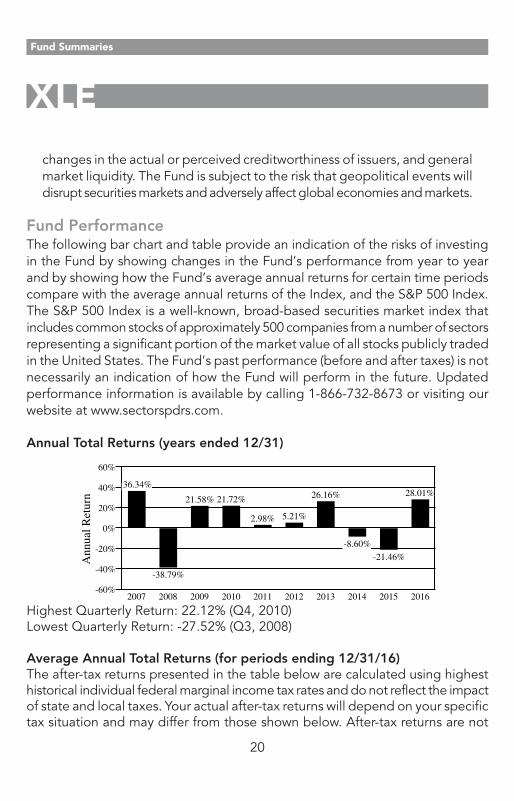
Fund PerformanceThe following bar chart and table provide an indication of the risks of investingin the Fund by showing changes in the Fund’s performance from year to yearand by showing how the Fund’s average annual returns for certain time periodscompare with the average annual returns of the Index, and the S&P 500 Index.The S&P 500 Index is a well-known, broad-based securities market index thatincludes common stocks of approximately 500 companies from a number of sectorsrepresenting a significant portion of the market value of all stocks publicly tradedin the United States. The Fund’s past performance (before and after taxes) is notnecessarily an indication of how the Fund will perform in the future. Updatedperformance information is available by calling 1-866-732-8673 or visiting ourwebsite at www.sectorspdrs.com.
Annual Total Returns (years ended 12/31)
-60%
-40%
-20%
0%
20%
40%
60%
2007
36.34%
2008
-38.79%
2009
21.58%
2010
21.72%
2011
2.98%
2012
5.21%
2013
26.16%
2014
-8.60%
2015
-21.46%
2016
28.01%
Ann
ual R
etur
n
Highest Quarterly Return: 22.12% (Q4, 2010)Lowest Quarterly Return: -27.52% (Q3, 2008)
Average Annual Total Returns (for periods ending 12/31/16)The after-tax returns presented in the table below are calculated using highesthistorical individual federal marginal income tax rates and do not reflect the impactof state and local taxes. Your actual after-tax returns will depend on your specifictax situation and may differ from those shown below. After-tax returns are not
Fund Summaries
XLE
20

relevant to investors who hold Fund Shares through tax-advantaged arrangements,such as 401(k) plans or individual retirement accounts. The returns after taxescan exceed the returns before taxes due to an assumed tax benefit for a shareholderfrom realizing a capital loss on a sale of Fund Shares.
OneYear
FiveYears
TenYears
Return Before Taxes . . . . . . . . . . . . . . . . . . . . . . . . . 28.01% 4.05% 4.49%
Return After Taxes on Distributions . . . . . . . . . . . . 27.24% 3.51% 4.09%
Return After Taxes on Distributions and Sale ofFund Shares . . . . . . . . . . . . . . . . . . . . . . . . . . . . . . . . 16.36% 3.12% 3.58%
The Energy Select Sector Index . . . . . . . . . . . . . . . 28.24% 4.17% 4.66%
S&P 500 Index . . . . . . . . . . . . . . . . . . . . . . . . . . . . . . 11.96% 14.66% 6.95%(Index returns reflect no deduction for fees, expenses or taxes)
Portfolio Management
Investment AdviserSSGA FM serves as the investment adviser to the Fund.
Portfolio ManagersThe professionals primarily responsible for the day-to-day management of theFund are Michael Feehily, Karl Schneider and David Chin.
Michael Feehily, CFA, is a Senior Managing Director of the Adviser and the Headof Global Equity Beta Solutions in the Americas. He worked at the Adviser from1997 to 2006 and rejoined in 2010.
Karl Schneider, CAIA, is a Vice President of the Adviser and Deputy Head ofGlobal Equity Beta Solutions in the Americas. He joined the Adviser in 1997.
David Chin is a Vice President of the Adviser and a Senior Portfolio Manager inthe Global Equity Beta Solutions Group. He joined the Adviser in 1999.
Fund Summaries
XLE
21

Purchase and Sale InformationThe Fund will issue (or redeem) Fund Shares to certain institutional investors (typicallymarket makers or other broker-dealers) only in large blocks of 50,000 Fund Sharesknown as “Creation Units.” Creation Unit transactions are typically conductedin exchange for the deposit or delivery of in-kind securities and/or cash constitutinga substantial replication, or a representation, of the securities included in theFund’s benchmark Index.
Individual Fund Shares may only be purchased and sold on the NYSE Arca, Inc.(the “Exchange”), other national securities exchanges, electronic crossing networksand other alternative trading systems through your broker-dealer at market prices.Because Fund Shares trade at market prices rather than at net asset value (“NAV”),Fund Shares may trade at a price greater than NAV (premium) or less than NAV(discount).
Tax InformationThe Fund’s distributions are expected to be taxed as ordinary income, qualifieddividend income and/or capital gains, unless you are investing through atax-advantaged arrangement, such as a 401(k) plan or individual retirement account.Any withdrawals made from such tax-advantaged arrangement may be taxableto you.
Payments to Broker-Dealers and Other FinancialIntermediariesIf you purchase Fund Shares through a broker-dealer or other financial intermediary(such as a bank), the Adviser, the Distributor or their affiliates may pay the financialintermediary for certain activities related to the Fund, including educational trainingprograms, conferences, the development of technology platforms and reportingsystems, or other services related to the sale or promotion of the Fund. Thesepayments may create a conflict of interest by influencing the broker-dealer orother intermediary and your salesperson to recommend the Fund over anotherinvestment. Ask your salesperson or visit your financial intermediary’s websitefor more information.
Fund Summaries
XLE
22
Investment ObjectiveThe Financial Select Sector SPDR Fund (the “Fund”) seeks to provide investmentresults that, before expenses, correspond generally to the price and yieldperformance of publicly traded equity securities of companies in the FinancialSelect Sector Index (the “Index”).
Fees and Expenses of the FundThe table below describes the fees and expenses that you may pay if you buyand hold shares of the Fund (“Fund Shares”). This table and the Example belowreflect the expenses of the Fund and do not reflect brokerage commissions youmay pay on purchases and sales of Fund Shares.
Annual Fund Operating Expenses
(expenses that you pay each year as a percentage of the value of yourinvestment):
Management fees . . . . . . . . . . . . . . . . . . . . . . . . . . . . . . . . . . . . 0.04%Distribution and service (12b-1) fees . . . . . . . . . . . . . . . . . . . . 0.04%Other expenses . . . . . . . . . . . . . . . . . . . . . . . . . . . . . . . . . . . . . . 0.06%Total annual fund operating expenses . . . . . . . . . . . . . . . . . 0.14%
Example:This Example is intended to help you compare the cost of investing in the Fundwith the cost of investing in other mutual funds. The Example does not take intoaccount customary brokerage commissions that you pay when purchasing or sellingFund Shares in the secondary market. The Example assumes that you invest $10,000in the Fund for the time periods indicated, and then sell all of your Fund Sharesat the end of those periods. The Example also assumes that your investmenthas a 5% return each year and that the Fund’s operating expenses remain thesame. Although your actual costs may be higher or lower, based on theseassumptions your costs would be:
Year 1 Year 3 Year 5 Year 10$14 $45 $79 $179
Fund Summaries
The Financial Select Sector SPDR Fund
XLF
23
Portfolio Turnover:The Fund pays transaction costs, such as commissions, when it buys and sellssecurities (or “turns over” its portfolio). A higher portfolio turnover rate may indicatehigher transaction costs and may result in higher taxes when Fund Shares areheld in a taxable account. These costs, which are not reflected in Annual FundOperating Expenses or in the Example, affect the Fund’s performance. Duringthe most recent fiscal year, the Fund’s portfolio turnover rate was 6% of the averagevalue of its portfolio.
The Fund’s Principal Investment StrategyIn seeking to track the performance of the Index, the Fund employs a replicationstrategy, which means that the Fund typically invests in substantially all of thesecurities represented in the Index in approximately the same proportions asthe Index.
Under normal market conditions, the Fund generally invests substantially all, butat least 95%, of its total assets in the securities comprising the Index. The Fundwill provide shareholders with at least 60 days’ notice prior to any material changein this 95% investment policy. In addition, the Fund may invest in cash and cashequivalents or money market instruments, such as repurchase agreements andmoney market funds (including money market funds advised by SSGA FundsManagement, Inc. (“SSGA FM” or the “Adviser”), the investment adviser to theFund).
The Index includes securities of companies from the following industries: diversifiedfinancial services; insurance; banks; capital markets; mortgage real estate investmenttrusts (“REITs”); consumer finance; and thrifts and mortgage finance. The Indexis one of ten Select Sector Indexes developed and maintained in accordancewith the following criteria: (1) each of the component securities in the Index isa constituent company of the S&P 500 Index; and (2) the Index is calculated byS&P Dow Jones Indices LLC (“S&P DJI”) based on methodology proprietary toS&P DJI and BofA Merrill Lynch Research (“BofA Merrill Lynch”) (S&P DJI andBofA Merrill Lynch, collectively, the “Index Provider”) using a “modified marketcapitalization” methodology, which means that modifications may be made to
Fund Summaries
XLF
24
the market capitalization weights of single stock concentrations in order to conformto the requirements of the Internal Revenue Code of 1986, as amended (the“Internal Revenue Code” or “IRC”). As of November 30, 2016, the Index wascomposed of 64 stocks.
The Index is sponsored by the Index Provider and compiled by S&P DJI (the“Index Compilation Agent”). Neither entity is affiliated with the Fund or the Adviser.The Index Compilation Agent determines the composition of the Index and relativeweightings of the securities in the Index based on the Index methodology. TheIndex Provider publishes information regarding the market value of the Index.
Principal Risks of Investing in the FundAs with all investments, there are certain risks of investing in the Fund. FundShares will change in value, and you could lose money by investing in the Fund.An investment in the Fund is not insured or guaranteed by the Federal DepositInsurance Corporation or any other government agency.
Passive Strategy/Index Risk: The Fund is managed with a passive investmentstrategy, attempting to track the performance of an unmanaged index ofsecurities, regardless of the current or projected performance of the Indexor of the actual securities comprising the Index. This differs from anactively-managed fund, which typically seeks to outperform a benchmarkindex. As a result, the Fund’s performance may be less favorable than thatof a portfolio managed using an active investment strategy. The structureand composition of the Index will affect the performance, volatility, andrisk of the Index and, consequently, the performance, volatility, and risk ofthe Fund.
Index Tracking Risk: While the Adviser seeks to track the performance ofthe Index as closely as possible (i.e., achieve a high degree of correlationwith the Index), the Fund’s return may not match or achieve a high degreeof correlation with the return of the Index due to operating expenses,transaction costs, cash flows, regulatory requirements and operationalinefficiencies. For example, the Adviser anticipates that it may take severalbusiness days for additions and deletions to the Index to be reflected inthe portfolio composition of the Fund.
Fund Summaries
XLF
25
Financial Sector Risk: The Fund’s assets will be concentrated in the financialsector, which means the Fund will be more affected by the performanceof the financial sector than a fund that is more diversified. Financial servicescompanies are subject to extensive governmental regulation which maylimit both the amounts and types of loans and other financial commitmentsthey can make, the interest rates and fees they can charge, the scope oftheir activities, the prices they can charge and the amount of capital theymust maintain. Profitability is largely dependent on the availability and costof capital funds and can fluctuate significantly when interest rates changeor due to increased competition. In addition, deterioration of the creditmarkets generally may cause an adverse impact in a broad range of markets,including U.S. and international credit and interbank money markets generally,thereby affecting a wide range of financial institutions and markets. Certainevents in the financial sector may cause an unusually high degree of volatilityin the financial markets, both domestic and foreign, and cause certain financialservices companies to incur large losses. Securities of financial servicescompanies may experience a dramatic decline in value when such companiesexperience substantial declines in the valuations of their assets, take actionto raise capital (such as the issuance of debt or equity securities), or ceaseoperations. Credit losses resulting from financial difficulties of borrowersand financial losses associated with investment activities can negatively impactthe sector. Insurance companies may be subject to severe price competition.Adverse economic, business or political developments could adversely affectfinancial institutions engaged in mortgage finance or other lending or investingactivities directly or indirectly connected to the value of real estate.
Equity Investing Risk: The market prices of equity securities owned by theFund may go up or down, sometimes rapidly or unpredictably. The valueof a security may decline for a number of reasons that may directly relateto the issuer and also may decline due to general industry or market conditionsthat are not specifically related to a particular company. In addition, equitymarkets tend to move in cycles, which may cause stock prices to fall overshort or extended periods of time.
Non-Diversification Risk: As a “non-diversified” fund, the Fund may holda smaller number of portfolio securities than many other funds. To the extentthe Fund invests in a relatively small number of issuers, a decline in the
Fund Summaries
XLF
26
market value of a particular security held by the Fund may affect its valuemore than if it invested in a larger number of issuers. The value of FundShares may be more volatile than the values of shares of more diversifiedfunds.
Large-Capitalization Securities Risk: Returns on investments in securitiesof large companies could trail the returns on investments in securities ofsmaller andmid-sizedcompanies. Largercompaniesmaybeunable to respondas quickly as smaller and mid-sized companies to competitive challengesor to changes in business, product, financial, or market conditions. Largercompanies may not be able to maintain growth at the high rates that maybe achieved by well-managed smaller and mid-sized companies.
Market Risk: The Fund’s investments are subject to changes in generaleconomic conditions, and general market fluctuations and the risks inherentin investment in securities markets. Investment markets can be volatile andprices of investments can change substantially due to various factors including,but not limited to, economic growth or recession, changes in interest rates,changes in the actual or perceived creditworthiness of issuers, and generalmarket liquidity. The Fund is subject to the risk that geopolitical events willdisrupt securities markets and adversely affect global economies and markets.
Mortgage REIT Risk: Mortgage REITs, which invest the majority of theirassets in real estate mortgages, receive principal and interest paymentsfrom the owners of the mortgage properties and derive their income primarilyfrom interest payments. Accordingly, mortgage REITs are subject to thecredit risk of the borrowers, which refers to the possibility that the borrowerwill be unable and/or unwilling to make timely interest payments and/orrepay the principal on the loan to the mortgage REIT when due. In the eventof a default by a borrower, the mortgage REIT may experience delays inenforcing its rights as a mortgagee and may incur substantial costs associatedwith protecting its investments. Mortgage REITs are subject to heavy cashflow dependency and, as a result, are particularly reliant on the properfunctioning of the capital markets. Further, mortgage REITs are dependentupon specialized management skills and their investments may not bediversified. Mortgage REITs are also subject to risks related to general andlocal economic conditions and the real estate market specifically, availability
Fund Summaries
XLF
27
of mortgage funds, changes in interest rates, changes in property values,and borrower prepayment on underlying mortgage loans. In addition, amortgage REIT could fail to qualify for favorable tax or regulatory treatment.
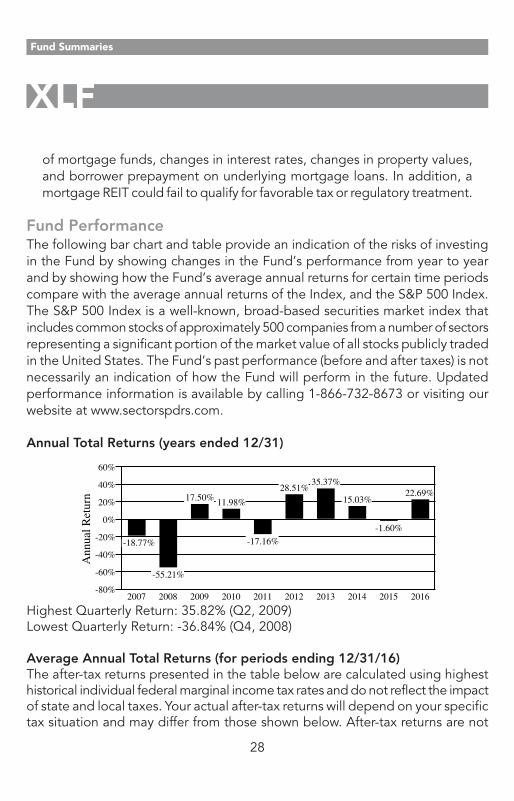
Fund PerformanceThe following bar chart and table provide an indication of the risks of investingin the Fund by showing changes in the Fund’s performance from year to yearand by showing how the Fund’s average annual returns for certain time periodscompare with the average annual returns of the Index, and the S&P 500 Index.The S&P 500 Index is a well-known, broad-based securities market index thatincludes common stocks of approximately 500 companies from a number of sectorsrepresenting a significant portion of the market value of all stocks publicly tradedin the United States. The Fund’s past performance (before and after taxes) is notnecessarily an indication of how the Fund will perform in the future. Updatedperformance information is available by calling 1-866-732-8673 or visiting ourwebsite at www.sectorspdrs.com.
Annual Total Returns (years ended 12/31)
-80%
-60%
-40%
-20%
0%
20%
40%
60%
2007
-18.77%
2008
-55.21%
2009
17.50%
2010
11.98%
2011
-17.16%
2012
28.51%
2013
35.37%
2014
15.03%
2015
-1.60%
2016
22.69%
Ann
ual R
etur
n
Highest Quarterly Return: 35.82% (Q2, 2009)Lowest Quarterly Return: -36.84% (Q4, 2008)
Average Annual Total Returns (for periods ending 12/31/16)The after-tax returns presented in the table below are calculated using highesthistorical individual federal marginal income tax rates and do not reflect the impactof state and local taxes. Your actual after-tax returns will depend on your specifictax situation and may differ from those shown below. After-tax returns are not
Fund Summaries
XLF
28
relevant to investors who hold Fund Shares through tax-advantaged arrangements,such as 401(k) plans or individual retirement accounts. The returns after taxescan exceed the returns before taxes due to an assumed tax benefit for a shareholderfrom realizing a capital loss on a sale of Fund Shares.
OneYear
FiveYears
TenYears
Return Before Taxes . . . . . . . . . . . . . . . . . . . . . . . . . 22.69% 19.29% -0.43%
Return After Taxes on Distributions . . . . . . . . . . . . 18.58% 18.04% -1.19%
Return After Taxes on Distributions and Sale ofFund Shares . . . . . . . . . . . . . . . . . . . . . . . . . . . . . . . . 18.22% 15.70% -0.35%
The Financial Select Sector Index . . . . . . . . . . . . . 22.80% 19.47% -0.34%
S&P 500 Index . . . . . . . . . . . . . . . . . . . . . . . . . . . . . . 11.96% 14.66% 6.95%(Index returns reflect no deduction for fees, expenses or taxes)
Portfolio Management
Investment AdviserSSGA FM serves as the investment adviser to the Fund.
Portfolio ManagersThe professionals primarily responsible for the day-to-day management of theFund are Michael Feehily, Karl Schneider and Melissa Kapitulik.
Michael Feehily, CFA, is a Senior Managing Director of the Adviser and the Headof Global Equity Beta Solutions in the Americas. He worked at the Adviser from1997 to 2006 and rejoined in 2010.
Karl Schneider, CAIA, is a Vice President of the Adviser and Deputy Head ofGlobal Equity Beta Solutions in the Americas. He joined the Adviser in 1997.
Melissa Kapitulik is a Vice President of the Adviser and a Senior Portfolio Managerin the Global Equity Beta Solutions Group. She joined the Adviser in 2006.
Fund Summaries
XLF
29

Purchase and Sale InformationThe Fund will issue (or redeem) Fund Shares to certain institutional investors (typicallymarket makers or other broker-dealers) only in large blocks of 50,000 Fund Sharesknown as “Creation Units.” Creation Unit transactions are typically conductedin exchange for the deposit or delivery of in-kind securities and/or cash constitutinga substantial replication, or a representation, of the securities included in theFund’s benchmark Index.
Individual Fund Shares may only be purchased and sold on the NYSE Arca, Inc.(the “Exchange”), other national securities exchanges, electronic crossing networksand other alternative trading systems through your broker-dealer at market prices.Because Fund Shares trade at market prices rather than at net asset value (“NAV”),Fund Shares may trade at a price greater than NAV (premium) or less than NAV(discount).
Tax InformationThe Fund’s distributions are expected to be taxed as ordinary income, qualifieddividend income and/or capital gains, unless you are investing through atax-advantaged arrangement, such as a 401(k) plan or individual retirement account.Any withdrawals made from such tax-advantaged arrangement may be taxableto you.
Payments to Broker-Dealers and Other FinancialIntermediariesIf you purchase Fund Shares through a broker-dealer or other financial intermediary(such as a bank), the Adviser, the Distributor or their affiliates may pay the financialintermediary for certain activities related to the Fund, including educational trainingprograms, conferences, the development of technology platforms and reportingsystems, or other services related to the sale or promotion of the Fund. Thesepayments may create a conflict of interest by influencing the broker-dealer orother intermediary and your salesperson to recommend the Fund over anotherinvestment. Ask your salesperson or visit your financial intermediary’s websitefor more information.
Fund Summaries
XLF
30

Investment ObjectiveThe Health Care Select Sector SPDR Fund (the “Fund”) seeks to provide investmentresults that, before expenses, correspond generally to the price and yieldperformance of publicly traded equity securities of companies in the Health CareSelect Sector Index (the “Index”).
Fees and Expenses of the FundThe table below describes the fees and expenses that you may pay if you buyand hold shares of the Fund (“Fund Shares”). This table and the Example belowreflect the expenses of the Fund and do not reflect brokerage commissions youmay pay on purchases and sales of Fund Shares.
Annual Fund Operating Expenses
(expenses that you pay each year as a percentage of the value of yourinvestment):
Management fees . . . . . . . . . . . . . . . . . . . . . . . . . . . . . . . . . . . . 0.04%Distribution and service (12b-1) fees . . . . . . . . . . . . . . . . . . . . 0.04%Other expenses . . . . . . . . . . . . . . . . . . . . . . . . . . . . . . . . . . . . . . 0.06%Total annual fund operating expenses . . . . . . . . . . . . . . . . . 0.14%
Example:This Example is intended to help you compare the cost of investing in the Fundwith the cost of investing in other mutual funds. The Example does not take intoaccount customary brokerage commissions that you pay when purchasing or sellingFund Shares in the secondary market. The Example assumes that you invest $10,000in the Fund for the time periods indicated, and then sell all of your Fund Sharesat the end of those periods. The Example also assumes that your investmenthas a 5% return each year and that the Fund’s operating expenses remain thesame. Although your actual costs may be higher or lower, based on theseassumptions your costs would be:
Year 1 Year 3 Year 5 Year 10$14 $45 $79 $179
Fund Summaries
The Health Care Select Sector SPDR Fund
XLV
31

Portfolio Turnover:The Fund pays transaction costs, such as commissions, when it buys and sellssecurities (or “turns over” its portfolio). A higher portfolio turnover rate may indicatehigher transaction costs and may result in higher taxes when Fund Shares areheld in a taxable account. These costs, which are not reflected in Annual FundOperating Expenses or in the Example, affect the Fund’s performance. Duringthe most recent fiscal year, the Fund’s portfolio turnover rate was 8% of the averagevalue of its portfolio.
The Fund’s Principal Investment StrategyIn seeking to track the performance of the Index, the Fund employs a replicationstrategy, which means that the Fund typically invests in substantially all of thesecurities represented in the Index in approximately the same proportions asthe Index.
Under normal market conditions, the Fund generally invests substantially all, butat least 95%, of its total assets in the securities comprising the Index. The Fundwill provide shareholders with at least 60 days’ notice prior to any material changein this 95% investment policy. In addition, the Fund may invest in cash and cashequivalents or money market instruments, such as repurchase agreements andmoney market funds (including money market funds advised by SSGA FundsManagement, Inc. (“SSGA FM” or the “Adviser”), the investment adviser to theFund).
The Index includes securities of companies from the following industries:pharmaceuticals; health care equipment and supplies; health care providers andservices; biotechnology; life sciences tools and services; and health care technology.The Index is one of ten Select Sector Indexes developed and maintained inaccordance with the following criteria: (1) each of the component securities inthe Index is a constituent company of the S&P 500 Index; and (2) the Index iscalculated by S&P Dow Jones Indices LLC (“S&P DJI”) based on methodologyproprietary to S&P DJI and BofA Merrill Lynch Research (“BofA Merrill Lynch”)(S&P DJI and BofA Merrill Lynch, collectively, the “Index Provider”) using a “modifiedmarket capitalization” methodology, which means that modifications may be made
Fund Summaries
XLV
32

to the market capitalization weights of single stock concentrations in order toconform to the requirements of the Internal Revenue Code of 1986, as amended(the “Internal Revenue Code” or “IRC”). As of November 30, 2016, the Indexwas composed of 59 stocks.
The Index is sponsored by the Index Provider and compiled by S&P DJI (the“Index Compilation Agent”). Neither entity is affiliated with the Fund or the Adviser.The Index Compilation Agent determines the composition of the Index and relativeweightings of the securities in the Index based on the Index methodology. TheIndex Provider publishes information regarding the market value of the Index.
Principal Risks of Investing in the FundAs with all investments, there are certain risks of investing in the Fund. FundShares will change in value, and you could lose money by investing in the Fund.An investment in the Fund is not insured or guaranteed by the Federal DepositInsurance Corporation or any other government agency.
Passive Strategy/Index Risk: The Fund is managed with a passive investmentstrategy, attempting to track the performance of an unmanaged index ofsecurities, regardless of the current or projected performance of the Indexor of the actual securities comprising the Index. This differs from anactively-managed fund, which typically seeks to outperform a benchmarkindex. As a result, the Fund’s performance may be less favorable than thatof a portfolio managed using an active investment strategy. The structureand composition of the Index will affect the performance, volatility, andrisk of the Index and, consequently, the performance, volatility, and risk ofthe Fund.
Index Tracking Risk: While the Adviser seeks to track the performance ofthe Index as closely as possible (i.e., achieve a high degree of correlationwith the Index), the Fund’s return may not match or achieve a high degreeof correlation with the return of the Index due to operating expenses,transaction costs, cash flows, regulatory requirements and operationalinefficiencies. For example, the Adviser anticipates that it may take severalbusiness days for additions and deletions to the Index to be reflected inthe portfolio composition of the Fund.
Fund Summaries
XLV
33
Health Care Sector Risk: The Fund’s assets will be concentrated in thehealth care sector, which means the Fund will be more affected by theperformance of the health care sector than a fund that is more diversified.Companies in the health care sector are subject to extensive governmentregulation and their profitability can be significantly affected by restrictionson government reimbursement for medical expenses, rising costs of medicalproducts and services, pricing pressure (including price discounting), limitedproduct lines and an increased emphasis on the delivery of healthcare throughoutpatient services. Companies in the health care sector are heavily dependenton obtaining and defending patents, which may be time consuming andcostly, and the expiration of patents may also adversely affect the profitabilityof these companies. Health care companies are also subject to extensivelitigation based on product liability and similar claims. In addition, theirproducts can become obsolete due to industry innovation, changes intechnologies or other market developments. Many new products in thehealth care sector require significant research and development and maybe subject to regulatory approvals, all of which may be time consumingand costly with no guarantee that any product will come to market.
Equity Investing Risk: The market prices of equity securities owned by theFund may go up or down, sometimes rapidly or unpredictably. The valueof a security may decline for a number of reasons that may directly relateto the issuer and also may decline due to general industry or market conditionsthat are not specifically related to a particular company. In addition, equitymarkets tend to move in cycles, which may cause stock prices to fall overshort or extended periods of time.
Non-Diversification Risk: As a “non-diversified” fund, the Fund may holda smaller number of portfolio securities than many other funds. To the extentthe Fund invests in a relatively small number of issuers, a decline in themarket value of a particular security held by the Fund may affect its valuemore than if it invested in a larger number of issuers. The value of FundShares may be more volatile than the values of shares of more diversifiedfunds.
Fund Summaries
XLV
34
Large-Capitalization Securities Risk: Returns on investments in securitiesof large companies could trail the returns on investments in securities ofsmaller andmid-sizedcompanies. Largercompaniesmaybeunable to respondas quickly as smaller and mid-sized companies to competitive challengesor to changes in business, product, financial, or market conditions. Largercompanies may not be able to maintain growth at the high rates that maybe achieved by well-managed smaller and mid-sized companies.
Market Risk: The Fund’s investments are subject to changes in generaleconomic conditions, and general market fluctuations and the risks inherentin investment in securities markets. Investment markets can be volatile andprices of investments can change substantially due to various factors including,but not limited to, economic growth or recession, changes in interest rates,changes in the actual or perceived creditworthiness of issuers, and generalmarket liquidity. The Fund is subject to the risk that geopolitical events willdisrupt securities markets and adversely affect global economies and markets.
Fund PerformanceThe following bar chart and table provide an indication of the risks of investingin the Fund by showing changes in the Fund’s performance from year to yearand by showing how the Fund’s average annual returns for certain time periodscompare with the average annual returns of the Index, and the S&P 500 Index.The S&P 500 Index is a well-known, broad-based securities market index thatincludes common stocks of approximately 500 companies from a number of sectorsrepresenting a significant portion of the market value of all stocks publicly tradedin the United States. The Fund’s past performance (before and after taxes) is notnecessarily an indication of how the Fund will perform in the future. Updatedperformance information is available by calling 1-866-732-8673 or visiting ourwebsite at www.sectorspdrs.com.
Fund Summaries
XLV
35
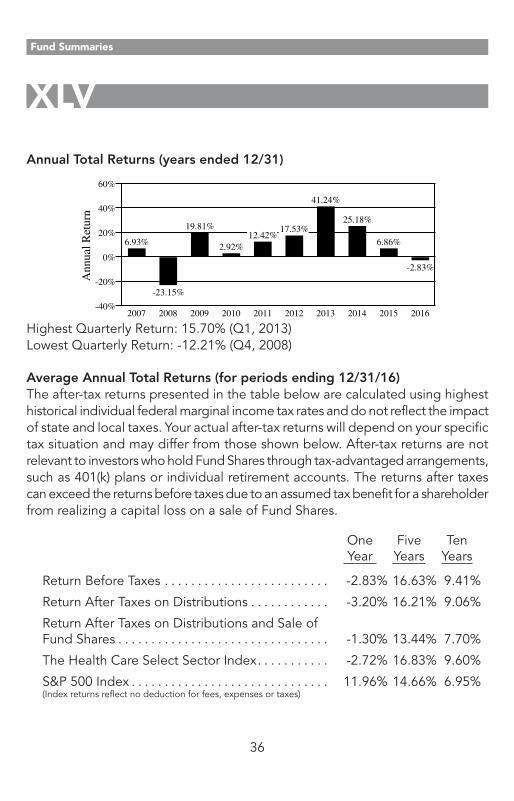
Annual Total Returns (years ended 12/31)
-40%
-20%
0%
20%
40%
60%
2007
6.93%
2008
-23.15%
2009
19.81%
2010
2.92%
2011
12.42%
2012
17.53%
2013
41.24%
2014
25.18%
2015
6.86%
2016
-2.83%
Ann
ual R
etur
n
Highest Quarterly Return: 15.70% (Q1, 2013)Lowest Quarterly Return: -12.21% (Q4, 2008)
Average Annual Total Returns (for periods ending 12/31/16)The after-tax returns presented in the table below are calculated using highesthistorical individual federal marginal income tax rates and do not reflect the impactof state and local taxes. Your actual after-tax returns will depend on your specifictax situation and may differ from those shown below. After-tax returns are notrelevant to investors who hold Fund Shares through tax-advantaged arrangements,such as 401(k) plans or individual retirement accounts. The returns after taxescan exceed the returns before taxes due to an assumed tax benefit for a shareholderfrom realizing a capital loss on a sale of Fund Shares.
OneYear
FiveYears
TenYears
Return Before Taxes . . . . . . . . . . . . . . . . . . . . . . . . . -2.83% 16.63% 9.41%
Return After Taxes on Distributions . . . . . . . . . . . . -3.20% 16.21% 9.06%
Return After Taxes on Distributions and Sale ofFund Shares . . . . . . . . . . . . . . . . . . . . . . . . . . . . . . . . -1.30% 13.44% 7.70%
The Health Care Select Sector Index. . . . . . . . . . . -2.72% 16.83% 9.60%
S&P 500 Index . . . . . . . . . . . . . . . . . . . . . . . . . . . . . . 11.96% 14.66% 6.95%(Index returns reflect no deduction for fees, expenses or taxes)
Fund Summaries
XLV
36
Portfolio Management
Investment AdviserSSGA FM serves as the investment adviser to the Fund.
Portfolio ManagersThe professionals primarily responsible for the day-to-day management of theFund are Michael Feehily, Karl Schneider and Dwayne Hancock.
Michael Feehily, CFA, is a Senior Managing Director of the Adviser and the Headof Global Equity Beta Solutions in the Americas. He worked at the Adviser from1997 to 2006 and rejoined in 2010.
Karl Schneider, CAIA, is a Vice President of the Adviser and Deputy Head ofGlobal Equity Beta Solutions in the Americas. He joined the Adviser in 1997.
Dwayne Hancock, CFA, is a Vice President of the Adviser and a Senior PortfolioManager in the Global Equity Beta Solutions Group. He joined the Adviser in1996.
Purchase and Sale InformationThe Fund will issue (or redeem) Fund Shares to certain institutional investors (typicallymarket makers or other broker-dealers) only in large blocks of 50,000 Fund Sharesknown as “Creation Units.” Creation Unit transactions are typically conductedin exchange for the deposit or delivery of in-kind securities and/or cash constitutinga substantial replication, or a representation, of the securities included in theFund’s benchmark Index.
Individual Fund Shares may only be purchased and sold on the NYSE Arca, Inc.(the “Exchange”), other national securities exchanges, electronic crossing networksand other alternative trading systems through your broker-dealer at market prices.Because Fund Shares trade at market prices rather than at net asset value (“NAV”),Fund Shares may trade at a price greater than NAV (premium) or less than NAV(discount).
Fund Summaries
XLV
37

Tax InformationThe Fund’s distributions are expected to be taxed as ordinary income, qualifieddividend income and/or capital gains, unless you are investing through atax-advantaged arrangement, such as a 401(k) plan or individual retirement account.Any withdrawals made from such tax-advantaged arrangement may be taxableto you.
Payments to Broker-Dealers and Other FinancialIntermediariesIf you purchase Fund Shares through a broker-dealer or other financial intermediary(such as a bank), the Adviser, the Distributor or their affiliates may pay the financialintermediary for certain activities related to the Fund, including educational trainingprograms, conferences, the development of technology platforms and reportingsystems, or other services related to the sale or promotion of the Fund. Thesepayments may create a conflict of interest by influencing the broker-dealer orother intermediary and your salesperson to recommend the Fund over anotherinvestment. Ask your salesperson or visit your financial intermediary’s websitefor more information.
Fund Summaries
XLV
38

Investment ObjectiveThe Industrial Select Sector SPDR Fund (the “Fund”) seeks to provide investmentresults that, before expenses, correspond generally to the price and yieldperformance of publicly traded equity securities of companies in the IndustrialSelect Sector Index (the “Index”).
Fees and Expenses of the FundThe table below describes the fees and expenses that you may pay if you buyand hold shares of the Fund (“Fund Shares”). This table and the Example belowreflect the expenses of the Fund and do not reflect brokerage commissions youmay pay on purchases and sales of Fund Shares.
Annual Fund Operating Expenses
(expenses that you pay each year as a percentage of the value of yourinvestment):
Management fees . . . . . . . . . . . . . . . . . . . . . . . . . . . . . . . . . . . . 0.04%Distribution and service (12b-1) fees . . . . . . . . . . . . . . . . . . . . 0.04%Other expenses . . . . . . . . . . . . . . . . . . . . . . . . . . . . . . . . . . . . . . 0.06%Total annual fund operating expenses . . . . . . . . . . . . . . . . . 0.14%
Example:This Example is intended to help you compare the cost of investing in the Fundwith the cost of investing in other mutual funds. The Example does not take intoaccount customary brokerage commissions that you pay when purchasing or sellingFund Shares in the secondary market. The Example assumes that you invest $10,000in the Fund for the time periods indicated, and then sell all of your Fund Sharesat the end of those periods. The Example also assumes that your investmenthas a 5% return each year and that the Fund’s operating expenses remain thesame. Although your actual costs may be higher or lower, based on theseassumptions your costs would be:
Year 1 Year 3 Year 5 Year 10$14 $45 $79 $179
Fund Summaries
The Industrial Select Sector SPDR Fund
XLI
39

Portfolio Turnover:The Fund pays transaction costs, such as commissions, when it buys and sellssecurities (or “turns over” its portfolio). A higher portfolio turnover rate may indicatehigher transaction costs and may result in higher taxes when Fund Shares areheld in a taxable account. These costs, which are not reflected in Annual FundOperating Expenses or in the Example, affect the Fund’s performance. Duringthe most recent fiscal year, the Fund’s portfolio turnover rate was 12% of theaverage value of its portfolio.
The Fund’s Principal Investment StrategyIn seeking to track the performance of the Index, the Fund employs a replicationstrategy, which means that the Fund typically invests in substantially all of thesecurities represented in the Index in approximately the same proportions asthe Index.
Under normal market conditions, the Fund generally invests substantially all, butat least 95%, of its total assets in the securities comprising the Index. The Fundwill provide shareholders with at least 60 days’ notice prior to any material changein this 95% investment policy. In addition, the Fund may invest in cash and cashequivalents or money market instruments, such as repurchase agreements andmoney market funds (including money market funds advised by SSGA FundsManagement, Inc. (“SSGA FM” or the “Adviser”), the investment adviser to theFund).
The Index includes securities of companies from the following industries: aerospaceand defense; industrial conglomerates; marine; transportation infrastructure;machinery; road and rail; air freight and logistics; commercial services and supplies;professional services; electrical equipment; construction and engineering; tradingcompanies and distributors; airlines; and building products. The Index is one often Select Sector Indexes developed and maintained in accordance with thefollowing criteria: (1) each of the component securities in the Index is a constituentcompany of the S&P 500 Index; and (2) the Index is calculated by S&P Dow JonesIndices LLC (“S&P DJI”) based on methodology proprietary to S&P DJI and BofAMerrill Lynch Research (“BofA Merrill Lynch”) (S&P DJI and BofA Merrill Lynch,collectively, the “Index Provider”) using a “modified market capitalization”methodology, which means that modifications may be made to the market
Fund Summaries
XLI
40
capitalization weights of single stock concentrations in order to conform to therequirements of the Internal Revenue Code of 1986, as amended (the “InternalRevenue Code” or “IRC”). As of November 30, 2016, the Index was composedof 69 stocks.
The Index is sponsored by the Index Provider and compiled by S&P DJI (the“Index Compilation Agent”). Neither entity is affiliated with the Fund or the Adviser.The Index Compilation Agent determines the composition of the Index and relativeweightings of the securities in the Index based on the Index methodology. TheIndex Provider publishes information regarding the market value of the Index.
Principal Risks of Investing in the FundAs with all investments, there are certain risks of investing in the Fund. FundShares will change in value, and you could lose money by investing in the Fund.An investment in the Fund is not insured or guaranteed by the Federal DepositInsurance Corporation or any other government agency.
Passive Strategy/Index Risk: The Fund is managed with a passive investmentstrategy, attempting to track the performance of an unmanaged index ofsecurities, regardless of the current or projected performance of the Indexor of the actual securities comprising the Index. This differs from anactively-managed fund, which typically seeks to outperform a benchmarkindex. As a result, the Fund’s performance may be less favorable than thatof a portfolio managed using an active investment strategy. The structureand composition of the Index will affect the performance, volatility, andrisk of the Index and, consequently, the performance, volatility, and risk ofthe Fund.
Index Tracking Risk: While the Adviser seeks to track the performance ofthe Index as closely as possible (i.e., achieve a high degree of correlationwith the Index), the Fund’s return may not match or achieve a high degreeof correlation with the return of the Index due to operating expenses,transaction costs, cash flows, regulatory requirements and operationalinefficiencies. For example, the Adviser anticipates that it may take severalbusiness days for additions and deletions to the Index to be reflected inthe portfolio composition of the Fund.
Fund Summaries
XLI
41
Industrial Sector Risk: The Fund’s assets will be concentrated in the industrialsector, which means the Fund will be more affected by the performanceof the industrial sector than a fund that is more diversified. Industrial companiesare affected by supply and demand both for their specific product or serviceand for industrial sector products in general. Government regulation, worldevents, exchange rates and economic conditions, technological developmentsand liabilities for environmental damage and general civil liabilities will likewiseaffect the performance of these companies. Aerospace and defensecompanies, a component of the industrial sector, can be significantly affectedby government spending policies because companies involved in this industryrely, to a significant extent, on U.S. and foreign government demand fortheir products and services. Thus, the financial condition of, and investorinterest in, aerospace and defense companies are heavily influenced bygovernmental defense spending policies which are typically under pressurefrom efforts to control the U.S. (and other) government budgets. Transportationsecurities, a component of the industrial sector, are cyclical and have occasionalsharp price movements which may result from changes in the economy,fuel prices, labor agreements and insurance costs.
Equity Investing Risk: The market prices of equity securities owned by theFund may go up or down, sometimes rapidly or unpredictably. The valueof a security may decline for a number of reasons that may directly relateto the issuer and also may decline due to general industry or market conditionsthat are not specifically related to a particular company. In addition, equitymarkets tend to move in cycles, which may cause stock prices to fall overshort or extended periods of time.
Non-Diversification Risk: As a “non-diversified” fund, the Fund may holda smaller number of portfolio securities than many other funds. To the extentthe Fund invests in a relatively small number of issuers, a decline in themarket value of a particular security held by the Fund may affect its valuemore than if it invested in a larger number of issuers. The value of FundShares may be more volatile than the values of shares of more diversifiedfunds.
Fund Summaries
XLI
42
Large-Capitalization Securities Risk: Returns on investments in securitiesof large companies could trail the returns on investments in securities ofsmaller andmid-sizedcompanies. Largercompaniesmaybeunable to respondas quickly as smaller and mid-sized companies to competitive challengesor to changes in business, product, financial, or market conditions. Largercompanies may not be able to maintain growth at the high rates that maybe achieved by well-managed smaller and mid-sized companies.
Market Risk: The Fund’s investments are subject to changes in generaleconomic conditions, and general market fluctuations and the risks inherentin investment in securities markets. Investment markets can be volatile andprices of investments can change substantially due to various factors including,but not limited to, economic growth or recession, changes in interest rates,changes in the actual or perceived creditworthiness of issuers, and generalmarket liquidity. The Fund is subject to the risk that geopolitical events willdisrupt securities markets and adversely affect global economies and markets.
Fund PerformanceThe following bar chart and table provide an indication of the risks of investingin the Fund by showing changes in the Fund’s performance from year to yearand by showing how the Fund’s average annual returns for certain time periodscompare with the average annual returns of the Index, and the S&P 500 Index.The S&P 500 Index is a well-known, broad-based securities market index thatincludes common stocks of approximately 500 companies from a number of sectorsrepresenting a significant portion of the market value of all stocks publicly tradedin the United States. The Fund’s past performance (before and after taxes) is notnecessarily an indication of how the Fund will perform in the future. Updatedperformance information is available by calling 1-866-732-8673 or visiting ourwebsite at www.sectorspdrs.com.
Fund Summaries
XLI
43

Annual Total Returns (years ended 12/31)
-60%
-40%
-20%
0%
20%
40%
60%
2007
13.20%
2008
-38.88%
2009
22.63%
2010
27.65%
2011
-1.02%
2012
14.86%
2013
40.44%
2014
10.45%
2015
-4.25%
2016
19.95%
Ann
ual R
etur
n
Highest Quarterly Return: 20.98% (Q3, 2009)Lowest Quarterly Return: -23.21% (Q4, 2008)
Average Annual Total Returns (for periods ending 12/31/16)The after-tax returns presented in the table below are calculated using highesthistorical individual federal marginal income tax rates and do not reflect the impactof state and local taxes. Your actual after-tax returns will depend on your specifictax situation and may differ from those shown below. After-tax returns are notrelevant to investors who hold Fund Shares through tax-advantaged arrangements,such as 401(k) plans or individual retirement accounts. The returns after taxescan exceed the returns before taxes due to an assumed tax benefit for a shareholderfrom realizing a capital loss on a sale of Fund Shares.
OneYear
FiveYears
TenYears
Return Before Taxes . . . . . . . . . . . . . . . . . . . . . . . . . 19.95% 15.40% 8.17%
Return After Taxes on Distributions . . . . . . . . . . . . 19.23% 14.82% 7.72%
Return After Taxes on Distributions and Sale ofFund Shares . . . . . . . . . . . . . . . . . . . . . . . . . . . . . . . . 11.66% 12.32% 6.58%
The Industrial Select Sector Index . . . . . . . . . . . . . 20.13% 15.58% 8.35%
S&P 500 Index . . . . . . . . . . . . . . . . . . . . . . . . . . . . . . 11.96% 14.66% 6.95%(Index returns reflect no deduction for fees, expenses or taxes)
Fund Summaries
XLI
44

Portfolio Management
Investment AdviserSSGA FM serves as the investment adviser to the Fund.
Portfolio ManagersThe professionals primarily responsible for the day-to-day management of theFund are Michael Feehily, Karl Schneider and Emiliano Rabinovich.
Michael Feehily, CFA, is a Senior Managing Director of the Adviser and the Headof Global Equity Beta Solutions in the Americas. He worked at the Adviser from1997 to 2006 and rejoined in 2010.
Karl Schneider, CAIA, is a Vice President of the Adviser and Deputy Head ofGlobal Equity Beta Solutions in the Americas. He joined the Adviser in 1997.
Emiliano Rabinovich, CFA, is a Vice President of the Adviser and a Senior PortfolioManager in the Global Equity Beta Solutions Group. He joined the Adviser in2006.
Purchase and Sale InformationThe Fund will issue (or redeem) Fund Shares to certain institutional investors (typicallymarket makers or other broker-dealers) only in large blocks of 50,000 Fund Sharesknown as “Creation Units.” Creation Unit transactions are typically conductedin exchange for the deposit or delivery of in-kind securities and/or cash constitutinga substantial replication, or a representation, of the securities included in theFund’s benchmark Index.
Individual Fund Shares may only be purchased and sold on the NYSE Arca, Inc.(the “Exchange”), other national securities exchanges, electronic crossing networksand other alternative trading systems through your broker-dealer at market prices.Because Fund Shares trade at market prices rather than at net asset value (“NAV”),Fund Shares may trade at a price greater than NAV (premium) or less than NAV(discount).
Fund Summaries
XLI
45
Tax InformationThe Fund’s distributions are expected to be taxed as ordinary income, qualifieddividend income and/or capital gains, unless you are investing through atax-advantaged arrangement, such as a 401(k) plan or individual retirement account.Any withdrawals made from such tax-advantaged arrangement may be taxableto you.
Payments to Broker-Dealers and Other FinancialIntermediariesIf you purchase Fund Shares through a broker-dealer or other financial intermediary(such as a bank), the Adviser, the Distributor or their affiliates may pay the financialintermediary for certain activities related to the Fund, including educational trainingprograms, conferences, the development of technology platforms and reportingsystems, or other services related to the sale or promotion of the Fund. Thesepayments may create a conflict of interest by influencing the broker-dealer orother intermediary and your salesperson to recommend the Fund over anotherinvestment. Ask your salesperson or visit your financial intermediary’s websitefor more information.
Fund Summaries
XLI
46
Investment ObjectiveThe Materials Select Sector SPDR Fund (the “Fund”) seeks to provide investmentresults that, before expenses, correspond generally to the price and yieldperformance of publicly traded equity securities of companies in the MaterialsSelect Sector Index (the “Index”).
Fees and Expenses of the FundThe table below describes the fees and expenses that you may pay if you buyand hold shares of the Fund (“Fund Shares”). This table and the Example belowreflect the expenses of the Fund and do not reflect brokerage commissions youmay pay on purchases and sales of Fund Shares.
Annual Fund Operating Expenses
(expenses that you pay each year as a percentage of the value of yourinvestment):
Management fees . . . . . . . . . . . . . . . . . . . . . . . . . . . . . . . . . . . . 0.04%Distribution and service (12b-1) fees . . . . . . . . . . . . . . . . . . . . 0.04%Other expenses . . . . . . . . . . . . . . . . . . . . . . . . . . . . . . . . . . . . . . 0.06%Total annual fund operating expenses . . . . . . . . . . . . . . . . . 0.14%
Example:This Example is intended to help you compare the cost of investing in the Fundwith the cost of investing in other mutual funds. The Example does not take intoaccount customary brokerage commissions that you pay when purchasing or sellingFund Shares in the secondary market. The Example assumes that you invest $10,000in the Fund for the time periods indicated, and then sell all of your Fund Sharesat the end of those periods. The Example also assumes that your investmenthas a 5% return each year and that the Fund’s operating expenses remain thesame. Although your actual costs may be higher or lower, based on theseassumptions your costs would be:
Year 1 Year 3 Year 5 Year 10$14 $45 $79 $179
Fund Summaries
The Materials Select Sector SPDR Fund
XLB
47
Portfolio Turnover:The Fund pays transaction costs, such as commissions, when it buys and sellssecurities (or “turns over” its portfolio). A higher portfolio turnover rate may indicatehigher transaction costs and may result in higher taxes when Fund Shares areheld in a taxable account. These costs, which are not reflected in Annual FundOperating Expenses or in the Example, affect the Fund’s performance. Duringthe most recent fiscal year, the Fund’s portfolio turnover rate was 16% of theaverage value of its portfolio.
The Fund’s Principal Investment StrategyIn seeking to track the performance of the Index, the Fund employs a replicationstrategy, which means that the Fund typically invests in substantially all of thesecurities represented in the Index in approximately the same proportions asthe Index.
Under normal market conditions, the Fund generally invests substantially all, butat least 95%, of its total assets in the securities comprising the Index. The Fundwill provide shareholders with at least 60 days’ notice prior to any material changein this 95% investment policy. In addition, the Fund may invest in cash and cashequivalents or money market instruments, such as repurchase agreements andmoney market funds (including money market funds advised by SSGA FundsManagement, Inc. (“SSGA FM” or the “Adviser”), the investment adviser to theFund).
The Index includes securities of companies from the following industries: chemicals;metals and mining; paper and forest products; containers and packaging; andconstruction materials. The Index is one of ten Select Sector Indexes developedand maintained in accordance with the following criteria: (1) each of the componentsecurities in the Index is a constituent company of the S&P 500 Index; and (2)the Index is calculated by S&P Dow Jones Indices LLC (“S&P DJI”) based onmethodology proprietary to S&P DJI and BofA Merrill Lynch Research (“BofAMerrill Lynch”) (S&P DJI and BofA Merrill Lynch, collectively, the “Index Provider”)using a “modified market capitalization” methodology, which means thatmodifications may be made to the market capitalization weights of single stockconcentrations in order to conform to the requirements of the Internal RevenueCode of 1986, as amended (the “Internal Revenue Code” or “IRC”). As of November30, 2016, the Index was composed of 26 stocks.
Fund Summaries
XLB
48

The Index is sponsored by the Index Provider and compiled by S&P DJI (the“Index Compilation Agent”). Neither entity is affiliated with the Fund or the Adviser.The Index Compilation Agent determines the composition of the Index and relativeweightings of the securities in the Index based on the Index methodology. TheIndex Provider publishes information regarding the market value of the Index.
Principal Risks of Investing in the FundAs with all investments, there are certain risks of investing in the Fund. FundShares will change in value, and you could lose money by investing in the Fund.An investment in the Fund is not insured or guaranteed by the Federal DepositInsurance Corporation or any other government agency.
Passive Strategy/Index Risk: The Fund is managed with a passive investmentstrategy, attempting to track the performance of an unmanaged index ofsecurities, regardless of the current or projected performance of the Indexor of the actual securities comprising the Index. This differs from anactively-managed fund, which typically seeks to outperform a benchmarkindex. As a result, the Fund’s performance may be less favorable than thatof a portfolio managed using an active investment strategy. The structureand composition of the Index will affect the performance, volatility, andrisk of the Index and, consequently, the performance, volatility, and risk ofthe Fund.
Index Tracking Risk: While the Adviser seeks to track the performance ofthe Index as closely as possible (i.e., achieve a high degree of correlationwith the Index), the Fund’s return may not match or achieve a high degreeof correlation with the return of the Index due to operating expenses,transaction costs, cash flows, regulatory requirements and operationalinefficiencies. For example, the Adviser anticipates that it may take severalbusiness days for additions and deletions to the Index to be reflected inthe portfolio composition of the Fund.
Materials Sector Risk: The Fund’s assets will be concentrated in the materialssector, which means the Fund will be more affected by the performanceof the materials sector than a fund that is more diversified. Many materialscompanies are significantly affected by the level and volatility of commodityprices, exchange rates, import controls, worldwide competition, environmental
Fund Summaries
XLB
49
policies and consumer demand. At times, worldwide production of industrialmaterials has exceeded demand as a result of over-building or economicdownturns, leading to poor investment returns or losses. Other risks mayinclude liabilities for environmental damage and general civil liabilities,depletion of resources, and mandated expenditures for safety and pollutioncontrol. The materials sector may also be affected by economic cycles,technical progress, labor relations, and government regulations.
Equity Investing Risk: The market prices of equity securities owned by theFund may go up or down, sometimes rapidly or unpredictably. The valueof a security may decline for a number of reasons that may directly relateto the issuer and also may decline due to general industry or market conditionsthat are not specifically related to a particular company. In addition, equitymarkets tend to move in cycles, which may cause stock prices to fall overshort or extended periods of time.
Non-Diversification Risk: As a “non-diversified” fund, the Fund may holda smaller number of portfolio securities than many other funds. To the extentthe Fund invests in a relatively small number of issuers, a decline in themarket value of a particular security held by the Fund may affect its valuemore than if it invested in a larger number of issuers. The value of FundShares may be more volatile than the values of shares of more diversifiedfunds.
Large-Capitalization Securities Risk: Returns on investments in securitiesof large companies could trail the returns on investments in securities ofsmaller andmid-sizedcompanies. Largercompaniesmaybeunable to respondas quickly as smaller and mid-sized companies to competitive challengesor to changes in business, product, financial, or market conditions. Largercompanies may not be able to maintain growth at the high rates that maybe achieved by well-managed smaller and mid-sized companies.
Market Risk: The Fund’s investments are subject to changes in generaleconomic conditions, and general market fluctuations and the risks inherentin investment in securities markets. Investment markets can be volatile andprices of investments can change substantially due to various factors including,but not limited to, economic growth or recession, changes in interest rates,changes in the actual or perceived creditworthiness of issuers, and general
Fund Summaries
XLB
50

market liquidity. The Fund is subject to the risk that geopolitical events willdisrupt securities markets and adversely affect global economies and markets.
Fund PerformanceThe following bar chart and table provide an indication of the risks of investingin the Fund by showing changes in the Fund’s performance from year to yearand by showing how the Fund’s average annual returns for certain time periodscompare with the average annual returns of the Index, and the S&P 500 Index.The S&P 500 Index is a well-known, broad-based securities market index thatincludes common stocks of approximately 500 companies from a number of sectorsrepresenting a significant portion of the market value of all stocks publicly tradedin the United States. The Fund’s past performance (before and after taxes) is notnecessarily an indication of how the Fund will perform in the future. Updatedperformance information is available by calling 1-866-732-8673 or visiting ourwebsite at www.sectorspdrs.com.
Annual Total Returns (years ended 12/31)
-80%
-60%
-40%
-20%
0%
20%
40%
60%
80%
2007
21.98%
2008
-43.99%
2009
48.47%
2010
20.40%
2011
-10.97%
2012
14.74%
2013
25.83%
2014
7.31%
2015
-8.58%
2016
16.66%
Ann
ual R
etur
n
Highest Quarterly Return: 20.62% (Q3, 2009)Lowest Quarterly Return: -30.50% (Q4, 2008)
Average Annual Total Returns (for periods ending 12/31/16)The after-tax returns presented in the table below are calculated using highesthistorical individual federal marginal income tax rates and do not reflect the impactof state and local taxes. Your actual after-tax returns will depend on your specifictax situation and may differ from those shown below. After-tax returns are notrelevant to investors who hold Fund Shares through tax-advantaged arrangements,
Fund Summaries
XLB
51
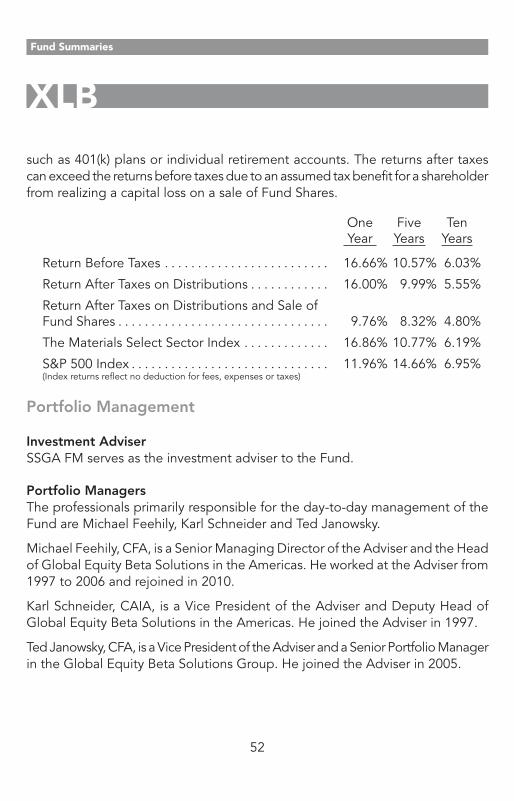
such as 401(k) plans or individual retirement accounts. The returns after taxescan exceed the returns before taxes due to an assumed tax benefit for a shareholderfrom realizing a capital loss on a sale of Fund Shares.
OneYear
FiveYears
TenYears
Return Before Taxes . . . . . . . . . . . . . . . . . . . . . . . . . 16.66% 10.57% 6.03%
Return After Taxes on Distributions . . . . . . . . . . . . 16.00% 9.99% 5.55%
Return After Taxes on Distributions and Sale ofFund Shares . . . . . . . . . . . . . . . . . . . . . . . . . . . . . . . . 9.76% 8.32% 4.80%
The Materials Select Sector Index . . . . . . . . . . . . . 16.86% 10.77% 6.19%
S&P 500 Index . . . . . . . . . . . . . . . . . . . . . . . . . . . . . . 11.96% 14.66% 6.95%(Index returns reflect no deduction for fees, expenses or taxes)
Portfolio Management
Investment AdviserSSGA FM serves as the investment adviser to the Fund.
Portfolio ManagersThe professionals primarily responsible for the day-to-day management of theFund are Michael Feehily, Karl Schneider and Ted Janowsky.
Michael Feehily, CFA, is a Senior Managing Director of the Adviser and the Headof Global Equity Beta Solutions in the Americas. He worked at the Adviser from1997 to 2006 and rejoined in 2010.
Karl Schneider, CAIA, is a Vice President of the Adviser and Deputy Head ofGlobal Equity Beta Solutions in the Americas. He joined the Adviser in 1997.
Ted Janowsky, CFA, is a Vice President of the Adviser and a Senior Portfolio Managerin the Global Equity Beta Solutions Group. He joined the Adviser in 2005.
Fund Summaries
XLB
52
Purchase and Sale InformationThe Fund will issue (or redeem) Fund Shares to certain institutional investors (typicallymarket makers or other broker-dealers) only in large blocks of 50,000 Fund Sharesknown as “Creation Units.” Creation Unit transactions are typically conductedin exchange for the deposit or delivery of in-kind securities and/or cash constitutinga substantial replication, or a representation, of the securities included in theFund’s benchmark Index.
Individual Fund Shares may only be purchased and sold on the NYSE Arca, Inc.(the “Exchange”), other national securities exchanges, electronic crossing networksand other alternative trading systems through your broker-dealer at market prices.Because Fund Shares trade at market prices rather than at net asset value (“NAV”),Fund Shares may trade at a price greater than NAV (premium) or less than NAV(discount).
Tax InformationThe Fund’s distributions are expected to be taxed as ordinary income, qualifieddividend income and/or capital gains, unless you are investing through atax-advantaged arrangement, such as a 401(k) plan or individual retirement account.Any withdrawals made from such tax-advantaged arrangement may be taxableto you.
Payments to Broker-Dealers and Other FinancialIntermediariesIf you purchase Fund Shares through a broker-dealer or other financial intermediary(such as a bank), the Adviser, the Distributor or their affiliates may pay the financialintermediary for certain activities related to the Fund, including educational trainingprograms, conferences, the development of technology platforms and reportingsystems, or other services related to the sale or promotion of the Fund. Thesepayments may create a conflict of interest by influencing the broker-dealer orother intermediary and your salesperson to recommend the Fund over anotherinvestment. Ask your salesperson or visit your financial intermediary’s websitefor more information.
Fund Summaries
XLB
53
Investment ObjectiveThe Real Estate Select Sector SPDR Fund (the “Fund”) seeks to provide investmentresults that, before expenses, correspond generally to the price and yieldperformance of publicly traded equity securities of companies in the RealEstate Select Sector Index (the “Index”).
Fees and Expenses of the FundThe table below describes the fees and expenses that you may pay if you buyand hold shares of the Fund (“Fund Shares”). This table and the Example belowreflect the expenses of the Fund and do not reflect brokerage commissions youmay pay on purchases and sales of Fund Shares.
Annual Fund Operating Expenses
(expenses that you pay each year as a percentage of the value of yourinvestment):
Management fees . . . . . . . . . . . . . . . . . . . . . . . . . . . . . . . . . . . 0.04%Distribution and service (12b-1) fees . . . . . . . . . . . . . . . . . . . 0.04%Other expenses . . . . . . . . . . . . . . . . . . . . . . . . . . . . . . . . . . . . . 0.08%Total annual fund operating expenses . . . . . . . . . . . . . . . . 0.16%Less contractual fee waiver1 . . . . . . . . . . . . . . . . . . . . . . . . . . . -0.02%Net annual fund operating expenses . . . . . . . . . . . . . . . . . 0.14%
1 SSGA Funds Management, Inc. (the “Adviser”) has contractually agreed to waive its advisoryfee and reimburse certain expenses, until January 31, 2018, so that the annual Fund operatingexpenses of the Fund are limited to no more than 0.14% of the Fund’s average daily net assets(exclusive of non-recurring account fees and extraordinary expenses). The Adviser may continuesuch waiver and/or reimbursement from year to year, but there is no guarantee that the Adviserwill do so after January 31, 2018. The waiver and/or reimbursement may not be terminated priorto January 31, 2018 except with the approval of The Select Sector SPDR Trust’s Board of Trustees.
Example:This Example is intended to help you compare the cost of investing in the Fundwith the cost of investing in other mutual funds. The Example does not take intoaccount customary brokerage commissions that you pay when purchasing or sellingFund Shares in the secondary market. The Example assumes that you invest $10,000
Fund Summaries
The Real Estate Select Sector SPDR Fund
XLRE
54

in the Fund for the time periods indicated, and then sell all of your Fund Sharesat the end of those periods. The Example also assumes that your investmenthas a 5% return each year and that the Fund’s operating expenses remain thesame. The calculation of costs for the one-year period takes into account theeffect of any current contractual fee waivers and/or reimbursements; and thecalculation of costs for the remaining periods takes such fee waivers and/orreimbursements into account only for the first year of each such period. Althoughyour actual costs may be higher or lower, based on these assumptions your costswould be:
Year 1 Year 3 Year 5 Year 10$14 $50 $88 $203
Portfolio Turnover:The Fund pays transaction costs, such as commissions, when it buys and sellssecurities (or “turns over” its portfolio). A higher portfolio turnover rate may indicatehigher transaction costs and may result in higher taxes when Fund Shares areheld in a taxable account. These costs, which are not reflected in Annual FundOperating Expenses or in the Example, affect the Fund’s performance. Fromthe Fund’s commencement of operations on October 8, 2015 to the most recentfiscal year end, the Fund’s portfolio turnover rate was 5% of the average valueof its portfolio.
The Fund’s Principal Investment StrategyIn seeking to track the performance of the Index, the Fund employs a replicationstrategy, which means that the Fund typically invests in substantially all of thesecurities represented in the Index in approximately the same proportions asthe Index.
Under normal market conditions, the Fund generally invests substantially all, butat least 95%, of its total assets in the securities comprising the Index. The Fundwill provide shareholders with at least 60 days’ notice prior to any material changein this 95% investment policy. In addition, the Fund may invest in cash and cash
Fund Summaries
XLRE
55
equivalents or money market instruments, such as repurchase agreements andmoney market funds (including money market funds advised by SSGA FundsManagement, Inc. (“SSGA FM” or the “Adviser”), the investment adviser to theFund).
The Index includes securities of companies from the following industries: realestate management and development and REITs, excluding mortgage REITs.The Index is one of ten Select Sector Indexes developed and maintained inaccordance with the following criteria: (1) each of the component securities inthe Index is a constituent company of the S&P 500 Index; and (2) the Index iscalculated by S&P Dow Jones Indices LLC (“S&P DJI”) based on methodologyproprietary to S&P DJI and BofA Merrill Lynch Research (“BofA Merrill Lynch”)(S&P DJI and BofA Merrill Lynch, collectively, the “Index Provider”) using a “modifiedmarket capitalization” methodology, which means that modifications may be madeto the market capitalization weights of single stock concentrations in order toconform to the requirements of the Internal Revenue Code of 1986, as amended(the “Internal Revenue Code” or “IRC”). As of November 30, 2016, the Indexwas composed of 28 stocks.
The Index is sponsored by the Index Provider and compiled by S&P DJI (the“Index Compilation Agent”). Neither entity is affiliated with the Fund or the Adviser.The Index Compilation Agent determines the composition of the Index and relativeweightings of the securities in the Index based on the Index methodology. TheIndex Provider publishes information regarding the market value of the Index.
Principal Risks of Investing in the FundAs with all investments, there are certain risks of investing in the Fund. FundShares will change in value, and you could lose money by investing in the Fund.An investment in the Fund is not insured or guaranteed by the Federal DepositInsurance Corporation or any other government agency.
Passive Strategy/Index Risk: The Fund is managed with a passive investmentstrategy, attempting to track the performance of an unmanaged index ofsecurities, regardless of the current or projected performance of the Indexor of the actual securities comprising the Index. This differs from anactively-managed fund, which typically seeks to outperform a benchmarkindex. As a result, the Fund’s performance may be less favorable than that
Fund Summaries
XLRE
56

of a portfolio managed using an active investment strategy. The structureand composition of the Index will affect the performance, volatility, andrisk of the Index and, consequently, the performance, volatility, and risk ofthe Fund.
Index Tracking Risk: While the Adviser seeks to track the performance ofthe Index as closely as possible (i.e., achieve a high degree of correlationwith the Index), the Fund’s return may not match or achieve a high degreeof correlation with the return of the Index due to operating expenses,transaction costs, cash flows, regulatory requirements and operationalinefficiencies. For example, the Adviser anticipates that it may take severalbusiness days for additions and deletions to the Index to be reflected inthe portfolio composition of the Fund.
Real Estate Sector Risk: The Fund’s assets will be concentrated in the realestate sector, which means the Fund will be more affected by the performanceof the real estate sector than a fund that is more diversified. An investmentin a real property company may be subject to risks similar to those associatedwith direct ownership of real estate, including, by way of example, thepossibility of declines in the value of real estate, losses from casualty orcondemnation, and changes in local and general economic conditions, supplyand demand, interest rates, environmental liability, zoning laws, regulatorylimitations on rents, property taxes, and operating expenses. Some realproperty companies have limited diversification because they invest in alimited number of properties, a narrow geographic area, or a single typeof property.
REIT Risk: REITs are subject to the risks associated with investing in thesecurities of real property companies. In particular, REITs may be affectedby changes in the values of the underlying properties that they own or operate.Further, REITs are dependent upon specialized management skills, and theirinvestments may be concentrated in relatively few properties, or in a smallgeographic area or a single property type. REITs are also subject to heavycash flow dependency and, as a result, are particularly reliant on the properfunctioning of capital markets. A variety of economic and other factors mayadversely affect a lessee’s ability to meet its obligations to a REIT. In theevent of a default by a lessee, the REIT may experience delays in enforcing
Fund Summaries
XLRE
57
its rights as a lessor and may incur substantial costs associated in protectingits investments. In addition, a REIT could fail to qualify for favorable tax orregulatory treatment.
Equity Investing Risk: The market prices of equity securities owned by theFund may go up or down, sometimes rapidly or unpredictably. The valueof a security may decline for a number of reasons that may directly relateto the issuer and also may decline due to general industry or market conditionsthat are not specifically related to a particular company. In addition, equitymarkets tend to move in cycles, which may cause stock prices to fall overshort or extended periods of time.
Non-Diversification Risk: As a “non-diversified” fund, the Fund may holda smaller number of portfolio securities than many other funds. To the extentthe Fund invests in a relatively small number of issuers, a decline in themarket value of a particular security held by the Fund may affect its valuemore than if it invested in a larger number of issuers. The value of FundShares may be more volatile than the values of shares of more diversifiedfunds.
Large-Capitalization Securities Risk: Returns on investments in securitiesof large companies could trail the returns on investments in securities ofsmaller andmid-sizedcompanies. Largercompaniesmaybeunable to respondas quickly as smaller and mid-sized companies to competitive challengesor to changes in business, product, financial, or market conditions. Largercompanies may not be able to maintain growth at the high rates that maybe achieved by well-managed smaller and mid-sized companies.
Market Risk: The Fund’s investments are subject to changes in generaleconomic conditions, and general market fluctuations and the risks inherentin investment in securities markets. Investment markets can be volatile andprices of investments can change substantially due to various factors including,but not limited to, economic growth or recession, changes in interest rates,changes in the actual or perceived creditworthiness of issuers, and generalmarket liquidity. The Fund is subject to the risk that geopolitical events willdisrupt securities markets and adversely affect global economies and markets.
Fund Summaries
XLRE
58

Fund PerformanceThe following bar chart shows the Fund’s return for calendar year 2016. The followingtable provides an indication of the risks of investing in the Fund by showing howthe Fund’s average annual returns for certain time periods compare with the averageannual returns of the Index, and the S&P 500 Index. The S&P 500 Index is awell-known, broad-based securities market index that includes common stocksof approximately 500 companies from a number of sectors representing a significantportion of the market value of all stocks publicly traded in the United States. TheFund’s past performance (before and after taxes) is not necessarily an indicationof how the Fund will perform in the future. Updated performance informationis available by calling 1-866-732-8673 or visiting our website atwww.sectorspdrs.com.
Annual Total Return (year ended 12/31)
0%
0.5%
1.0%
1.5%
2.0%
2.5%
3.0%
3.5%
4.0%
2016
3.19%
Ann
ual R
etur
n
Highest Quarterly Return: 5.67% (Q2, 2016)Lowest Quarterly Return: -4.43% (Q4, 2016)
Average Annual Total Returns (for periods ending 12/31/16)The after-tax returns presented in the table below are calculated using highesthistorical individual federal marginal income tax rates and do not reflect the impactof state and local taxes. Your actual after-tax returns will depend on your specifictax situation and may differ from those shown below. After-tax returns are notrelevant to investors who hold Fund Shares through tax-advantaged arrangements,such as 401(k) plans or individual retirement accounts. The returns after taxescan exceed the returns before taxes due to an assumed tax benefit for a shareholderfrom realizing a capital loss on a sale of Fund Shares.
Fund Summaries
XLRE
59
OneYear
Since Inception10/07/2015
Return Before Taxes . . . . . . . . . . . . . . . . . . . . . . . 3.19% 6.36%
Return After Taxes on Distributions . . . . . . . . . . 1.37% 4.45%
Return After Taxes on Distributions and Saleof Fund Shares . . . . . . . . . . . . . . . . . . . . . . . . . . . . 1.81% 3.99%
The Real Estate Select Sector Index. . . . . . . . . . 3.30% 6.54%
S&P 500 Index . . . . . . . . . . . . . . . . . . . . . . . . . . . . 11.96% 12.16%(Index returns reflect no deduction for fees, expenses or taxes)
Portfolio Management
Investment AdviserSSGA FM serves as the investment adviser to the Fund.
Portfolio ManagersThe professionals primarily responsible for the day-to-day management of theFund are Michael Feehily, Karl Schneider and Amy Cheng.
Michael Feehily, CFA, is a Senior Managing Director of the Adviser and the Headof Global Equity Beta Solutions in the Americas. He worked at the Adviser from1997 to 2006 and rejoined in 2010.
Karl Schneider, CAIA, is a Vice President of the Adviser and Deputy Head ofGlobal Equity Beta Solutions in the Americas. He joined the Adviser in 1997.
Amy Cheng is a Vice President of the Adviser and a Senior Portfolio Managerin the Global Equity Beta Solutions Group. She joined the Adviser in 2000.
Fund Summaries
XLRE
60
Purchase and Sale InformationThe Fund will issue (or redeem) Fund Shares to certain institutional investors (typicallymarket makers or other broker-dealers) only in large blocks of 50,000 Fund Sharesknown as “Creation Units.” Creation Unit transactions are typically conductedin exchange for the deposit or delivery of in-kind securities and/or cash constitutinga substantial replication, or a representation, of the securities included in theFund’s benchmark Index.
Individual Fund Shares may only be purchased and sold on the NYSE Arca, Inc.(the “Exchange”), other national securities exchanges, electronic crossing networksand other alternative trading systems through your broker-dealer at market prices.Because Fund Shares trade at market prices rather than at net asset value (“NAV”),Fund Shares may trade at a price greater than NAV (premium) or less than NAV(discount).
Tax InformationThe Fund’s distributions are expected to be taxed as ordinary income, qualifieddividend income and/or capital gains, unless you are investing through atax-advantaged arrangement, such as a 401(k) plan or individual retirement account.Any withdrawals made from such tax-advantaged arrangement may be taxableto you.
Payments to Broker-Dealers and Other FinancialIntermediariesIf you purchase Fund Shares through a broker-dealer or other financial intermediary(such as a bank), the Adviser, the Distributor or their affiliates may pay the financialintermediary for certain activities related to the Fund, including educational trainingprograms, conferences, the development of technology platforms and reportingsystems, or other services related to the sale or promotion of the Fund. Thesepayments may create a conflict of interest by influencing the broker-dealer orother intermediary and your salesperson to recommend the Fund over anotherinvestment. Ask your salesperson or visit your financial intermediary’s websitefor more information.
Fund Summaries
XLRE
61
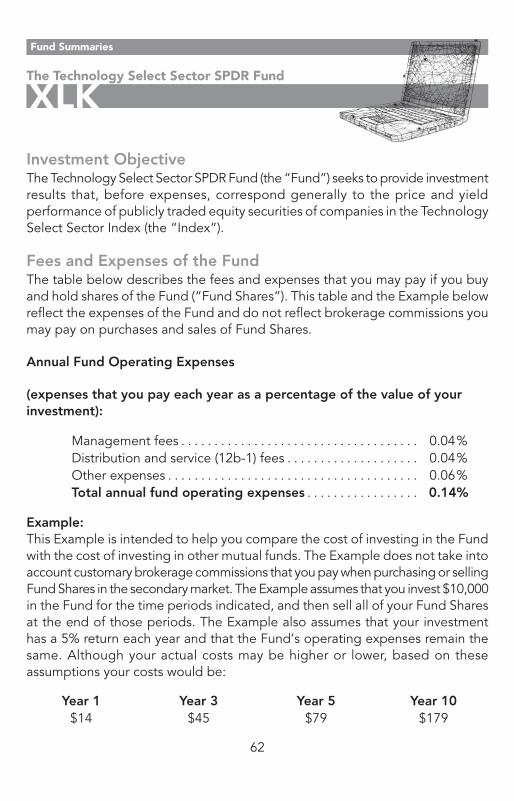
Investment ObjectiveThe Technology Select Sector SPDR Fund (the “Fund”) seeks to provide investmentresults that, before expenses, correspond generally to the price and yieldperformance of publicly traded equity securities of companies in the TechnologySelect Sector Index (the “Index”).
Fees and Expenses of the FundThe table below describes the fees and expenses that you may pay if you buyand hold shares of the Fund (“Fund Shares”). This table and the Example belowreflect the expenses of the Fund and do not reflect brokerage commissions youmay pay on purchases and sales of Fund Shares.
Annual Fund Operating Expenses
(expenses that you pay each year as a percentage of the value of yourinvestment):
Management fees . . . . . . . . . . . . . . . . . . . . . . . . . . . . . . . . . . . . 0.04%Distribution and service (12b-1) fees . . . . . . . . . . . . . . . . . . . . 0.04%Other expenses . . . . . . . . . . . . . . . . . . . . . . . . . . . . . . . . . . . . . . 0.06%Total annual fund operating expenses . . . . . . . . . . . . . . . . . 0.14%
Example:This Example is intended to help you compare the cost of investing in the Fundwith the cost of investing in other mutual funds. The Example does not take intoaccount customary brokerage commissions that you pay when purchasing or sellingFund Shares in the secondary market. The Example assumes that you invest $10,000in the Fund for the time periods indicated, and then sell all of your Fund Sharesat the end of those periods. The Example also assumes that your investmenthas a 5% return each year and that the Fund’s operating expenses remain thesame. Although your actual costs may be higher or lower, based on theseassumptions your costs would be:
Year 1 Year 3 Year 5 Year 10$14 $45 $79 $179
Fund Summaries
The Technology Select Sector SPDR Fund
XLK
62

Portfolio Turnover:The Fund pays transaction costs, such as commissions, when it buys and sellssecurities (or “turns over” its portfolio). A higher portfolio turnover rate may indicatehigher transaction costs and may result in higher taxes when Fund Shares areheld in a taxable account. These costs, which are not reflected in Annual FundOperating Expenses or in the Example, affect the Fund’s performance. Duringthe most recent fiscal year, the Fund’s portfolio turnover rate was 5% of the averagevalue of its portfolio.
The Fund’s Principal Investment StrategyIn seeking to track the performance of the Index, the Fund employs a replicationstrategy, which means that the Fund typically invests in substantially all of thesecurities represented in the Index in approximately the same proportions asthe Index.
Under normal market conditions, the Fund generally invests substantially all, butat least 95%, of its total assets in the securities comprising the Index. The Fundwill provide shareholders with at least 60 days’ notice prior to any material changein this 95% investment policy. In addition, the Fund may invest in cash and cashequivalents or money market instruments, such as repurchase agreements andmoney market funds (including money market funds advised by SSGA FundsManagement, Inc. (“SSGA FM” or the “Adviser”), the investment adviser to theFund).
The Index includes securities of companies from the following industries: technologyhardware, storage,andperipherals; software;diversified telecommunicationservices;communications equipment; semiconductors and semiconductor equipment;internet software and services; IT services; electronic equipment, instrumentsand components; and wireless telecommunication services. The Index is one often Select Sector Indexes developed and maintained in accordance with thefollowing criteria: (1) each of the component securities in the Index is a constituentcompany of the S&P 500 Index; and (2) the Index is calculated by S&P Dow JonesIndices LLC (“S&P DJI”) based on methodology proprietary to S&P DJI and BofAMerrill Lynch Research (“BofA Merrill Lynch”) (S&P DJI and BofA Merrill Lynch,collectively, the “Index Provider”) using a “modified market capitalization”methodology, which means that modifications may be made to the market
Fund Summaries
XLK
63
capitalization weights of single stock concentrations in order to conform to therequirements of the Internal Revenue Code of 1986, as amended (the “InternalRevenue Code” or “IRC”). As of November 30, 2016, the Index was composedof 72 stocks.
The Index is sponsored by the Index Provider and compiled by S&P DJI (the“Index Compilation Agent”). Neither entity is affiliated with the Fund or the Adviser.The Index Compilation Agent determines the composition of the Index and relativeweightings of the securities in the Index based on the Index methodology. TheIndex Provider publishes information regarding the market value of the Index.
Principal Risks of Investing in the FundAs with all investments, there are certain risks of investing in the Fund. FundShares will change in value, and you could lose money by investing in the Fund.An investment in the Fund is not insured or guaranteed by the Federal DepositInsurance Corporation or any other government agency.
Passive Strategy/Index Risk: The Fund is managed with a passive investmentstrategy, attempting to track the performance of an unmanaged index ofsecurities, regardless of the current or projected performance of the Indexor of the actual securities comprising the Index. This differs from anactively-managed fund, which typically seeks to outperform a benchmarkindex. As a result, the Fund’s performance may be less favorable than thatof a portfolio managed using an active investment strategy. The structureand composition of the Index will affect the performance, volatility, andrisk of the Index and, consequently, the performance, volatility, and risk ofthe Fund.
Index Tracking Risk: While the Adviser seeks to track the performance ofthe Index as closely as possible (i.e., achieve a high degree of correlationwith the Index), the Fund’s return may not match or achieve a high degreeof correlation with the return of the Index due to operating expenses,transaction costs, cash flows, regulatory requirements and operationalinefficiencies. For example, the Adviser anticipates that it may take severalbusiness days for additions and deletions to the Index to be reflected inthe portfolio composition of the Fund.
Fund Summaries
XLK
64
Technology Sector Risk: The Fund’s assets will be concentrated in thetechnology sector, which means the Fund will be more affected by theperformance of the technology sector than a fund that is more diversified.Market or economic factors impacting technology companies and companiesthat rely heavily on technological advances could have a major effect onthe value of the Fund’s investments. The value of stocks of technologycompanies and companies that rely heavily on technology is particularlyvulnerable to rapid changes in technology product cycles, rapid productobsolescence, government regulation and competition, both domesticallyand internationally, including competition from foreign competitors withlower production costs. Stocks of technology companies and companiesthat rely heavily on technology, especially those of smaller, less-seasonedcompanies, tend to be more volatile than the overall market. Technologycompanies are heavily dependent on patent and intellectual property rights,the loss or impairment of which may adversely affect profitability. Additionally,companies in the technologysectormay facedramaticandoftenunpredictablechanges ingrowth ratesandcompetition for theservicesofqualifiedpersonnel.
Equity Investing Risk: The market prices of equity securities owned by theFund may go up or down, sometimes rapidly or unpredictably. The valueof a security may decline for a number of reasons that may directly relateto the issuer and also may decline due to general industry or market conditionsthat are not specifically related to a particular company. In addition, equitymarkets tend to move in cycles, which may cause stock prices to fall overshort or extended periods of time.
Non-Diversification Risk: As a “non-diversified” fund, the Fund may holda smaller number of portfolio securities than many other funds. To the extentthe Fund invests in a relatively small number of issuers, a decline in themarket value of a particular security held by the Fund may affect its valuemore than if it invested in a larger number of issuers. The value of FundShares may be more volatile than the values of shares of more diversifiedfunds.
Large-Capitalization Securities Risk: Returns on investments in securitiesof large companies could trail the returns on investments in securities ofsmaller andmid-sizedcompanies. Largercompaniesmaybeunable to respond
Fund Summaries
XLK
65

as quickly as smaller and mid-sized companies to competitive challengesor to changes in business, product, financial, or market conditions. Largercompanies may not be able to maintain growth at the high rates that maybe achieved by well-managed smaller and mid-sized companies.
Market Risk: The Fund’s investments are subject to changes in generaleconomic conditions, and general market fluctuations and the risks inherentin investment in securities markets. Investment markets can be volatile andprices of investments can change substantially due to various factors including,but not limited to, economic growth or recession, changes in interest rates,changes in the actual or perceived creditworthiness of issuers, and generalmarket liquidity. The Fund is subject to the risk that geopolitical events willdisrupt securities markets and adversely affect global economies and markets.
Fund PerformanceThe following bar chart and table provide an indication of the risks of investingin the Fund by showing changes in the Fund’s performance from year to yearand by showing how the Fund’s average annual returns for certain time periodscompare with the average annual returns of the Index, and the S&P 500 Index.The S&P 500 Index is a well-known, broad-based securities market index thatincludes common stocks of approximately 500 companies from a number of sectorsrepresenting a significant portion of the market value of all stocks publicly tradedin the United States. The Fund’s past performance (before and after taxes) is notnecessarily an indication of how the Fund will perform in the future. Updatedperformance information is available by calling 1-866-732-8673 or visiting ourwebsite at www.sectorspdrs.com.
Fund Summaries
XLK
66
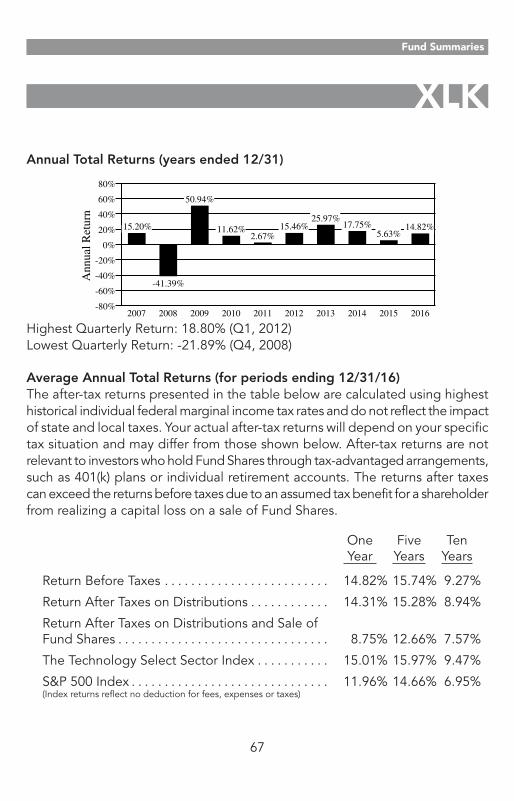
Annual Total Returns (years ended 12/31)
-80%
-60%
-40%
-20%
0%
20%
40%
60%
80%
2007
15.20%
2008
-41.39%
2009
50.94%
2010
11.62%
2011
2.67%
2012
15.46%
2013
25.97%
2014
17.75%
2015
5.63%
2016
14.82%
Ann
ual R
etur
n
Highest Quarterly Return: 18.80% (Q1, 2012)Lowest Quarterly Return: -21.89% (Q4, 2008)
Average Annual Total Returns (for periods ending 12/31/16)The after-tax returns presented in the table below are calculated using highesthistorical individual federal marginal income tax rates and do not reflect the impactof state and local taxes. Your actual after-tax returns will depend on your specifictax situation and may differ from those shown below. After-tax returns are notrelevant to investors who hold Fund Shares through tax-advantaged arrangements,such as 401(k) plans or individual retirement accounts. The returns after taxescan exceed the returns before taxes due to an assumed tax benefit for a shareholderfrom realizing a capital loss on a sale of Fund Shares.
OneYear
FiveYears
TenYears
Return Before Taxes . . . . . . . . . . . . . . . . . . . . . . . . . 14.82% 15.74% 9.27%
Return After Taxes on Distributions . . . . . . . . . . . . 14.31% 15.28% 8.94%
Return After Taxes on Distributions and Sale ofFund Shares . . . . . . . . . . . . . . . . . . . . . . . . . . . . . . . . 8.75% 12.66% 7.57%
The Technology Select Sector Index . . . . . . . . . . . 15.01% 15.97% 9.47%
S&P 500 Index . . . . . . . . . . . . . . . . . . . . . . . . . . . . . . 11.96% 14.66% 6.95%(Index returns reflect no deduction for fees, expenses or taxes)
Fund Summaries
XLK
67

Portfolio Management
Investment AdviserSSGA FM serves as the investment adviser to the Fund.
Portfolio ManagersThe professionals primarily responsible for the day-to-day management of theFund are Michael Feehily, Karl Schneider and David Chin.
Michael Feehily, CFA, is a Senior Managing Director of the Adviser and the Headof Global Equity Beta Solutions in the Americas. He worked at the Adviser from1997 to 2006 and rejoined in 2010.
Karl Schneider, CAIA, is a Vice President of the Adviser and Deputy Head ofGlobal Equity Beta Solutions in the Americas. He joined the Adviser in 1997.
David Chin is a Vice President of the Adviser and a Senior Portfolio Manager inthe Global Equity Beta Solutions Group. He joined the Adviser in 1999.
Purchase and Sale InformationThe Fund will issue (or redeem) Fund Shares to certain institutional investors (typicallymarket makers or other broker-dealers) only in large blocks of 50,000 Fund Sharesknown as “Creation Units.” Creation Unit transactions are typically conductedin exchange for the deposit or delivery of in-kind securities and/or cash constitutinga substantial replication, or a representation, of the securities included in theFund’s benchmark Index.
Individual Fund Shares may only be purchased and sold on the NYSE Arca, Inc.(the “Exchange”), other national securities exchanges, electronic crossing networksand other alternative trading systems through your broker-dealer at market prices.Because Fund Shares trade at market prices rather than at net asset value (“NAV”),Fund Shares may trade at a price greater than NAV (premium) or less than NAV(discount).
Fund Summaries
XLK
68

Tax InformationThe Fund’s distributions are expected to be taxed as ordinary income, qualifieddividend income and/or capital gains, unless you are investing through atax-advantaged arrangement, such as a 401(k) plan or individual retirement account.Any withdrawals made from such tax-advantaged arrangement may be taxableto you.
Payments to Broker-Dealers and Other FinancialIntermediariesIf you purchase Fund Shares through a broker-dealer or other financial intermediary(such as a bank), the Adviser, the Distributor or their affiliates may pay the financialintermediary for certain activities related to the Fund, including educational trainingprograms, conferences, the development of technology platforms and reportingsystems, or other services related to the sale or promotion of the Fund. Thesepayments may create a conflict of interest by influencing the broker-dealer orother intermediary and your salesperson to recommend the Fund over anotherinvestment. Ask your salesperson or visit your financial intermediary’s websitefor more information.
Fund Summaries
XLK
69
Investment ObjectiveThe Utilities Select Sector SPDR Fund (the “Fund”) seeks to provide investmentresults that, before expenses, correspond generally to the price and yieldperformance of publicly traded equity securities of companies in the Utilities SelectSector Index (the “Index”).
Fees and Expenses of the FundThe table below describes the fees and expenses that you may pay if you buyand hold shares of the Fund (“Fund Shares”). This table and the Example belowreflect the expenses of the Fund and do not reflect brokerage commissions youmay pay on purchases and sales of Fund Shares.
Annual Fund Operating Expenses
(expenses that you pay each year as a percentage of the value of yourinvestment):
Management fees . . . . . . . . . . . . . . . . . . . . . . . . . . . . . . . . . . . . 0.04%Distribution and service (12b-1) fees . . . . . . . . . . . . . . . . . . . . 0.04%Other expenses . . . . . . . . . . . . . . . . . . . . . . . . . . . . . . . . . . . . . . 0.06%Total annual fund operating expenses . . . . . . . . . . . . . . . . . 0.14%
Example:This Example is intended to help you compare the cost of investing in the Fundwith the cost of investing in other mutual funds. The Example does not take intoaccount customary brokerage commissions that you pay when purchasing or sellingFund Shares in the secondary market. The Example assumes that you invest $10,000in the Fund for the time periods indicated, and then sell all of your Fund Sharesat the end of those periods. The Example also assumes that your investmenthas a 5% return each year and that the Fund’s operating expenses remain thesame. Although your actual costs may be higher or lower, based on theseassumptions your costs would be:
Year 1 Year 3 Year 5 Year 10$14 $45 $79 $179
Fund Summaries
The Utilities Select Sector SPDR Fund
XLU
70
Portfolio Turnover:The Fund pays transaction costs, such as commissions, when it buys and sellssecurities (or “turns over” its portfolio). A higher portfolio turnover rate may indicatehigher transaction costs and may result in higher taxes when Fund Shares areheld in a taxable account. These costs, which are not reflected in Annual FundOperating Expenses or in the Example, affect the Fund’s performance. Duringthe most recent fiscal year, the Fund’s portfolio turnover rate was 8% of the averagevalue of its portfolio.
The Fund’s Principal Investment StrategyIn seeking to track the performance of the Index, the Fund employs a replicationstrategy, which means that the Fund typically invests in substantially all of thesecurities represented in the Index in approximately the same proportions asthe Index.
Under normal market conditions, the Fund generally invests substantially all, butat least 95%, of its total assets in the securities comprising the Index. The Fundwill provide shareholders with at least 60 days’ notice prior to any material changein this 95% investment policy. In addition, the Fund may invest in cash and cashequivalents or money market instruments, such as repurchase agreements andmoney market funds (including money market funds advised by SSGA FundsManagement, Inc. (“SSGA FM” or the “Adviser”), the investment adviser to theFund).
The Index includes securities of companies from the following industries: electricutilities; water utilities; multi-utilities; independent power producers and energytraders; and gas utilities. The Index is one of ten Select Sector Indexes developedand maintained in accordance with the following criteria: (1) each of the componentsecurities in the Index is a constituent company of the S&P 500 Index; and (2)the Index is calculated by S&P Dow Jones Indices LLC (“S&P DJI”) based onmethodology proprietary to S&P DJI and BofA Merrill Lynch Research (“BofAMerrill Lynch”) (S&P DJI and BofA Merrill Lynch, collectively, the “Index Provider”)using a “modified market capitalization” methodology, which means thatmodifications may be made to the market capitalization weights of single stockconcentrations in order to conform to the requirements of the Internal RevenueCode of 1986, as amended (the “Internal Revenue Code” or “IRC”). As of November30, 2016, the Index was composed of 28 stocks.
Fund Summaries
XLU
71

The Index is sponsored by the Index Provider and compiled by S&P DJI (the“Index Compilation Agent”). Neither entity is affiliated with the Fund or the Adviser.The Index Compilation Agent determines the composition of the Index and relativeweightings of the securities in the Index based on the Index methodology. TheIndex Provider publishes information regarding the market value of the Index.
Principal Risks of Investing in the FundAs with all investments, there are certain risks of investing in the Fund. FundShares will change in value, and you could lose money by investing in the Fund.An investment in the Fund is not insured or guaranteed by the Federal DepositInsurance Corporation or any other government agency.
Passive Strategy/Index Risk: The Fund is managed with a passive investmentstrategy, attempting to track the performance of an unmanaged index ofsecurities, regardless of the current or projected performance of the Indexor of the actual securities comprising the Index. This differs from anactively-managed fund, which typically seeks to outperform a benchmarkindex. As a result, the Fund’s performance may be less favorable than thatof a portfolio managed using an active investment strategy. The structureand composition of the Index will affect the performance, volatility, andrisk of the Index and, consequently, the performance, volatility, and risk ofthe Fund.
Index Tracking Risk: While the Adviser seeks to track the performance ofthe Index as closely as possible (i.e., achieve a high degree of correlationwith the Index), the Fund’s return may not match or achieve a high degreeof correlation with the return of the Index due to operating expenses,transaction costs, cash flows, regulatory requirements and operationalinefficiencies. For example, the Adviser anticipates that it may take severalbusiness days for additions and deletions to the Index to be reflected inthe portfolio composition of the Fund.
Utilities Sector Risk: The Fund’s assets will be concentrated in the utilitiessector, which means the Fund will be more affected by the performanceof the utilities sector than a fund that is more diversified. Utility companiesare affected by supply and demand, operating costs, government regulation,environmental factors, liabilities for environmental damage and general civil
Fund Summaries
XLU
72
liabilities, and rate caps or rate changes. Although rate changes of a regulatedutility usually fluctuate in approximate correlation with financing costs, dueto political and regulatory factors rate changes ordinarily occur only followinga delay after the changes in financing costs. This factor will tend to favorablyaffect a regulated utility company’s earnings and dividends in times ofdecreasing costs, but conversely, will tend to adversely affect earnings anddividends when costs are rising. The value of regulated utility equity securitiesmay tend to have an inverse relationship to the movement of interest rates.Certain utility companies have experienced full or partial deregulation inrecent years. These utility companies are frequently more similar to industrialcompanies in that they are subject to greater competition and have beenpermitted by regulators to diversify outside of their original geographicregions and their traditional lines of business. These opportunities may permitcertain utility companies to earn more than their traditional regulated ratesof return. Some companies, however, may be forced to defend their corebusiness and may be less profitable. In addition, natural disasters, terroristattacks, government intervention or other factors may render a utilitycompany’sequipmentunusableorobsoleteandnegatively impactprofitability.
Among the risks that may affect utility companies are the following: risksof increases in fuel and other operating costs; the high cost of borrowingto finance capital construction during inflationary periods; restrictions onoperations and increased costs and delays associated with compliance withenvironmental and nuclear safety regulations; and the difficulties involvedin obtaining natural gas for resale or fuel for generating electricity at reasonableprices. Other risks include those related to the construction and operationof nuclear power plants, the effects of energy conservation and the effectsof regulatory changes.
Equity Investing Risk: The market prices of equity securities owned by theFund may go up or down, sometimes rapidly or unpredictably. The valueof a security may decline for a number of reasons that may directly relateto the issuer and also may decline due to general industry or market conditionsthat are not specifically related to a particular company. In addition, equitymarkets tend to move in cycles, which may cause stock prices to fall overshort or extended periods of time.
Fund Summaries
XLU
73
Non-Diversification Risk: As a “non-diversified” fund, the Fund may holda smaller number of portfolio securities than many other funds. To the extentthe Fund invests in a relatively small number of issuers, a decline in themarket value of a particular security held by the Fund may affect its valuemore than if it invested in a larger number of issuers. The value of FundShares may be more volatile than the values of shares of more diversifiedfunds.
Large-Capitalization Securities Risk: Returns on investments in securitiesof large companies could trail the returns on investments in securities ofsmaller andmid-sizedcompanies. Largercompaniesmaybeunable to respondas quickly as smaller and mid-sized companies to competitive challengesor to changes in business, product, financial, or market conditions. Largercompanies may not be able to maintain growth at the high rates that maybe achieved by well-managed smaller and mid-sized companies.
Market Risk: The Fund’s investments are subject to changes in generaleconomic conditions, and general market fluctuations and the risks inherentin investment in securities markets. Investment markets can be volatile andprices of investments can change substantially due to various factors including,but not limited to, economic growth or recession, changes in interest rates,changes in the actual or perceived creditworthiness of issuers, and generalmarket liquidity. The Fund is subject to the risk that geopolitical events willdisrupt securities markets and adversely affect global economies and markets.
Fund PerformanceThe following bar chart and table provide an indication of the risks of investingin the Fund by showing changes in the Fund’s performance from year to yearand by showing how the Fund’s average annual returns for certain time periodscompare with the average annual returns of the Index, and the S&P 500 Index.The S&P 500 Index is a well-known, broad-based securities market index thatincludes common stocks of approximately 500 companies from a number of sectorsrepresenting a significant portion of the market value of all stocks publicly tradedin the United States. The Fund’s past performance (before and after taxes) is notnecessarily an indication of how the Fund will perform in the future. Updatedperformance information is available by calling 1-866-732-8673 or visiting ourwebsite at www.sectorspdrs.com.
Fund Summaries
XLU
74
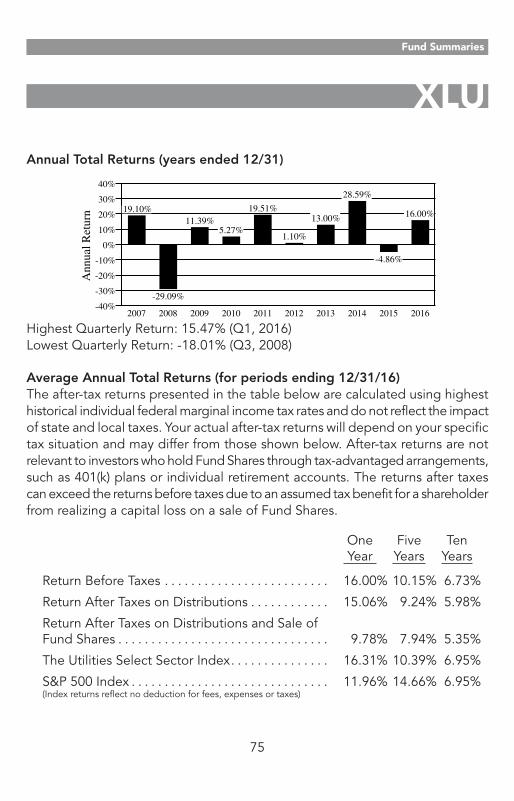
Annual Total Returns (years ended 12/31)
-40%
-30%
-20%
-10%
0%
10%
20%
30%
40%
2007
19.10%
2008
-29.09%
2009
11.39%
2010
5.27%
2011
19.51%
2012
1.10%
2013
13.00%
2014
28.59%
2015
-4.86%
2016
16.00%
Ann
ual R
etur
n
Highest Quarterly Return: 15.47% (Q1, 2016)Lowest Quarterly Return: -18.01% (Q3, 2008)
Average Annual Total Returns (for periods ending 12/31/16)The after-tax returns presented in the table below are calculated using highesthistorical individual federal marginal income tax rates and do not reflect the impactof state and local taxes. Your actual after-tax returns will depend on your specifictax situation and may differ from those shown below. After-tax returns are notrelevant to investors who hold Fund Shares through tax-advantaged arrangements,such as 401(k) plans or individual retirement accounts. The returns after taxescan exceed the returns before taxes due to an assumed tax benefit for a shareholderfrom realizing a capital loss on a sale of Fund Shares.
OneYear
FiveYears
TenYears
Return Before Taxes . . . . . . . . . . . . . . . . . . . . . . . . . 16.00% 10.15% 6.73%
Return After Taxes on Distributions . . . . . . . . . . . . 15.06% 9.24% 5.98%
Return After Taxes on Distributions and Sale ofFund Shares . . . . . . . . . . . . . . . . . . . . . . . . . . . . . . . . 9.78% 7.94% 5.35%
The Utilities Select Sector Index. . . . . . . . . . . . . . . 16.31% 10.39% 6.95%
S&P 500 Index . . . . . . . . . . . . . . . . . . . . . . . . . . . . . . 11.96% 14.66% 6.95%(Index returns reflect no deduction for fees, expenses or taxes)
Fund Summaries
XLU
75
Portfolio Management
Investment AdviserSSGA FM serves as the investment adviser to the Fund.
Portfolio ManagersThe professionals primarily responsible for the day-to-day management of theFund are Michael Feehily, Karl Schneider and Dwayne Hancock.
Michael Feehily, CFA, is a Senior Managing Director of the Adviser and the Headof Global Equity Beta Solutions in the Americas. He worked at the Adviser from1997 to 2006 and rejoined in 2010.
Karl Schneider, CAIA, is a Vice President of the Adviser and Deputy Head ofGlobal Equity Beta Solutions in the Americas. He joined the Adviser in 1997.
Dwayne Hancock, CFA, is a Vice President of the Adviser and a Senior PortfolioManager in the Global Equity Beta Solutions Group. He joined the Adviser in1996.
Purchase and Sale InformationThe Fund will issue (or redeem) Fund Shares to certain institutional investors (typicallymarket makers or other broker-dealers) only in large blocks of 50,000 Fund Sharesknown as “Creation Units.” Creation Unit transactions are typically conductedin exchange for the deposit or delivery of in-kind securities and/or cash constitutinga substantial replication, or a representation, of the securities included in theFund’s benchmark Index.
Individual Fund Shares may only be purchased and sold on the NYSE Arca, Inc.(the “Exchange”), other national securities exchanges, electronic crossing networksand other alternative trading systems through your broker-dealer at market prices.Because Fund Shares trade at market prices rather than at net asset value (“NAV”),Fund Shares may trade at a price greater than NAV (premium) or less than NAV(discount).
Fund Summaries
XLU
76
Tax InformationThe Fund’s distributions are expected to be taxed as ordinary income, qualifieddividend income and/or capital gains, unless you are investing through atax-advantaged arrangement, such as a 401(k) plan or individual retirement account.Any withdrawals made from such tax-advantaged arrangement may be taxableto you.
Payments to Broker-Dealers and Other FinancialIntermediariesIf you purchase Fund Shares through a broker-dealer or other financial intermediary(such as a bank), the Adviser, the Distributor or their affiliates may pay the financialintermediary for certain activities related to the Fund, including educational trainingprograms, conferences, the development of technology platforms and reportingsystems, or other services related to the sale or promotion of the Fund. Thesepayments may create a conflict of interest by influencing the broker-dealer orother intermediary and your salesperson to recommend the Fund over anotherinvestment. Ask your salesperson or visit your financial intermediary’s websitefor more information.
Fund Summaries
XLU
77
ADDITIONAL STRATEGIES INFORMATION
Principal Strategies
Please see “The Fund’s Principal Investment Strategy” section under “FundSummaries” for each Fund above for a complete discussion of each Fund’s principalinvestment strategies. A Fund may invest in various types of securities and engagein various investment techniques that are not the principal focus of the Fund.Some of these are described below under “Non-Principal Strategies” and othersare not described in this Prospectus. These other securities, techniques and practices,together with their associated risks, are described in the Statement of AdditionalInformation (the “SAI”), which you may obtain free of charge by contacting theDistributor (see the back cover of this Prospectus for address and phone number).
SSGA FM seeks to track the performance of a Fund’s Index as closely as possible(i.e., obtain a high degree of correlation with the Index). A number of factorsmay affect a Fund’s ability to achieve a high degree of correlation with its Index,and there can be no guarantee that a Fund will achieve a high degree of correlation.
While normally each Fund employs a replication strategy to track the performanceof its Index, under various circumstances it may not be possible or practical topurchase all of the securities in the benchmark Index for a Fund, or amounts ofsuch securities in proportion to their weighting in the Index, such as when thereare practical difficulties or substantial costs involved in compiling a portfolio ofsecurities to follow the Index; in instances when a security in the Index becomestemporarily illiquid, unavailable or less liquid; or due to legal restrictions (suchas diversification requirements that apply to the Fund but not the Index). Undersuch circumstances, the Adviser intends to employ a sampling strategy in managingsuch Fund. Sampling means that the Adviser uses quantitative analysis to selectsecurities, including securities in the Index, outside of the Index and derivativesthat have a similar investment profile as the relevant Index in terms of key riskfactors, performance attributes and other economic characteristics. These includeindustry weightings, market capitalization, and other financial characteristics ofsecurities. The quantity of holdings in a Fund will be based on a number of factors,including asset size of the Fund. In addition, from time to time, securities areadded to or removed from each Index. The Adviser may sell securities that arerepresented in an Index, or purchase securities that are not yet represented inan Index, in anticipation of their removal from or addition to an Index. Further,the Adviser may choose to overweight securities in an Index, purchase or sellsecurities not in an Index, or utilize various combinations of other availabletechniques, in seeking to track an Index.
78
The Select Sector SPDR Trust’s (the “Trust”) Board of Trustees (the “Board”) maychange a Fund’s investment strategy and other policies without shareholderapproval, except as otherwise indicated in this Prospectus or in the SAI. The Boardmay not change a Fund’s investment objective without shareholder approval.
Non-Principal StrategiesCertain Other Investments. Each Fund may invest in equity securities that arenot included in the Fund’s Index, convertible securities, variable rate demandnotes, commercial paper, structured notes (notes on which the amount of principalrepayment and interest payments are based on the movement of one or morespecified factors such as the movement of a particular security or index), swapsand in options and futures contracts. Swaps, options and futures contracts,convertible securities and structured notes may be used by a Fund in seekingperformance that corresponds to its Index and in managing cash flows.
Temporary Defensive Positions. In certain situations or market conditions, a Fundmay temporarily depart from its normal investment policies and strategies providedthat the alternative is consistent with the Fund’s investment objective and is inthe best interest of the Fund. For example, a Fund may make larger than normalinvestments in derivatives to maintain exposure to its Index if it is unable to investdirectly in a component security, or if a derivative investment may provide higherliquidity than other types of investments. Consequently, under such circumstances,such Fund may invest in a different mix of investments than it would under normalcircumstances.
Borrowing Money. Each Fund may borrow money from a bank up to a limit of10% of the value of its assets, but only for temporary or emergency purposes.
Lending of Securities. Each Fund may lend its portfolio securities in an amountnot to exceed one-quarter (25%) of the value of its total assets via a securitieslending program through its securities lending agent, State Street Bank and TrustCompany (“State Street” or the “Lending Agent”), to brokers, dealers and otherfinancial institutions desiring to borrow securities to complete transactions andfor other purposes. A securities lending program allows a Fund to receive a portionof the income generated by lending its securities and investing the respectivecollateral. A Fund will receive collateral for each loaned security which is at leastequal to 102% of the market value of that security, marked to market each tradingday. In the securities lending program, the borrower generally has the right tovote the loaned securities; however, a Fund may call loans to vote proxies if amaterial issue affecting the Fund’s economic interest in the investment is to bevoted upon. Security loans may be terminated at any time by a Fund.
79
ADDITIONAL RISK INFORMATIONThe following section provides additional information regarding certain of theprincipal risks identified under “Principal Risks of Investing in the Fund” in eachFund Summary along with additional risk information.
80
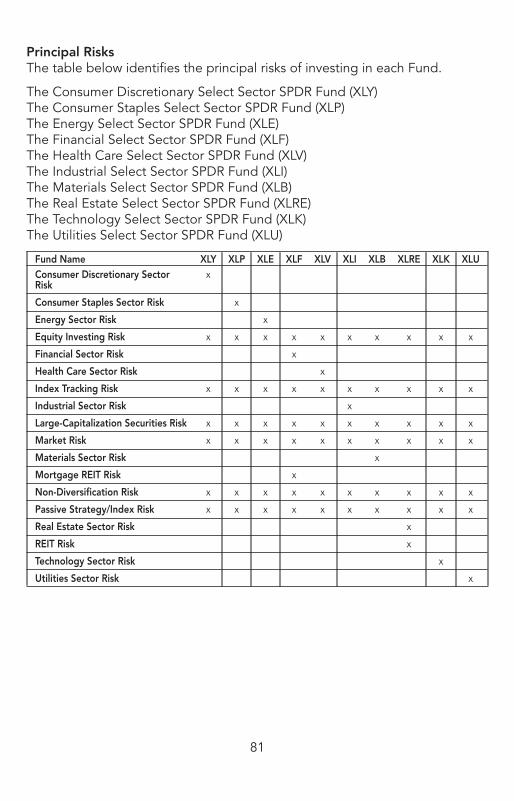
Principal RisksThe table below identifies the principal risks of investing in each Fund.
The Consumer Discretionary Select Sector SPDR Fund (XLY)The Consumer Staples Select Sector SPDR Fund (XLP)The Energy Select Sector SPDR Fund (XLE)The Financial Select Sector SPDR Fund (XLF)The Health Care Select Sector SPDR Fund (XLV)The Industrial Select Sector SPDR Fund (XLI)The Materials Select Sector SPDR Fund (XLB)The Real Estate Select Sector SPDR Fund (XLRE)The Technology Select Sector SPDR Fund (XLK)The Utilities Select Sector SPDR Fund (XLU)
Fund Name XLY XLP XLE XLF XLV XLI XLB XLRE XLK XLUConsumer Discretionary SectorRisk
x
Consumer Staples Sector Risk x
Energy Sector Risk x
Equity Investing Risk x x x x x x x x x x
Financial Sector Risk x
Health Care Sector Risk x
Index Tracking Risk x x x x x x x x x x
Industrial Sector Risk x
Large-Capitalization Securities Risk x x x x x x x x x x
Market Risk x x x x x x x x x x
Materials Sector Risk x
Mortgage REIT Risk x
Non-Diversification Risk x x x x x x x x x x
Passive Strategy/Index Risk x x x x x x x x x x
Real Estate Sector Risk x
REIT Risk x
Technology Sector Risk x
Utilities Sector Risk x
81
ConsumerDiscretionarySectorRisk. Thesuccessof consumerproductmanufacturersand retailers is tied closely to the performance of the overall global economy,interest rates, competition and consumer confidence. Success depends heavilyon disposable household income and consumer spending. Also, companies inthe consumer discretionary sector may be subject to severe competition, whichmay have an adverse impact on their respective profitability. Changes indemographics and consumer tastes can also affect the demand for, and successof, consumer products and services in the marketplace.
Consumer Staples Sector Risk. Consumer staples companies are subject togovernment regulation affecting their products which may negatively impact suchcompanies’ performance. For instance, government regulations may affect thepermissibility of using various food additives and production methods of companiesthat make food products, which could affect company profitability. Tobaccocompanies may be adversely affected by the adoption of proposed legislationand/or by litigation. Also, the success of food, beverage, household and personalproducts companies may be strongly affected by consumer interest, marketingcampaigns and other factors affecting supply and demand, including performanceof the overall domestic and international economy, interest rates, competitionand consumer confidence and spending.
Energy Sector Risk. Issuers in energy-related industries can be significantly affectedby fluctuations in energy prices and supply and demand of energy fuels causedby geopolitical events, energy conservation or use of alternative fuel sources,the success of exploration projects, weather or meteorological events, taxes,increased governmental or environmental regulation, resource depletion, risinginterest rates, declines in domestic or foreign production, accidents or catastrophicevents, or terrorist threats or attacks, among others. Markets for various energy-related commodities can have significant volatility, and are subject to control ormanipulation by large producers or purchasers. Companies in the energy sectormay need to make substantial expenditures, and to incur significant amounts ofdebt, in order to maintain or expand their reserves through exploration of newsourcesof supply, through thedevelopmentofexistingsources, throughacquisitions,or through long-term contracts to acquire reserves. Factors adversely affectingproducers, refiners, distributors, or others in the energy sector may affect adverselycompanies that service or supply those entities, either because demand for thoseservices or products is curtailed, or those services or products come under pricepressure.
Equity Investing Risk. The market prices of equity securities owned by a Fundmay go up or down, sometimes rapidly or unpredictably. The value of a securitymay decline for a number of reasons that may directly relate to the issuer, suchas management performance, financial leverage, non-compliance with regulatoryrequirements, and reduced demand for the issuer’s goods or services. The values
82
of equity securities also may decline due to general industry or market conditionsthat are not specifically related to a particular company, such as real or perceivedadverse economic conditions, changes in the general outlook for corporate earnings,changes in interest or currency rates, or adverse investor sentiment generally.In addition, equity markets tend to move in cycles, which may cause stock pricesto fall over short or extended periods of time.
Financial Sector Risk. Financial services companies are subject to extensivegovernmental regulation which may limit both the amounts and types of loansand other financial commitments they can make, the interest rates and fees theycan charge, the scope of their activities, the prices they can charge and the amountof capital they must maintain. Profitability is largely dependent on the availabilityand cost of capital funds and can fluctuate significantly when interest rates changeor due to increased competition. In addition, deterioration of the credit marketsgenerally may cause an adverse impact in a broad range of markets, includingU.S. and international credit and interbank money markets generally, therebyaffecting a wide range of financial institutions and markets. Certain events in thefinancial sector may cause an unusually high degree of volatility in the financialmarkets, both domestic and foreign, and cause certain financial services companiesto incur large losses. Securities of financial services companies may experiencea dramatic decline in value when such companies experience substantial declinesin the valuations of their assets, take action to raise capital (such as the issuanceof debt or equity securities), or cease operations. Credit losses resulting fromfinancial difficulties of borrowers and financial losses associated with investmentactivities can negatively impact the sector. Insurance companies may be subjectto severe price competition. Adverse economic, business or political developmentscould adversely affect financial institutions engaged in mortgage finance or otherlending or investing activities directly or indirectly connected to the value of realestate. The Financial Select Sector SPDR Fund’s exposure to real estate securitiesis limited to mortgage REITs.
Health Care Sector Risk. Companies in the health care sector are subject to extensivegovernment regulation and their profitability can be significantly affected byrestrictions on government reimbursement for medical expenses, rising costs ofmedical products and services, pricing pressure (including price discounting),limited product lines and an increased emphasis on the delivery of healthcarethrough outpatient services. Companies in the health care sector are heavilydependent on obtaining and defending patents, which may be time consumingand costly, and the expiration of patents may also adversely affect the profitabilityof these companies. Health care companies are also subject to extensive litigationbased on product liability and similar claims. In addition, their products can becomeobsolete due to industry innovation, changes in technologies or other market
83
developments. Many new products in the health care sector require significantresearch and development and may be subject to regulatory approvals, all ofwhich may be time consuming and costly with no guarantee that any productwill come to market.
Index Tracking Risk. While the Adviser seeks to track the performance of theIndex (i.e., achieve a high degree of correlation with the Index), a Fund’s returnmay not match the return of the Index for a number of reasons. Each Fund incursa number of operating expenses not applicable to the Index, and incurs costsin buying and selling securities. In addition, a Fund may not be fully invested attimes, either as a result of cash flows into or out of the Fund or reserves of cashheld by the Fund to meet redemptions. Changes in the composition of the Indexand regulatory requirements also may impact a Fund’s ability to match the returnof the Index. Index tracking risk may be heightened during times of increasedmarket volatility or other unusual market conditions.
Industrial Sector Risk. Industrial companies are affected by supply and demandboth for their specific product or service and for industrial sector products ingeneral. Government regulation, world events, exchange rates and economicconditions, technological developments and liabilities for environmental damageand general civil liabilities will likewise affect the performance of these companies.Aerospace and defense companies, a component of the industrial sector, canbe significantly affected by government spending policies because companiesinvolved in this industry rely, to a significant extent, on U.S. and foreign governmentdemand for their products and services. Thus, the financial condition of, andinvestor interest in, aerospace and defense companies are heavily influenced bygovernmental defense spending policies which are typically under pressure fromefforts to control the U.S. (and other) government budgets. Transportation securities,a component of the industrial sector, are cyclical and have occasional sharp pricemovements which may result from changes in the economy, fuel prices, laboragreements and insurance costs.
Large-Capitalization Securities Risk. Securities issued by large-capitalizationcompanies may present risks not present in smaller companies. For example,larger companies may be unable to respond as quickly as smaller and mid-sizedcompanies to competitive challenges or to changes in business, product, financial,or other market conditions. Larger companies may not be able to maintain growthat the high rates that may be achieved by well-managed smaller and mid-sizedcompanies, especially during strong economic periods. Returns on investmentsin securities of large companies could trail the returns on investments in securitiesof smaller and mid-sized companies.
Market Risk. Market prices of investments held by a Fund will go up or down,sometimes rapidly or unpredictably. Each Fund’s investments are subject to changesin general economic conditions, general market fluctuations and the risks inherent
84
in investment in securities markets. Investment markets can be volatile and pricesof investments can change substantially due to various factors including, but notlimited to, economic growth or recession, changes in interest rates, changes inactual or perceived creditworthiness of issuers and general market liquidity. Evenif general economic conditions do not change, the value of an investment in aFund could decline if the particular industries, sectors or companies in which theFund invests do not perform well or are adversely affected by events. Further,legal, political, regulatory and tax changes also may cause fluctuations in marketsand securities prices.
Materials Sector Risk. Many materials companies are significantly affected by thelevel and volatility of commodity prices, exchange rates, import controls, worldwidecompetition, environmental policies and consumer demand. At times, worldwideproduction of industrial materials has exceeded demand as a result of over-buildingor economic downturns, leading to poor investment returns or losses. Other risksmay include liabilities forenvironmentaldamageandgeneral civil liabilities,depletionof resources, and mandated expenditures for safety and pollution control. Thematerials sector may also be affected by economic cycles, technical progress,labor relations, and government regulations.
Mortgage REIT Risk. Mortgage REITs, which invest the majority of their assetsin real estate mortgages, receive principal and interest payments from the ownersof the mortgage properties and derive their income primarily from interest payments.Accordingly, mortgage REITs are subject to the credit risk of the borrowers, whichrefers to the possibility that the borrower will be unable and/or unwilling to maketimely interest payments and/or repay the principal on the loan to the mortgageREIT when due. In the event of a default by a borrower, the mortgage REIT mayexperience delays in enforcing its rights as a mortgagee and may incur substantialcosts associated with protecting its investments. Mortgage REITs are subject toheavy cash flow dependency and, as a result, are particularly reliant on the properfunctioning of the capital markets. Further, mortgage REITs are dependent uponspecialized management skills and their investments may not be diversified.Mortgage REITs are also subject to risks related to general and local economicconditions and the real estate market specifically, availability of mortgage funds,changes in interest rates, changes in property values, and borrower prepaymenton underlying mortgage loans. In addition, a mortgage REIT could possibly failto qualify for favorable tax treatment under the Internal Revenue Code, or tomaintain its exemptions from registration under the Investment Company Actof 1940, as amended (the “1940 Act”), which could have adverse consequencesfor a Fund. Investments in mortgage REITs are also subject to the risks affectingequity markets generally.
85
Non-Diversification Risk. As a “non-diversified” fund, each Fund may hold a smallernumber of portfolio securities than many other funds. To the extent a Fund investsin a relatively small number of issuers, a decline in the market value of a particularsecurity held by the Fund may affect its value more than if it invested in a largernumber of issuers. The value of Fund Shares may be more volatile than the valuesof shares of more diversified funds.
Passive Strategy/Index Risk. Each Fund is managed with a passive investmentstrategy, attempting to track the performance of an unmanaged index of securities.Each Fund will seek to replicate Index returns regardless of the current or projectedperformance of the Index or of the actual securities comprising the Index. Thisdiffers from an actively-managed fund, which typically seeks to outperform abenchmark index. Each Fund generally will buy and will not sell a security includedin the Index as long as the security is part of the Index regardless of any suddenor material decline in value or foreseeable material decline in value of the security,even though the Adviser may make a different investment decision for other activelymanaged accounts or portfolios that hold the security. As a result, a Fund’sperformance may be less favorable than that of a portfolio managed using anactive investment strategy. The structure and composition of the Index will affectthe performance, volatility, and risk of the Index (in absolute terms and by comparisonwith other indices) and, consequently, the performance, volatility, and risk of aFund.
Real Estate Sector Risk. There are special risks associated with investment in securitiesof companies engaged in real property markets, including without limitation REITsand real estate operating companies. An investment in a real property companymay be subject to risks similar to those associated with direct ownership of realestate, including, by way of example, the possibility of declines in the value ofreal estate, losses from casualty or condemnation, and changes in local and generaleconomic conditions, supply and demand, interest rates, environmental liability,zoning laws, regulatory limitations on rents, property taxes, and operating expenses.An investment in a real property company is subject to additional risks, such aspoor performance by the manager of the real property company, adverse changesin tax laws, difficulties in valuing and disposing of real estate, and the effect ofgeneral declines in stock prices. Some real property companies have limiteddiversification because they invest in a limited number of properties, a narrowgeographic area, or a single type of property. Also, the organizational documentsof a real property company may contain provisions that make changes in controlof the company difficult and time-consuming. As a shareholder in a real propertycompany, the Fund, and indirectly the Fund’s shareholders, would bear their ratableshares of the real property company’s expenses and would at the same timecontinue to pay their own fees and expenses.
86
REIT Risk. REITs are subject to the risks associated with investing in the securitiesof real property companies. In particular, REITs may be affected by changes inthe values of the underlying properties that they own or operate. Further, REITsare dependent upon specialized management skills, and their investments maybe concentrated in relatively few properties, or in a small geographic area or asingle property type. REITs are also subject to heavy cash flow dependency and,as a result, are particularly reliant on the proper functioning of capital markets,as well as defaults by borrowers and self-liquidation. A variety of economic andother factors may adversely affect a lessee’s ability to meet its obligations to aREIT. In the event of a default by a lessee, the REIT may experience delays inenforcing its rights as a lessor and may incur substantial costs associated withprotecting its investments. In addition, a REIT could possibly fail to qualify forfavorable tax treatment under the Internal Revenue Code, or to maintain itsexemptions from registration under the 1940 Act, which could have adverseconsequences for a Fund. Investments in REITs are also subject to the risks affectingequity markets generally.
Technology Sector Risk. Market or economic factors impacting technologycompanies and companies that rely heavily on technological advances could havea major effect on the value of the Fund’s investments. The value of stocks oftechnology companies and companies that rely heavily on technology is particularlyvulnerable to rapid changes in technology product cycles, rapid productobsolescence, government regulation and competition, both domestically andinternationally, includingcompetition fromforeigncompetitorswith lowerproductioncosts. Stocks of technology companies and companies that rely heavily ontechnology, especially those of smaller, less-seasoned companies, tend to bemore volatile than the overall market. Technology companies are heavily dependenton patent and intellectual property rights, the loss or impairment of which mayadversely affect profitability. Additionally, companies in the technology sectormay face dramatic and often unpredictable changes in growth rates and competitionfor the services of qualified personnel.
Utilities Sector Risk. Utility companies are affected by supply and demand, operatingcosts, government regulation, environmental factors, liabilities for environmentaldamage and general civil liabilities, and rate caps or rate changes. Although ratechanges of a regulated utility usually fluctuate in approximate correlation withfinancing costs, due to political and regulatory factors, rate changes ordinarilyoccur only following a delay after the changes in financing costs. This factor willtend to favorably affect a regulated utility company’s earnings and dividends intimes of decreasing costs, but conversely, will tend to adversely affect earningsand dividends when costs are rising. The value of regulated utility equity securitiesmay tend to have an inverse relationship to the movement of interest rates. Certainutility companies have experienced full or partial deregulation in recent years.These utility companies are frequently more similar to industrial companies in
87
that they are subject to greater competition and have been permitted by regulatorsto diversify outside of their original geographic regions and their traditional linesof business. These opportunities may permit certain utility companies to earnmore than their traditional regulated rates of return. Some companies, however,may be forced to defend their core business and may be less profitable. In addition,natural disasters, terrorist attacks, government intervention or other factors mayrender a utility company’s equipment unusable or obsolete and negatively impactprofitability.
Among the risks that may affect utility companies are the following: risks of increasesin fuel and other operating costs; the high cost of borrowing to finance capitalconstruction during inflationary periods; restrictions on operations and increasedcosts and delays associated with compliance with environmental and nuclearsafety regulations; and the difficulties involved in obtaining natural gas for resaleor fuel for generating electricity at reasonable prices. Other risks include thoserelated to the construction and operation of nuclear power plants, the effectsof energy conservation and the effects of regulatory changes.
Non-Principal RisksTrading Issues. Although Fund Shares are listed for trading on the Exchange andmay be listed or traded on U.S. and non-U.S. stock exchanges other than theExchange, there can be no assurance that an active trading market for such FundShares will develop or be maintained. Trading in Fund Shares on the Exchangemay be halted due to market conditions or for reasons that, in the view of theExchange, make trading in Fund Shares inadvisable. In addition, trading in FundShares on the Exchange is subject to trading halts caused by extraordinary marketvolatility pursuant to Exchange “circuit breaker” rules. There can be no assurancethat the requirements of the Exchange necessary to maintain the listing of a Fundwill continue to be met or will remain unchanged or that Fund Shares will tradewith any volume, or at all, on any stock exchange.
Fluctuation of Net Asset Value, Share Premiums and Discounts. The net assetvalue of Fund Shares will generally fluctuate with changes in the market valueof a Fund’s securities holdings. The market prices of Fund Shares will generallyfluctuate in accordance with changes in a Fund’s net asset value and supply anddemand of Fund Shares on the Exchange. It cannot be predicted whether FundShares will trade below, at or above their net asset value. Price differences maybe due, in large part, to the fact that supply and demand forces at work in thesecondary trading market for Fund Shares will be closely related to, but not identicalto, the same forces influencing the prices of the securities of the relevant Indextrading individually or in the aggregate at any point in time. The market pricesof Fund Shares may deviate significantly from the net asset value of Fund Sharesduring periods of market volatility. However, given that Fund Shares can be createdand redeemed in Creation Units (unlike shares of many closed-end funds, which
88

frequently trade at appreciable discounts from, and sometimes at premiums to,their net asset value), the Adviser believes that large discounts or premiums tothe net asset value of Fund Shares should not be sustained over long periods.While the creation/redemption feature is designed to make it likely that FundShares normally will trade close to a Fund’s net asset value, disruptions to creationsand redemptions or market volatility may result in trading prices that differsignificantly from such Fund’s net asset value. If an investor purchases Fund Sharesat a time when the market price is at a premium to the net asset value of FundShares or sells at a time when the market price is at a discount to the net assetvalue of Fund Shares, then the investor may sustain losses.
Costs of Buying and Selling Shares. Investors buying or selling Fund Shares inthe secondary market will pay brokerage commissions or other charges imposedby brokers, as determined by that broker. Brokerage commissions are often afixed amount and may be a significant proportional cost for investors seekingto buy or sell relatively small amounts of Fund Shares. In addition, secondarymarket investors will also incur the cost of the difference between the price thatan investor is willing to pay for Fund Shares (the “bid” price) and the price atwhich an investor is willing to sell Fund Shares (the “ask” price). This differencein bid and ask prices is often referred to as the “spread” or “bid/ask spread.”The bid/ask spread varies over time for Fund Shares based on trading volumeand market liquidity, and is generally lower if Fund Shares have more tradingvolume and market liquidity and higher if Fund Shares have little trading volumeand market liquidity. Further, increased market volatility may cause increasedbid/ask spreads. Due to the costs of buying or selling Fund Shares, includingbid/ask spreads, frequent trading of Fund Shares may significantly reduce investmentresults and an investment in Fund Shares may not be advisable for investors whoanticipate regularly making small investments.
Securities Lending Risk. Each Fund may lend portfolio securities with a value ofup to 25% of its total assets. For these purposes, total assets shall include thevalue of all assets received as collateral for the loan. Such loans may be terminatedat any time, and a Fund will receive cash or other obligations as collateral. Anysuch loans must be continuously secured by collateral in cash or cash equivalentsmaintained on a current basis in an amount at least equal to the market valueof the securities loaned by a Fund. In a loan transaction, as compensation forlending its securities, a Fund will receive a portion of the dividends or interestaccrued on the securities held as collateral or, in the case of cash collateral, aportion of the income from the investment of such cash. In addition, a Fund willreceive the amount of all dividends, interest and other distributions on the loanedsecurities. However, the borrower has the right to vote the loaned securities. AFund will call loans to vote proxies if a material issue affecting the investmentis to be voted upon. Should the borrower of the securities fail financially, a Fundmay experience delays in recovering the securities or exercising its rights in the
89
collateral. Loans are made only to borrowers that are deemed by the securitieslending agent to be of good financial standing. In a loan transaction, a Fundwill also bear the risk of any decline in value of securities acquired with cash collateral.A Fund will attempt to minimize this risk by limiting the investment of cash collateralto high quality instruments of short maturity.
Concentration Risk. A Fund’s assets will generally be concentrated in an industryor group of industries to the extent that the Fund’s underlying Index concentratesin a particular industry or group of industries. When a Fund focuses its investmentsin a particular industry or sector, financial, economic, business, and otherdevelopments affecting issuers in that industry, market, or economic sector willhave a greater effect on the Fund than if it had not focused its assets in thatindustry, market, or economic sector, which may increase the volatility of the Fund.
Money Market Risk. An investment in a money market fund is not a deposit ofany bank and is not insured or guaranteed by the FDIC or any other governmentagency. Certain money market funds seek to preserve the value of their sharesat $1.00 per share, although there can be no assurance that they will do so, andit is possible to lose money by investing in such a money market fund. A majoror unexpected increase in interest rates or a decline in the credit quality of anissuer or entity providing credit support, an inactive trading market for moneymarket instruments, or adverse market, economic, industry, political, regulatory,geopolitical, and other conditions could cause the share price of such a moneymarket fund to fall below $1.00. It is possible that such a money market fundwill issue and redeem shares at $1.00 per share at times when the fair value ofthe money market fund’s portfolio per share is more or less than $1.00. Noneof State Street Corporation, State Street, State Street Global Advisors (“SSGA”),SSGA FM or their affiliates (“State Street Entities”) guarantee the value of aninvestment in a money market fund at $1.00 per share. Investors should haveno expectation of capital support to a money market fund from State Street Entities.Other money market funds price and transact at a “floating” NAV that will fluctuatealong with changes in the market-based value of fund assets. Shares sold utilizinga floating NAV may be worth more or less than their original purchase price.Recent changes in the regulation of money market funds may affect the operationsand structures of money market funds. A money market fund may be permittedor required to impose redemption fees or to impose limitations on redemptionsduring periods of high illiquidity in the markets for the investments held by it.
Derivatives Risk. A derivative is a financial contract the value of which dependson, or is derived from, the value of an underlying asset, interest rate, or index.Derivative transactions typically involve leverage and may have significant volatility.It is possible that a derivative transaction will result in a loss greater than theprincipal amount invested, and a Fund may not be able to close out a derivativetransaction at a favorable time or price. Risks associated with derivative instruments
90
include potential changes in value in response to interest rate changes or othermarket developments or as a result of the counterparty’s credit quality; the potentialfor the derivative transaction not to have the effect the Adviser anticipated ora different or less favorable effect than the Adviser anticipated; the failure of thecounterparty to the derivative transaction to perform its obligations under thetransaction or to settle a trade; possible mispricing or improper valuation of thederivative instrument; imperfect correlation in the value of a derivative with theasset, rate, or index underlying the derivative; the risk that a Fund may be requiredto post collateral or margin with its counterparty, and will not be able to recoverthe collateral or margin in the event of the counterparty’s insolvency or bankruptcy;the risk that a Fund will experience losses on its derivatives investments and onits other portfolio investments, even when the derivatives investments may beintended in part or entirely to hedge those portfolio investments; the risks specificto the asset underlying the derivative instrument; lack of liquidity for the derivativeinstrument, including without limitation absence of a secondary trading market;the potential for reduced returns to a Fund due to losses on the transaction andan increase in volatility; the potential for the derivative transaction to have theeffect of accelerating the recognition of gain; and legal risks arising from thedocumentation relating to the derivative transaction.
MANAGEMENTSSGA FM serves as the investment adviser to each Fund and, subject to thesupervision of the Board, is responsible for the investment management of eachFund. The Adviser provides an investment management program for each Fundand manages the investment of the Funds’ assets. The Adviser is a wholly-ownedsubsidiary of State Street Corporation and is registered with the U.S. Securitiesand Exchange Commission (“SEC”) under the Investment Advisers Act of 1940,as amended. The Adviser and certain other affiliates of State Street Corporationmake up SSGA. SSGA is one of the world’s largest institutional money managersand the investment management arm of State Street Corporation. As of December31, 2016, the Adviser managed approximately $410.71 billion in assets and SSGAmanaged approximately $2.47 trillion in assets. The Adviser’s principal businessaddress is State Street Financial Center, One Lincoln Street, Boston, Massachusetts02111.
For the services provided to each Fund in operation under the Investment AdvisoryAgreement as of the fiscal year ended September 30, 2016, the fee paid to theAdviser was equivalent to an effective rate of 0.04% of each applicable Fund’saverage daily net assets. The advisory fee is allocated pro rata to each such Fundbased upon the relative net assets of each Fund. From time to time, the Advisermay waive all or a portion of its fee, although the Adviser has informed the Trustthat it does not currently intend to do so, except as noted below.
91
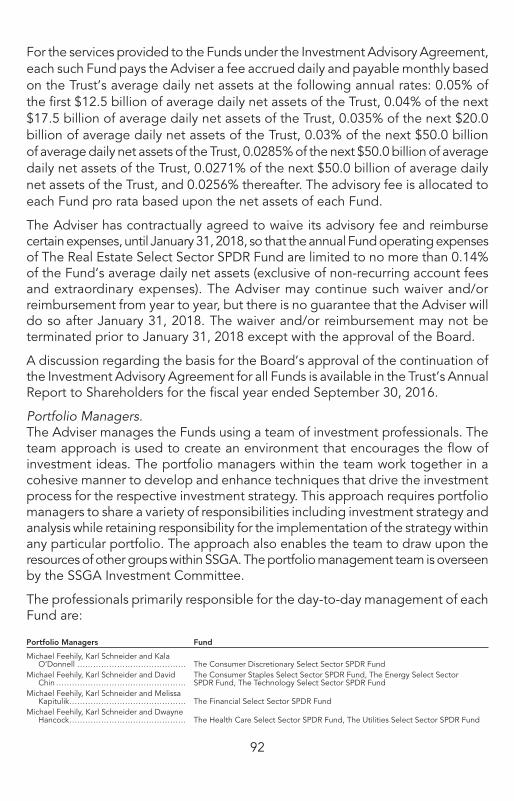
For the services provided to the Funds under the Investment Advisory Agreement,each such Fund pays the Adviser a fee accrued daily and payable monthly basedon the Trust’s average daily net assets at the following annual rates: 0.05% ofthe first $12.5 billion of average daily net assets of the Trust, 0.04% of the next$17.5 billion of average daily net assets of the Trust, 0.035% of the next $20.0billion of average daily net assets of the Trust, 0.03% of the next $50.0 billionof average daily net assets of the Trust, 0.0285% of the next $50.0 billion of averagedaily net assets of the Trust, 0.0271% of the next $50.0 billion of average dailynet assets of the Trust, and 0.0256% thereafter. The advisory fee is allocated toeach Fund pro rata based upon the net assets of each Fund.
The Adviser has contractually agreed to waive its advisory fee and reimbursecertain expenses, until January 31, 2018, so that the annual Fund operating expensesof The Real Estate Select Sector SPDR Fund are limited to no more than 0.14%of the Fund’s average daily net assets (exclusive of non-recurring account feesand extraordinary expenses). The Adviser may continue such waiver and/orreimbursement from year to year, but there is no guarantee that the Adviser willdo so after January 31, 2018. The waiver and/or reimbursement may not beterminated prior to January 31, 2018 except with the approval of the Board.
A discussion regarding the basis for the Board’s approval of the continuation ofthe Investment Advisory Agreement for all Funds is available in the Trust’s AnnualReport to Shareholders for the fiscal year ended September 30, 2016.
Portfolio Managers.The Adviser manages the Funds using a team of investment professionals. Theteam approach is used to create an environment that encourages the flow ofinvestment ideas. The portfolio managers within the team work together in acohesive manner to develop and enhance techniques that drive the investmentprocess for the respective investment strategy. This approach requires portfoliomanagers to share a variety of responsibilities including investment strategy andanalysis while retaining responsibility for the implementation of the strategy withinany particular portfolio. The approach also enables the team to draw upon theresources of other groups within SSGA. The portfolio management team is overseenby the SSGA Investment Committee.
The professionals primarily responsible for the day-to-day management of eachFund are:
Portfolio Managers Fund
Michael Feehily, Karl Schneider and KalaO’Donnell ......................................... The Consumer Discretionary Select Sector SPDR Fund
Michael Feehily, Karl Schneider and DavidChin .................................................
The Consumer Staples Select Sector SPDR Fund, The Energy Select SectorSPDR Fund, The Technology Select Sector SPDR Fund
Michael Feehily, Karl Schneider and MelissaKapitulik............................................ The Financial Select Sector SPDR Fund
Michael Feehily, Karl Schneider and DwayneHancock............................................ The Health Care Select Sector SPDR Fund, The Utilities Select Sector SPDR Fund
92

Portfolio Managers Fund
Michael Feehily, Karl Schneider and EmilianoRabinovich......................................... The Industrial Select Sector SPDR Fund
Michael Feehily, Karl Schneider and TedJanowsky .......................................... The Materials Select Sector SPDR Fund
Michael Feehily, Karl Schneider and AmyCheng .............................................. The Real Estate Select Sector SPDR Fund
Amy ChengAmy Cheng is a Vice President of SSGA and the Adviser and a Senior PortfolioManager in the Global Equity Beta Solutions Group. She is responsible for managingvarious domestic, international and emerging market strategies. Prior to assumingher current role in May 2008, Ms. Cheng worked in SSGA’s Implementation Group,where she performed the day-to-day management of active developed andemerging market equity portfolios. She also worked as an operations associateresponsible for funds managed by the active international equities team. Priorto joining SSGA in 2000, Ms. Cheng worked at Mellon Financial. Ms. Cheng earneda Bachelor of Arts in Economics and Political Science from the University of Rochesterand a Master of Business Administration from the Carroll School of Managementat Boston College. She is a member of the FTSE EPRA/NAREIT Global Real EstateIndex Series Americas Regional Advisory Committee.
David ChinDavid Chin is a Vice President of SSGA and the Adviser and a Senior PortfolioManager in the Global Equity Beta Solutions Group at SSGA. He is responsiblefor managing both U.S. and international funds. Prior to joining SSGA in 1999,Mr. Chin was a product analyst in the Analytical Services Group at Frank RussellCompany. Before this, he worked at OneSource Information Systems developinginvestment software. Preceding this, he was affiliated with PanAgora AssetManagement in the Research and Development group creating quantitativeinvestment models for international equities. Mr. Chin has been working in theinvestment management field since 1992. Mr. Chin holds a Bachelor of Sciencein Management Information Systems from the University of Massachusetts/Bostonand a Master of Business Administration from the University of Arizona.
Michael FeehilyMichael Feehily, CFA, is a Senior Managing Director of SSGA and the Adviserand the Head of Global Equity Beta Solutions in the Americas. He is also a memberof the Senior Leadership Team, Chairperson for the firm’s Trade ManagementOversight Committee and a voting member on the North America ProductCommittee. Mr. Feehily rejoined SSGA in 2010 after spending four years in StateStreet Global Markets, LLC, where he helped to build the Global Exposure Solutionsbusiness. This group created and managed portfolios that were designed to meetthe short-term market exposure needs of institutional clients. Prior to this, Mr.Feehily had been Head of the U.S. Passive Equity Team within SSGA, which he
93

originally joined in 1997. He began his career at State Street within the GlobalServices division in 1992. Mr. Feehily received a Bachelor of Science from BabsonCollege in Finance, Investments, and Economics. He received a Master of BusinessAdministration in Finance from Bentley College and also earned the CharteredFinancial Analyst (CFA) designation. Mr. Feehily is a member of the CFA Instituteand the Boston Security Analysts Society. He is also a former member of theRussell Index Client Advisory Board.
Dwayne HancockDwayne Hancock, CFA, is a Vice President of SSGA and the Adviser and a SeniorPortfolio Manager in the firm’s Global Equity Beta Solutions (GEBS) Group. Withinthis group, he is currently the strategy leader for the group’s non-US passiveproducts. Prior to taking on this responsibility, Mr. Hancock was the ETF productspecialist for the GEBS group. He is also a member of the SSGA ValuationCommittee. Mr. Hancock currently manages a varied mix of funds with both domesticand international strategies, which include separate accounts, commingled funds,mutual funds and ETFs. Additionally, he has played a primary role in determiningtrading strategies for significant benchmark changes such as the annual Russellindices reconstitution. Mr. Hancock joined SSGA in 1996 and became part ofthe GEBS portfolio management team in 1998. Prior to this, he worked in thefirm’s Passive International Equity Operations department as a senior analyst.He has been working in the investment management field since 1994. Mr. Hancockholds a Master of Business Administration from the Carroll School of Managementat Boston College and a Bachelor of Science in Business Administration fromFramingham State College. He also earned the Chartered Financial Analyst (CFA)designation and is a member of the Boston Security Analysts Society.
Ted JanowskyTed Janowsky, CFA, is a Vice President of SSGA and the Adviser and a SeniorPortfolio Manager in the Global Equity Beta Solutions Group. In this capacity,he manages a diverse group of equity and derivative-based index portfolios andhas played a significant role designing proprietary portfolio management software.Additionally, Mr. Janowsky is head of the portfolio management team of SSGA’sCompany Stock Group, which manages all fiduciary transactions and companystock investments including employee stock ownership plans, 401(k) plans, definedbenefit plans and non-qualified plans. Prior to joining the Global Equity BetaSolutions Group, he worked as an application developer in Investor TechnologyServices within State Street Corporation. He also worked as a business analystin State Street’s London and Sydney offices. Mr. Janowsky joined SSGA in 2005.Mr. Janowsky holds a Bachelor of Science in Business Administration from Bucknell
94

University and a Master of Business Administration from the Carroll School ofManagement at Boston College. He has also earned the Chartered FinancialAnalyst (CFA) designation and is a member of the CFA Institute and the BostonSecurity Analysts Society.
Melissa KapitulikMelissa Kapitulik is a Vice President of SSGA and the Adviser and a Senior PortfolioManager in the Global Equity Beta Solutions Group where she currently managesa varied group of equity and derivative-based index portfolios across a diverseset of fund types and regions. Before joining SSGA in 2006, Ms. Kapitulik wasa consultant specializing in accounting system implementations for major investmentmanagement companies and was responsible for the design and developmentof a wide variety of applications. She began her career at PIMCO, where sheworked for several years as a trading assistant in Global Fixed Income. Ms. Kapitulikholds a Bachelor of Science in Finance from Villanova University.
Kala O’DonnellKala O’Donnell, CFA, is a Vice President of SSGA and the Adviser and a SeniorPortfolio Manager in the Global Equity Beta Solutions Group. She is responsiblefor managing both domestic and international equity index portfolios, includinga variety of separate accounts, commingled funds, ETFs and alternative betastrategies. Additionally, Ms. O’Donnell has been involved in various research andprocess improvement projects, and has served as a hedging specialist withinthe Group. Prior to joining SSGA, Ms. O’Donnell worked in State Street Corporation’sMutual Funds division in the U.S., as well as in Canada and Germany. She hasbeen in the investment management field since she joined SSGA in 1995. Ms.O’Donnell holds a Bachelor of Science in Accounting from Lehigh University anda Master of Business Administration in International Business from Bentley College.She is member of the Chartered Financial Analyst (CFA) Institute and the BostonSecurity Analysts Society.
Emiliano RabinovichEmiliano Rabinovich, CFA, is a Vice President of SSGA and the Adviser and aSenior Portfolio Manager in the Global Equity Beta Solutions Group. Within thisgroup, he is the strategy leader for the Americas. Mr. Rabinovich currently managesa varied mix of funds that include both traditional indexing and a variety of alternativebeta mandates. Also, he manages several local and global strategies and fundstructures, which include separate accounts, commingled funds and mutual funds.Mr. Rabinovich joined SSGA in Montreal in 2006, where he was the Head of theGlobal Equity Beta Solutions Group in Canada. He has been working in theinvestment management field since 2003. Mr. Rabinovich holds a Bachelor of
95

Arts in Economics from the University of Buenos Aires and a Master of Arts inEconomics from the University of CEMA. He has also earned the Chartered FinancialAnalyst (CFA) designation and is a member of Boston Security Analysts Society.
Karl SchneiderKarl Schneider, CAIA, is a Vice President of SSGA and the Adviser and DeputyHead of Global Equity Beta Solutions (GEBS) in the Americas, where he alsoserves as a senior portfolio manager for a number of the group’s passive equityportfolios. Previously within GEBS, he served as a portfolio manager and productspecialist for U.S. equity strategies and synthetic beta strategies, includingcommodities, buy/write, and hedge fund replication. He is also a member of theS&P Dow Jones U.S. Equities Index Advisory Panel. Prior to joining the GEBSgroup, Mr. Schneider worked as a portfolio manager in SSGA’s CurrencyManagement Group, managing both active currency selection and traditionalpassive hedging overlay portfolios. He joined SSGA in 1997. Mr. Schneider holdsa Bachelor of Science in Finance and Investments from Babson College and aMaster of Science in Finance from the Carroll School of Management at BostonCollege. He has earned the Chartered Alternative Investment Analyst (CAIA)designation and is a member of the CAIA Association.
Additional information about the portfolio managers’ compensation, other accountsmanaged by the portfolio managers, and the portfolio managers’ ownership ofthe Funds is available in the SAI.
Administrator, Sub-Administrator, Custodian and Transfer Agent. The Adviserserves as Administrator for each Fund. State Street, part of State Street Corporation,is the Sub-Administrator for each Fund and the Custodian for each Fund’s assets,and serves as Transfer Agent to each Fund.
Lending Agent. State Street is the securities lending agent for each Fund. Forits services, the lending agent would typically receive a portion of the net investmentincome, if any, earned on the collateral for the securities loaned.
Distributor. ALPS Portfolio Solutions Distributor, Inc. (the “Distributor”) is thedistributor of Fund Shares. The Distributor will not distribute Fund Shares in lessthan Creation Units, and it does not maintain a secondary market in Fund Shares.The Distributor may enter into selected dealer agreements with other broker-dealersor other qualified financial institutions for the sale of Creation Units of Fund Shares.
Additional Information. The Board oversees generally the operations of the Fundsand the Trust. The Trust enters into contractual arrangements with various parties,including among others the Funds’ investment adviser, custodian, transfer agent,and accountants, who provide services to the Funds. Shareholders are not partiesto any such contractual arrangements or intended beneficiaries of those contractual
96

arrangements, and those contractual arrangements are not intended to createin any shareholder any right to enforce them directly against the service providersor to seek any remedy under them directly against the service providers.
This Prospectus provides information concerning the Trust and the Funds thatyou should consider in determining whether to purchase Fund Shares. Neitherthis Prospectus nor the related SAI is intended, or should be read, to be or giverise to an agreement or contract between the Trust or the Funds and any investor,or to give rise to any rights in any shareholder or other person other than anyrights under federal or state law that may not be waived.
ADDITIONAL INDEX INFORMATION
Index License
S&P Opco, LLC, a subsidiary of S&P DJI and an affiliate of McGraw Hill Financial,Inc. (“S&P”), NYSE Arca, Inc. (either directly or through affiliates) and BofA MerrillLynch have entered into a license agreement with respect to each Fund’s SelectSector Index. The Trust has entered into a sublicense agreement with S&P andBofA Merrill Lynch, dated December 15, 1998, as amended from time to time,whereby the Trust agrees to pay a sublicense fee per annum (i) to S&P equal to0.03% of the aggregate net assets of all series of the Trust, subject to a breakpoint,and (ii) to BofA Merrill Lynch equal to 0.03% of the aggregate net assets of allseries of the Trust, subject to certain breakpoints. The fees to S&P and BofA MerrillLynch are generally paid quarterly. Each Fund will pay its proportionate shareof the annual sublicense fees based on the relative net assets of each Fund. BofAMerrill Lynch is the marketing name for the global banking and global marketsbusinesses of Bank of America Corporation. The Select Sector Indices are licensedby, and payments by the Trust are made to, Merrill Lynch, Pierce, Fenner & SmithIncorporated, an affiliate of Bank of America Corporation.
Additional Information Concerning Index Construction and MaintenanceThe Index Compilation Agent assigns each constituent stock of the S&P 500 Indexto a Select Sector Index in alignment with the stock’s GICS (Global IndustryClassification Standard) classification, except that stocks classified in either theGICS Information Technology Sector or the GICS Telecommunication ServicesSector will be assigned to the Technology Select Sector Index. Changes to theS&P 500 Index are made as needed, with no annual or semi-annual reconstitution.S&P DJI has sole control over the removal of stocks from the S&P 500 Index andthe selection of replacement stocks to be added to the S&P 500 Index.
97
Additional Information Concerning the Role of S&P and BofA Merrill LynchThe stocks included in each Index are selected from the universe of companiesrepresented by the S&P 500 Index. The weighting of the stocks included in eachSelect Sector Index will likely differ from the weighting of stocks included in anysimilar S&P 500 sector index that is published and disseminated by S&P DJI becausethe weightings are based on BofA Merrill Lynch’s proprietary methodology. S&PDJI acts as “index calculation agent” in connection with the calculation anddissemination of each Select Sector Index.
S&P DJI and its affiliates do not sponsor, endorse, sell or promote Fund Shares.Additionally, BofA Merrill Lynch does not sponsor or promote Fund Shares.
Neither S&P DJI, nor BofA Merrill Lynch, nor their respective affiliates make anyrepresentation or warranty, express or implied, to SSGA FM, the owners of FundShares of the Select Sector SPDR Funds or any member of the public regardingthe ability of a Fund to track the performance of the various sectors representedin the stock market. Additionally, S&P DJI, BofA Merrill Lynch and their respectiveaffiliates do not make any representation or warranty, express or implied, to SSGAFM, the owners of Fund Shares or any member of the public regarding theadvisability of investing in securities generally or in Fund Shares particularly.
S&P DJI’s and BofA Merrill Lynch’s only relationship to SSGA FM and the Trustwith respect to the Select Sector Indices is the licensing of certain trademarksand trade names of S&P, BofA Merrill Lynch, the S&P 500 Index and Select SectorIndices which are determined, composed and calculated by S&P DJI withoutregard to SSGA FM or any Fund. S&P®, S&P 500® and “Select Sector” are trademarksof Standard & Poor’s Financial Services LLC, an affiliate of S&P DJI; Dow Jones®
is a trademark of Dow Jones Trademark Holdings LLC; and these trademarkshave been licensed for use by S&P DJI and sublicensed for certain purposes bySSGA FM and the Trust. S&P DJI, BofA Merrill Lynch and their affiliates have noobligation to take the needs of SSGA FM, the Trust or the owners of Fund Sharesinto consideration in determining, composing or calculating the S&P 500 or theSelect Sector Indices.
Although S&P DJI seeks to obtain and use information from sources which itconsiders reliable, S&P DJI, BofA Merrill Lynch and their affiliates do not guaranteethe accuracy and/or completeness of the S&P 500 Index, any Select Sector SPDRIndex (collectively, the “Indexes”) or any data related thereto. S&P DJI, BofAMerrill Lynch and their affiliates make no warranty, express or implied, as to resultsto be obtained by SSGA FM, the Trust, owners of a Fund, or any other personor entity from the use of the S&P 500 Index, the Indexes or any data relatedthereto in connection with the rights licensed under the license agreement orfor any other use. S&P DJI, BofA Merrill Lynch and their affiliates make no expressor implied warranties, and hereby expressly disclaim all warranties of merchantabilityor fitness for a particular purpose with respect to the S&P 500 Index, the Indexes
98

or any data related thereto. Without limiting any of the foregoing, in no eventshall S&P DJI, BofA Merrill Lynch and their respective affiliates have any liabilityfor any special, punitive, indirect or consequential damages (including lost profits),even if notified of the possibility of such damages.
The Indexes identified herein are determined, composed and calculated withoutregard to any Fund Shares or the issuer thereof. Neither S&P DJI nor BofA MerrillLynch is responsible for, or has participated in, the determination of the timingof, prices of, or quantities of any Fund Shares to be issued, nor in the determinationor calculation of the equation by which Fund Shares are redeemable.
ADDITIONAL PURCHASE AND SALE INFORMATIONFund Shares are listed for secondary trading on the Exchange and individualFund Shares may only be purchased and sold in the secondary market througha broker-dealer. The secondary markets are closed on weekends and also aregenerally closed on the following holidays: New Year’s Day, Dr. Martin LutherKing, Jr. Day, Presidents’ Day, Good Friday, Memorial Day (observed), IndependenceDay, Labor Day, Thanksgiving Day and Christmas Day. The Exchange may closeearly on the business day before certain holidays and on the day after ThanksgivingDay. Exchange holiday schedules are subject to change without notice. If youbuy or sell Fund Shares in the secondary market, you will pay the secondary marketprice for Fund Shares. In addition, you may incur customary brokerage commissionsand charges and may pay some or all of the spread between the bid and theoffered price in the secondary market on each leg of a round trip (purchase andsale) transaction.
The trading prices of Fund Shares will fluctuate continuously throughout tradinghours based on market supply and demand rather than the relevant Fund’s netasset value, which is calculated at the end of each business day. Fund Shareswill trade on the Exchange at prices that may be above (i.e., at a premium) orbelow (i.e., at a discount), to varying degrees, the daily net asset value of FundShares. The trading prices of Fund Shares may deviate significantly from the relevantFund’s net asset value during periods of market volatility. Given, however, thatFund Shares can be issued and redeemed daily in Creation Units, the Adviserbelieves that large discounts and premiums to net asset value should not besustained over long periods. Information showing the number of days the marketprice of Fund Shares was greater than the relevant Fund’s net asset value andthe number of days it was less than the relevant Fund’s net asset value (i.e., premiumor discount) for various time periods is available by visiting the Funds’ websiteat www.sectorspdrs.com.
99
The Exchange will disseminate, every fifteen seconds during the regular tradingday, an indicative optimized portfolio value (“IOPV”) relating to the Funds. TheIOPV calculations are estimates of the value of the Funds’ net asset value perFund Share using market data. Premiums and discounts between the IOPV andthe market price may occur. This should not be viewed as a “real-time” updateof the net asset value per Fund Share, which is calculated only once a day. Neitherthe Funds nor the Adviser or any of their affiliates are involved in, or responsiblefor, the calculation or dissemination of such IOPVs and make no warranty as totheir accuracy.
The Funds do not impose any restrictions on the frequency of purchases andredemptions; however, the Funds reserve the right to reject or limit purchasesat any time as described in the SAI. When considering that no restriction or policywas necessary, the Board evaluated the risks posed by market timing activities,such as whether frequent purchases and redemptions would interfere with theefficient implementation of a Fund’s investment strategy, or whether they wouldcause a Fund to experience increased transaction costs. The Board consideredthat, unlike traditional mutual funds, Fund Shares are issued and redeemed onlyin large quantities of shares known as Creation Units, available only from a Funddirectly, and that most trading in a Fund occurs on the Exchange at prevailingmarket prices and does not involve the Fund directly. Given this structure, theBoard determined that it is unlikely that (a) market timing would be attemptedby a Fund’s shareholders or (b) any attempts to market time a Fund by shareholderswould result in negative impact to the Fund or its shareholders.
In addition, certain affiliates of each Fund and SSGA FM may purchase and resellor distribute Fund Shares pursuant to the registration statement of which thisProspectus is a part.
DISTRIBUTION AND SERVICE PLANEach Fund has adopted a Distribution and Service Plan in accordance with Rule12b-1 under the 1940 Act pursuant to which payments at an annual rate of upto 0.25% of the Fund’s average daily net assets may be made for the sale anddistribution of Fund Shares. Effective October 1, 2015, the Board has limitedeach Fund’s 12b-1 fee to an annual rate of 0.040% of its average daily net assetsthrough at least January 31, 2018 (prior to October 1, 2015, each applicableFund’s 12b-1 fee was limited to an annual rate of 0.044% of its average dailynet assets). Because these fees would be paid out of a Fund’s assets on an on-goingbasis, these fees will increase the cost of your investment and may cost you moreover time than paying other types of sales charges.
100
DISTRIBUTIONSDividends and Capital Gains. As a Fund shareholder, you are entitled to yourshare of the applicable Fund’s income and net realized gains on its investments.Each Fund pays out substantially all of its net earnings to its shareholders as“distributions.”
Each Fund typically earns income dividends from stocks, interest from debt securitiesand securities lending income. These amounts, net of expenses and taxes (ifapplicable), are passed along to Fund shareholders as “income dividenddistributions.” Each Fund will generally realize short-term capital gains or losseswhenever it sells or exchanges assets held for one year or less. Net short-termcapital gains will generally be treated as ordinary income when distributed toshareholders. Each Fund will generally realize long-term capital gains or losseswhenever it sells or exchanges assets held for more than one year. Net capitalgains (the excess of a Fund’s net long-term capital gains over its net short-termcapital losses) are distributed to shareholders as “capital gain distributions.”
Income dividend distributions, if any, are generally distributed to shareholdersquarterly, but may vary significantly from period to period.
Net capital gains for each Fund are distributed at least annually. Dividends maybe declared and paid more frequently or at any other times to improve Indextracking or to comply with the distribution requirements of the Internal RevenueCode.
In addition, each Fund intends to distribute at least annually amounts representingthe full dividend yield net of expenses on the underlying investment securitiesas if the Fund owned the underlying investment securities for the entire dividendperiod. As a result, some portion of each distribution may result in a return ofcapital. You will be notified regarding the portion of the distribution which representsa return of capital.
Distributions in cash may be reinvested automatically in additional whole sharesonly if the broker through whom you purchased shares makes such option available.Dividends which are reinvested will nevertheless be taxable to the same extentas if such dividends had not been reinvested.
PORTFOLIO HOLDINGS DISCLOSUREThe Funds’ portfolio holdings disclosure policy is described in the SAI. In addition,the identities and quantities of the securities held by each Fund are disclosedon the Funds’ website.
101

ADDITIONAL TAX INFORMATIONThe following discussion is a summary of some important U.S. federal taxconsiderations generally applicable to an investment in a Fund. Your investmentin a Fund may have other tax implications. Please consult your tax advisor aboutfederal, state, local, foreign or other tax laws applicable to you. Investors, includingnon-U.S. investors, may wish to consult the SAI tax section for additional disclosure.
Each Fund has elected or will elect to be a regulated investment company andintends to qualify each year to be treated as such. A regulated investment companyis generally not subject to tax at the corporate level on income and gains thatare distributed to shareholders. However, a Fund’s failure to qualify for treatmentas a regulated investment company may result in corporate level taxation, andconsequently, a reduction in income available for distribution to shareholders.
In general, your distributions are subject to federal income tax when they arepaid, whether you take them in cash or reinvest them in a Fund. The incomedividends and short-term capital gains distributions you receive from a Fund willbe taxed as either ordinary income or qualified dividend income. Subject to certainlimitations, dividends that are reported by a Fund as qualified dividend incomeare taxable to noncorporate shareholders at rates of up to 20%. Any distributionsof a Fund’s net capital gains are taxable as long-term capital gain regardless ofhow long you have owned Fund Shares. Long-term capital gains are generallytaxed to noncorporate shareholders at rates of up to 20%. Distributions in excessof a Fund’s current and accumulated earnings and profits are treated as a tax-freereturn of capital to the extent of your basis in the applicable Fund’s shares, and,in general, as capital gain thereafter.
In general, dividends may be reported by a Fund as qualified dividend incomeif they are attributable to qualified dividend income received by such Fund, which,in general, includes dividend income from taxable U.S. corporations and certainforeign corporations (i.e., certain foreign corporations incorporated in a possessionof the United States or in certain countries with a comprehensive tax treaty withthe United States, and certain other foreign corporations if the stock with respectto which the dividend is paid is readily tradable on an established securities marketin the United States), provided that the Fund satisfies certain holding periodrequirements in respect of the stock of such corporations and has not hedgedits position in the stock in certain ways. A dividend generally will not be treatedas qualified dividend income if the dividend is received with respect to any shareof stock held by a Fund for fewer than 61 days during the 121-day period beginningat the date which is 60 days before the date on which such share becomesex-dividend with respect to such dividend. These holding period requirements
102
will also apply to your ownership of Fund Shares. Holding periods may be suspendedfor these purposes for stock that is hedged. Additionally, income derived inconnection with a Fund’s securities lending activities will not be treated as qualifieddividend income.
If you lend your Fund Shares pursuant to securities lending arrangements youmay lose the ability to treat Fund dividends (paid while Fund Shares are heldby the borrower) as qualified dividend income. You should consult your financialintermediary or tax advisor to discuss your particular circumstances.
Distributions paid in January, but declared by a Fund in October, November orDecember of the previous year, payable to shareholders of record in such a month,may be taxable to you in the calendar year in which they were declared. TheFunds will inform you of the amount of your ordinary income dividends, qualifieddividend income and capital gain distributions shortly after the close of eachcalendar year.
A distribution will reduce a Fund’s net asset value per Fund Share and may betaxable to you as ordinary income or capital gain even though, from an investmentstandpoint, the distribution may constitute a return of capital.
Derivatives and Other Complex Securities. A Fund may invest in complex securities.These investments may be subject to numerous special and complex rules. Theserules could affect whether gains and losses recognized by a Fund are treatedas ordinary income or capital gain, accelerate the recognition of income to aFund and/or defer a Fund’s ability to recognize losses. In turn, these rules mayaffect the amount, timing or character of the income distributed to you by a Fund.You should consult your personal tax advisor regarding the application of theserules.
Foreign Income Taxes. Investment income received by a Fund from sources withinforeign countries may be subject to foreign income taxes withheld at the source.The United States has entered into tax treaties with many foreign countries whichmay entitle a Fund to a reduced rate of such taxes or exemption from taxes onsuch income. It is impossible to determine the effective rate of foreign tax for aFund in advance since the amount of the assets to be invested within variouscountries is not known.
U.S. individuals with income exceeding specified thresholds are subject to a 3.8%Medicare contribution tax on all or a portion of their “net investment income,”which includes taxable interest, dividends and certain capital gains (generallyincluding capital gain distributions and capital gains realized upon the sale ofFund Shares). This 3.8% tax also applies to all or a portion of the undistributednet investment income of certain shareholders that are estates and trusts.
103
Non-U.S. Investors. Ordinary income dividends paid by a Fund to shareholderswho are non-resident aliens or foreign entities will generally be subject to a 30%U.S. withholding tax, unless a lower treaty rate applies or unless such income iseffectively connected with a U.S. trade or business. Gains on the sale of FundShares and dividends that are, in each case, effectively connected with the conductof a trade or business within the U.S. will generally be subject to U.S. federalnet income taxation at regular income tax rates. Non-U.S. shareholders that own,directly or indirectly, more than 5% of a Fund’s shares are urged to consult theirown tax advisors concerning special tax rules that may apply to their investment.
Unless certain non-U.S. entities that hold Fund Shares comply with IRS requirementsthatwill generally require themto report information regardingU.S.persons investingin, or holding accounts with, such entities, a 30% withholding tax may apply todistributions payable to such entities and, after December 31, 2018, redemptionproceeds and certain capital gain dividends payable to such entities. A non-U.S.shareholder may be exempt from the withholding described in this paragraphunder an applicable intergovernmental agreement between the U.S. and a foreigngovernment, provided that the shareholder and the applicable foreign governmentcomply with the terms of such agreement.
Taxes on Exchange-Listed Share Sales. Any capital gain or loss realized upon asale of Fund Shares is generally treated as long-term capital gain or loss if FundShares have been held for more than one year and as short-term capital gain orloss if Fund Shares have been held for one year or less, except that any capitalloss on the sale of Fund Shares held for six months or less is treated as long-termcapital loss to the extent that capital gain dividends were paid with respect tosuch Fund Shares.
Taxes on Creations and Redemptions of Creation Units. A person who exchangessecurities for Creation Units generally will recognize a gain or loss. The gain orloss will be equal to the difference between the market value of the CreationUnits at the time and the exchanger’s aggregate basis in the securities surrenderedplus any cash paid for the Creation Units. A person who exchanges CreationUnits for securities will generally recognize a gain or loss equal to the differencebetween the exchanger’s basis in the Creation Units and the aggregate marketvalue of the securities and the amount of cash received. The Internal RevenueService (the “IRS”), however, may assert that a loss realized upon an exchangeof securities for Creation Units cannot be deducted currently under the rulesgoverning “wash sales,” or on the basis that there has been no significant changein economic position. Persons exchanging securities should consult their owntax advisor with respect to whether wash sale rules apply and when a loss mightbe deductible.
104
Under current federal tax laws, any capital gain or loss realized upon a redemption(or creation) of Creation Units is generally treated as long-term capital gain orloss if the applicable Fund Shares (or securities surrendered) have been held formore than one year and as a short-term capital gain or loss if the applicableFund Shares (or securities surrendered) have been held for one year or less.
If you create or redeem Creation Units, you will be sent a confirmation statementshowing how many Fund Shares you purchased or sold and at what price.
If a Fund redeems Creation Units in cash, it may recognize more capital gainsthan it will if it redeems Creation Units in-kind.
Backup Withholding. A Fund will be required in certain cases to withhold (as“backup withholding”) on amounts payable to any shareholder who (1) has providedthe Fund either an incorrect tax identification number or no number at all, (2) issubject to backup withholding by the IRS for failure to properly report paymentsof interest or dividends, (3) has failed to certify to the Fund that such shareholderis not subject to backup withholding, or (4) has not certified that such shareholderis a U.S. person (including a U.S. resident alien). The backup withholding rate is28%. Backup withholding will not be applied to payments that have been subjectto the 30% withholding tax on shareholders who are neither citizens nor permanentresidents of the United States.
Certain Potential Tax Reporting Requirements. Under U.S. Treasury regulations,if a shareholder recognizes a loss of $2 million or more for an individual shareholderor $10 million or more for a corporate shareholder (or certain greater amountsover a combination of years), the shareholder must file with the Internal RevenueService a disclosure statement on Form 8886. Direct shareholders of portfoliosecurities are in many cases excepted from this reporting requirement, but undercurrent guidance shareholders of a RIC are not excepted. Significant penaltiesmay be imposed for the failure to comply with the reporting requirements. Thefact that a loss is reportable under these regulations does not affect the legaldetermination of whether the taxpayer’s treatment of the loss is proper. Shareholdersshould consult their tax advisors to determine the applicability of these regulationsin light of their individual circumstances.
Other Tax Issues. A Fund may be subject to tax in certain states where the Funddoes business. Furthermore, in those states which have income tax laws, the taxtreatment of the Funds and of Fund shareholders with respect to distributionsby the Funds may differ from federal tax treatment.
The foregoing discussion summarizes some of the consequences under currentfederal tax law of an investment in the Funds. It is not a substitute for personaltax advice. Consult your personal tax advisor about the potential tax consequencesof an investment in the Funds under all applicable tax laws.
105

GENERAL INFORMATIONThe Trust was organized as a Massachusetts business trust on June 10, 1998. Ifshareholders of any Fund are required to vote on any matters, shareholders areentitled to one vote for each Fund Share they own. Annual meetings of shareholderswill not be held except as required by the 1940 Act and other applicable law.See the SAI for more information concerning the Trust’s form of organization.
Management and OrganizationEach Fund is a separate, non-diversified series of the Trust, which is an open-endregistered management investment company.
For purposes of the 1940 Act, Fund Shares are issued by the respective seriesof the Trust and the acquisition of Fund Shares by investment companies is subjectto the restrictions of Section 12(d)(1) of the 1940 Act.
The Trust has received exemptive relief from Section 12(d)(1) to allow registeredinvestment companies to invest in the Funds beyond the limits set forth in Section12(d)(1), subject to certain terms and conditions as set forth in an SEC exemptiveorder issued to the Trust, including that such investment companies enter intoan agreement with the Trust.
From time to time, a Fund may advertise yield and total return figures. Yield isa historical measure of dividend income, and total return is a measure of pastdividend income (assuming that it has been reinvested) plus capital appreciation.Neither yield nor total return should be used to predict the future performanceof a Fund.
Clifford Chance US LLP serves as counsel to the Trust, including the Funds.PricewaterhouseCoopers LLP serves as the independent registered publicaccounting firm and will audit the Funds’ financial statements annually.
PREMIUM/DISCOUNT INFORMATIONInformation showing the number of days the market price of a Fund’s shares wasgreater than a Fund’s NAV per Fund Share (i.e., at a premium) and the numberof days it was less than the Fund’s NAV per Fund Share (i.e., at a discount) forvarious time periods is available by visiting the Funds’ website atwww.sectorspdrs.com.
FINANCIAL HIGHLIGHTSThe financial highlight tables below are intended to help you understand eachFund’s financial performance for the past five fiscal years or, if shorter, the periodsince each Fund’s inception. Certain information reflects the performance results
106
for a single Fund Share. The total returns in the table represent the rate that aninvestor would have earned (or lost) on an investment in each Fund (assumingreinvestment of all dividends and distributions). This information has been auditedby PricewaterhouseCoopers LLP, the Trust’s independent registered publicaccounting firm, whose report, along with each Fund’s financial highlights andfinancial statements, is included in the annual report to shareholders, which isavailable upon request. The financial information included in these tables shouldbe read in conjunction with the financial statements incorporated by referencein the SAI.
107

The Consumer Discretionary Select Sector SPDR Fund
YearEnded
9/30/16
YearEnded
9/30/15
YearEnded
9/30/14
YearEnded
9/30/13
YearEnded
9/30/12
Net asset value, beginning ofperiod. . . . . . . . . . . . . . . . . . . . . . . . . . . . . . . $ 74.26 $ 66.69 $ 60.59 $ 46.79 $ 34.88
Income (loss) from investmentoperations: . . . . . . . . . . . . . . . . . . . . . . . . .
Net investment income (loss) (a) . . . . . . . . 1.22 1.05 0.90 0.83 0.66Net realized and unrealized gain
(loss) (b) . . . . . . . . . . . . . . . . . . . . . . . . . . . . . . 5.79 7.55 6.10 13.73 11.88
Total from investment operations . . . . . . 7.01 8.60 7.00 14.56 12.54
Net equalization credits andcharges (a) . . . . . . . . . . . . . . . . . . . . . . . . . . . (0.02) 0.05 0.01 0.06 0.04
Distributions to shareholders from: . .Net investment income . . . . . . . . . . . . . . . . (1.22) (1.08) (0.91) (0.82) (0.67)
Net asset value, end of period . . . . . . . $ 80.03 $ 74.26 $ 66.69 $ 60.59 $ 46.79
Total return (c) . . . . . . . . . . . . . . . . . . . . . . . . 9.48% 12.98% 11.59% 31.50% 36.25%Ratios and Supplemental Data: . . . . . .Net assets, end of period (in 000s). . . . . $9,531,929 $10,117,642 $6,712,778 $6,734,928 $3,343,159Ratios to average net assets: . . . . . . . . .Total expenses . . . . . . . . . . . . . . . . . . . . . . . . . 0.14% 0.15% 0.15% 0.17% 0.18%Net investment income (loss) . . . . . . . . . . 1.56% 1.41% 1.37% 1.55% 1.55%Portfolio turnover rate (d). . . . . . . . . . . . . . . 10% 6% 5% 8% 5%
(a) Per share numbers have been calculated using average shares outstanding, which more appropriatelypresents the per share data for the year.
(b) Amounts shown in this caption for a share outstanding may not accord with the change in aggregategains and losses in securities for the fiscal period because of the timing of sales and repurchasesof Fund shares in relation to fluctuating market values for the Fund.
(c) Total return is calculated assuming a purchase of shares at net asset value on the first day anda sale at net asset value on the last day of each period reported. Distributions are assumed, forthe purpose of this calculation, to be reinvested at net asset value per share on the respectivepayment dates of each distribution. Total return for periods of less than one year is not annualized.Broker commission charges are not included in this calculation.
(d) Portfolio turnover rate excludes securities received or delivered from in-kind processing of creationsor redemptions on Select Sector SPDR shares.
FINANCIAL HIGHLIGHTSSelected data for a Select Sector SPDR share outstanding throughout each year
108
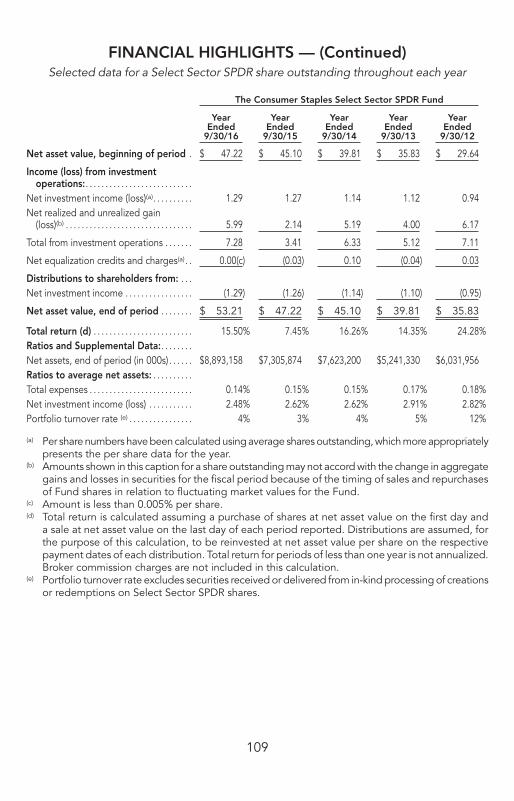
The Consumer Staples Select Sector SPDR Fund
YearEnded
9/30/16
YearEnded
9/30/15
YearEnded
9/30/14
YearEnded
9/30/13
YearEnded
9/30/12
Net asset value, beginning of period . $ 47.22 $ 45.10 $ 39.81 $ 35.83 $ 29.64
Income (loss) from investmentoperations:. . . . . . . . . . . . . . . . . . . . . . . . . . .
Net investment income (loss)(a). . . . . . . . . . 1.29 1.27 1.14 1.12 0.94Net realized and unrealized gain
(loss)(b) . . . . . . . . . . . . . . . . . . . . . . . . . . . . . . . . 5.99 2.14 5.19 4.00 6.17
Total from investment operations . . . . . . . 7.28 3.41 6.33 5.12 7.11
Net equalization credits and charges(a). . 0.00(c) (0.03) 0.10 (0.04) 0.03
Distributions to shareholders from: . . .Net investment income . . . . . . . . . . . . . . . . . (1.29) (1.26) (1.14) (1.10) (0.95)
Net asset value, end of period . . . . . . . . $ 53.21 $ 47.22 $ 45.10 $ 39.81 $ 35.83
Total return (d) . . . . . . . . . . . . . . . . . . . . . . . . . 15.50% 7.45% 16.26% 14.35% 24.28%Ratios and Supplemental Data:. . . . . . . .Net assets, end of period (in 000s) . . . . . . $8,893,158 $7,305,874 $7,623,200 $5,241,330 $6,031,956Ratios to average net assets: . . . . . . . . . .Total expenses . . . . . . . . . . . . . . . . . . . . . . . . . . 0.14% 0.15% 0.15% 0.17% 0.18%Net investment income (loss) . . . . . . . . . . . 2.48% 2.62% 2.62% 2.91% 2.82%Portfolio turnover rate (e) . . . . . . . . . . . . . . . . 4% 3% 4% 5% 12%
(a) Per share numbers have been calculated using average shares outstanding, which more appropriatelypresents the per share data for the year.
(b) Amounts shown in this caption for a share outstanding may not accord with the change in aggregategains and losses in securities for the fiscal period because of the timing of sales and repurchasesof Fund shares in relation to fluctuating market values for the Fund.
(c) Amount is less than 0.005% per share.(d) Total return is calculated assuming a purchase of shares at net asset value on the first day and
a sale at net asset value on the last day of each period reported. Distributions are assumed, forthe purpose of this calculation, to be reinvested at net asset value per share on the respectivepayment dates of each distribution. Total return for periods of less than one year is not annualized.Broker commission charges are not included in this calculation.
(e) Portfolio turnover rate excludes securities received or delivered from in-kind processing of creationsor redemptions on Select Sector SPDR shares.
FINANCIAL HIGHLIGHTS — (Continued)Selected data for a Select Sector SPDR share outstanding throughout each year
109
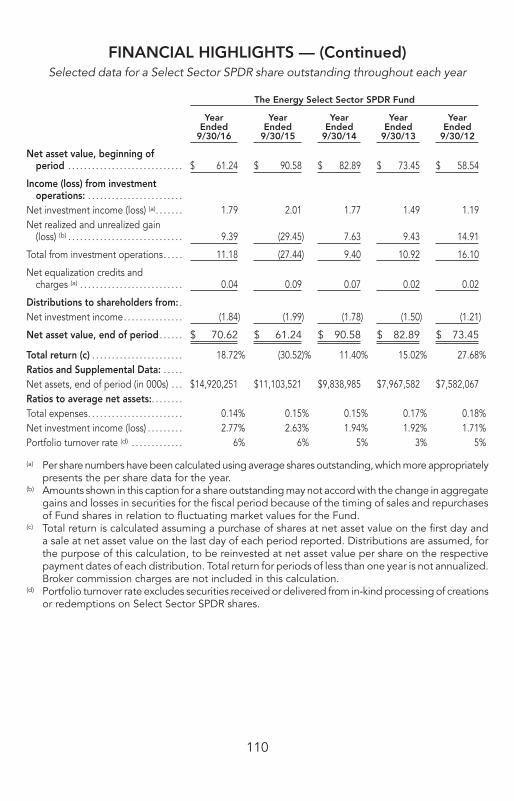
The Energy Select Sector SPDR Fund
YearEnded
9/30/16
YearEnded
9/30/15
YearEnded
9/30/14
YearEnded
9/30/13
YearEnded
9/30/12
Net asset value, beginning ofperiod . . . . . . . . . . . . . . . . . . . . . . . . . . . . . $ 61.24 $ 90.58 $ 82.89 $ 73.45 $ 58.54
Income (loss) from investmentoperations: . . . . . . . . . . . . . . . . . . . . . . . .
Net investment income (loss) (a). . . . . . . 1.79 2.01 1.77 1.49 1.19Net realized and unrealized gain
(loss) (b) . . . . . . . . . . . . . . . . . . . . . . . . . . . . . 9.39 (29.45) 7.63 9.43 14.91
Total from investment operations. . . . . 11.18 (27.44) 9.40 10.92 16.10
Net equalization credits andcharges (a) . . . . . . . . . . . . . . . . . . . . . . . . . . 0.04 0.09 0.07 0.02 0.02
Distributions to shareholders from: .Net investment income. . . . . . . . . . . . . . . (1.84) (1.99) (1.78) (1.50) (1.21)
Net asset value, end of period . . . . . . $ 70.62 $ 61.24 $ 90.58 $ 82.89 $ 73.45
Total return (c) . . . . . . . . . . . . . . . . . . . . . . . 18.72% (30.52)% 11.40% 15.02% 27.68%Ratios and Supplemental Data: . . . . .Net assets, end of period (in 000s) . . . $14,920,251 $11,103,521 $9,838,985 $7,967,582 $7,582,067Ratios to average net assets:. . . . . . . .Total expenses. . . . . . . . . . . . . . . . . . . . . . . . 0.14% 0.15% 0.15% 0.17% 0.18%Net investment income (loss) . . . . . . . . . 2.77% 2.63% 1.94% 1.92% 1.71%Portfolio turnover rate (d) . . . . . . . . . . . . . 6% 6% 5% 3% 5%
(a) Per share numbers have been calculated using average shares outstanding, which more appropriatelypresents the per share data for the year.
(b) Amounts shown in this caption for a share outstanding may not accord with the change in aggregategains and losses in securities for the fiscal period because of the timing of sales and repurchasesof Fund shares in relation to fluctuating market values for the Fund.
(c) Total return is calculated assuming a purchase of shares at net asset value on the first day anda sale at net asset value on the last day of each period reported. Distributions are assumed, forthe purpose of this calculation, to be reinvested at net asset value per share on the respectivepayment dates of each distribution. Total return for periods of less than one year is not annualized.Broker commission charges are not included in this calculation.
(d) Portfolio turnover rate excludes securities received or delivered from in-kind processing of creationsor redemptions on Select Sector SPDR shares.
FINANCIAL HIGHLIGHTS — (Continued)Selected data for a Select Sector SPDR share outstanding throughout each year
110
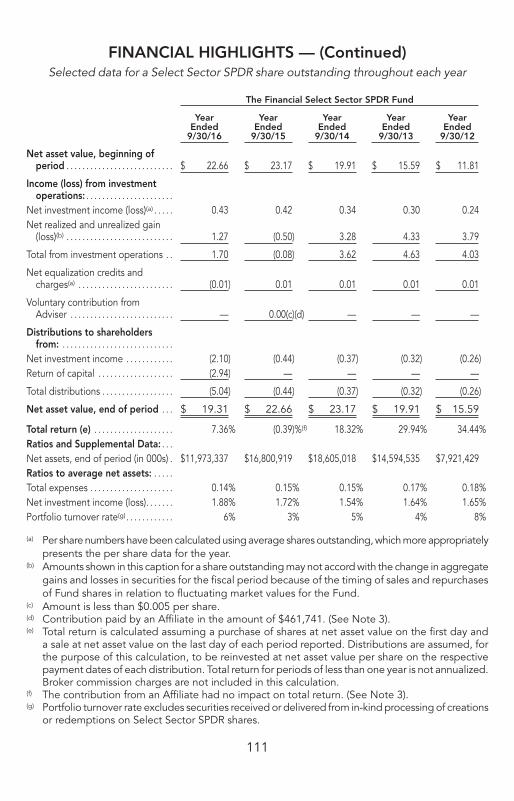
The Financial Select Sector SPDR Fund
YearEnded
9/30/16
YearEnded
9/30/15
YearEnded
9/30/14
YearEnded
9/30/13
YearEnded
9/30/12
Net asset value, beginning ofperiod . . . . . . . . . . . . . . . . . . . . . . . . . . . $ 22.66 $ 23.17 $ 19.91 $ 15.59 $ 11.81
Income (loss) from investmentoperations: . . . . . . . . . . . . . . . . . . . . . .
Net investment income (loss)(a) . . . . . 0.43 0.42 0.34 0.30 0.24Net realized and unrealized gain
(loss)(b) . . . . . . . . . . . . . . . . . . . . . . . . . . . 1.27 (0.50) 3.28 4.33 3.79
Total from investment operations . . 1.70 (0.08) 3.62 4.63 4.03
Net equalization credits andcharges(a) . . . . . . . . . . . . . . . . . . . . . . . . (0.01) 0.01 0.01 0.01 0.01
Voluntary contribution fromAdviser . . . . . . . . . . . . . . . . . . . . . . . . . . — 0.00(c)(d) — — —
Distributions to shareholdersfrom: . . . . . . . . . . . . . . . . . . . . . . . . . . . .
Net investment income . . . . . . . . . . . . (2.10) (0.44) (0.37) (0.32) (0.26)Return of capital . . . . . . . . . . . . . . . . . . . (2.94) — — — —
Total distributions . . . . . . . . . . . . . . . . . . (5.04) (0.44) (0.37) (0.32) (0.26)
Net asset value, end of period . . . $ 19.31 $ 22.66 $ 23.17 $ 19.91 $ 15.59
Total return (e) . . . . . . . . . . . . . . . . . . . . 7.36% (0.39)%(f) 18.32% 29.94% 34.44%Ratios and Supplemental Data: . . .Net assets, end of period (in 000s) . $11,973,337 $16,800,919 $18,605,018 $14,594,535 $7,921,429Ratios to average net assets: . . . . .Total expenses . . . . . . . . . . . . . . . . . . . . . 0.14% 0.15% 0.15% 0.17% 0.18%Net investment income (loss). . . . . . . 1.88% 1.72% 1.54% 1.64% 1.65%Portfolio turnover rate(g). . . . . . . . . . . . 6% 3% 5% 4% 8%
(a) Per share numbers have been calculated using average shares outstanding, which more appropriatelypresents the per share data for the year.
(b) Amounts shown in this caption for a share outstanding may not accord with the change in aggregategains and losses in securities for the fiscal period because of the timing of sales and repurchasesof Fund shares in relation to fluctuating market values for the Fund.
(c) Amount is less than $0.005 per share.(d) Contribution paid by an Affiliate in the amount of $461,741. (See Note 3).(e) Total return is calculated assuming a purchase of shares at net asset value on the first day and
a sale at net asset value on the last day of each period reported. Distributions are assumed, forthe purpose of this calculation, to be reinvested at net asset value per share on the respectivepayment dates of each distribution. Total return for periods of less than one year is not annualized.Broker commission charges are not included in this calculation.
(f) The contribution from an Affiliate had no impact on total return. (See Note 3).(g) Portfolio turnover rate excludes securities received or delivered from in-kind processing of creations
or redemptions on Select Sector SPDR shares.
FINANCIAL HIGHLIGHTS — (Continued)Selected data for a Select Sector SPDR share outstanding throughout each year
111

The Health Care Select Sector SPDR Fund
YearEnded
9/30/16
YearEnded
9/30/15
YearEnded
9/30/14
YearEnded
9/30/13
YearEnded
9/30/12
Net asset value, beginning ofperiod . . . . . . . . . . . . . . . . . . . . . . . . . . . . $ 66.30 $ 63.90 $ 50.59 $ 40.13 $ 31.74
Income (loss) from investmentoperations: . . . . . . . . . . . . . . . . . . . . . . .
Net investment income (loss) (a) . . . . . 1.08 1.02 0.89 0.84 0.78Net realized and unrealized gain
(loss) (b) . . . . . . . . . . . . . . . . . . . . . . . . . . . . 5.82 2.35 13.29 10.45 8.40
Total from investment operations . . . 6.90 3.37 14.18 11.29 9.18
Net equalization credits andcharges (a) . . . . . . . . . . . . . . . . . . . . . . . . . (0.01) 0.02 0.02 0.01 (0.02)
Distributions to shareholdersfrom:. . . . . . . . . . . . . . . . . . . . . . . . . . . . . .
Net investment income. . . . . . . . . . . . . . (1.10) (0.99) (0.89) (0.84) (0.77)
Net asset value, end of period. . . . . $ 72.09 $ 66.30 $ 63.90 $ 50.59 $ 40.13
Total return (c) . . . . . . . . . . . . . . . . . . . . . . 10.45% 5.22% 28.22% 28.39% 29.04%Ratios and Supplemental Data: . . . .Net assets, end of period (in 000s) . . $12,447,213 $12,872,900 $11,161,902 $7,479,810 $5,060,628Ratios to average net assets: . . . . . .Total expenses . . . . . . . . . . . . . . . . . . . . . . 0.14% 0.15% 0.15% 0.17% 0.18%Net investment income (loss). . . . . . . . 1.54% 1.43% 1.53% 1.84% 2.15%Portfolio turnover rate(d) . . . . . . . . . . . . . 8% 3% 3% 5% 5%
(a) Per share numbers have been calculated using average shares outstanding, which more appropriatelypresents the per share data for the year.
(b) Amounts shown in this caption for a share outstanding may not accord with the change in aggregategains and losses in securities for the fiscal period because of the timing of sales and repurchasesof Fund shares in relation to fluctuating market values for the Fund.
(c) Total return is calculated assuming a purchase of shares at net asset value on the first day anda sale at net asset value on the last day of each period reported. Distributions are assumed, forthe purpose of this calculation, to be reinvested at net asset value per share on the respectivepayment dates of each distribution. Total return for periods of less than one year is not annualized.Broker commission charges are not included in this calculation.
(d) Portfolio turnover rate excludes securities received or delivered from in-kind processing of creationsor redemptions on Select Sector SPDR shares.
FINANCIAL HIGHLIGHTS — (Continued)Selected data for a Select Sector SPDR share outstanding throughout each year
112
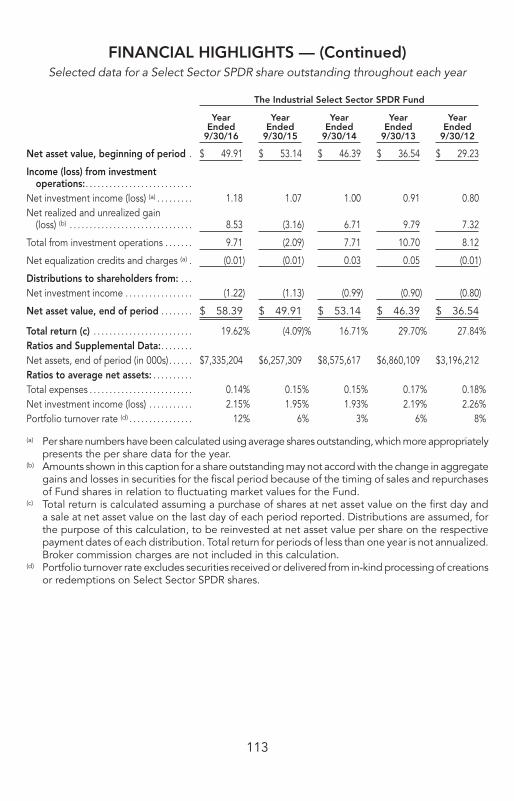
The Industrial Select Sector SPDR Fund
YearEnded
9/30/16
YearEnded
9/30/15
YearEnded
9/30/14
YearEnded
9/30/13
YearEnded
9/30/12
Net asset value, beginning of period . $ 49.91 $ 53.14 $ 46.39 $ 36.54 $ 29.23
Income (loss) from investmentoperations:. . . . . . . . . . . . . . . . . . . . . . . . . . .
Net investment income (loss) (a) . . . . . . . . . 1.18 1.07 1.00 0.91 0.80Net realized and unrealized gain
(loss) (b) . . . . . . . . . . . . . . . . . . . . . . . . . . . . . . . 8.53 (3.16) 6.71 9.79 7.32
Total from investment operations . . . . . . . 9.71 (2.09) 7.71 10.70 8.12
Net equalization credits and charges (a) . (0.01) (0.01) 0.03 0.05 (0.01)
Distributions to shareholders from: . . .Net investment income . . . . . . . . . . . . . . . . . (1.22) (1.13) (0.99) (0.90) (0.80)
Net asset value, end of period . . . . . . . . $ 58.39 $ 49.91 $ 53.14 $ 46.39 $ 36.54
Total return (c) . . . . . . . . . . . . . . . . . . . . . . . . . 19.62% (4.09)% 16.71% 29.70% 27.84%Ratios and Supplemental Data:. . . . . . . .Net assets, end of period (in 000s) . . . . . . $7,335,204 $6,257,309 $8,575,617 $6,860,109 $3,196,212Ratios to average net assets: . . . . . . . . . .Total expenses . . . . . . . . . . . . . . . . . . . . . . . . . . 0.14% 0.15% 0.15% 0.17% 0.18%Net investment income (loss) . . . . . . . . . . . 2.15% 1.95% 1.93% 2.19% 2.26%Portfolio turnover rate (d) . . . . . . . . . . . . . . . . 12% 6% 3% 6% 8%
(a) Per share numbers have been calculated using average shares outstanding, which more appropriatelypresents the per share data for the year.
(b) Amounts shown in this caption for a share outstanding may not accord with the change in aggregategains and losses in securities for the fiscal period because of the timing of sales and repurchasesof Fund shares in relation to fluctuating market values for the Fund.
(c) Total return is calculated assuming a purchase of shares at net asset value on the first day anda sale at net asset value on the last day of each period reported. Distributions are assumed, forthe purpose of this calculation, to be reinvested at net asset value per share on the respectivepayment dates of each distribution. Total return for periods of less than one year is not annualized.Broker commission charges are not included in this calculation.
(d) Portfolio turnover rate excludes securities received or delivered from in-kind processing of creationsor redemptions on Select Sector SPDR shares.
FINANCIAL HIGHLIGHTS — (Continued)Selected data for a Select Sector SPDR share outstanding throughout each year
113
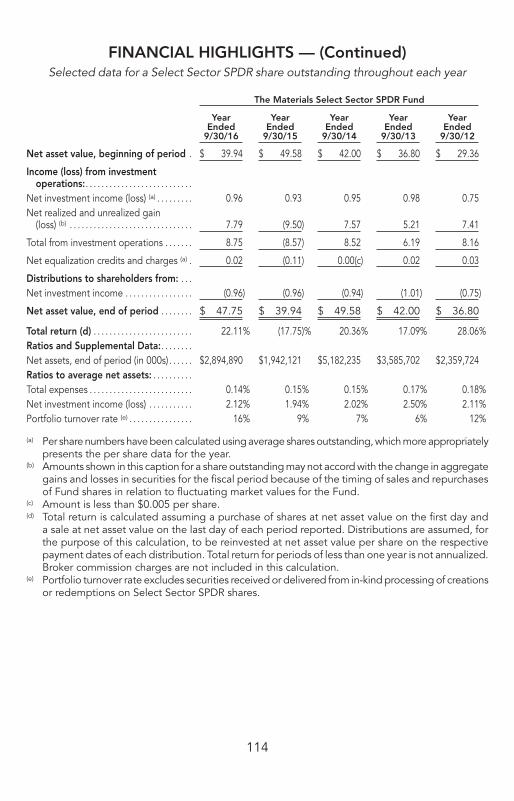
The Materials Select Sector SPDR Fund
YearEnded
9/30/16
YearEnded
9/30/15
YearEnded
9/30/14
YearEnded
9/30/13
YearEnded
9/30/12
Net asset value, beginning of period . $ 39.94 $ 49.58 $ 42.00 $ 36.80 $ 29.36
Income (loss) from investmentoperations:. . . . . . . . . . . . . . . . . . . . . . . . . . .
Net investment income (loss) (a) . . . . . . . . . 0.96 0.93 0.95 0.98 0.75Net realized and unrealized gain
(loss) (b) . . . . . . . . . . . . . . . . . . . . . . . . . . . . . . . 7.79 (9.50) 7.57 5.21 7.41
Total from investment operations . . . . . . . 8.75 (8.57) 8.52 6.19 8.16
Net equalization credits and charges (a) . 0.02 (0.11) 0.00(c) 0.02 0.03
Distributions to shareholders from: . . .Net investment income . . . . . . . . . . . . . . . . . (0.96) (0.96) (0.94) (1.01) (0.75)
Net asset value, end of period . . . . . . . . $ 47.75 $ 39.94 $ 49.58 $ 42.00 $ 36.80
Total return (d) . . . . . . . . . . . . . . . . . . . . . . . . . 22.11% (17.75)% 20.36% 17.09% 28.06%Ratios and Supplemental Data:. . . . . . . .Net assets, end of period (in 000s) . . . . . . $2,894,890 $1,942,121 $5,182,235 $3,585,702 $2,359,724Ratios to average net assets: . . . . . . . . . .Total expenses . . . . . . . . . . . . . . . . . . . . . . . . . . 0.14% 0.15% 0.15% 0.17% 0.18%Net investment income (loss) . . . . . . . . . . . 2.12% 1.94% 2.02% 2.50% 2.11%Portfolio turnover rate (e) . . . . . . . . . . . . . . . . 16% 9% 7% 6% 12%
(a) Per share numbers have been calculated using average shares outstanding, which more appropriatelypresents the per share data for the year.
(b) Amounts shown in this caption for a share outstanding may not accord with the change in aggregategains and losses in securities for the fiscal period because of the timing of sales and repurchasesof Fund shares in relation to fluctuating market values for the Fund.
(c) Amount is less than $0.005 per share.(d) Total return is calculated assuming a purchase of shares at net asset value on the first day and
a sale at net asset value on the last day of each period reported. Distributions are assumed, forthe purpose of this calculation, to be reinvested at net asset value per share on the respectivepayment dates of each distribution. Total return for periods of less than one year is not annualized.Broker commission charges are not included in this calculation.
(e) Portfolio turnover rate excludes securities received or delivered from in-kind processing of creationsor redemptions on Select Sector SPDR shares.
FINANCIAL HIGHLIGHTS — (Continued)Selected data for a Select Sector SPDR share outstanding throughout each year
114
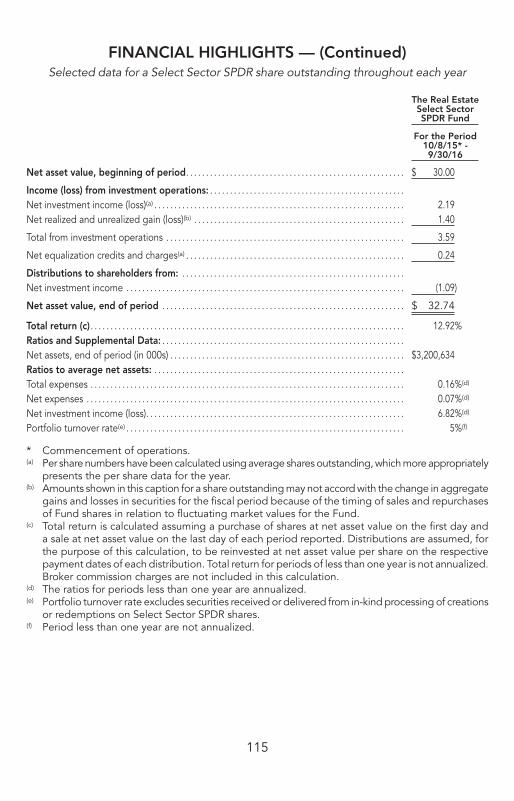
The Real EstateSelect SectorSPDR Fund
For the Period10/8/15* -9/30/16
Net asset value, beginning of period. . . . . . . . . . . . . . . . . . . . . . . . . . . . . . . . . . . . . . . . . . . . . . . . . . . . . . . $ 30.00
Income (loss) from investment operations: . . . . . . . . . . . . . . . . . . . . . . . . . . . . . . . . . . . . . . . . . . . . . . . . .Net investment income (loss)(a) . . . . . . . . . . . . . . . . . . . . . . . . . . . . . . . . . . . . . . . . . . . . . . . . . . . . . . . . . . . . . . . 2.19Net realized and unrealized gain (loss)(b) . . . . . . . . . . . . . . . . . . . . . . . . . . . . . . . . . . . . . . . . . . . . . . . . . . . . . 1.40
Total from investment operations . . . . . . . . . . . . . . . . . . . . . . . . . . . . . . . . . . . . . . . . . . . . . . . . . . . . . . . . . . . . 3.59
Net equalization credits and charges(a) . . . . . . . . . . . . . . . . . . . . . . . . . . . . . . . . . . . . . . . . . . . . . . . . . . . . . . . 0.24
Distributions to shareholders from: . . . . . . . . . . . . . . . . . . . . . . . . . . . . . . . . . . . . . . . . . . . . . . . . . . . . . . . .Net investment income . . . . . . . . . . . . . . . . . . . . . . . . . . . . . . . . . . . . . . . . . . . . . . . . . . . . . . . . . . . . . . . . . . . . . . (1.09)
Net asset value, end of period . . . . . . . . . . . . . . . . . . . . . . . . . . . . . . . . . . . . . . . . . . . . . . . . . . . . . . . . . . . . . $ 32.74
Total return (c). . . . . . . . . . . . . . . . . . . . . . . . . . . . . . . . . . . . . . . . . . . . . . . . . . . . . . . . . . . . . . . . . . . . . . . . . . . . . . . 12.92%Ratios and Supplemental Data: . . . . . . . . . . . . . . . . . . . . . . . . . . . . . . . . . . . . . . . . . . . . . . . . . . . . . . . . . . . . .Net assets, end of period (in 000s) . . . . . . . . . . . . . . . . . . . . . . . . . . . . . . . . . . . . . . . . . . . . . . . . . . . . . . . . . . . $3,200,634Ratios to average net assets: . . . . . . . . . . . . . . . . . . . . . . . . . . . . . . . . . . . . . . . . . . . . . . . . . . . . . . . . . . . . . . .Total expenses . . . . . . . . . . . . . . . . . . . . . . . . . . . . . . . . . . . . . . . . . . . . . . . . . . . . . . . . . . . . . . . . . . . . . . . . . . . . . . . 0.16%(d)
Net expenses . . . . . . . . . . . . . . . . . . . . . . . . . . . . . . . . . . . . . . . . . . . . . . . . . . . . . . . . . . . . . . . . . . . . . . . . . . . . . . . . 0.07%(d)
Net investment income (loss). . . . . . . . . . . . . . . . . . . . . . . . . . . . . . . . . . . . . . . . . . . . . . . . . . . . . . . . . . . . . . . . . 6.82%(d)
Portfolio turnover rate(e) . . . . . . . . . . . . . . . . . . . . . . . . . . . . . . . . . . . . . . . . . . . . . . . . . . . . . . . . . . . . . . . . . . . . . . 5%(f)
* Commencement of operations.(a) Per share numbers have been calculated using average shares outstanding, which more appropriately
presents the per share data for the year.(b) Amounts shown in this caption for a share outstanding may not accord with the change in aggregate
gains and losses in securities for the fiscal period because of the timing of sales and repurchasesof Fund shares in relation to fluctuating market values for the Fund.
(c) Total return is calculated assuming a purchase of shares at net asset value on the first day anda sale at net asset value on the last day of each period reported. Distributions are assumed, forthe purpose of this calculation, to be reinvested at net asset value per share on the respectivepayment dates of each distribution. Total return for periods of less than one year is not annualized.Broker commission charges are not included in this calculation.
(d) The ratios for periods less than one year are annualized.(e) Portfolio turnover rate excludes securities received or delivered from in-kind processing of creations
or redemptions on Select Sector SPDR shares.(f) Period less than one year are not annualized.
FINANCIAL HIGHLIGHTS — (Continued)Selected data for a Select Sector SPDR share outstanding throughout each year
115

The Technology Select Sector SPDR Fund
YearEnded
9/30/16
YearEnded
9/30/15
YearEnded
9/30/14
YearEnded
9/30/13
YearEnded
9/30/12
Net asset value, beginning ofperiod . . . . . . . . . . . . . . . . . . . . . . . . . . $ 39.56 $ 39.89 $ 32.04 $ 30.83 $ 23.59
Income (loss) from investmentoperations:. . . . . . . . . . . . . . . . . . . . .
Net investment income (loss)(a). . . . 0.83 0.75 0.68 0.61 0.43Net realized and unrealized gain
(loss)(b) . . . . . . . . . . . . . . . . . . . . . . . . . . 8.22 (0.30) 7.86 1.20 7.23
Total from investment operations . 9.05 0.45 8.54 1.81 7.66
Net equalization credits andcharges(a) . . . . . . . . . . . . . . . . . . . . . . . 0.01 (0.01) (0.01) (0.00)(c) 0.02
Distributions to shareholdersfrom: . . . . . . . . . . . . . . . . . . . . . . . . . . .
Net investment income . . . . . . . . . . . (0.84) (0.77) (0.68) (0.60) (0.44)
Net asset value, end of period . . $ 47.78 $ 39.56 $ 39.89 $ 32.04 $ 30.83
Total return (d) . . . . . . . . . . . . . . . . . . . 23.13% 1.04% 26.75% 5.99% 32.76%Ratios and Supplemental Data:. .Net assets, end of period (in
000s). . . . . . . . . . . . . . . . . . . . . . . . . . . . $13,003,829 $11,382,284 $13,854,341 $11,714,309 $10,679,945Ratios to average net assets: . . . .Total expenses . . . . . . . . . . . . . . . . . . . . 0.14% 0.15% 0.15% 0.17% 0.18%Net investment income (loss) . . . . . 1.91% 1.80% 1.85% 1.99% 1.53%Portfolio turnover rate (e) . . . . . . . . . . 5% 5% 10% 4% 5%
(a) Per share numbers have been calculated using average shares outstanding, which more appropriatelypresents the per share data for the year.
(b) Amounts shown in this caption for a share outstanding may not accord with the change in aggregategains and losses in securities for the fiscal period because of the timing of sales and repurchasesof Fund shares in relation to fluctuating market values for the Fund.
(c) Amount is less than $0.005 per share.(d) Total return is calculated assuming a purchase of shares at net asset value on the first day and
a sale at net asset value on the last day of each period reported. Distributions are assumed, forthe purpose of this calculation, to be reinvested at net asset value per share on the respectivepayment dates of each Fund. Broker commission charges are not included in this calculation.
(e) Portfolio turnover rate excludes securities received or delivered from in-kind processing of creationsor redemptions on Select Sector SPDR shares.
FINANCIAL HIGHLIGHTS — (Continued)Selected data for a Select Sector SPDR share outstanding throughout each year
116
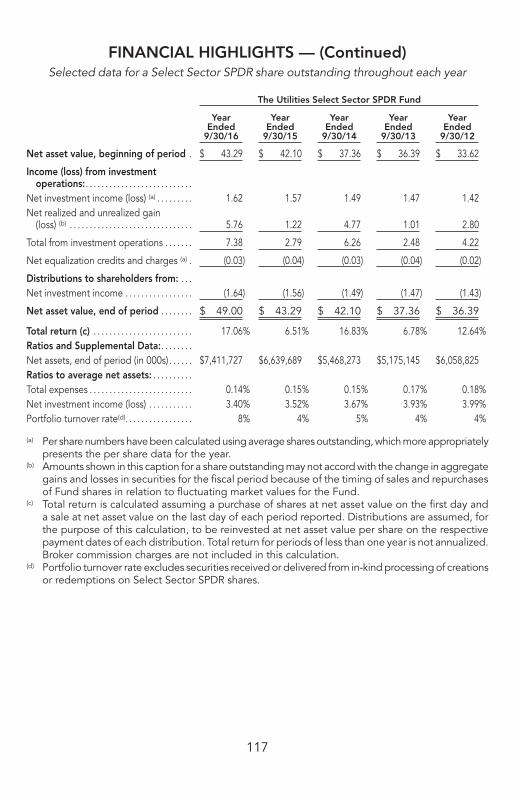
The Utilities Select Sector SPDR Fund
YearEnded
9/30/16
YearEnded
9/30/15
YearEnded
9/30/14
YearEnded
9/30/13
YearEnded
9/30/12
Net asset value, beginning of period . $ 43.29 $ 42.10 $ 37.36 $ 36.39 $ 33.62
Income (loss) from investmentoperations:. . . . . . . . . . . . . . . . . . . . . . . . . . .
Net investment income (loss) (a) . . . . . . . . . 1.62 1.57 1.49 1.47 1.42Net realized and unrealized gain
(loss) (b) . . . . . . . . . . . . . . . . . . . . . . . . . . . . . . . 5.76 1.22 4.77 1.01 2.80
Total from investment operations . . . . . . . 7.38 2.79 6.26 2.48 4.22
Net equalization credits and charges (a) . (0.03) (0.04) (0.03) (0.04) (0.02)
Distributions to shareholders from: . . .Net investment income . . . . . . . . . . . . . . . . . (1.64) (1.56) (1.49) (1.47) (1.43)
Net asset value, end of period . . . . . . . . $ 49.00 $ 43.29 $ 42.10 $ 37.36 $ 36.39
Total return (c) . . . . . . . . . . . . . . . . . . . . . . . . . 17.06% 6.51% 16.83% 6.78% 12.64%Ratios and Supplemental Data:. . . . . . . .Net assets, end of period (in 000s) . . . . . . $7,411,727 $6,639,689 $5,468,273 $5,175,145 $6,058,825Ratios to average net assets: . . . . . . . . . .Total expenses . . . . . . . . . . . . . . . . . . . . . . . . . . 0.14% 0.15% 0.15% 0.17% 0.18%Net investment income (loss) . . . . . . . . . . . 3.40% 3.52% 3.67% 3.93% 3.99%Portfolio turnover rate(d). . . . . . . . . . . . . . . . . 8% 4% 5% 4% 4%
(a) Per share numbers have been calculated using average shares outstanding, which more appropriatelypresents the per share data for the year.
(b) Amounts shown in this caption for a share outstanding may not accord with the change in aggregategains and losses in securities for the fiscal period because of the timing of sales and repurchasesof Fund shares in relation to fluctuating market values for the Fund.
(c) Total return is calculated assuming a purchase of shares at net asset value on the first day anda sale at net asset value on the last day of each period reported. Distributions are assumed, forthe purpose of this calculation, to be reinvested at net asset value per share on the respectivepayment dates of each distribution. Total return for periods of less than one year is not annualized.Broker commission charges are not included in this calculation.
(d) Portfolio turnover rate excludes securities received or delivered from in-kind processing of creationsor redemptions on Select Sector SPDR shares.
FINANCIAL HIGHLIGHTS — (Continued)Selected data for a Select Sector SPDR share outstanding throughout each year
117

WHERE TO LEARN MORE ABOUT THE FUNDSThis Prospectus does not contain all the information included in the RegistrationStatement filed with the SEC with respect to Fund Shares. The SAI and the Annualand Semi-Annual Reports to shareholders, each of which has been or will befiled with the SEC, provide more information about the Funds. The Prospectusand SAI may be supplemented from time to time. In the Annual Report, you willfind a discussion of the market conditions and investment strategies that significantlyaffected each Fund’s performance during the Fund’s last fiscal year. The SAI andthe financial statements included in the Trust’s Annual Report to shareholdersare incorporated herein by reference (i.e., they are legally part of this Prospectus).These materials may be obtained without charge, upon request, by writing tothe Distributor, ALPS Portfolio Solutions Distributor, Inc., 1290 Broadway, Suite1100, Denver, CO 80203, by visiting the Funds’ website at www.sectorspdrs.comor by calling the following number:
Investor Information: 1-866-SECTOR-ETF (1-866-732-8673)
The Registration Statement, including this Prospectus, the SAI, and the exhibitsas well as any shareholder reports may be reviewed and copied at the SEC’sPublic Reference Room (100 F Street NE, Washington D.C. 20549) or on the EDGARDatabase on the SEC’s website (http://www.sec.gov). Information on the operationof the public reference room may be obtained by calling the SEC at 1-202-551-8090.You may get copies of this and other information after paying a duplicating fee,by electronic request at the following e-mail address: [email protected], or bywriting to the Public Reference Section of the SEC, Washington, D.C. 20549-1520.
Shareholder inquiries may be directed to the Funds in writing to ALPS PortfolioSolutions Distributor, Inc., 1290 Broadway, Suite 1100, Denver, CO 80203, orby calling the Investor Information number listed above.
No person has been authorized to give any information or to make anyrepresentations other than those contained in this Prospectus in connectionwith the offer of Fund Shares, and, if given or made, the information orrepresentations must not be relied upon as having been authorized by theTrust or the Funds. Neither the delivery of this Prospectus nor any sale ofFund Shares shall under any circumstance imply that the information containedherein is correct as of any date after the date of this Prospectus.
Dealers effecting transactions in Fund Shares, whether or not participatingin this distribution, are generally required to deliver a Prospectus. This is inaddition to any obligation of dealers to deliver a Prospectus when actingas underwriters.
SSSPDRPROThe Trust’s Investment Company Act Number is 811-08837