the secrets of a swiss watch hidden danger global player ... · 140 years later and celebrating its...
TRANSCRIPT

3D-D
arst
ellu
ng, N
ASA
/JPL
-Cal
tech
From a “local workshop” to aglobal player
2015, Shimadzu celebrates its 140th
anniversary: a success story
The secrets of a Swiss watch
»In our lab we R.E.A.C.H. the verysecrets of matter«
Hidden danger
LCMS-8050 – Faster and moresensitive detection of mycotoxinsin baby food

of the Top 10 inventors in thehistory of the country.
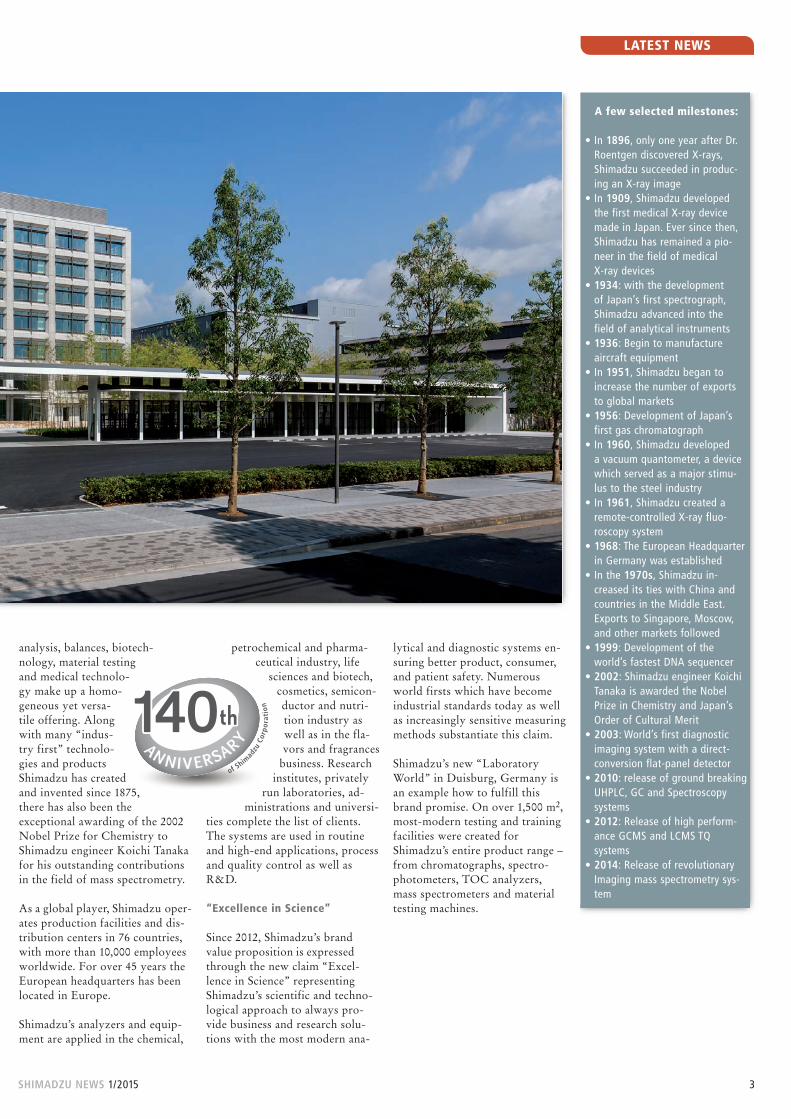
140 years later and celebrating itsanniversary in 2015, Shimadzu isone of the worldwide leadingmanufacturers of analytical in -strumentation and diagnosticimaging systems. Its technolo-gies are used as essential toolsfor quality control of consumergoods and articles of daily use,in health care as well as in allareas of environmental and con-sumer protection. Spectroscopy,chromatography, environmental
»It is the dose that makes the poison« New ICPE-9800 series 4
Animal kingdom suffering from plastic wastes 6
The secrets of a Swiss watch –»In our lab we R.E.A.C.H. the very secrets of matter« 12
Testing wine bottles – Non-destructive quality control 16
Coffee inspired not only science –Particle measurement using the SALD-2300 18
Hidden danger – Faster and more sensitive detection of mycotoxins in baby food 20
Biomass fuel: can algae make thewheels go round? – Monitoring ofalgae growth 22
Universal testing machine qualifieselectronic components 28
High sensitivity meets robustness 30
Small yet high-performance – NewUV-VIS spectrophotometer UV-1280 8
New milestone in ICP-OES technology 9
Insights on molecular level –iMScope TRIO 10
Sweet secrets analyzed fast and easily 24
More freedom of choice –New features in TOC-Control L-software 26
Performance meets design 31
Extended analysis possibilities –Special accessories for the UV-3600 Plus 32
APPLICATION
PRODUCTS
From a “local workshop” to a global player 2
Selenium in blood serum – Atomicabsorption spectroscopy for traceanalysis 14
Shimadzu employees are sociallyengaged 27
LATEST NEWS
SHIMADZU NEWS 1/2015
CONTENT
He was the son of a crafts-man of Buddhist altars,but driven to manufacture
instruments for physics andchemistry. He attended the Phys -ics and Chemistry Research In -stitute, where he gained experi-ence with a variety of technolo-gies and fields of expertise. Hewas convinced that Japan as acountry with few natural re -sources should work towardsbecoming a leader in science. Atthe door-step from the industrialrevolution to the scientific age,he founded in 1875 his own
business in Kiyamachi, Kyoto.His name was Genzo Shimadzu.
In 1877, he succeeded in launch-ing the first manned balloonflight in Japan. One year afterexploration of X-rays throughConrad Röntgen in Germany,Genzo Shimadzu took the firstX-ray images in Japan. In thefollowing years, he created thefirst commercial X-ray system inJa pan and started the productionof machines for materials devel-opment. In 1930, the emperorawarded Genzo Shimadzu one
NEWS – Shimadzu’s customer maga -zine is also available as WebApp (foriOS and Android) via: www.shimadzu-webapp.eu or as appfor iPhone in the AppStore.
Shimadzu celebrates its 140th anniversary
From a “local workshop”to a global player
3SHIMADZU NEWS 1/2015
LATEST NEWS
petrochemical and pharma-ceutical industry, life
sciences and bio tech,cosmetics, semicon-ductor and nutri-tion in dustry aswell as in the fla-vors and fragrances
business. Re searchinstitutes, privately
run laboratories, ad -min istrations and universi-
ties complete the list of clients.The systems are used in routineand high-end applications, pro cessand quality control as well asR&D.
“Excellence in Science”
Since 2012, Shimadzu’s brandvalue proposition is expressedthrough the new claim “Excel -lence in Science” representingShimadzu’s scientific and techno-logical approach to always pro-vide business and research solu-tions with the most modern ana-
analysis, balances, bio tech -nology, material testingand medical technolo-gy make up a ho mo -geneous yet versa-tile offering. Alongwith many “indus-try first” technolo-gies and productsShimadzu has createdand invented since 1875,there has also been theexceptional awarding of the 2002Nobel Prize for Chemis try toShimadzu engineer Koichi Tanakafor his outstanding contributionsin the field of mass spectrometry.
As a global player, Shimadzu oper -ates production facilities and dis-tribution centers in 76 countries,with more than 10,000 employeesworldwide. For over 45 years theEuropean headquarters has beenlocated in Europe.
Shimadzu’s analyzers and equip-ment are applied in the chemical,
A few selected milestones:
• In 1896, only one year after Dr.Roentgen discovered X-rays,Shimadzu succeeded in produc -ing an X-ray image
• In 1909, Shimadzu developed the first medical X-ray devicemade in Japan. Ever since then,Shimadzu has remained a pio -neer in the field of medical X-ray devices
• 1934: with the development of Japan’s first spectrograph,Shimadzu advanced into the field of analytical instruments
• 1936: Begin to manufacture aircraft equipment
• In 1951, Shimadzu began toincrease the number of exports to global markets
• 1956: Development of Japan’sfirst gas chromatograph
• In 1960, Shimadzu developed a vacuum quantometer, a devicewhich served as a major stimu -lus to the steel industry
• In 1961, Shimadzu created aremote-controlled X-ray fluo-roscopy system
• 1968: The European Headquarterin Germany was established
• In the 1970s, Shimadzu in -creased its ties with China andcountries in the Middle East.Exports to Singapore, Moscow,and other markets followed
• 1999: Development of the world’s fastest DNA sequencer
• 2002: Shimadzu engineer KoichiTanaka is awarded the NobelPrize in Chemistry and Japan’sOrder of Cultural Merit
• 2003: World’s first diagnosticimaging system with a direct-conversion flat-panel detector
• 2010: release of ground breakingUHPLC, GC and Spectroscopy systems
• 2012: Release of high perform-ance GCMS and LCMS TQ systems
• 2014: Release of revolutionaryImaging mass spectrometry sys-tem
lytical and diagnostic systems en -suring better product, consum er,and patient safety. Numer ousworld firsts which have be comeindustrial standards today as wellas increasingly sensitive mea suringmethods substantiate this claim.
Shimadzu’s new “LaboratoryWorld” in Duisburg, Germany isan example how to fulfill thisbrand promise. On over 1,500 m2,most-modern testing and trainingfacilities were created forShimadzu’s entire product range –from chromatographs, spectro -photometers, TOC analyzers,mass spectrometers and materialtesting machines.

APPLICATION
4 SHIMADZU NEWS 1/2015
E ssential to life, drinking wa -ter is the most importantnutrient source. For an adult,
the daily drinking water require-ment is approximately 2 - 3 litersper day. While in some regions inthe world it is still very difficultto provide and guarantee safedrinking water supplies, the situa-tion in Europe appears to be verygood. The next step is therefore todetermine the quality of drinkingwater and to comply with specificstandards, as not all water is con-sidered healthy or could even beclassified as potable water.
In the 98/83/EC Drinking WaterDirective on the quality of waterintended for human consumption,the European countries have spec-ified when water is considered tobe drinking water or when itsconsumption is prohibited. Thetesting criteria mentioned in thisdirective must be complied withand must be adopted into existingnational law.
Some parameters in the 98/83/ECdirective can be tested easily, forinstance coloration. If a watersample tests negative, it can al -ready be classified as questionable.But water that does not exhibitsignificant turbidity can also beharmful to humans.
Elements present in water
As a natural product, water con-tains many substances such asorganic compounds or inorganicconstituents. The term mineralwater already points to some ofthese substances – essentially min-erals such as calcium, potassium,magnesium and sodium. These in -organic nutrients are essential asthe human body does not synthe-size them, and they must thereforebe obtained from a dietary source.
present in almost every organ can-not perform their function. Too
There are, however, many otheressential elements in drinking wa -ter such as the trace elementschromium, cobalt, iron, copper,manganese, selenium and zinc.Other tentative candidates, whoseexact functions as trace elementsin the human body have not yetbeen conclusively investigated,could for instance be arsenic,nickel or tin.
For all these elements, the concen-tration plays a key role. For ex -ample, when selenium is missing,leads to a deficiency, and seleni-um-dependent enzymes that are
much selenium, however, can leadto poisoning, so-called selenosisthat includes symptoms rangingfrom fatigue and nausea to hairand nail loss.
The German laboratory magazineGIT has already reported on theanalysis of selenium in serum us -ing graphite furnace-AAS (AA-7000G) to determine wheth erselenium poisoning has oc curred(see the article on page 14 of thisissue). On the topic of drinkingwater analysis, it is im portant thatfood monitoring can rule out anoverdose as a cause for poisoning.Drinking water, for instance, maycontain a maximum of 10 μg/Lselenium.
Other elements in the limit valuelist of the 98/83/EC directive areheavy metals such as lead, cadmi-um, chromium, cobalt, copper,manganese, molybdenum, nickel,mercury, selenium, zinc and tin. It becomes apparent from this list that the classification of theelements overlaps. Some of theheavy metals were classified aboveas ‘essential.’ Other elements, onthe other hand, can be classified as toxic or even belong to bothcategories. This emphasizes oncemore that the concentration isdecisive.
Concentration (mg/L) Concentration (mg/L)
Axial view (AX) Radial view (RD)
Inte
nsit
y
050,000
100,000150,000200,000250,000300,000
050,000
100,000150,000200,000250,000300,000
350,000
0 100 200 0 100 200
r = 0.99998 r = 1.00000
Figure 1: Radial plasma observation masks ionization interferences at high sodium
concentrations (right) and the linear working range can be markedly extended
New ICPE-9800 series – Fast and reliable elemental analysis of drinking water
»It is the dose that makes the poison«

5SHIMADZU NEWS 1/2015
APPLICATION
Drinking water analysis
The elements specified in the98/83/EC directive should be ana-lyzed with a minimum of effortand within the shortest time pos-sible. These elements, along withother important minerals, are list-ed in table 1.
When a large number of elementsare to be determined, the newICPE-9800 series proves to beparticularly advantageous becauseit can determine all elements si -multaneously. Of this series, theICPE-9810 is suitable for the de -termination of ultra-trace concen-trations of most of the elementsmentioned. The ICPE-9810 is op -erated under axial plasma observa-tion (AX). Since higher ppm-ranges, such as for sodium, arealso of interest, radial plasma ob -servation (RD) is required as well.The ICPE-9820 offers this combi-nation of axial and radial plasmaobservation.
The exact effect of axial and radialplasma observation is shown inthe example for sodium. The cali-bration series up to 200 mg/L isobserved both axially (completeplasma) and radially (plasma sec-tion, from the side). The calibra-tion curve under axial observationis not linear, as so-called ioniza-tion interferences can occur, espe-
cially at high concentrations of themain group 1 elements (e.g. sodi-um or potassium). These can bemasked using radial plasma obser-vation.
Results
The detection limits required ac -cording to the European 98/83/ECdirective can be attained using theICPE-9820. Figure 2 shows all cal-ibration curves. Certified referencematerials – drinking water sampleswith known content of the ele-ments listed in table 1 – were alsomeasured as unknown sampleswithin one measuring sequence.Three different reference materialsamples (TMDW, trace metals indrinking water), supplied by HighPurity Standards (North Charles -ton, SC, USA), were investigated.
The results in table 2 show that thecertified concentrations were re -covered within a short time andwith very little effort. The ele-ments mercury, arsenic, antimonyand selenium can be measured sen-sitively when switching to the hy -dride vapour technique.
The ICPE-9820 series complieswith the latest standards and canalso be used in many differentfields of analysis, for instance inthe food or pharmaceutical indus-tries as well as in the petrochemicalindustry.
Figure 2: By Shimadzu’s ICPE solution software all calibration curves can be obtained easily
at first glance
20010
1,000– –
5.0 [3]50
2,000200
1– –– –50
200,00020105
10
201
100– –
0.5 [3]5
200200.2– –– –5
20,00021
1.251
2.52.0 (0.3*)
1.0090
0.200.120.600.45
2.0 (0.10*)1518
0.1560
0.450.90
1.25 (0.15*)2.0 (0.13*)
AxialAxialRadialRadialAxialAxialAxialAxialAxialRadialRadialAxialRadialAxialAxialAxialAxial
AlAsBCaCdCrCuFeHgKMgMnNaNiPbSbSe
AluminumArsenicBoronCalciumCadmiumChromiumCopperIronMercuryPotassiumMagnesiumManganeseSodiumNickelLeadAntimonySelenium
Element [1] 98/83/EC directive ICPE-9820
Limit value98/83/EG
[μg/L]
Detectionlimit [2]
[μg/l]
Plasmaobservation
Detectionlimit[μg/L]
Table 1: The elements and their limit values specified in 98/83/EC, as well as the required
detection limits of the analytical instruments. The detection limits specified for the ICPE-9820
refer to the present application.
[1] In addition elements that can be determined using the ICPE-9800 series can be included in
the analysis (more than 70).
[2] Determined as 3-fold standard deviation of a natural sample with a low concentration
of the element. The detection limits refer to the drinking water application and can be
improved depending on the selection of the spectral line/application.
[3] The limit value in Germany according to the German Drinking Water Ordinance is 3,0 μg/L,
the detection limit is at 0.3 μg/L.
[*] using the hydride vapour technique.
Table 2: Recoveries of the elements that are contained in the reference material lie within
the range of 100 ± 5 %
[1] The certified reference values are reported with an uncertainty of 0.5 - 2.0 %
[2] n.c. = not certified
AlBCaCdCrCuFeKMgMnNaNiPbZn
120n.c. [2]35,000
102020
1002,5009,000
406,000
604070
117– –
35,30010202099
2,5509,000
396,160
573868
125150
31,00010202090
2,5008,000
402,300
602075
121152
31,00010192090
2,5108,010
402,240
582073
125150
31,00010202090
2,5008,000
4022,000
602075
124147
30,90010191987
2,5707,820
3922,800
571875
CRM-TMDW [1]
μg/L
ICPE-9820
μg/L
CRM-TMDW-A[1]
μg/L
ICPE-9820
μg/L
CRM-TMDW-B[1]
μg/L
ICPE-9820
μg/L
Further information
on this article
• Applications
www.shimadzu.eu/shimadzu-news-2015
Ag 328.068 (1)
1.00000
Al 394.403 (1)
0.99999
B 249.773 (2)
0.99990
Ba 230.424 (1)
1.00000
Ca 183.801 (2)
0.99992Cd 214.438 (1)
0.99999
Co 228.616 (1)
0.99999
Co 238.892 (1)
1.00000
Cr 670.784 (3)
1.00000
Cu 324.754 (1)
0.99998Fe 238.204 (1)
0.99999
K 769.896 (3)
0.99992
Li 670.784 (3)
0.99990
Mg 285.213 (3)
0.99982
Mn 259.373 (1)
1.00000Na 589.592 (2)
1.00000
Ni 231.604 (1)
0.99998
Pb 220.353 (1)
0.99994
Sr 216.596 (1)
0.99999
Zn 213.856 (1)
0.99998
For further information, pleasescan the QR code.

Plastic waste is very diverse in ap -pearance. This is why an opticalcategorization has been intro-duced, for example industrial,
APPLICATION
I n the autumn of 2014, the‘Fulmar Litter Monitoring’workshop* organized by
IMARES (Institute for MarineResources & Ecosystem Studies)took place on the Dutch island ofTexel. The workshop focused onthe analysis of stomach contentsof dead fulmars (Fulmarus glacia -lis) that were found along theshores of the North Sea.
During the workshops, the partic-ipants under the guidance of Dr.Jan. A van Franeker (Figure 1)learned how to examine the birdsexternally and internally in orderto categorize the animals in termsof age, gender and other impor-tant features.
After external inspection, the birdis examined internally. For the ap -plication described here, the stom-ach content of the bird is of inter-est. The stomach of a fulmar ex -tends virtually over the entirebody of the bird, as it has to di -gest whole fish. The stomach isactually subdivided into two
up to a maximum diving depth of2 m, where mainly light polymerssuch as polyethylene and poly -propylene are present.
stomachs: the proventriculus andthe gizzard. Predigestion takesplace in the proventriculus andhard parts are ground in the giz-zard and converted to food (Fig -ure 2).
The North Sea countries have rec-ognized the threat posed by plas-tic waste since many years, andtheir goal is to reduce the concen-tration of plastics in the ocean tosuch an extent that most fulmarswill contain less than 0.1 g of plas-tic in their stomachs (i.e. not morethan 10 % of the birds containingmore than 0.1 g). These values arenot statistically attained in the 5regions of the surrounding NorthSea coastlines (Figure 4).
Although fulmars feed on any-thing that swims, such as fish andsquid, the birds also consumeplastic wastes. They mistake plas-tics for food. Plastics can acciden-tally be taken in during fishing orthe plastic can already be con-tained in the fish they eat. Thefulmar fishes on the ocean surface
6 SHIMADZU NEWS 1/2015
Animal kingdom suffering fromplastic wastesFTIR analysis of polymers in fulmars
Figure 1: Dr. J.A. van Franeker during the workshop (2014) dissecting a young bird,
whose stomach contents are shown in Figure 2
Figure 2: Stomach content of a fulmar, including many polymer particles in various sizes
and appearances. For years this research has been carried out and recorded statistically by
Dr. van Franeker.
5-year period
% birds with > 0.1 g plastic
EcoQOtarget
1975-79 1980-84 1985-89 1990-94 1995-99 2000-04 2005-09 2010-1410 %
20 %
40 %
60 %
80 %
100 %
Figure 3: Trend analysis (5-year summary) for the occurrence of plastics in the stomachs
of fulmars in the Netherlands. The trend shows a slight drop over the years, but it is still
significantly far higher than the EcoQO target which is to reduce the percentage of birds
with more than the limit value of 0.1 g of plastic in their stomachs to below 10 %.

materials and their appearancescan be measured non-destructive-ly, including plastics from fulmarstomachs. When the FTIR system(IRAffinity-1S) is equipped with a single-reflectance ATR unit(Quest™), the sample can be mea -
7SHIMADZU NEWS 1/2015
APPLICATION
stomachs. The mean value of ma -terial per stomach was 28 particleswith a total weight of approx. 0.3 g.The critical EcoQO value of 0.1 gplastic was exceeded in 52 % ofthe birds [1].
What does 0.3 g of plastic mean?
This amount may seem very little– but in terms of the body weightof a fulmar, 0.3 g of plastic wouldcorrespond to 20 g of plastic in aperson weighing 70 kg, i.e. onefifth of a bar of chocolate (see fig -ure 5).
Why FTIR?
Using this infrared spectroscopicmeasuring technique, all types of
Figure 5: Comparison of the amount of plastic in a bird’s stomach (left, North Sea, mean
value) with the extrapolated volume corresponding to the size of a human. For a person weigh -
ing 70 kg, this is more than 20 g.
10 %target
% b
irds
wit
h >
0.1
g pl
asti
c
Scottish Islands(115)
EastEngland
(51)
ChannelRegion
(72)
SoutheastNorth Sea
(482)
SkagerrakRegion
(76)
0 %
20 %
40 %
60 %
80 %
100 %
Figure 4: This is the regional statistic of the surrounding North Sea countries for the
occurrence of plastic in the stomachs of fulmars in the North Sea, whereby the 10 %
target of the EcoQO was included for comparison in the bar chart
Figure 6: FTIR spectrum of a thin foil, which was measured using the Quest diamond
single-reflectance unit
applied/used, non-plastic and pol-lutant.
Exact statistics for fulmars in theNetherlands from 2009 to 2013were: 227 fulmars were examined,94 % had plastic materials in their
sured directly. Sample preparationmerely involves drying the samplewith paper after briefly rinsingwith water. Under this condition,the polymer is expected to be suf-ficiently clean.
An ATR unit enables surface mea -surement, which in this case iscarried out at a penetration depthof approx. 2 μm. The sample isheld in contact with a diamondprism and pressed against it usingan anvil. The infrared spectrameasured assist in the identifica-tion of the polymers, all withinseconds. The measurement time
and analysis was one minute.FTIR-ATR is therefore a suitablemeth od for measuring large sam-ple amounts (for instance also formon itoring).
Measuring results
A major problem in the analysisof natural field samples is falseanalysis. This is explained using athin piece of foil.
The spectrum obtained from thepiece of foil was analyzed furtherusing a polymer library. The resultof the search identified the materi-al as a polyamide (nylon). A pure-ly visual comparison of the spec-tral structure, as well as the li -brary search result with a hit of700 (good agreement over 900)clearly shows that no good corre-lation was obtained.
When expanding the library withthe know-how on this foreignsample, the hit rate was better andmore reliable. For an improvedanalysis, many additional facts areneeded, for instance: what doesthe bird eat, what is the consisten-cy of the gastric fluid and so on.
To better classify spectrum (Fig -ure 7), two additional referencespectra (fish skin �
1
2
5
4
3
1
2
3
45

APPLICATION
8 SHIMADZU NEWS 1/2015
Figure 7: Analysis of a thin foil using infrared spectroscopy and library identification.
(False result). The material is not Nylon.
and also stomach fat) are required(Figure 8). When combining thefat spectrum of the fulmar withthe fish skin spectrum, the spec-trum left is obtained.
The second example shows a frag-ment with the description ‘whitewith rough surface.’
The library search has thereforeled to the correct result. Poly -propylene constitutes part of thespectrum. So do proteins andsmall amounts of fat. All threecontribute to the spectrum. The
polymer is found with a hit accu-racy of 930 out of a maximum of1.000.
Discussion of the measuredresults
Materials that have become en -riched in fulmar stomachs can beinvestigated using infrared spec-troscopy. Surface analysis enablesthe determination of materials at alayer depth of 2 μm. Dependingon the ‘history’ of the particle, itcan exhibit a certain ‘roughness’ inwhich digestion fluids can collect.
Due to the fatty foods, many ofthe samples have been found tocontain fat which accumulates inthe pores. Should these samples berinsed with a fat remover, the in -frared spectra of the cleaned sur-faces could lead to a higher hitrate. Knowing this enables rapidscreening of the particles on non-cleaned surfaces.
AuthorsDr. J. A. van Franeker, IMARES Wageningen UR
Albert van Oyen, Carat GmbH
Marion Egelkraut-Holtus, Shimadzu
Europa GmbH
References[1] Fulmar litter EcoQO monitoring in the
Netherlands – Update 2012 and 2013,
J.A. van Franeker, S. Kühn, E.L. Bravo
Rebolledo, A. Meijboom, Report number
C122/14, IMARES Wageningen UR
Figure 8: Library search of an infrared spectrum of a white fragment with rough surface.
Here, the correct polymer polypropylene was found. The additional bands can be assigned
to protein and fat.
Further information
on this article
• Dossier – Plastic waste
and marine wildlife
• Carat GmbH
• IMARES
www.shimadzu.eu/shimadzu-news-
2015
PRODUCTS
Small yet high-performanceNew UV-VIS spectrophotometer UV-1280
O rganic and aqueous solu-tions, biological samples,optical materials such as
filters or foils and much more –the new UV-VIS spectrophotome-ter UV-1280 (Figure 1) enablesspectral analyses for a wide rangeof samples. The compact systemwith a spectral bandwidth of 5 nmallows measurements with highstability in a wavelength range of190 - 1,100 nm.
The UV-1280 has a very smallfootprint. It is easy to operateusing function keys and the largeLCD monitor which also displays
the on-board software. The fol-lowing functions and programsare provided as standard:
1. photometry2. spectrum3. quantitative analysis4. kinetics5. time-scan measurement 6. multicomponent analysis7. DNA/Protein quantification.
In addition, the UV-1280 enablesinstrument validation. It tests thefollowing instrument parameters:wavelength accuracy and repeata-bility, stray light, photometric
accuracy, photometric repeatabili-ty, baseline flatness and baselinestability, as well as noise level.
The wide application range is sup-ported by a comprehensive rangeof accessories which is used indi-vidually in the sample compart-ment. Via the USB connection,data can be copied directly in theUSB memory and evaluated usingspreadsheet software. A printerwith USB-I/F interface can alsobe connected directly to the UV-1280.
UV-1280

9SHIMADZU NEWS 1/2015
PRODUCTS
ICPE-9800 spectrophotometer series reduces operating costs
New milestone in ICP-OES technology
F or more than 30 years, induc-tively coupled plasma (ICP)has been used commercially
as an excitation source for opticalemission spectrometers and hasbecome an indispensable tool fordaily routine applications.
Since the introduction of the firstsequential ICP-OES spectrometerICPQ-100 in 1977, Shimadzu hasbeen a driving force in technicalinnovation. The ICPS-8100, forinstance, features exceptional lightintensity while achieving high res-olution. The optical systems with1-meter monochromator havedefined standards in this instru-ment class. With the launch of theICPE-9000 in 2005, a simultane-ous system with vacuum opticsand minitorch was introduced.
The new ICPE-9800 series is a fol-low-up to this success story andsets a new milestone in ICP-OESinstrument technology.
The new simultaneous spectrome-ters in the ICPE-9800 series areequipped with vacuum high-per-formance optics and use a 1,024 x1,024 pixel CCD (charge-coupleddevice) detector. This systemallows simultaneous acquisition ofspectral data over the entire wave-length range of 167 to 800 nmwithout exception, i.e. all elementinformation and wavelengths areavailable to the user at any time.
High-performance optics
The new series includes two spec-trometers:
• the ICPE-9810 with vertical ori-entation of the minitorch andaxial plasma observation for thehighest possible sensitivity
• the ICPE-9820, also with verti-cal orientation of the minitorchbut with axial and radial plasmaobservation.
This allows the ICPE-9820 to car -ry out analysis of samples contain -ing low-concentration elements(axial) and high-concentration ele-ments (radial) within one sequence.
The intelligent ICPEsolution soft-ware enables automatic wave-length optimization as well as cor-rection of interferences. Assistantfunctions help to develop methodsand to evaluate the results.
Minimum operating costs
In the new ICPE-9800 series,there was particular emphasis onminimizing operating costs as well
as on high performance. For in -stance, argon consumption is re -duced to 10 L/min due to theminitorch technology. The vacu-um optics do not require purgingof the optical tank with argon ornitrogen, as is common in manyspectrometers.
Moreover, the energy-saving Ecomode enables further reduction ofargon and energy consumptionduring standby operation betweenmeasurements. Using 99.95 %pure argon instead of the com-monly used 99.999 %, only re -quired for purging the optics, isan additional savings potential. In
ICPE-9820
this way, up to 20,000 Euro can besaved over a three-year operatingperiod.
The accessories program includesa wide selection of pneumatic neb -ulizers, nebulizer chambers and ul -trasonic nebulizer for various sam -ple materials. Combining with au -tosamplers such as the ASC-9800or the ASX-520 enables fully auto -mated multi-element analysis.Through the use of the ASXPressPLUS sample introduction sys-tem, measuring times of less thanone minute can be achieved for thehighest possible sample through putand reliable results.

PRODUCTS
10 SHIMADZU NEWS 1/2015
I n recent years, imaging massspectrometry (imaging MS) hasreceived increased attention
through a variety of applications.This fairly new innovation in massspectrometry allows spatial as -signment of analytes as well astheir identification. The sample –for instance, a tissue section – isanalyzed using mass spectrometryat specified locations in a grid.The mass spectra of the individualpoints are subsequently combinedvia dedicated software into oneimage (MS image) which repre-sents the distribution of individualsubstances within the sample. Thisway, the occurrence of certain mol -ecules at specific locations can becompared with morphological ab -normalities.
illumination, as well as fluores-cence images (up to 5 optionalwavelengths). The analytes areionized via MALDI (Matrix-Assisted Laser Desorption/Ioniza -tion) at atmospheric pressure.
With the iMScope TRIO (Figure1), Shimadzu offers a worldwideunique instrument for imagingmass spectrometry. The iMScopecombines an optical microscopeand a high-resolution mass spec-trometer in one single instrument.This allows direct comparison ofthe MS image with the microscop-ic image. Substances from samplesthat were microscopically exam-ined cannot only be identifieddirectly, but their spatial distribu-tion within a tissue can also bedetermined.
World’s best spatial resolution
The optical microscope can ac -quire images in epi- and trans-
The solid-state laser used for thispurpose can scan the sample witha variable diameter of 5 to 200 μm.This results in a maximum resolu-tion of the MS images of 5 μmwhich is currently the world’s bestspatial resolution that can beachieved.
The ionized molecules are subse-quently analyzed using the inte-grated ion-trap time-of-flight (IT-TOF) mass spectrometer. Thehigh-resolution system can alsocarry out MSn analyses whichenables identification as well asstructural elucidation of the targetanalytes. Furthermore, MS/MSanalysis increases the sensitivitydue to a better signal-to-noiseratio.
With an analysis speed of six pix-els per second, MS images can beacquired rapidly. This way, acqui-sition of 250 x 250 pixels (62,500pixels) takes less than three hours.The possibility of exchanging theMALDI source for an ESI (Elec -trospray Ionization) source fur-ther increases the flexibility of thesystem and the mass spectrometercan also be used for the analysisof liquid samples.
Large application bandwidth
There is a wide range of possibleapplication areas, such as theanalysis of biomarkers, active sub-stances and their metabolites intissues, the distribution of sub-stances in foods and plants, butalso the analysis of micro-defectsor minute contaminations in syn-thetic materials. In general, theiMScope TRIO is used in innova-tive Research & Development.
The following example showswhich additional information is
Insights on molecularleveliMScope TRIO with revolutionary technology
iMScope TRIO – Imaging Mass Microscope
Figure 1a: MS/MS image of quercetin
(m/z 269.2 → 224.97)
Figure 1b: Overlay of the MS/MS image with
the optical image

11SHIMADZU NEWS 1/2015
PRODUCTS
gained from the comparison of anoptical image with an MS image.A rat liver section was treatedwith quercetin and used for analy-sis. The MS image (Figure 1a)alone shows an apparently ran-dom uniform distribution ofquercetin over the entire sample.After overlaying with the micro-scope image (Figure 1b), a correla-tion between the localization ofthe molecule and the structureswithin the investigated liver tissuecan already be visualized. Magni -fication of the overlayed image(Figure 3) clearly shows that allthe detected quercetin moleculesare exclusively localized in theintracellular space or on the cellwalls and not inside the cells.
The use of a larger laser beamdiameter would have resulted in aloss of spatial information aboutthe localization of quercetin with-in the tissue. A precise allocationto the intracellular space or thecell membrane would not havebeen possible.
Resolution is applicationdependent
Depending on the investigatedobject, a medium or high spatialresolution is required. In order tostudy the localization within larg-er tissue structures, a medium res-olution is sufficient, whereas lo -calization on the molecular levelrequires the highest possible reso-lution.
High resolutions can be used todetermine the distribution ofdrugs in microstructures or theaccumulation of their metabolites.
Figure 2: By enlarging the superimposed
image, it can be seen that quercetin is local-
ized in the intracellular space and not inside
the cells
Figure 4: Overlay of the MS images from three different retinal lipids
Figure 3: Microscopic image of the retina as well as MS images for two different lipids at resolutions of each 10 μm, 20 μm, 50 μm
and 100 μm
For the investigation of variouslipids that are present in the retinaof the eye, a higher resolution of10 μm was selected. The micro-scopic image (Figure 4) shows theretinal pigment epithelium as adark band that separates the innerfrom the outer retina. MS images(Figure 4) of two different lipids(m/z = 798.54 und m/z = 872.61)were acquired using several reso-lutions (10 μm, 20 μm, 50 μm und100 μm). The outline of the retinalpigment epithelium only can berecognized at a resolution of atleast 10 μm. At a lower resolutionthis outline is lost.
Software for data acquisitionand analysis
The ‘Imaging MS solution’ soft-ware specifically developed for theiMScope TRIO is used for dataacquisition as well as for dataanalysis. The software allows theoverlaying of several MS images(Figure 5). The high resolution of
the MS images allows for accurateassignment of the three investigat-ed lipids. While PC (phosphati -dylcholine, 16 : 0/22 : 6) exclusivelyoccurs in the outer retina, PC(18 : 0/22 : 6) can be found directlyadjacent to the retinal pigmentepithelium in the inner retina, andPC (16 : 0/18 :1) even further in -side the retina.
Additional tools for statistical dataanalysis are Hierarchical ClusterAnalysis (HCA), Region of In -terest Analysis (ROI) and Princi -pal Component Analysis (PCA).
Matrix deposition without delocalization
To obtain MS images with maxi-mum spatial resolution, samplepreparation is very important,next to an excellent performanceof the mass spectrometer. Thematrix required for ionization isconventionally dissolved in liquid
and sprayed or spotted onto thesample. As a result, there is alwaysa risk that the target analytes willdissolve in this liquid and diffuseinside the sample. This will lead tothe situation that despite usinginstruments, which are capable ofhigh-resolution sample analysis,the sample no longer yields such ahigh resolution.
With the iMLayer, Shimadzutherefore offers a device for ma -trix application with which thiseffect cannot occur. The matrix isdeposited via a sublimation pro -cess, whereby a thin layer of verysmall matrix crystals is applied,and delocalization of analytes can-not occur. In combination withthe iMLayer, the iMScope offers aunique and complete solution forsample preparation, acquisitionand overlay of optical and MSimages with the world’s best spa-tial resolution, as well as (statisti-cal) data evaluation via imagingMS solution software.

APPLICATION
A few kilometres south of theFrench border, the city ofLa Chaux-de-Fonds is lo -
cated in the French-speaking partof Switzerland in the Jura moun-tains. The city is the most impor-tant center of the watch makingindustry in the country and wasadded to the World Patrimo ny ofUNESCO. It is home to Metallo-Tests SA, and no wonder, sincethe company as an indepen dentlaboratory accredited for Swisstesting focusses on materials andelements testing for the watch-making industries. Besides thiskey area, Metallo-Tests serves themedical industry, micro-electron-ics, telephony, writing instru-ments, leather goods and acces-sories, eyewear, toys, packaging,automotive and environment.
are carcinogenic, endocrine dis-ruptor or organic pollutant theycan be restricted (SVHC = Sub -stances of Very High Concern)
A watch is made up of many ele-ments that must meet the criteriafor biocompatibility and theREACH Regulation of the Euro -pean Union to prevent allergy inthe consumer or legal non-compli -ance problems with the country inwhich the watch is sold. A braceletcan be made of leather, rubber orsteel. Depending on the constitu -ent materials, the substances ofrestriction will be different.
Leather straps – Chromium VI
For example, the majority of leath -er straps are tanned with chromi-
posed by the introduction of newlaws or standards (especially inchemical analysis) and the increaseof market requests. For over thir-ty years, the company continuesto expand by investing regularlyin advanced equipment. The ex -ample of a wristwatch demon-strates Metallo-Tests’ core compe-tencies.
Biocompatibility and REACHcompliance of a wristwatch
REACH (Registration EvaluationAuthorization of Chemicals) is aEuropean regulation concerningall chemicals manufactured in orimported into Europe. Chemicalsubstances must be registered andtheir potential risk for health orenvironment are evaluated. If they
Metallo-Tests SA aims to caterperfectly to the constraints im -
12 SHIMADZU NEWS 1/2015
The secrets of a Swiss watch»In our lab we R.E.A.C.H. the very secrets of matter«
Figure 1: HPLC Nexera with Photodiode
Array detector

13SHIMADZU NEWS 1/2015
APPLICATION
um salts (III). Poor control of thetanning process can cause oxida-tion of Cr III to Cr VI, the latterbeing carcinogenic and mu tagenic.It is therefore limited to 3 mg/kgin Europe for leathers which comeinto contact with skin [1].
Extraction is carried out accordingto ISO 17075. After discolorationof the extraction solution by apassage through a C-18 cartridge,a reagent is added to form a pinkcomplex with Cr VI. A dosage at540 nm allows the content of CrVI to be determined. This analysisis executed with the compact UV-2600 universal, research-gradespectrophotometer that can beused in a wide range of fields andexpanded easily to suit the meas-urement objective.
Formaldehyde
The leather straps are usually de -signed with a finishing to be moreresistant to environmental con-straints such as sweat, humidityand cosmetics. Treatments to im -prove their strengths may containformaldehyde which can be irri-tating and is recognized as carci -nogenic. It is restricted in manycountries at 75 mg/kg [2].
tively coupled plasma emissionspectrometer at the most sensitivewavelengths of nickel, 221.6 and231.6 nm.
AuthorDr. Sandra Wermeille
Metallo-Tests SA
La Chaux-de-Fonds, Switzerland
www.metallo-tests.ch
Legal references:[1] LBFG Deutschland und REACH,
Annex XVII
[2] Japanese Law 112 und GB 20400/2006
China
[3] Reg. (EC) No. 850/2004 (Act on Persistent
Organic Pollutants)
[4] REACH, Annex XIV und List of SVHC
(Substances of Very High Concern)
[5] REACH Annex XVII, Entry No. 27
ATR cell enables a rapid di agnosisto determine which family thepolymer belongs to. This anal ysisalso verifies the absence of poly-mer degradation after aging byenvironmental testing, such asozone, sunlight exposure, heat andhumid ity, sweat contact or oxida-tive vapors. These tests simulatesurrounding conditions the brace -let will be submitted to.
Plasticizers
In case where a watch containsrubber or plastic, there is a poten-tial risk in the presence of plasti-cizers such as restricted phtha-lates. Some phthalates are subjectto authorization [4] because theyare classified as endocrine disrup-tors. One of the most used re -stricted softeners is DEHP (Di-(2-ethylhexyl) phthalate, CAS No.117-81-7). Phthalates are extractedaccording to EN 15777 or ISO16181. They are then measured byGCMS-QP2010 with EI detector.
Metals
Where metallic elements in con-tact with the skin contain nickel,such as AISI 316L stainless steelas case or clasp, a nickel releasetest is required. Nickel allergyaffects a large percentage of thepopulation (nearly 13 %, largelyfemale). Before being sold, theparts to be in direct and pro-longed contact with the skin arechecked according to EN 1811.Their nickel release must be incompliance with REACH [5]. The tested components of thewatch are immersed in an artificialsweat solution for one week andthe amount of nickel released ismeasured by ICPE-9000 induc-
Extraction is carried out accordingto ISO 17226-1 and assay is per-formed on a Nexera UHPLC withPhotodiode Array detector at 360 nm.
Short-chain chlorinated paraffin (SCCP)
With these leathers, the presenceof short-chain chlorinated paraffinSCCP is also verified in accordancewith ISO/DIS standard 18219.These waxes are generally derivedfrom greasing treatments used toprevent them from drying out.The use of SCCP is banned in Eu -rope since they pollute the envi-ronment [3]. These SCCPs canalso be found in plastics or rub-bers where they are used as flameretardants. After extraction, theyare assayed on a GCMS-QP2010gas chromatograph mass spec-trometer with NCI detector toincrease sensitivity.
Plastics and rubber straps
Bracelets made of rubber or plas-tic can be of diverse nature (FKM,HNBR, NBR, PVC, silicone etc.).Analysis on Shimadzu’s FTIRspectrometer IR Prestige-21 with
Figure 3: GC-MS spectrum of phthalates mix (DiBP, DBP, BBP, DEHP,DnOP, DiNP/DiDP)
Figure 4: ICP-OES spectrum of Ni at concentrations between 100 and 2,500 µg/L
at 231 nm
Figure 2: Calibration curve of DEHP (Di-[2-Ethylhexyl]phthalate) softener with
GCMS-QP2010
0.250.50
1.000.75
1.251.501.752.002.252.502.753.00
6.0 7.0 8.0 9.0 10.0 11.0 12.0 13.0 14.0 15.0 16.0 17.0 18.0 19.0 20.0 21.0 22.0 23.0
(x 10,000,000) Max. Intensity: 30,577,172
0
200
400
600
800
1,000
1,200
1,400
1,600
Inte
nsit
y

LATEST NEWS
B lood or serum analysis canhelp in the diagnosis ofnumerous diseases and is
also used to investigate possibleexcessive or insufficient supple-mentation with vitamins or traceelements. Blood serum is a diffi-cult analytical matrix since it con-tains many different components,and serum analysis is therefore amajor challenge. Atomic absorp-tion spectroscopy offers a reliableand robust analysis method.
Atomic absorption spectroscopy(AAS) with graphite furnace hasbeen proven to be successful inthe analysis of trace elements inserum. The advantages of this sys-tem are the high detection sensi-tivity (measuring range in thelower μg/L range), small samplevolume required (10 - 20 μL) andthe relatively low sensitivity todifficult matrices.
In order to operate an atomicabsorption spectrometer, speciallamps are required that containthe specific element to be ana-lyzed – selenium determinationtherefore requires a seleniumlamp. The selenium in the lamp is
curs below this range and maycause a variety of problems. Anexcess of selenium is, however,toxic. The margin between seleni-um deficiency and a toxic concen-tration is very narrow. It is there-fore important to determine theselenium concentration in bloodand to monitor any additionalselenium intake closely.
How atomic absorption spectroscopy works
Instrumental analysis is an impor-tant diagnostic tool in the analysisof blood or blood serum. Manycauses of disease can be deter-mined from blood compositionand can be treated accordingly. In addition to its many main com-ponents, blood also contains sub-stances that the human body needsonly in minute amounts. One ofthese substances is selenium.
Selenium is an essential trace ele-ment for the human organism.This means that the body onlyneeds selenium in trace amounts.The selenium concentration in se -rum lies in the range of about 50 -120 μg/L. Selenium deficiency oc -
14 SHIMADZU NEWS 1/2015
Selenium in blood serumAtomic absorption spectroscopy for trace analysis
excited in such a way that it emitsselenium-specific light.
The element-specific light is di -rected via a special mirrors throughan optical path in which a so-called atomization unit is placed.In trace analysis, a graphite fur-nace atomization unit is used.This furnace includes a tube ofabout 3 cm in length made ofcompressed graphite. After pass-ing through the graphite tube, the
element-specific light is directedby other optical parts onto a pho-tomultiplier which measures theincident light.
For the analysis, an aliquot of thesample (approx. 20 μL) is injectedinto the graphite tube and heatedelectrothermally. First, the solventis evaporated and the remainingsample components are ashed. In aso-called atomization step, thesample is subsequently irradiatedwith enough energy to convert thesample components into manyfree excitable ground-state atomsof the respective element. In theground state, atoms absorb energyfrom light emitted by the lamp.The system measures the lightintensity attenuation (absorption)during the atomization phase(atomic absorption).
During atomization, temperaturesof up to 3,000 °C are generated.To protect the graphite tube fromoxidation (by atmospheric oxy-gen), a small continuous stream ofargon is directed through thetube. The argon gas flow also fo -cuses the resulting atomic cloud.The measuring range for seleniumlies at about 2 μg/L to 25 μg/L(LOD < 0.5 μg/L) for sensitivesystems (AA-7000G).
Various graphite tubes are avail-able for graphite-furnace AAS.For serum analysis, graphite tubeswith an omega-shaped platformhave proven to be successful asthey heat the sample uniformly.
-5,000 -2,500 0,000 2,500 5,000 7,500 10,000 12,500 15,0000.000
0.025
0.050
0.075
0.100
0.125
0.150
0.175
0.200
Concentration [µg/L]
Abs. = 0.0094867 Conc. +0.050650 r = 0.9999
Abs
.
Figure 2: The graph shows the evaluation function according to the standard addition
method (r = 0.9999)
Figure 1: The images show a graphite tube in the optical beam before and during the
injection (total of 25 μL). It is important that the sample is carefully and ‘reproducibly’
placed in the tube.
Table 1: Composition of the sample injection for the individual measuring points and the resulting concentrations of the selenium addition
10 μL5 μL0 μL
0 μL5 μL
10 μL
5 μL5 μL5 μL
0 μg/L7,5 μg/L15 μg/L
10 μL10 μL10 μL
Sample volume Water addedStandard added (Selenium
concentration 30 μg/L)Palladium modifier
addedResulting selenium
addition

15SHIMADZU NEWS 1/2015
LATEST NEWS
Sample preparation
In addition to water (> 90 %) andsoluble substances that occur nat-urally in blood, serum containsmainly proteins (about 7 %). Be -cause of the high viscosity and theorganic matrix (proteins), the se -rum sample is diluted at a ratio of1 :10 with ultrapure water. To fur-ther reduce the viscosity of thediluted sample, a surfactant (Tri -ton X) is added to the dilution.This dilution can be placed direct-ly in an autosampler vial for sub-sequent analysis. Due to the dilu-tion factor (factor 10), the work-ing range of this analysis is about20 μg - 250 μg per liter of serum.
Temperature program
Selective, straightforward and sen-sitive analysis using graphite-tubeAAS requires an adapted and op -timized temperature program. First,the water must be evaporated slow -ly without splashing the sample inthe graphite tube. The interferingorganic substances are then ashedat temperatures up to 1,100 °C.
Selenium has a boiling point of685 °C, and suitable measuresmust be taken to prevent lowermeasurement values. Injecting asmall amount of palladium nitratesolution will suffice for this pur-pose. This can be programmedand carried out automatically viaan autosampler.
The palladium modifies the seleni-um in such a way that it will onlyevaporate at higher temperaturesand is therefore not volatile athigher drying temperatures suchas 1,100 °C. The atomization stepthen takes place at 2,500 °C andneeds just a few seconds. Absorp -tion measurement also takes placeduring this time span.
Calibration
In graphite-furnace AAS, absorp-tion is recorded along the time-
Figure 3: Peaks of three injections (red = sample without addition,
black = both injections with different amounts of selenium). The y-axis shows the
absorption versus time in seconds (x-axis).
Table 2: Certified reference sample concentrations (Sero, Norway) and related statistical data for results recovery (confidence interval/acceptance range) as well as analytical results of
the AA-7000G (*95 % confidence interval)
SampleSerum L-1Serum L-2
Measured values107 μg/L157 μg/L
Analyt. uncertainty* 100 - 114 μg/L150 - 164 μg/L
Acceptable range93 - 121 μg/L143-171 μg/L
Measured values107158
RSD [%]3.92 %4.00 %
SD [μg/L]46
Final result107 ± 4 μg/L158 ± 6 μg/L
Serum Specifications in accordance with analysis certificate Results Shimadzu AA-7000G
2.0 2.5 3.0 3.5
0.000
0.025
0.050
0.075
0.100
0.125
0.150
0.175
0.200
Intensity [Abs.]
Time [sec.]
axis during atomization. This re -sults in a peak, whose height orarea is used for calibration as ameasure of concentration. Forevaluation, external calibrationsare typically used.
For difficult matrices such asblood serum, the standard addi-tion method has become an estab-lished evaluation method. Thesample is mixed with a standardsolution in various ways and mea -sured afterwards (Table 1, Figure2). In this way, sample measure-ments in different concentrationlevels are obtained in which theindividual matrix interferences ofthe sample are optimally takeninto account.
When the measurement parame-ters (height or area) are plottedagainst the added selenium con-centrations, the graph shows thesample concentration on the nega-tive x-axis. In this way, each sam-ple obtains its own internal evalu-ation function. The injection se -quence is fully programmable andcan be carried out using an auto -sampler. The user only has to fillthe sample vials and provide thestandard addition solution and themodifier. Evaluation of the resultsalso takes place automatically.
Measurement example
Two certified sera with differentconcentration were tested for meth -od development. The results andthe standard deviation were ob -tained after three injections for eachconcentration level (Fig. 3, Tab. 2).
Conclusion
It is anything but easy to analyzetrace elements in difficult matricessuch as blood serum. A robustmeasurement system with an opti-mized furnace program, appropri-ate equipment and a suitable dataevaluation method can make suchspecialized analytics available forroutine analyses.
Read for youin G.I.T. Labor-Fachzeitschrift 8/2014

S ome beverages are sensitiveto light and can lose colorand vitamins. This is why
they are distributed in coloredglass bottles to protect them fromthe influence of light. The colorand shape of bottles are often partof the sales strategy to attract theattention of buyers. As the pro-duction of glass bottles requiresmuch energy, recycling of glass isworthwhile. In Germany, recy-cling is promoted via the ‘GreenDot’ system. Used glass bottlesare collected in separate contain-ers for white, brown and greenglass, and this multitude of colorsis a challenge. How to handle blueglass or bottles that are neitherbrown nor green, but appearmilky?
Colors are subjective, but theycan also be characterized objec-tively using color tables. Spectro -scopic methods such as UV-VISspectroscopy can help. De pendingon the desired quality of the endproduct, higher or lower percent-ages of recycled glass are being
Testing wine bottlesCombining UV and EDX – Non-destructive quality control, fast and simple screening method
used in glass production. The basematerial silicon dioxide is mixedwith coloring oxides. The oxidesare used depending on the desiredspecifications (color) of the endproduct.
In white glass, for instance, ironoxide causes interference whichmakes the glass appear slightlygreen. If the color should be moreintense, chromium oxide is addedand the glass turns into more in -tense green. Brown glass containsmanganese oxide and iron oxide.A variation of oxides results indifferent colors. To be able to lim -it the immense number of colorshades, oxides of complementarycolors are added to decolorize theglass.
It is therefore interesting to knowthe composition of the glass gran-ulates before smelting and, withthis knowledge, to add furtheroxides if necessary. A fast methodto determine this composition iselemental analysis with an energy-dispersive X-ray fluorescencespectrometer (EDX). This tech-nique enables direct non-destruc-tive analysis of the material todetermine its elemental composi-tion. The technique provides in -formation of the main elementsand interfering elements in glassproduction.
While glass consists to a largeextent of SiO2, it is also possibleto determine iron (Fe), manganese(Mn) and chromium (Cr) in addi-tion to the silicon (Si) signal. A traditional glass is made of leadcrystal which contains lead oxides.The element lead (Pb) is also in -cluded in the analysis spectrum ofthe EDX systems and is in addi-tion subject to the RoHS (Restric -tion of Hazardous Substances)directive.
The experiment presented herediscusses the end product winebottle. The intention is to analyze
the bottle non-destructively. Thisis possible using UV-VIS spectros -copy as well as the EDX system.The sample compartments in both instrument classes are largeenough to hold an entire bottle.
Measurement results using UV-VIS spectroscopy
There are different approaches forqualification in glass analysis. It ispossible to perform a standardized
APPLICATION
16 SHIMADZU NEWS 1/2015
Figure 1: Two wine bottles of different glass
color were of interest. The green bottle on
the left is referred to as an old wine bottle
and the green-blue bottle on the right as a
new wine bottle. Figure 2: Bottle in the measurement position in front of an integrating sphere in the
MPC-2600. The measuring window is 1 x 2.5 cm. The bottle can be positioned using the
x-y-z table. The measuring window can be seen through this thin transparent bottle.
nm.
Abs
.
-0.2980.000
2.000
4.000
6.089
332.79 400.00 600.00 800.00 899.34
Figure 3: Absorption spectra of glass bottles in the visible spectral range of 310
to 890 nm

17SHIMADZU NEWS 1/2015
APPLICATION
color analysis for which special-ized evaluation software is avail-able, for instance Chroma (ILIS)or Color Lite (LabCognition).These color analysis softwarepackages calculate standard colorvalues from the given UV spec-trum. These are objective coloranalysis methods.
Classical evaluation is performedon the spectrum itself. The natureof the oxides and their specific
energy potentials yield character-istic UV-VIS spectra. These spec-tra work like fingerprints, even athigh concentrations. Interpreta -tion of the spectra enables classifi-cation of the elements that are in -volved in the coloration of the glass.
Another challenge is the shape ofthe material, for instance a bottlewith thick walls. In the transmis-sion and absorption method, twowalls were illuminated. This in -evitably leads to strong absorp-tions. In this analysis, another in -terfering material is present: theglass itself. It exhibits strong ab -sorptions in the ultraviolet range,which affects the analysis of ironoxides. UV spectroscopic analysisfocuses on the color of the solid.In this analysis, the sample mate-rial was not destroyed (Figure 2).
In addition to coloring materials,glass also contains other main ma -terials that are required for theproperties of the target applica-tion. In order to identify these el -ements, the non-destructive EDXmeasuring technique is recom-mended.
Figure 3 shows the absorptionspectra of two wine bottles. The
black line (bottom) represents thecolors and components of the oldbottle and the blue line (upper)those of the new bottle. In thespectra, the Fe2O3 range (400 -450 nm) and the Cr2O3 range at650 nm can be clearly recognized.A quantitative shift can be identi-fied in the spectra. The black spec-trum (bottom) shows that there ismore Cr2O3 present, while in theblue spectrum the iron oxide re -gion around 410 nm absorbs morestrongly.
Using the second derivative, theoxide fine structure (Fig ure 4) canbe made visible for these spectrathat were measured with a resolu-tion of 5 mm.
The increased iron oxide signals inthe blue spectrum are a matter fordiscussion. In the literature, an in -crease of the signals by manganeseoxide has been described [3]. Thiseffect, and the reduction of thechromium oxide, causes the bottlecolor to change to brown.
Measurement results using the EDX technique
Using EDX, all elements involvedin the composition of the glass canbe identified, For the measure-ment, the bottle is placed on themeasurement window. The high-energy radiation of the EDX pen-etrates the glass, and the elementsreact to the X-ray irradiation byemitting fluorescence radiation.This fluorescence radiation is de -
Table 1: Typical oxides for staining of glasses [1]
Table 2: Comparison of the element distribution in both wine bottles
Figure 5: EDX measurement curves of a
wine bottle, where blue represents the old
wine bottle and red the new wine bottle.
The green color of the old bottle is related
to its higher Cr content.
nm.
Abs
.
-1,715
-1,000
0,000
1,000
2,000
2,504
571.23 600.00 650.00 700.00 750.00 800.00
816.06
Figure 4: Using the second derivative of the spectrum of the old wine bottle, the energy
bands belonging to Cr2O3 can be made visible according to the literature [2]
5.3 5.5[keV]
0.50
1.00
1.50
2.00
[cps/uA]
Iron oxideCopper oxideChromium oxideCobalt oxideManganese oxideRare earths
Green, yellow or brown-blackBlue, redGreenBlueUsed to decolorize the green castVarious colors
OxideColor (varies depending on the oxidation
level of the element)
CaOK2OFe2O3
Cr2O3
MnOSiO2
Property of the color
23,56 %10,736 ppm
7,662 ppm4,932 ppm
732 ppm73.66 %
Green
21,60 %13,010 ppm
8,640 ppm1,789 ppm
810 ppm75.44 %
Green-brown
Element Old wine bottle New wine bottle
tected, is element specific and cantherefore be assigned to each ele-ment. Due to the presence of glass(SiO2), a high percentage is as -signed to silicon oxide. Since thestarting materials used in glassmanufacture are silicon oxide andmixtures of other oxides, a rangeof elements can be expected. Theanalysis presented was carried outwith the fundamental parameters.The observed surface is 1 cm indiameter. For analysis, the bottleis placed directly into the samplecompartment.
Two wine bottles of differentyears were analyzed. Both bottlesare used for bottling red wine. Asmight have been expected, theEDX result was dominated by thetypical glass oxides – i.e. SiO2,CaO and K2O, which representthe main components in both bot-tles. A summary of the results ispresented in table 2. The results of individual measurements areshown in figures 6 and 7 (Page 18).
�

APPLICATION
18
Figure 6: Analysis of the new wine bottle (EDX measurement) Figure 7: Analysis of the old wine bottle (EDX measurement)
Discussion
Using the EDX results, the visualand spectroscopic analyses couldbe confirmed. It was found thatmolecular spectroscopy exhibitscharacteristic signals that could beassigned to the oxides involved.The color as well as the composi-
tion could therefore be deter-mined from one spectrum. TheEDX elemental analysis comple-mented the obtained result withadditional details of the material,which could indicate that theunexpected element contributions(such as silver) originated fromrecycled glass.
Literature[1] Werner Vogel: Glaschemie. 3. Auflage,
Springer-Verlag, 1992.
[2] The effect of chromium oxide on optical
spectroscopy of sodium silicate glasses,
Bahman, Mirhadi, Behzad Mehdikhani,
Journal of Optoelectronics and Advanced
Materials, Vol. 13, No. 9, September 2011,
p. 1067 - 1070
[3] Effect on manganese oxide on redox iron
in sodium silicate glasses, Bahman,
Mirhadi, Behzad Mehdikhani, Journal of
Optoelectronics and Advanced Materials,
Vol.13, No. 10, October 2011, p. 1309 - 1312
Coffee inspired not only scienceParticle measurement using the SALD-2300
»Design while drinking wine,execute while drinking cof-fee.« With these words, Jean
Paul, a writer in the Romanticperiod, bestowed literary honorson coffee and associated the stim-
ulating effects of coffee with cre-ative work. But coffee not onlyhelps writers at their desks, butalso helps scientists to endure longnights at the laboratory – and whoknows to which fundamental
SALD-2300
SHIMADZU NEWS 1/2015

19SHIMADZU NEWS 1/2015
APPLICATION
700 μm, to a particle size of ap -proximately 1,500 μm.
The SALD-2300 with its numer-ous accessories is suitable for vir-tually any application. In additionto dry particle measurement, theSALD-2300 can be used for wet-dispersion particle measurement.Accessories such as the BC-23 andthe MS-23 are available for thispurpose. Even highly concentrat-ed pastes with a particle concen-
tration of up to 20 % can bemeasured using the optional HC-23 accessory.
Particle diameter (μm)
Nor
mal
ized
par
ticl
e am
ount
(Cu
m)
0 0
5
10
15
20
50
100
0.01 0.06 0.1 0.5 1 5 10 50 100 500 1,000 5,000
Q3 (%) q3 (%)
1234
––––––––––––
Coffee_001Coffee_002Coffee_003Coffee_004
0.0000.0000.0000.000
3.00-0.20i3.00-0.20i3.00-0.20i3.00-0.20i
226.457500.501587.659630.067
161.963675.330675.330675.330
256.396472.267566.298606.458
0.3720.2430.1810.169
95.40193.01993.23692.228
89.14981.16978.97975.257
71.95549.69335.49128.157
60.42125.4479.1795.956
20.6510.8240.0420.026
File nameAbsorb -
anceRef. index
Mediandiameter
Modal diameter
Meanvalue
Standarddeviation
1,000.0μm
800.0μm
500.0μm
315.0μm
125.0μm
Figure 1: Particle size distribution of four different coffee samples
Coffee – four popular brewing methods
Filter coffeeThis brewing method is especiallypopular in the U.S. and in Germany.In the method developed in 1908by Melitta Bentz from Dresden,Germany, medium-finely groundcoffee is placed in a paper filterbag and extracted by pouring hotwater over it.
Espresso methodIn this method, water is forcedthrough finely ground coffee undera pressure of 9 - 15 bar. As a re -sult, a layer of foam generallyknown as ‘crema’ is formed fromthe coffee’s oils. The espressomethod is very popular in Italy andother countries.
Depending on tradition, culture and personal taste, there are hundreds ofways coffee can be brewed. However, almost all brewing methods fall intoone of the following basic preparation methods. The coffee is ground to adifferent degree for each of these methods.
French pressAs the name says, this brewingmethod is especially popular inFrance. The coarsely powderedground coffee is placed directly inhot water and is subsequently sep-arated from the water using a pressplunger and metal sieve before pour -ing the coffee into cups.
Turkish coffee or mochaThis brewing method (and actuallyalso the type of coffee itself) wasnamed after the port city of AlMukah on the Red Sea. Here, anultra-finely ground coffee (resem-bling powdered sugar) is mixedwith the same amount of sugar,and this mixture is boiled for sev-eral minutes in a copper kettle. The mocha is ready for drinkingwhen the coffee grounds have set-tled at the bottom of the cup.
achievements coffee was thesteam ing witness. But have anyresearchers in this situation everwondered about the history andorigin of this exotic beverage?
According to legend, a shepherdnoticed his animals behaving odd -ly: they were still fit and awake,and were hopping around in spiteof the approach of night. He foundout that his lively sheep had nib-bled on the red berries of a kaffabush, which apparently causedthis odd behavior.
And whether he ate the berriesand noticed the same effects him-self or whether he brought theberries to monks who experiment-ed with the beans and createdbrews – here the stories start todiverge.
One thing is certain, however: thecoffee bush and the coffee bean(which in botanical terms is thepit of a fruit resembling cherries)originate from the province ofKaffa in the forested highlands ofsoutheast Ethiopia. Several cen-turies would pass, however, untilcoffee conquered the entire world.
Enjoyment depends on many factors
Coffee is a science in itself. Notonly is the entire process of plant-ing, harvesting, cleaning, and pre -paring the coffee challenging andrequiring a professional eye, butdownstream processes such asroasting are also important.
Of course, brewing a good cup ofcoffee also has to be learned. Theappropriate temperature, the cor-
rect mixing ratio of water andground coffee, the water pressureand many other influences such asgrind settings of the coffee beanswill add a particular flavor.
The degree of grinding of the cof-fee beans determines the taste ofthe coffee. Using the SALD-2300particle size analyzer (measuringrange 17 nm - 2,500 μm, concen-tration range: 0.1 ppm - 20 %)with the DS-5 dry measurementunit, various coffees were meas-ured. For a single measurement, a volume of approximately 0.5 - 1 cm3 was needed. In addition tothe type of coffee and degree ofroasting, the fineness of the grindwas a crucial difference.
It has become apparent that theoil and overall moisture content ofpowdered coffee pose a particularchallenge for measurement. Indi -vidual particles can stick togethereasily to form larger aggregates.This effect was even slightly exac-erbated by vacuum packaging thecoffee samples.
After drying the powdered coffeeand due to the very efficient dou-ble-dispersion process of the drymeasurement unit, highly repro-ducible measurement of the indi-vidual samples became possible.
Results
Figure 1 shows measured resultsof a total of four coffee samples (2 x filter coffee, espresso andmocha). The particle size distribu-tion based on volume ranges from50 μm, with the first maximum atapproximately 150 μm, via a sec-ond maximum at approximately

APPLICATION
T hey are natural and part ofthe biosphere, but they aretoxic for humans and ani-
mals – mycotoxins are metabolicproducts of lower fungi, whichalso include molds. They areformed during improper storageof food or feed materials, or underadverse conditions such as in -creased humidity or elevated tem-peratures before harvest in thefield. Since acute poisoning rarelyoccurs, these substances attract lit-tle attention.
Although very high levels of my -cotoxins can act acutely toxic, thehighest hazard potential, however,lurks in their carcinogenicity, mu -tagenicity and teratogenicity whentaking up low quantities over anextended period of time. Further -more, it has to be assumed thatthe accumulation of mycotoxinsin the human body is responsiblefor the development of organ dis-eases such as nerve, kidney, liverand heart damages.
Contamination with fungi or theirmycotoxins in the field or duringstorage is a serious problem, alsofor agriculture worldwide. Accord -ing to estimation of the Food andAgriculture organizations of the
in various types of baby foodusing the LCMS-8050 triple-quadrupole mass spectrometer.The following foods were exam-ined in detail: powder for thepreparation of baby milk, milkthickening cereals, flour, rice andtapioca, as well as a vegetablepurées mixed with cereals.
Materials and methods
Sample preparation:20 mL of a water-acetonitrile mix-ture (volume ratio 1 : 1) was addedto the homogenized sample (5 g),treated for 5 minutes in an ultra-sonic bath and subsequently agi-tated for additional 30 minutes atroom temperature. After centrifu-gation (3,000 g, 10 min.), the su -pernatant was diluted with water(volume ratio 1 : 4). The extractioncolumns (Isolute® Myco, Biotage,Sweden; 60 mg / 3 mL) were firstconditioned with 2 mL acetoni-trile and then with 2 mL water. 3 mL of the diluted supernatantwere transferred onto the extrac-tion column at the lowest possibleflow rate.
This was followed by two wash-ing steps, first with 3 mL of water,
because of their low body weight,their higher metabolic rate andtheir poorly developed ability todetoxify contaminants and foreignsubstances (xenobiotics). The Eu -ropean Commission has, there-fore, specified very low limits, es -pecially for infant and child nutri-tion.
The lowest levels apply to thehighly toxic ochratoxin A (0.025μg/kg), as well as to aflatoxins B1(0.1 μg/kg) and M1 (0.025 μg/kg)because they belong to the mostpotent carcinogens.
A sensitive analysis for the pro-tection of very young consumersis therefore essential. This applica-tion presents a new method forultra-fast analysis of mycotoxins
United Nations (FAO) up to 25 %of the world production of grainsand derived staple foods are in -fested with mycotoxin producingfungi. Mainly grains, oily seedsand nuts, coffee, fruits, vegetablesas well as spices are affected.
Introduction of limits
Since 2006, uniform maximumlevels in certain foods have beenapplied in Europe for the protec-tion of consumers. These maxi-mum levels are dependent on thetoxicity of the mycotoxin as wellas on the intended use of the food.Processing into baby food is par-ticularly critical, as these littleconsumers have special needs. Thebody of a small child is particular-ly sensitive to toxic compounds,
20 SHIMADZU NEWS 1/2015
Hidden dangerLCMS-8050 – Faster and more sensitive detection of mycotoxins in baby food
Nexera X2 combined with Triple Quadrupole mass spectrometer LCMS-8050
min.
-500,0000
1,000,000
2,000,000
3,000,000
4,000,000
5,000,000
6,000,000
7,000,000
8,000,000
9,000,000
10,000,000
11,000,000
12,000,000
1.0 1.5 2.0 2.5 3.0 3.5 4.0 4.5 5.0 5.5 6.0 6.5 7.0 7.5 8.0 8.5
Figure 1: Chromatogram of a mycotoxin standard with 45 components at a concentration
of 50 ppb (2 ppb for the aflatoxins and ochratoxins)
Figure 2: Comparison of the zoomed chromatogram overlay shows the reproducibility
(n = 4) for 5 aflatoxins (c = 0.1 ppb) in grain flour, which is added to infant milk as a
thickening agent
min.
0.00
0.25
0.50
0.75
1.00
1.25
1.50
1.75
2.00
2.25
2.50
(x 10,000)
3.0 3.1 3.2 3.3 3.4 3.5 3.6 3.7 3.8 3.9 4.0

for Risk Assessment – BfR, Bundesinstitut für Risikobewertung). Of these, only some are relevant for food and feed safety. These include:
· Aflatoxins · Ochratoxins · Ergot alkaloids· Fusarium mycotoxins (trichothecenes, fumonisins,
zearalenone)· Patulin.
Mycotoxins are not visible and may remain in foods, even after removal of the fungi. Highly processed foods, in which detection of any fungi is oftenvery difficult or no longer possible, may still contain mycotoxins. Conversely,foods that on visual inspection are clearly infested with fungi do not neces-sarily contain mycotoxins, although consumption is strongly discouraged.
As mycotoxins are chemically very stable compounds and thermally stable up to very high temperatures, they are generally not destroyed during foodprocessing. A so-called ‘carry-over’ effect is found in farm animals that haveconsumed toxin-containing feeds. Certain mycotoxins can be deposited inunchanged or metabolized form in various organs or can be excreted.
This way, mycotoxins get into foods of animal origin (meats, eggs, milk, milkproducts) without the product being moldy itself. Also this type of contami-nation is not externally recognizable. Using sensitive analytical instrumenta-tion, however, detection and identification is possible even at extremely lowconcentrations.
History and discovery of mycotoxinsOlder than mankind and widespread all over the world, toxins of molds haveattracted the interest of researchers not till recent decades. Already in theBible, there are reports on a disease that occurs after ingesting ergot. And inthe Middle Ages, hundreds and thousands fell victim to this disease that isknown today as ergotism (St. Anthony’s fire). Even mysterious phenomena inhistory, such as the decline of many advanced civilizations or mystic deaths ofabout 30 persons that were involved in the opening and exploration of thetomb of the Egyptian pharaoh Tutankhamun, can most likely be traced back toacute mycotoxin poisoning.
Also in recent times, there have been repeated reports on initially mysteriousdiseases that were later associated with the deadly effect of molds. For in -stance, at the beginning of the 20th century, a disease caused by the fusariumfungus (in moldy sorghum and wheat) was mentioned in the former SovietUnion, that probably first appeared in the year 1891 and took hundreds andthousands human lives until the end of World War II (source: Determination ofaflatoxins and patulin using online SPE-LC by Andreas Sascha Wendt).
The first mycotoxins were discovered and identified not until in 1961 the causeof the mysterious death of 100,000 turkey poults was investigated in England.After an intensive search, the researchers encountered aftlatoxins in the moldyanimal feed. During the following years, there was a virtual explosion of dis-coveries of new toxic metabolites of molds. That these compounds could alsobe present in human nutrition and be the cause of diseases only became evi-dent over time, when optimized analytical methods and modern instrumenttechnology became available that enabled sensitive and fast monitoring offoods and food ingredients.
So far, approximately 300 different mycotoxins are known that are producedby more than 250 molds during their growth (source: German Federal Institute
21SHIMADZU NEWS 1/2015
APPLICATION
followed by 3 mL water-acetoni-trile (volume ratio 9 : 1). Afterdrying, the components were elut-ed stepwise from the column,starting with 2 mL acetonitrile,acidified with 0.1 % formic acid,followed by 2 mL methanol. Theeluate was evaporated to completedryness at 35 °C under nitrogen(Turbovap, Biotage, Sweden). Thesample was mixed with 150 μL ofa solvent mixture (water/metha -nol/acetonitrile at a volume ratioof 80 : 10 : 10 and 0.1 % formicacid).
LC-MS/MS analysis:The extract was analyzed using aNexera X2 UHPLC system(Shimadzu, Japan) coupled toShimadzu’s LCMS-8050 triple-quadrupole mass spectrometer.Sample analysis was carried out inthe MRM mode (Multiple Reac -tion Monitoring) with two transi-tions per component. The parame-ters of the ion source and the in -terface, i.e. gas flows, voltages andtemperatures, were carefully opti-mized, so that due to their syner-gistic effect, the optimal sensitivi-ty could be achieved with the
LCMS-8050. Parameter optimiza-tion is important especially for thecritical analytes, in this case theaflatoxins.
45 mycotoxins in less than nine minutes
Figure 1 shows the chromatogramof a mycotoxin standard with aconcentration of 2 ppb for theaflatoxins (B1, B2, G1, G2, M1)and ochratoxin A and B, as well as 50 ppb for the remaining myco-toxins.
As criterion for the quality of theanalysis method, the recoveryrates of the sample preparation(extraction recovery) were deter-mined, as well as the matrix effectduring ionization (ionizationrecovery) for the aflatoxins. Themeasurements were carried out in3 different matrices. Table 1 liststhe values for vegetable-grain pu -rée (comparison of the peak areasof matrix spiked with standardsbefore or after extraction, as wellas the comparison with the peakareas of a pure standard so lution).
�
Table 1: Recovery rates of the aflatoxins in vegetable-grain purée
Figure 3: Aflatoxin B1 at a concentration of 0.2 ppb
min.
0.000.100.200.300.400.500.600.700.800.901.001.101.201.30
(x 10,000)
3.5 3.55 3.6 3.65 3.7 3.75 3.8 3.85 3.9 3.95 4.0 4.5
Extraction recoveryIonisation recoveryTotal recovery
101 %49 %49 %
109 %90 %98 %
104 %96 %
100 %
114 %106 %121 %
118 %91 %
108 %
AFB1 AFB2 AFG1 AFG2 AFM1

Figure 1: A microscopic image of the microalgae cells of sample 1
G lobal warming due to ex -cessive use of fossil fuelshas prompted and acceler-
ated the search for alternativefuels. Among the more interestingalternatives is biomass fuel, whichhas attracted considerable atten-tion.
Microalgae can be used for theproduction of oil without compet-ing with food production. Com -pared with other biofuels, its pro-ductivity per unit time and area ishigh, while arable land selectionpossibilities are immense. As forthe practical use of microalgal bio-mass, various studies have beenconducted at each stage of its pro-duction, including stock selectionand breeding, cultivation, harvest-ing, oil extraction and purifica-tion.
The Shimadzu TOC-L series com -bustion-type total organic carbon(TOC) analyzer with its powerfulorganic substance oxidation fea-
rectly in a suspended culture ofmicroalgae cells. No pretreatmentis necessary.
The data presented are providedby Prof. Yoshihiro Shiraiwa’s lab-oratory at the University of Tsu -kuba, Japan.
Analytical method
The microalgae was cultured foreight days. As of the first day,TOC measurement was conductedonce per day for both sample 1(consisting of a culture along withsuspended microalgae cells) andsample 2 (with a culture only ob -tained by removing the microalgaecells from sample 1 through cen-trifugal sedimentation). Based onthe difference in organic carbon(TOC) between sample 1 andsample 2, the value of TOC pres-ent for the organic matter of themicroalgae cells was then ob -tained. Further, the turbidity ofsample 1 was measured and the
In this unique application theTOC-L is used to track thegrowth process of microalgae bymeasuring the TOC content di -
tures enables complete oxidizationand measurement of samples suchas microalgae cell culture suspen-sions.
Biomass fuel: can algae make the wheels go round? Monitoring of algae growth by TOC measurement
APPLICATION
The results for the recovery ratesin the two other matrices (babymilk powder, milk thickening ce -reals) do not differ much from thevalues listed in table 1. In addi-tion, the reproducibility of theanalysis results was investigated.Figure 2 shows the good repro-ducibility (n = 4) of the aflatoxinsat a concentration of 0.1 ppb in thematrix (matrix in this example:milk thickening ce reals).
Figures 3 and 4 clearly show thatthe required legal limit value of0.1 μg/mL for aflatoxin B1 (MRMQuan 312.6 > 284.9, MRM Qual312.6 > 240.9) as well as 0.025 μg/mL for aflatoxin M1 (MRM Quan329.1 > 237, MRM Qual 329.1 >229) is easily attained.
Conclusion
Because of its high toxic and car-cinogenic potential, reliable andsensitive determination of myco-toxins is essential, especially forthe protection of infants andyoung children.
The present ap plication describesa reliable meth od for the quantifi-cation of 45 mycotoxins in babyfood. With the ultrafast scan ratesof the LCMS-8050 and a polaritychange of only 5 ms, the analysistakes less than nine minutes. Re -covery ra tes and reproducibilitymeasurements in three differentbaby foods illustrate the reliabilityof the method.
22 SHIMADZU NEWS 1/2015
min.
0.0
0.2
0.4
0.6
0.8
1.0
1.2
1.4
1.6
1.8
2.0
(x 10,000)
3.00 3.05 3.10 3.15 3.20 3.25 3.30 3.35 3.40 3.45 3.50 3.55
Figure 4: Aflatoxin M1 at a concentration of 0.2 ppb

23SHIMADZU NEWS 1/2015
APPLICATION
value used as an index of cell mass.A microscopic image of the mi -croalgae cells of sample 1 is shownin figure 1.
Measurement Conditions
• Analyzer: Shimadzu TOC-LCPHtotal organic carbon analyzer
• Catalyst: Standard catalyst• Measurement item: TOC
(TC-IC)• Calibration curve: 1-point cali-
bration curve using 1,000 mg/Lpotassium hydrogen phthalateaqueous solution
• Sample 1: Culture solution con-taining suspended microalgaecells
• Sample 2: Culture solution withmicroalgae cells removed usingcentrifugal sedimentation Watersampling method: Sample 1water was sampled while stirringwith a magnetic stirrer.
Measurement results
Figure 2 shows the measurementresults for the total carbon (TC),total organic carbon (TOC) andinorganic carbon (IC) associatedwith the cell mass during the cul-ture period. The ratios of TOC toIC in the microalgae cells are alsoshown in figure 3. From these re -sults, it was possible to obtain in -formation on increase and de -crease of TC, IC and TOC values
The TNM-L total nitrogen unitoption is required for nitrogen(TN) measurement. In addition,filtering and centrifugal separationetc. are required for separate mea -surement of samples in the dis-solved and suspended state.
The TOC-L can be used to con-duct measurements using verysmall sample volumes in the rangeof 10 to 20 mL, making it suitablefor laboratory-scale studies.
associated with the microalgaecells throughout the culture pro -cess.
One essential element in the prac-tical realization of microalgal bio-mass is to establish the cultureconditions, and this study demon-strates that information regardingthe carbon balance can be ob -tained using a TOC analyzer.
Shimadzu TOC-L series total organic carbon analyzer
The TOC-L can be used to con-duct the following types of meas-urements:• Total carbon and nitrogen con-
tent in water, quantity dissolved,quantity suspended
• Total carbon, organic carbon,inorganic carbon in water
• Dissolved CO2 in water
The TOC-L can therefore be usedin applications of microalgae re -search such as:• Obtaining information on the
physiological state and proper-ties of microalgae
• Understanding changes in cellmaterial in the culture over timeand due to light and dark envi-ronment
• Understanding quantitativelythe carbon and nitrogen balancein the culture system.
Culture period (days)
Carb
on c
onte
nt /
tur
bidi
ty (
mg
/L)
-50
0
50
100
150
200
0 2 4 6 8 10
Culture period (days)
TOC
/TC
or
IC/T
C(r
atio
)
0
0.2
0.4
0.6
0.8
1.0
0 2 4 6 8 10
Figure 2: Changes in TC, IC, TOC quantity in microalgae cells
(conversion value per turbidity unit)
Figure 3: Changes in TOC/TC and IC/TC in microalgae cells
Abbildung 4: TOC-L-Gesamtkohlenstoffanaly -
sator plus TNM-L-Gesamtstickstoffeinheit
IMPRINT
Shimadzu NEWS, Customer Magazine of Shimadzu Europa GmbH, Duisburg
PublisherShimadzu Europa GmbHAlbert-Hahn-Str. 6 -10 · D-47269 DuisburgPhone: +49 - 203 - 76 87-0 Fax: +49 - 203 - 76 66 [email protected]
Editorial TeamUta SteegerPhone: +49 (0)203 76 87-410 Ralf Weber, Tobias Ohme
Design and Productionm/e brand communication GmbH GWADüsseldorf
Circulation German: 5,450 · English: 6,680
CopyrightShimadzu Europa GmbH, Duisburg, Germany – February 2015.
Windows is a trademark of Microsoft Corporation. ©2015
Apple Inc. All rights reserved. Apple, theApple logo, Mac, Mac OS and Macintoshare trademarks of Apple Inc.

Figure 1: Structures of stevia glycosides
0
5
10
15
20
25
30
0 5 10 15 20 25 30 35
min
mAU
min
a
b
0
5
10
15
20
25
30
0 1 2 3 4
mAUResulution
(USP)
23.3732.1315.2333.0323.2008.7267.2093.445
Width(50 %)0.0220.0280.0280.0310.0310.0310.0340.0360.037
Area
242313246137783288292972735072434933421141250
Ret.Time0.8001.7381.8372.0912.2472.4132.8853.3023.509
Name
Rebaudioside DRebaudioside ASteviosideRebaudioside FRebaudioside CDulcoside ARubusosideRebaudioside BSteviolbioside
Peak
123456789
Figure 2: a) JECFA method for the separation of nine stevia glycosides
b) improved UHPLC assay for the separation of nine stevia glycosides
PRODUCTS
W ith today’s growinghealth awareness, there isan increasing interest in
sugar substitutes in various areasof the food industry. Compared towell established artificial sweeten-ers, such as Aspartam and Sac -charin, the natural alternative Ste -via, extracted from the Stevia re -baudiana plant has been approvedfor use in the EU only in 2011.Stevia, also known as sweet-leaf, isnative to South America and the
switching valve. The system wasalso equipped with a photo diodearray detector (Figure 3).
Method scouting was performedin an overnight sequence using 3and 9 min gradient runs at 30 °Cand 50 °C. Five combinations ofstationary phase and mobile phasewere selected. The data obtainedfrom the most promising mobilephase/stationary phase combina-tion was used for computer simu-lation to identify the optimumseparation conditions with respectto gradient slope and oven tem-perature.
Resulting UHPLC method (figure 2 b)
Column: ACE Excel 2 Super C18,150 x 2.1 mmMobile Phase: 10 mM NaH2PO4,pH 2.8 A: in H2O and B: in MeCN/H2O (80 : 20 v/v)Gradient: 39.5 - 48 % B in 4 minCycle time: 7 minFlow rate: 0.6 mL/minTemperature: 50 °CInjection Volume: 1 μLSample: 0.04 mg/mL of each com-pound in MeCN/H2O (6 : 94)
Validation
The method obtained was fullyvalidated using the LabSolutions /VALIDAT interface. The incorpo-rated template assistant requiredmerely the addition of the appro-
pair. After method developmentusing the Nexera X2 MethodScouting Platform, the Nexera-inew generation integrated UHPLCsystem with its system check func -tion and automated workflow wasthe ideal tool for a quick and sim-ple programmed method valida-tion procedure.
Starting point for the developmentof an improved UHPLC methodfor the separation and quantifica-tion of nine stevia glycosides wasthe JECFA (Joint FAO/WHOExpert Committee on Food Ad -ditives) approved method, rou-tinely used for the quality assur-ance of stevia analytical standards.
Method Development
JECFA method (Figure 2 a):Column: Phenomenex LunaC18(2) 5 μm; 250 x 4.6 mmMobile Phase: A: 10 mMNaH2PO4, pH 2.6 in H2O to B: ACN (68 : 32 v/v)Isocratic: 35 min run timeFlow rate: 1 mL/minTemperature: 40 °CInjection Volume: 5 μLSample: 0.2 mg/mL of each com-pound in MeCN/H2O (30 : 70 v/v)
For UHPLC method scouting, aShimadzu Nexera X2 MethodScouting System was used, con-sisiting of two quaternary solventpumps, an autosampler and a col-umn oven including a six column
plant extract contains steviol gly-cosides with up to 450 times thesweetness of sugar.
As the Rebaudioside A steviolglycoside exhibits the lowest bit-ter aftertaste, it is largely enrichedin commercial stevia products,while natural extract contains ste-vioside as the major component.Hence, an HPLC assay for qualitycontrol purposes, must be able toclearly separate this critical peak
24 SHIMADZU NEWS 1/2015
Sweet secrets analyzed fast and easilyAutomated validation procedure of an optimized UHPLC assay
Figure 3: Schematic diagram of the Nexera X2 Method Scouting System

Figure 5: Method validation workflow guided by VALIDAT©
Figure 6: Auto-validation procedure in i-series instrument
Figure 7: Automated workflow in i-series batch analysis
Figure 8: Finished validation report created by VALIDAT© according to company
template VA
25SHIMADZU NEWS 1/2015
PRODUCTS
priate components to be validated,which was achieved by importingthe LabSolutions method file(.lcm) with compound table intothe VALIDAT project (Figure 4).
To carry out the validation suc-cessfully, the software provided allmathematical and statistical proce-dures, as well as full 21 CFR Part11 compliance. With a well-struc-tured workflow and versatile, ad -justable templates the validationprocess was organized easily andefficiently (Figure 5).
After importing the method, eachparameter, such as precision, lin-earity, repeatability etc. wasplanned individually. Accordingto these checkpoints VALIDATreleased a validation plan as astarting point for programmedbatch creation in LabSolutions.By importing the batch fromVALIDAT into LabSolutions eachdata file (.lcd) obtained a uniqueidentifier that allowed automatedexport of the analytical results
Figure 4: Validation planning by method import from LabSolutions into VALIDAT©
back into the validation software,eliminating the need for manualcopy-pasting and the risk of hu -man error during this process.
Additionally, the i-series ‘AutoValidation’ function (Figure 6)allows to easily evaluate whetheror not the system is working in astable range. System parameters,such as solvent delivery or wave-length accuracy are controlled bya fixed procedure to guarantee thesystem performance before carry-ing out a method validation.
It is also possible to carry out anautomated routine inspection andself-diagnosis of the instrumentvia the ‘System Check’ function,where data on consumable usageis recorded, such as number ofinjections, solvent volume deliv-ered by the pump or UV lampburn time. The results of the autovalidation and system check pro-cedures are summarized in a print-ed report that can be added to thevalidation documents.
After the system status had beenevaluated, the LabSolutions batchfile allowed full automation of thesample analysis from starting ofthe instrument to the shut-downprocedure after the run had fin-ished.
All necessary steps, such asswitch ing on the instrument at adefined time, purging of the flowlines, column/system equilibra-tion until a stable baseline wasobtained, sample measurements,system wash and shut-down wereprogrammed into the batch tableand carried out automatically inan overnight run (Figure 7).
Results
After electronic release of the vali-dation plan for programmed batchcreation in LabSolutions and ana -lysis on the i-series using the
workflow described in figures 4 -7, the pre-defined validation re -port (Figure 8) was completedwithin minutes thanks to the au -tomated data import into VALI-DAT. The successfully completedvalidation project was then savedas a template that will serve as astarting point for further projects.

PRODUCTS
New features and morestraightforward operationhave been the leading prin-
ciples in the development of theTOC-Control L software. In com -bination with this software,Shimadzu’s TOC-L series instru-ments offer users modern toolsfor straightforward and reliableTOC analysis in all applicationareas. Shimadzu now releases anew TOC-Control L softwareproviding new valuable features.
Residual inorganic carbon (IC) checks
Key to TOC determination is thedifference between organic andinorganic carbon. The most popu-lar method used is the so-calledNPOC method in which the sam-ple is acidified to convert the car-bonates and hydrogen carbonates,i.e. inorganic carbon (IC) presentin the sample to CO2. The carbondioxide is subsequently purgedusing a gas stream passed throughthe sample.
Furthermore, this feature is alsocompatible with the SSM-5000Asolid sample module for combus-tion option. The settings dialogueis prepared separately from TOC-L instrument validation set-tings. From these contents, a sam-ple ta ble for validation can be pre-pared.
Conclusion
The new TOC-Control L soft-ware version gives more freedomto create the optimal method formeasuring TOC in specific sam-ples. The improved validationtable also reduces validation time.
For this case, the new versionoffers the possibility to selectbetween automatic changing ofinjection of volume or dilutionfactor.
Improved support for performing instrument validation
It is necessary to confirm the per-formance of the instrument at reg-ular intervals in order to guaran-tee reliability of measurement. Forthis purpose, TOC-L has a featureto create schedules easily for vali-dation measurements. They can becreated quickly and easily usingsimple window operations andcheck parameters such as sensitivi-ty, linearity and repeatability.
During NPOC analysis measure-ment, IC removal may be incom-plete depending on pH or othercharacteristics, and IC may remaininadvertently in some samples. Ifit’s necessary to check the effec-tiveness of the IC removal treat-ment, the software will performIC measurement just after theNPOC measurement and thenoutput results in which the ICvalues are subtracted from NPOCvalues.
Automatic re-measurement of samples out of calibrationrange
With samples of unknown con-centration, the TOC-Control Lsoftware offers automatic re-mea -surement when the result exceedsthe calibration range. Up to now,the software changed the injectionvolume and the dilution factor forthis purpose. In some applica-tions, it is useful to change thedilution factor only by keepingthe same injection volume.
26 SHIMADZU NEWS 1/2015
More freedom of choiceNew features in TOC-Control L software
Figure 1: Peak profile of IC measurement for sample A Figure 2: Peak profile NPOC and IC measurement for sample A in case of NPOC-IC type
Figure 4: Validation setting dialog for TOC-L
Figure 3: Validation setting dialogue for SSM-5000A

F or Shimadzu and its employ-ees, social and non-profitcommitment is day-to-day
reality. Fellow citizens as well asthe environment take center stagein this corporate-citizen-engage-ment. Shimadzu has launched var-ious projects in which employeescan become socially involved,such as the annual ‘Social Day’ inDuisburg, or the ‘Wish Tree’ inwhich employees fulfill children’sChristmas wishes.
In 2013, the first ‘Social Day’ wasorganized and tackled enthusiasti-cally by 25 employees. Within thescope of Germany’s national ‘Mal -tese Social Day’ the Maltese Foun -dation had recommended to helpout in Duisburg’s kindergarden‘The little Rascals.’ In cooperationwith the directors of ShimadzuEuropa and Shimadzu Deutsch -land, Jürgen Kwass and JürgenSemmler, walls were painted, toys
wishes, which are then being ful-filled by Shimadzu employees. In2012 and 2013, close to 70 chil-dren and adolescents receivedChristmas gifts this way.
During Christmas 2014, Shimadzuwas committed again – and be -cause of the current political situ-ation the event took place thistime at the refugees’ home inDuisburg-Baerl. 63 children couldlook forward to receiving a Christ -mas present from Shimadzu em -ployees, who in turn received thegreatest gift themselves – sparklesin kids’ eyes.
Duisburg animal shelter. Variousteams undertook various tasks forwhich there is often no time indaily operation of the shelter. “Werenovated and freshly painted thedog pool, built a wooden house,felled a tree and even baked dogbiscuits”, said Jennifer Libuda. “A little tired, but very proud, atthe end of the day we could lookback to many accomplished proj-ects.”
During advent time – ‘Wish Tree’ for children
Since 2012, Shimadzu’s employeesalso volunteer with pre-Christmassocial events: a ‘Wish Tree’ real-ized in cooperation with the So -cial Welfare Organization Diako -niewerk Duisburg. Children fromsocially disadvantaged familiesthat are being looked after in daycare groups at the Diakoniewerkmay write down their Christmas
were repaired and garden plotswere planted.
Identifying with communitiesand regions
“As an established Duisburg-based company, Shimadzu isclosely connected with the cityand the region. The same is truefor our technical offices and theirrespective locations in Germany”explains Jürgen Semmler. “As partof the increased awareness for sus-tainable development of our socie-ty and businesses, Shimadzu hasbecome involved as a responsiblecompany. Therefore, our ‘SocialDay’ is a yearly contribution inwhich we, together with ouremployees, commit ourselves tosocial projects in our region.”
After the successful start last year,volunteers were easily found inSeptember 2014 to help out at the
Sparkles in kids’ eyesShimadzu employees are socially engaged
27SHIMADZU NEWS 1/2015
LATEST NEWS
For more about
Shimadzu’s social
commitment see
www.shimadzu.eu/shimadzu-news-2015

APPLICATION
Modern electronic productsmust meet a variety ofcharacteristics. They are
expected to perform better thantheir predecessor generations, butthey should also be lighter, smalleror more robust. They must be ableto withstand environmental influ-ences such as temperature or hu -
3198-7 (2003) [5] explicitly allowsthe use of a universal testing ma -chine. The speed range for testingspecified in the Japanese JIS Z3198-7 is between 5 mm/min and30 mm/min. The implementationof the normative standards forcarrying out shear tests usingShimadzu’s AG-X universal test-ing machine with the 90° sheartest kit is described below.
due to thermo-mechanical stresscan be identified this way. Theshear force is the measured quan-tity, which decreases with increas-ing degradation of the solder joint[3].
The tests are normally carried outwith a small set of different mate-rials prior to the start of produc-tion within the scope of productqualification. As a rule, these in -clude various solder pastes thatare necessary for the connectionbetween substrate and componentand various printed circuit boardmetallizations. These tests mustalso be performed when the solderpaste is changed, for instance dur-ing an ongoing production pro -cess. The shear forces can be de -termined on real components, forinstance on circuit boards of amobile phone, or on a test assem-bly. Due to statistical fluctuationsof individual component failure itis advantageous to carry out thetests with a sufficient number ofidentical components [3]. As theseare usually not available in largenumbers, a test assembly is to bepreferred.
The underlying DIN EN 62137-1-2 norm states that the measuringdevice for carrying out the sheartest merely must “include a mech-anism for mounting the substrates...” and “can exert a shear forcethat is greater than the strength ofthe soldering connection ...” Therecommended feed rates in DINEN 62137-1-2 are between 0.5 mm/min and 9 mm/min.
Universal testing machine for shear tests
In addition to the specializedshear test devices available on themarket it is, consequently, alsopossible to use a universal testingmachine for carrying out sheartests. The Japanese norm JIS Z
midity, and should endure mechan -ical stresses such as vibration ormechanical shocks – all this com-bined with an environmentallyfriendly manufacturing processand lower production costs.
A decisive factor for the reliabilityof an electronic product is the sol-der joint [1]. When it fails, theelectronic product also fails [2].
Shear force test as classicaltesting method
Various tests are available to in -vestigate the reliability of solderjoints. As a conventional destruc-tive testing method, the shearforce test has become well estab-lished [3]. Changes in the solderjoint that can, for instance, occur
28 SHIMADZU NEWS 1/2015
Universal testing machine qualifieselectronic componentsStandardized shear force testing
A test board with M-MELF and1206 type components were usedas test objects applying a lead-freetin-silver-copper soldering pasteand a chemical-gold circuit boardmetallization, as well as a test cir-cuit board with SMD capacitors insizes 2512, and also a chemical-gold circuit board metallizationusing a tin-silver-copper solderingalloy. The individual componenttypes were each soldered in a rowonto the circuit board. This leads
Figure 1: Crack formation at a solder joint
due to thermo-mechanical stress (transverse
metallographic section)
Figure 2: AG-X shear test assembly with (1) = shearing chisel and (2) = M MELF type
components (3) = 1206 type components
Figure 3: Schematic of the shear test
geometry.

29SHIMADZU NEWS 1/2015
APPLICATION
figure 5, component a and compo-nent b).
Conclusion
After carrying out several hundredshear tests according to the meth -od described, it can be concludedthat shear tests can be performedaccording to the relevant standardsusing a universal testing machine.A comparison of the determinedshear forces with the shear forcesdocumented in the literature [6]shows a similar dispersion of themeasurement results.
To determine the influence of sol-dering defects, such as porositieson the shear forces and their dis-persion, it is possible to first ex -amine the samples using a non-destructive method, for instance2D X-ray testing or computer-assisted tomography and to classi-fy them according to their propor-tion of porosities [7].
Due to the typical features of theuniversal testing machine, it is alsopossible to carry out cyclic testson SMD components withoutshearing, using custom-madeshearing chisels. The first of suchtests carried out have been promis-ing so far.
AcknowledgementAchaffenburg University of Applied Sciences
thanks Shimadzu for its professional support
and collaboration as well as for supporting
our teaching and research activities.
activated in the measuring meth -od.
After the start of the measurementand the automatic sample fracturerecognition, the sheared compo-nent is removed from the shearingchisel using tweezers. The shear-ing chisel is subsequently movedup to the next component via man -ual control of the tensile strengthtesting machine and a further mea -surement is started.
For evaluation, the maximumstrength is primarily of interest. In case of questionable fracturepatterns during optical inspection,the force-displacement diagram isused to detect possible non-uni-form shearing. This can occurwhen the shearing chisel has notsheared off the component hori-zontally, but due to displacementof the component only one side ofthe component has initially beensheared off. Such shear patternscan be clearly recognized in theforce-displacement diagram. Viathe overlay function of the Tra -pezium-X software, it is possibleto display several measuringcurves superimposed in one dia-gram (Figure 4). This way, it ispossible to evaluate the quality ofseveral solder joints at a glance.
After shearing, the remaining re -sidual solder joints are examinedunder a microscope and classifiedaccording to their fracture mode(Figure 5). In the current examplefractures only occurred along thesolder/component interface anddiagonally across the solder (see
to more economical testing proce-dures, as the circuit board doesnot need to be readjusted prior toeach measurement.
Implementing the shear tests
The circuit board is mounted onthe breadboard of the shear testkit with slotted clamping platesand positioned via micrometerscrews (Figure 2). It has been prov -en advantageous to drive the shear -ing chisel up to the point where itcontacts the circuit board. Thispoint can be easily recognized onthe micrometer screws, as thesewill no longer indicate any dis-tinct change in length.
Subsequently, the shearing chiselis adjusted to the desired compo-nent distance h via the micrometerscrews (see figure 3). A value of0.1 mm has been found suitable.According to DIN 62137 theshearing height, which is the dis-tance of the circuit board to theshearing chisel, should not begreater than ¼ of the componentheight. During the shear test, onehas to make sure that the shearingchisel does not rub against the sol-der pad of the circuit board oragainst the solder deposit.
A stainless steel chisel was cus-tom-made for each componentwidth, which can be screwed ontothe standard mount of the sheartest kit of the tensile strength test-ing machine, was used as shearingchisel. The shear rate was set to 5 mm/min and automatic recogni-tion of the sample fracture was
Stroke (mm)
Forc
e (N
)
0
20
40
60
80
100
120
140
160
180
200
0 0.05 0.1 0.15 0.2 0.25 0.3 0.35 0.4 0.45 0.5
Figure 5: Fracture modes (modified
according to [6])
Figure 4: Example of a shear force diagram for ten components of size 2512
AuthorProf. Dr. Michael Kaloudis
Aschaffenburg University of Applied Sciences,
laboratories for materials technology and
structural-design and connection technologies
References[1] Shnawah DA, Sabri MFM, Badruddin IA
(2012) A review on thermal cycling and
drop impact reliability of SAC solder joint
in portable electronic products.
Microelectronics Reliability.
Doi:10.1016/j.microrel.2011.07.093
[2] Suganuma K (2001) Advances in lead-free
electronics soldering. Current Opinion in
Solid State and Materials Science.
Doi:10.1016/S1359-0286(00)00036-X
[3] Dusek M (2002) Test methods for evaluat-
ing the reliability of PCB finishes using
lead-free alloys: A guide. MATC A 107.
National Physical Laboratory, Teddington
[4] DIN Deutsches Institut für Normung e.V.
Oberflächenmontage-Technik – Verfahren
zur Überprüfung von Umwelteinflüssen
und zur Prüfung der Haltbarkeit von
Oberflächen-Lötverbindungen Teil 1-2:
Scherfestigkeitsprüfungen. Beuth Verlag
(DIN EN 62137-2)
[5] Test methods for lead-free solders. JIS Z
3198-1 2003. Japanese Standards
Association, Tokyo, Japan
[6] Ahrens T, Andreae H, Schruttke W (2006)
RoHS-Handbuch für Hersteller und Zulie -
ferer: Praktische Umsetzungshilfen, alter-
native Materialien und innovative Verfah -
ren. Forum Verlag Herkert, Merching
[7] Rauer M, Volkert A, Schreck T, Härter S,
Kaloudis M (2014) Computed Tomography-
Based Analysis of Voids in SnBi57Ag1
Solder Joints and Their Influence on the
Reliability. J Fail. Anal. and Preven.
Doi:10.1007/s11668-014-9801-y

ppbppbppbppbppbppb
APPLICATION
G as chromatography is acommon technique in mon-itoring of complex gas sam-
ples emitting from exhaust, processsupervision or quality control ofgases. Detection limits in the ppbrange are often required so thatwithout extensive enrichment tech-nique, injection of a sample vol-ume of 500 - 1,000 μL requires avery sensitive detection system.Furthermore, gas samples normallyconsist of several components (e.g.permanent gases and hydrocar-bons), so a universal detection sys-tem is needed.
The Flame Ionization Detector(FID) is popular due to its excep-tional combination of sensitivity,reproducibility and long-term sta-bility. Unfortunately, the FID de -tection spectrum lacks permanentgases such as oxygen, nitrogen andcarbon dioxide. On the other hand,while Thermal Conductivity De -tectors (TCD) are universal detec-tors, they operate in the ppm de -tection range and are therefore notsensitive enough.
In gas chromatography, heliumionization technique has becomean interesting solution that allowsuniversal detection of all compo-nents with high sensitivity. Detec -tion limits in low ppb range are
from 3 to 5 ppm. The gas was sam-pled and injected by a 6 port 1/16”valco valve with sample loop of500 μL and equipped with heliumpurged rotor housing. The gassample was split 1:1 and injectedon a Restek Molsieve column RT-Msieve 5A 30 m ID 0.53 mm df 50 μm. Starting with the tempera-ture program at 0 °C, baseline sep-aration of argon and oxygen wasachieved with a chromatographicresolution of R > 1.65.
Detection and quantification limitsfor the components are shown intable 1 and are calculated on a sig-nal to noise ratio S/N = 3.3 for thedetection limits, and on S/N = 10for the quantification limits. Thereproducibility of the respectivecomponents over 5 measurementsranged from RSD = 1.1 - 1.5 %.
For baseline separation of argonand oxygen the temperature pro-
plasma generating electrodes areshielded from contamination bythe sample and effects from theplasma itself – one reason for thesuperior long-term stability of theBID detector. The light emittedfrom the helium plasma leads toionization of components elutingfrom the chromatographic column.Ions generated in this way are de -tected by special ‘kovar alloy’ col-lection electrodes which are anoth-er special development contribut-ing to the stability of BID.
Excellent trace capabilities
The quality control of high purityhelium is a good example showingthe trace capabilities of the BIDdetector. The chromatogram in fig-ure 2 shows the result of a stan-dard containing hydrogen, argon,oxygen, nitrogen, methane and car-bon monoxide in concentrations
achievable without any extensivesample enrichment techniques.However, easy operation and long-term stability of systems operatedin trace analysis is still challenging.
Unique plasma technology
Shimadzu’s new Barrier IonizationDischarge Detector (BID) com-bines high sensitivity of heliumionization technique with robust-ness and excellent long-term stabil-ity. The unique technology gener-ating the helium plasma allows de -tection of components with an ion-ization potential below 17.6 eV. In this way, the detector can see allcomponents except helium andneon.
The helium plasma generation isdone within a thin quartz glasstube, building a dielectric barrierbetween the electrodes and theplasma (Figure 1). In this way the
30 SHIMADZU NEWS 1/2015
High sensitivity meets robustnessGas measurements – Unique BID plasma technology for ppb detection limits
Figure 1: Cross-sectional drawing of a BID detector. Introduction of the discharge gas and
helium plasma generation takes place in the upper half of the detector, while detection of
the components eluting from the capillary column takes place in the lower half.
Table 1: Detection limits calculated on a signal to noise ratio S/N = 3.3 and quantification limits calculated on S/N = 10
Minutes
0
2,500
5,000
7,500
10,000
12,500
15,000
17,500
20,000
22,500
25,000
27,500
uV
1.0 2.0 3.0 4.0 5.0 6.0 7.0 8.0 11.09.0 10.0
123456
Peak#
1.5712.3432.4555.126.094
10.214
Retentiontime
HydrogenArgonOxygenNitrogenMethaneCarbon monoxide
Name
80993490527565317477712435627
Area
32271343310449110322398611464
Height S/N
63263205216470225
Detectionlimit
2594848662555
Quantitative limit
784146147199
77165
Unit
Figure 2: Standard chromatogram of permanent gases and hydrocarbons

31SHIMADZU NEWS 1/2015
APPLICATION
PRODUCTS
gram was started below room tem-perature, so active cryogenic cool-ing of the oven with liquid nitro-gen or carbon dioxide is required.Since the BID has almost equalresponse factors (peak area/con-centration) for argon and oxygen,this can be avoided if a sum con-centration for both componentswould be sufficient. The BID re -sponse for argon 9.11 area cts/ppbis very similar to oxygen 9.19 areacts/ppb, so the concentration errorevaluating both components assum peak would therefore be lessthan 1 %.
Figure 3 shows a chromatogram ofan unknown helium sample withpurity 6.0. The absence of nitrogenand oxygen in the chromatogramproves that the leak rate of the sys-
aldehydes or acids for which FIDis less sensitive. For permanentgases, the BID achieves 200 timesbetter detection limits comparedwith TCD detector, allowing traceanalysis in low ppb range. Becauseof its robustness and long-termstability the BID is the ideal solu-
tion for replacement of TCD andFID combination, which is oftenused for measurements of gaseoussamples containing permanentgases and hydrocarbons.
tem against ambient air was belowthe respective detection limits of 48and 66 ppb respectively. A smallconcentration of just 68 ppb meth -ane was measured in the high puri-ty helium.
Suitable for many applications
High sensitivity and robustnessmake the Barrier Ionization Dis -charge Detector (BID) an interest-ing solution for many applicationswhich would require two or moredetectors in order to achieve detec-tion limits in the ppb range. Basedon its sensitivity, it can replace aFID detector for analysis of hydro -carbons, thereby improving detec-tion limits by a factor of two ormore in the case of small alcohols,
Minutes
01,0002,0003,0004,0005,0006,000
uV
1.0 2.0 3.0 4.0 5.0 6.0 7.0 8.0 9.0 10.0 11.0 12.0
Figure 3: Sample from helium gas cylinder with purity 6.0
Performance meets design
T he EDX series provides out-standing performance: Faster,improved sensitivity, better
resolution and no need of liquidnitrogen - these are only a few newfeatures of Shimadzu’s next gener-ation of energy dispersive X-rayfluorescence spectrometer target-ing material and elemental analysis.
The new EDX-7000 and EDX-8000 inherit the superior featuresof the successful and establishedinstruments EDX-720 and EDX-800 and provide outstanding addi-tional functions, such as
• an energy resolution better than140 eV, reducing significantly theimpact of coexisting elements
• improved sensitivity whichmakes LLD’s much better
• higher speed providing the samequality of results in 1/10 of themeasurement time
• Due to the increased perform-ance and quality of SDD detec-tors in the recent past, Shimadzuimplemented high performanceSDD detectors in its new instru-
ment series allowing liquid nitro-gen free analysis.
The measurement range starts fromcarbon in case of the EDX-8000,respectively sodium in case of theEDX-7000. Both instrumentsdetermine element concentrationsup to Uranium. Collimators, cam-
era and filter are standard acces-sories. Turret, vacuum and heliumunit are optional accessories.
Like in the predecessor software,the users have full access to allfunctions of the software. They caneven create calibration curves ontheir own, no further costs arise.
Gold Award for the new EDX-7000/EDX-8000 spectrometer series
EDX-7000/EDX-8000
The instrument is delivered withtwo software packages: An easysoftware pack for regularly recur-ring tasks, and an advanced soft-ware pack for professional use.
Industrial Design Gold Award
The new EDX-7000/8000 energy-dispersive (ED) XRF spectrometerhas achieved the Gold Award inthe Analytical Instrument Indus -trial Design segment of the 2014IBO Industrial Design Awards.
It was donated for the system’sround front and streamlined pro-file that sets it apart from otherbenchtop ED-XRF systems, mak-ing the EDX-7000/8000 seriesapproachable and distinctive.

PRODUCTS
32
Laborama
March 19 - 20, 2015Brussels, Belgiumwww.expo.laborama.be
Anakon
March 23 - 27, 2015Graz, Austriawww.analytchem.tugraz.at/anakon2015/
Wasser Berlin InternationalMarch 24 - 27, 2015Berlin, Germanywww.wasser-berlin.de
Setac
May 3 - 7, 2015Barcelona, Spainwww.setac.org
Control
May 5 - 9, 2015Stuttgart, Germanywww.control-messe.de
If you would like to receive the Shimadzu News on a regular basis, please email us your postal address via: [email protected]
You can also subscribe to our newsletter via: www.shimadzu.eu/newsletter
Shimadzu live
Extended analysis possibilities
W ith the new UV-3600 Plus,Shimadzu has extendedits successful UV-VIS-
NIR family. The innovation ofworking with three detectors(PMT [photomultiplier] InGaAs[indium-gallium-arsenide] andPbS cell [lead sulfide]) in the pre-vious UV-3600 model is beingcontinued with additional newaccessories.
The MPC-603 (Multi PurposeSample Compartment) with built-in integrating sphere and ISR-603(Integrating Sphere Attachment)complement the UV-3600 Plusmarket introduction. In additionto conventional measurements ofdiffuse and specular reflectance, itis now also possible to carry outabsolute reflectance measure-ments with three detectors in theUV-3600 Plus.
The sample compartment of theUV-3600 Plus is designed in sucha way that on the one hand thePMT is switched off when thesample compartment is open,while also being able to imple-ment accessories connections inthe sample compartment. Thenew integrating spheres areequipped with suitable acces-
sories, allowing measurement ofliquids and solids as well as mea -surement of films.
The most important new features at a glance:
• ISR-603Cell, powder and film holdersare standard equipment for the60 mm ISR-603 BaSO4 (bariumsulfate) integrating sphere. Thesphere is equipped with threedetectors. The ISR-603 meas-ures diffuse reflectance andtotal reflectance of liquids andsolids. Incidence angles of 0 °Cand 8 °C can be realized.
• MPC-603The sample compartment forlarge samples is equipped witha 60 mm BaSO4 integratingsphere. Transmittance as well asreflectance measurements canbe carried out. Radiation inci-dence angles of 0 °C and 8 °Conto the sample can be real-ized. The sample table can befreely adjusted in the xyz direc-tion. It is equipped with a V-stage for non-planar samplesthat is suitable, for instance, forbottles or large objectives. TheMPC-603 can be extended to
ital data management versions.The LabSolutions platform workswith databases of different levelsand integrates a wide selection ofinstruments, for example chro-matography or spectroscopy sys-tems.
Using the LabSolutions connec-tion kit for the UVProbe soft-ware, the file version of theUVProbe is converted into adatabase control component thatmeets all demands associatedwith a protected database, suchas user level or testing criteria,which are required by pharma-ceutical industry regulatory pro-cedures.
UV-3600 Plus
achieve absolute reflectancemeasurements for incidence an -gles of 5°, 12°, 30° and 45°. Itcontains three detectors formeasuring the UV-VIS-NIRradiation.
UVProbe 2.50 with connectionto the LabSolutions platform
The new UVProbe 2.50 softwareversion can be integrated in thedatabase, and can also be inte-grated as a client-server versionin the LabSolutions server plat-form. This way, the applicationrange is extended from simple filemanagement using WindowsExplorer into two additional dig-
Special accessories for the UV-3600 Plus
Registration Newsletter