the scripted truth about cnms · – cnms stream centerlines • challenges – intense data...
TRANSCRIPT

Bradford Hartley Jr. GISP, CFM7/26/2012
2012 ESRI User Conference
The Scripted Truth about CNMS

FEMA’s Risk MAP Program(Mapping, Assessment, Planning)
• The vision for Risk MAP is to deliver quality data that increases public awareness and leads to action that reduces risk to life and property.
• Risk MAP Program Metrics:1. Deployment2. Quality (CNMS)3. Risk Awareness4. Community Action
• FEMA Partners:– Cooperating Technical Partner (CTP)– Production and Technical Services (PTS)

What is CNMS• CNMS – Coordinated Needs Management Strategy
– A GIS file database that supports:• Locations of Special Flood Hazard Areas (SFHA) for
studied streams using stream centerlines• Basic model information
– Type of model, age of model, etc.• Needs
– Model based SFHAs with documented quality issues.• Requests
– Areas of SFHA lacking a model – Cartographic issue areas
• Reporting / Exporting– NVUE – New, Validated or Updated Engineering (i.e.
quality)• Decision Making / Prioritization
– Where are studies valid or Unverified? Where is attention needed?

Still Confused?
• Goal:– Produce a National inventory database of flooding sources that:
• Tracks program status on NVUE• Informs map planning production decisions - References mapped
flooding sources as valid or as having an unmet need• Serve as FEMA’s mapping needs management system• Document accomplishments - Resolution date of existing
mapping needs will be captured
• CNMS Website• http://cnms.riskmapcds.com• National Inventory of CNMS data updated
quarterly
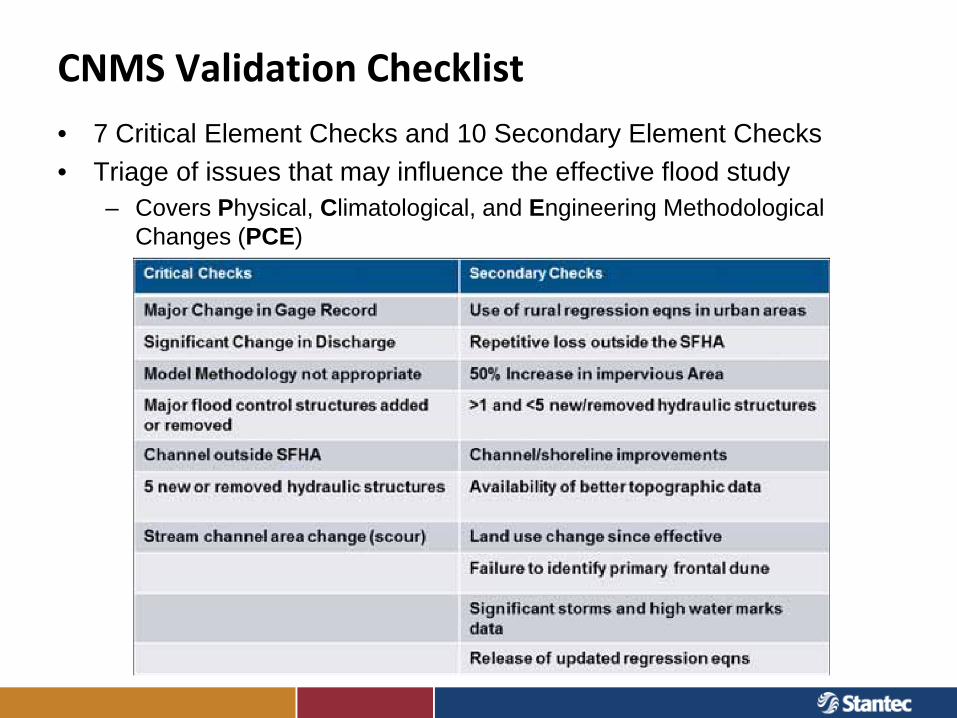
CNMS Validation Checklist
• 7 Critical Element Checks and 10 Secondary Element Checks• Triage of issues that may influence the effective flood study
– Covers Physical, Climatological, and Engineering Methodological Changes (PCE)

Region V CNMS Project Details
• The 411:– Project area includes 6 States (IN, IL, MI, MN, OH, WI)– Build a database for all mapped Special Flood Hazard Areas
within Region V (est. 123,000 Miles)– Assign each stream specific attributes (Zone Type, Model
Type, Year of the Study, etc.)– Implement ArcSDE– Perform stream validation (17 Checks)– CNMS is a “living” database

In-House File Geodatabase Enhancements
• 17 Checks added to stream centerlines– Formally in S_Studies_Ar
• Added comment fields• Added tables and feature classes
– Aided in data collection and tool utilization
• Added relationships• Built in automated QC Tools

Automated Tool #1 (a.k.a….C1C2 Tool)
• Tool Inputs– USGS Gages shapefile (Modified)– CNMS stream centerlines– Gage table– Peak FQ or HEC-SSP results
• Challenges– Data extraction– Locating gages
• End Result– Use recorded historical flow data to verify the accuracy of the
flow rates used in the hydrology analysis of the effective study. Recorded historical flow data is compared to any newly recorded data to show a change in flow pattern for the specific study extent.
Major change in gage record since effective analysis that includes major flood events

Model Builder ScriptVerify Gage Data
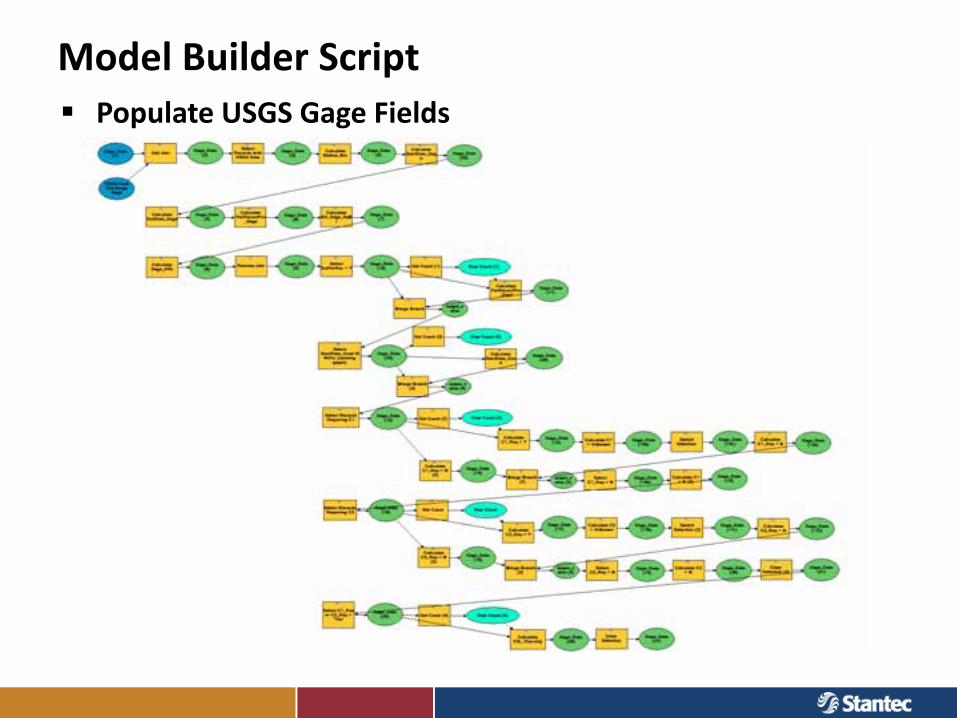
Model Builder ScriptPopulate USGS Gage Fields

Model Builder ScriptPopulate C1

Model Builder ScriptPopulate C2

Automated Tool #2 (a.k.a….C4 Tool)
• Tool Inputs– National Inventory of dams shapefile– National Hydrology Data (NHD) High Resolution – USGS Watershed Boundary shapefile (HUC12)– CNMS stream centerlines
• Challenges– Finding the most down stream point– Identifying the correct drainage area– Unknown dam construction/modified date
• End Result– Each study drainage area is traced upstream to identify the
studies watershed. All newly regulated drainage area (dams with construction/modification date after the study date) is calculated to see if the sum is greater or less than 30% of the study's drainage area.
Addition/removal of a major flood control structure

Model Builder ScriptExport HUCs

Model Builder ScriptsIdentify Small Tributaries
Sum Drainage Area
Transfer Attributes

Automated Tool #3 (a.k.a….S137 Tool)
• Tool Inputs– National Urban Change Indicator (NUCI) raster dataset– USGS National Land Cover Dataset (NLCD)– USGS Watershed Boundary shapefile (HUC12)– National Hydrology Data (NHD) High Resolution – CNMS stream centerlines
• Challenges– Intense data processing– Identifying only Urban Change pixels
• End Result– Three checks are completed simultaneously through one scripted
tool. S1 looks at the type of regression equation used in the stream’s study. S3 analyzes the change in impervious area over time in a stream’s watershed. S7 focuses on how land use in the watershed has changed.
Use of rural regression equations in urbanized areas, where an increase in impervious area in the sub‐basin is more than 50%. (e.g. changes to vegetation or land use)

Python ScriptTool 1 ‐ develops a table that lists urban/impervious area for every HUC‐12 area within the range of dates in the NUCI and NLCD datasetsTool 2 ‐ evaluates and populates S1, S3, and S7 checks for specified stream lines in the database

Q and A
• Questions? Comments? Concerns?

Bradford Hartley Jr.
Stantec Consulting135 South LaSalle Street Suite 3100
Chicago, Illinois [email protected]
Phone: 312-262-2282
Thank You