the scottmadden energy industry update – winter 2015
TRANSCRIPT

Winter 2015
ENERGY
CHANGES: TURN AND FACE THE STRANGE
The ScottMadden
INDUSTRYUPDATE
TABLE OF CONTENTS
About Our Energy Practice
32Recent ScottMadden Insights
33
Executive Summary 4
Mergers, Acquisitions, and Corporate Restructurings: Changing Owners and Form 5-7
View from the Executive Suite
Energy Storage: Installations on the Rise 9
Electric Vehicles: Sales Trends and Business Models 10-12
Decentralized Generation: Solar in a Narrow Lead 13
Natural Gas Markets: Latest Developments 14-16
Energy Supply, Demand, and Markets
Renewable Energy Tariffs: Utilities Explore Alternative Rate Structures 18
EPA Finalizes Coal Combustion Residuals Rule 19
Rates and Regulatory Developments
SEPA/ScottMadden Mission to Germany: Facts Found and Lessons Learned 21-24
Clean Power Plan: Latest Developments 25-26
Clean Tech and Environment
Evolving Utility Business Models: Differing Regulatory and Incentive Constructs Matter 28
Levelized Cost of Energy: The Trends, the Debate, and the Outcome 29-31
Managing the Utility Enterprise

VIEW FROM THE EXECUTIVE SUITE
The ScottMadden Energy Industry Update
4
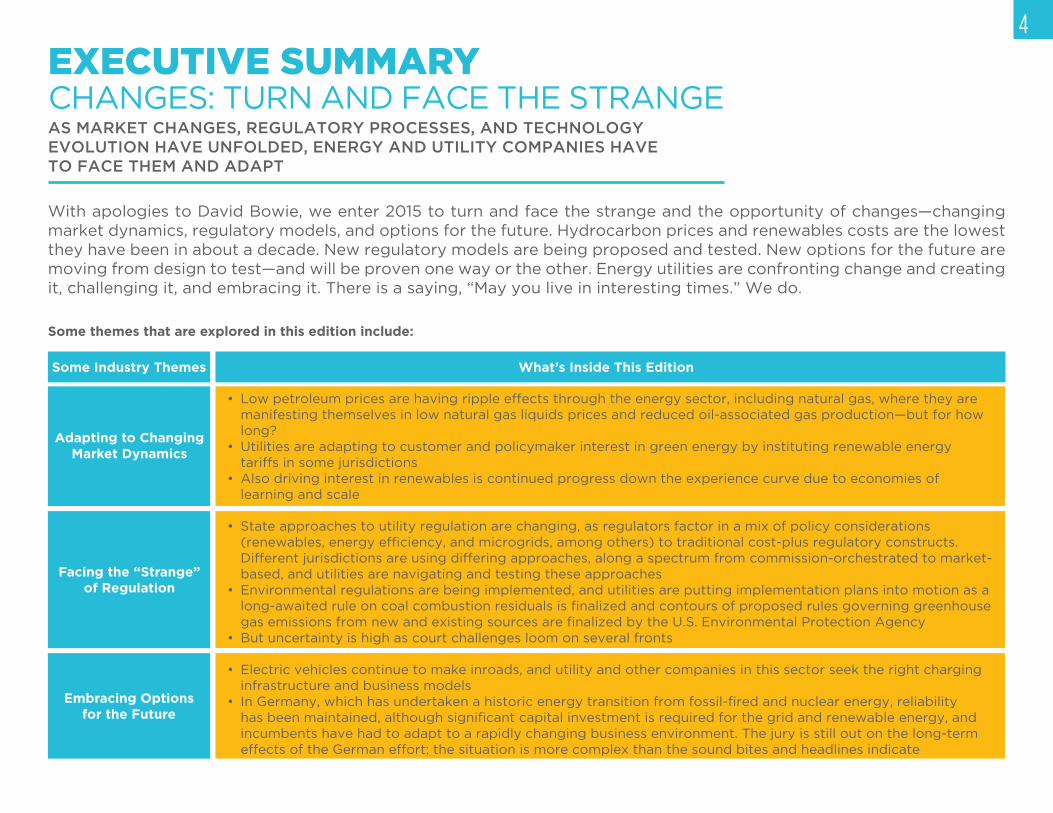
EXECUTIVE SUMMARYCHANGES: TURN AND FACE THE STRANGEAS MARKET CHANGES, REGULATORY PROCESSES, AND TECHNOLOGY EVOLUTION HAVE UNFOLDED, ENERGY AND UTILITY COMPANIES HAVE TO FACE THEM AND ADAPT
With apologies to David Bowie, we enter 2015 to turn and face the strange and the opportunity of changes—changing
market dynamics, regulatory models, and options for the future. Hydrocarbon prices and renewables costs are the lowest
they have been in about a decade. New regulatory models are being proposed and tested. New options for the future are
moving from design to test—and will be proven one way or the other. Energy utilities are confronting change and creating
it, challenging it, and embracing it. There is a saying, “May you live in interesting times.” We do.
Facing the “Strange” of Regulation
Embracing Options for the Future
Some Industry Themes
Adapting to Changing Market Dynamics
What’s Inside This Edition
• Low petroleum prices are having ripple effects through the energy sector, including natural gas, where they are
manifesting themselves in low natural gas liquids prices and reduced oil-associated gas production—but for how
long?
• Utilities are adapting to customer and policymaker interest in green energy by instituting renewable energy
tariffs in some jurisdictions
• Also driving interest in renewables is continued progress down the experience curve due to economies of
learning and scale
• State approaches to utility regulation are changing, as regulators factor in a mix of policy considerations
(renewables, energy efficiency, and microgrids, among others) to traditional cost-plus regulatory constructs. Different jurisdictions are using differing approaches, along a spectrum from commission-orchestrated to market-
based, and utilities are navigating and testing these approaches
• Environmental regulations are being implemented, and utilities are putting implementation plans into motion as a
long-awaited rule on coal combustion residuals is finalized and contours of proposed rules governing greenhouse gas emissions from new and existing sources are finalized by the U.S. Environmental Protection Agency
• But uncertainty is high as court challenges loom on several fronts
• Electric vehicles continue to make inroads, and utility and other companies in this sector seek the right charging
infrastructure and business models
• In Germany, which has undertaken a historic energy transition from fossil-fired and nuclear energy, reliability has been maintained, although significant capital investment is required for the grid and renewable energy, and incumbents have had to adapt to a rapidly changing business environment. The jury is still out on the long-term
effects of the German effort; the situation is more complex than the sound bites and headlines indicate
Some themes that are explored in this edition include:
SEPT NOVOCT DEC
5
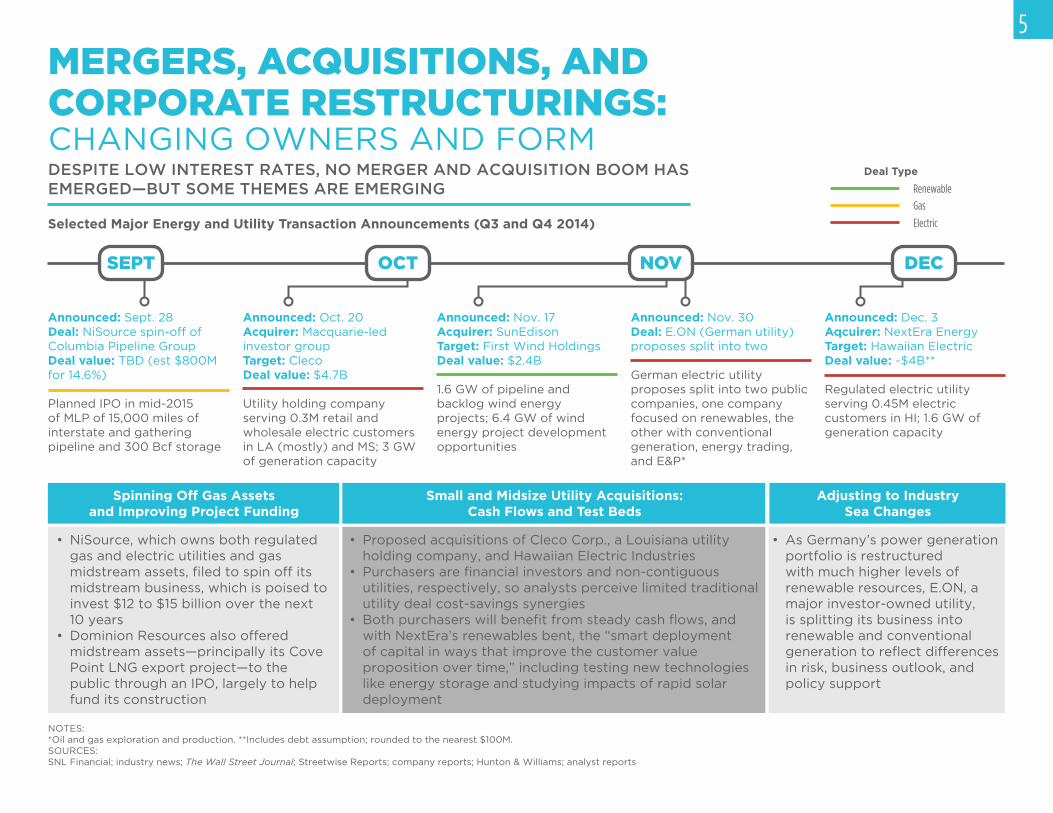
MERGERS, ACQUISITIONS, AND CORPORATE RESTRUCTURINGS: CHANGING OWNERS AND FORMDESPITE LOW INTEREST RATES, NO MERGER AND ACQUISITION BOOM HAS EMERGED—BUT SOME THEMES ARE EMERGING
Selected Major Energy and Utility Transaction Announcements (Q3 and Q4 2014)
Deal Type
Renewable
Gas
Electric
Announced: Sept. 28Deal: NiSource spin-off of Columbia Pipeline GroupDeal value: TBD (est $800M for 14.6%)
Planned IPO in mid-2015 of MLP of 15,000 miles of interstate and gathering pipeline and 300 Bcf storage
Announced: Nov. 17Acquirer: SunEdisonTarget: First Wind HoldingsDeal value: $2.4B
1.6 GW of pipeline and backlog wind energy projects; 6.4 GW of wind energy project development opportunities
Announced: Oct. 20Acquirer: Macquarie-led investor groupTarget: ClecoDeal value: $4.7B
Utility holding company serving 0.3M retail and wholesale electric customers in LA (mostly) and MS; 3 GW of generation capacity
Announced: Nov. 30Deal: E.ON (German utility) proposes split into two
German electric utility proposes split into two public companies, one company focused on renewables, the other with conventional generation, energy trading, and E&P*
Announced: Dec. 3Aqcuirer: NextEra EnergyTarget: Hawaiian ElectricDeal value: ~$4B**
Regulated electric utility serving 0.45M electric customers in HI; 1.6 GW of generation capacity
NOTES: *Oil and gas exploration and production. **Includes debt assumption; rounded to the nearest $100M.SOURCES:SNL Financial; industry news; The Wall Street Journal; Streetwise Reports; company reports; Hunton & Williams; analyst reports
Spinning Off Gas Assets and Improving Project Funding
• NiSource, which owns both regulated gas and electric utilities and gas midstream assets, filed to spin off its midstream business, which is poised to invest $12 to $15 billion over the next 10 years
• Dominion Resources also offered midstream assets—principally its Cove Point LNG export project—to the public through an IPO, largely to help fund its construction
• Proposed acquisitions of Cleco Corp., a Louisiana utility holding company, and Hawaiian Electric Industries
• Purchasers are financial investors and non-contiguous utilities, respectively, so analysts perceive limited traditional utility deal cost-savings synergies
• Both purchasers will benefit from steady cash flows, and with NextEra’s renewables bent, the “smart deployment of capital in ways that improve the customer value proposition over time,” including testing new technologies like energy storage and studying impacts of rapid solar deployment
• As Germany’s power generation portfolio is restructured with much higher levels of renewable resources, E.ON, a major investor-owned utility, is splitting its business into renewable and conventional generation to reflect differences in risk, business outlook, and policy support
Small and Midsize Utility Acquisitions: Cash Flows and Test Beds
Adjusting to Industry Sea Changes
WTI Spot Crude Oil
Henry Hub Spot Gas
SNL MLP Index
Legend
Nov. 2014Dec. 201350%
100%
150%
200%
250%
Oct. 2013
6MERGERS, ACQUISITIONS, AND CORPORATE RESTRUCTURINGS: CHANGING OWNERS AND FORM
SOURCES:Industry news; SNL Financial; company reports; ScottMadden analysis
• In August 2014, Kinder Morgan Inc. (KMI) announced its plans to acquire all the outstanding equity securities of Kinder Morgan Management LLC and MLPs Kinder Morgan Energy Partners and El Paso Pipeline Partners
• The deal, valued at $75.6 billion, was finalized on November 26, 2014, reorganizing as a C-corporation
UNWINDING KMI—THE MASTER LIMITED PARTNERSHIP (MLP)
• The rationale for the “reverse MLP” was that traditional tax, cash flow, and dividend benefits were overshadowed by high incentive distribution rights payments and organizational unwieldiness
• According to one analyst: KMI “breaks the link to the MLP model, where quarterly distribution increases are the norm, providing eventual headroom to walk dividend growth down as the business matures and growth opportunities slow next decade”
• Interestingly, as a C-corporation, KMI’s borrowing costs were lower than as an MLP• Others potentially in a similar position as KMI include ONEOK and Williams
TOO BIG AND OLD TO MLP?
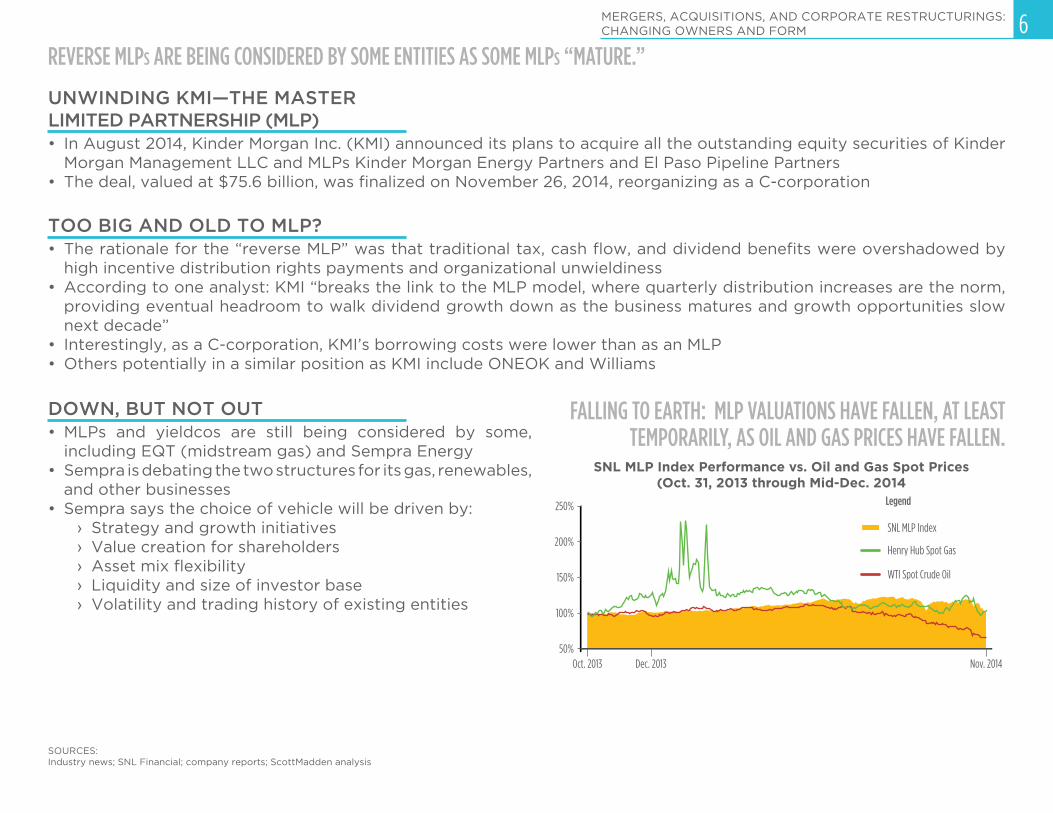
• MLPs and yieldcos are still being considered by some, including EQT (midstream gas) and Sempra Energy
• Sempra is debating the two structures for its gas, renewables, and other businesses
• Sempra says the choice of vehicle will be driven by:› Strategy and growth initiatives› Value creation for shareholders› Asset mix flexibility› Liquidity and size of investor base› Volatility and trading history of existing entities
DOWN, BUT NOT OUT
SNL MLP Index Performance vs. Oil and Gas Spot Prices(Oct. 31, 2013 through Mid-Dec. 2014
FALLING TO EARTH: MLP VALUATIONS HAVE FALLEN, AT LEAST TEMPORARILY, AS OIL AND GAS PRICES HAVE FALLEN.
REVERSE MLPS ARE BEING CONSIDERED BY SOME ENTITIES AS SOME MLPS “MATURE.”
Load-Serving Utility (e.g., IOU) PUC-Approved
Contract
PUC-Regulated Operating Company
Load-Serving Utility (e.g., IOU)
Lease Agreements
Revenue Requirement
Rent Payments
7
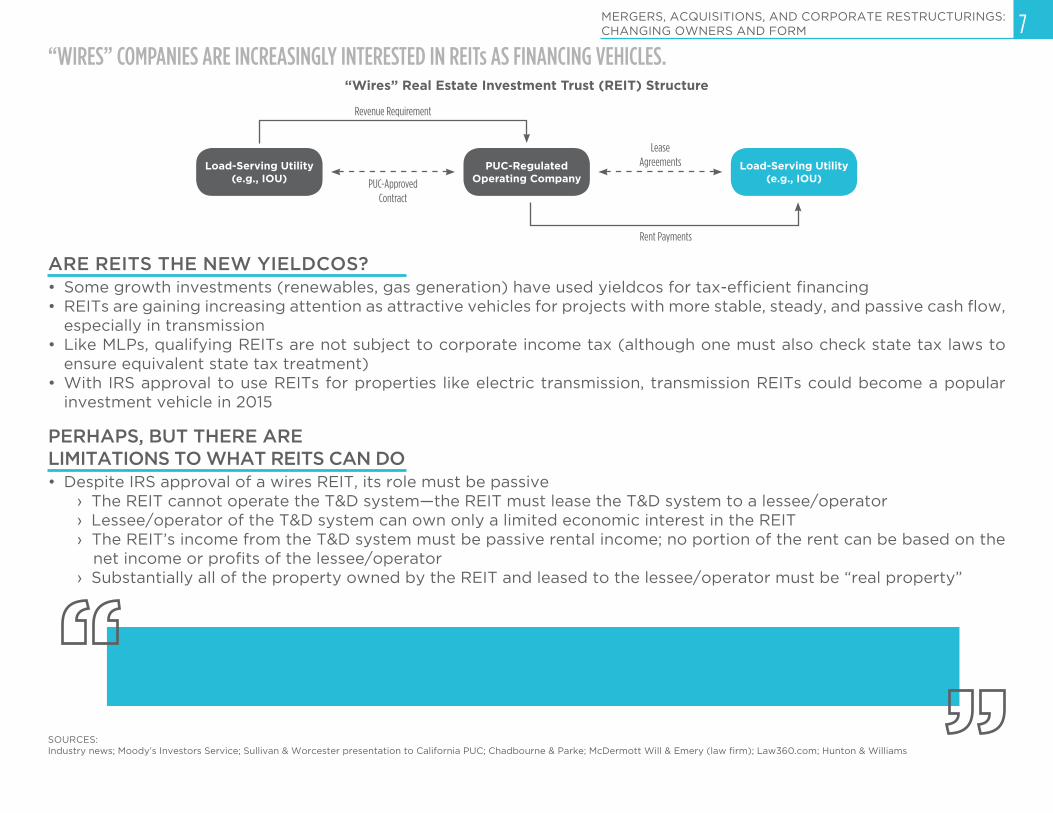
• Some growth investments (renewables, gas generation) have used yieldcos for tax-efficient financing• REITs are gaining increasing attention as attractive vehicles for projects with more stable, steady, and passive cash flow,
especially in transmission• Like MLPs, qualifying REITs are not subject to corporate income tax (although one must also check state tax laws to
ensure equivalent state tax treatment)• With IRS approval to use REITs for properties like electric transmission, transmission REITs could become a popular
investment vehicle in 2015
ARE REITS THE NEW YIELDCOS?
• Despite IRS approval of a wires REIT, its role must be passive› The REIT cannot operate the T&D system—the REIT must lease the T&D system to a lessee/operator› Lessee/operator of the T&D system can own only a limited economic interest in the REIT› The REIT’s income from the T&D system must be passive rental income; no portion of the rent can be based on the
net income or profits of the lessee/operator› Substantially all of the property owned by the REIT and leased to the lessee/operator must be “real property”
PERHAPS, BUT THERE ARE LIMITATIONS TO WHAT REITS CAN DO
SOURCES:Industry news; Moody’s Investors Service; Sullivan & Worcester presentation to California PUC; Chadbourne & Parke; McDermott Will & Emery (law firm); Law360.com; Hunton & Williams
“Wires” Real Estate Investment Trust (REIT) Structure
MERGERS, ACQUISITIONS, AND CORPORATE RESTRUCTURINGS: CHANGING OWNERS AND FORM
“WIRES” COMPANIES ARE INCREASINGLY INTERESTED IN REITs AS FINANCING VEHICLES.
An electric transmission and distribution system—from the busbar through and including the meters—qualifies as real property since it is “an inherently permanent structure that is not an accessory to the operation of a business” and “the system is a passive conduit that allows electricity created by a generation source to flow through the system to end-users.”
–Sharyland Utilities IRS Private Letter Ruling (2007)

ENERGY SUPPLY, DEMAND, AND MARKETS
The ScottMadden Energy Industry Update
UTTXCA
AB (CA)AL
WVPAILHI
OHNYVT
MAAKNMMN
0 20 40 60 80 100 120 140 160 1,000 1,200800
63.5110.0
150.0150.0
939.41,200.0
60.032.4
31.520.020.0
4.03.03.0
1.81.0
9
ENERGY STORAGE: INSTALLATIONS ON THE RISE
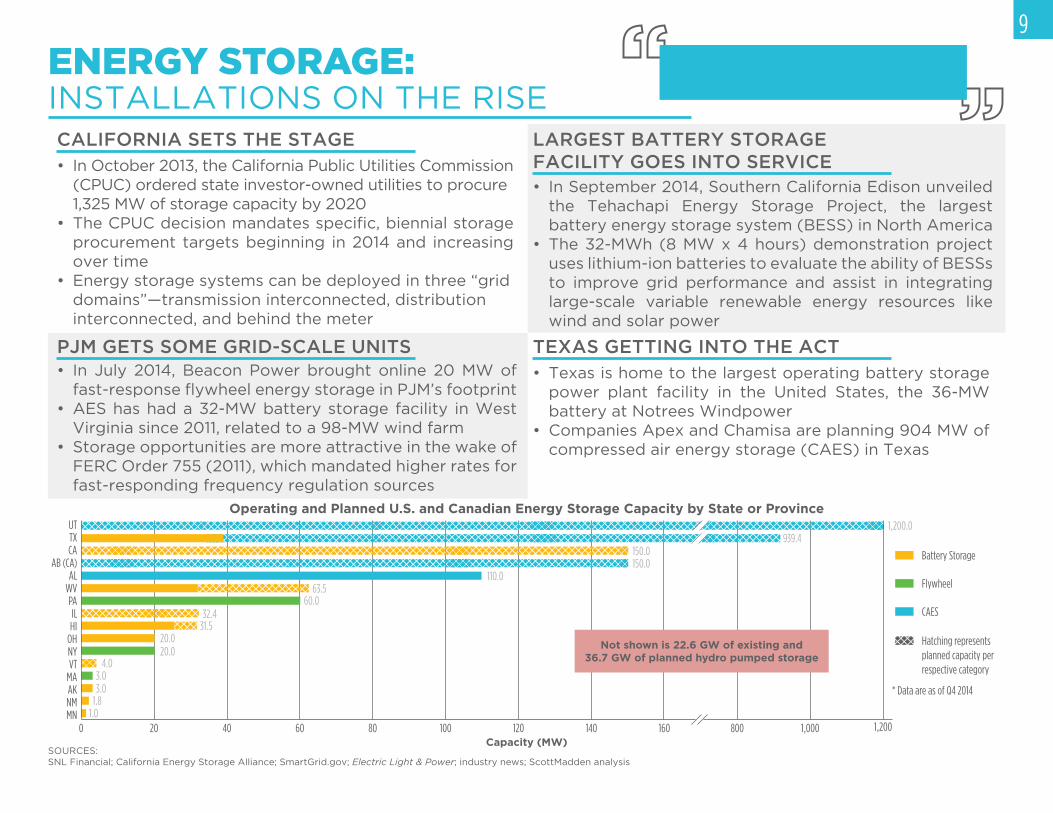
• In October 2013, the California Public Utilities Commission (CPUC) ordered state investor-owned utilities to procure 1,325 MW of storage capacity by 2020
• The CPUC decision mandates specific, biennial storage procurement targets beginning in 2014 and increasing over time
• Energy storage systems can be deployed in three “grid domains”—transmission interconnected, distribution interconnected, and behind the meter
CALIFORNIA SETS THE STAGE
• Texas is home to the largest operating battery storage power plant facility in the United States, the 36-MW battery at Notrees Windpower
• Companies Apex and Chamisa are planning 904 MW of compressed air energy storage (CAES) in Texas
TEXAS GETTING INTO THE ACT
• In September 2014, Southern California Edison unveiled the Tehachapi Energy Storage Project, the largest battery energy storage system (BESS) in North America
• The 32-MWh (8 MW x 4 hours) demonstration project uses lithium-ion batteries to evaluate the ability of BESSs to improve grid performance and assist in integrating large-scale variable renewable energy resources like wind and solar power
LARGEST BATTERY STORAGE FACILITY GOES INTO SERVICE
• In July 2014, Beacon Power brought online 20 MW of fast-response flywheel energy storage in PJM’s footprint
• AES has had a 32-MW battery storage facility in West Virginia since 2011, related to a 98-MW wind farm
• Storage opportunities are more attractive in the wake of FERC Order 755 (2011), which mandated higher rates for fast-responding frequency regulation sources
PJM GETS SOME GRID-SCALE UNITS
Wind and solar power’s mismatch with system peaks, together with declining solar costs, have created
interest in storage in tandem with renewables.
SOURCES:SNL Financial; California Energy Storage Alliance; SmartGrid.gov; Electric Light & Power; industry news; ScottMadden analysis
Capacity (MW)
Operating and Planned U.S. and Canadian Energy Storage Capacity by State or Province
Flywheel
Battery Storage
CAES
Hatching represents planned capacity per respective category
Not shown is 22.6 GW of existing and 36.7 GW of planned hydro pumped storage
* Data are as of Q4 2014
Less than 1
More than 31 to 2
2 to 32011 201420132012
= 10,000 cars
6,700
7,700
8,700
2,800
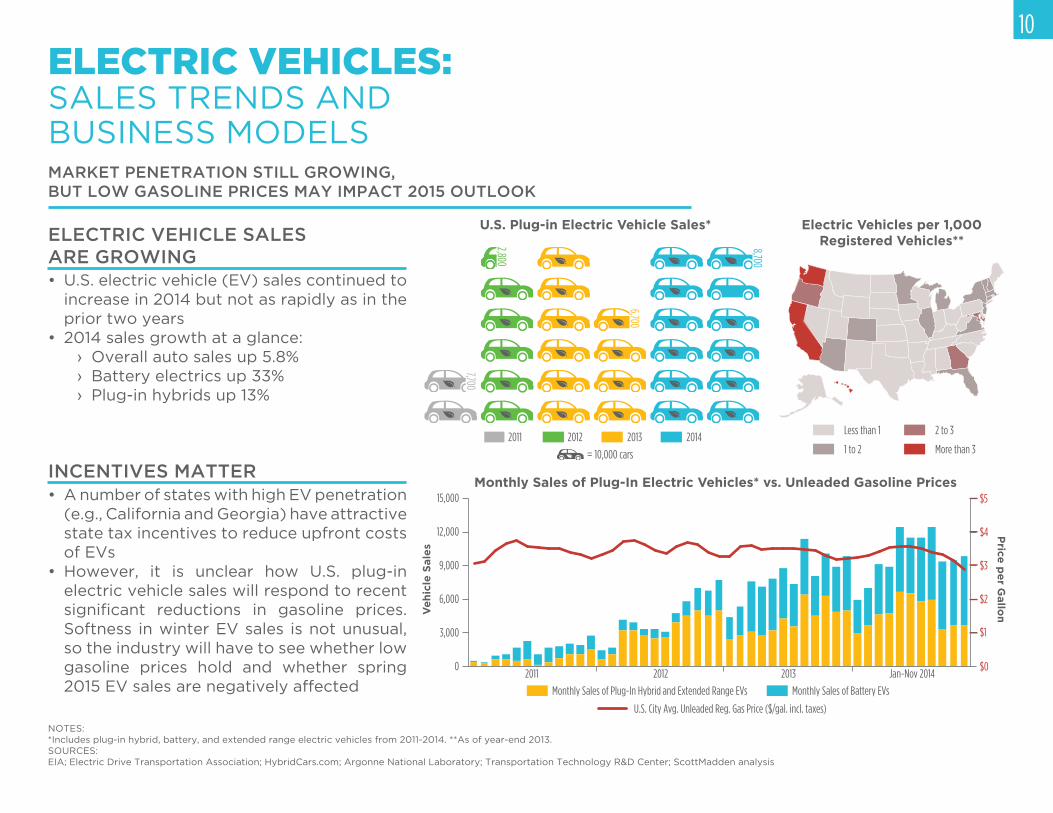
Monthly Sales of Plug-In Electric Vehicles* vs. Unleaded Gasoline Prices
2011 2012 2013 Jan-Nov 2014$0
$1
$2
$3
$4
$5
0
6,000
9,000
12,000
15,000
3,000
Monthly Sales of Battery EVsMonthly Sales of Plug-In Hybrid and Extended Range EVs
U.S. City Avg. Unleaded Reg. Gas Price ($/gal. incl. taxes)
Price
pe
r Gallo
n
10
ELECTRIC VEHICLES: SALES TRENDS AND BUSINESS MODELSMARKET PENETRATION STILL GROWING, BUT LOW GASOLINE PRICES MAY IMPACT 2015 OUTLOOK
• U.S. electric vehicle (EV) sales continued to increase in 2014 but not as rapidly as in the prior two years
• 2014 sales growth at a glance:› Overall auto sales up 5.8%› Battery electrics up 33%› Plug-in hybrids up 13%
ELECTRIC VEHICLE SALES ARE GROWING
• A number of states with high EV penetration (e.g., California and Georgia) have attractive state tax incentives to reduce upfront costs of EVs
• However, it is unclear how U.S. plug-in electric vehicle sales will respond to recent significant reductions in gasoline prices. Softness in winter EV sales is not unusual, so the industry will have to see whether low gasoline prices hold and whether spring 2015 EV sales are negatively affected
NOTES: *Includes plug-in hybrid, battery, and extended range electric vehicles from 2011-2014. **As of year-end 2013.SOURCES:EIA; Electric Drive Transportation Association; HybridCars.com; Argonne National Laboratory; Transportation Technology R&D Center; ScottMadden analysis
Electric Vehicles per 1,000 Registered Vehicles**
U.S. Plug-in Electric Vehicle Sales*
INCENTIVES MATTER
Ve
hic
le S
ale
s
EV1234 1234 1234 1234
CARDHOLDER 01/25
BANK CARD
11ELECTRIC VEHICLES: SALES TRENDS AND BUSINESS MODELS
NOTES: *Concern that all electric vehicles may become stranded due to inadequate battery performance/capacity and inability to charge. **Network operator is often a software firm that manages the network the stations are hosted on, typically managing customer interface and billing. ***A site owner buys and installs the stations and collects revenue from the network operator.SOURCES:EPRI; EEI; DOE; UCLA; utility websites; ScottMadden analysis
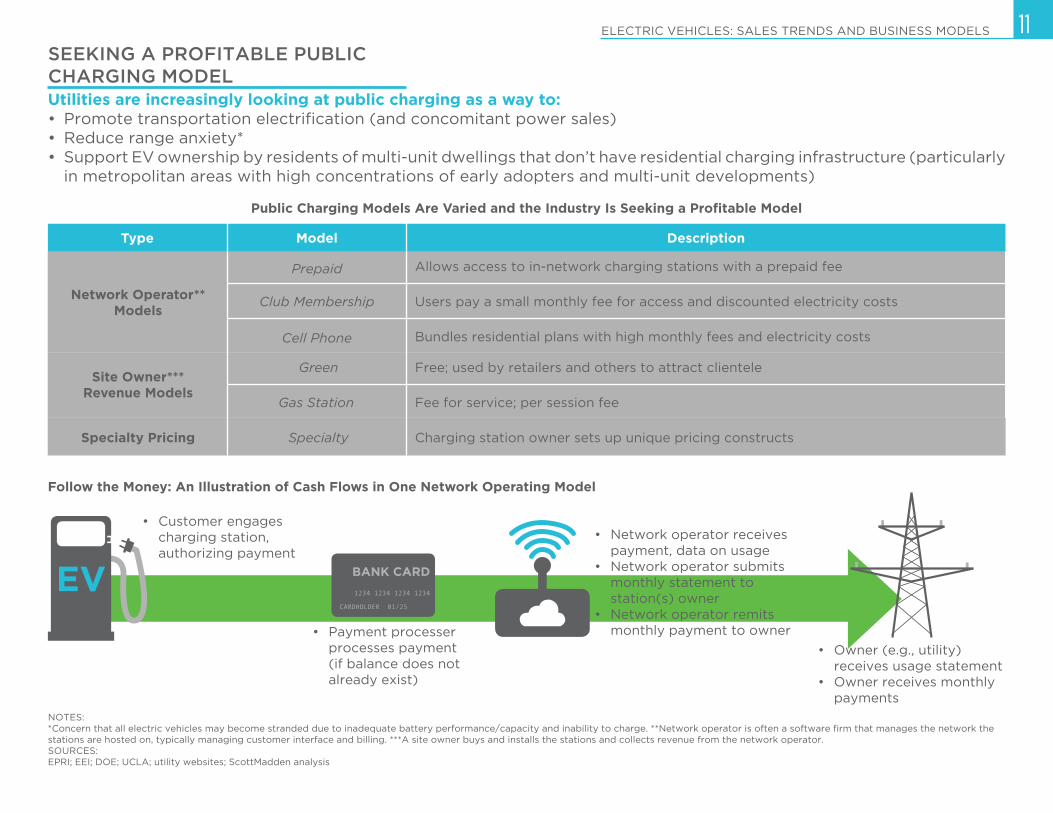
Utilities are increasingly looking at public charging as a way to:• Promote transportation electrification (and concomitant power sales) • Reduce range anxiety*• Support EV ownership by residents of multi-unit dwellings that don’t have residential charging infrastructure (particularly
in metropolitan areas with high concentrations of early adopters and multi-unit developments)
SEEKING A PROFITABLE PUBLIC CHARGING MODEL
Public Charging Models Are Varied and the Industry Is Seeking a Profitable Model
Allows access to in-network charging stations with a prepaid fee
Users pay a small monthly fee for access and discounted electricity costs
Bundles residential plans with high monthly fees and electricity costs
Free; used by retailers and others to attract clientele
Fee for service; per session fee
Charging station owner sets up unique pricing constructs
DescriptionModelType
Network Operator** Models
Site Owner*** Revenue Models
Specialty Pricing
Prepaid
Club Membership
Cell Phone
Green
Gas Station
Specialty
Follow the Money: An Illustration of Cash Flows in One Network Operating Model
• Customer engages charging station, authorizing payment
• Payment processer processes payment (if balance does not already exist)
• Network operator receives payment, data on usage
• Network operator submits monthly statement to station(s) owner
• Network operator remits monthly payment to owner
• Owner (e.g., utility) receives usage statement
• Owner receives monthly payments
Public
Workplace
1 232221201918171615141312111098765432 240.0
0.8
0.7
0.6
0.5
0.4
0.3
0.2
0.1
0.9
Flat Rate TOD
Time of Day (hour)
Ave
rag
e k
W
12ELECTRIC VEHICLES: SALES TRENDS AND BUSINESS MODELS
What Different Charging Levels Mean
DescriptionTime to Charge*Level
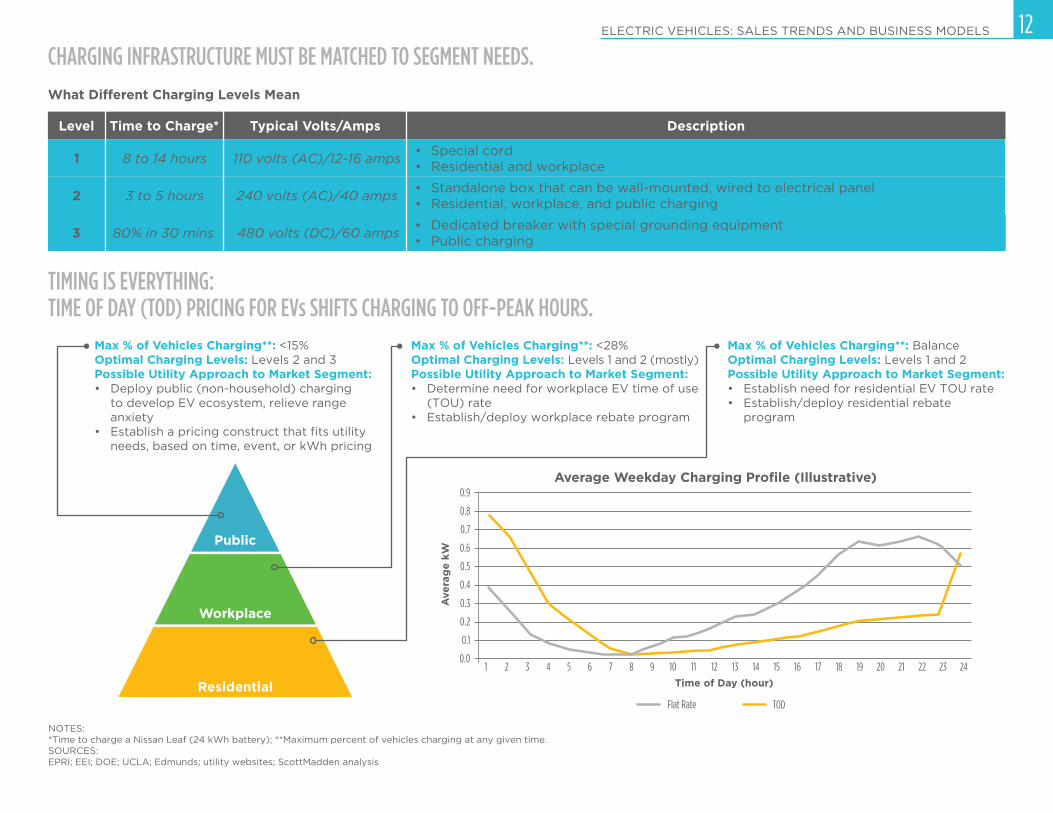
CHARGING INFRASTRUCTURE MUST BE MATCHED TO SEGMENT NEEDS.
1 8 to 14 hours 110 volts (AC)/12-16 amps• Special cord • Residential and workplace
240 volts (AC)/40 amps2 3 to 5 hours• Standalone box that can be wall-mounted, wired to electrical panel• Residential, workplace, and public charging
480 volts (DC)/60 amps3 80% in 30 mins• Dedicated breaker with special grounding equipment• Public charging
Typical Volts/Amps
NOTES: *Time to charge a Nissan Leaf (24 kWh battery); **Maximum percent of vehicles charging at any given time.SOURCES:EPRI; EEI; DOE; UCLA; Edmunds; utility websites; ScottMadden analysis
Residential
Max % of Vehicles Charging**: <15%Optimal Charging Levels: Levels 2 and 3Possible Utility Approach to Market Segment:• Deploy public (non-household) charging
to develop EV ecosystem, relieve range anxiety
• Establish a pricing construct that fits utility needs, based on time, event, or kWh pricing
Max % of Vehicles Charging**: <28%Optimal Charging Levels: Levels 1 and 2 (mostly) Possible Utility Approach to Market Segment:• Determine need for workplace EV time of use
(TOU) rate• Establish/deploy workplace rebate program
Max % of Vehicles Charging**: BalanceOptimal Charging Levels: Levels 1 and 2Possible Utility Approach to Market Segment:• Establish need for residential EV TOU rate• Establish/deploy residential rebate
program
Average Weekday Charging Profile (Illustrative)
TIMING IS EVERYTHING: TIME OF DAY (TOD) PRICING FOR EVs SHIFTS CHARGING TO OFF-PEAK HOURS.
PhotovoltaicTotal MW: 4,232
Internal CombustionTotal MW: 3,937
OtherTotal MW: 494
WindTotal MW: 382
Combustion TurbineTotal MW: 156
HydroelectricTotal MW: 122
Steam TurbineTotal MW: 60
StorageTotal MW: 23
TNWYMSRIMTALMEDCKYSDIDUTAKLAWAKSNHVAWVNMNDOKARVTNEWIDEILSCNVTXINORMOIACTOHCOGAMNMAHINCPAAZMIMDFLNYNJCA0
200
400
600
800
1,000
2,000
2,200
13
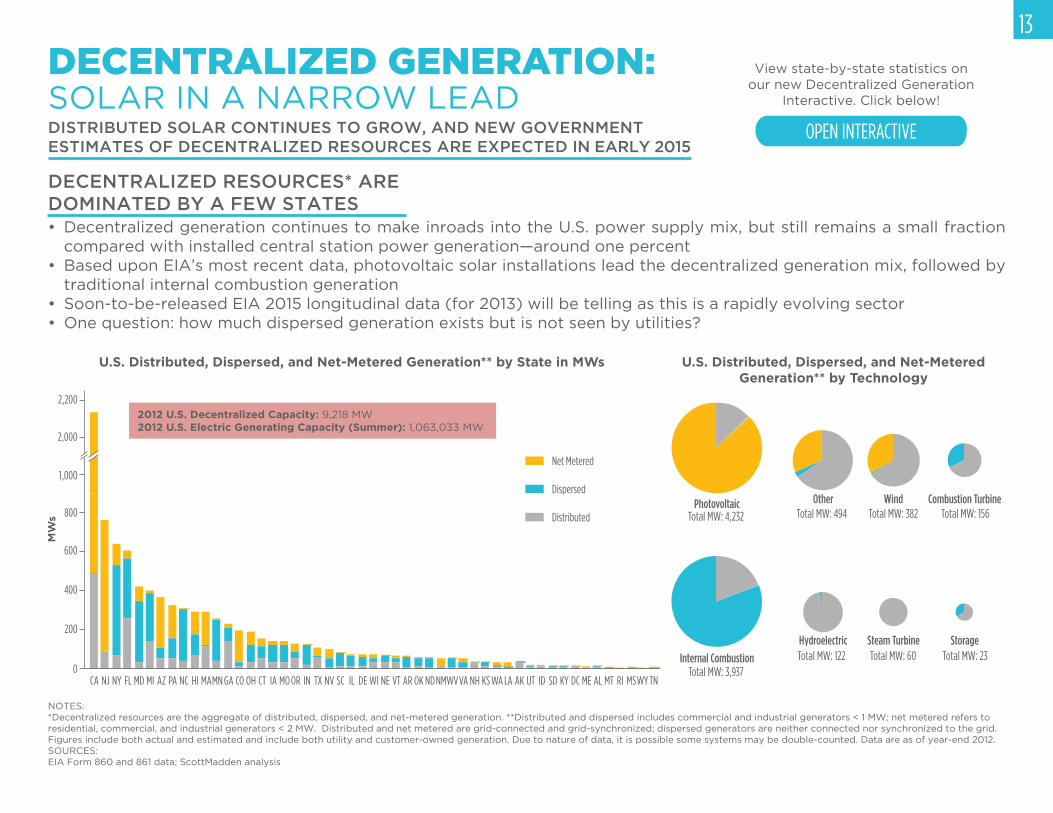
DECENTRALIZED GENERATION: SOLAR IN A NARROW LEADDISTRIBUTED SOLAR CONTINUES TO GROW, AND NEW GOVERNMENT
ESTIMATES OF DECENTRALIZED RESOURCES ARE EXPECTED IN EARLY 2015
• Decentralized generation continues to make inroads into the U.S. power supply mix, but still remains a small fraction
compared with installed central station power generation—around one percent
• Based upon EIA’s most recent data, photovoltaic solar installations lead the decentralized generation mix, followed by
traditional internal combustion generation
• Soon-to-be-released EIA 2015 longitudinal data (for 2013) will be telling as this is a rapidly evolving sector
• One question: how much dispersed generation exists but is not seen by utilities?
DECENTRALIZED RESOURCES* ARE
DOMINATED BY A FEW STATES
NOTES:
*Decentralized resources are the aggregate of distributed, dispersed, and net-metered generation. **Distributed and dispersed includes commercial and industrial generators < 1 MW; net metered refers to
residential, commercial, and industrial generators < 2 MW. Distributed and net metered are grid-connected and grid-synchronized; dispersed generators are neither connected nor synchronized to the grid.
Figures include both actual and estimated and include both utility and customer-owned generation. Due to nature of data, it is possible some systems may be double-counted. Data are as of year-end 2012.
SOURCES:
EIA Form 860 and 861 data; ScottMadden analysis
U.S. Distributed, Dispersed, and Net-Metered Generation** by State in MWs U.S. Distributed, Dispersed, and Net-Metered Generation** by Technology
Dispersed
Net Metered
Distributed
MW
s
2012 U.S. Decentralized Capacity: 9,218 MW
2012 U.S. Electric Generating Capacity (Summer): 1,063,033 MW
OPEN INTERACTIVE
View state-by-state statistics on
our new Decentralized Generation
Interactive. Click below!
Jan. 2009 Jan. 2010 Jan. 2011 Jan. 2012 Jan. 2013 Jan. 2014 Jan. 2015 Jan. 2016
Spot Prices Forward Prices$0
$10
$8
$4
$6
$2
Dec. 2016
High-Low Bound per two year period
Henry Hub Spot Price
Forward Price
Pricing point 30-day avg. price/MMBtu at end of Q3 2014 (% increase/decrease
from previous year)
TZ5$3.96(5%)
TCO$3.90(6%)
FGT-Z3$3.91(5%)
Henry Hub$3.90(14%)
Chicago$3.93(5%)NPGL
Midcon$3.75(6%)SoCal
$4.10(8%)
CIG$3.74(9%)
AECO$3.63(84%)
Sumas$3.77(16%)
PG&E$4.46(12%)
TZ6-NY$2.34
(-38%)
Algonquin$2.98
(-23%)
Houston$3.91(7%)
14
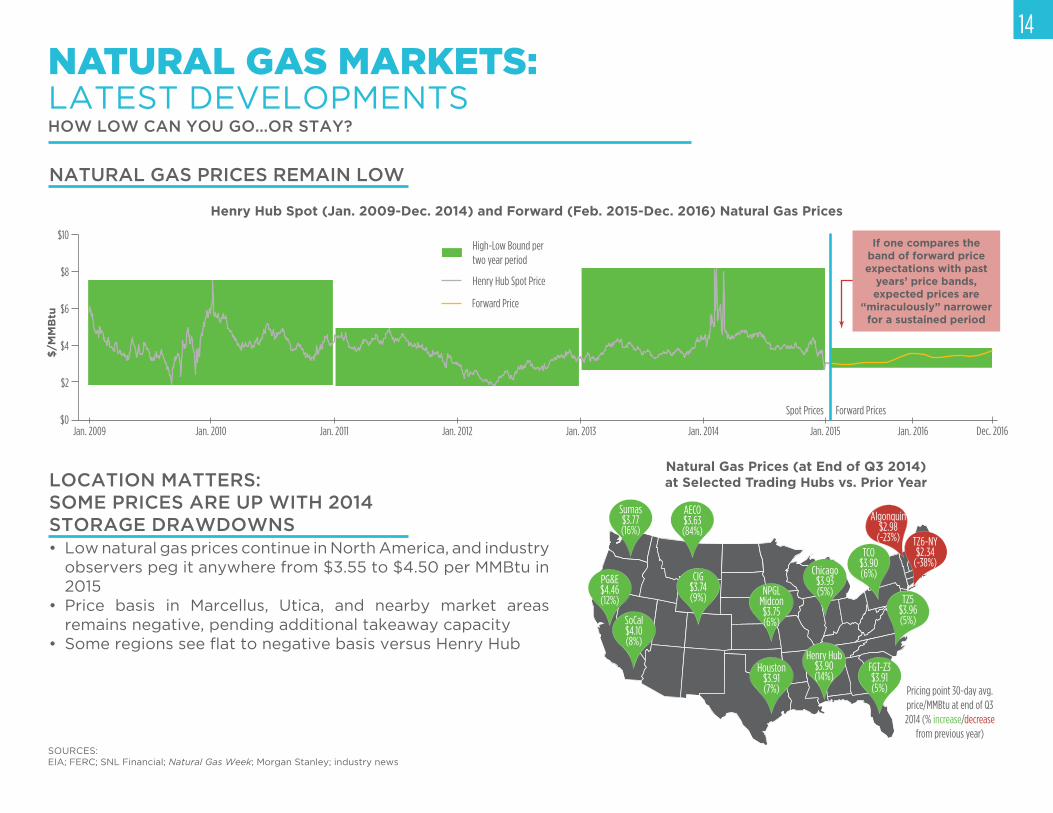
NATURAL GAS MARKETS: LATEST DEVELOPMENTSHOW LOW CAN YOU GO...OR STAY?
• Low natural gas prices continue in North America, and industry
observers peg it anywhere from $3.55 to $4.50 per MMBtu in
2015
• Price basis in Marcellus, Utica, and nearby market areas
remains negative, pending additional takeaway capacity
• Some regions see flat to negative basis versus Henry Hub
LOCATION MATTERS: SOME PRICES ARE UP WITH 2014 STORAGE DRAWDOWNS
SOURCES:
EIA; FERC; SNL Financial; Natural Gas Week; Morgan Stanley; industry news
Natural Gas Prices (at End of Q3 2014) at Selected Trading Hubs vs. Prior Year
If one compares the band of forward price expectations with past
years’ price bands, expected prices are
“miraculously” narrower for a sustained period
Henry Hub Spot (Jan. 2009-Dec. 2014) and Forward (Feb. 2015-Dec. 2016) Natural Gas Prices
$/M
MB
tu
NATURAL GAS PRICES REMAIN LOW
0
10
20
30
40Rest of U.S. Shale
Utica (OH, PA & WV)
Marcellus (PA & WV)
Haynesville (LA & TX)
Eagle Ford (TX)
Fayetteville (AR)
Barnett (TX)
Woodford (OK)
Bakken (ND)
3/131/13 11/149/147/145/143/141/1411/139/137/135/13
Antrim (MI, IN, & OH)
$0
$1
$2
$3
$4
$5
Marcellu
s Dry
(Tier
II)
Haynesv
ille (U
nrestr.
)
Montne
y Dry
Eagle F
ord Gas
Huron T
ight
Woodfo
rd Arko
ma
Haynesv
ille (R
estr.)
Fayett
eville
2.6
Barnett
Gas
Montne
y Wet
Fayett
eville
3.2
Utica Dry
Marcellu
s NE
Utica Rich
Gas
Super
Rich Marc
ellus
Marcellu
s Wet
2015-16 Forward Price (high)*
2015-16 Forward Price (low)*
15NATURAL GAS MARKETS: LATEST DEVELOPMENTS
NOTES:
*Forward prices are monthly high/low as of early Jan. 2015 for Henry Hub gas in months Feb. 2015 to Dec. 2016. IRR based upon half-cycle return not including leasehold acquisition expense or allocated costs. Assumes NGL prices at 40% of West Texas Intermediate crude, regional gas price differential and company disclosed D&C costs and recoveriesSOURCES:
EIA; FERC; Deutsche Bank; SNL Financial; Natural Gas Week; Wood Mackenzie; Charles River Associates; industry news
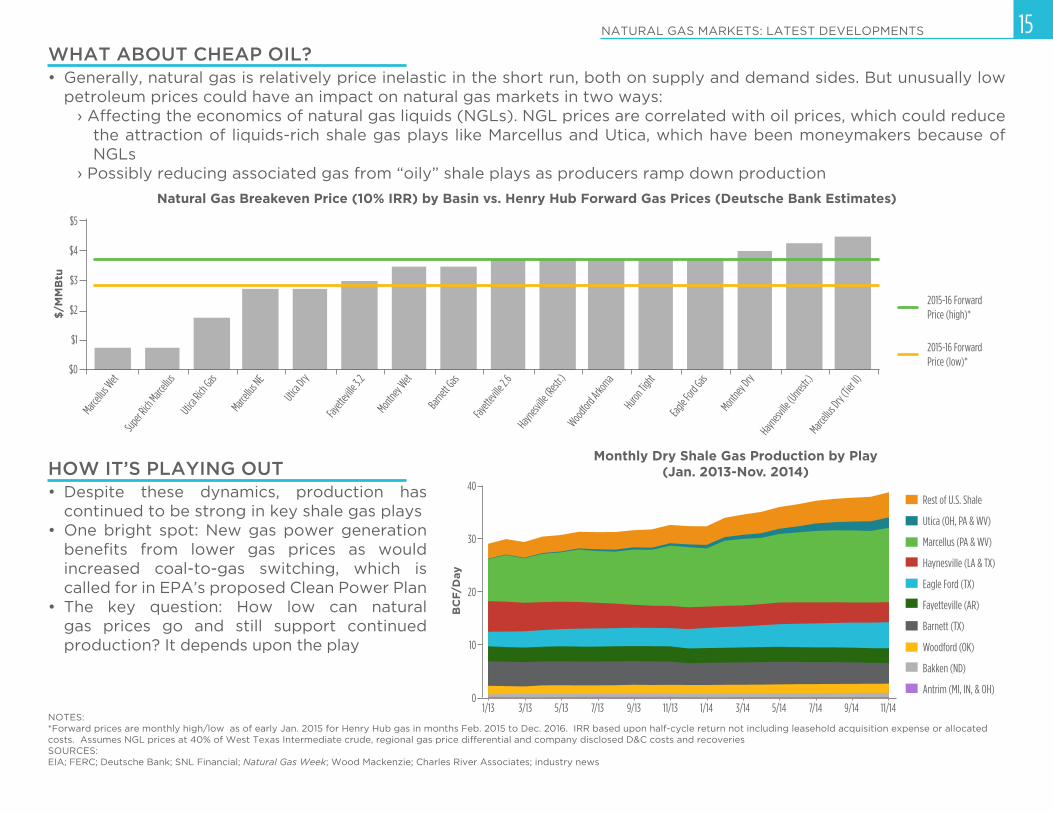
• Despite these dynamics, production has
continued to be strong in key shale gas plays
• One bright spot: New gas power generation
benefits from lower gas prices as would increased coal-to-gas switching, which is called for in EPA’s proposed Clean Power Plan
• The key question: How low can natural gas prices go and still support continued
production? It depends upon the play
HOW IT’S PLAYING OUTMonthly Dry Shale Gas Production by Play
(Jan. 2013-Nov. 2014)
Natural Gas Breakeven Price (10% IRR) by Basin vs. Henry Hub Forward Gas Prices (Deutsche Bank Estimates)
BC
F/D
ay
• Generally, natural gas is relatively price inelastic in the short run, both on supply and demand sides. But unusually low
petroleum prices could have an impact on natural gas markets in two ways:
› Affecting the economics of natural gas liquids (NGLs). NGL prices are correlated with oil prices, which could reduce the attraction of liquids-rich shale gas plays like Marcellus and Utica, which have been moneymakers because of NGLs
› Possibly reducing associated gas from “oily” shale plays as producers ramp down production
WHAT ABOUT CHEAP OIL?$
/MM
Btu
500
1,000
1,500
2,000
2,500
3,000
3,500
4,000
Jan. 20
15
Nov. 20
14
Sept. 2
014
July 2
014
May 201
4
Mar. 201
4
Jan. 20
14
Nov. 20
13
Sept. 2
013
July 2
013
May 201
3
Mar. 201
3
Jan. 20
13
Working Gas in Storage
5-year Max (top) and Min (bottom) for 2009-2013
Bil
lio
n C
ub
ic F
ee
t
16
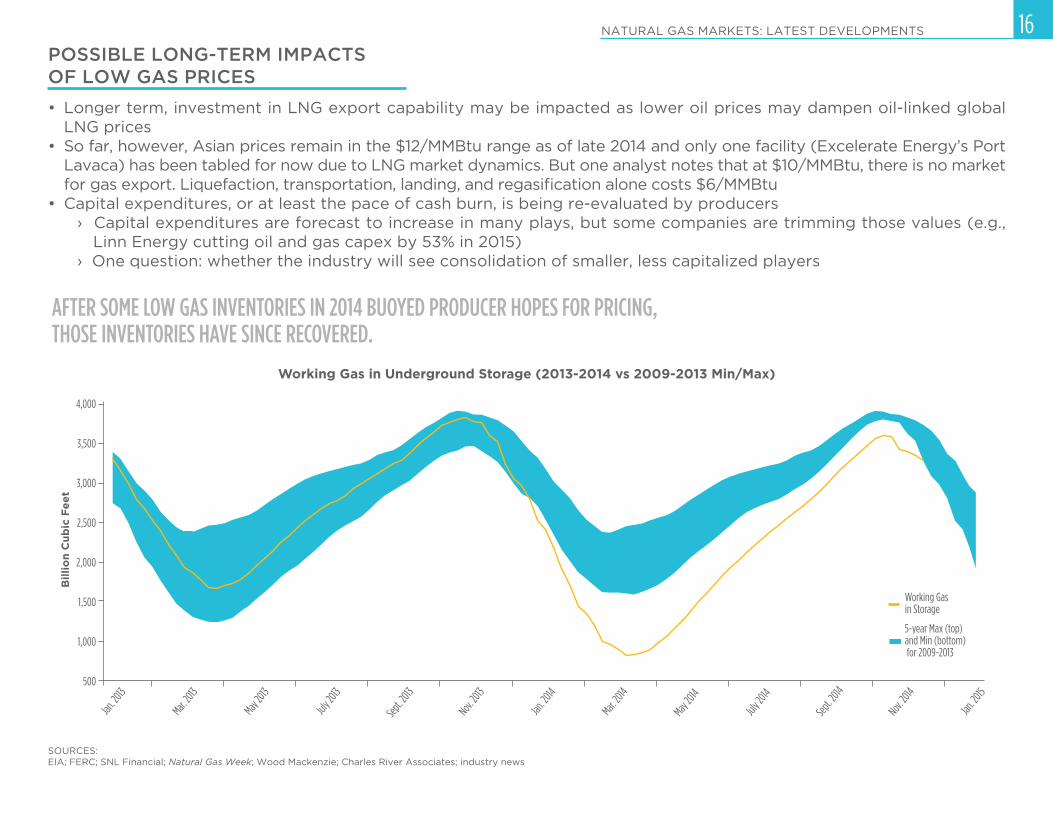
• Longer term, investment in LNG export capability may be impacted as lower oil prices may dampen oil-linked global LNG prices
• So far, however, Asian prices remain in the $12/MMBtu range as of late 2014 and only one facility (Excelerate Energy’s Port Lavaca) has been tabled for now due to LNG market dynamics. But one analyst notes that at $10/MMBtu, there is no market for gas export. Liquefaction, transportation, landing, and regasification alone costs $6/MMBtu
• Capital expenditures, or at least the pace of cash burn, is being re-evaluated by producers› Capital expenditures are forecast to increase in many plays, but some companies are trimming those values (e.g.,
Linn Energy cutting oil and gas capex by 53% in 2015)› One question: whether the industry will see consolidation of smaller, less capitalized players
NATURAL GAS MARKETS: LATEST DEVELOPMENTS
SOURCES:
EIA; FERC; SNL Financial; Natural Gas Week; Wood Mackenzie; Charles River Associates; industry news
POSSIBLE LONG-TERM IMPACTS OF LOW GAS PRICES
Working Gas in Underground Storage (2013-2014 vs 2009-2013 Min/Max)
AFTER SOME LOW GAS INVENTORIES IN 2014 BUOYED PRODUCER HOPES FOR PRICING, THOSE INVENTORIES HAVE SINCE RECOVERED.
RATE AND REGULATORY DEVELOPMENTS
The ScottMadden Energy Industry Update
State with renewable tariff
State without renewable tariff
18
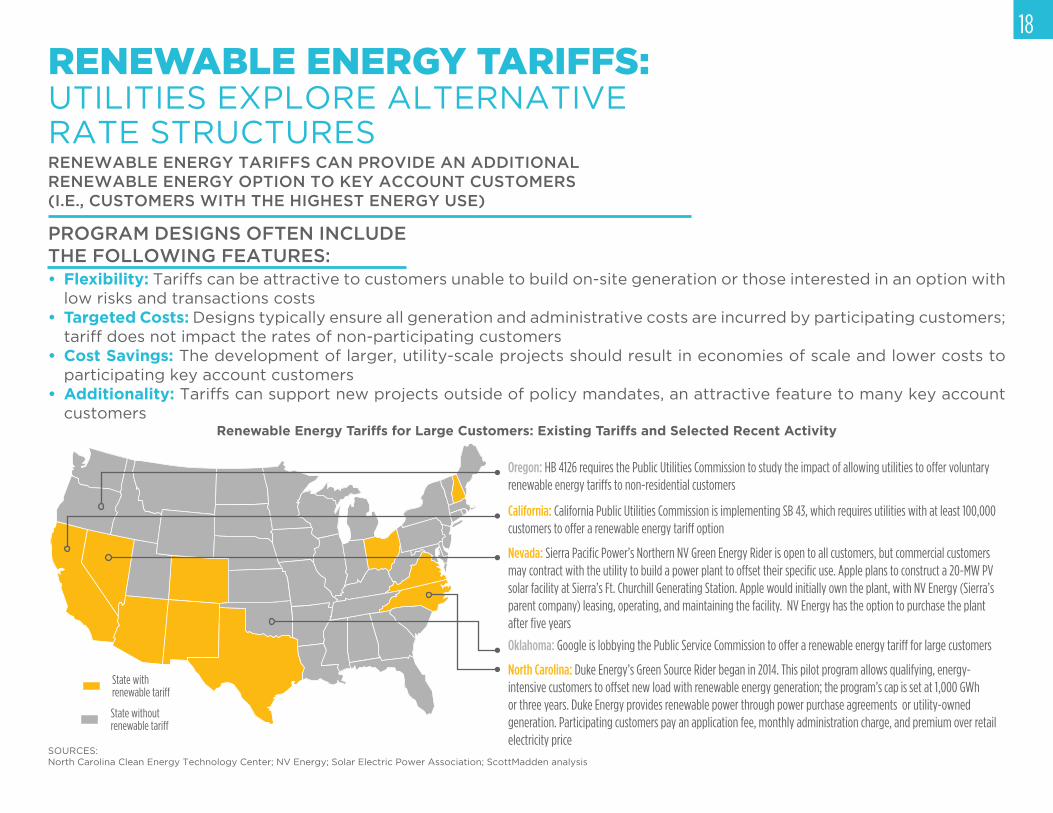
RENEWABLE ENERGY TARIFFS: UTILITIES EXPLORE ALTERNATIVE
RATE STRUCTURESRENEWABLE ENERGY TARIFFS CAN PROVIDE AN ADDITIONAL RENEWABLE ENERGY OPTION TO KEY ACCOUNT CUSTOMERS (I.E., CUSTOMERS WITH THE HIGHEST ENERGY USE)
• Flexibility: Tariffs can be attractive to customers unable to build on-site generation or those interested in an option with
low risks and transactions costs
• Targeted Costs: Designs typically ensure all generation and administrative costs are incurred by participating customers;
tariff does not impact the rates of non-participating customers
• Cost Savings: The development of larger, utility-scale projects should result in economies of scale and lower costs to
participating key account customers
• Additionality: Tariffs can support new projects outside of policy mandates, an attractive feature to many key account
customers
PROGRAM DESIGNS OFTEN INCLUDE THE FOLLOWING FEATURES:
Renewable Energy Tariffs for Large Customers: Existing Tariffs and Selected Recent Activity
Oregon: HB 4126 requires the Public Utilities Commission to study the impact of allowing utilities to offer voluntary renewable energy tariffs to non-residential customers
California: California Public Utilities Commission is implementing SB 43, which requires utilities with at least 100,000 customers to offer a renewable energy tariff option
Nevada: Sierra Pacific Power’s Northern NV Green Energy Rider is open to all customers, but commercial customers may contract with the utility to build a power plant to offset their specific use. Apple plans to construct a 20-MW PV solar facility at Sierra’s Ft. Churchill Generating Station. Apple would initially own the plant, with NV Energy (Sierra’s parent company) leasing, operating, and maintaining the facility. NV Energy has the option to purchase the plant after five years
Oklahoma: Google is lobbying the Public Service Commission to offer a renewable energy tariff for large customers
North Carolina: Duke Energy’s Green Source Rider began in 2014. This pilot program allows qualifying, energy-intensive customers to offset new load with renewable energy generation; the program’s cap is set at 1,000 GWh or three years. Duke Energy provides renewable power through power purchase agreements or utility-owned generation. Participating customers pay an application fee, monthly administration charge, and premium over retail electricity price
SOURCES:
North Carolina Clean Energy Technology Center; NV Energy; Solar Electric Power Association; ScottMadden analysis
19
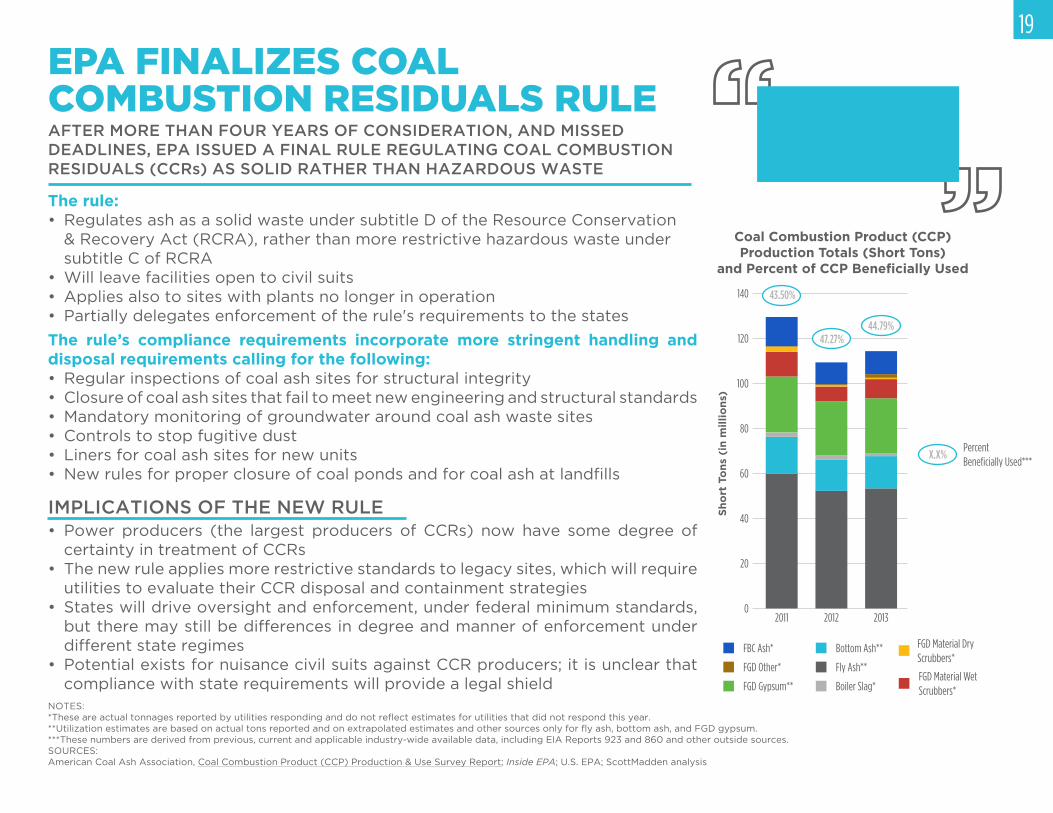
EPA FINALIZES COAL COMBUSTION RESIDUALS RULEAFTER MORE THAN FOUR YEARS OF CONSIDERATION, AND MISSED DEADLINES, EPA ISSUED A FINAL RULE REGULATING COAL COMBUSTION RESIDUALS (CCRs) AS SOLID RATHER THAN HAZARDOUS WASTE
The rule:• Regulates ash as a solid waste under subtitle D of the Resource Conservation
& Recovery Act (RCRA), rather than more restrictive hazardous waste under
subtitle C of RCRA
• Will leave facilities open to civil suits
• Applies also to sites with plants no longer in operation
• Partially delegates enforcement of the rule's requirements to the states
• Power producers (the largest producers of CCRs) now have some degree of
certainty in treatment of CCRs
• The new rule applies more restrictive standards to legacy sites, which will require
utilities to evaluate their CCR disposal and containment strategies
• States will drive oversight and enforcement, under federal minimum standards,
but there may still be differences in degree and manner of enforcement under
different state regimes
• Potential exists for nuisance civil suits against CCR producers; it is unclear that
compliance with state requirements will provide a legal shield
IMPLICATIONS OF THE NEW RULE
NOTES:
*These are actual tonnages reported by utilities responding and do not reflect estimates for utilities that did not respond this year.**Utilization estimates are based on actual tons reported and on extrapolated estimates and other sources only for fly ash, bottom ash, and FGD gypsum.***These numbers are derived from previous, current and applicable industry-wide available data, including EIA Reports 923 and 860 and other outside sources.SOURCES:
American Coal Ash Association, Coal Combustion Product (CCP) Production & Use Survey Report; Inside EPA; U.S. EPA; ScottMadden analysis
Nearly half of coal combustion residuals are beneficially used in other products such as cement and wallboard.
Coal Combustion Product (CCP) Production Totals (Short Tons)
and Percent of CCP Beneficially Used
FGD Other*
FGD Material Dry Scrubbers*
FGD Material Wet Scrubbers*FGD Gypsum** Boiler Slag*
Bottom Ash**
Fly Ash**
FBC Ash*
140
Sh
ort
To
ns
(in
mil
lio
ns)
120
100
80
60
40
20
02011
43.50%
2012
47.27%
2013
44.79%
Percent Beneficially Used***
X.X%
The rule’s compliance requirements incorporate more stringent handling and disposal requirements calling for the following:• Regular inspections of coal ash sites for structural integrity
• Closure of coal ash sites that fail to meet new engineering and structural standards
• Mandatory monitoring of groundwater around coal ash waste sites• Controls to stop fugitive dust
• Liners for coal ash sites for new units
• New rules for proper closure of coal ponds and for coal ash at landfills

CLEAN TECH AND ENVIRONMENT
The ScottMadden Energy Industry Update
% of Greenhouse Gas
Reduction (vs. 1990)Climate
Renewable Energy
EnergyEfficiency
% of Electricity
Consumption
% of Final Energy
Consumption
% of Primary Energy
Consumption (vs. 2008)
Energy Productivity
Building Renovation
-23.8%(estimated)
25.4%
12.4%(2012)
-3.3%
+1.1% per year
~1% per year
Achieved 2013 2020 20502025 2030 2035 2040 2045
+2.1% per year
Doubling of Renovation Rate: 1% → 2%
-40%
-55%-70%
-80% to
-95%
40% to
45%35%
50% 55% to 60% 65%80%
18%30%
45%
60%
-20% -50%
21
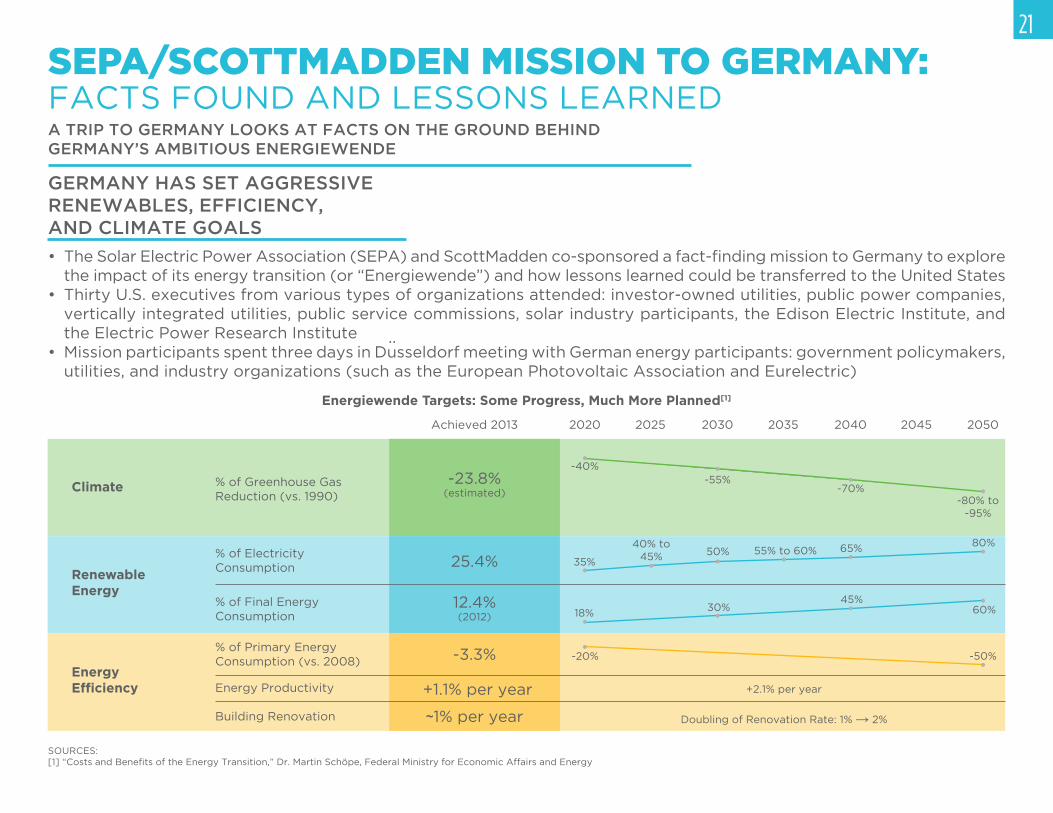
SEPA/SCOTTMADDEN MISSION TO GERMANY: FACTS FOUND AND LESSONS LEARNEDA TRIP TO GERMANY LOOKS AT FACTS ON THE GROUND BEHIND GERMANY’S AMBITIOUS ENERGIEWENDE
• The Solar Electric Power Association (SEPA) and ScottMadden co-sponsored a fact-finding mission to Germany to explore the impact of its energy transition (or “Energiewende”) and how lessons learned could be transferred to the United States
• Thirty U.S. executives from various types of organizations attended: investor-owned utilities, public power companies, vertically integrated utilities, public service commissions, solar industry participants, the Edison Electric Institute, and the Electric Power Research Institute
• Mission participants spent three days in Dusseldorf meeting with German energy participants: government policymakers, utilities, and industry organizations (such as the European Photovoltaic Association and Eurelectric)
GERMANY HAS SET AGGRESSIVE RENEWABLES, EFFICIENCY, AND CLIMATE GOALS
Energiewende Targets: Some Progress, Much More Planned[1]
..
SOURCES:
[1] “Costs and Benefits of the Energy Transition,” Dr. Martin Schöpe, Federal Ministry for Economic Affairs and Energy
German Net Installed Capacity (GWs) as of July 16, 2014
Year-to-Date German Electricity Production (TWhs) through July 2014
00
10
20
30
40
20
40
60
80
100
GW
sT
Wh
s
Nuclear Brown Coal HydroBiomassSolarWindNatural GasHard Coal
12.1
21.2
28.1 28.4
34.637.4
7.55.6
51.157.8
18.329.0
22.730.5
11.3
22SEPA/SCOTTMADDEN MISSION TO GERMANY: FACTS FOUND AND LESSONS LEARNED
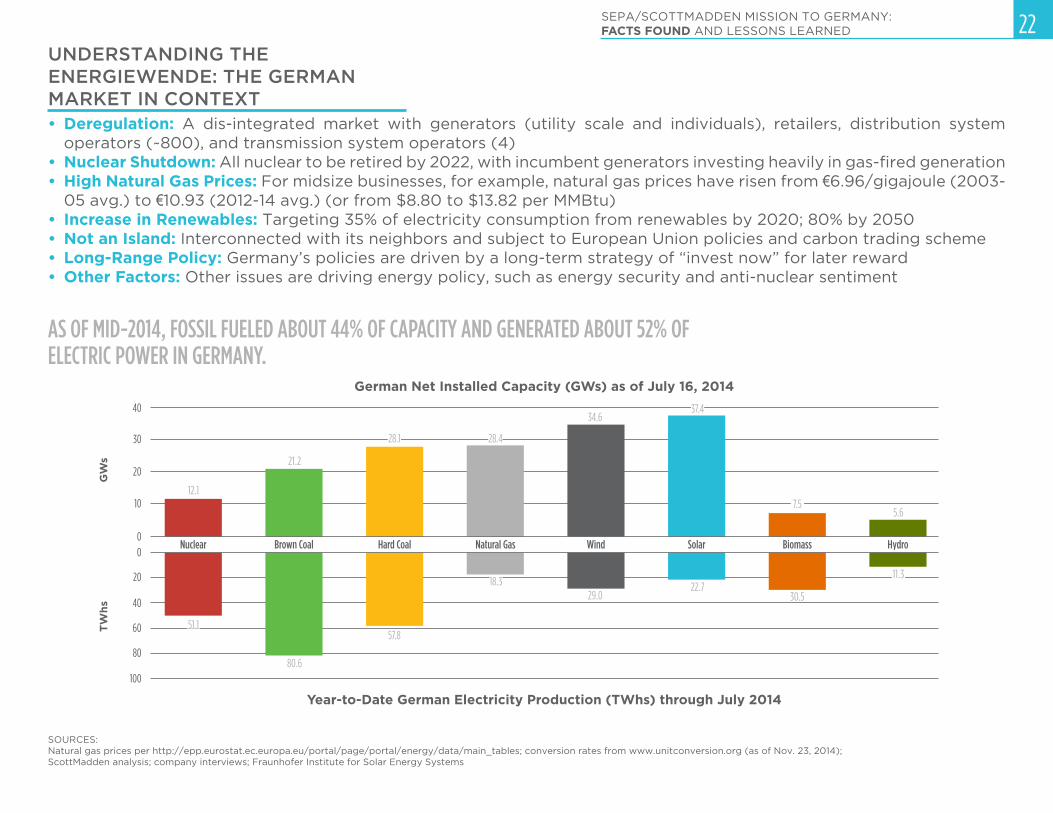
• Deregulation: A dis-integrated market with generators (utility scale and individuals), retailers, distribution system operators (~800), and transmission system operators (4)
• Nuclear Shutdown: All nuclear to be retired by 2022, with incumbent generators investing heavily in gas-fired generation• High Natural Gas Prices: For midsize businesses, for example, natural gas prices have risen from €6.96/gigajoule (2003-
05 avg.) to €10.93 (2012-14 avg.) (or from $8.80 to $13.82 per MMBtu)
• Increase in Renewables: Targeting 35% of electricity consumption from renewables by 2020; 80% by 2050
• Not an Island: Interconnected with its neighbors and subject to European Union policies and carbon trading scheme• Long-Range Policy: Germany’s policies are driven by a long-term strategy of “invest now” for later reward
• Other Factors: Other issues are driving energy policy, such as energy security and anti-nuclear sentiment
UNDERSTANDING THE ENERGIEWENDE: THE GERMAN MARKET IN CONTEXT
SOURCES:
Natural gas prices per http://epp.eurostat.ec.europa.eu/portal/page/portal/energy/data/main_tables; conversion rates from www.unitconversion.org (as of Nov. 23, 2014);ScottMadden analysis; company interviews; Fraunhofer Institute for Solar Energy Systems
AS OF MID-2014, FOSSIL FUELED ABOUT 44% OF CAPACITY AND GENERATED ABOUT 52% OF ELECTRIC POWER IN GERMANY.
80.6
0
300
600
900
1,200
1,500
2012201120102009200820072006200520042003
2 15 51172
387
202299
298
990
1,213
Number of Grid Interventions to Stabilize the Grid by Grid Operator TenneT
Conservative Estimate: €27.5B(Slower Renewables Penetration)
€3.6B
€7.8B
€16.1B
€4.2B
€12.0B
€26.3B
Higher and Faster Renewables Penetration: €42.5B
Nu
mb
er
of
Inte
rve
nti
on
s
23
High Voltage (60-110 kV (150 kV))
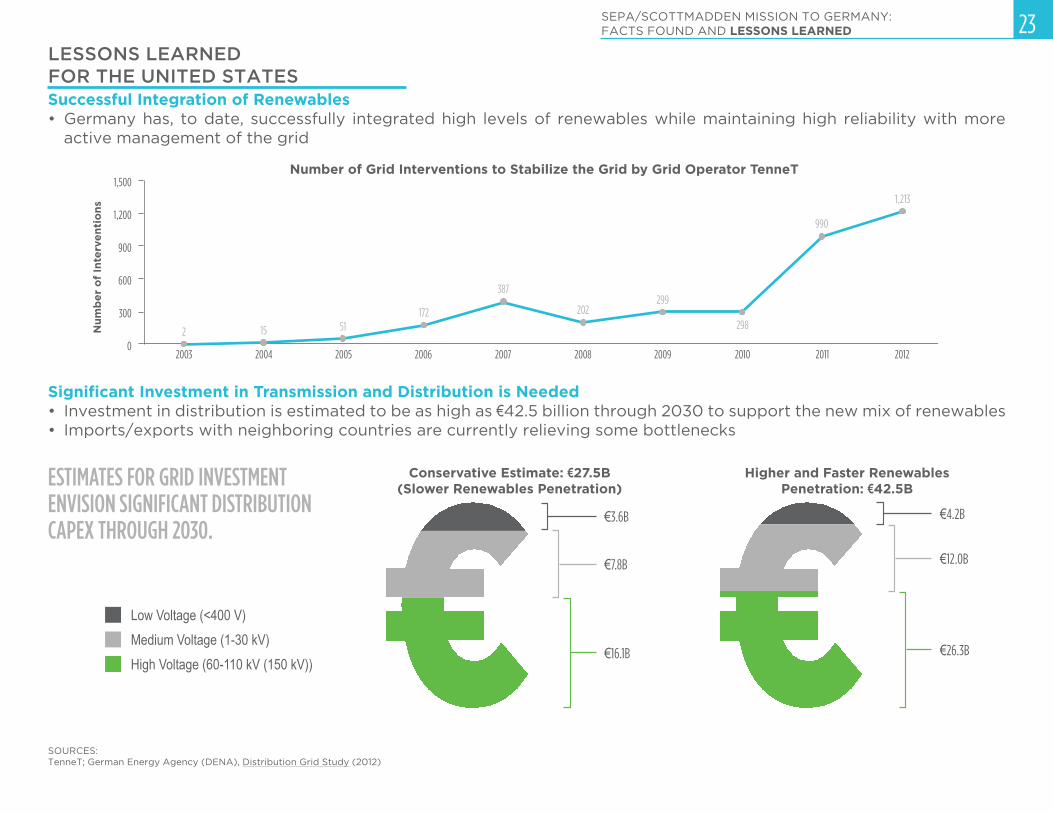
SEPA/SCOTTMADDEN MISSION TO GERMANY: FACTS FOUND AND LESSONS LEARNED
Successful Integration of Renewables• Germany has, to date, successfully integrated high levels of renewables while maintaining high reliability with more
active management of the grid
LESSONS LEARNED FOR THE UNITED STATES
Low Voltage (<400 V)
Medium Voltage (1-30 kV)
Significant Investment in Transmission and Distribution is Needed• Investment in distribution is estimated to be as high as €42.5 billion through 2030 to support the new mix of renewables• Imports/exports with neighboring countries are currently relieving some bottlenecks
SOURCES:
TenneT; German Energy Agency (DENA), Distribution Grid Study (2012)
ESTIMATES FOR GRID INVESTMENT ENVISION SIGNIFICANT DISTRIBUTION CAPEX THROUGH 2030.
X.X%Percent of Household Spend
048
16
32
Eu
roce
nt/
kW
h
12
202428
2013
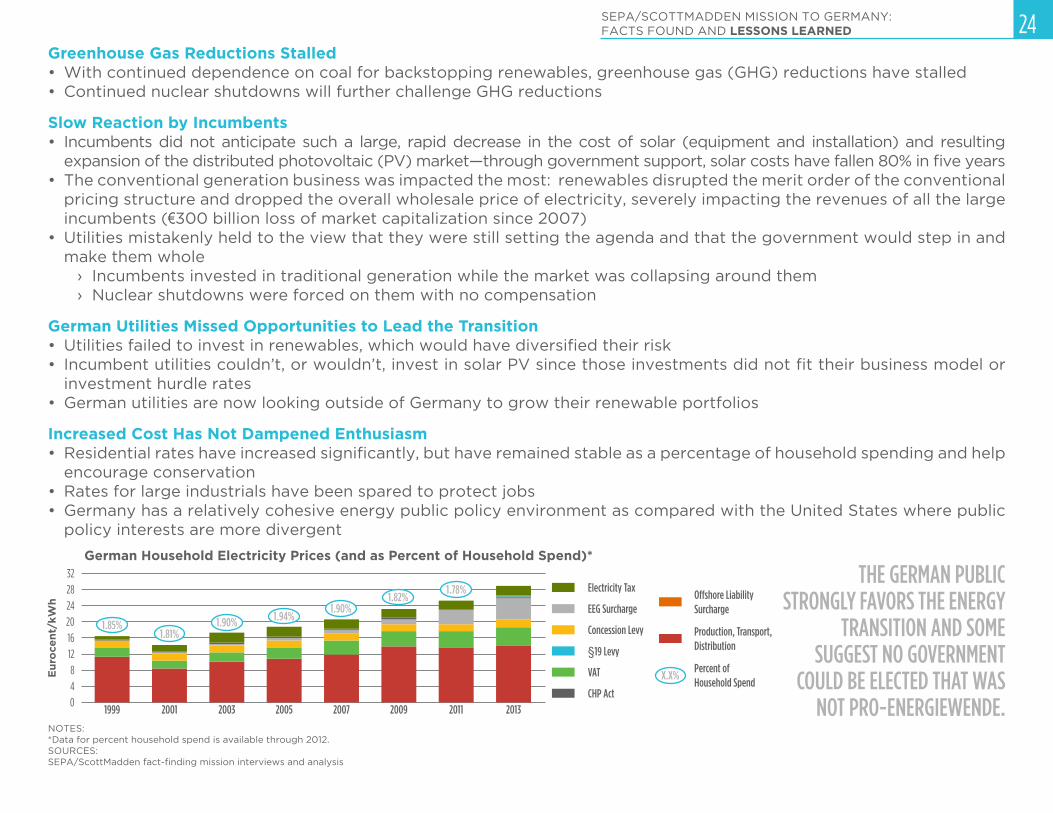
German Household Electricity Prices (and as Percent of Household Spend)*
Electricity Tax
Production, Transport, Distribution
Offshore Liability Surcharge
§19 Levy
CHP Act
EEG Surcharge
Concession Levy
VAT
2009
1.82%
2007
1.90%
2005
1.94%
2003
1.90%
2001
1.81%
1999
1.85%
2011
1.78%
24SEPA/SCOTTMADDEN MISSION TO GERMANY: FACTS FOUND AND LESSONS LEARNED
Greenhouse Gas Reductions Stalled• With continued dependence on coal for backstopping renewables, greenhouse gas (GHG) reductions have stalled• Continued nuclear shutdowns will further challenge GHG reductions
Slow Reaction by Incumbents• Incumbents did not anticipate such a large, rapid decrease in the cost of solar (equipment and installation) and resulting
expansion of the distributed photovoltaic (PV) market—through government support, solar costs have fallen 80% in five years• The conventional generation business was impacted the most: renewables disrupted the merit order of the conventional
pricing structure and dropped the overall wholesale price of electricity, severely impacting the revenues of all the large incumbents (€300 billion loss of market capitalization since 2007)
• Utilities mistakenly held to the view that they were still setting the agenda and that the government would step in and
make them whole
› Incumbents invested in traditional generation while the market was collapsing around them› Nuclear shutdowns were forced on them with no compensation
German Utilities Missed Opportunities to Lead the Transition• Utilities failed to invest in renewables, which would have diversified their risk• Incumbent utilities couldn’t, or wouldn’t, invest in solar PV since those investments did not fit their business model or
investment hurdle rates
• German utilities are now looking outside of Germany to grow their renewable portfolios
Increased Cost Has Not Dampened Enthusiasm• Residential rates have increased significantly, but have remained stable as a percentage of household spending and help
encourage conservation
• Rates for large industrials have been spared to protect jobs
• Germany has a relatively cohesive energy public policy environment as compared with the United States where public
policy interests are more divergent
NOTES:
*Data for percent household spend is available through 2012.
SOURCES:
SEPA/ScottMadden fact-finding mission interviews and analysis
THE GERMAN PUBLIC STRONGLY FAVORS THE ENERGY
TRANSITION AND SOME SUGGEST NO GOVERNMENT
COULD BE ELECTED THAT WAS NOT PRO-ENERGIEWENDE.
25
NOTES:
*CPP means the EPA’s proposed Clean Power Plan. **NGCC means natural gas combined cycle generating unit.
SOURCES:
SNL Financial; NARUC; RTI International; U.S. EPA
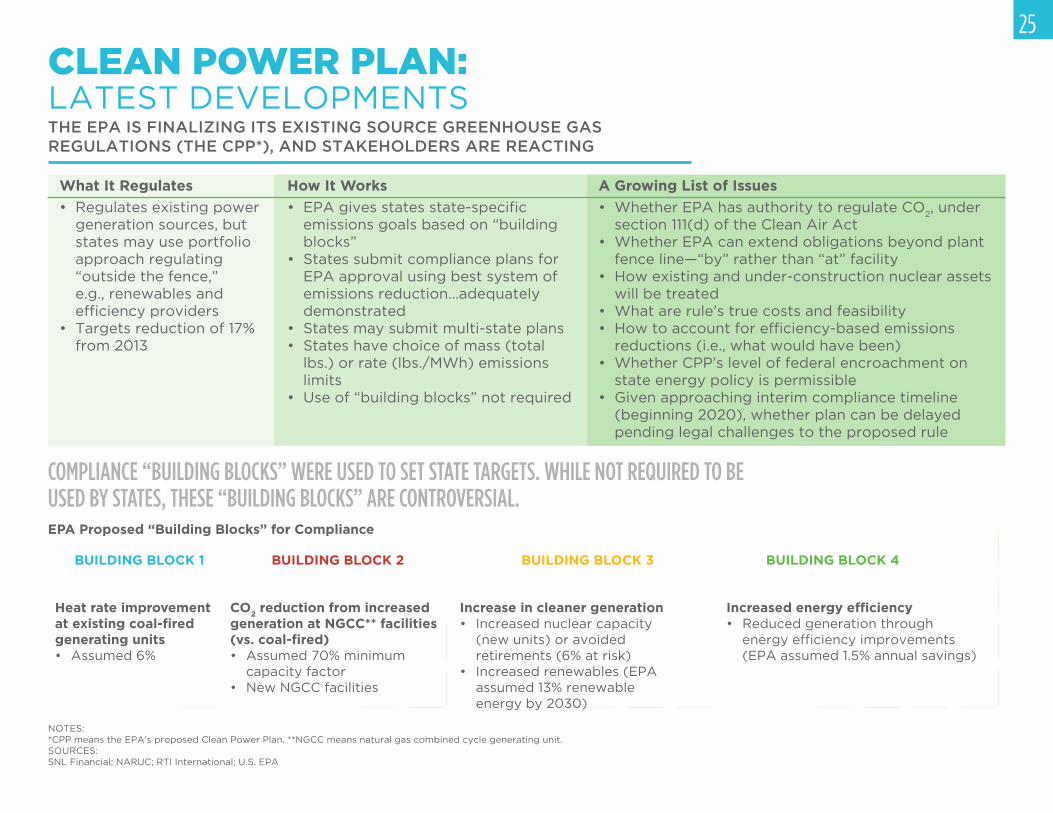
CLEAN POWER PLAN: LATEST DEVELOPMENTSTHE EPA IS FINALIZING ITS EXISTING SOURCE GREENHOUSE GAS REGULATIONS (THE CPP*), AND STAKEHOLDERS ARE REACTING
• Regulates existing power
generation sources, but
states may use portfolio
approach regulating
“outside the fence,”
e.g., renewables and
efficiency providers • Targets reduction of 17%
from 2013
• EPA gives states state-specific emissions goals based on “building
blocks”
• States submit compliance plans for
EPA approval using best system of emissions reduction...adequately
demonstrated
• States may submit multi-state plans• States have choice of mass (total
lbs.) or rate (lbs./MWh) emissions limits
• Use of “building blocks” not required
• Whether EPA has authority to regulate CO2, under
section 111(d) of the Clean Air Act• Whether EPA can extend obligations beyond plant
fence line—“by” rather than “at” facility
• How existing and under-construction nuclear assets will be treated
• What are rule’s true costs and feasibility• How to account for efficiency-based emissions
reductions (i.e., what would have been)• Whether CPP’s level of federal encroachment on
state energy policy is permissible
• Given approaching interim compliance timeline (beginning 2020), whether plan can be delayed pending legal challenges to the proposed rule
A Growing List of IssuesHow It WorksWhat It Regulates
COMPLIANCE “BUILDING BLOCKS” WERE USED TO SET STATE TARGETS. WHILE NOT REQUIRED TO BE USED BY STATES, THESE “BUILDING BLOCKS” ARE CONTROVERSIAL.EPA Proposed “Building Blocks” for Compliance
Heat rate improvement at existing coal-fired generating units• Assumed 6%
CO2 reduction from increased generation at NGCC** facilities (vs. coal-fired)• Assumed 70% minimum
capacity factor
• New NGCC facilities
Increase in cleaner generation• Increased nuclear capacity
(new units) or avoided retirements (6% at risk)
• Increased renewables (EPA assumed 13% renewable
energy by 2030)
Increased energy efficiency • Reduced generation through
energy efficiency improvements (EPA assumed 1.5% annual savings)
BUILDING BLOCK 1 BUILDING BLOCK 2 BUILDING BLOCK 3 BUILDING BLOCK 4
END OF YEAR 2015
START OF 2015
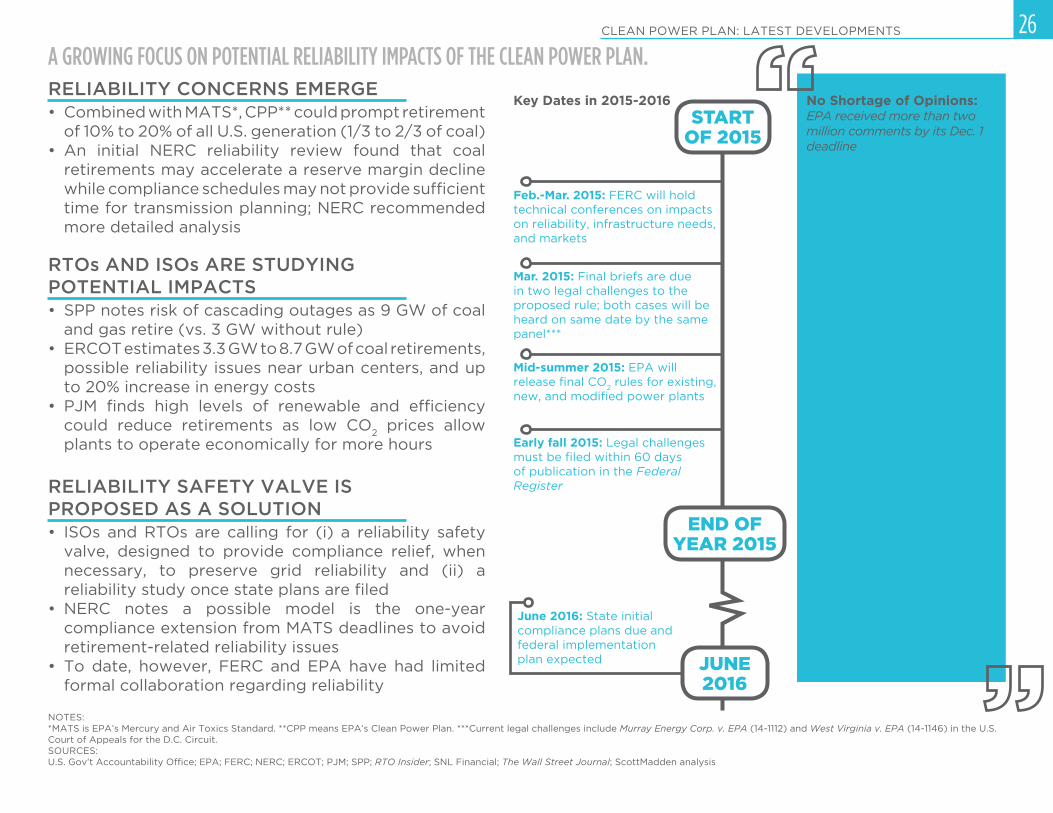
26CLEAN POWER PLAN: LATEST DEVELOPMENTS
NOTES:
*MATS is EPA’s Mercury and Air Toxics Standard. **CPP means EPA’s Clean Power Plan. ***Current legal challenges include Murray Energy Corp. v. EPA (14-1112) and West Virginia v. EPA (14-1146) in the U.S. Court of Appeals for the D.C. Circuit.
SOURCES:
U.S. Gov’t Accountability Office; EPA; FERC; NERC; ERCOT; PJM; SPP; RTO Insider; SNL Financial; The Wall Street Journal; ScottMadden analysis
• Combined with MATS*, CPP** could prompt retirement
of 10% to 20% of all U.S. generation (1/3 to 2/3 of coal)• An initial NERC reliability review found that coal
retirements may accelerate a reserve margin decline while compliance schedules may not provide sufficient time for transmission planning; NERC recommended
more detailed analysis
RELIABILITY CONCERNS EMERGE
A GROWING FOCUS ON POTENTIAL RELIABILITY IMPACTS OF THE CLEAN POWER PLAN.
• SPP notes risk of cascading outages as 9 GW of coal and gas retire (vs. 3 GW without rule)
• ERCOT estimates 3.3 GW to 8.7 GW of coal retirements, possible reliability issues near urban centers, and up
to 20% increase in energy costs
• PJM finds high levels of renewable and efficiency could reduce retirements as low CO
2 prices allow
plants to operate economically for more hours
RTOs AND ISOs ARE STUDYING POTENTIAL IMPACTS
• ISOs and RTOs are calling for (i) a reliability safety valve, designed to provide compliance relief, when necessary, to preserve grid reliability and (ii) a reliability study once state plans are filed
• NERC notes a possible model is the one-year compliance extension from MATS deadlines to avoid retirement-related reliability issues
• To date, however, FERC and EPA have had limited formal collaboration regarding reliability
RELIABILITY SAFETY VALVE ISPROPOSED AS A SOLUTION
Key Dates in 2015-2016
Feb.-Mar. 2015: FERC will hold
technical conferences on impacts
on reliability, infrastructure needs,
and markets
Mar. 2015: Final briefs are due
in two legal challenges to the
proposed rule; both cases will be
heard on same date by the same
panel***
Mid-summer 2015: EPA will
release final CO2 rules for existing,
new, and modified power plants
Early fall 2015: Legal challenges
must be filed within 60 days of publication in the Federal
Register
June 2016: State initial
compliance plans due and
federal implementation
plan expected JUNE2016
EPA’s proposed regulations are unlawful at the most fundamental level....[T]he Administration has decided to bypass Congress in implementing far-reaching Executive Branch energy and environmental policy goals.
–National Mining
Association
While EPA has made much of the supposed flexibility its ‘building blocks’ approach would provide, it in fact provides no flexibility for Texas as each of these blocks is likely unachievable, particularly in the timeframes required...
–Public Utilities
Commission of Texas
EPA should require full compliance by 2025 because the vast majority of emission reductions can be achieved early on in the compliance period.
–Sierra Club
No Shortage of Opinions: EPA received more than two
million comments by its Dec. 1
deadline

MANAGING THE UTILITY ENTERPRISE
The ScottMadden Energy Industry Update
28
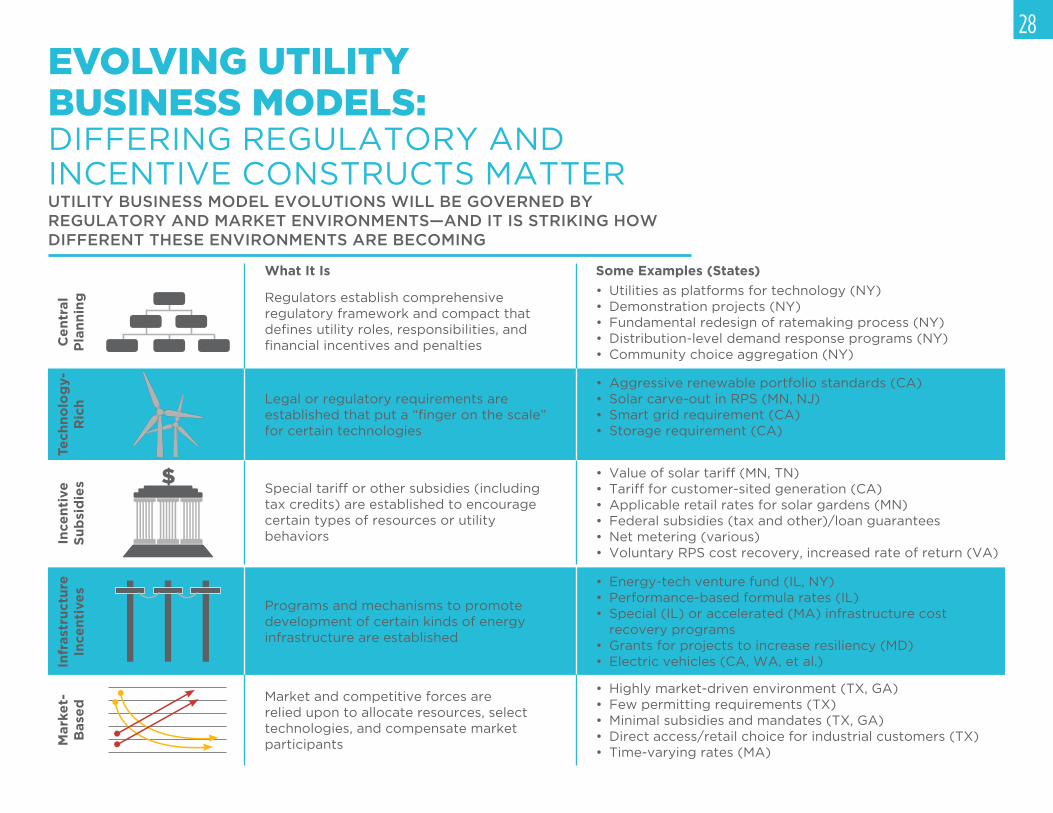
EVOLVING UTILITY BUSINESS MODELS:DIFFERING REGULATORY AND
INCENTIVE CONSTRUCTS MATTERUTILITY BUSINESS MODEL EVOLUTIONS WILL BE GOVERNED BY REGULATORY AND MARKET ENVIRONMENTS—AND IT IS STRIKING HOW DIFFERENT THESE ENVIRONMENTS ARE BECOMING
What It Is
Ce
ntr
al
Pla
nn
ing Regulators establish comprehensive
regulatory framework and compact that
defines utility roles, responsibilities, and financial incentives and penalties
• Utilities as platforms for technology (NY)
• Demonstration projects (NY)
• Fundamental redesign of ratemaking process (NY)
• Distribution-level demand response programs (NY)
• Community choice aggregation (NY)
Tech
no
log
y-
Ric
h Legal or regulatory requirements are
established that put a “finger on the scale” for certain technologies
• Aggressive renewable portfolio standards (CA)
• Solar carve-out in RPS (MN, NJ)• Smart grid requirement (CA)
• Storage requirement (CA)
Ince
nti
ve
Su
bsi
die
s
Special tariff or other subsidies (including
tax credits) are established to encourage
certain types of resources or utility
behaviors
• Value of solar tariff (MN, TN)• Tariff for customer-sited generation (CA)
• Applicable retail rates for solar gardens (MN)
• Federal subsidies (tax and other)/loan guarantees
• Net metering (various)
• Voluntary RPS cost recovery, increased rate of return (VA)
Infr
ast
ruct
ure
In
cen
tive
s
Programs and mechanisms to promote
development of certain kinds of energy
infrastructure are established
• Energy-tech venture fund (IL, NY)• Performance-based formula rates (IL)
• Special (IL) or accelerated (MA) infrastructure cost
recovery programs
• Grants for projects to increase resiliency (MD)
• Electric vehicles (CA, WA, et al.)
Mark
et-
Base
d Market and competitive forces are
relied upon to allocate resources, select technologies, and compensate market participants
• Highly market-driven environment (TX, GA)• Few permitting requirements (TX)
• Minimal subsidies and mandates (TX, GA)• Direct access/retail choice for industrial customers (TX)
• Time-varying rates (MA)
Some Examples (States)
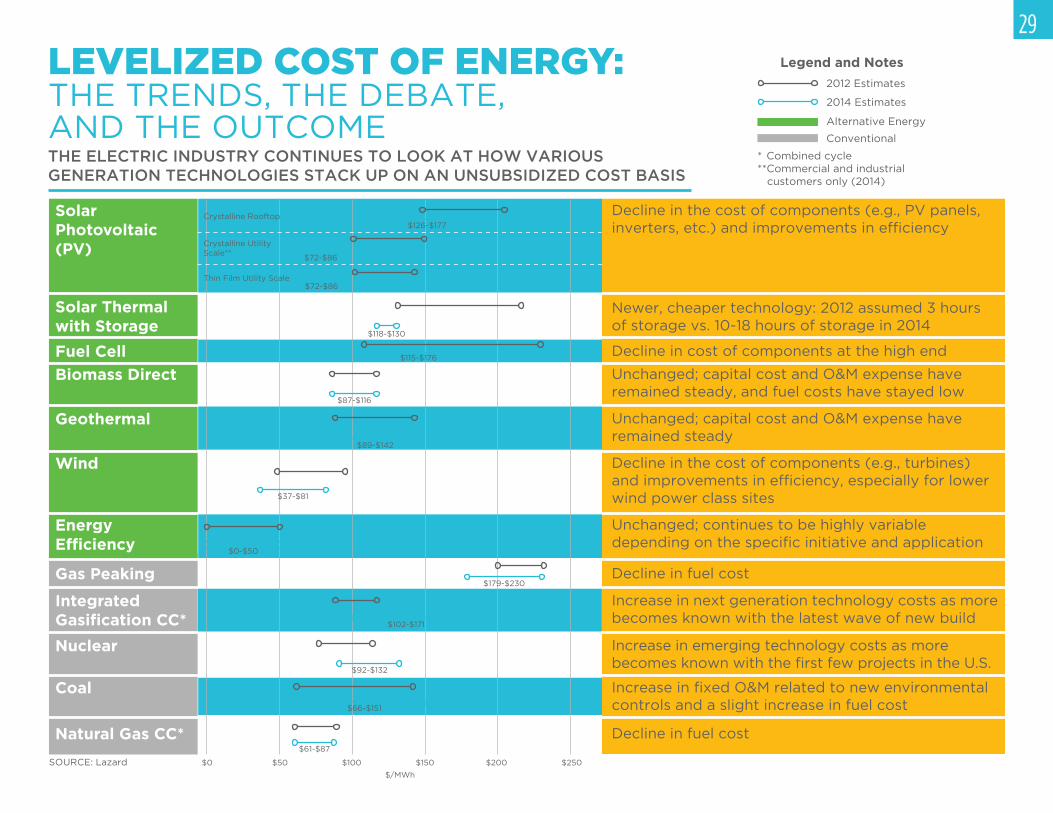
$0 $50 $100 $150 $200 $250
$126-$177
$72-$86
$72-$86
$118-$130
$115-$176
$87-$116
$89-$142
$37-$81
$0-$50
$179-$230
$102-$171
$92-$132
$66-$151
$61-$87
Crystalline Rooftop
Crystalline Utility Scale**
Thin Film Utility Scale
$/MWh
29
LEVELIZED COST OF ENERGY: THE TRENDS, THE DEBATE, AND THE OUTCOMETHE ELECTRIC INDUSTRY CONTINUES TO LOOK AT HOW VARIOUS GENERATION TECHNOLOGIES STACK UP ON AN UNSUBSIDIZED COST BASIS
Decline in the cost of components (e.g., PV panels, inverters, etc.) and improvements in efficiency
Newer, cheaper technology: 2012 assumed 3 hours of storage vs. 10-18 hours of storage in 2014
Decline in cost of components at the high end
Unchanged; capital cost and O&M expense have remained steady
Decline in the cost of components (e.g., turbines) and improvements in efficiency, especially for lower wind power class sites
Unchanged; continues to be highly variable depending on the specific initiative and application
Decline in fuel cost
Increase in emerging technology costs as more becomes known with the first few projects in the U.S.
Increase in next generation technology costs as more becomes known with the latest wave of new build
Increase in fixed O&M related to new environmental controls and a slight increase in fuel cost
Decline in fuel cost
Solar Photovoltaic (PV)
Solar Thermal with Storage
Fuel Cell
Geothermal
Wind
Energy Efficiency
Gas Peaking
Nuclear
Integrated Gasification CC*
Coal
Natural Gas CC*
Biomass Direct Unchanged; capital cost and O&M expense have remained steady, and fuel costs have stayed low
Legend and Notes
2012 Estimates
2014 Estimates
Alternative Energy
Conventional
* Combined cycle**Commercial and industrial customers only (2014)
SOURCE: Lazard
LEVELIZED COST OF ENERGY: THE TRENDS, THE DEBATE, AND THE OUTCOME
Point Counterpoint
30
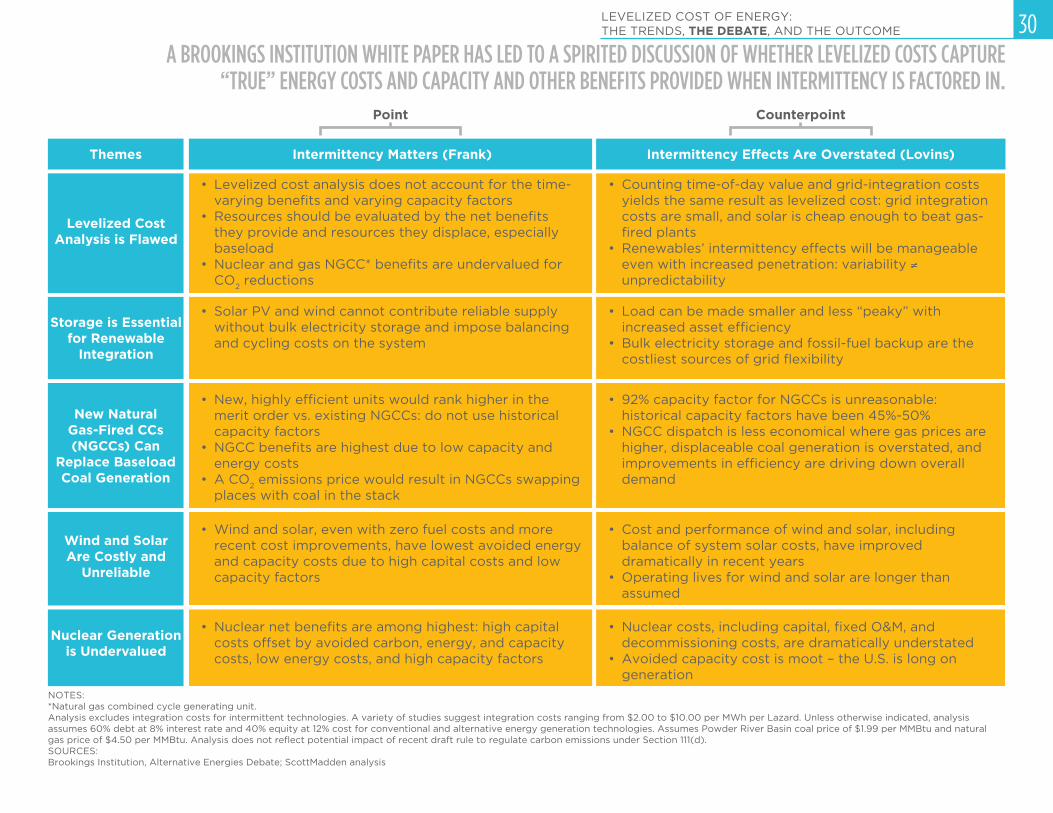
NOTES: *Natural gas combined cycle generating unit. Analysis excludes integration costs for intermittent technologies. A variety of studies suggest integration costs ranging from $2.00 to $10.00 per MWh per Lazard. Unless otherwise indicated, analysis assumes 60% debt at 8% interest rate and 40% equity at 12% cost for conventional and alternative energy generation technologies. Assumes Powder River Basin coal price of $1.99 per MMBtu and natural gas price of $4.50 per MMBtu. Analysis does not reflect potential impact of recent draft rule to regulate carbon emissions under Section 111(d).SOURCES:Brookings Institution, Alternative Energies Debate; ScottMadden analysis
Storage is Essential for Renewable
Integration
New Natural Gas-Fired CCs (NGCCs) Can
Replace Baseload Coal Generation
Wind and Solar Are Costly and
Unreliable
Themes
Levelized Cost Analysis is Flawed
Nuclear Generation is Undervalued
Intermittency Matters (Frank) Intermittency Effects Are Overstated (Lovins)
• Levelized cost analysis does not account for the time-varying benefits and varying capacity factors
• Resources should be evaluated by the net benefits they provide and resources they displace, especially baseload
• Nuclear and gas NGCC* benefits are undervalued for CO
2 reductions
• Counting time-of-day value and grid-integration costs yields the same result as levelized cost: grid integration costs are small, and solar is cheap enough to beat gas-fired plants
• Renewables’ intermittency effects will be manageable even with increased penetration: variability ≠ unpredictability
• Solar PV and wind cannot contribute reliable supply without bulk electricity storage and impose balancing and cycling costs on the system
• Load can be made smaller and less “peaky” with increased asset efficiency
• Bulk electricity storage and fossil-fuel backup are the costliest sources of grid flexibility
• New, highly efficient units would rank higher in the merit order vs. existing NGCCs: do not use historical capacity factors
• NGCC benefits are highest due to low capacity and energy costs
• A CO2 emissions price would result in NGCCs swapping
places with coal in the stack
• 92% capacity factor for NGCCs is unreasonable: historical capacity factors have been 45%-50%
• NGCC dispatch is less economical where gas prices are higher, displaceable coal generation is overstated, and improvements in efficiency are driving down overall demand
• Wind and solar, even with zero fuel costs and more recent cost improvements, have lowest avoided energy and capacity costs due to high capital costs and low capacity factors
• Cost and performance of wind and solar, including balance of system solar costs, have improved dramatically in recent years
• Operating lives for wind and solar are longer than assumed
• Nuclear net benefits are among highest: high capital costs offset by avoided carbon, energy, and capacity costs, low energy costs, and high capacity factors
• Nuclear costs, including capital, fixed O&M, and decommissioning costs, are dramatically understated
• Avoided capacity cost is moot – the U.S. is long on generation
A BROOKINGS INSTITUTION WHITE PAPER HAS LED TO A SPIRITED DISCUSSION OF WHETHER LEVELIZED COSTS CAPTURE “TRUE” ENERGY COSTS AND CAPACITY AND OTHER BENEFITS PROVIDED WHEN INTERMITTENCY IS FACTORED IN.
31
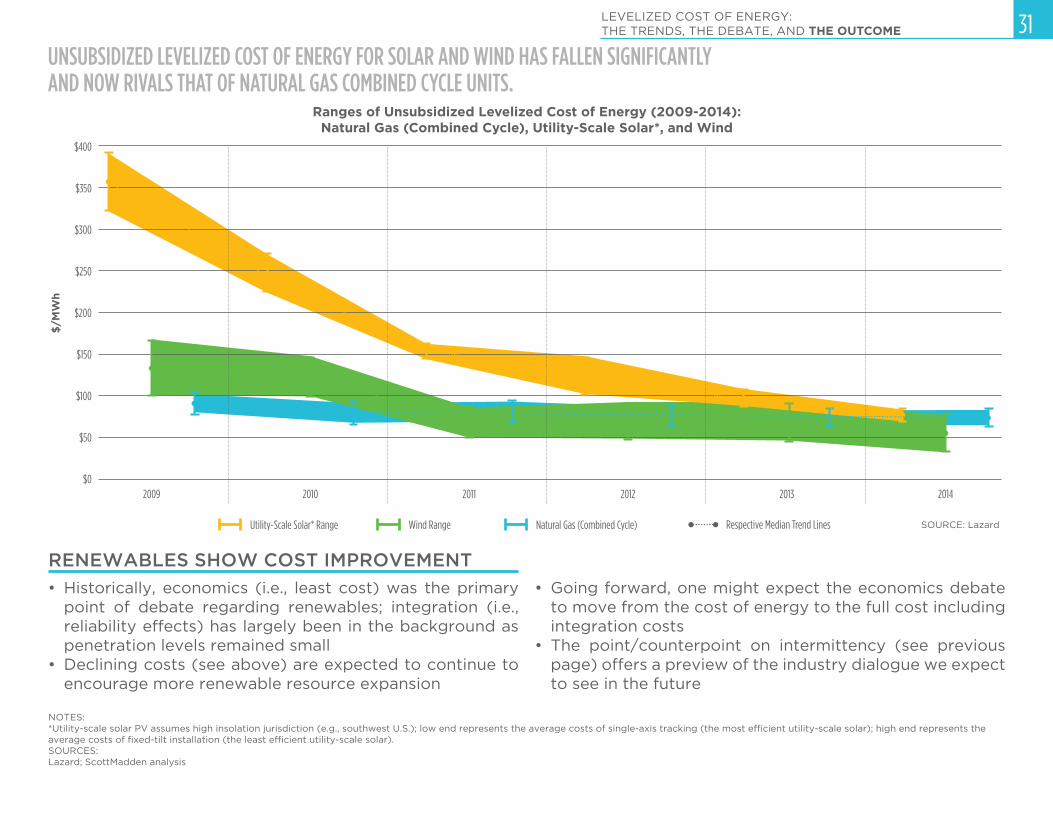
• Historically, economics (i.e., least cost) was the primary point of debate regarding renewables; integration (i.e., reliability effects) has largely been in the background as penetration levels remained small
• Declining costs (see above) are expected to continue to encourage more renewable resource expansion
• Going forward, one might expect the economics debate to move from the cost of energy to the full cost including integration costs
• The point/counterpoint on intermittency (see previous page) offers a preview of the industry dialogue we expect to see in the future
LEVELIZED COST OF ENERGY: THE TRENDS, THE DEBATE, AND THE OUTCOME
NOTES: *Utility-scale solar PV assumes high insolation jurisdiction (e.g., southwest U.S.); low end represents the average costs of single-axis tracking (the most efficient utility-scale solar); high end represents the average costs of fixed-tilt installation (the least efficient utility-scale solar).SOURCES: Lazard; ScottMadden analysis
UNSUBSIDIZED LEVELIZED COST OF ENERGY FOR SOLAR AND WIND HAS FALLEN SIGNIFICANTLY AND NOW RIVALS THAT OF NATURAL GAS COMBINED CYCLE UNITS.
Ranges of Unsubsidized Levelized Cost of Energy (2009-2014): Natural Gas (Combined Cycle), Utility-Scale Solar*, and Wind
$400
$350
$300
$250
$200
$150
$100
$/M
Wh
$50
$02009 2010 2011 2012 2013 2014
Utility-Scale Solar* Range Wind Range Natural Gas (Combined Cycle) Respective Median Trend Lines
RENEWABLES SHOW COST IMPROVEMENT
SOURCE: Lazard
32
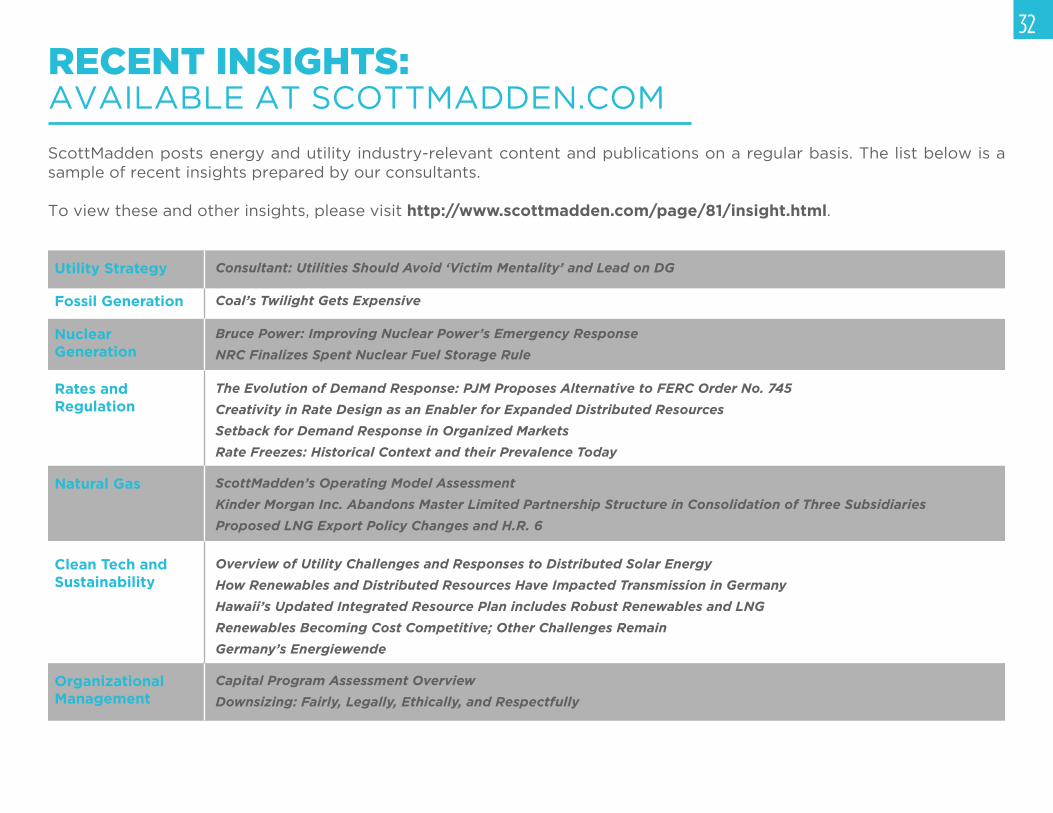
RECENT INSIGHTS: AVAILABLE AT SCOTTMADDEN.COM
ScottMadden posts energy and utility industry-relevant content and publications on a regular basis. The list below is a
sample of recent insights prepared by our consultants.
To view these and other insights, please visit http://www.scottmadden.com/page/81/insight.html.
Utility Strategy Consultant: Utilities Should Avoid ‘Victim Mentality’ and Lead on DG
Fossil Generation Coal’s Twilight Gets Expensive
Nuclear Generation
Bruce Power: Improving Nuclear Power’s Emergency Response
NRC Finalizes Spent Nuclear Fuel Storage Rule
Natural Gas ScottMadden’s Operating Model Assessment
Kinder Morgan Inc. Abandons Master Limited Partnership Structure in Consolidation of Three Subsidiaries
Proposed LNG Export Policy Changes and H.R. 6
Organizational Management
Capital Program Assessment Overview
Downsizing: Fairly, Legally, Ethically, and Respectfully
Rates and Regulation
The Evolution of Demand Response: PJM Proposes Alternative to FERC Order No. 745
Creativity in Rate Design as an Enabler for Expanded Distributed Resources
Setback for Demand Response in Organized Markets
Rate Freezes: Historical Context and their Prevalence Today
Clean Tech and Sustainability
Overview of Utility Challenges and Responses to Distributed Solar Energy
How Renewables and Distributed Resources Have Impacted Transmission in Germany
Hawaii’s Updated Integrated Resource Plan includes Robust Renewables and LNG
Renewables Becoming Cost Competitive; Other Challenges Remain
Germany’s Energiewende
33
Since 1983, we have been energy consultants. We have served more than 300 clients, including 20 of the top 20 energy
utilities. We have performed more than 2,400 projects across every energy utility business unit and every function. We
have helped our clients develop strategies, improve operations, reorganize companies, and implement initiatives. Our
broad and deep energy utility expertise is not theoretical—it is experience based.
Part of knowing where to go is understanding where you are. Before we begin any project, we listen to our client, understand
their situation, and then personalize our work to help them succeed.
Our clients trust us with their most important challenges. They know that, chances are, we have seen and solved a problem
similar to theirs. They know we will do what we say we will do, with integrity and tenacity, and we will produce real results.
The energy industry is our industry. We are personally invested in every project we take on.
For more information about our Energy Practice, contact Stuart Pearman.
ENERGY PRACTICE: SCOTTMADDEN KNOWS ENERGY.
Brad Kitchens
404-814-0020
Stuart PearmanPartner and Energy Practice [email protected]
919-781-4191
Chris VlahoplusPartner and Clean Tech & Sustainability Practice Leader [email protected]
919-781-4191
Greg LitraPartner and Energy, Clean Tech & Sustainability Research [email protected]
919-714-7613
ScottMadden Research provides clients with valuable insight on developments, trends, and practices in energy and
sustainability. Through its semi-annual ScottMadden Energy Industry Update and other publications, our research team
helps clients discern and analyze critical issues and inform their business decisions.
We also provide customized, project-based research and analytical support on matters of interest to our clients.
For more information about our research capabilities or content, see the Insight section of our web site or contact us.
RESEARCH
CONTACTS