the scope and nature of mentoring in michigan scope and nature of mentoring in michigan: ... scope...
TRANSCRIPT
The Scope and Nature of Mentoring in Michigan:
A Report on Wave VII of the Mentor Michigan Census
January 2010
Prepared by:
Kahle Research Solutions Inc. www.KahleResearch.com
Table of Contents
Introduction ..............................................................................................................................1
The Mentoring Funnel ..............................................................................................................2
Summary of Funnel Measures .................................................................................................3 Mentoring Organizations ............................................................................................3 Numbers of Mentors and Youth Served ....................................................................3 Returning Mentors vs. New Recruits .........................................................................4 Youth Served and Active Mentors by Program Type ...............................................5 New and Returning Mentors by Program Type .........................................................6 Mentor Screening ........................................................................................................8 Inquiries and Applications .........................................................................................9 Training and Support from Organizations .............................................................. 10 Types of Mentoring ................................................................................................... 13 Types of Mentoring by Program Type ..................................................................... 14
Demographics ......................................................................................................................... 15 Demographics of Mentors and Youth Served ......................................................... 15 Demographics of Youth and Mentors on Waiting Lists ......................................... 18
Capacity Changes in Mentoring Organizations ................................................................... 19 Mentoring Program Longevity ................................................................................. 19 Mentoring Capacity and Changes in Capacity........................................................ 20
Budget Changes in Mentoring Organizations ...................................................................... 21 Mentoring Program Annual Budgets and Changes in Budgets ............................ 21 Anticipated Budget Changes ................................................................................... 23 Changes in the Source of Mentoring Program Budgets ........................................ 23 FTE Changes ............................................................................................................. 25
Economic Impact on Mentoring Organizations.................................................................... 26 Observations by Respondents................................................................................. 26 Actions Implemented ................................................................................................ 28 Organizational Characteristics................................................................................. 29
Barriers to Serving More Children ........................................................................................ 30
Satisfaction with Mentor Michigan ........................................................................................ 34 Overall Satisfaction ................................................................................................... 34 Satisfaction with and Importance of Mentor Michigan Services ........................... 35 Ranking of Mentor Michigan Services ..................................................................... 36 Willingness to Pay Mentor Michigan Membership Fee .......................................... 37
Mentor Michigan Quality Standards for Youth Mentoring Programs ................................. 38 Meeting the Standards .............................................................................................. 38 Most Difficult Standard to Meet................................................................................ 41
Recommendations for Mentor Michigan .............................................................................. 42
Appendix A: Funnel Measures Summary Table Totals by Waves ...................................... 45
Appendix B: Background, Objectives and Method .............................................................. 48
List of Tables and Charts
Exhibit Title Page
1 Numbers of Active Mentors and Youth Served ..................................................3
2 Returning Mentors vs. New Recruits ..................................................................4
3 Youth Served and Active Mentors by Total and Program Type .......................5
4 Youth Served and Active Mentors Breakdown of “All Others” Category ........6
5 Returning Mentors vs. New Recruits by Program Type ....................................6
6 Screening Procedures Used by Mentoring Organizations ................................8
7 Average Number of Monthly Mentor Inquiries and Written Applications ........9
8 Mean Hours Spent on Mentor Training and Support from Organizations ..... 10
9 Minimum and Average Duration, and Minimum Intensity of Match ............... 11
10 Pre- and Post Match Training and Support for Mentors ................................. 12
11 Types of Mentoring Practiced by Organizations ............................................. 13
12 Types of Mentoring Practiced by Program Type ............................................. 14
13 Demographics of Mentors ................................................................................. 15
14 Demographics of Youth Served ........................................................................ 16
15 Demographics of Youth and Mentors on Waiting Lists .................................. 18
16 Length of Time Operating a Mentoring Program by Program Type ............... 19
17 Mentoring Capacity of Mentoring Program ...................................................... 20
18 Mentoring Program Annual Budget/Budget Change ....................................... 22
19 Anticipated Budget Changes in the Next Year ................................................. 23
20a Source of Mentoring Program Budget-FY 2008 and FY 2009 ......................... 24
20b “Other” Sources of Mentoring Budgets ........................................................... 24
21 FTE Changes in the Past Year ........................................................................... 25
22 Actions Observed Since August 31, 2008 ........................................................ 27
23 Actions Implemented Since August 31, 2008 ................................................... 28
24 Characteristics of Organizations by Operating Budget Size .......................... 29
25 Satisfaction with Mentor Michigan .................................................................... 34
26 Satisfaction with and Importance of Mentor Michigan Services .................... 35
27 Ranking of Mentor Michigan Services by Importance .................................... 36
28 Willingness to Pay a Mentor Michigan Membership Fee ................................ 37
29 Meeting the MM Quality Standards for Youth Mentoring Programs .............. 38
30 Meeting the MM Quality Standards for Youth Mentoring Programs by Program Size ......................................................................................... 39
31 Meeting the MM Quality Standards for Youth Mentoring Programs by Budget Size ............................................................................................ 40

32 Meeting the MM Quality Standards for Youth Mentoring Programs by Longevity of Program ........................................................................... 40
33 Most Difficult Program Standard to Meet ......................................................... 41
Funnel Measures Summary Table Totals by Wave .......................................... 45
Scope and Nature of Mentoring
Kahle Research Solutions Page 1 Final – 1/20/2010
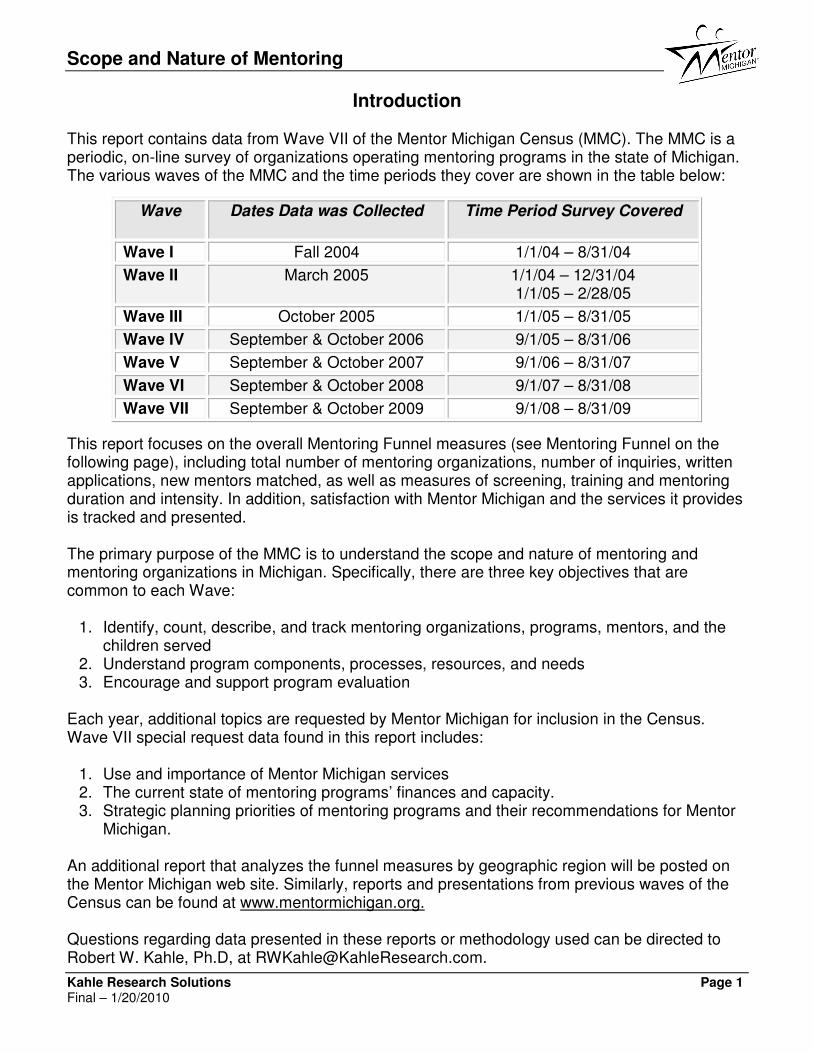
Introduction This report contains data from Wave VII of the Mentor Michigan Census (MMC). The MMC is a periodic, on-line survey of organizations operating mentoring programs in the state of Michigan. The various waves of the MMC and the time periods they cover are shown in the table below:
Wave Dates Data was Collected Time Period Survey Covered
Wave I Fall 2004 1/1/04 – 8/31/04
Wave II March 2005
1/1/04 – 12/31/04 1/1/05 – 2/28/05
Wave III October 2005 1/1/05 – 8/31/05
Wave IV September & October 2006 9/1/05 – 8/31/06
Wave V September & October 2007 9/1/06 – 8/31/07
Wave VI September & October 2008 9/1/07 – 8/31/08
Wave VII September & October 2009 9/1/08 – 8/31/09
This report focuses on the overall Mentoring Funnel measures (see Mentoring Funnel on the following page), including total number of mentoring organizations, number of inquiries, written applications, new mentors matched, as well as measures of screening, training and mentoring duration and intensity. In addition, satisfaction with Mentor Michigan and the services it provides is tracked and presented. The primary purpose of the MMC is to understand the scope and nature of mentoring and mentoring organizations in Michigan. Specifically, there are three key objectives that are common to each Wave:
1. Identify, count, describe, and track mentoring organizations, programs, mentors, and the children served
2. Understand program components, processes, resources, and needs 3. Encourage and support program evaluation
Each year, additional topics are requested by Mentor Michigan for inclusion in the Census. Wave VII special request data found in this report includes:
1. Use and importance of Mentor Michigan services 2. The current state of mentoring programs’ finances and capacity. 3. Strategic planning priorities of mentoring programs and their recommendations for Mentor
Michigan. An additional report that analyzes the funnel measures by geographic region will be posted on the Mentor Michigan web site. Similarly, reports and presentations from previous waves of the Census can be found at www.mentormichigan.org. Questions regarding data presented in these reports or methodology used can be directed to Robert W. Kahle, Ph.D, at [email protected].
Scope and Nature of Mentoring
Kahle Research Solutions Page 2 Final – 1/20/2010
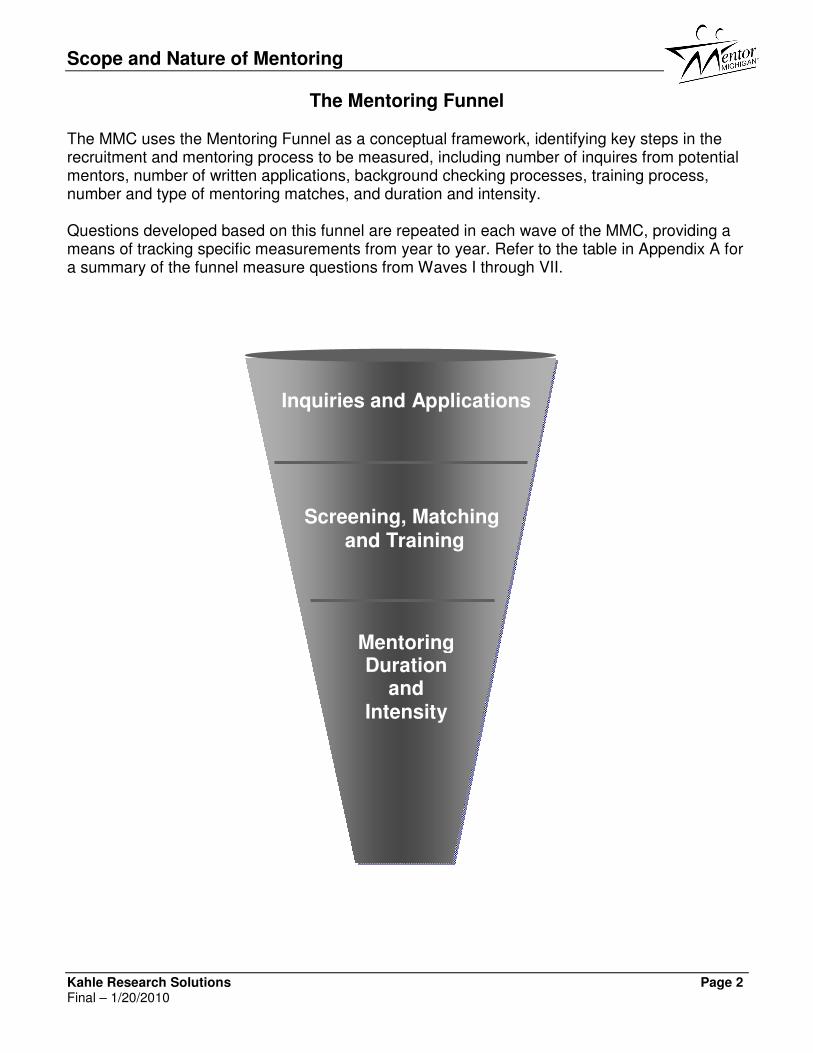
Inquiries and Applications
Screening, Matching and Training
Mentoring Duration
and Intensity
The Mentoring Funnel The MMC uses the Mentoring Funnel as a conceptual framework, identifying key steps in the recruitment and mentoring process to be measured, including number of inquires from potential mentors, number of written applications, background checking processes, training process, number and type of mentoring matches, and duration and intensity. Questions developed based on this funnel are repeated in each wave of the MMC, providing a means of tracking specific measurements from year to year. Refer to the table in Appendix A for a summary of the funnel measure questions from Waves I through VII.
Scope and Nature of Mentoring
Kahle Research Solutions Page 3 Final – 1/20/2010
9,108
10,54611,767
16,382
18,23217,051
19,578
16,574
27,090
20,294
28,283
25,883
22,916
28,536
0
5,000
10,000
15,000
20,000
25,000
30,000
35,000
Wave I Wave II Wave III Wave IV Wave V Wave VI Wave VII
Active Mentors Youth Served
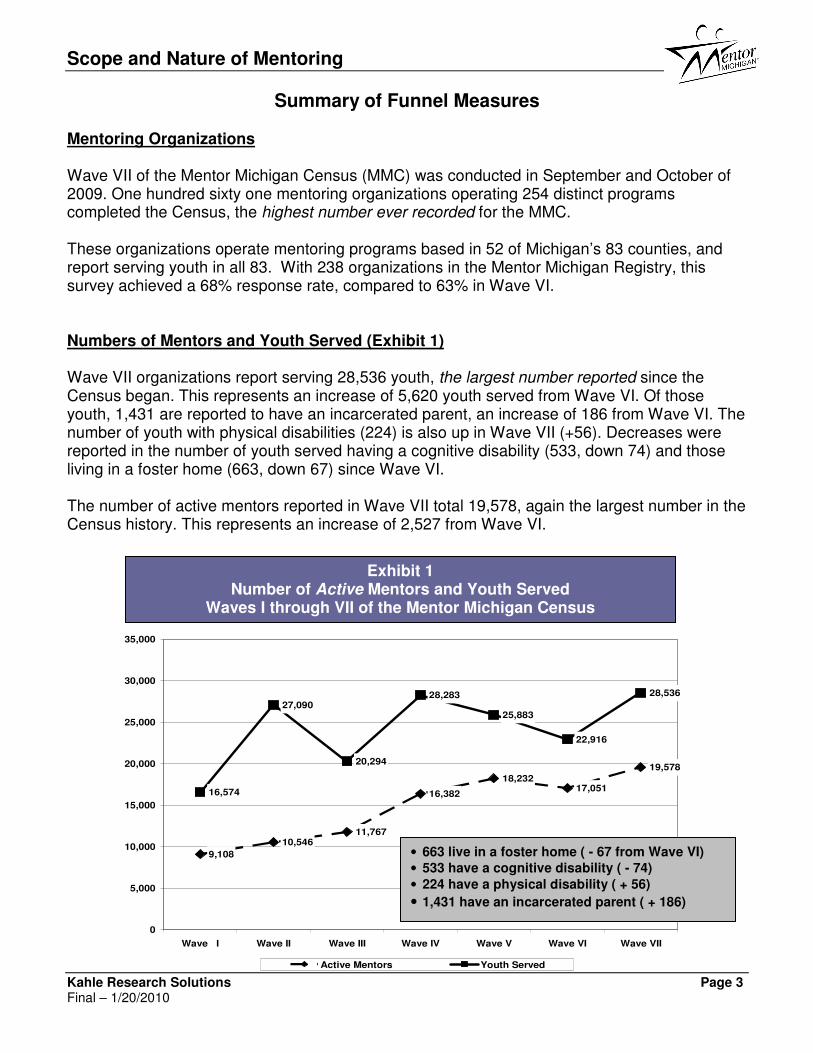
Summary of Funnel Measures Mentoring Organizations Wave VII of the Mentor Michigan Census (MMC) was conducted in September and October of 2009. One hundred sixty one mentoring organizations operating 254 distinct programs completed the Census, the highest number ever recorded for the MMC. These organizations operate mentoring programs based in 52 of Michigan’s 83 counties, and report serving youth in all 83. With 238 organizations in the Mentor Michigan Registry, this survey achieved a 68% response rate, compared to 63% in Wave VI. Numbers of Mentors and Youth Served (Exhibit 1) Wave VII organizations report serving 28,536 youth, the largest number reported since the Census began. This represents an increase of 5,620 youth served from Wave VI. Of those youth, 1,431 are reported to have an incarcerated parent, an increase of 186 from Wave VI. The number of youth with physical disabilities (224) is also up in Wave VII (+56). Decreases were reported in the number of youth served having a cognitive disability (533, down 74) and those living in a foster home (663, down 67) since Wave VI. The number of active mentors reported in Wave VII total 19,578, again the largest number in the Census history. This represents an increase of 2,527 from Wave VI.
• 663 live in a foster home ( - 67 from Wave VI) • 533 have a cognitive disability ( - 74)
• 224 have a physical disability ( + 56)
• 1,431 have an incarcerated parent ( + 186)
Exhibit 1 Number of Active Mentors and Youth Served
Waves I through VII of the Mentor Michigan Census
Scope and Nature of Mentoring
Kahle Research Solutions Page 4 Final – 1/20/2010
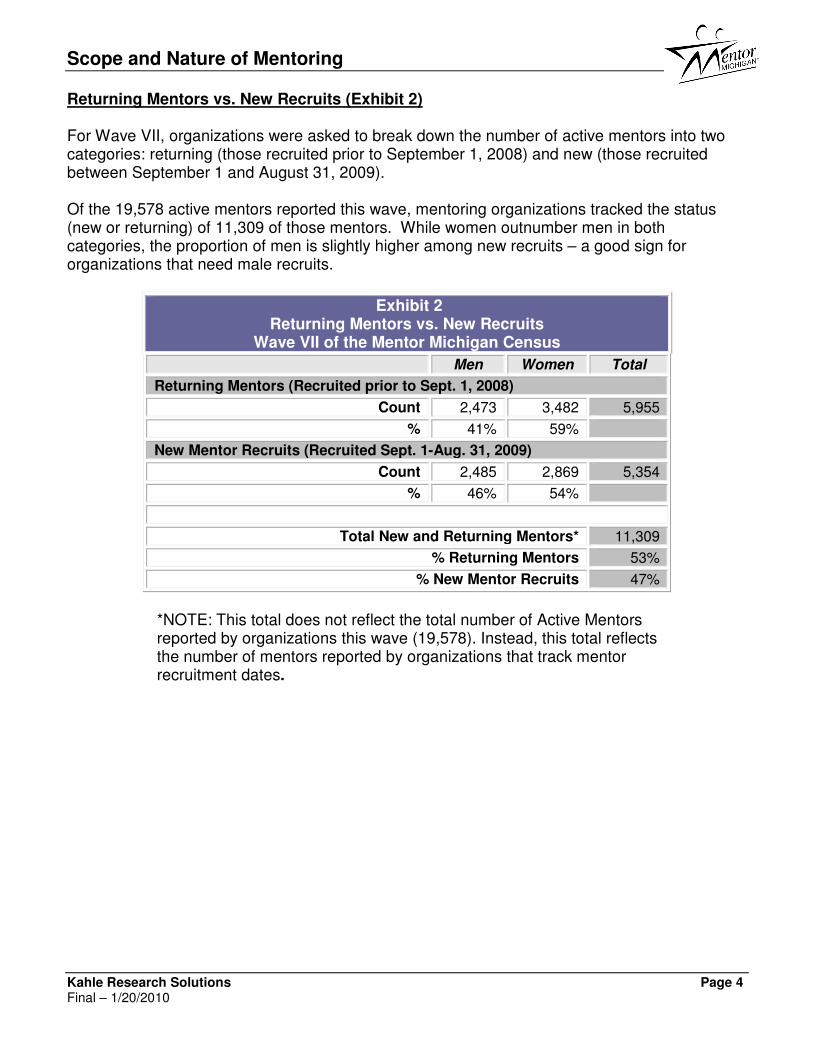
Returning Mentors vs. New Recruits (Exhibit 2) For Wave VII, organizations were asked to break down the number of active mentors into two categories: returning (those recruited prior to September 1, 2008) and new (those recruited between September 1 and August 31, 2009). Of the 19,578 active mentors reported this wave, mentoring organizations tracked the status (new or returning) of 11,309 of those mentors. While women outnumber men in both categories, the proportion of men is slightly higher among new recruits – a good sign for organizations that need male recruits.
Exhibit 2 Returning Mentors vs. New Recruits
Wave VII of the Mentor Michigan Census
Men Women Total
Returning Mentors (Recruited prior to Sept. 1, 2008)
Count 2,473 3,482 5,955
% 41% 59%
New Mentor Recruits (Recruited Sept. 1-Aug. 31, 2009)
Count 2,485 2,869 5,354
% 46% 54%
Total New and Returning Mentors* 11,309
% Returning Mentors 53%
% New Mentor Recruits 47%
*NOTE: This total does not reflect the total number of Active Mentors reported by organizations this wave (19,578). Instead, this total reflects the number of mentors reported by organizations that track mentor recruitment dates.

Scope and Nature of Mentoring
Kahle Research Solutions Page 5 Final – 1/20/2010
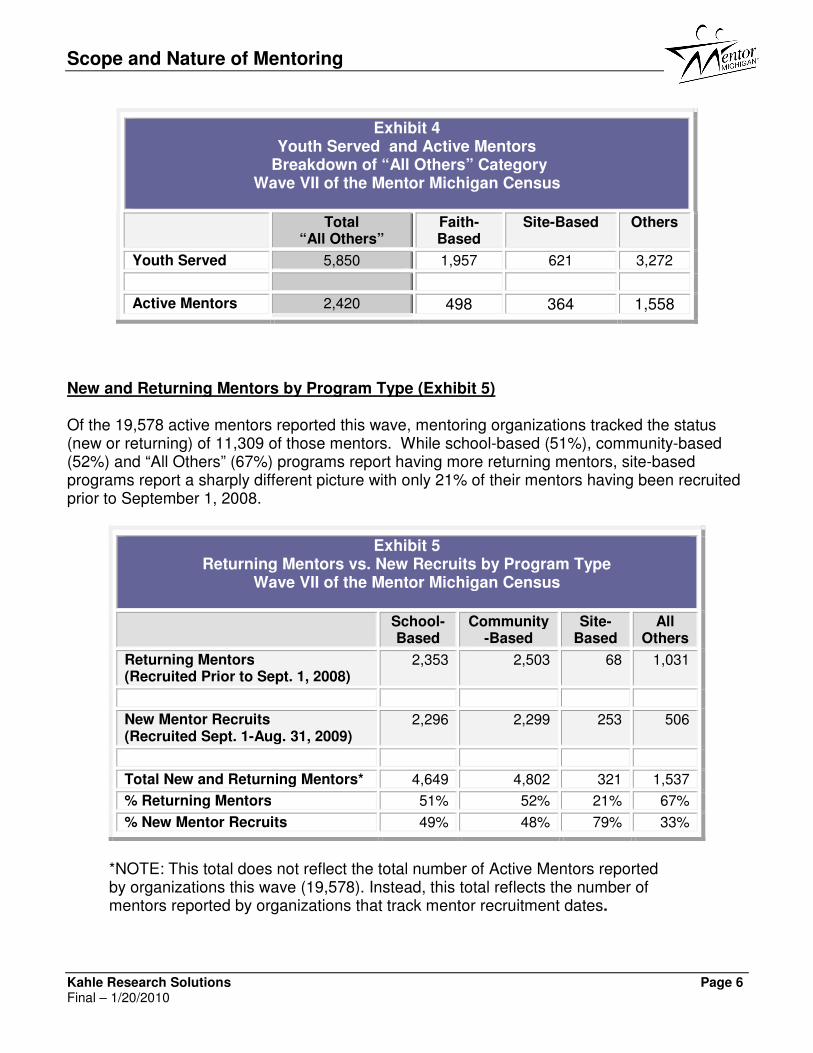
Youth Served and Active Mentors by Program Type (Exhibits 3 & 4) Overall, both the number of youth served and the number of active mentors increased in Wave VII (by 5,620 and 2,527 respectively) over Wave VI. While school-based programs report increases (3,365 and 1,194 respectively), community-based programs reported significant declines in both (-3,117 and -730 respectively). The increase in youth served and active mentors is mostly attributable to programs described as “All Others.” In past waves, “All Others” encompassed faith-based and site-based programs, as well as programs that self-identify as “Other”. In Wave VII, the category “Site-based” was added, thus removing those programs from the “All Others” category. Of the 5,850 youth served by “All Others” for Wave VII, 1,957 were served by faith-based programs and 621 by site-based programs. Four programs self-identified as “Other” account for 2,304 youth served in Wave VII; the remaining programs serve 968 youth. Similarly, two “Other” programs report having 849 active mentors, while the remaining programs make up the balance of 709 active mentors. Additional characteristics of the “Other” programs follow: • Sixty-three percent conduct group mentoring, with 25% describing their mentoring program
as one-to-one. • Forty-seven percent have been operating mentoring programs from one to five years; 42%
have been operating 10 years or more. • Twenty-two percent of programs have mentoring budgets less than $4,999; 17% have
budgets in the $10,000-24,999 range; and another 17% have budgets in the $25,000 – 49,999 range.
Exhibit 3 Youth Served and Active Mentors by Total and Program Type
Wave VI and VII of the Mentor Michigan Census
Total School- based
Community- based
All Others
Youth Served
Wave VI 22,916 11,826 10,612 478
Wave VII 28,536 15,191 7,495 5,850
Net Increase/ Decrease
5,620 3,365 -3,117 5,372
Active Mentors
Wave VI 17,051 9,437 7,257 357
Wave VII 19,578 10,631 6,527 2,420
Net Increase/ Decrease
2,527 1,194 -730 2,063
Scope and Nature of Mentoring
Kahle Research Solutions Page 6 Final – 1/20/2010
Exhibit 4 Youth Served and Active Mentors
Breakdown of “All Others” Category Wave VII of the Mentor Michigan Census
Total “All Others”
Faith-Based
Site-Based Others
Youth Served 5,850 1,957 621 3,272
Active Mentors 2,420 498 364 1,558
New and Returning Mentors by Program Type (Exhibit 5) Of the 19,578 active mentors reported this wave, mentoring organizations tracked the status (new or returning) of 11,309 of those mentors. While school-based (51%), community-based (52%) and “All Others” (67%) programs report having more returning mentors, site-based programs report a sharply different picture with only 21% of their mentors having been recruited prior to September 1, 2008.
Exhibit 5 Returning Mentors vs. New Recruits by Program Type
Wave VII of the Mentor Michigan Census
School- Based
Community-Based
Site-Based
All Others
Returning Mentors (Recruited Prior to Sept. 1, 2008)
2,353 2,503 68 1,031
New Mentor Recruits (Recruited Sept. 1-Aug. 31, 2009)
2,296 2,299 253 506
Total New and Returning Mentors* 4,649 4,802 321 1,537
% Returning Mentors 51% 52% 21% 67%
% New Mentor Recruits 49% 48% 79% 33%
*NOTE: This total does not reflect the total number of Active Mentors reported by organizations this wave (19,578). Instead, this total reflects the number of mentors reported by organizations that track mentor recruitment dates.
Scope and Nature of Mentoring
Kahle Research Solutions Page 7 Final – 1/20/2010
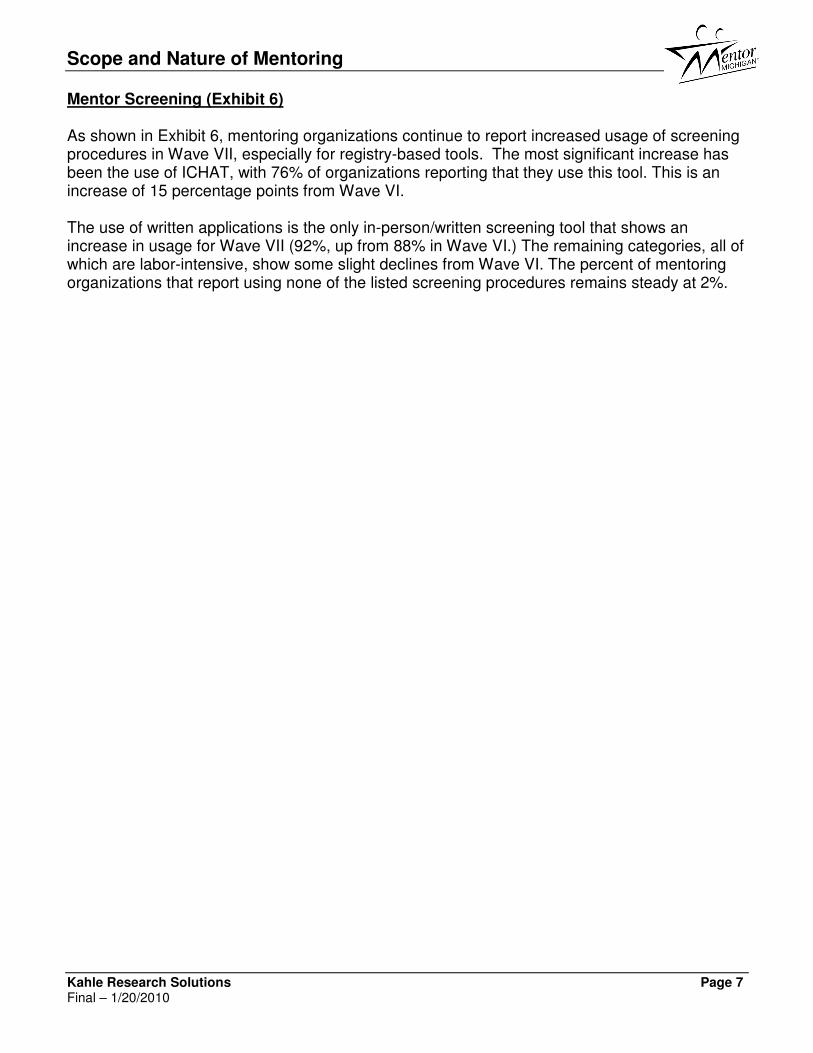
Mentor Screening (Exhibit 6) As shown in Exhibit 6, mentoring organizations continue to report increased usage of screening procedures in Wave VII, especially for registry-based tools. The most significant increase has been the use of ICHAT, with 76% of organizations reporting that they use this tool. This is an increase of 15 percentage points from Wave VI. The use of written applications is the only in-person/written screening tool that shows an increase in usage for Wave VII (92%, up from 88% in Wave VI.) The remaining categories, all of which are labor-intensive, show some slight declines from Wave VI. The percent of mentoring organizations that report using none of the listed screening procedures remains steady at 2%.
Scope and Nature of Mentoring
Kahle Research Solutions Page 8 Final – 1/20/2010
Exhibit 6 Screening Procedures Used by Mentoring Organizations
Waves I through VII of the Mentor Michigan Census
Screening Procedure
Wave I %
Wave II %
Wave III %
Wave IV %
Wave V %
Wave VI %
Wave VII %
Registry-Based
Criminal background check*
89 -- --- -- -- -- --
State criminal background check**
-- 79 80 79 80 -- --
Federal criminal background check**
-- 29 28 27 33 -- --
Fingerprint check*** -- -- 11 13 15 -- --
Name only state check (ICHAT)^^^
-- -- -- -- -- 61 76
Sex offender registry
60 64 59 62 69 69 74
Driving record/license
64 60 52 50 51 56 57
Child abuse registry 40 48 41 42 46 49 51
Name only national check^^^
-- -- -- -- -- 16 17
FBI fingerprint check^^^
-- -- -- -- -- 13 13
State only fingerprint check^^^
-- -- -- -- -- 9 10
Other national fingerprint check^^^
-- -- -- -- -- 3 3
In Person/ Written
Written application 83 84 87 77 85 88 92
Personal interview 86 87 84 81 84 89 87
Personal character references
79 81 81 76 81 82 81
Employment references
44 33 35 24 29 31 28
Home assessment** -- 12 15 8 13 14 13
Home visit** -- 9 11 8 11 17 12
None of the above 3 6 5 5 3 2 2
* Asked only in Wave I. ** Added in Wave II. *** Added in Wave III. ^Dropped in Wave III.
^^Added in Wave IV. ^^^Added in Wave VI. NOTE: Not all categories shown
Scope and Nature of Mentoring
Kahle Research Solutions Page 9 Final – 1/20/2010
728
831
1,023
1,115 1,130
1,374
1,460
497 520
746
666 658
746
815
0
500
1,000
1,500
Wave I:
1/1/04-
8/31/04
Wave II:
1/1/04-
12/31/04
Wave III:
1/1/05-
8/31/05
Wave IV:
9/1/05-
8/31/06
Wave V:
9/1/06-
8/31/07
Wave VI:
9/9/08-
10/10/08
Wave VII:
9/11/09-
10/9/09
Inquiries Applications
68% 63% 73% 46% 59% 66% 59%
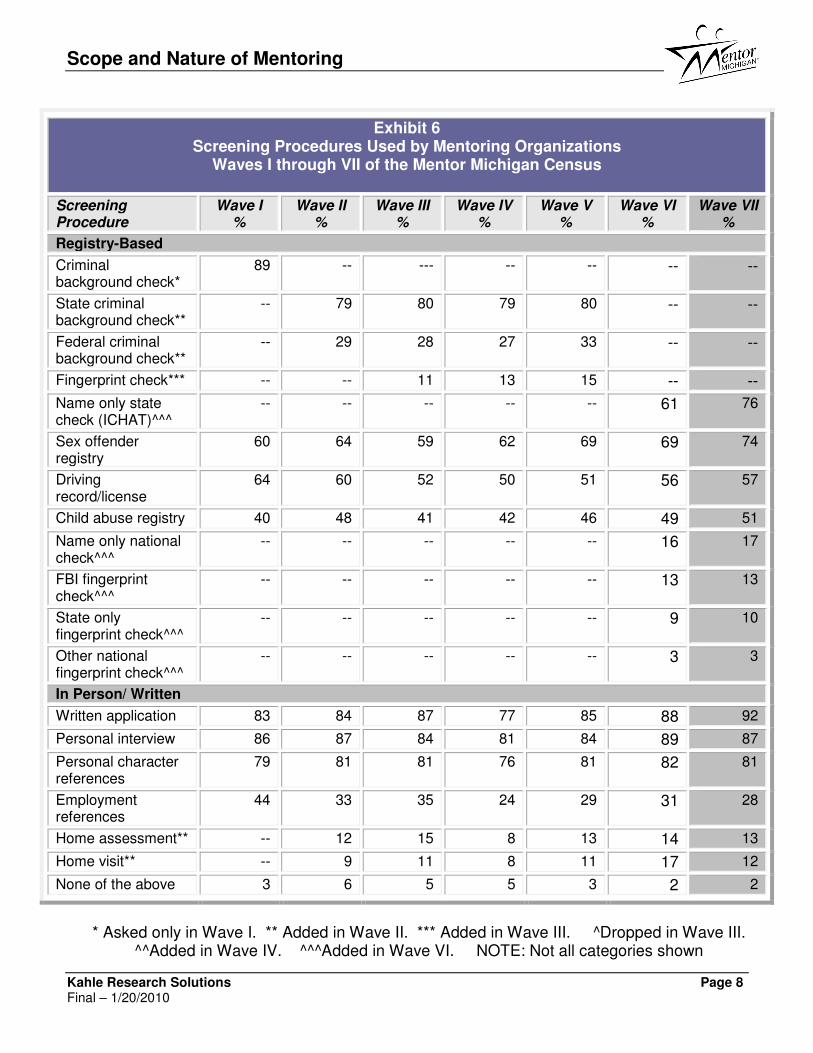
Inquiries and Applications (Exhibit 7) As shown in Exhibit 7, organizations report receiving 16,485 inquiries and 9,776 written applications in Wave VII, continuing an upward trend. This reflects an increase for both (2,929 and 822) from Wave VI. However, the number of serious inquires, as defined by the proportion of inquiries that led to written applications, is down seven percentage points from Wave VI. Fifty-six percent of mentor inquiries resulted in written applications for Wave VII; 66% was reported in Wave VI. While community-based programs report receiving more than twice as many inquiries as do school-based programs (9,766 to 4,852), 45% of community-based inquiries resulted in written applications. By contrast, 90% of school-based inquiries resulted in written applications. In Wave VI the percentages were very similar (50% and 90% respectively). With 437 inquiries and 240 written applications, 55% of site-based program inquiries result in written applications.
Exhibit 7 Average Number of Monthly Mentor Inquiries and Written Applications:
Waves I through VII of the Mentor Michigan Census Total Wave VII
mentor inquires= 16,485. Up 2,929 from Wave VI.
Total mentor written applications= 9,776 Up 822 from Wave VI.
Percent of mentor inquiries resulting in written applications. Down 7 percentage points from Wave VI.

Scope and Nature of Mentoring
Kahle Research Solutions Page 10 Final – 1/20/2010
Training and Support from Organizations (Exhibits 8, 9,10) Organizations requiring a minimum time of one hour per week for the mentor/youth match has increased from 55% in Wave VI to 58% in Wave VII, with a two hour or less minimum reported by fewer organizations (21% in Wave VI; 18% in Wave VII). The average time (duration) for a match has increased slightly from 13.5 months in Wave VI to 14.3 months in Wave VII. More than a third (33%) of organizations report that they currently provide eight or more hours of after-match training and support to their mentors. However, the mean number of hours of this training and support has decreased from 13.9 in Wave VI to 10.3 in Wave VII Exhibit 8 presents the mean number of hours of mentor training and support provided to mentors by organizations in Wave VI and VII. Exhibits 9 and 10 provide more detail on the intensity and duration of matches, as well as the hours spent on mentor training and support.
Exhibit 8 Mean Hours Spent on Mentor Training and Support from Organizations
Wave VI and VII of the Mentor Michigan Census
Wave VI Mean Wave VII Mean
Pre-match, face-to-face mentor training 6.3 hours 6.2 hours
Post-match, 1 year of mentor training & support 13.9 hours 10.3 hours
Minimum time per week required for match to meet in person
2.4 hours 2.2 hours
Minimum time requirement for duration of a match 9.4 months 9.7 months
Average time for a match 13.5 months 14.3 months

Scope and Nature of Mentoring
Kahle Research Solutions Page 11 Final – 1/20/2010
Exhibit 9 Minimum and Average Duration, and Minimum Intensity of Match
Waves VI and VII of the Mentor Michigan Census
Wave VI %
Wave VII %
Minimum time (duration) of mentor/youth match
No minimum 1 2
1-2 months 2 2
3-5 months 7 7
6-8 months 21 16
9-11 months 26 23
12 months 36 39
More than 12 Months, less than 2 years 0 1
More than 2 years, less than 5 years 2 2
More than 5 years 0 0
Don’t know 4 8
Average time (duration) for mentor/youth match
No minimum 0 2
1–2 months 3 1
3–5 months 5 4
6–8 months 13 15
9–11 months 21 19
12 months 21 17
More than 12 months, less than 2 years 8 8
More than 2 years, less than 5 years 15 12
More than 5 years 0 2
Don’t know 14 21
Minimum time (intensity) per week for mentor/youth match
No minimum 0 3
1 hour 55 58
2 hours 21 18
3 hours 5 2
4 hours 5 4
5 hours 0 0
6 hours 7 2
More than 6 hours 0 5
Don’t know 7 7
Scope and Nature of Mentoring
Kahle Research Solutions Page 12 Final – 1/20/2010
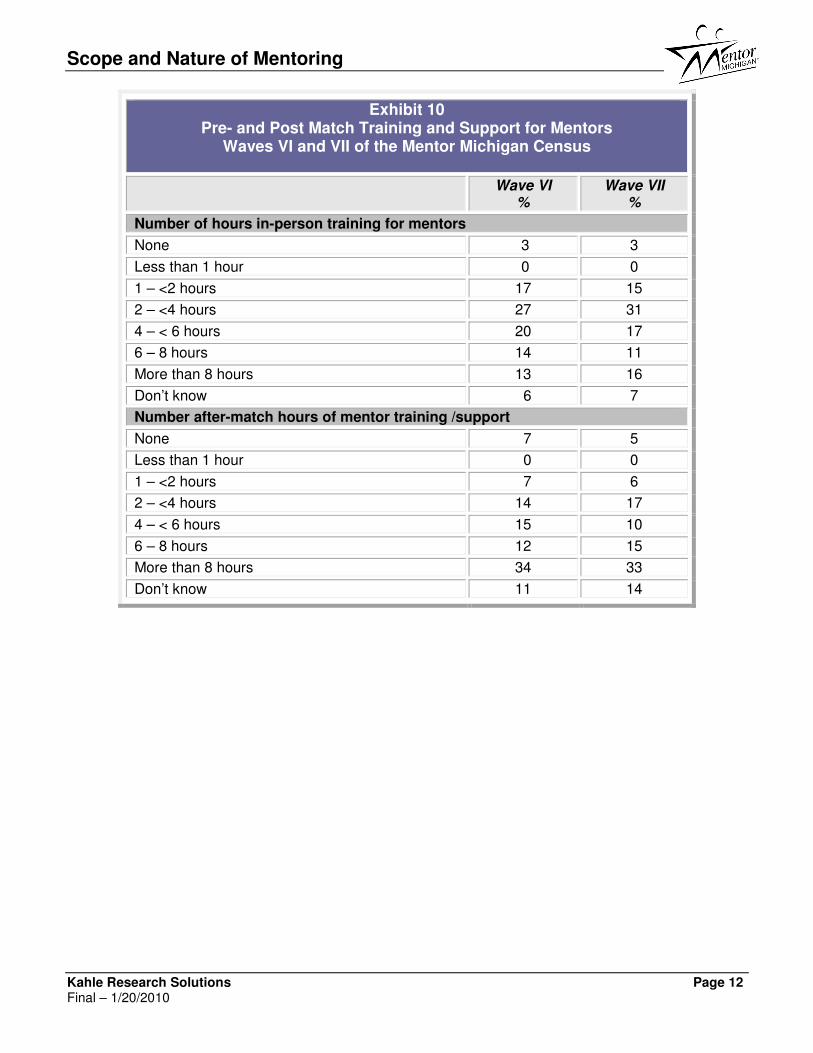
Exhibit 10 Pre- and Post Match Training and Support for Mentors
Waves VI and VII of the Mentor Michigan Census
Wave VI %
Wave VII %
Number of hours in-person training for mentors
None 3 3
Less than 1 hour 0 0
1 – <2 hours 17 15
2 – <4 hours 27 31
4 – < 6 hours 20 17
6 – 8 hours 14 11
More than 8 hours 13 16
Don’t know 6 7
Number after-match hours of mentor training /support
None 7 5
Less than 1 hour 0 0
1 – <2 hours 7 6
2 – <4 hours 14 17
4 – < 6 hours 15 10
6 – 8 hours 12 15
More than 8 hours 34 33
Don’t know 11 14
Scope and Nature of Mentoring
Kahle Research Solutions Page 13 Final – 1/20/2010
52%
19%
9%
19%
1%
63%
13%
7%
12%
1%
66%
13% 12%
8%
1%
55%
9% 8%
23%
4%
16%
6%
1%1%
11%
6%
1%
59%
12%
81%
5%6%
<1%
18%
70%
0%
10%
20%
30%
40%
50%
60%
70%
80%
90%
One to One Group Peer Team E-Mentoring
Wave I Wave II Wave III Wave IV Wave V Wave VI Wave VII
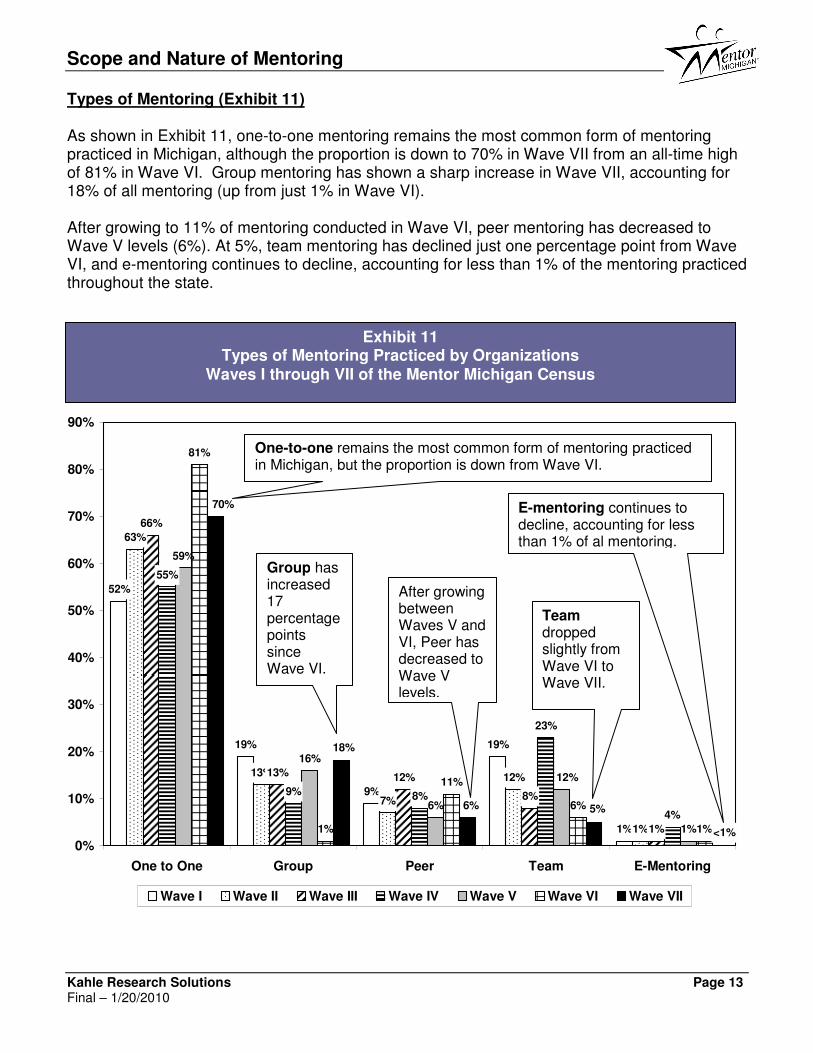
Types of Mentoring (Exhibit 11) As shown in Exhibit 11, one-to-one mentoring remains the most common form of mentoring practiced in Michigan, although the proportion is down to 70% in Wave VII from an all-time high of 81% in Wave VI. Group mentoring has shown a sharp increase in Wave VII, accounting for 18% of all mentoring (up from just 1% in Wave VI). After growing to 11% of mentoring conducted in Wave VI, peer mentoring has decreased to Wave V levels (6%). At 5%, team mentoring has declined just one percentage point from Wave VI, and e-mentoring continues to decline, accounting for less than 1% of the mentoring practiced throughout the state.
Types of Mentoring Practiced by Organizations Waves I through VI of the Mentor Michigan Census
Exhibit 11 Types of Mentoring Practiced by Organizations
Waves I through VII of the Mentor Michigan Census
One-to-one remains the most common form of mentoring practiced in Michigan, but the proportion is down from Wave VI.
Group has increased 17 percentage points since Wave VI.
After growing between Waves V and VI, Peer has decreased to Wave V levels.
Team dropped slightly from Wave VI to Wave VII.
E-mentoring continues to decline, accounting for less than 1% of al mentoring.

Scope and Nature of Mentoring
Kahle Research Solutions Page 14 Final – 1/20/2010
Wave VII
Site-Based Programs
Group,
23%
Peer
17%
Team
4%
E-
mentoring
<1%
One to one
46%
Wave VII
School-Based Programs
Peer
8%
Group
7%
Team 4% E-
mentoring
0%
One to one
81%
Wave VII
Community-Based Programs
One to one
87%
Peer
3%
Group
5%
Team 4% E-
mentoring
<1%
Types of Mentoring by Program Type (Exhibit 12) While the largest percentage of mentoring in site-based programs is one-to-one, these programs report a different mix of mentoring types than their school-based and community-based counterparts. Just 46% of the mentoring conducted by site-based programs is one-to-one, compared to 81% of school-based and 87% of community based programs. Group (23%) and peer (17%) mentoring are used much more frequently in site-based programs.
Exhibit 12 Types of Mentoring Practiced by Program Type
Waves I through VII of the Mentor Michigan Census
Scope and Nature of Mentoring
Kahle Research Solutions Page 15 Final – 1/20/2010
Demographics
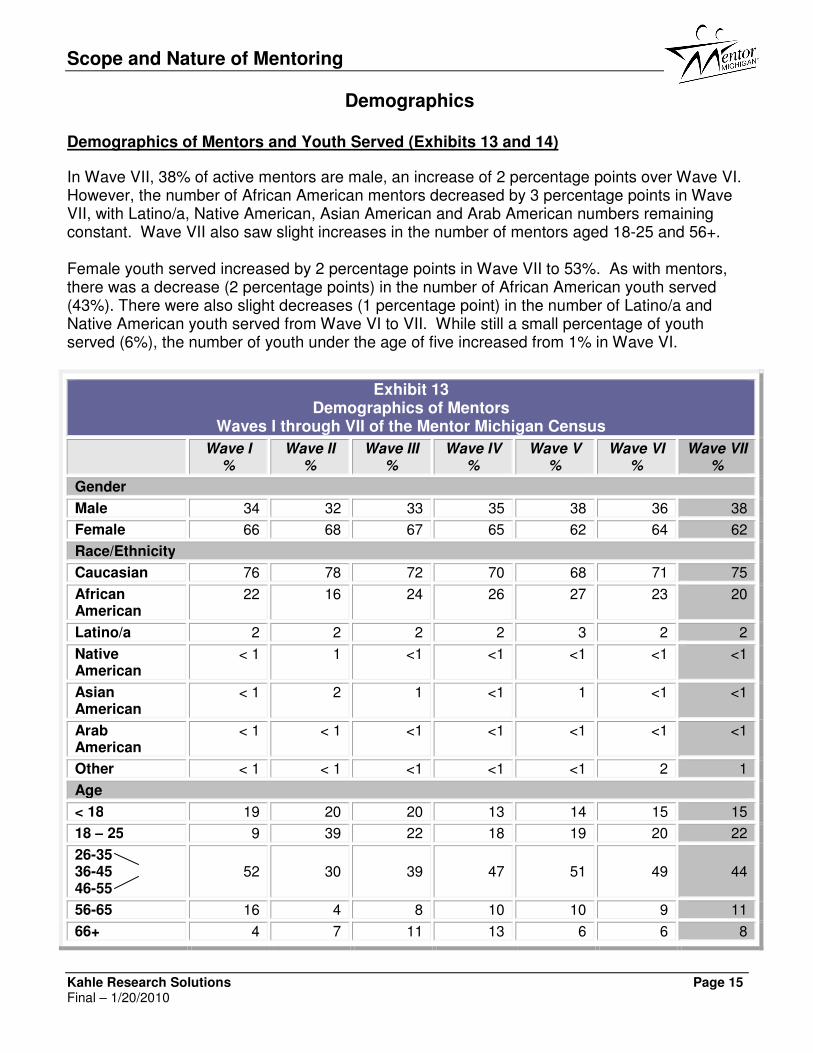
Demographics of Mentors and Youth Served (Exhibits 13 and 14)
In Wave VII, 38% of active mentors are male, an increase of 2 percentage points over Wave VI. However, the number of African American mentors decreased by 3 percentage points in Wave VII, with Latino/a, Native American, Asian American and Arab American numbers remaining constant. Wave VII also saw slight increases in the number of mentors aged 18-25 and 56+. Female youth served increased by 2 percentage points in Wave VII to 53%. As with mentors, there was a decrease (2 percentage points) in the number of African American youth served (43%). There were also slight decreases (1 percentage point) in the number of Latino/a and Native American youth served from Wave VI to VII. While still a small percentage of youth served (6%), the number of youth under the age of five increased from 1% in Wave VI.
Exhibit 13 Demographics of Mentors
Waves I through VII of the Mentor Michigan Census
Wave I %
Wave II %
Wave III %
Wave IV %
Wave V %
Wave VI %
Wave VII %
Gender
Male 34 32 33 35 38 36 38
Female 66 68 67 65 62 64 62
Race/Ethnicity
Caucasian 76 78 72 70 68 71 75
African American
22 16 24 26 27 23 20
Latino/a 2 2 2 2 3 2 2
Native American
< 1 1 <1 <1 <1 <1 <1
Asian American
< 1 2 1 <1 1 <1 <1
Arab American
< 1 < 1 <1 <1 <1 <1 <1
Other < 1 < 1 <1 <1 <1 2 1
Age
< 18 19 20 20 13 14 15 15
18 – 25 9 39 22 18 19 20 22
26-35 36-45 46-55
52
30
39
47
51
49
44
56-65 16 4 8 10 10 9 11
66+ 4 7 11 13 6 6 8

Scope and Nature of Mentoring
Kahle Research Solutions Page 16 Final – 1/20/2010
Exhibit 14 Demographics of Youth Served
Waves I through VII of the Mentor Michigan Census
Wave I %
Wave II %
Wave III %
Wave IV %
Wave V %
Wave VI %
Wave VII %
Gender
Male 40 51 46 31 48 49 47
Female 60 49 54 69 52 51 53
Race/Ethnicity
Caucasian 44 57 52 56 46 40 43
African American
47 36 36 33 42 45 43
Latino/a 5 4 6 6 7 9 8
Native American
2 1 1 1 2 2 1
Asian American
0 <1 1 1 <1 <1 <1
Arab American
< 1 < 1 <1 <1 <1 <1 <1
Other 0 2 3 3 2 3 4
Age
< 5 0 4 21 6 2 1 6
6-11 35 59 38 56 53 42 46
12-14 45 17 21 22 28 29 25
15-18 18 20 18 14 16 25 21
19-25 2 < 1 2 1 <1 2 2
Scope and Nature of Mentoring
Kahle Research Solutions Page 17 Final – 1/20/2010
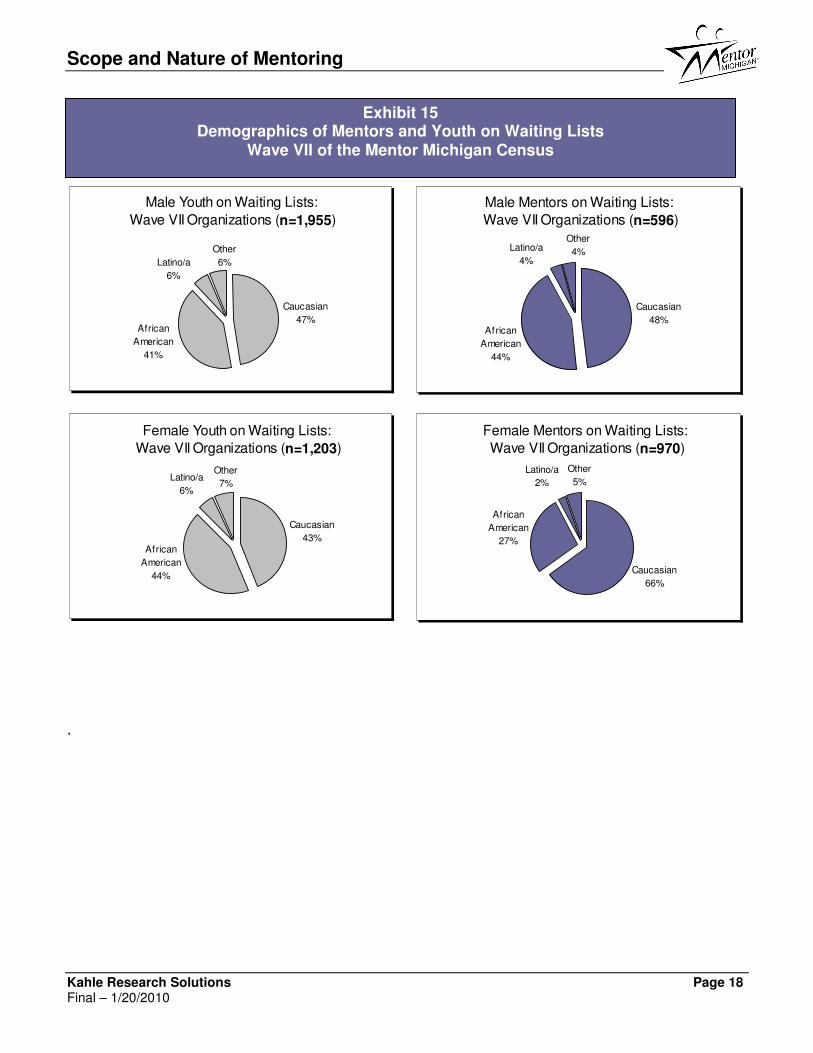
Demographics of Youth and Mentors on Waiting Lists (Exhibit 15) In Wave VII, a total of 3,568 youth (up from 3,028 in Wave VI) and 1,674 mentors (up from 999 in Wave VI) were reported to be on waiting lists. Of those, gender and race/ethnicity data was available for 52% of youth and 53% of mentors (see Exhibit 15). This is substantially less than the data available in previous years. According to Wave VII respondents, there are 3.3 times as many male youth as there are mentors on waiting lists for matches. Forty-one percent of male youth are African American, while Latino youth account for 6% of males on the waiting lists. There are 1.2 times as many female youth as there are mentors on waiting lists for matches. The racial breakdown of female youth on waiting lists is similar to that of the male youth, with 44% African American, and 6% Latina. The need for male mentors, especially African American men, is evident in all geographic areas. In Southeast Michigan, always an area of high need, 187 African American men are on waiting lists to be matched while 227 African American boys are waiting for a mentor. The need for African American female mentors is also great. While 44% of the wait listed females statewide are African American, only 27% of the female mentors are African American. A significant change in waiting list demographics has occurred in the Northern/UP area. In Wave VI, there were five African American boys waiting to be matched and no African American mentors on waiting lists. In Wave VII, organizations report that 105 African American boys are waiting to be matched while only 8 African American men are on waiting lists.
Scope and Nature of Mentoring
Kahle Research Solutions Page 18 Final – 1/20/2010
Male Youth on Waiting Lists:
Wave VII Organizations (n=1,955)
Caucasian
47%African
American
41%
Latino/a
6%
Other
6%
Male Mentors on Waiting Lists:
Wave VII Organizations (n=596)
Caucasian
48%African
American
44%
Other
4%Latino/a
4%
Female Youth on Waiting Lists:
Wave VII Organizations (n=1,203)
Caucasian
43%
Latino/a
6%
Other
7%
African
American
44%
Female Mentors on Waiting Lists:
Wave VII Organizations (n=970)
Caucasian
66%
African
American
27%
Other
5%
Latino/a
2%
.
Exhibit 15 Demographics of Mentors and Youth on Waiting Lists
Wave VII of the Mentor Michigan Census
Scope and Nature of Mentoring
Kahle Research Solutions Page 19 Final – 1/20/2010
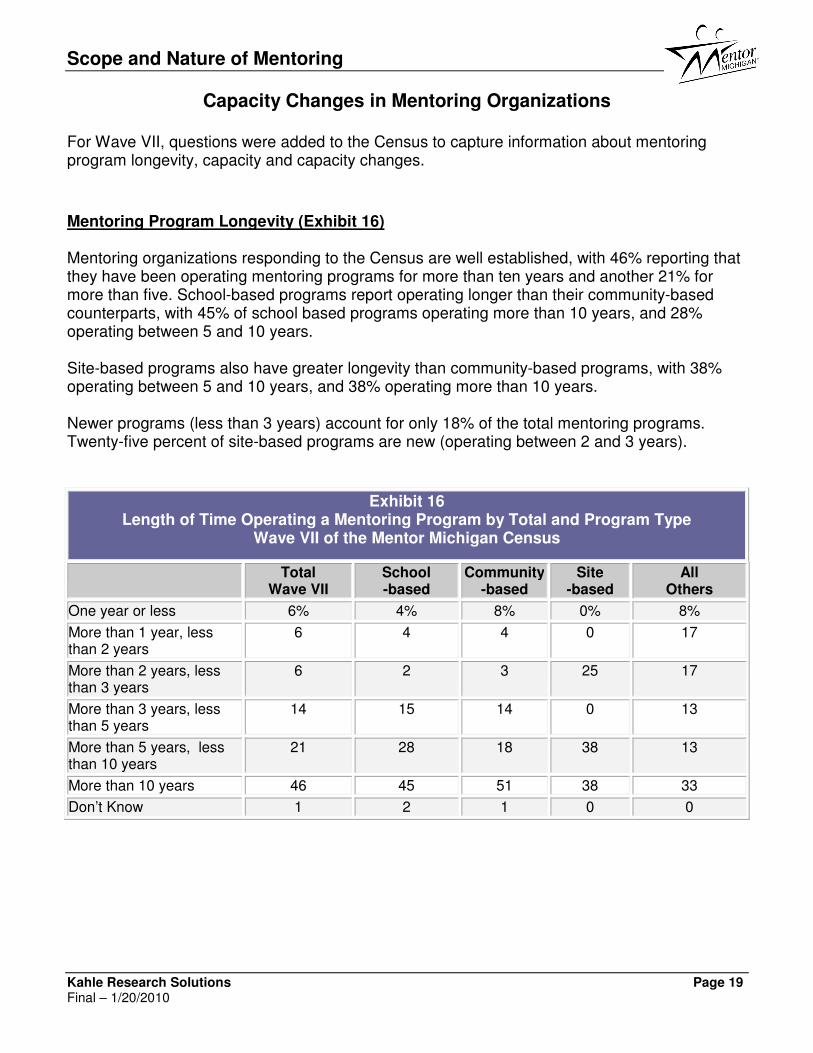
Capacity Changes in Mentoring Organizations For Wave VII, questions were added to the Census to capture information about mentoring program longevity, capacity and capacity changes.
Mentoring Program Longevity (Exhibit 16) Mentoring organizations responding to the Census are well established, with 46% reporting that they have been operating mentoring programs for more than ten years and another 21% for more than five. School-based programs report operating longer than their community-based counterparts, with 45% of school based programs operating more than 10 years, and 28% operating between 5 and 10 years. Site-based programs also have greater longevity than community-based programs, with 38% operating between 5 and 10 years, and 38% operating more than 10 years. Newer programs (less than 3 years) account for only 18% of the total mentoring programs. Twenty-five percent of site-based programs are new (operating between 2 and 3 years).
Exhibit 16 Length of Time Operating a Mentoring Program by Total and Program Type
Wave VII of the Mentor Michigan Census
Total Wave VII
School -based
Community-based
Site -based
All Others
One year or less 6% 4% 8% 0% 8%
More than 1 year, less than 2 years
6 4 4 0 17
More than 2 years, less than 3 years
6 2 3 25 17
More than 3 years, less than 5 years
14 15 14 0 13
More than 5 years, less than 10 years
21 28 18 38 13
More than 10 years 46 45 51 38 33
Don’t Know 1 2 1 0 0
Scope and Nature of Mentoring
Kahle Research Solutions Page 20 Final – 1/20/2010
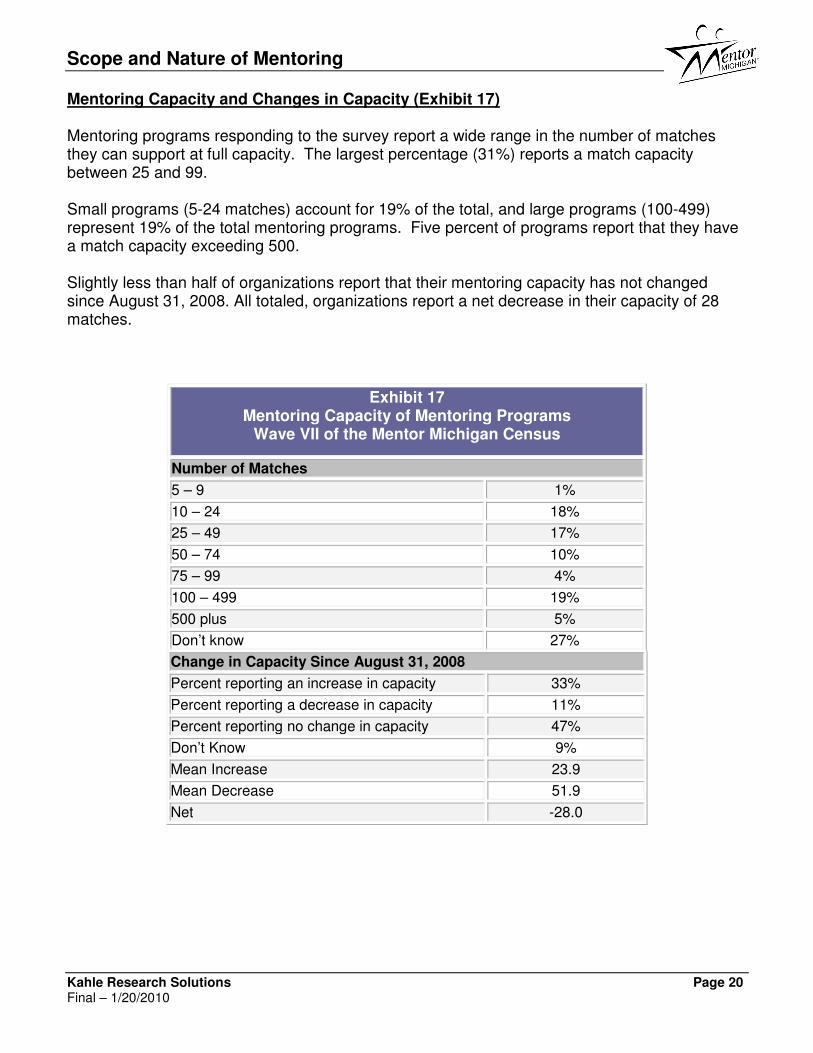
Mentoring Capacity and Changes in Capacity (Exhibit 17) Mentoring programs responding to the survey report a wide range in the number of matches they can support at full capacity. The largest percentage (31%) reports a match capacity between 25 and 99. Small programs (5-24 matches) account for 19% of the total, and large programs (100-499) represent 19% of the total mentoring programs. Five percent of programs report that they have a match capacity exceeding 500. Slightly less than half of organizations report that their mentoring capacity has not changed since August 31, 2008. All totaled, organizations report a net decrease in their capacity of 28 matches.
Exhibit 17 Mentoring Capacity of Mentoring Programs
Wave VII of the Mentor Michigan Census
Number of Matches
5 – 9 1%
10 – 24 18%
25 – 49 17%
50 – 74 10%
75 – 99 4%
100 – 499 19%
500 plus 5%
Don’t know 27%
Change in Capacity Since August 31, 2008
Percent reporting an increase in capacity 33%
Percent reporting a decrease in capacity 11%
Percent reporting no change in capacity 47%
Don’t Know 9%
Mean Increase 23.9
Mean Decrease 51.9
Net -28.0
Scope and Nature of Mentoring
Kahle Research Solutions Page 21 Final – 1/20/2010
Budget Changes in Mentoring Organizations
Mentoring Program Annual Budgets and Changes in Budgets (Exhibit 18) Twenty percent of mentoring programs report having small budgets of $5,000 or less. Most (28%) of school-based programs report having budgets this size, as do 25% of site-based and 14% of community-based programs. The percentage of programs with budgets between $5,000 and $49,999 total 25%. Similar percentages are reported across all types of programs. While 10% of the total programs reporting indicate that their budgets are between $50,000 and $99,999, 38% (3) of site-based programs report having budgets this size. In addition, while only a small percentage of programs (5%) have large budgets in excess of $500,000, 8% of community-based programs report this budget size. Twenty-five percent of mentoring programs have experienced a decrease in their budgets since one year ago, accounting for an average reduction of $23,318, or an average net reduction of $9,429. Only programs labeled “All Others” report a net increase in program budgets averaging $7,842. Ten percent of organizations report having their budgets increased in the last year, none of which are site-based. However, more than half (55%) report no change in their budget over the last year. This is true for 75% of site-based, 66% of school-based, and 45% of community-based programs. A breakdown of mentoring program budget size and change in budget can be found in Exhibit 18.

Scope and Nature of Mentoring
Kahle Research Solutions Page 22 Final – 1/20/2010
Exhibit 18 Mentoring Program Annual Budget / Budget Change by Total and Program Type
Wave VII of the Mentor Michigan Census
Total Wave VII
School -based
Community-based
Site -based
All Others
Number of Programs 155 47 76 8 24
Budget Size
0-$4,999 20% 28% 14% 25% 21%
$5,000-9,999 5 4 5 0 4
$10,000-24,999 12 15 8 13 21
$25,000-49,999 8 2 9 13 17
$50,000-99,999 10 4 12 38 8
$100,000-199,999 12 13 16 0 4
$200,000-299,999 9 11 11 0 4
$300,000-399,999 6 11 4 13 4
$400,000-499,999 3 4 1 0 4
$500,000 or more 5 2 8 0 0
Don’t Know 10 6 12 0 13
Change in Budget Since August 31, 2008
% that experienced an increase 10% 4% 13% 0% 17
% that experienced a decrease 25% 23 29 25 13
% that experienced no change 55% 66 45 75 63
Don’t Know 10% 6 13 0 8
Mean Increase $18,889 $1,650 $24,593 $0 $13,250
Mean Decrease $23,318 $17,539 $38,247 $12,750 $5,408
Net -$9,429 -$15,889 -$13,654 -$12,750 $7,842

Scope and Nature of Mentoring
Kahle Research Solutions Page 23 Final – 1/20/2010
Anticipated Budget Changes (Exhibit 19) Forty-two percent of organizations report that they do not anticipate a change in their budgets over the next year. While one quarter of mentoring programs report that they are anticipating a budget decrease (with a mean anticipated decrease of 33%), fully 15% indicate that they anticipate their budgets will increase. The mean anticipated percentage increase for these programs is reported to be 32%
Exhibit 19 Anticipated Budget Changes in the Next Year
Wave VII of the Mentor Michigan Census
Percent of organizations anticipating a budget increase 15%
Percent of organizations anticipating a budget decrease 25%
Percent of organizations anticipating no change 42%
Don’t Know 19%
Mean anticipated percentage increase 32%
Mean anticipated percentage decrease 33%
Net -1%
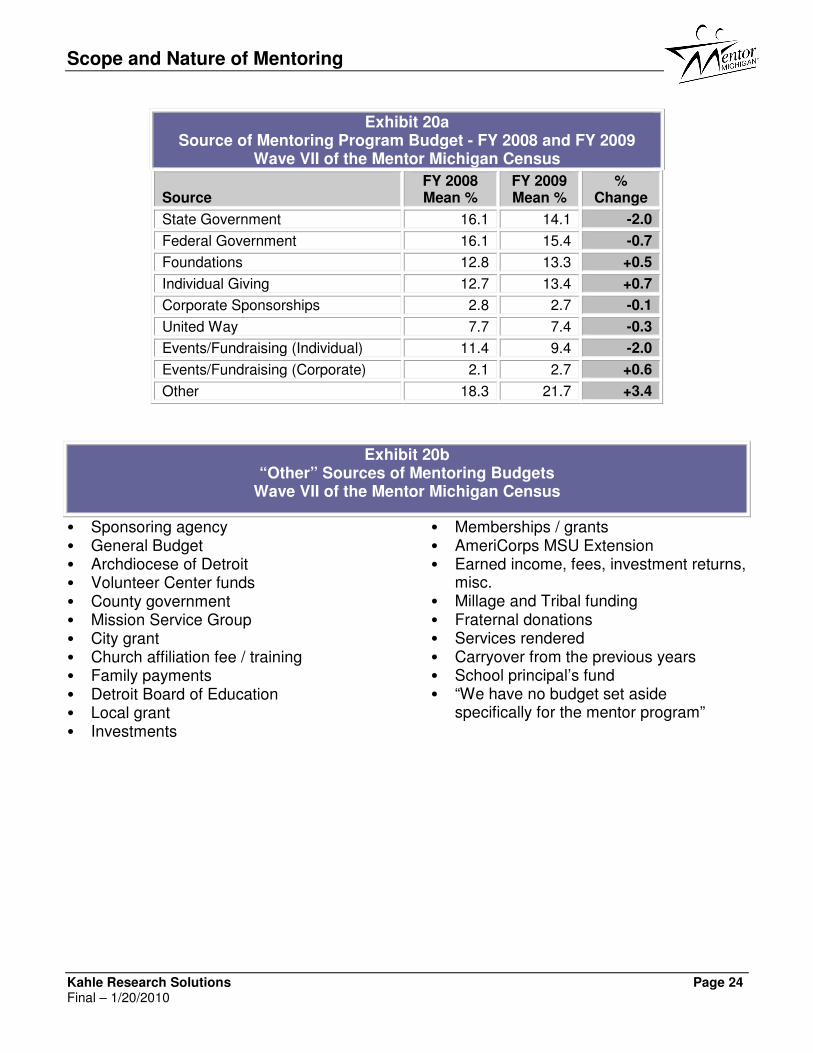
Changes in the Source of Mentoring Program Budgets (Exhibits 20a and 20b) While mentoring organizations in Michigan report a 2% drop in state funds and individual fundraising events between fiscal years 2008 and 2009, we have witnessed an increase in “other” sources of funding. Foundation support, individual giving, and corporate fundraising events have increased have also increased. Respondent write-ins for the “other” category are listed in Exhibit 20b.
Scope and Nature of Mentoring
Kahle Research Solutions Page 24 Final – 1/20/2010
Exhibit 20a Source of Mentoring Program Budget - FY 2008 and FY 2009
Wave VII of the Mentor Michigan Census
Source
FY 2008 Mean %
FY 2009 Mean %
% Change
State Government 16.1 14.1 -2.0
Federal Government 16.1 15.4 -0.7
Foundations 12.8 13.3 +0.5
Individual Giving 12.7 13.4 +0.7
Corporate Sponsorships 2.8 2.7 -0.1
United Way 7.7 7.4 -0.3
Events/Fundraising (Individual) 11.4 9.4 -2.0
Events/Fundraising (Corporate) 2.1 2.7 +0.6
Other 18.3 21.7 +3.4
Exhibit 20b “Other” Sources of Mentoring Budgets
Wave VII of the Mentor Michigan Census
• Sponsoring agency • General Budget • Archdiocese of Detroit • Volunteer Center funds • County government • Mission Service Group • City grant • Church affiliation fee / training • Family payments • Detroit Board of Education • Local grant • Investments
• Memberships / grants • AmeriCorps MSU Extension • Earned income, fees, investment returns,
misc. • Millage and Tribal funding • Fraternal donations • Services rendered • Carryover from the previous years • School principal’s fund • “We have no budget set aside
specifically for the mentor program”
Scope and Nature of Mentoring
Kahle Research Solutions Page 25 Final – 1/20/2010
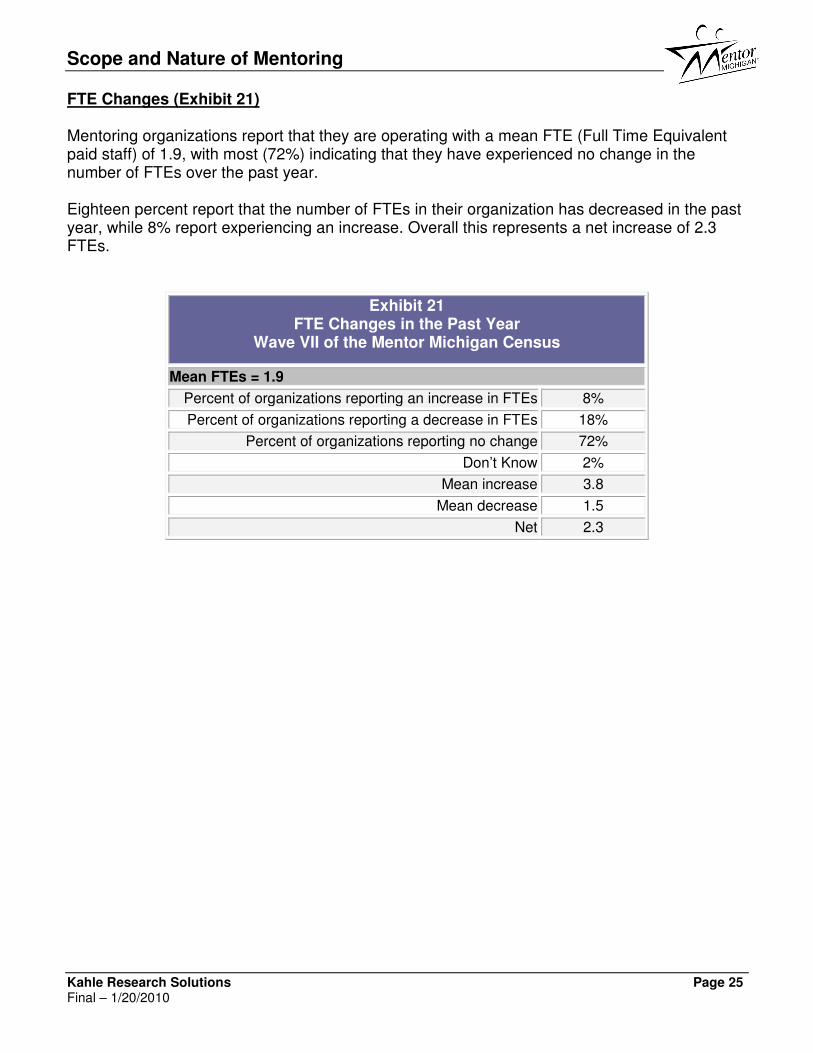
FTE Changes (Exhibit 21) Mentoring organizations report that they are operating with a mean FTE (Full Time Equivalent paid staff) of 1.9, with most (72%) indicating that they have experienced no change in the number of FTEs over the past year. Eighteen percent report that the number of FTEs in their organization has decreased in the past year, while 8% report experiencing an increase. Overall this represents a net increase of 2.3 FTEs.
Exhibit 21 FTE Changes in the Past Year
Wave VII of the Mentor Michigan Census
Mean FTEs = 1.9
Percent of organizations reporting an increase in FTEs 8%
Percent of organizations reporting a decrease in FTEs 18%
Percent of organizations reporting no change 72%
Don’t Know 2%
Mean increase 3.8
Mean decrease 1.5
Net 2.3
Scope and Nature of Mentoring
Kahle Research Solutions Page 26 Final – 1/20/2010
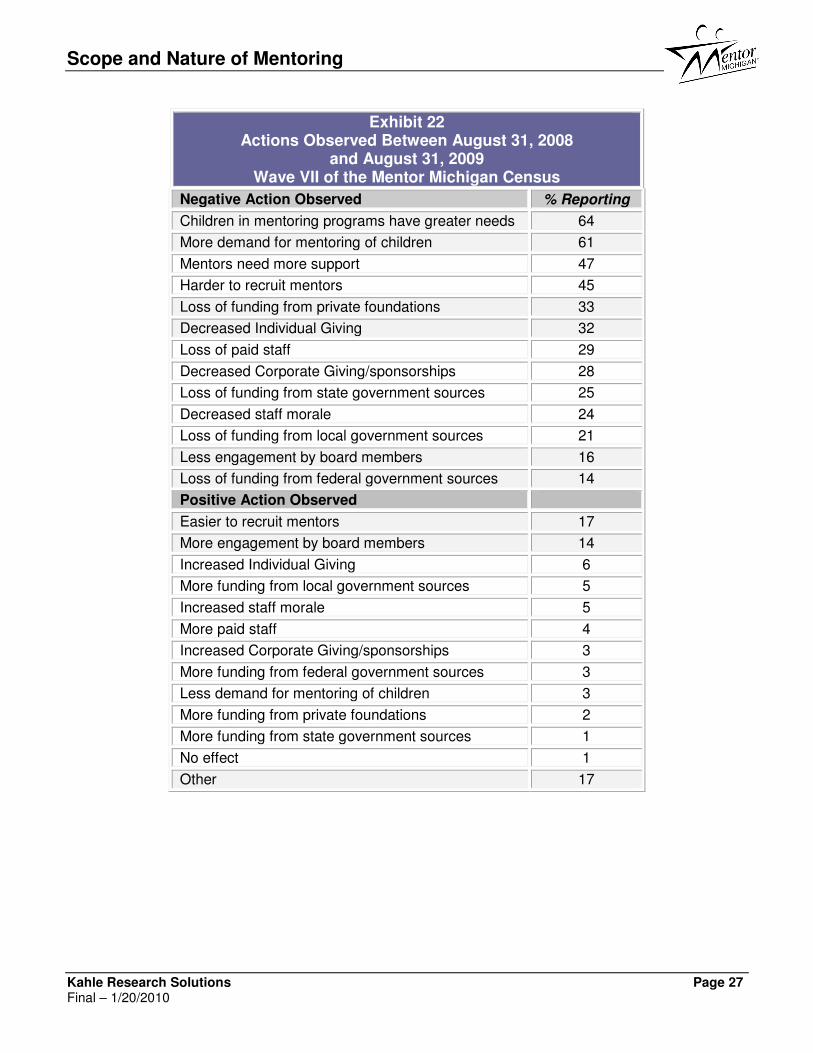
Economic Impact on Mentoring Organizations In Wave VII respondents were asked questions to gauge what, if any, impact the economy is having on mentoring organizations. Overall, the economic impact is much less than expected. Based on their responses, mentoring organizations have been only moderately affected by the economy and most seem quite resilient. Observations by Respondents (Exhibit 22) While the overall economic impact may be less than expected, far more organizations report observing what can be categorized as negative actions within their mentoring programs in the past year than do those observing positive actions. Sixty-one percent report that they have observed an increase in demand for mentoring children in the past year, with 64% reporting that children in their mentoring programs have greater needs than they did one year ago. Forty-five percent observe that it is harder to recruit mentors, and 47% state that their mentors need more support this year. Close to a third report a loss of funding from private foundations and decreased individual giving, a quarter report a loss of funding from state government sources, and 14% indicate that they have seen a loss of funding from federal government sources. However, not all of the news is negative. Some respondents (17%) have observed that it has been easier to recruit mentors in the past year, and 14% report seeing more engagement by their board members. Still, while other reported observations can be categorized as positive, the percentage of respondents making the observations is 6% or less.
Scope and Nature of Mentoring
Kahle Research Solutions Page 27 Final – 1/20/2010
Exhibit 22 Actions Observed Between August 31, 2008
and August 31, 2009 Wave VII of the Mentor Michigan Census
Negative Action Observed % Reporting
Children in mentoring programs have greater needs 64
More demand for mentoring of children 61
Mentors need more support 47
Harder to recruit mentors 45
Loss of funding from private foundations 33
Decreased Individual Giving 32
Loss of paid staff 29
Decreased Corporate Giving/sponsorships 28
Loss of funding from state government sources 25
Decreased staff morale 24
Loss of funding from local government sources 21
Less engagement by board members 16
Loss of funding from federal government sources 14
Positive Action Observed
Easier to recruit mentors 17
More engagement by board members 14
Increased Individual Giving 6
More funding from local government sources 5
Increased staff morale 5
More paid staff 4
Increased Corporate Giving/sponsorships 3
More funding from federal government sources 3
Less demand for mentoring of children 3
More funding from private foundations 2
More funding from state government sources 1
No effect 1
Other 17

Scope and Nature of Mentoring
Kahle Research Solutions Page 28 Final – 1/20/2010
Actions Implemented (Exhibit 23) Respondents were presented with a list of action statements and asked to identify all that are applicable to their organizations since August 31, 2008. Forty-seven percent of respondents report that they have increased the amount of time they spend seeking funding in the past year, and nearly a third (32%) have increased collaboration or merged with other organizations and programs to provide mentoring services. And while 22% report that they have made no changes in the past year, at least 20% state they have reduced the number of paid staff (21%), used reserve funds (21%) and delayed or canceled the purchase of vital office equipment (20%). Twelve percent report that they have reduced the number of children served through their programs. A smaller percentage of organizations report reductions in staff hours and health benefits, and participation in community events. Nine percent indicate that they have reduced the variety and scope of programs offered and 7% have narrowed the focus of the children served.
Exhibit 23 Actions Implemented Between August 31, 2008 and August 31, 2009
Wave VII of the Mentor Michigan Census
Action Implemented % Reporting
Increased the amount of time spent seeking funding 47
Increased collaboration or merger with other organizations/programs 32
Made no changes over the past year 22
Reduced the number of paid staff 21
Needed to use reserve funds 21
Delayed / canceled the purchase of vital office equipment 20
Reduced the number of hours that staff work 18
Reduced participation in community events 17
Altered the content of mentoring programs offered 13
Reduced the number of children served through your mentoring program(s) 12
Reduced staff benefits like health care or other insurance coverage 11
Reduced media exposure 10
Reduced the variety of mentoring programs offered 9
Reduced scope of program(s) 8
Narrowing the focus of the population of children to be served 7
Reduced the amount of training and support provided to mentors 6
Increased use of credit 6
Reduced the frequency of mentoring programs offered 5
Reduced the amount of time staff dedicate to mentor screening / background checks
3
Other 8
Scope and Nature of Mentoring
Kahle Research Solutions Page 29 Final – 1/20/2010
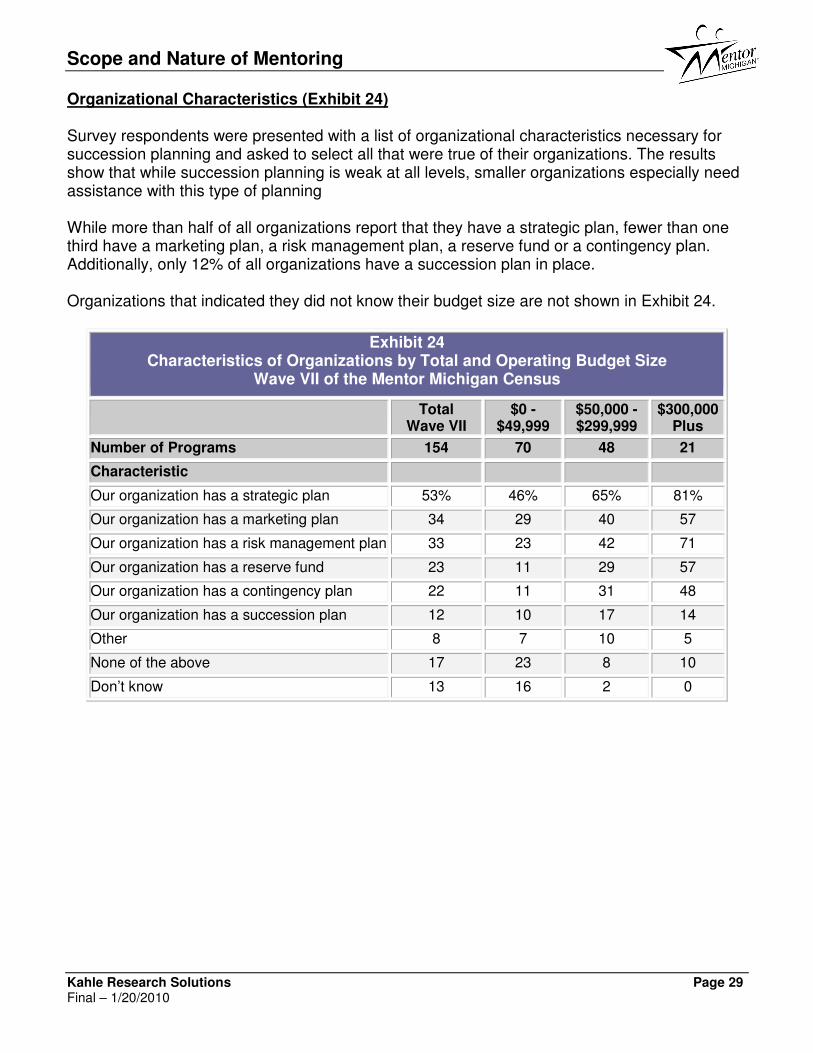
Organizational Characteristics (Exhibit 24) Survey respondents were presented with a list of organizational characteristics necessary for succession planning and asked to select all that were true of their organizations. The results show that while succession planning is weak at all levels, smaller organizations especially need assistance with this type of planning While more than half of all organizations report that they have a strategic plan, fewer than one third have a marketing plan, a risk management plan, a reserve fund or a contingency plan. Additionally, only 12% of all organizations have a succession plan in place. Organizations that indicated they did not know their budget size are not shown in Exhibit 24.
Exhibit 24 Characteristics of Organizations by Total and Operating Budget Size
Wave VII of the Mentor Michigan Census
Total Wave VII
$0 - $49,999
$50,000 - $299,999
$300,000 Plus
Number of Programs 154 70 48 21
Characteristic
Our organization has a strategic plan 53% 46% 65% 81%
Our organization has a marketing plan 34 29 40 57
Our organization has a risk management plan 33 23 42 71
Our organization has a reserve fund 23 11 29 57
Our organization has a contingency plan 22 11 31 48
Our organization has a succession plan 12 10 17 14
Other 8 7 10 5
None of the above 17 23 8 10
Don’t know 13 16 2 0
Scope and Nature of Mentoring
Kahle Research Solutions Page 30 Final – 1/20/2010
Barriers to Serving More Children Judging from budgetary and staffing projections presented in the previous section, it would seem that the economic impact on mentoring organizations has not been as severe as anticipated. Yet most respondents, when asked, express concerns over the state of the economy and its effects on their ability to provide quality mentoring to youth in need. Wave VII respondents were asked to provide qualitative input about the barriers they encounter while attempting to serve more children. For the majority of these mentoring organizations, the phrase most often uttered when identifying barriers to serving more children is “lack of…” Lack of funding, lack of staff, and lack of volunteers to mentor children all serve to prevent them from providing the quality and quantity of mentoring services they desire. Reduced funding reduces the number of staff members who administer the mentoring programs, resulting in fewer programs serving fewer children. According to these respondents, a stalled economy and high unemployment reduce the number of adults willing to choose mentoring over job hunting, again resulting in fewer children being served. While other barriers to serving more children exist, for many of these organizations the lack of funding causes a ripple effect, affecting all areas of mentoring. A lack of paid staff is often attributed to the lack of funding. The need for staff to administer and coordinate mentoring programs is great. Organizations are getting by but express grave concerns about their ability to continue to offer mentoring services to the youth in need. A lack of qualified, willing mentors is a perennial barrier to serving more youth for these organizations. A suffering economy that reduces funding and subsequently reduces the staff needed to recruit these mentors exacerbates the problem, according to these organizations. Verbatim comments from survey respondents are shown on the following pages.
Scope and Nature of Mentoring
Kahle Research Solutions Page 31 Final – 1/20/2010
• “The largest single barrier is not having enough funds to have a stable facility to run the program.”
• “Our largest single barrier is being able to serve children in need with our limited budget.”
• “Funding, we cannot do more with less.” • “Funding reductions have caused us to recruit fewer volunteers, thus fewer children
are served.” • “<PROGRAM> does not have any reserve funds. (Currently) we are able to pay our
operating/program cost. Due to increased exposure there is an increase in a request for services. Very soon we will not be able to accept new participants.”
• “Neither mentoring program has had any funding for the past year. It is difficult to recruit volunteers for a program that has no funding.”
• “Reduced funding affects the amount of volunteers we can bring into the program which affects the number of children we are able to serve.”
• “This program serves 10 counties and operates with one AmeriCorps member. My first year was a short one with the economy turning upside down. Year 2 has shown a slow recovery.”
• “Our greatest need is funding for basics like transportation from school to the youth park and for after-school healthy snacks. We cannot seem to secure grants that would allow for additional funding of special projects or activities for the kids.”
• “The largest single barrier is funding to support the amount of staff and supplies that it takes to run a quality program.”
• “Lack of funding - program operates solely on individual giving.” • “While partnerships and collaborations are great for continuation of programming, we
are all facing the same dilemma, how to do more...with less.” • “Facility and staffing limitations are equal barriers, which are the result of funding
limits. Funding limits are due to lack of social and political will to properly address the needs of the people we serve.”
Lack of Funding for Operations
Scope and Nature of Mentoring
Kahle Research Solutions Page 32 Final – 1/20/2010
• “We are currently run by a volunteer coordinator, and two site volunteer coordinators. We are being run ragged, and really need a paid staff position to insure the sustainability of the program.”
• “The single largest barrier to serving more children is in the area of staff capacity, which is a direct result of decreased finances.”
• “Funding for staff. I need a grant writer who can write the grant, or find a grant to fund staff. Please help me. I am the Executive Director, Matched Specialist and Activity person rolled into one. (Two full time positions and a part time position). The only way I can work here is I am retired and can draw from that funding.”
• “Staff is spread across multiple programs, not enough dedicated time to the program, not even one full-time person dedicated to it. This makes recruitment, proper training and ongoing supervision difficult.”
• “Funding for the coordinator. She did an amazing job, had over 90% retention from year 1 to year 2, and the schools were very pleased with the quality of the oversight. But grant funding for her position ran out and schools could not pick up the expense.”
• “Funding for additional staff. Staff to volunteer ratio cannot exceed 30:1, and we are currently at capacity.”
• “Not enough money for marketing and staff to recruit mentors and manage relationships.”
• “Time spent recruiting, matching and maintaining without additional funds for added staff or VISTA member. “
• “Due to budget concerns (decreased funding) job descriptions are changing creating increased responsibilities on staff.”
• “Lack of funding to have someone hired to administer the program part or full time.” • “Funding to increase staff time of those who are the ones who do the matching of Bigs to
Littles and who follow-up with them.” • “We have the capacity and the infrastructure to serve more youth. We do not have the
funding for more staff to take advantage of our capacity.” • “Our budget handles one part-time coordinator. We have quadrupled the children served
in the last four years. We have seen a rise in (number) of children needing mentoring as well as mentors needed for these children.”
Lack of Staff

Scope and Nature of Mentoring
Kahle Research Solutions Page 33 Final – 1/20/2010
• “The recruitment of male mentors. The economy is bad in our area (high unemployment). The focus for men in our area is to find employment or cut spending. Volunteering in areas that may cost money at some time is not an interest.”
• “Adult mentor commitment - financial stress of the community has taken away many potential mentors.”
• “Recruitment of new mentors and retention of existing mentors because of employment shifts.”
• “We have 80 children apply for our after school program which includes mentoring for every child. We can only take a maximum of 55 children because that is all the staff can handle. We believe we can get the mentors but do not have enough staff to manage them”
• “Recruitment of qualified adults, mostly male. There are so many boys of single parent families who need help.”
• “Recruiting COMMITTED mentors.” • “Finding men who would become mentors for young mentees with disabilities.” • “To find community volunteers that are willing to be matched with a child for at
least a year.” • “There are only so many volunteers out there, especially men, who have the
time/inclination to help out.” • “More African American male participation (is one of) the largest barriers to
serving more children.” • “Often times, people express interest in volunteering, but then do not bother
with completing the application or at the time, they are only looking for information. Some also do not want to be bothered with going thru the training or background check process.”
Lack of Mentors

Scope and Nature of Mentoring
Kahle Research Solutions Page 34 Final – 1/20/2010
40%51% 51% 50%
38%
51%
38%
36% 35% 35%
46%
40%
8% 12% 13%8%
2%3%5%2%5%
4%
10%18%
0%
20%
40%
60%
80%
100%
Wave II Wave III Wave IV Wave V Wave VI Wave VII
Not Aware ofMM/Don't Know
Not Very/Not at AllSatisfied
Somewhat Satisfied
Very Satisfied
Satisfaction with Mentor Michigan
Overall Satisfaction (Exhibit 25) General satisfaction with Mentor Michigan was measured on a four-point scale using the following question:
“Overall, and considering all aspects of the service, information and resources provided, how satisfied are you with Mentor Michigan?”
As shown in Exhibit 25, overall satisfaction with Mentor Michigan has grown from 84% very/somewhat satisfied in Wave VI to 91% in Wave VII. Those who are not aware of Mentor Michigan or don’t know has been reduced to 8% (down from 13% last wave), and those not very/not at all satisfied remains a small 2% of responding organizations.
Exhibit 25 Satisfaction with Mentor Michigan
Waves II through VII of the Mentor Michigan Census

Scope and Nature of Mentoring
Kahle Research Solutions Page 35 Final – 1/20/2010
Satisfaction with and Importance of Mentor Michigan Services (Exhibit 26) Asked to rank Mentor Michigan services by both satisfaction and importance, mentoring organizations rank Mentor Michigan Quality Program Standards for Youth highest in both categories. On a scale of 1 to 4, with 4 being “most satisfied” and “most important”, the Standards ranked a 3.7 in both. Most of the services listed were ranked high in satisfaction and importance. Only one service, Recruitment Campaigns such as National Guard, Municipal League, etc., ranked lower than 3.0, and then only slightly at 2.7 in satisfaction and 2.9 in importance.
Ranking of MM Services by Satisfaction Mean Ranking*
Ranking of MM Services by Importance
Mean Ranking**
Mentor Michigan Quality Program Standards for Youth 3.7
Mentor Michigan Quality Program Standards for Youth 3.7
AmeriCorps/ AmeriCorps*VISTA members 3.6 Mentor Michigan website 3.5
Mentor Michigan Directory 3.5 Mentor Michigan Directory 3.4
Mentor Michigan website 3.5 Mentor Michigan training sessions 3.4
Mentor Michigan training sessions 3.5
National Mentoring Month activities/ programs/ toolkit 3.4
Mentor Michigan listserv 3.4 Mentor Michigan listserv 3.3
National Mentoring Month activities/ programs/ toolkit 3.4
Mentor Michigan Statewide Conference 3.3
Mentor Michigan Statewide Conference 3.4 Mentor Michigan Census data 3.3
Mentor Michigan webinars 3.4
Mentor Michigan Public Service Announcements 3.2
Mentor Michigan Census data 3.4
AmeriCorps/ AmeriCorps*VISTA members 3.2
Clearinghouse on national mentoring issues 3.4 Mentor Michigan webinars 3.2
Mentor Michigan Public Service Announcements 3.3
Clearinghouse on national mentoring issues 3.2
Recruitment Campaigns such as National Guard, Municipal League, etc. 2.7
Recruitment Campaigns such as National Guard, Municipal League, etc. 2.9
*Satisfaction Scale: **Importance Scale: 4 = Very Satisfied 4 = Very important 3 = Somewhat Satisfied 3 = Somewhat Important 2 = Not Very Satisfied 2 = Not Very Important 1 = Not at All Satisfied 1 = Not at All Important
Exhibit 26 Satisfaction with and Importance of Mentor Michigan Services
Wave VII of the Mentor Michigan Census
Scope and Nature of Mentoring
Kahle Research Solutions Page 36 Final – 1/20/2010
Fund Development
34.0Capacity Building
20.5
Public
Awareness
16.9
Advocacy
15.0
Data
Collection
13.6
0 10 20 30 40 50 60 70 80 90 100
1
Ranking of Mentor Michigan Services (Exhibit 27) Survey respondents were asked to rank Mentor Michigan services another way this wave. Given 100 points to allocate, they awarded points to five different Mentor Michigan services (shown in Exhibit 27) according to their organization’s priorities. Based on their responses, Fund Development / Expanding Financial resources / Mini grants received the highest mean ranking (34.0). Data Collection / Research / Evaluation / Evidence-based Practices ranked the lowest (13.6).
Mentor Michigan Service
Mean Ranking
Fund Development / Expanding financial resources / Mini grants 34.0
Capacity building for mentoring programs (such as webinars, training, annual conference, and AmeriCorps or AmeriCorps*VISTA)
20.5
Public awareness / Public Relations / Recruitment (such as PSAs, targeted recruitment campaigns and positioning mentoring as a solution to key issues))
16.9
Advocacy with state and federal officials (such as lobbying for state and/or federal funds)
15.0
Data Collection / Research / Evaluation / Evidence-based Practices 13.6
Exhibit 27 Ranking of Mentor Michigan Services by Importance
Wave VII of the Mentor Michigan Census
Scope and Nature of Mentoring
Kahle Research Solutions Page 37 Final – 1/20/2010
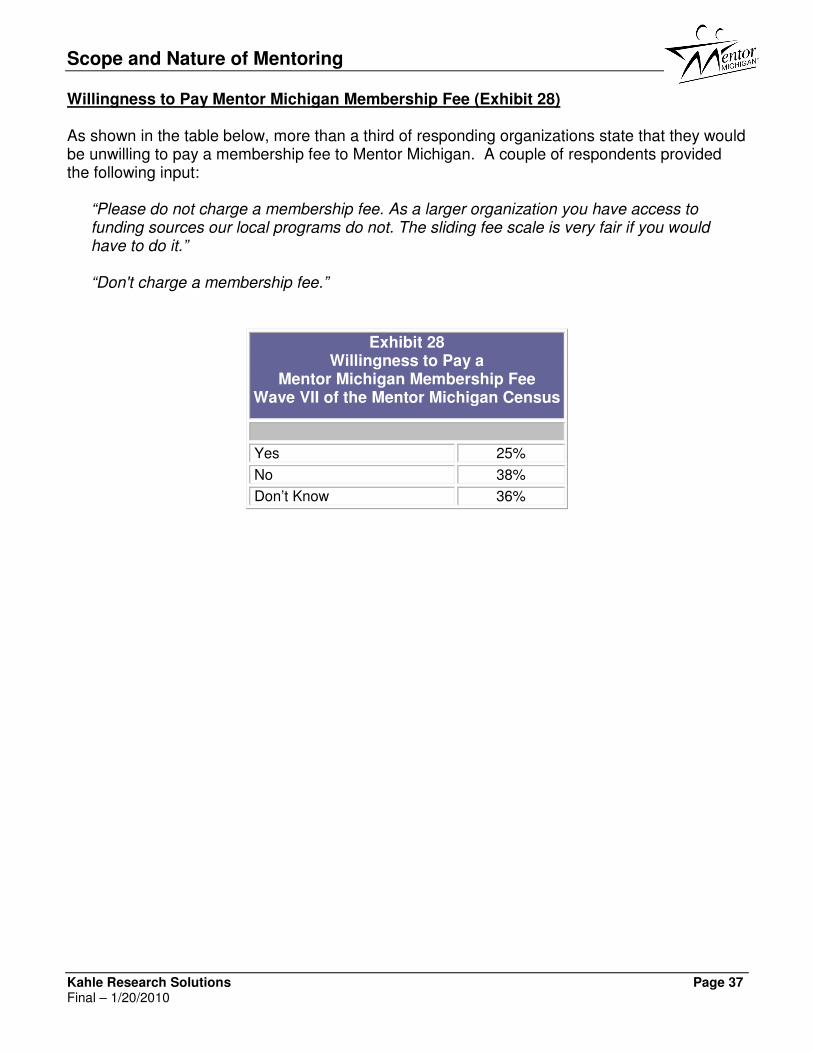
Willingness to Pay Mentor Michigan Membership Fee (Exhibit 28) As shown in the table below, more than a third of responding organizations state that they would be unwilling to pay a membership fee to Mentor Michigan. A couple of respondents provided the following input:
“Please do not charge a membership fee. As a larger organization you have access to funding sources our local programs do not. The sliding fee scale is very fair if you would have to do it.” “Don't charge a membership fee.”
Exhibit 28 Willingness to Pay a
Mentor Michigan Membership Fee Wave VII of the Mentor Michigan Census
Yes 25%
No 38%
Don’t Know 36%

Scope and Nature of Mentoring
Kahle Research Solutions Page 38 Final – 1/20/2010
Meet Most
51%
Meet Only
Some
12%Other / Don't
Know
10%
Meet All
28%
Mentor Michigan Quality Standards for Youth Mentoring Programs Meeting the Standards (Exhibit 29) Eighty percent of responding organizations report that they are familiar with Mentor Michigan’s Quality Standards for Youth Mentoring Programs. Of those, 51% claim to meet most of the standards, 28% meet all, and 12% meet only some. Ten percent don’t know if they meet the standards. Both school-based and community-based programs adhere to the Quality Standards in similar proportions (see Exhibit 30). Site-based programs, however, are markedly different, with 75% claiming to meet most of the Standards and 25% meeting some.
Exhibit 29 Meeting the MM Quality Standards for Youth Mentoring Programs
Wave VII of the Mentor Michigan Census

Scope and Nature of Mentoring
Kahle Research Solutions Page 39 Final – 1/20/2010
Exhibit 30 Meeting the MM Quality Standards for Youth Mentoring Programs by Program Type
Wave VII of the Mentor Michigan Census

Scope and Nature of Mentoring
Kahle Research Solutions Page 40 Final – 1/20/2010
The percentage of programs that meet most or all of the standards increases by the size of the program (based on budget size). Ninety-six percent of those with budgets of $300,000 or more report meeting most or all of the standards, while 73% of small programs ($0 to $49,900) do so. See Exhibit 31 below for more details.
Exhibit 31 Meeting the MM Quality Standards for Youth Mentoring Programs by Budget Size
Wave VII of the Mentor Michigan Census
Total Wave VII
$0 - $49,999
$50,000 - $299,999
$300,000 Plus
Number of Programs 154 70 48 21
Our mentoring program(s) meets all of the standards
28% 20% 38% 48%
Our mentoring program(s) meets most of the standards
51 53 46 48
Our mentoring program(s) meets only some of the standards
12 17 8 5
Other 5 9 2 0
Don’t Know 5 1 6 0
Looking at program longevity (see Exhibit 32), compliance with the standards is highest with programs that are very new (1-2 years) and much older (more than 10 years). One hundred percent of the very new programs report that they meet most or all of the standards, while 88 of the older programs report this compliance level.
Wave VII Total
More than 1 but less
than 2
More than 2 but less
than 3
More than 3 but less than 4
More than 5 but less than
10
More than 10
Number of Programs 154 9 9 21 33 70
Our mentoring program(s) meets all of the standards
28% 22% 22% 14% 18% 40%
Our mentoring program(s) meets most of the standards
51 78 44 67 52 44
Our mentoring program(s) meets only some of the standards
12 0 22 10 15 9
Other 5 0 0 10 6 4
Exhibit 32 Meeting the MM Quality Standards for Youth Mentoring Programs by Program
Longevity Wave VII of the Mentor Michigan Census
Scope and Nature of Mentoring
Kahle Research Solutions Page 41 Final – 1/20/2010
3%
3%
4%
4%
5%
5%
5%
12%
16%
10%
28%
6%
Organization Management
Definition of Youth Mentoring
Eligibility Screening
Orientation and Training
Matching Strategy
Match Making Process
Governance
Mentor Support, Recognition,
Retention
Match Closure
Recruitment Plan
Program Evaluation
Don’t know
% of Organizations Reporting Most Difficult Standard to Meet
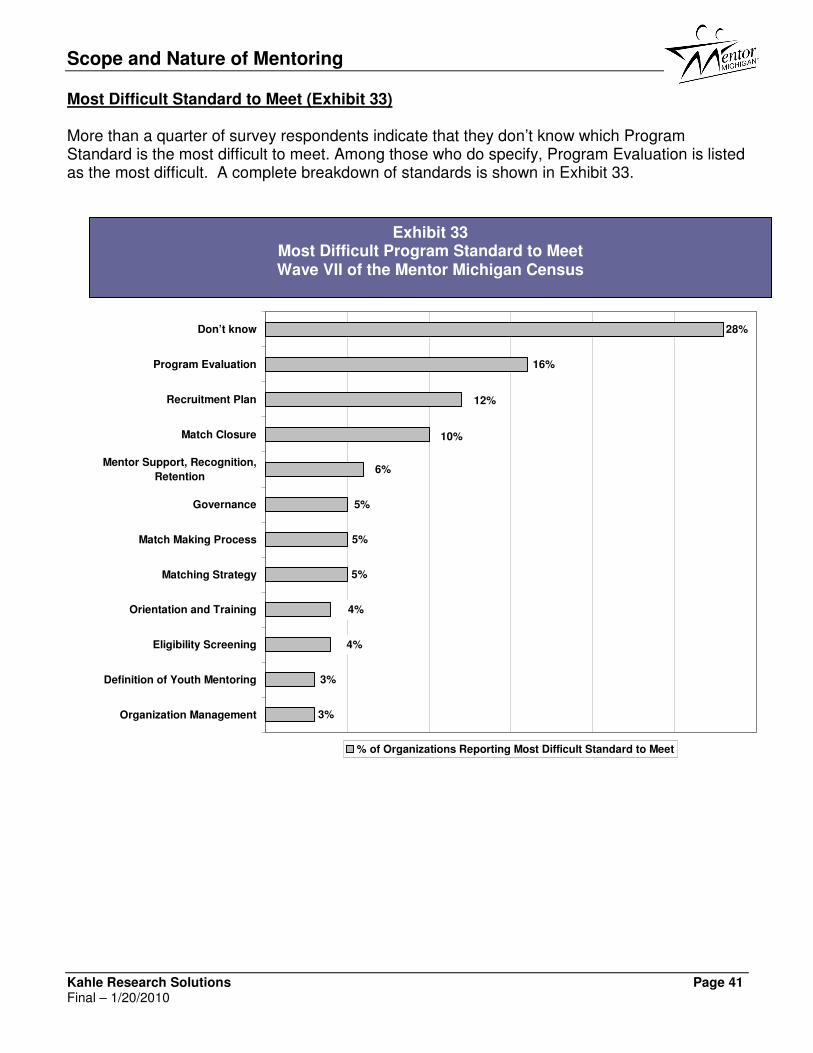
Most Difficult Standard to Meet (Exhibit 33) More than a quarter of survey respondents indicate that they don’t know which Program Standard is the most difficult to meet. Among those who do specify, Program Evaluation is listed as the most difficult. A complete breakdown of standards is shown in Exhibit 33.
Exhibit 33 Most Difficult Program Standard to Meet Wave VII of the Mentor Michigan Census

Scope and Nature of Mentoring
Kahle Research Solutions Page 42 Final – 1/20/2010
Recommendations for Mentor Michigan Respondents were asked to provide their recommendations for Mentor Michigan as it plans for the future. Not surprisingly, many organizations seek assistance from Mentor Michigan to obtain funding. In addition, recommendations also fall into the categories below: • Promoting, Advocating and Increasing Awareness of Mentoring • Acting as an Information and Training Resource • Providing Unique Resources to Mentoring Organizations • Fostering Collaboration and Consolidation among Mentoring Organizations Verbatim statements from respondents follow.
• “Continue to expose mentoring programs to funding opportunities.” • “Advocacy and fund development.” • “Provide more opportunities for mini grants and other funding opportunities.” • “Increase availability and amount of grants and other funding.” • “Fundraising is the biggest issue right now. I know that some other states’ mentoring
organizations have advocated and gotten line items in their state's budget directed specifically toward mentoring programs. That would be helpful!”
• “As we live in the Upper Peninsula which is Rural and covers a large geographic area we would like to see more funding to these children who have limited access to after school events.”
• “Fund development plans to help smaller agencies that cannot compete with larger programs for state and federal dollars.”
• “Find more opportunities for programs to get funding.” • “Help non-profits find funding for staff,” • “Many of the current contracts through DHS will be lost in the upcoming 1-2 years, is
there a solution state-wide for creating funding for those programs that will be lost?” • “It is our belief that our children need us more than ever today. However, funding is
falling away quicker than ever. It would be very important for Mentor Michigan to assist organizations in obtaining funding so programs can continue to reach out to our youth.”
• “Securing federal/private funds to implement targeted programs/support specific to each region of the state.”
• “Assist startup programs with some funding for the first year. Allow for funding based on capacity building efforts for the first 2 years. Most organizations are community-based with in-kind from educational institutions with no direct funding.”
• “We are very grateful for the grant opportunities you offer. We would suggest continuing to add to your grant funding.”
Identify and Provide Funding; Assist Organizations to Obtain Funding

Scope and Nature of Mentoring
Kahle Research Solutions Page 43 Final – 1/20/2010
• “Advocate for mentoring across the state. Seek to reach out to the areas of the state that you may not fully reach.”
• “Advocate to waive the AmeriCorps/AmeriCorps VISTA match for new mentoring programs with budgets less than $10,000. New programs that are volunteer-run can benefit from having an AmeriCorps member to build its capacity, mentors, and participants for one year.”
• “Really help push the face of mentoring so more and more people become aware.”
• “Building awareness of mentoring in the more rural areas. Mentor Michigan's recruitment has targeted the urban areas and we need help in the rural areas. We are struggling just to get something started.”
• “Stepping up the image of quality mentoring in the eyes of the public.” • “More promoting of mentoring programs. The program has been listed on
the Mentor Michigan site since June 2009 and have yet to receive any inquires.”
• “Keep up advocacy and education with legislators.”
Promote, Advocate, and Increase Awareness of Mentoring
• “Webinars on organization and how to recruit male mentors.”
• “Provide strategies for retention and support of mentors as they go through their own personal financial challenges.”
• “Webinar on grant writing would be great.” • “Provide more mentoring training outside of the annual conference in regional areas.
Also provide a resource that lists local conferences for youth to attend that are being mentored.”
• “I am looking forward to the webinars that relate to school based mentoring programs. It would be nice to be able to have a page to download resources and activities.”
• “Would be nice to be able to access training at our site when our trainer is not available.”
• “The direction MM is headed in terms of delivering content and learning opportunities is right where we want to go.”
• “More technical training on the establishment of mentoring programs.” • “Offer capacity building grants and technical support for new mentoring programs.” • “Increased support of collaboratives, training on supervision issues - for both interns
and VISTAs who can assist with program capacity, and mentor supervision to increase retention and reduce the need to recruit and train new mentors. Also helping to make connections between corporate world and programs for increased support, not just money but marketing, consulting, training, in-kind support.”
Serve as Information and Training Resource

Scope and Nature of Mentoring
Kahle Research Solutions Page 44 Final – 1/20/2010
• “Continue to do what others are not or can not do - for example the Census Data and Quality Program Standards.
• ”Thank you for the Quality Standards! They give us all a common focus and "gold standard" to strive for. Continue to support and train around those standards. The meeting First Gentleman Mulhern had around the state several years ago was very motivating for us in the mentoring field. More PR from him would be helpful.”
• “Continued support of areas of volunteer management which includes recruitment, screening, risk management and case management are vital.”
• “How can we use the data that is collected in these types of surveys and turn them into dollars for our programs? Mentor Michigan could use this data to solicit funders for dollars to support the participating programs.”
Provide Resources Unique to Mentoring
• “A collaboration between mentoring programs and experienced retired non profit/for profit industry leaders. These leaders would help increase capacity and act as onsite leadership mentors to the volunteer staff and Board.”
• “Provide more opportunities to collaborate on funding.” • “A chance for current Mentoring Programs to have round table sessions
at the Mentor Michigan Conference and discuss best practices, funding options, recruitment and evaluation.”
• “Local Mentor collaboratives are very helpful. Support of these is important.”
Promote Collaboration
Scope and Nature of Mentoring
Kahle Research Solutions Page 45 Final – 1/20/2010
Appendix A Funnel Measures Summary Table Totals by Waves
Question Wave I 1/1/04- 9/1/04
Wave II 1/1/04-2/28/05
Wave III 1/1/05-8/31/05
Wave IV 9/1/05-8/31/06
Wave V 9/1/06-8/31/07
Wave VI 9/1/07-8/31/08
Wave VII 9/1/08-8/31/09
# Mentoring organizations 105 136 123 137 140 143 161
# Inquiries to be a mentor 5,823 9,975 8,816 17,522 13,380 13,566 16,485
Monthly average 728 831 1,102 1,460 1,115 1,130 1,374
# Written applications to be a mentor 3,976 6,249 5,973 8,000 7,891 8,954 9,776
Monthly average 497 520 747 666 658 746 815
Background check - [M.R.]
Criminal background check* 89% -- --- -- -- -- --
State criminal background check** -- 79% 80% 79% 80% -- --
Federal criminal background check** -- 29 28 27 33 -- --
Fingerprint check*** -- -- 11 13 15 -- --
FBI fingerprint check^^^ -- -- -- -- -- 13% 13%
Other national fingerprint check^^^ -- -- -- -- -- 3 3
State only fingerprint check^^^ -- -- -- -- -- 9 10
Name only national check^^^ -- -- -- -- -- 16 17
Name only state check (ICHAT)^^^ -- -- -- -- -- 61 76
Sex offender registry 60 64 59 62 69 69 74
Child abuse registry 40 48 41 42 46 49 51
Driving record/license 64 60 52 50 51 56 57
Personal character references 79 81 81 76 81 82 81
Employment references 44 33 35 24 29 31 28
Credit check^ 3 1 0 0 0 4 0
Written application 83 84 87 77 85 88 92
Personal interview 86 87 84 81 84 89 87
Home assessment** -- 12 15 8 13 14 13
Home visit** -- 9 11 8 11 17 12
None of the above 3 6 5 5 3 2 2
Use SafetyNET to conduct background checks^^^
Yes -- -- -- -- -- 16% 13%
No -- -- -- -- -- 69 71
Don’t Know -- -- -- -- -- 15 15
Youth served
Total 16,574 27,090 20,294 28,283 25,883 22,916 28,536
Mean per Organization 157.8 199.2 114 206 185 160 177
* Asked only in Wave I. ** Added in Wave II. *** Added in Wave III. ^Dropped in Wave III.
^^Added in Wave IV. ^^^Added in Wave VI.

Scope and Nature of Mentoring
Kahle Research Solutions Page 46 Final – 1/20/2010
Funnel Measures Summary Table Totals by Waves (cont’d)
Question
Wave I 1/1/04- 9/1/04
Wave II 1/1/04-2/28/05
Wave III 1/1/05-8/31/05
Wave IV 9/1/05-8/31/06
Wave V 9/1/06-8/31/07
Wave VI 9/1/07-8/31/08
Wave VII 9/1/08-8/31/09
Total number of matches
% of organizations reporting an increase 37% 40% 38% 41% 51% 55% 41%
% of organizations reporting a decrease 12% 29% 15% 9% 15% 15% 14%
%of organizations reporting no change 36% 25% 48% 27% 24% 23% 34%
Don’t know 16% 22% 22% 23% 9% 7% 11%
Increased # 2,195 3,282 1,975 4,194 3,596 3,171 3,148
Decreased # 848 1,066 1,859 585 1,078 645 765
Net change # 1,347 2,216 116 3,609 2,518 2,526 2,383
Active mentors 9,108 10,5461
15,9772
11,767 16,382 18,232 17,051 19,578
Mentors currently on waiting list 2,017 1,243 1,124 2,625 1,833 999 1,674
Youth currently on waiting list 2,345 3,428 3,311 4,081 3,452 3,028 3,568
Minimum time of mentor/youth match +++
No minimum 1% 2%
1-2 months 2 2
3-5 months 7 7
6-8 months 21 16
9-11 months 26 23
12 months 36 39
More than 12 Months, less than 2 years 0 1
More than 2 years, less than 5 years 2 2
More than 5 years 0 0
Don’t know 4 8
Average time for mentor/youth match +++
No minimum 0% 2%
1-2 months 3 1
3–5 months 5 4
6–8 months 13 15
9–11 months 21 19
12 months 21 17
More than 12 months, less than 2 years 8 8
More than 2 years, less than 5 years 15 12
More than 5 years 0 2
Don’t know 14 21
1 = Total for all of 2004 2 = Total as of 2/28/05
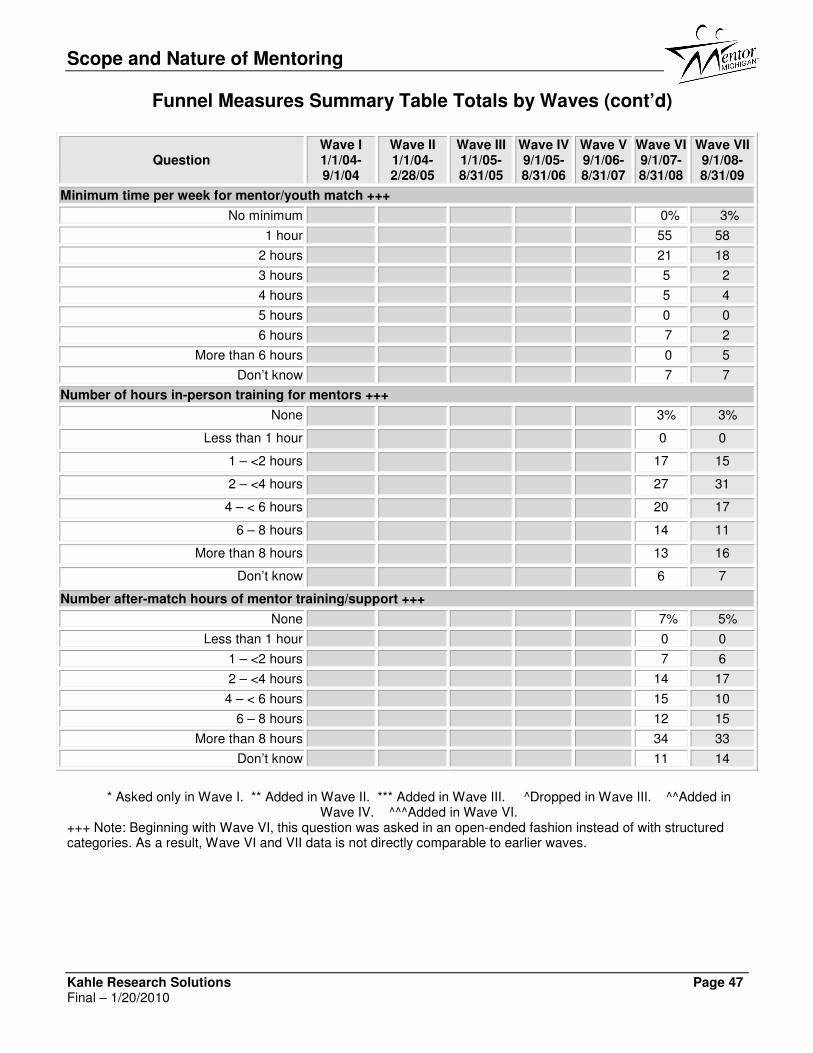
Scope and Nature of Mentoring
Kahle Research Solutions Page 47 Final – 1/20/2010
Funnel Measures Summary Table Totals by Waves (cont’d)
Question
Wave I 1/1/04- 9/1/04
Wave II 1/1/04-2/28/05
Wave III 1/1/05-8/31/05
Wave IV 9/1/05-8/31/06
Wave V 9/1/06-8/31/07
Wave VI 9/1/07-8/31/08
Wave VII 9/1/08-8/31/09
Minimum time per week for mentor/youth match +++
No minimum 0% 3%
1 hour 55 58
2 hours 21 18
3 hours 5 2
4 hours 5 4
5 hours 0 0
6 hours 7 2
More than 6 hours 0 5
Don’t know 7 7
Number of hours in-person training for mentors +++
None 3% 3%
Less than 1 hour 0 0
1 – <2 hours 17 15
2 – <4 hours 27 31
4 – < 6 hours 20 17
6 – 8 hours 14 11
More than 8 hours 13 16
Don’t know 6 7
Number after-match hours of mentor training/support +++
None 7% 5%
Less than 1 hour 0 0
1 – <2 hours 7 6
2 – <4 hours 14 17
4 – < 6 hours 15 10
6 – 8 hours 12 15
More than 8 hours 34 33
Don’t know 11 14
* Asked only in Wave I. ** Added in Wave II. *** Added in Wave III. ^Dropped in Wave III. ^^Added in
Wave IV. ^^^Added in Wave VI. +++ Note: Beginning with Wave VI, this question was asked in an open-ended fashion instead of with structured categories. As a result, Wave VI and VII data is not directly comparable to earlier waves.

Scope and Nature of Mentoring
Kahle Research Solutions Page 48 Final – 1/20/2010
Appendix B Background, Objectives and Method
The Mentor Michigan Census (MMC) is a periodic survey of organizations operating mentoring programs in the State of Michigan. In Wave I of the MMC, conducted in the fall of 2004, 105 organizations responded to the MMC out of a total of 156 organizations that had registered with Mentor Michigan as of September 1, 2004. This reflected a 67% response rate. Wave II of the MMC, conducted in March of 2005, reflected a similar response rate of 66%. Out of a total of 207 mentoring organizations identified and registered with Mentor Michigan, 136 responded. Of the 105 organizations that responded to Wave I, 96 responded to Wave II. Thus, 40 organizations reported for the first time in Wave II. Wave III of the MMC was conducted in October of 2005. Out of a total of 237 mentoring organizations identified and registered with Mentor Michigan, 123 responded (51% response rate). Of those 123 that responded in Wave III, 7 also responded to Wave I, 13 responded to Wave II and 74 completed both Wave I and Wave II surveys. Thus, 12 organizations reported for the first time in Wave III (17 report that they “don’t know” about previous survey completions). Wave IV of the MMC was conducted in September and October of 2006. Out of the 237 mentoring organizations identified and registered with Mentor Michigan, 137 responded (58% response rate). Of those 137 that responded in Wave IV, 63 also responded in Wave I, 67 also responded in Wave II, and 70 also responded in Wave III. Thus, 24 organizations reported for the first time in Wave IV (29 report that they “don’t know” about previous survey completions). Wave V of the MMC was conducted in September and October of 2007. One hundred and forty mentoring organizations responded to the survey. With 220 organizations in the Mentor Michigan Registry, this survey achieved a 64% response rate. Of those 140 that responded in Wave V, 54 also responded in Wave I, 55 also responded in Wave II, 71 also responded in Wave III, and 82 also responded in Wave IV. Thus, 27 organizations reported for the first time in Wave V (26 report that they “don’t know” about previous survey completions). Wave VI of the MMC, conducted in September and October of 2008. One hundred and forty three organizations responded to the survey, the largest number in Census history. With 227 organizations in the Mentor Michigan Registry, this survey achieved a 63% response rate. Of those 143 that responded in Wave VI, 43 also responded in Waves I and II, 51 also responded in Wave III, 60 also responded in Wave IV, and 73 also responded in Wave V. Thus, 33 organizations reported for the first time in Wave VI (32 report that they “don’t know” about previous survey completions). This report covers Wave VII of the MMC, conducted in September and October of 2009. One hundred sixty one organizations responded to the survey, the largest number in Census history. With 238 organizations in the Mentor Michigan Registry, this survey achieved a 68% response rate. Of those 161 that responded in Wave VII, 44 also responded in Wave I, 46 in Wave II, 51 in Wave III, 56 in Wave IV, 68 in Wave V, and 88 also responded in Wave VI. Thus, 23

Scope and Nature of Mentoring
Kahle Research Solutions Page 49 Final – 1/20/2010
organizations reported for the first time in Wave VII (46 report that they “don’t know” about previous survey completions). The MCC data were collected via an on-line survey. For the first five Waves of the MMC, there were approximately 60 questions in the survey. With Wave VI, the survey questions increased to 96; with Wave VII there were 93. Approximately 30 of the questions for each wave are repeated for tracking purposes. The remaining questions are specific to each wave and focused on various items of interest to Mentor Michigan and its key constituents. The primary purpose of the MMC is to understand the scope and nature of mentoring and mentoring organizations in Michigan. Specifically, there are three key objectives:
1. Identify, count, describe, and track mentoring organizations, programs, mentors, and the children served.
2. Understand program components, processes, resources, and needs. 3. Encourage and support program evaluation.
Additionally, in the first Wave of the MMC, emphasis was placed on understanding the types of organizations that provide mentoring programs. In Wave II, emphasis was placed on understanding barriers to serving more children with mentors, including liability, recruitment and other challenges. Wave II also included a special section addressing use and satisfaction with the services and products produced by Mentor Michigan. With Wave III, emphasis was placed on understanding adherence to the eleven Mentor Michigan Quality Program Standards. In Wave IV, additional sections gathered data on organizations’ use of AmeriCorps and AmeriCorps*VISTA members, the partnerships they maintain, and the collaboratives they join. The Wave V survey again asked about the use of AmeriCorps and AmeriCorps*VISTA members, as well as gathered data on mentoring capacity. For Wave VI of the census, organizations were asked not only which Mentor Michigan services they used, but how helpful they found each service. In addition, questions were asked regarding collaboration on mentoring efforts among programs. In Wave VII, questions were added to identify capacity changes within mentoring organizations and assess the impact of the economic environment on these organizations. In addition, Wave VII sought input for ideas and strategies to be implemented by Mentor Michigan in the future. Mentor Michigan has adopted the National Mentoring Partnership’s definition of mentoring. “Mentoring is a structured and trusting relationship that brings young people together with caring individuals who offer guidance, support, and encouragement aimed at developing the competence and character of the mentee.” Responsible mentoring can take many forms:
• Traditional mentoring (one adult to one young person) • Group mentoring (one adult to up to four young people) • Team mentoring (several adults working with small groups of young people, in
which the adult to youth ratio is not greater than 1:4) • Peer mentoring (caring youth mentoring other youth)
Scope and Nature of Mentoring
Kahle Research Solutions Page 50 Final – 1/20/2010
• E-mentoring (mentoring via e-mail and the Internet)
The MMC uses the mentoring funnel as a conceptual framework. The mentoring funnel can be used by organizations and Mentor Michigan when planning, implementing and assessing efforts to provide mentors to children who need them. The funnel identifies key steps in the recruitment and mentoring process to be measured, including number of inquires from potential mentors, number of written applications, background checking processes, training process, number and type of mentoring matches, duration and intensity of matches and mentors repeating the mentoring experience or referring others to become mentors. See the “State of Mentoring in Michigan” for more information.