the scl language for parallel...
TRANSCRIPT
Using Cross-Platform Graphic Packages forGUIs and Data Plotting
with SCL and C/C++
José M. Garrido C.
Department of Computer ScienceCollege of Science and Mathematics
Kennesaw State University
November 7, 2014
José M. Garrido C. Graphic Packages for GUIs and Data Plotting
Presentation Agenda
1 General Goals2 Concepts and Background Overview3 Graphics for GUIs and data plotting4 Implementing Computational Models with C and graphics5 Demonstration of C programs using graphic libraries on
Linux
cs.kennesaw.edu/~jgarrido/comp_models
José M. Garrido C. Graphic Packages for GUIs and Data Plotting
A Computational Model
An software implementation of the solution to a (scientific)complex problemIt usually requires a mathematical model or mathematicalrepresentation that has been formulated for the problem.The software implementation often requireshigh-performance computing (HPC) to run.
José M. Garrido C. Graphic Packages for GUIs and Data Plotting
Abstraction and Decomposition
Abstraction is recognized as a fundamental and essentialprinciple in problem solving and software development.Abstraction and decomposition are extremely importantin dealing with large and complex systems.Abstraction is the activity of hiding the details and exposingonly the essential features of a particular system.In modeling, one of the critical tasks is representing thevarious aspects of a system at different levels ofabstraction.A good abstraction captures the essential elements of asystem, and purposely leaving out the rest.
José M. Garrido C. Graphic Packages for GUIs and Data Plotting
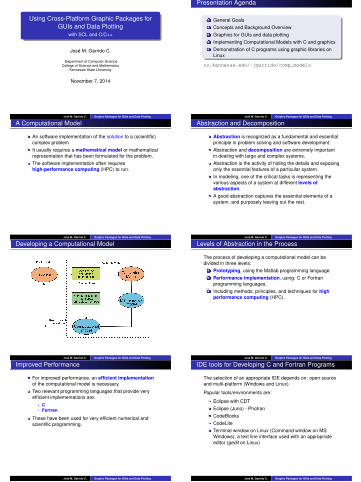
Developing a Computational Model
José M. Garrido C. Graphic Packages for GUIs and Data Plotting
Levels of Abstraction in the Process
The process of developing a computational model can bedivided in three levels:
1 Prototyping, using the Matlab programming language2 Performance implementation, using: C or Fortran
programming languages.3 Including methods, principles, and techniques for high
performance computing (HPC).
José M. Garrido C. Graphic Packages for GUIs and Data Plotting
Improved Performance
For improved performance, an efficient implementationof the computational model is necessary.Two relevant programming languages that provide veryefficient implementations are:
CFortran.
These have been used for very efficient numerical andscientific programming.
José M. Garrido C. Graphic Packages for GUIs and Data Plotting
IDE tools for Developing C and Fortran Programs
The selection of an appropriate IDE depends on: open sourceand multi-platform (Windows and Linux).
Popular tools/environments are:
Eclipse with CDTEclipse (Juno) - PhotranCodeBlocksCodeLiteTerminal window on Linux (Command window on MSWindows), a text line interface used with an appropriateeditor (gedit on Linux)
José M. Garrido C. Graphic Packages for GUIs and Data Plotting
Structure of a C Program
José M. Garrido C. Graphic Packages for GUIs and Data Plotting
Compiling a C Program
José M. Garrido C. Graphic Packages for GUIs and Data Plotting
Linking a C Program
José M. Garrido C. Graphic Packages for GUIs and Data Plotting
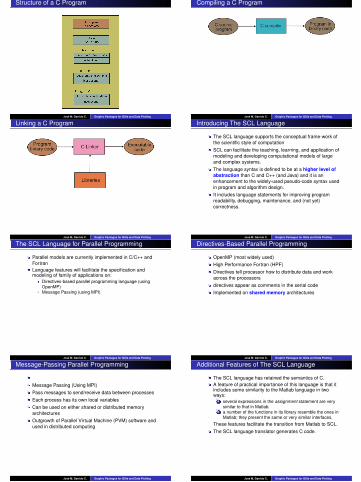
Introducing The SCL Language
The SCL language supports the conceptual frame-work ofthe scientific style of computationSCL can facilitate the teaching, learning, and application ofmodeling and developing computational models of largeand complex systems.The language syntax is defined to be at a higher level ofabstraction than C and C++ (and Java) and it is anenhancement to the widely-used pseudo-code syntax usedin program and algorithm design.It includes language statements for improving programreadability, debugging, maintenance, and (not yet)correctness.
José M. Garrido C. Graphic Packages for GUIs and Data Plotting
The SCL Language for Parallel Programming
Parallel models are currently implemented in C/C++ andFortranLanguage features will facilitate the specification andmodeling of family of applications on:
Directives-based parallel programming language (usingOpenMP)Message Passing (using MPI)
José M. Garrido C. Graphic Packages for GUIs and Data Plotting
Directives-Based Parallel Programming
OpenMP (most widely used)High Performance Fortran (HPF)Directives tell processor how to distribute data and workacross the processorsdirectives appear as comments in the serial codeImplemented on shared memory architectures
José M. Garrido C. Graphic Packages for GUIs and Data Plotting
Message-Passing Parallel Programming
Message Passing (Using MPI)Pass messages to send/receive data between processesEach process has its own local variablesCan be used on either shared or distributed memoryarchitecturesOutgrowth of Parallel Virtual Machine (PVM) software andused in distributed computing
José M. Garrido C. Graphic Packages for GUIs and Data Plotting
Additional Features of The SCL Language
The SCL language has retained the semantics of C.A feature of practical importance of this language is that itincludes some similarity to the Matlab language in twoways:
1 several expressions in the assignment statement are verysimilar to that in Matlab.
2 a number of the functions in its library resemble the ones inMatlab; they present the same or very similar interfaces.
These features facilitate the transition from Matlab to SCL.The SCL language translator generates C code.
José M. Garrido C. Graphic Packages for GUIs and Data Plotting

The SCL Translator
The SCL language translator is implemented as aone-pass language processor that parses an SCL programand generates C source code.The translator flags general syntax errorsThe generated code can be integrated conveniently withany C or C++ library.The basic run-time support of this language consists of theGnu Scientific Library (GSL) and a set of additional Cfunctions that are used with to facilitate the development ofcomputational models.
José M. Garrido C. Graphic Packages for GUIs and Data Plotting
SCL Translation and C Compilation/Linkage
José M. Garrido C. Graphic Packages for GUIs and Data Plotting
Modules
A program is usually partitioned into several modules. Thisis known as modular design.A function is the most basic decomposition unit in a Cprogram and it carries out a specific task in a program.A module in C is a related collection of C functions. Thesefunctions will normally be stored in a single C source file.In object oriented programming languages, such as C++and Java, the fundamental module is a class.Every module has a specific purpose and may beimplemented in a specific programming language.
José M. Garrido C. Graphic Packages for GUIs and Data Plotting
Fundamental Principles of Modular Design
Coupling — a high-level description of the dependency ofa module on other modules. Description of the interfaces.A module should exhibit loose coupling.Cohesion — the level of dependency within the module. Amodule should exhibit strong cohesion.Separation of Concerns. Each module should address aseparate concern (one aspect of functionality).
José M. Garrido C. Graphic Packages for GUIs and Data Plotting
Modular Design with Graphics
A program that implements a computational model ispartitioned into several modules at various levels of detail.At the highest level of abstraction, only the top modules aredefined.This level is adequate when a program includes:
a GUI module for user interaction (front–end module)the main logic or backend module (the computational modelimplementation)the module for the data visualization of the output dataproduced by the main logic module.
José M. Garrido C. Graphic Packages for GUIs and Data Plotting
High-level Modular Structure
José M. Garrido C. Graphic Packages for GUIs and Data Plotting
Software Tools for Implementing GUIs
There are several good GUI toolkits or packages and mostare implemented in C or C++.Several of these packages are based on the OPENGLstandard. Some of the most widely-used toolkits for GUIimplementation are:
GLUI – A very small and simple package that isimplemented on top of GLUT/OPENGL.FLTK – A slightly larger package that is also based onOPENGL.Other similar packages are GLFW,GLOW, FOX, and GLV.More complete, larger, and more sophisticated packagesare: WxWidgets (Wxwindows), GTK+, and Qt.Other packages are more geared toward gamedevelopment, such as SDL.
José M. Garrido C. Graphic Packages for GUIs and Data Plotting
Software Tools for Plotting
There are several packages for data plotting and most areimplemented in C or C++.Some of the most widely-used toolkits for plotting are:
GnuPlot – A very versatile and simple package that iswidely known and well-documented.Spreadsheet programs – A general-purpose business typeof software packages.PlPlot – A library of C functions with bindings for otherprogramming languages.DisLin – A library of C functions with bindings for otherprogramming languages.GluPlot – A C++ library and utility for data plottingGlPlot – A C++ library and utility for data plottingOther packages are more geared toward plotting and dataanalysis , such as Ggobi.
José M. Garrido C. Graphic Packages for GUIs and Data Plotting
Gnuplot Plotting Utility
Gnuplot is a portable command-line driven graphing utilityfor Linux, MS Windows, MacOS X, and other platforms.The source code is copyrighted but freely distributed.It was originally created to allow scientists and students tovisualize mathematical functions and data interactively, buthas grown to support many non-interactive uses such asweb scripting.It is also used as a plotting engine by third-partyapplications like Octave.Gnuplot has been supported and under activedevelopment since 1986.
José M. Garrido C. Graphic Packages for GUIs and Data Plotting
Programs with Gnuplot
These examples store the problem data on a file *.gpl andthe GnuPlot commands in a file *.cgp
The free-falling object, the files are: ffallobj_ode.cand ffallobj_ode.sh For plotting: ffallobjode.gpl,ffallobjode.cgp, ffallobjode.png,ffallobjodev.gpl, and *.png.Falling object with a drag force, with a mathematical modelgiven by two first-order ODEs. Files: ffallobj_drag.cand ffallobj_drag.sh. For plotting:ffallobj_drag.gpl, ffallobj_drag.cgp, *.pngThe Lorenz equations program, the files are: elorenz.c,and elorenz.sh. For plotting: elorenz.gpl,elorenz.cgp, elorenz_zx.cgp, elorenz.png,elorenz_zx.png, elorenz_xyz.cgp, andelorenz_xyz.png.
José M. Garrido C. Graphic Packages for GUIs and Data Plotting
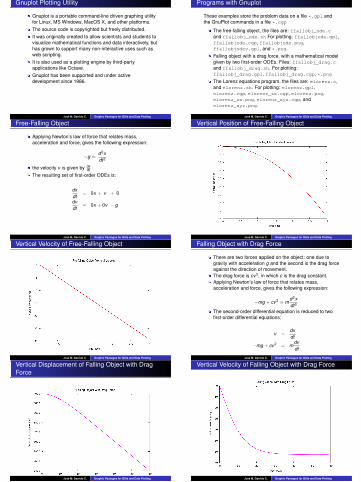
Free-Falling Object
Applying Newton’s law of force that relates mass,acceleration and force, gives the following expression:
−g =d2xdt2
the velocity v is given by dxdt
The resulting set of first-order ODEs is:
dxdt
= 0x + v + 0
dvdt
= 0x + 0v − g
José M. Garrido C. Graphic Packages for GUIs and Data Plotting
Vertical Position of Free-Falling Object
José M. Garrido C. Graphic Packages for GUIs and Data Plotting
Vertical Velocity of Free-Falling Object
José M. Garrido C. Graphic Packages for GUIs and Data Plotting
Falling Object with Drag Force
There are two forces applied on the object: one due togravity with acceleration g and the second is the drag forceagainst the direction of movement.The drag force is cv2, in which c is the drag constant.Applying Newton’s law of force that relates mass,acceleration and force, gives the following expression:
−mg + cv2 = md2xdt2
The second-order differential equation is reduced to twofirst-order differential equations:
v =dxdt
−mg + cv2 = mdvdt
José M. Garrido C. Graphic Packages for GUIs and Data Plotting
Vertical Displacement of Falling Object with DragForce
José M. Garrido C. Graphic Packages for GUIs and Data Plotting
Vertical Velocity of Falling Object with Drag Force
José M. Garrido C. Graphic Packages for GUIs and Data Plotting
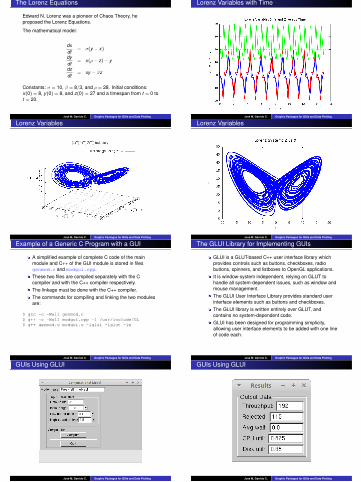
The Lorenz Equations
Edward N. Lorenz was a pioneer of Chaos Theory, heproposed the Lorenz Equations.
The mathematical model:
dxdt
= σ(y − x)
dydt
= x(ρ− z)− y
dzdt
= xy − βz
Constants: σ = 10, β = 8/3, and ρ = 28. Initial conditions:x(0) = 8, y(0) = 8, and z(0) = 27 and a timespan from t = 0 tot = 20.
José M. Garrido C. Graphic Packages for GUIs and Data Plotting
Lorenz Variables with Time
José M. Garrido C. Graphic Packages for GUIs and Data Plotting
Lorenz Variables
José M. Garrido C. Graphic Packages for GUIs and Data Plotting
Lorenz Variables
José M. Garrido C. Graphic Packages for GUIs and Data Plotting
Example of a Generic C Program with a GUI
A simplified example of complete C code of the mainmodule and C++ of the GUI module is stored in filesgenmod.c and modgui.cpp.These two files are compiled separately with the Ccompiler and with the C++ compiler respectively.The linkage must be done with the C++ compiler.The commands for compiling and linking the two modulesare:
$ gcc -c -Wall genmod.c$ g++ -c -Wall modgui.cpp -I /usr/include/GL$ g++ genmod.o modgui.o -lglui -lglut -lm
José M. Garrido C. Graphic Packages for GUIs and Data Plotting
The GLUI Library for Implementing GUIs
GLUI is a GLUT-based C++ user interface library whichprovides controls such as buttons, checkboxes, radiobuttons, spinners, and listboxes to OpenGL applications.It is window-system independent, relying on GLUT tohandle all system-dependent issues, such as window andmouse management.The GLUI User Interface Library provides standard userinterface elements such as buttons and checkboxes.The GLUI library is written entirely over GLUT, andcontains no system-dependent code.GLUI has been designed for programming simplicity,allowing user interface elements to be added with one lineof code each.
José M. Garrido C. Graphic Packages for GUIs and Data Plotting
GUIs Using GLUI
José M. Garrido C. Graphic Packages for GUIs and Data Plotting
GUIs Using GLUI
José M. Garrido C. Graphic Packages for GUIs and Data Plotting

Using FLTK
The same general procedure used previously applies whenimplementing GUIs using the FLTK package.In the following example, the main difference is the list ofnames of the functions to get the input values from the GUImodule and the names of the functions to set the outputvalues of the results.The commands for compiling and linking the two modulesusing FLTK are:
$ gcc -c -Wall fgenmod.c$ g++ -c -Wall fmodgui.cpp$ g++ fgenmod.o fmodgui.o -lfltk -lm
José M. Garrido C. Graphic Packages for GUIs and Data Plotting
GUIs Using FLTK
José M. Garrido C. Graphic Packages for GUIs and Data Plotting
GUIs Using FLTK
José M. Garrido C. Graphic Packages for GUIs and Data Plotting
The Files that Use GLUI
The compressed archive genmod.tar.gz includes files:genmod.c, modgui.cpp, genmod.mak, and thecorresponding object files.The compressed archive, ffallobj3g.tar.gz, includesthe following files: ffallobj3g.c, compgui.cpp,ffallobjeg.mak, ffallobj3g.o, compgui.o, andffallobj3g.These files make up the project of the Free-falling objectcomputational model, which uses the GLUI package.To extract the files from the archive ffallobj3.tar.gz,type the following command on an appropriate directory:
$ tar -zxvf ffallobj3g.tar.gz
José M. Garrido C. Graphic Packages for GUIs and Data Plotting
The Files that Use FLTK
The archive fgenmod.tar.gz includes the following files:fgenmod.c, fmodgui.cpp, fgenmod.mak, fgenmod.o,fmodgui.o, and fgenmod.The archive fffallobj3f.tar.gz includes the followingfiles: ffallobj3.c, fmodguif.cpp, ffallobj3f.mak,and the corresponding object files.These files make up the project, which uses the FLTKpackage.All the files are stored on the web site:
cs.kennesaw.edu/~jgarrido/comp_models
José M. Garrido C. Graphic Packages for GUIs and Data Plotting
The Cartesian Plotting Library
The Cartesian library is based on FLTK graphical toolkitand is used to display various plots within real X and Ycoordinates.The main usage is visualization of scientific data but thelibrary is extensible.The plotting of coordinate axes and generation of tics isprovided.Automatic modes can generate tics with proper "density"so that when the drawing is rescaled, the number of ticscan automatically change to keep drawings withoutoverlapping labels.Each drawing can have any number of vertical and/orhorizontal axes with custom position relative to the plottingarea (left, right, top or bottom).
José M. Garrido C. Graphic Packages for GUIs and Data Plotting
Program Using The Cartesian Plotting Library
The Free-falling object program is formulated with amathematical model based on an ODE and solved with theGSL. The program consists of three modules:
1 The main logic in module ffallobjf_ode.c2 The module for the GUI: fmodgui.cpp3 The module that plots the data generated by the main
module: cartmod2.cpp.
The make file is: ffallobjf2.mak.
José M. Garrido C. Graphic Packages for GUIs and Data Plotting
Lorenz Equations Using The Cartesian Plotting Library
The Lorenz Equations consists of a formulation of threefirst-order differential equations.The program uses the GSL to solve numerically the ODEs.The program consists of two modules:
1 The main module: elorenz3g.c2 The module that plots the data: cartlorenz.cpp
The make file is: elorenz3g.mak
José M. Garrido C. Graphic Packages for GUIs and Data Plotting