the science of social video turning views … · 1turnig vewsoal2cidmopi3yyi4vews5i4252 l2fp 3...
TRANSCRIPT

©2016 Brightcove, Inc. All Rights Reserved. 1
THE SCIENCE OF SOCIAL VIDEO
TURNING VIEWS INTO VALUEWith eight in ten consumers engaging with brands on social media, and three in four consumers linking social video viewing to purchasing decisions, we examine how
brands can make the most of this opportunity.
The meteoric rise of video viewing on social media networks has been a hot topic
of conversation over recent years. Amongst the most quoted stats are these facts:
• Facebook now receives 8 billion video views per day, while Snapchat reportedly goes 2 billion better with 10 billion views.
• Though YouTube is typically more vague with its stats–preferring to measure
its growth in terms of hours spent than views and stating that every day
“people watch hundreds of millions of hours” on the site.
• Twitter recently released figures showing that its video views had grown by
220% in the 12 months previous.
• Building upon numbers like these, Cisco has predicted that by 2019, 80% of
the world’s consumer Internet traffic will be made up of video.
For brands, the growth in the popularity of social video represents a massive opportunity to
reach a large and captive audience—but only if approached correctly. With such a vast array
of social media networks to keep track of however, how can brands navigate their way around
them successfully? And what can they learn about the where, what, and why of current social
video viewing habits in order to capitalise on them?
Why Read This ReportIn September 2016, Brightcove commissioned research firm Vanson Bourne to examine
consumers’ changing social video engagement habits and preferences. The goal of the research
was to ascertain how brand social video in particular is driving, or has the potential to drive,
behaviours across the buying cycle.
Incorporating the responses of 5,500 viewers aged 18 years and over across the UK, France,
Germany, US, and Australia, this report offers not only a fascinating snapshot into the evolving
world of social video, but also a glimpse at the benefits for those brands who are able to turn it
to their advantage.

©2016 Brightcove, Inc. All Rights Reserved. 2
SOCIAL VIDEO CONSUMPTION
If the industry stats in our introduction
weren’t enough to convince you of social
video’s rapid rise to prominence, then
perhaps this one will. Our results showed
that consumers are spending an average of
six hours per week watching video content
on social media networks alone.
Nearly seven in ten (67%) said that this
amount has increased in the last twelve
months–a fifth said considerably so–and
three fifths expect it to continue rising over
the next year.
When it comes to preference, YouTube is
the indisputably dominant social network.
Consumers told us that half (50%) of their
social video views currently take place on
YouTube, a third (36%) on Facebook, and
the remaining 14% is split over networks like
Snapchat, Twitter and Instagram. This same
split could broadly be seen across all five
countries that were surveyed.
SOCIAL VIDEO PREFERENCE BY NETWORK
Perhaps unsurprisingly, the most popular
social video content types are music videos
(56% watch), User Generated Content
(53% watch) and film trailers (52% watch).
Differing slightly in order depending on
viewing location, music videos were the top
choice on YouTube, and UGC the top choice
for almost all the other social networks.
Going against the crowd however, users of
LinkedIn picked news as their number one
video type (35%).
Across the social networks, the top three
ways consumers discover their video
content are when they scroll through
newsfeeds (62%), when it is shared by
someone on their network (49%) and when
they actively look for it (46%).
Consumers are spending an average of six hours per week watching video content on social media networks alone.
YouTube Facebook Other
50%36%
14%

©2016 Brightcove, Inc. All Rights Reserved. 3
COUNTRY COMPARISONS• Australia showed the highest
growth in social video views over
the past year–with 73% of Australian
consumers admitting to an increase
in the amount they watch
• When asked to look ahead to
the next twelve months, French
consumers predicted the least growth
in their views (only 53% expected
to watch more social video)
• Americans emerged as the most
likely to watch ‘how-to’ videos (44%)
or live streamed content (25%)
• Germany saw the highest viewership
for music video content (61%),
but the lowest comparative
figure for UGC videos (43%)
• Germans were also most likely to
actively look for video content–60%
discover videos this way, while the
French are the least likely (38%) to do so
Regardless of consumers’ preferences for social network, content type or discovery method, our results clearly underline the rising popularity of social video. But what does this wealth of views actually look like in terms of engagement?
MINUTES OF SOCIAL VIDEO CONSUMERS WATCH PER DAY
PERCENTAGE OF CONSUMERS THAT INTERACT WITH BRANDS ON SOCIAL MEDIA
PERCENT OF TIME SPENTON EACH CHANNEL
UNITEDKINGDOM
46UNITEDSTATES
60
GERMANY
44
FRANCE
37
AUSTRALIA
51
US
Au
stra
lia
Fra
nce
Germ
an
y
UK
YouTube
Other
0
20
40
60
80
France
75%
44% watch branded videos
39% made a purchase after
watching branded video
Germany
77%
31% watch branded videos
41% made a purchase after
watching branded video
United Kingdom
80%
47% watch branded videos
43% made a purchase after
watching branded video
Australia
83%
47% watch branded videos
48% made a purchase after
watching branded video
United States
85%
45% watch branded videos
53% made a purchase after
watching branded video
©2016 Brightcove, Inc. All Rights Reserved. 4
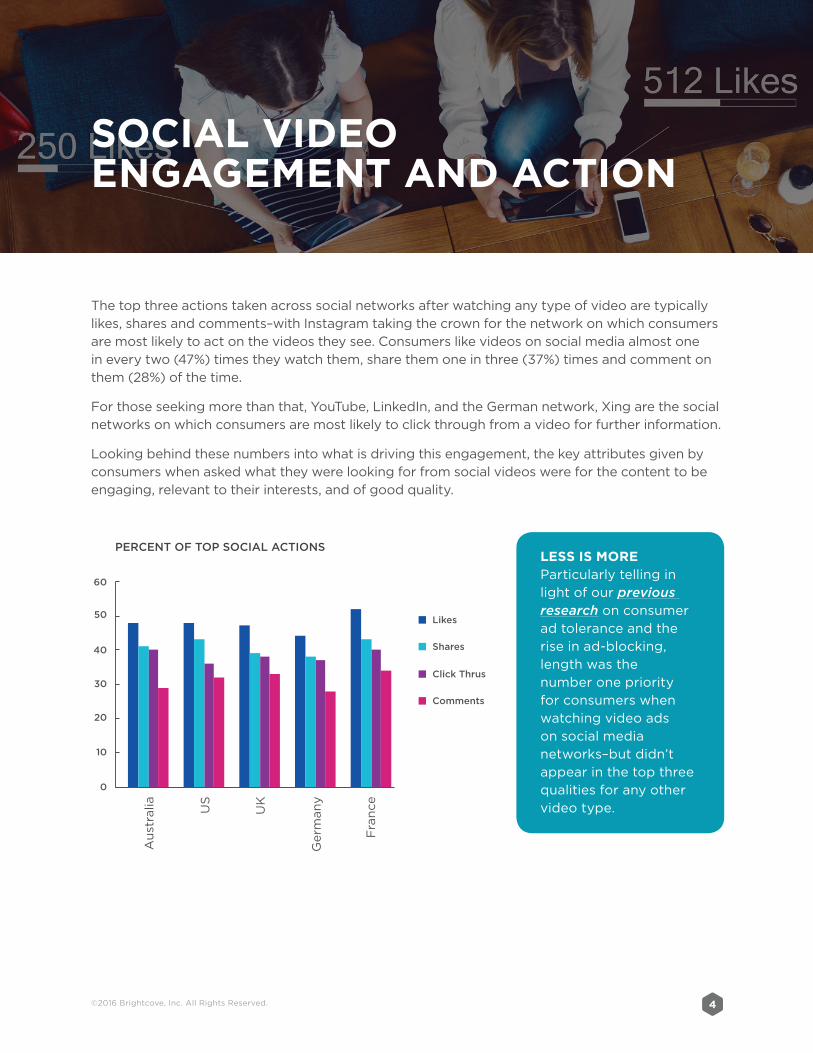
LESS IS MOREParticularly telling in
light of our previous research on consumer
ad tolerance and the
rise in ad-blocking,
length was the
number one priority
for consumers when
watching video ads
on social media
networks–but didn’t
appear in the top three
qualities for any other
video type.
SOCIAL VIDEO ENGAGEMENT AND ACTION
The top three actions taken across social networks after watching any type of video are typically
likes, shares and comments–with Instagram taking the crown for the network on which consumers
are most likely to act on the videos they see. Consumers like videos on social media almost one
in every two (47%) times they watch them, share them one in three (37%) times and comment on
them (28%) of the time.
For those seeking more than that, YouTube, LinkedIn, and the German network, Xing are the social
networks on which consumers are most likely to click through from a video for further information.
Looking behind these numbers into what is driving this engagement, the key attributes given by
consumers when asked what they were looking for from social videos were for the content to be
engaging, relevant to their interests, and of good quality.
US
Au
stra
lia
Fra
nce
Germ
an
y
UK
0
20
10
40
60
50
30
Likes
Shares
Click Thrus
Comments
PERCENT OF TOP SOCIAL ACTIONS
©2016 Brightcove, Inc. All Rights Reserved. 5
PREFERENCES FOR BRAND VIDEO CONTENT
Though the general results paint a highly
attractive picture of social video in terms of
viewer numbers and engagements levels,
the key question for brands is whether this
consumer interest is transferring across
to their content–something we set out to
investigate further.
As a starting point, over eight in ten (81%)
consumers said they engage with brands on
social media.
Breaking this down, half (50%) of all
consumers said that they read brand posts
on their newsfeeds, and a little over two fifths
(43%) watch brand videos in their newsfeeds
or become a fan of brand pages (42%).
With the most brand video viewing currently
taking place on LinkedIn and Periscope,
consumers appear to look for exactly the
same top three qualities from brand videos as
with any other form. Our results also revealed
that over a third of consumers (36%) would
be more likely to watch content if shared by
a brand–a level of trust that was particularly
apparent in the US (40%).
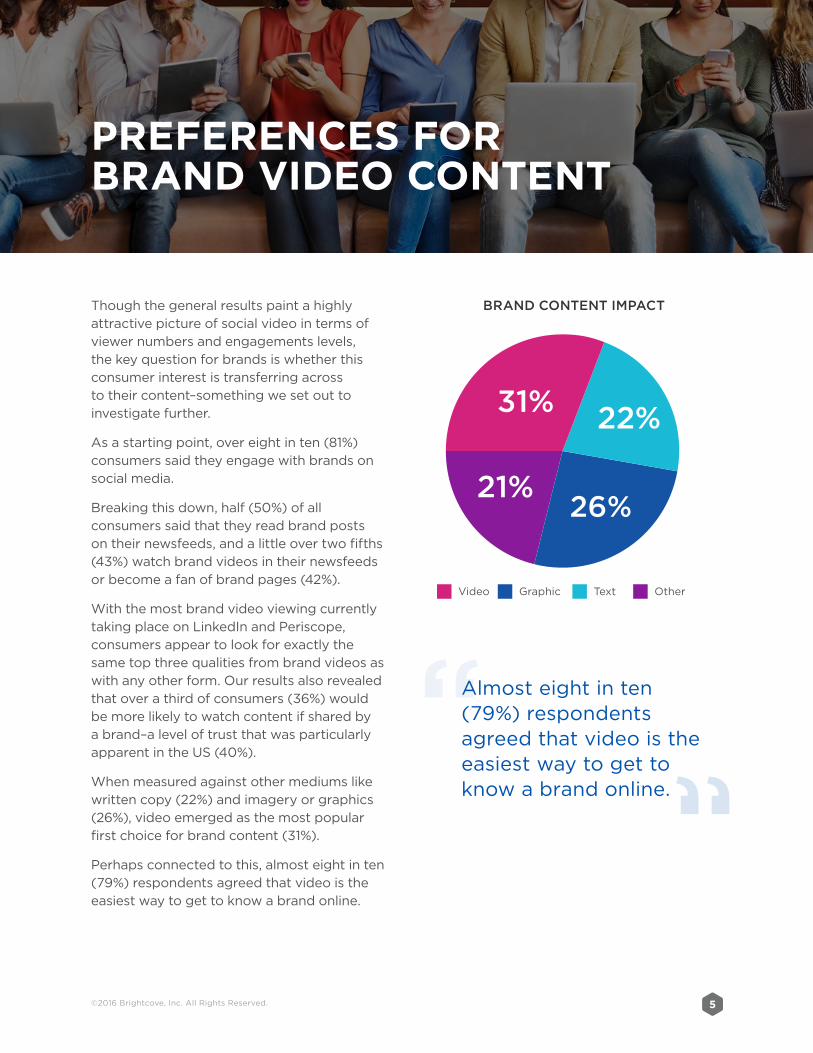
When measured against other mediums like
written copy (22%) and imagery or graphics
(26%), video emerged as the most popular
first choice for brand content (31%).
Perhaps connected to this, almost eight in ten
(79%) respondents agreed that video is the
easiest way to get to know a brand online.
BRAND CONTENT IMPACT
31% 22%
21%26%
Video Graphic Text Other
Almost eight in ten (79%) respondents agreed that video is the easiest way to get to know a brand online.

©2016 Brightcove, Inc. All Rights Reserved. 6
MOVING TOWARDS SOCIAL VIDEO CONVERSION
Getting to know a brand is an excellent starting point, but the ultimate goal for any business is
achieving that ever elusive connection to sales. In this regard, our results provided some highly
compelling evidence of success.
First and foremost, nearly three quarters (74%) of consumers pointed to a connection between
watching a video on social media and their purchasing decision-making process. In fact, nearly
half (46%) of consumers said they have actually made a purchase as a result of watching a
brand video on social media, and another third (32%) have considered doing so.
Videos that converted sales successfully were noted to have provided the right level of
information on the brand or product in question (57% of respondents said this was a
factor), and be relevant to the consumer’s interest (54%). In terms of their efficacy, of equal
significance was the fact that the vast majority of consumers (92%) confirmed that they
recognise when a brand video on social media is encouraging them to take an action such as
to buy something.
COUNTRY COMPARISONS• The US had the highest percentage
of consumers (85%) that interact
with brands on social media
• Comparatively, one in four French
consumers say they never interact with
brands on social media–making them the
lowest ranked country for interaction
• Though Germans chose becoming
fans of brand pages (44%) as their
top method for interaction, it was
consumers in the US who were most
likely to take this action (48%)
• 53% of US consumers have actually
made a purchase as a result of
watching a brand video on social
media. This is the highest conversion
percentage of all five countries
• Australian and German consumers
are the least likely to recognise a
call-to-action in a brand video
Nearly three quarters (74%) of consumers pointed to a connection between watching a video on social media and their purchasing decision-making process.

©2016 Brightcove, Inc. All Rights Reserved. 7
MAKING THE MOST OF THE OPPORTUNITY
Whilestatslikethoseintheprevioussection
provethehugepotentialofsocialvideo,our
researchalsoindicatedanumberofareas
wherethereisopportunityforbrandsto
pushitsvalueevenhigher.
Itwasnotsolongagothatsocialnetworks
mighthavebeenconsideredtheexclusive
domainforentertainmentcontent.However,
asbrandscontinuetoinvestinsocialmedia,
andassocialnetworksinvestmorein
videocapabilities,brandvideohasgrown
to14%ofthevideocontentconsumed
onsocialnetworks.Withovereightinten
(81%)consumersinteractingwithbrands
onthesesocialchannels,andthreeinfour
(78%)viewersmakingdecisionsbasedon
thebrandvideostheywatch,thispresentsa
tremendousopportunityforbrandstoinvest
insocialvideostrategies.
Whatismore,ourresultsshowthatbrands
arenowgoinghead-to-headwithmusic
videos,filmtrailersandUGCtoearna
significantnumberofeyeballs.Fourteen
percent(14%)ofthe500millionusersthat
werereportedlywatchingFacebookvideos
onadailybasisinthethirdquarteroflast
year,forexample,wouldbeahugeaudience.
Justimaginewhatthataudiencewouldlook
likeifbrandscouldfindwaystoincrease
theirviewershippercentageevenmore!
Pointingtoonepossibleareafor
development,86%ofrespondentssaidthat
thebrandvideostheywatchonsocialmedia
networksweren’talwaysrelevanttothem.
Thiswasalsooneofthekeyfactorsgiven
fornotmakingapurchaseafterwatchinga
brandvideo,alongwiththecontentcoming
acrossastoopromotional.
Theimpactofsuchanexperienceisclear–
afterwatchingabadbrandvideoathird
ofconsumerstoldustheyarelesslikelyto
watchmorecontentfromthatbrand,and
slightlylesslikely(29%)toeitherconsider
becomingacustomerormakingapurchase.
Afifthoftherespondentswouldalso
discourageothersfromengagingwiththe
brand–causingaknock-oneffectbeyondthe
individualviewer.
WHEN BRAND VIDEO GOES BAD
So,withsocialvideoofferingsomuch
opportunityformarketers,howdothey
avoidtheabovepitfallstoensuretheyare
takingfulladvantageofit?
20% OF RESPONDENTSwould discourage others fromengaging with the brand
29% OF RESPONDENTSare less likely to become acustomer/make a purchase
33% OF RESPONDENTSare less likely to watch morecontent from the brand

©2016 Brightcove, Inc. All Rights Reserved. 8
THE SCIENCE OF SOCIAL SUCCESS
Brands, currently, have six whole hours a week to engage with consumers via social video.
Brands need to do more to ensure their videos stand out from the crowd. They need to deliver
what consumers want through careful targeting, a tailored approach to each social network, and
by paying attention to their audience’s ongoing preferences so they can monitor and adapt the
video content they serve.
DOES IT SOUND COMPLICATED? IT DOESN’T NEED TO BE.We’ve collected some top industry pointers, by social network, to get your social video
strategy started.
TWITTER FACEBOOK YOUTUBE
Audience type Skews slightly more towards male users
More traction with female users
More global in nature (88 countries and 76 languages represented)
Audience age Relatively young (18-29 year old age range, followed by 30-49 year old age range)
Relatively young (18-29 year old age range, followed by 30-49 year old age range); it is also the favourite network for the older generations (50-64 year old age range, 65+ year old age range)
The older millennial generation (25-34 year old age range)
Video length The maximum video length on Twitter is 140 seconds, however industry research has shown that 80% of users will only watch a full video if it's 30 seconds or less
Ideally 15 seconds–40% of a Facebook audience will watch until the end of a 1-16 second long Facebook video, but this drops to 18% for videos over 30 seconds
Of the most engaging uploads, videos that were between 16 seconds and 2 minutes had 53.8% of all YouTube views
©2016 Brightcove, Inc. All Rights Reserved. 9
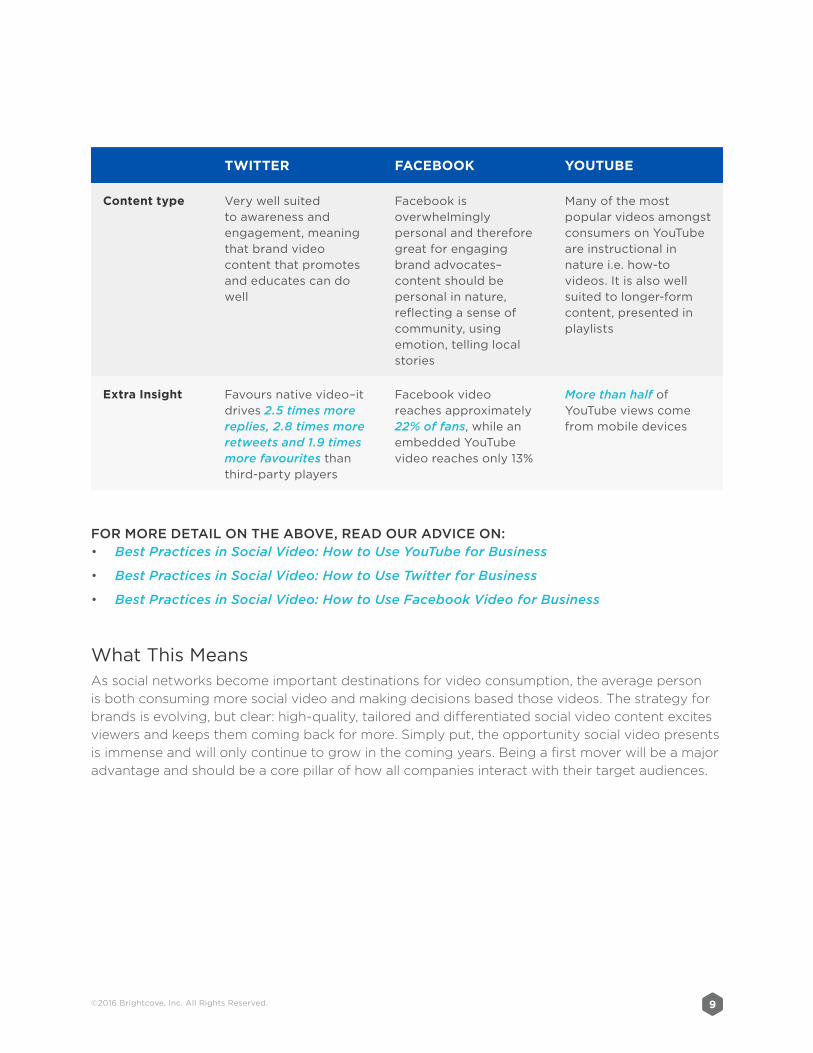
TWITTER FACEBOOK YOUTUBE
Content type Very well suited to awareness and engagement, meaning that brand video content that promotes and educates can do well
Facebook is overwhelmingly personal and therefore great for engaging brand advocates–content should be personal in nature, reflecting a sense of community, using emotion, telling local stories
Many of the most popular videos amongst consumers on YouTube are instructional in nature i.e. how-to videos. It is also well suited to longer-form content, presented in playlists
Extra Insight Favours native video–it drives 2.5 times more replies, 2.8 times more retweets and 1.9 times more favourites than third-party players
Facebook video reaches approximately 22% of fans, while an embedded YouTube video reaches only 13%
More than half of YouTube views come from mobile devices
FOR MORE DETAIL ON THE ABOVE, READ OUR ADVICE ON:• Best Practices in Social Video: How to Use YouTube for Business
• Best Practices in Social Video: How to Use Twitter for Business
• Best Practices in Social Video: How to Use Facebook Video for Business
What This MeansAssocialnetworksbecomeimportantdestinationsforvideoconsumption,theaverageperson
isbothconsumingmoresocialvideoandmakingdecisionsbasedthosevideos.Thestrategyfor
brandsisevolving,butclear:high-quality,tailoredanddifferentiatedsocialvideocontentexcites
viewersandkeepsthemcomingbackformore.Simplyput,theopportunitysocialvideopresents
isimmenseandwillonlycontinuetogrowinthecomingyears.Beingafirstmoverwillbeamajor
advantageandshouldbeacorepillarofhowallcompaniesinteractwiththeirtargetaudiences.

©2016 Brightcove, Inc. All Rights Reserved. 10
Getting a handle on the optimum video strategy for each social network is a vital first step.
But for brands to truly make the most of the huge opportunity that social video
presents, they need to be able to quickly and easily serve, manage and adapt their video
content across all social networks, in what is an ever-evolving social landscape.
Brightcove Social was developed with exactly this need in mind. Unlike traditional social media
marketing management tools, Brightcove Social is configured to deliver a premium video viewing
experience across numerous social sites, all managed within a single, easy-to-use platform.
For marketing organisations that want to reach social audiences
through video content, Brightcove Social allows them to:
• Manage and publish video content across their websites and to multiple social networks
• Aggregate video analytics from all destinations where the video is
published, including all their social views, in a single location
• Distribute video natively, optimised for each social network
• Edit videos and accompanying social posts according to the social network best practices
• Track multiple edits of a single video-and the location to which they are published.
Edit once, publish to multiple locations, all from a single interface
For more, visit brightcove.com/en/social
RESEARCH METHODOLOGY
Vanson Bourne, the research firm that conducted the survey, interviewed 5,500 consumers aged 18 years old and over in the
following countries: the UK, France, Germany, US, and Australia (1,000 respondents in the UK, France and Germany, 2,000 in the US,
and 500 in Australia). Fieldwork was conducted in September-October 2016.
ABOUT BRIGHTCOVE
Brightcove Inc. (NASDAQ:BCOV) is the leading global provider of powerful cloud solutions for delivering and monetizing video
across connected devices. The company offers a full suite of products and services that reduce the cost and complexity associated
with publishing, distributing, measuring, and monetizing video across devices. Brightcove has nearly 5,000 customers in over 70
countries that rely on the company’s cloud solutions to successfully publish high-quality video experiences to audiences everywhere.
To learn more, visit brightcove.com.