the science behind good user- - esriaustralia.com.au · the science behind good user-interface...
TRANSCRIPT


The science behind good user-interface designMichael F. Goodchild

The history of the GIS user interface

The history of the GIS user interface
• CGIS (1965)• Handling polygon coverages, less than 10
functions

The history of the GIS user interface
• CGIS (1965)• Handling polygon coverages, less than 10
functions
• ARC/INFO• More data types, more functions in each release

The history of the GIS user interface
• CGIS (1965)• Handling polygon coverages, less than 10
functions
• ARC/INFO• More data types, more functions in each release
• Today• Doubts about whether the data types + functions
can still scale

The problem
• GIS has many types of users• the GIS professional
• courses at post-secondary level• years of experience• habituated to existing interfaces
• the amateur• expects an intuitive interface that is easy to learn• the Child-of-10 standard
• and everything in between

The problem
The problem
• GIS has a reputation for being difficult to learn and use• a long, slow learning curve

The problem
• GIS has a reputation for being difficult to learn and use• a long, slow learning curve
• GIS requires users to think differently• to learn the language of GIS
• acronyms: DEM, DTM, DSM, DRG, DLG, DOQ, …• words that have GIS-specific meaning: polygon,
centroid, topology, …• new words: quadtree, polyline, viewshed,
geodesic, …
Why is GIS so hard?

Why is GIS so hard?• Geographic information is complex
• discrete objects, continuous fields• rasters, vectors• social, environmental phenomena

Why is GIS so hard?• Geographic information is complex
• discrete objects, continuous fields• rasters, vectors• social, environmental phenomena
• Many basic concepts are difficult• map projections• datums• scale• uncertainty
Why is GIS so hard?• Geographic information is complex
• discrete objects, continuous fields• rasters, vectors• social, environmental phenomena
• Many basic concepts are difficult• map projections• datums• scale• uncertainty
• GIS is used for many different purposes

…and more

…and more
• GIS is industrial strength

…and more
• GIS is industrial strength• Users focus on what buttons to push, what
commands to invoke• rather than on the concepts they are exploring

…and more
• GIS is industrial strength• Users focus on what buttons to push, what
commands to invoke• rather than on the concepts they are exploring
• GIS courses can be more like training than education
An educator’s perspective
• How to reward students who made it through three courses in GIS?• and still worried that they weren’t familiar with all
of ArcGIS• the fly-by (ArcScene)


Difficult spatial concepts
• Map projections• Designed for flattening the Earth• So it could be portrayed on a flat sheet of paper• Replace flat paper with the globe
• ArcGlobe• Other virtual globes• When the Earth’s curvature matters

1995 SIGGRAPH movie

Counter-arguments
Counter-arguments
• But the computer screen is flat• Yes, but if the user can spin the globe it is
perceived as a 3D object• Yes, so we still need the perspective orthographic
projection (a complicated way of saying how the Earth looks from space)

Counter-arguments
• But the computer screen is flat• Yes, but if the user can spin the globe it is
perceived as a 3D object• Yes, so we still need the perspective orthographic
projection (a complicated way of saying how the Earth looks from space)
• But what if you want to see the entire Earth at once?

Other difficult concepts

Other difficult concepts
• Scale (representative fraction or scale bar)• Use the metaphor of the height of the eye or a
helicopter

Other difficult concepts
• Scale (representative fraction or scale bar)• Use the metaphor of the height of the eye or a
helicopter
• Uncertainty• Visualize, animate
Other difficult concepts
• Scale (representative fraction or scale bar)• Use the metaphor of the height of the eye or a
helicopter
• Uncertainty• Visualize, animate
• Datums

The GeoWeb

The GeoWeb
• Data distributed on the Web

The GeoWeb
• Data distributed on the Web• GIS functions available as Web services
• discovered through online search
The GeoWeb
• Data distributed on the Web• GIS functions available as Web services
• discovered through online search
• A high level of interoperability• OGC, ISO standards

The GeoWeb
• Data distributed on the Web• GIS functions available as Web services
• discovered through online search
• A high level of interoperability• OGC, ISO standards
• CyberGIS• use of high-performance computing
• parallel algorithms

The GeoWeb
• Data distributed on the Web• GIS functions available as Web services
• discovered through online search
• A high level of interoperability• OGC, ISO standards
• CyberGIS• use of high-performance computing
• parallel algorithms
• Service-oriented architecture• chaining together remote services

The problem

The problem
• To support CyberGIS, SOA, discovery of services• we must formalize functionality• a common language to describe operations• interoperability across functions

The problem
• To support CyberGIS, SOA, discovery of services• we must formalize functionality• a common language to describe operations• interoperability across functions
• In 40 years of GIS development this has not been achieved• functionality is ad hoc, legacy, artifactual• another reason why GIS is difficult to learn and
use

Title Count of functions
3D Analyst Tools 34
Analysis Tools 19
Cartography Tools 43
Conversion Tools 46
Data Interoperability Tools 2
Data Management Tools 178
Editing Tools 7
Geocoding Tools 7
Geostatistical Analyst Tools 22
Linear Referencing Tools 7
Multidimension Tools 7
Network Analyst Tools 21
Parcel Fabric Tools 4
Schematics Tools 5
Server Tools 14
Spatial Analyst Tools 171
Spatial Statistics Tools 26
Tracking Analyst Tools 2
Total 615
Organization of the ArcGIS 10 Toolbox

Progress to date

Progress to date
• Formalizing representations• discrete objects and continuous fields

Progress to date
• Formalizing representations• discrete objects and continuous fields
• Discrete objects• points, lines, areas, volumes• OGC Simple Feature Model• object-oriented data modeling

Progress to date
• Formalizing representations• discrete objects and continuous fields
• Discrete objects• points, lines, areas, volumes• OGC Simple Feature Model• object-oriented data modeling
• Continuous fields• a single value at every point in the plane • six representations

The OGC Simple Feature Model (from MySQL 4.1)

The six discretizations of continuous fields that are commonly available in GIS
Point sampling on a raster Irregular point sampling Triangulated irregular network
Raster of cells Irregular polygons Digitized isolines

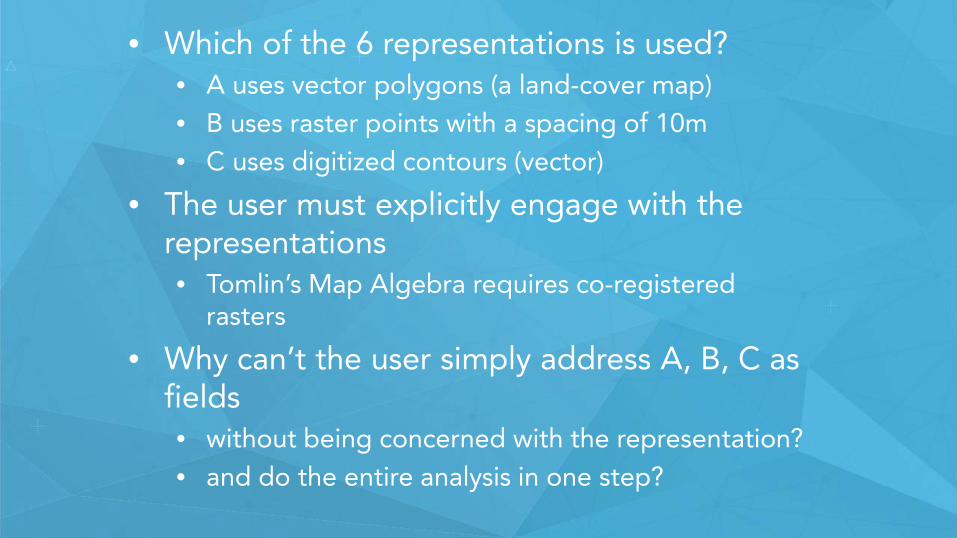
D = 1 if A = cropped and B > 0.05 and C > 100
else D = 0
A: land-cover typeB: slopeC: distance from stream


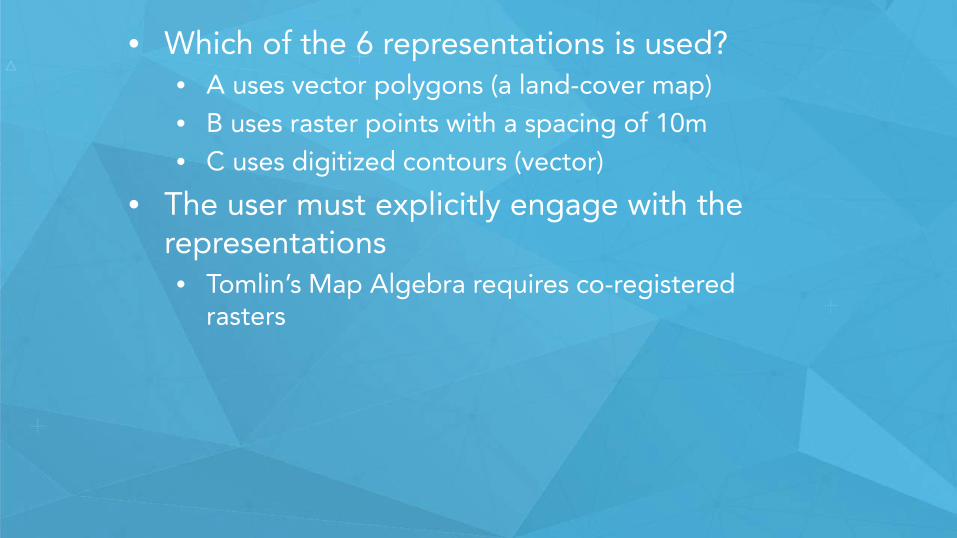
• Which of the 6 representations is used?• A uses vector polygons (a land-cover map)• B uses raster points with a spacing of 10m• C uses digitized contours (vector)
• Which of the 6 representations is used?• A uses vector polygons (a land-cover map)• B uses raster points with a spacing of 10m• C uses digitized contours (vector)
• The user must explicitly engage with the representations• Tomlin’s Map Algebra requires co-registered
rasters
• Which of the 6 representations is used?• A uses vector polygons (a land-cover map)• B uses raster points with a spacing of 10m• C uses digitized contours (vector)
• The user must explicitly engage with the representations• Tomlin’s Map Algebra requires co-registered
rasters
• Why can’t the user simply address A, B, C as fields• without being concerned with the representation?• and do the entire analysis in one step?

Three strategies for simplifying the user interface
• 1. Eliminate redundancy in operations• can the need for an operation be anticipated?
• Comparing two variables across space• are they both attributes of the same class of
objects?• if not a spatial join will be required
• topological overlay
• the join can be invoked automatically
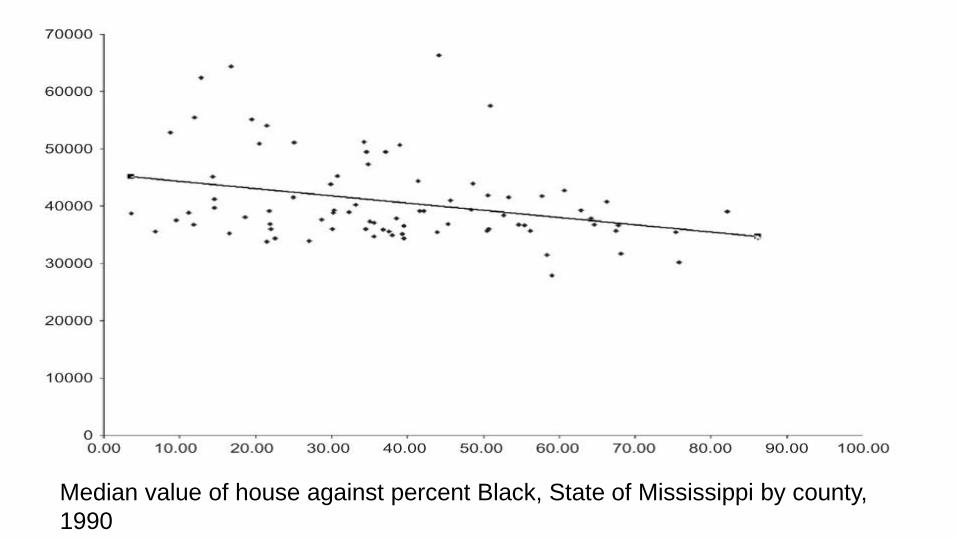
Median value of house against percent Black, State of Mississippi by county, 1990
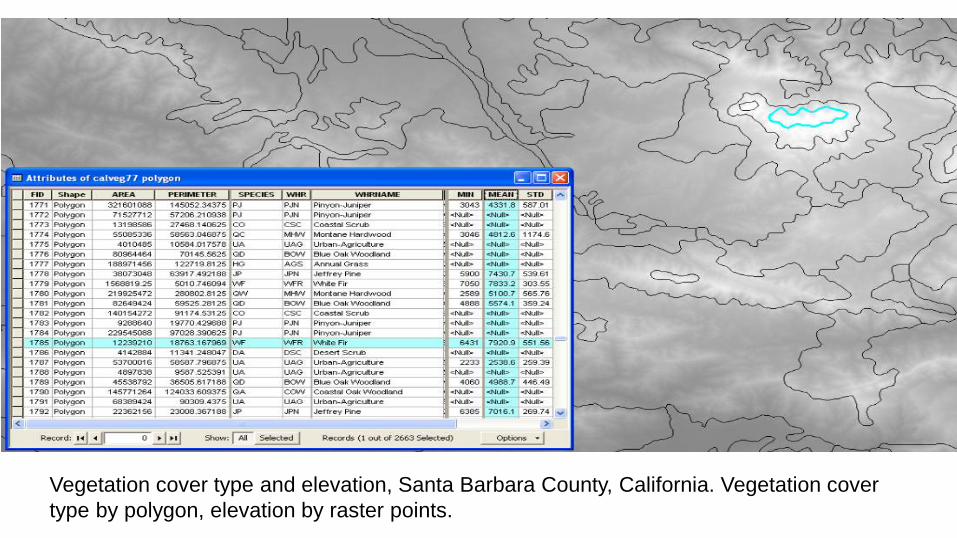
Vegetation cover type and elevation, Santa Barbara County, California. Vegetation cover type by polygon, elevation by raster points.

2. Operations on continuous fields
2. Operations on continuous fields
• Avoid engagement with details of the representation• refer to entire fields

2. Operations on continuous fields
• Avoid engagement with details of the representation• refer to entire fields
• Except when necessary• when representation of the output is not clearly defined
• adding a 10m raster variable to a 30m raster variable• should it produce a 10m raster, a 30m raster, or what?

3. Focus on fundamental spatial concepts
• many functions seek to explore some basic concept
• e.g., relationship between layers• e.g., Tobler’s First Law
• to evaluate the concept• to explore its expression in a given data set
Center for Spatial Studies, UC Santa Barbarateachspatial.org

185 concepts mined from the literatures of many disciplinesReferences and links to the key sources

Organizational schemasAlphabetical, by discipline, by similarity, by part-whole relationships

A new approach to interface design
• Hiding the existing interface for most users• Invoking functions automatically where
possible• Chaining functions where appropriate• A basis for standardizing and formalizing
functionality• A basis for Web service discovery