the scholastic aptitude test as a predictor of third-level academic performance
TRANSCRIPT
Educational Research Centre
The Scholastic Aptitude Test as a Predictor of Third-Level Academic PerformanceAuthor(s): Bernard O'Rourke, Michael O. Martin and John J. HurleySource: The Irish Journal of Education / Iris Eireannach an Oideachais, Vol. 23, No. 1(Summer, 1989), pp. 22-39Published by: Educational Research CentreStable URL: http://www.jstor.org/stable/30077342 .
Accessed: 22/06/2014 07:54
Your use of the JSTOR archive indicates your acceptance of the Terms & Conditions of Use, available at .http://www.jstor.org/page/info/about/policies/terms.jsp
.JSTOR is a not-for-profit service that helps scholars, researchers, and students discover, use, and build upon a wide range ofcontent in a trusted digital archive. We use information technology and tools to increase productivity and facilitate new formsof scholarship. For more information about JSTOR, please contact [email protected].
.
Educational Research Centre is collaborating with JSTOR to digitize, preserve and extend access to The IrishJournal of Education / Iris Eireannach an Oideachais.
http://www.jstor.org
This content downloaded from 188.72.126.162 on Sun, 22 Jun 2014 07:54:58 AMAll use subject to JSTOR Terms and Conditions
The Irish Journal of Education, 1989, xxiii, 1, pp. 22-39.
THE SCHOLASTIC APTITUDE TEST AS A PREDICTOR OF THIRD-LEVEL ACADEMIC
PERFORMANCE
Bernard O'Rourke and Michael O. Martin Educational Research Centre, St Patrick's College, Dublin
John J. Hurley National Institute for Higher Education, Dublin
The need that has arisen over the last 20 years to select candidates for places in Irish third-level institutions has generated interest in how selection is carried out and whether or not it might be improved. During this period, the Leaving Certificate Examination (LCE has been used as the sole or dominant instrument in selection for third level. With the LCE's role in third-level selection coming increasingly under scrutiny, interest has developed in examining the potential role in selection of a test of scholastic aptitude. In this study, the usefulness of the Scholastic Aptitude Test (SAT and the Leaving Certificate Examination to predict the first-year examination performance of 458 students in an Irish third-level institution is examined. The LCE was found to be a more powerful predictor. The SAT could also be an effective predictor, but only if the effects of selection were controlled. When the SAT and LCE are combined, the SAT contributes negligibly to improving the level of prediction obtained using only the LCE.
The need that has arisen over the last 20 years to select candidates for places in Irish third-level institutions has generated interest in how selection is carried out and whether or not it might be improved. During this period, the Leaving Certificate Examination (LCE has been used as the sole or dominant instrument in selection. This practice has given rise to widespread and persistent professional, media, and public concern. Typical of professional concerns are doubts about the appropriateness of the LCE as a selection instrument (e.g., Madaus & Macnamara, 1970 as well as beliefs that it has undesirable backwash effects on second-level curricula (e.g., Coolahan, 1979). Its limited power to predict performance in first-year university examinations has also been a cause for concern (e.g., Moran & Crowley, 1979). Such concerns have led to suggestions that alternative selection options, such as aptitude tests, should be
This content downloaded from 188.72.126.162 on Sun, 22 Jun 2014 07:54:58 AMAll use subject to JSTOR Terms and Conditions
THE SAT AND THIRD-LEVEL ACADEMIC PERFORMANCE 23
explored (e.g., Madaus & Macnamara, 1970; Titley & Mazurek, 1979). These concerns parallel ones in England which led to empirical studies of the use of aptitude tests in the selection process (Choppin & Orr, 1976).
Although a significant aspect of the Irish debate on third-level admissions, interest in the potential role of a test of scholastic aptitude has not been supported by the findings of empirical research elsewhere. Some pertinent studies have been undertaken in countries such as England and Scotland, which share broadly similar traditions of external examinations and third-level admission procedures. In these studies, scores on tests of scholastic aptitude have been found to be less useful predictors of first-year examination performance (Choppin & Orr, 1976 and of degree performance (Christie & Mills, 1973; Powell, 1973 than results of school-leaving examinations. When combined with results of school-leaving examinations, scholastic aptitude test scores have made little if any additional contribution to prediction of performance at third level (Choppin & Orr, 1976; Christie & Mills, 1973; Powell, 1973). Similar results were reported in the only comparable Irish study of a cohort of first-year students at University College, Cork (Moran & Humphreys, 1983).
Any further attempt to contribute to the empirical aspect of the debate on the potential role of an aptitude test in third-level admissions in Ireland must address two distinct, but related, issues. Firstly, attention must be given to evaluating whether a test of scholastic aptitude is a valid predictor in the population of interest. This aspect of validity is referred to here as 'predictive'. Secondly, attention must be given to evaluating the extent to which prediction of first-year examination performance by Leaving Certificate Examination (LCE performance might be improved by the use of aptitude test scores as additional predictors. This second aspect of validity is referred to here as 'incremental predictive'. Logically, it is assumed that a realistic assessment of the potential utility of an aptitude test as a selection instrument requires that the test be first shown to be a valid predictor of academic performance (Dunnett, 1978). Only then does it make sense to examine its predictive validity relative to other competing predictors.
In seeking to address the twin issues of predictive validity and incremental predictive validity, it is necessary to attend to the problems involved in attempting to assess validity in the context of a selective system of third-level admissions, where the data necessary to evaluate the instrument are not readily available. In principle, the predictive validity of an instrument (e.g., an aptitude test may be estimated quite simply by administering the instrument to a representative sample of the population of interest, applying the treatment (e.g., a course of study), and then obtaining a measure of the outcome of the treatment
This content downloaded from 188.72.126.162 on Sun, 22 Jun 2014 07:54:58 AMAll use subject to JSTOR Terms and Conditions
24 BERNARD O'ROURKE, MICHAEL 0. MARTIN AND JOHN R. IIURLEY
(e.g., end-of-course examination results). The coefficient of correlation between scores on the instrument and the outcome measure can be taken as an index of the predictive validity of the instrument.
In practice, however, the matter is not so straightforward. Frequently, it is not possible to accept into a course all those who apply for it, so that only some students can be selected. In terms of evaluating predictive validity, selection introduces several difficulties. The act of selection means that data on outcome measures cannot be obtained for all applicants. Since selection is not random but purposive (i.e., those likely to perform best are selected), the selected group will not be representative of the applicant group as a whole. Further, selection will have the effect of reducing the variance of scores on the prediction instrument. The existence of such difficulties means that validity coefficients which are based on selected groups may be biased and/or sharply reduced (Mosteller, 1978; Olson & Becker, 1983), thereby giving rise to unduly pessimistic conclusions about the value of the selection instruments (Linn, 1983; Linn, Harnisch, & Dunbar, 1981).
Studies of predictive validity typically adopt one of two approaches to this problem. The simplest and most common approach is to ignore the problem and assume that the entrant group is essentially equivalent to the applicant group. The likelihood that this approach will produce greatly underestimated validity coefficients increases with the degree of selectivity in the admission process (Linn & Dunbar, 1982). The second approach makes use of statistical corrections to compensate for the distortion introduced by the selection process and provides validity estimates for the unselected or applicant group. The disadvantage of this approach is that the assumptions on which correction techniques are based may not always be tenable. Because of the selective nature of the third-level educational system in Ireland, both approaches to validity estimation will be examined here. Since selection is based on an index of academic ability (performance on the Leaving Certificate Examination), it follows that entrants cannot be regarded as typical of applicants in general.
In the present study, a version of the Scholastic Aptitude Test (SAT was administered to all applicants for undergraduate degree courses at the National Institute for Higher Education (NINE), Dublin in the academic year commencing October, 1984. LCE and first-year examination results for applicants admitted to the Institute were made available by the admissions office. The empirical analyses of these data form the basis of our study.
This content downloaded from 188.72.126.162 on Sun, 22 Jun 2014 07:54:58 AMAll use subject to JSTOR Terms and Conditions
THE SAT AND THIRD-LEVEL ACADEMIC PERFORMANCE 25
METHOD
Subjects Applicant group. The Applicant group was defined initially as all those who
applied for admission to the Institute, either directly or through the Central Applications Office (CAO), and who took the SAT. There were 6,931 such applicants. A small number (112 who applied to transfer from other institutions (Regional Technical Colleges, Dublin Institute of Technology and who were not asked to sit for the SAT should be added to this number to give a figure of 7,043 for the total Applicant group. Of the total 7,043 applicants, 6,848 had complete LCE results and 6,844 had both SAT scores and LCE results. All analyses involving the Applicant group are based on the latter group of 6,844.
Selection of candidates. Applicants to NINE Dublin are offered places on courses strictly on the basis of a 'points' score derived from their LCE results, which is described below. If an offer is declined, the place is offered to the applicant for that course with the next highest points score. In the very small number of cases where there is more than one applicant for a course sharing the same LCE points score, an aptitude test score is used as a tie-breaker. The SAT total score (Verbal Mathematical was used in this role with the 1984 Applicant group.
Composition of the entrant group. In the 1984 academic year, 544 students were admitted to one or other of the Institute's 11 undergraduate programmes. Repeat students (those who entered for the first time the previous year and failed their end-of-year examinations are not included in this figure. Of the 544 such registered students, 458 had scores available on both SAT and LCE points. The other 86 students were admitted either without SAT scores or on the basis of examination results other than the LCE (e.g., General Certificate of Education from Northern Ireland). Analyses of the predictive validity of the SAT and LCE in the Entrant group are based on the group of 458 students.
Instruments Scholastic Aptitude Test (SAT). The SAT is produced and administered by
Educational Testing Service (Princeton, NJ on behalf of the College Board, an organization providing testing and other educational services to its more than 2,500 member colleges, schools, school systems, and education associations in the United States. The test is designed to measure reasoning abilities in verbal and mathematical areas. It consists of 145 multiple-choice questions, divided into four separately-timed, 30-minute sections (two each for Verbal and Mathematical). Separate Verbal and Mathematical scores can be calculated.
This content downloaded from 188.72.126.162 on Sun, 22 Jun 2014 07:54:58 AMAll use subject to JSTOR Terms and Conditions
26 BERNARD O'ROURKE, MICHAEL 0. MARTIN AND JOHN R. HURLEY
The SAT was designed to provide interested colleges with a source of objective information on candidates. It was intended that this information would supplement other information on candidates, which was already available in schools thereby allowing 'some redress for possible errors and inconsistencies' (Donlon, 1984, p. 37).
The SAT is produced in a number of versions or forms each year to provide for several scheduled administrations. The test form used in this study was SAT Form 3SSA086 (31.1 which had been used by ETS in the scheduled SAT administration of the previous November (1983). No changes to test items were made; however, some minor changes in test instructions and in the design of the machine-readable answer sheets were required for the test administration in Ireland. Although each SAT form is produced to similar specifications, a statistical equating process is implemented routinely to allow all forms of the test to be reported on the same score scale. This equating process allows meaningful comparisons to be made between students taking different forms of the SAT.
The Verbal section of the SAT is designed to measure the extent of a student's vocabulary and his or her ability to understand written material. It consists of 85 multiple-choice five-option questions of four types: antonyms (25), analogies (20), sentence completion (15), and reading comprehension (25).
The Mathematical section of the SAT is designed to measure ability to solve problems involving arithmetical reasoning, algebra, and geometry. It consists of 60 multiple-choice questions of two types: standard (`regular' mathematics questions (40 five-option items and quantitative comparison questions (20 four-option items).
The production of an SAT score involves two stages. Firstly, a raw score is calculated by counting the items answered correctly and subtracting from this sum a fraction of the number of items answered incorrectly. The actual fraction used is the reciprocal of one less than the number of response options (i.e., 1 k-1, where k is the number of options). Secondly, the raw score is transformed to a scale score. Scale scores are reported on a range from a minimum of 200 to a maximum of 800. The transformation of raw scores to scale scores (incorporating the equating described above eliminates the dependence of raw scores on test length and on specific test forms and their characteristics (e.g., test-form difficulty). For this reason, a given scale score purports to represent the same ability level regardless of the test form or of characteristics associated with
Item-difficulty levels and test reliabilities were computed and compared with the equivalent statistics from an American sample to assess the suitability of the
This content downloaded from 188.72.126.162 on Sun, 22 Jun 2014 07:54:58 AMAll use subject to JSTOR Terms and Conditions

THE SAT AND THIRD-LEVEL ACADEMIC PERFORMANCE 27
SAT for an Irish population. The results of these analyses, reported in detail in O'Rourke, Martin, and Hurley (1987), indicate that both the Verbal and the Mathematical tests are at an appropriate level of difficulty and are sufficiently reliable for use with confidence in this country.
Leaving Certificate Examination (LCE). The LCE is a school-leaving examination extending over 30 subject areas and two examination levels (Higher and Ordinary which is taken by students over 16 years of age who have followed an approved course as a recognized senior-cycle student for at least two years (Ireland. Department of Education, 1983). Results on the examination have traditionally served as the basis for selection to third-level education. Ranking for selection purposes is made in most cases on the basis of points scores computed for every candidate. Each third-level institution has its own system for transforming LCE results (reported as letter grades, A to 0, for each subject/examination level into points scores (see Dunne & O'Boyle, 1984; O'Donnell, 1985).
NIHE Dublin ranks candidates on the basis of a points score defined by the arithmetic sum of points awarded in a maximum of six LCE subjects. The assignment of points values to letter grades is straightforward. For Higher-level LCE subjects, a grade 'A' is awarded 7 points, while grades '13', 'C', and 'D' are awarded 5, 4, and 2 points respectively. For Ordinary-level LCE subjects, grades 'A' and 'B' are awarded 3 points and 2 points respectively. None of the other possible grades at either Higher or Ordinary levels is awarded points. A maximum of 42 points (i.e., 6 x 7 points may be obtained by any candidate. (Unlike some other institutions, NIHE Dublin did not in 1984-85 limit the number of years over which LCE results could be combined for the purposes of generating a points score, although a limit of three years has since been introduced.
The LCE points-score distribution of 1984 applicants to NINE Dublin is presented in Table 1. The mean number of LCE points obtained by the applicants was 18.4 (SD 7.5). Comparative data on the third-level applicant population processed through the CAO (M 18.0; SD 7.9 are also presented in Table 1, indicating very little difference between the two groups. Both distributions have slightly more individuals located in the lower tails (zero to 11 points than in the higher tails (30 to 42 points). Comparable data on the 1984 NIHE Entrant group are also presented in Table 1.
This content downloaded from 188.72.126.162 on Sun, 22 Jun 2014 07:54:58 AMAll use subject to JSTOR Terms and Conditions

2 BERNARD O'ROURKE, MICHAEL 0. MARTIN AND JOHN R. HURLEY
TABLE 1
DISTRIBUTIONS, MEANS, AND STANDARD DEVIATIONS OF LCE POINTS SCORES FOR ALL 1984 CAO APPLICANTS AND
FOR 1984 APPLICANTS AND ENTRANTS TO NIHE DUBLIN
LCE points CAO Applicants NIHE Applicants NIHE Entrants score interval
N Cum N Cum N Cum
36-42 194 100.0 48 100.0 4 100.0 30-35 1,021 99.0 304 99.3 50 99.2 24-29 4,440 94.0 1,571 94.9 325 88.9 18-23 5,269 72.0 1,960 71.9 106 21.9 12-17 4,875 45.8 1,657 43.3 0 0.0 6-11 3,143 21.7 982 19.1 0 0.0 0 5 1,225 6.1 326 4.8 0 0.0
Total 20,167 6,848 458 Mean 18.0 18.4 25.8 SD 7.9 7.5 3.0
First-year examination results. The criterion measure for this study was academic performance in first-year examinations at NINE Dublin. A candidate's result in the first-year examination was expressed as a percentage average over all subjects taken as part of the first-year examination. Although some students would have taken autumn examinations at the end of first year (e.g., owing to failure in the summer examinations or to deferral), only the results of the summer examinations are considered here. The distributions of the percentage average first-year examination results for summer and for summer/autumn combined are very similar (O'Rourke, Martin, & Hurley, 1987).
Analysis Correlational and linear-regression methods are used (i to assess the validity
of the SAT as a predictor of first-year examination performance and (ii to examine whether the prediction of examination performance by LCE points score might be improved by the use of SAT scores as additional predictors.
General approach. Entrant-group statistics are computed from data on those who actually entered the Institute and hence are based on actual data, albeit from one end of the LCE performance distribution. Applicant-group statistics involving first-year examination results, on the other hand, had to be estimated
This content downloaded from 188.72.126.162 on Sun, 22 Jun 2014 07:54:58 AMAll use subject to JSTOR Terms and Conditions

THE SAT AND THIRD-LEVEL ACADEMIC PERFORMANCE 29
using statistical correction formulae. In the case of the correlation between LCE points score and first-year examination results, the formula used is taken from Gulliksen (1950, formula 18, p. 142). The correlations between the SAT scores and first-year examination results are computed using a formula supplied by Lewis and Boone (1979, p. 651, case 5). This is a generalization of Gulliksen's (1950, p.153 formula 37 to allow for the situation where the variances of both explicit (LCE points and implicit (SAT selector variables are known in the Applicant as well as in the Entrant group. (The tie-breaking role played by the SAT total score, being negligible, is ignored. The regression analyses carried out on the Entrant group are then replicated on the partly-simulated Applicant correlation matrix.
Limitations of Entrant-group analyses. Two aspects of the present situation give rise to concern about basing validity estimates on Entrant-group data only. Firstly, when the Entrant group represents a small proportion of the Applicant group, drawn from one end of an ability distribution, it is well known that correlations derived from the Entrant-group data will tend to underestimate their counterparts in the Applicant group (Linn, 1983). To take an example using actual data from the present study, the correlation between the SAT total score (Verbal Mathematical and the LCE points score decreases with the proportion selected from the upper end of the LCE points distribution; the correlation of .536 in the entire Applicant group reduces to just .117 in the top 5.1 percent (O'Rourke, Martin, & Hurley, 1987).
Secondly, when the Entrant group is selected largely on the basis of one predictor and it is required to assess the validity of another predictor which was not used explicitly in selection, it can be shown that correlation and regression coefficients involving the second predictor and the criterion measure are biased in a downward direction (Linn, 1983). This 'specification' error (Heckman, 1979 is caused by the omission from the prediction equation of a predictor known to be related to the criterion measure. Specification bias is in addition to that introduced by selecting from one end of the Applicant distribution, and, in the present context, implies that comparisons of the relative predictive power of LCE points and SAT scores may be biased against the SAT when based on Entrant-group data only.
Difficulties with statistical corrections. Replicating the validity analyses on the Applicant-group data avoids the two sources of bias described above but introduces another potential source of bias because of the necessity to use statistical corrections to compensate for the missing first-year examination results of those applicants who are not members of the Entrant group. These correction formulae are derived on the basis of certain assumptions about the
This content downloaded from 188.72.126.162 on Sun, 22 Jun 2014 07:54:58 AMAll use subject to JSTOR Terms and Conditions

30 BERNARD O'ROURKE, MICHAEL 0. MARTIN AND JOHN R. HURLEY
relationship between predictors and the criterion in the population. The two basic assumptions are that the regression of the criterion on the selector variable is linear and that the conditional variance of the criterion does not depend on the selector variable (i.e., the assumption of homoscedasticity (Linn, 1983). While the accuracy of estimates made using these correction formulae would be expected to depend on both these assumptions being met, there is evidence to indicate that estimates are relatively robust under violations of the homoscedasticity assumption (Greener & Osburn, 1979, 1980).
An additional factor which can also lead to inaccurate estimates is the implicit assumption of complete truncation at the cut-off point (Olson & Becker, 1983). Complete truncation means that all applicants above a certain cut-off point are accepted and all below that point rejected. This assumption is clearly violated in the present data, since only about 16 of those applicants with sufficiently high LCE points scores (approximately 19 points on average actually registered at NINE Dublin; the rest went to other institutions or followed some other career path. However, the fact that the NINE Dublin entrants do not appear to be untypical of that section of the Applicant group who achieve at least this level (similar mean scores, similar standard deviations may mitigate against this violation; the mean LCE points scores for the Entrant group is 25.82 (SD 3.05), while the mean for the section of the Applicant group scoring more than 19 LCE points is 24.85 (SD 3.69).
RESULTS
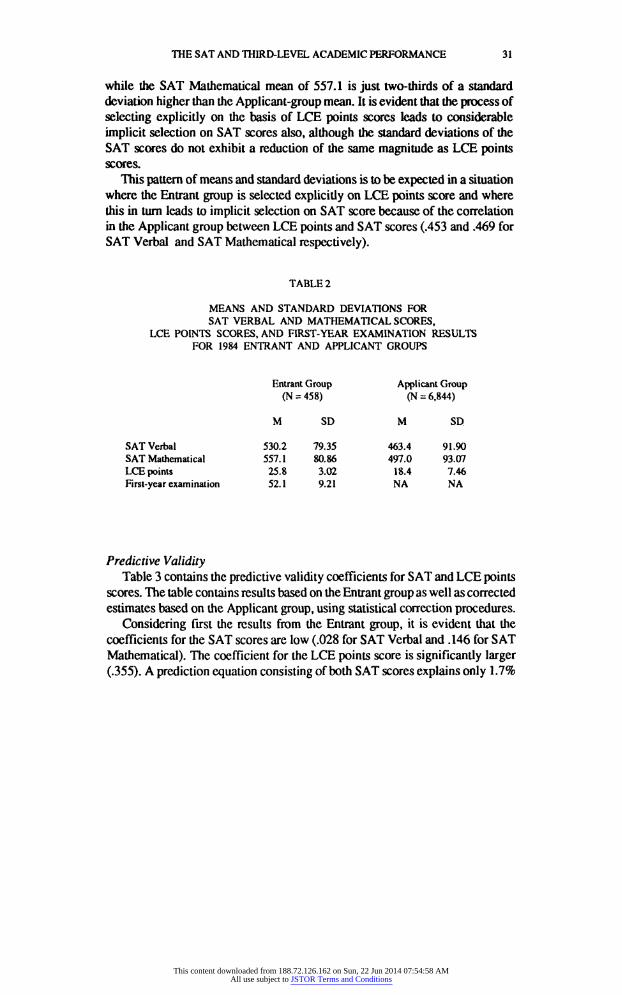
Effects of Selection on Ability of Entrants Table 2 provides means and standard deviations for SAT Verbal, SAT
Mathematical, LCE points, and first-year examination results for both Entrant and Applicant groups. A comparison of the Applicant and Entrant-group statistics reveals some of the effects of the selection process. Clearly the Entrant group has a much higher level of academic ability (in terms of both LCE points and SAT scores than the Applicant group. The mean LCE points score of the Entrant group (25.8 is a full standard deviation above the mean of the Applicant group (18.4). The higher mean score in the Entrant group is accompanied, as expected, by a smaller standard deviation (3.02 compared with 7.46). There is, therefore, considerable reduction in the variance of the LCE points score in the Entrant group.
The higher ability level of the Entrant group is also reflected in the SAT score statistics. At 530.2, the mean SAT Verbal score is slightly more than three-quarters of a standard deviation greater than the Applicant-group mean,
This content downloaded from 188.72.126.162 on Sun, 22 Jun 2014 07:54:58 AMAll use subject to JSTOR Terms and Conditions
THE SAT AND THIRD-LEVEL ACADEMIC PERFORMANCE 31
while the SAT Mathematical mean of 557.1 is just two-thirds of a standard deviation higher than the Applicant-group mean. It is evident that the process of selecting explicitly on the basis of LCE points scores leads to considerable implicit selection on SAT scores also, although the standard deviations of the SAT scores do not exhibit a reduction of the same magnitude as LCE points scores.
This pattern of means and standard deviations is to be expected in a situation where the Entrant group is selected explicitly on LCE points score and where this in turn leads to implicit selection on SAT score because of the correlation in the Applicant group between LCE points and SAT scores (.453 and .469 for SAT Verbal and SAT Mathematical respectively).
TABLE 2
MEANS AND STANDARD DEVIATIONS FOR SAT VERBAL AND MATHEMATICAL SCORES,
LCE POINTS SCORES, AND FIRST-YEAR EXAMINATION RESULTS FOR 1984 ENTRANT AND APPLICANT GROUPS
Entrant Group Applicant Group (N 458 (N 6,844
M SD M SD.
SAT Verbal 530.2 79.35 463.4 91.90 SAT Mathematical 557.1 80.86 497.0 93.07 LCE points 25.8 3.02 18.4 7.46 First-year examination 52.1 9.21 NA NA
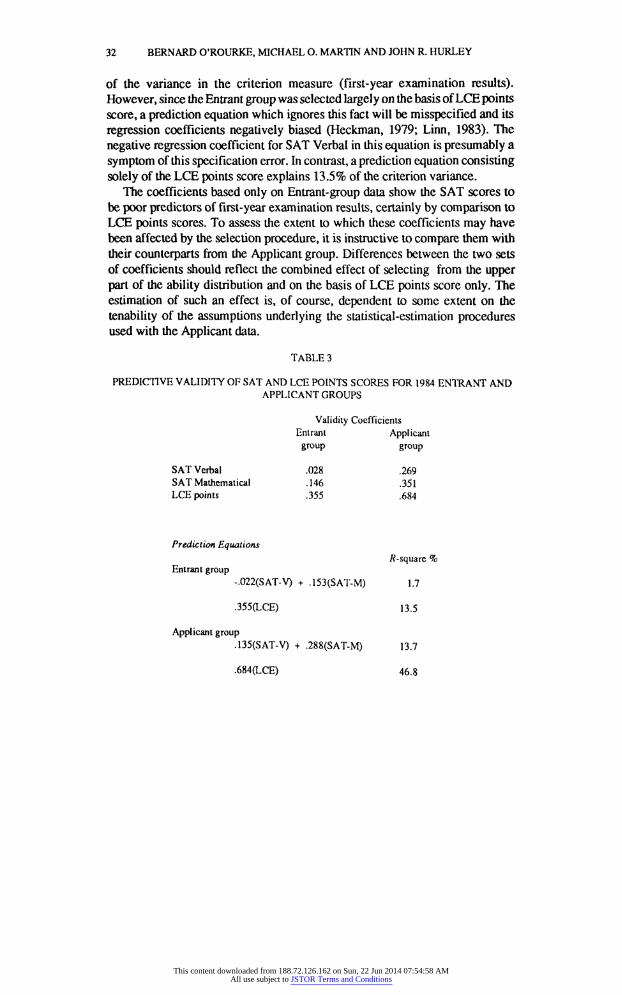
Predictive Validity Table 3 contains the predictive validity coefficients for SAT and LCE points
scores. The table contains results based on the Entrant group as well as corrected estimates based on the Applicant group, using statistical correction procedures.
Considering first the results from the Entrant group, it is evident that the coefficients for the SAT scores are low (.028 for SAT Verbal and .146 for SAT Mathematical). The coefficient for the LCE points score is significantly larger (.355). A prediction equation consisting of both SAT scores explains only 1.7
This content downloaded from 188.72.126.162 on Sun, 22 Jun 2014 07:54:58 AMAll use subject to JSTOR Terms and Conditions
32 BERNARD O'ROURKE, MICHAEL 0. MARTIN AND JOHN R. HURLEY
of the variance in the criterion measure (first-year examination results). However, since the Entrant group was selected largely on the basis of LCE points score, a prediction equation which ignores this fact will be misspecified and its regression coefficients negatively biased (Heckman, 1979; Linn, 1983). The negative regression coefficient for SAT Verbal in this equation is presumably a symptom of this specification error. In contrast, a prediction equation consisting solely of the LCE points score explains 13.5 of the criterion variance.
The coefficients based only on Entrant-group data show the SAT scores to be poor predictors of first-year examination results, certainly by comparison to LCE points scores. To assess the extent to which these coefficients may have been affected by the selection procedure, it is instructive to compare them with their counterparts from the Applicant group. Differences between the two sets of coefficients should reflect the combined effect of selecting from the upper part of the ability distribution and on the basis of LCE points score only. The estimation of such an effect is, of course, dependent to some extent on the tenability of the assumptions underlying the statistical-estimation procedures used with the Applicant data.
TABLE 3
PREDICTIVE VALIDITY OF SAT AND LCE POINTS SCORES FOR 1984 ENTRANT AND APPLICANT GROUPS
Validity Coefficients Entrant Applicant group group
SAT Verbal .028 .269 SAT Mathematical .146 .351 LCE points .355 .684
Prediction Equations R-square
Entrant group -.022(SAT-V .153(SAT-M 1.7
.355(LCE 13.5
Applicant group .135(SAT-V .288(SAT-M 13.7
.684(LCE 46.8
This content downloaded from 188.72.126.162 on Sun, 22 Jun 2014 07:54:58 AMAll use subject to JSTOR Terms and Conditions
TIIE SAT AND THIRD-LEVEL ACADEMIC PERFORMANCE 33
As expected, the adjusted Applicant-group validity coefficients show a substantial increase over the coefficients for the Entrant group. The increase is most notable in the case of SAT Verbal scores, going from .028 to .269, an increase of 960 percent. The coefficient for SAT Mathematical scores goes from .146 to .351, an increase of 240%, while the coefficient for LCE points scores goes from .355 to .684, an increase of 192 percent. The magnitude of these increases and their bias in favour of the SAT scores, particularly SAT Verbal, implies that the selection procedure does raise questions relating to inferences about the predictive validity of all three instruments which are based only on Entrant data.
Prediction equations based on Applicant-group data also reflect the effects of selection. An equation consisting of both Verbal and Mathematical SAT scores now explains 13.7 of the criterion variance compared to 1.7 with Entrant-group data, an increase of 805 percent. Approximately two-thirds of the variance explained by the SAT tests is accounted for by SAT Mathematical scores. It is significant also that the regression coefficient for the SAT Verbal test is positive in the Applicant-group equation. This is to be expected since the Lewis and Boone (1979 formula corrects for the specification error in the Entrant-group analysis by controlling for LCE points score. The equation consisting of LCE points score alone also shows an increase in the percentage of the criterion variance which is explained from 13.5 to 46.8%, an increase of 346 percent. It is evident that while switching the analysis from Entrant to Applicant data results in proportionately greater increases in the predictive power of the SAT scores compared to the LCE points score, the points score retains its superiority as a predictor in a straight comparison.
Incremental Predictive Validity The preceding analyses imply that both SAT and LCE points scores, when
considered independently, are potentially effective predictors of first-year examination performance. This section addresses the question of whether a prediction equation consisting only of LCE points score would be significantly improved by the addition of one or both SAT scores.
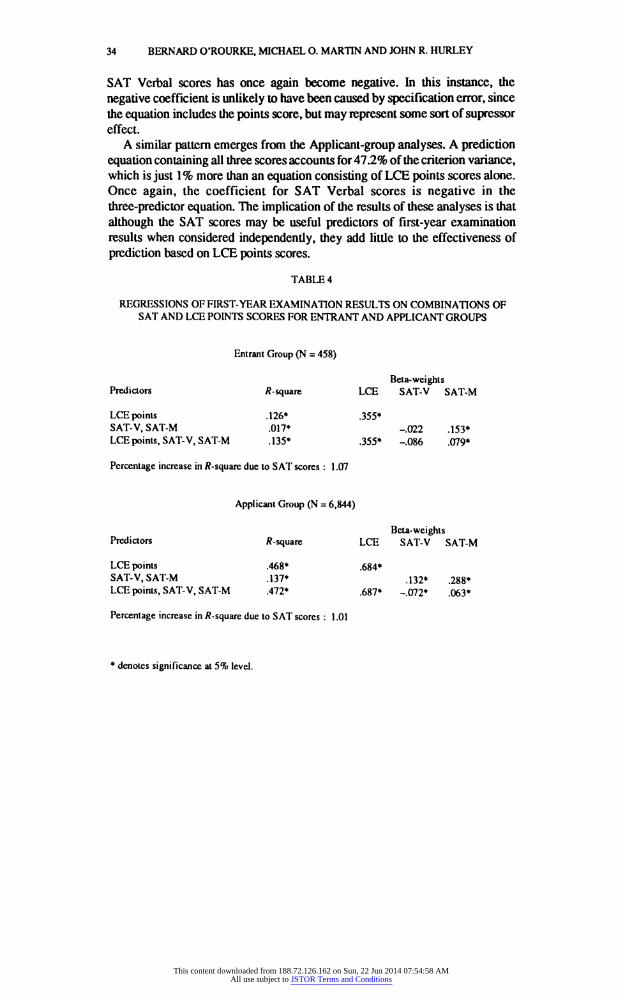
Table 4 repeats the separate LCE and SAT prediction equations for comparison purposes and also shows an equation containing all three scores as predictors. In the Entrant-group analyses, the percentage of variance explained by the three-predictor equation is 13.5 percent. This represents an increase of just .09 over the percentage explained by the LCE points score alone, which is a poor return for the inclusion of two further predictors. In addition, the increase is due entirely to SAT Mathematical scores, since the coefficient for
This content downloaded from 188.72.126.162 on Sun, 22 Jun 2014 07:54:58 AMAll use subject to JSTOR Terms and Conditions
34 BERNARD O'ROURKE, MICHAEL 0. MARTIN AND JOHN R. HURLEY
SAT Verbal scores has once again become negative. In this instance, the negative coefficient is unlikely to have been caused by specification error, since the equation includes the points score, but may represent some sort of supressor effect.
A similar pattern emerges from the Applicant-group analyses. A prediction equation containing all three scores accounts for 47.2 of the criterion variance, which is just 1 more than an equation consisting of LCE points scores alone. Once again, the coefficient for SAT Verbal scores is negative in the three-predictor equation. The implication of the results of these analyses is that although the SAT scores may be useful predictors of first-year examination results when considered independently, they add little to the effectiveness of prediction based on LCE points scores.
TABLE 4
REGRESSIONS OF FIRST-YEAR EXAMINATION RESULTS ON COMBINATIONS OF SAT AND LCE POINTS SCORES FOR ENTRANT AND APPLICANT GROUPS
Entrant Group (N 458
Beta-weights Predictors R-square LCE SAT-V SAT-M
LCE points .126 .355 SAT-V, SAT-M .017 -.022 .153 LCE points, SAT-V, SAT-M .135 .355 -.086 .079
Percentage increase in R-square due to SAT scores : 1.07
Applicant Group (N 6,844
Beta-weights Predictors R-square LCE SAT-V SAT-M
LCE points .468 .684 SAT-V, SAT-M .137 .132 .288 LCE points, SAT-V, SAT-M .472 .687 -.072 .063
Percentage increase in R-square due to SAT scores : 1.01
denotes significance at 5 level.
This content downloaded from 188.72.126.162 on Sun, 22 Jun 2014 07:54:58 AMAll use subject to JSTOR Terms and Conditions

THE SAT AND THIRD-LEVEL ACADEMIC PERFORMANCE 35
DISCUSSION
The results of this study show the Scholastic Aptitude Test to be a significant predictor of third-level academic performance, as demonstrated in the Applicant-group analyses. However, in spite of this demonstrable predictive validity, it is clear that the SAT adds little or nothing to prediction based on LCE performance alone. This lack of incremental predictive validity is evident in the Entrant-group analyses and is confirmed in the Applicant-group analyses.
The present result is not unexpected given the findings of earlier studies that the use of aptitude-type tests adds little or nothing to incremental predictive validity (Moran & Humphreys, 1983). It is clear, however, that the lack of an incremental contribution to prediction does not imply the absence altogether of predictive validity per se. The results obtained with the Applicant-group analyses show the SAT to be an effective predictor when considered independently. Thus, while it is true that the SAT does not improve on prediction based only on the LCE, it is also true that the SAT can of itself predict third level academic performance. In the event of a change in the basis of selection away from the LCE, the fact that the SAT demonstrates this independent predictive capability would be of material interest. Even assuming no change in the current basis of selection, the existence of an independent predictive capability for the SAT means that use of an SAT-type measure might provide useful information on the academic capability of some types of applicants (e.g., those presenting without LCE results). It is of particular interest that the Applicant-group analyses, by providing evidence of the SAT's predictive capability, illustrate the constraint which the selection process imposes on the estimation of the true predictive validity for the admissions-relevant population (i.e., the Applicants).
It is impossible to say with certainty why the SAT does not improve upon the prediction obtained with the LCE only. It is likely that the cause lies in the extent to which the two 'instruments' are in fact measuring the same attribute. The extent of this overlap is indicated by the LCE-SAT correlations for the Applicant group: .453 for SAT Verbal and .469 for SAT Mathematical (O'Rourke, Martin, & Hurley, 1987, Table 9). The size of this correlation suggests that the LCE points score itself may be considered to be an index of scholastic aptitude (Martin & O'Rourke, 1984). It is perhaps not surprising that a test such as the SAT, which is administered in a single session and not based on any specific subject syllabus, is unable to predict first-year examination performance at third level as efficiently as an LCE points score. Not only is an LCE points score based on the results of examinations which are similar in many respects to those in use at third
This content downloaded from 188.72.126.162 on Sun, 22 Jun 2014 07:54:58 AMAll use subject to JSTOR Terms and Conditions
36 BERNARD O'ROURKE, MICHAEL 0. MARTIN AND JOHN R. HURLEY
level, it also represents an aggregation of students' best performances on nine or more examination sessions in subject areas which often feed directly into subject areas assessed by first-year examinations at third level. For these reasons, an LCE points score can be considered as a relatively 'well-tuned' and general index of scholastic aptitude. When looked at from this viewpoint, a comparison with the predictive validity of individual LCE subjects rather than with the overall LCE points score might provide a more appropriate assessment of the potential utility of the SAT.
It is clear from supplementary analyses (O'Rourke, Martin, & Hurley, 1987 that the Institute-level pattern of results does not apply to faculties considered individually. Of particular significance is the fact that the absence of any predictive power for LCE or SAT in the largest faculty (containing 29 of the Entrant cohort studied depresses the R-square values observed in the whole-Institute analyses. Moreover, in two of the other faculties, the SAT Mathematical test makes a significant contribution to prediction and, in one of these, is the only predictor to make any significant contribution to an observed Entrant-group R-square of .204. Clearly, such faculty-level analyses suggest that a wholly negative conclusion on the potential contribution of the SAT is not warranted and that there is some evidence to indicate that the SAT is measuring skills and achievements (of a specifically mathematical nature which contribute to first-year examination performance.
Since its introduction in the 1920s, a major function of the SAT has been to serve as a common scale on which to assess the ability of students coming from a variety of school systems (which used different syllabi and had no common examinations (Donlon, 1984). While there are as yet no proposals on examination reform for Ireland which would create a similar situation as exists in the United States, there are potential roles for SAT-type tests even within the context of a system of common external examinations. The scaling of subject examinations in order to equate difficulty levels is one such application which has not only received research attention abroad, but has actually been implemented in Australia (McGaw, 1977, 1985). Scaling has been used in some Australian state educational systems which have replaced external examinations with school-based assessments, a situation not unlike that of the US. Another potential application of an SAT-type measure would be as a component of a revised points score in which the Verbal and Mathematical scores would be treated as single examination subjects. These and other possible uses of a test of scholastic aptitude must await further study.
This content downloaded from 188.72.126.162 on Sun, 22 Jun 2014 07:54:58 AMAll use subject to JSTOR Terms and Conditions

THE SAT AND THIRD-LEVEL ACADEMIC PERFORMANCE 37
REFERENCES
Choppin, B. H. L., & Orr, L. (1976). Aptitude testing at eighteen-plus. Slough, Berkshire: NFER.
Christie, T., & Mills, J. (1973). The use of a scholastic aptitude test in university selection. Manchester: Department of Education, University of Manchester.
Coolahan, J. (Ed.). (1979). University entrance requirements and their effect on second level curricula. Dublin: Irish Federation of University Teachers.
Donlon, T. F. (1984). The Scholastic Aptitude Test. In T. F. Donlon (Ed.), The College Board technical handbook for the Scholastic Aptitude Test and achievement tests. New York: College Entrance Examination Board.
Dunne, R., & O'Boyle, E. P. (1984). CAO college guide. Claremorris, Mayo: Careers and Educational Publishers.
Dunnett, C. W. (1978). Screening and selection. In W. H. Kruskal & J. M. Tanur (Eds.), International encyclopedia of statistics. Vol. 2. New York: Free Press.
Greener, J. M., & Osbum, H. G. (1979). An empirical study of the accuracy of corrections for restriction in range due to explicit selection. Applied Psychological Measurement, 3, 31-41.
Greener, J. M., & Osbum, H. G. (1980). Accuracy of corrections for restriction in range due to explicit selection in heteroscedastic and nonlinear distributions. Educational and Psychological Measurement, 40, 337-346.
Gulliksen, H. (1950). Theory of mental tests. New York: Wiley. Heckman, J. (1979). Sample selection bias as a specification error.
Econometrica, 47, 153-161. Ireland. Department of Education. (1983). Rules and programme for secondary
schools. Dublin: Stationery Office. Lewis, M. A., & Boone, J. 0. (1979). A FORTRAN program for correcting
correlation coefficients for restriction in range for explicit or implicit restriction. Educational and Psychological Measurement, 39, 649-652.
Linn, R. L. (1983). Pearson selection formulas: Implications for studies of predictive bias and estimates of educational effects in selected samples. Journal of Educational Measurement, 20, 1-15.
Linn, R. L., & Dunbar, S. B. (1982). Predictive validity of admissions measures: Corrections for selection on several variables. Journal of College Student Personnel, 23, 222-226.
Linn, R. L., Hamisch, D. L., & Dunbar, S. B. (1981). Corrections for range restriction: An empirical investigation of conditions resulting in conservative corrections. Journal of Applied Psychology, 66, 655-663.
This content downloaded from 188.72.126.162 on Sun, 22 Jun 2014 07:54:58 AMAll use subject to JSTOR Terms and Conditions

38 BERNARD O'ROURKE, MICHAEL 0. MARTIN AND JOHN R. HURLEY
McGaw, B. (1977). The use of rescaled teacher assessments in the admission of students to tertiary study. Australian Journal of Education, 21, 209-225.
McGaw, B. (1985). Combining school based and external assessments of performance to determine university admissions. Studies in Educational Evaluation, 11, 303-314.
Madams, G. F., & Macnamara, J. (1970). Public examinations: A study of the Irish Leaving Certificate. Dublin: Educational Research Centre, St Patrick's College.
Martin, M. O., & O'Rourke, B. (1984). The validity of the DAT as a measure of scholastic aptitude in Irish post-primary schools. Irish Journal of Education, 18, 3-22.
Moran, M. A., & Crowley, M. J. (1979). The Leaving Certificate and first year university performance. Journal of the Statistical and Social Inquiry Society of Ireland, 24, 231-266.
Moran, M. A., & Humphreys, A. (1983). A comparison of scholastic aptitude and personality tests with a school leaving examination as measures of subsequent academic performance. Proceedings of the Ninth International Conference on Improving University Teaching. Contributed papers: Volume II. College Park, Maryland: University of Maryland.
Mosteller, F. (1978). Errors: Nonsampling errors. In W. H. Kruskal & J. M. Tanur (Eds.), International encyclopedia of statistics. Vol. 1 . New York: Free Press.
Numerical Algorithms Group. (1985). The Generalised Linear Interactive Modelling system. Release 3.77. Oxford: Author.
Olson, C. A., & Becker, B. E. (1983). A proposed technique for the treatment of restriction of range in selection validation. Psychological Bulletin, 93, 137-148.
O'Donnell, M. (1985). Getting into college: What parents and students should know about the points system and other selection procedures for entry to third level education. Dublin: Desmond Press.
O'Rourke, B., Martin, M. O., & Hurley, J. J. (1987). The Scholastic Aptitude Test as a predictor of third-level academic performance. Dublin: Educational Research Centre, St Patrick's College, and National Institute for Higher Education.
Powell, J. L. (1973). Selection for university in Scotland. London: University of London Press.
This content downloaded from 188.72.126.162 on Sun, 22 Jun 2014 07:54:58 AMAll use subject to JSTOR Terms and Conditions

THE SAT AND THIRD-LEVEL ACADEMIC PERFORMANCE 39
Tilley, B., & Mazurek, K. (1979). Selection for higher education: An alternative. Oideas, 21, 59-63.
This content downloaded from 188.72.126.162 on Sun, 22 Jun 2014 07:54:58 AMAll use subject to JSTOR Terms and Conditions