the scandinavian way to better public transport
TRANSCRIPT

THE SCANDINAVIAN WAY TO BETTER PUBLIC TRANSPORT
T 0113 251 7204E [email protected]
Wellington House, 40-50 Wellington Street, Leeds LS1 2DE
HOW INNOVATION, DEVOLUTION AND FRANCHISING IS GETTING RESULTS FOR PASSENGERS AND CITIES

This report has been prepared by the Transport Research Institute at Edinburgh Napier University in collaboration with colleagues in Norway, Denmark, Sweden and the Netherlands.
The main objective of the report, commissioned by the Urban Transport Group (UTG), is to review the experiences of franchising public transport services in these countries, to understand why franchising has been chosen by these countries as a way of organising local and regional public transport services, and to present information on the impacts of this choice. Furthermore, in so doing, much information was gathered on the nature and performance of the local and regional public transport system in these countries more broadly, and much of this information is also presented here in order to put the information on franchising, and the contracts that underlie that system, into context.
The fi rst chapter summarises the information about all three countries to give a comparative picture of the level of service that a public transport user will encounter in each country, before moving on to comment on how far each country has achieved the outcomes for public transport that are of particular interest to UTG.
The Scandinavian Way to Better Public Transport Contents
Introduction .....................................................................................................2
Report overview and summary ................................................................... 4
Denmark ..........................................................................................................12
Norway ............................................................................................................ 30
Sweden ........................................................................................................... 50
References ..................................................................................................... 70
INTRODUCTION CONTENTS
2 3

The Scandinavian Way to Better Public Transport Report overview and summary
REPORT OVERVIEW AND SUMMARY
SOURCES OF INFORMATION USED WHEN PREPARING THE REPORT
This report has been prepared by the following organisations:
• Urbanet, Norway
• VTI and the K2 Swedish National Public Transport Research and Knowledge Centre, Sweden (on Denmark)
• Lund University and K2, Sweden
• Inno-V consultancy, Netherlands (input to Norway and Sweden)
These organisations obtained information from published sources in the respective countries, together with primary data from public transport organisations, and material from their own previous research. References to these sources are provided at the end of this document.
TYPICAL SERVICE LEVELS
In comparison with equivalent city regions in GB outside of London, the service levels are higher, particularly in the off peak, evenings and on Sundays. Services also tend to be less concentrated on the highest revenue-generating routes with a higher minimum level of service provided in lower density areas and at times of low demand. As most Scandinavian regions operate some form of gross cost contract for bus services there is an element of cross-subsidy between revenue-generating and loss-making routes. This permits a generally higher level of service to be provided in rural and low density suburban areas than in equivalent areas of the UK where bus deregulation does not allow for such levels of cross subsidy.
Bus and tram service levels in the cities with population of approximately 100,000 inhabitants and above are as follows:
• Service hours are between 0400-0100 or in some cases there is a 24-hour service.
• 5-10 minute frequencies on main routes in rush hour, reducing to 8-12 minutes daytime off peak and Saturdays, and 15-30 minutes at other times.
• On secondary routes, 10-20 minute frequency during the peak hours and half hourly off peak.
Regional and commuter rail services operate 3-6 trains per hour during peak times on main corridors, with 2-3 trains per hour during peak times on secondary lines. These frequencies are reduced to 2-3 trains per hour on main corridors during off peak times and to 1-2 trains per hour on secondary lines.
4 5
1.1
1.2
Full data for all three countries on access to public transport is not available, but for Norway, about 67% of the population in the 10 largest urban areas lives within 500m or less of a public transport stop.
Modern low floor buses are the norm in Scandiavian cities as is a shift to fossil-fuel free vehicles. Rail services are also generally electrified. Levels of accessibility of infrastructure and vehicles for people with disabilities is high.
TYPICAL FARES
Fares in Scandinavian countries are zonal and multi-modal. They are supplied on a stored value or season ticket smartcard or, especially in Norway, increasingly as mobile tickets. Fares bought on board buses and trams incur a surcharge.
To make a typical urban journey of two zones (including unlimited interchange between different modes and services within a given time period) costs typically in the region of:
• £2 to £3 for a single ticket purchased on board;
• £1.50 if using stored value smartcard; and
• £0.80 if using a season ticket.
Monthly season tickets (again valid on bus, rail and where available on metro and tram) cost:
• For a city of 100,000 people in the region of £50;
• For a larger city of 300,000 people £70; and
• For a whole region of 1-2 million people and covering up to 25,000 square km, in the order of £120 to £170.
In comparison, a monthly season ticket valid on all bus and rail services within West Yorkshire costs £154.40; a monthly season ticket valid only on First Bus bus services in the Leeds area costs £56. Similar prices apply in the West Midlands.
In comparison to incomes, fares for frequent users in Scandinavian cities are at a similar level to those in UTG cities and regions but season tickets often cover a wider geographical area and all tickets are multi-modal and permit interchange. In addition, changes in real fares in Scandinavian cities over the past decade have been comparable to changes in motoring costs.
The ability of the Scandinavian regions to provide all-mode tickets at prices that in relation to incomes are lower than in UTG member areas is due to the higher levels of subsidy per head (although not necessarily per trip) that the Scandinavian regions devote to local bus based public transport; to the fact that operators in the franchised bus systems of Scandinavia make lower levels of profit than in the deregulated bus system in UTG areas; and because rail services in Scandinavian regions are delivered at costs comparable to or sometimes lower than in Britain – all factors over which the UTG regions have to date had very little direct control.
1.3

THE SCANDINAVIAN APPROACH
The key characteristics of Scandinavian public transport are:
• High frequency services with high quality vehicles with good off peak provision
• Smart and simple multi-modal ticketing (with multi-modal fares delivering excellent value for money in comparison to incomes)
• High levels of public transport use
• Ambitious plans for public transport’s role in reducing carbon and toxic emissions through low or zero emission bus fleets and modal shift from other modes
• Public transport strategies that align with wider national and sub-national goals for economic development, land use planning and social cohesion
• Significant innovation including on vehicle technologies, smart ticketing and customer service
• Levels of revenue support for bus services which underpin a high quality of service (with higher funding per head and per trip on bus than in UK city regions although in Swedish cities funding per bus trip is lower)
• Comparable or lower levels of public funding per passenger km for rail services
Striking examples of these characteristics in practice featured in this report include:
• A raft of public transport improvements since 2000 in the Swedish region of Skåne resulting in a doubling of patronage.
• Between 28 and 38% of tickets sold In the Oslo/Akershus urban area of Norway were via mobile phones.
• There will be no diesel-powered buses in Oslo by 2020, and Skåne’s bus fleet will run on fossil-free fuel by the same year.
• Copenhagen’s metro and suburban rail service are a key part of the city’s plan to be the first in the world to be CO2 free by 2025
Scandinavian countries have taken this approach because there is a political and public consensus that public transport is a public service. A public service that has a key role to play in tacking road congestion, reducing greenhouse gases and air pollution. A public service that also spreads the benefits of economic growth and promotes social cohesion through ensuring better connectivity within and between communities – including linking peripheral areas with the main towns and cities that are driving the wider economy.
PUBLIC FUNDING
The table below shows the total public revenue funding for bus services, the ridership, population and the public funding per trip and per capita for the countries covered in this report (except for Denmark, where the data is for Copenhagen), and for England outside London. Public revenue funding for England includes tendered bus service costs, concessionary fares reimbursement and bus service operators’ grant. Copenhagen stands out as having particularly high public funding per trip.
Table 1.1 Comparison of funding and ridership per head, bus services, different countries.
Table 1.2 – Annual subsidy per passenger kilometre for sample rail franchises in Scandinavia and the UK
Public revenue funding (£m)
Ridership (millions)
Population (millions)
Funding per head (£)
Funding per trip (£)
Trips per head
Copenhagen met area 2014
218.49 176.2 2.576 85 1.24 68
English metropolitan areas 2012/13 (source: TSGB tables 0618 and 0622)
620 1,015 13 47.60 0.61 78
All Norway 2014 393 420 5 78.6 0.93 84
Oslo metro area 2014 (includes metro and tram)
292 225 0.85 343 1.29 265
All Sweden 2014 1,007 775 9.8 102 1.29 78
Gothenburg city 2013 (includes tram)
68.6 172.7 0.52 132 0.38 332
Annual subsidy pence per pax/km
Northern rail 2013/14 (source: ORR) 7.79
Merseyrail 2013/14 (source: ORR) 12.69
Gothenburg region 2014 (source: Trafa) 8
Skåne region, SW Sweden (source: Trafa) 1
Stockholm region (source: Trafa) 7
Data on rail services is more difficult to obtain for Norway (as services in its regions are run as part of a wider contract, negotiated at the national level, rather than competitively tendered contracts) but they are shown for selected Swedish regions, which franchise their rail services, and some selected rail franchises in English city regions that are run in UTG areas. Data is also presented for Danish rail services (all of which are secured via negotiated contracts).
In the Skåne region, 23 million train km are operated each year at a total cost (excluding revenue) of £6.24 per train km of which £0.58 per train km is access charges to the infrastructure owner/operator, Trafikverket, on the 100% electrified network.
The Scandinavian Way to Better Public Transport6 7
1.4
1.5
Report overview and summary

FRANCHISING IN SCANDINAVIA
The general pattern observed in the three Scandinavian countries is as follows:
• Virtually all bus services have been franchised.
• Sweden has franchised its regional rail services whilst long distance services are open access.
• Norway and Denmark deliver the vast majority of rail services through negotiated contracts with the incumbent national rail operator.
• Metro and tram services are provided either through franchising or by the incumbent municipal operator.
The main reason for introducing franchising was to reduce costs and in Denmark as a response to a large number of strikes in the public transport sector. It can also be viewed as a way of introducing market forces, for ideological reasons, into public transport, without the perceived disadvantages of full deregulation. These reasons are different from the main rationale for considering bus franchising in UTG regions in Britain, where the key impetus is a desire to improve integration.
The main impact of franchising of bus services in all three countries has been to reduce costs and increase quality. There is a less clear link between franchising and ridership, since all three countries have seen periods of growth and stagnation in bus passenger numbers in the 20-25 years since franchising began. That said, most urban regions in Sweden, and the Oslo area, have seen significant ridership growth since 2000. This has resulted primarily from increased level of service but franchising has helped to limit the increases in cost of providing this increase that could have arisen in a directly publicly delivered public transport system.
Related to the point in the previous paragraph on service levels, it is crucial to note that franchising in these countries and regions gives public sector Passenger Transport Authorities the direct ability to improve aspects of service because they specify and purchase that service from private sector operators. Thus, if they have the resources and are willing to pay for improvements, these can be delivered rapidly, to deliver on policy ambitions. Examples of this from other chapters of this report include:
• A raft of public transport improvements has been delivered in the Swedish region of Skåne since 2000, resulting in a doubling of patronage.
• In the Oslo/Akershus urban area of Norway between 28% and 38% of the tickets sold in 2015 were mobile tickets (Ruter 2016b).
• There will be no diesel-powered buses in Oslo by 2020, and Skåne’s bus fleet will run on fossil-free fuel by the same year.
• Copenhagen’s metro and suburban rail service are a key part of the public transport network that help it towards being the world’s first zero CO2 emission city by 2025.
The Scandinavian Way to Better Public Transport8 9
Outcome Achievements in Sweden, Norway and Denmark
Overall success of passenger transport and of franchising?
Public transport ridership per person in major Swedish cities and Oslo is much higher than in the UTG regions. This is likely to be a result of higher density land use in the Scandinavian cities coupled with better public transport service. Public transport use as % of all trips is lower in Norway and Denmark and higher in Sweden than in Britain; but these figures in Britain are dominated by travel within London, and travel to London by rail, and Scandinavian countries are more rural than Britain.
Franchising in bus services in Scandinavia has been very successful in cutting operating costs and increasing quality (see below).
How are fares determined?
Fares policy and levels are determined politically at the regional level and seek to make public transport an attractive alternative to the car. Zonal fares system is universal. Strong emphasis on “equity” and simplicity of pricing means that there is little peak/off-peak price differentiation and no use of yield management even on longer distance regional rail services.
General governance model for urban/regional public transport
Bus and tram: regional body specifies services and fares and procures the operation from “private” operators (although Keolis and Arriva are major players and ultimately owned by national governments). Contracts are generally gross cost. Similar for regional rail in Sweden, and regional government has strong influence on rail service specification also in Copenhagen.
Outcome Achievements in Sweden, Norway and Denmark
Effectiveness of existing governance arrangements
Existing governance arrangements for public transport are not generally questioned by most commentators. Sweden reviewed its governance arrangements (see below) but retained something quite similar to what it had had before and to what is found elsewhere in Scandinavia.
Any recent changes in governance
In Sweden, a law adopted in 2012 gave more political direction to local and regional public transport, and introduced the possibility of deregulated bus services. This was an attempt to introduce more free market thinking into what was perceived by some as production-led industry unresponsive to the customer.
What formats for franchising are chosen, and why?
Varies greatly, both in duration and size of contracts; difficult to generalise. Gross cost contracts dominate, although increasingly with larger incentive payments for quality and/or payment of portion of contract per boarding passenger with validated ticket.
Preparation/research to select form of franchising?
As franchising has been in place for a long time, hard to know what research if any underlay original forms of contract selected. Now, experimentation with different forms of contract especially in Stockholm and Oslo is evaluated by national research centres and results are shared across industry. There is now in Scandinavia a wealth of experience, innovation and learning on different contracting formats.
Where does risk sit? Generally passenger transport authorities retain revenue and take revenue risk.
Innovations resulting from franchising process?
Industry in Scandinavia is innovative but it is not possible to say whether this is a result of franchising or simply the innovative nature of the culture in these countries.
Political and media view of franchising
Not an issue as long as service continued to be delivered and improved.
Impact on costs and subsidy of moving to franchising
Franchising of bus services in Sweden in the early 1980s saw 20% more supply, 20% cost reductions and 30% increase in ridership. Lesser impacts have been observed later. The first round of franchising in Copenhagen achieved 20% cost reductions compared to previous public monopoly operator. Franchising in Norway achieved 10% operating cost reduction. Much of the savings have been reinvested to enhance the service levels.
Passenger benefits Higher service quality; in Denmark, less industrial action.
Benefits in relation to wider societal goals?
It is difficult to distinguish the impacts of public transport in general on societal goals from the impacts of franchising. Whilst public transport – especially regional rail – is seen as positive for economic growth, it is difficult to disentangle its effects from the many other factors that influence the economy.
The link between public transport, land use planning and economic development
Economic development and public transport are regional government functions. Land use, though, is primarily municipal, with no strong regional plan. This allows some municipalities to follow development plans that do not support public transport (e.g. not close to stations, low densities) for local political reasons. Municipalities are major landowners and land use planning is more prescriptive than in the UK, so for those municipalities that wish to pursue development patterns that support public transport, it is easier to do so than in the UK.
Table 1.3 – How Scandinavian countries have delivered on outcomes related to public transport that are of interest to UTG members
1.6
Report overview and summary

The Scandinavian Way to Better Public Transport
High levels of taxation on car ownership have been applied over many years as a revenue raiser and were more politically feasible in Denmark than in neighbouring Sweden due to the former’s lack of an indigenous car industry. Within this general Scandinavian welfare model context, public transport (especially bus) has been seen as a public service, albeit one whose efficiency can be increased through franchising.
The more left-leaning Danish governments elected in 2009 and 2011 signaled a shift away from road construction (except for the worst bottlenecks) and placed a much greater emphasis on public transport and cycling. This was motivated by a desire to tackle traffic congestion and also to reduce greenhouse gas emissions.
Until the late 1980s, public transport, public transport was provided entirely by publicly owned monopoly operators. Rail services were all provided by the incumbent state operator DSB. In order to introduce some level of competition into this system, franchising of bus services under contracts to private operators began in Copenhagen in the early 1990s and then in other regions shortly thereafter. This was done in order to improve services and service quality whilst maintaining public control over strategic decisions about public transport. The bulk of rail services continue to be provided by DSB under a negotiated contract with the country’s Department for Transport.
An important distinctive feature of Danish culture is the high level of cycling in its cities (see figure 6). Cycling accounts for 15% of all trips in Denmark and 1 in every 5 commuter trips are made on bikes. Furthermore, almost 90% of all Danes own a bicycle. For example, in Aalborg 17% of all trips are made on bikes. Between 2001 and 2012 the number of cyclists in Aalborg increased by 11 % (Cycling Embassy of Denmark, 2016). The City of Copenhagen is now even officially ‘Bike city of the world’ and ‘Best city for cyclists’ (Denmark, 2016), with 45 % of its population cycling to work or to their place of education in the municipality1. More than 60% of Copenhageners use their bike every day. Greater Copenhagen has over 1000 km of bicycle lanes (Copenhagenize Design Co, 2016). High levels of cycling can partly be attributed to low car ownership and investment in new cycling infrastructure.
Denmark10 11
DENMARK
GEOGRAPHIC CONTEXT
Denmark is a small country with a land area of only 43,000 square km (compared to 244,000 square km for the UK) and a population of 5.7 million. Using the Eurostat Local Administrative Unit 2 methodology, 30% of Denmark’s population lives in rural areas, compared to only 14% of the UK’s population. 47% of the Danish population own a car compared to 46% in the UK.
On an index of purchasing power parity adjusted GDP, where the EEA average is 100, Denmark sits at 127, compared to the UK’s 108. It has a Gini coefficient (measuring income equality) of 27.4 compared to the UK’s less equal 32.4. (The Gini coefficient is non-linear, but to give an example, if 20% of the population own 80% of the wealth then the coefficient would be 0.6.)
In December 2016 £1 was worth around 8.8 Danish kroner.
OVERALL APPROACH TO TRANSPORT, MOBILITY AND PUBLIC TRANSPORT
The traditional approach to transport provision in Denmark has been one of ‘predict and provide’, especially with regard to roads, echoing general practice in Europe more widely. The current proposal to construct a roughly £3 billion eastern bypass in Copenhagen, partly within a tunnel, illustrates this approach. Historically high car taxes have limited car ownership but with recent economic growth car ownership has grown to levels comparable with the UK although car ownership in Copenhagen remains low at only 227 per thousand people.
1. City of Copenhagen (2015): København. Cyklernes By. Cykelregnskabet 2014.
2.1
2.2

The Scandinavian Way to Better Public Transport Denmark
USAGE OF PUBLIC TRANSPORT IN DENMARK
Public transport’s share of all trips is only 6%. This is a little more than half the 11% of trips made by public transport in Great Britain. Car use in Denmark, at 58% of trips, is however lower than the GB figure of 64%. The difference is accounted for by much higher cycling levels (15% of trips) but not at the expense of walking which at 18% of trips in Denmark is close to the 22% figure observed in the UK. (Danish National Travel Survey, 2015; GB National Travel Survey, 2014.)
The relative share of passenger km in Denmark are shown in figure 2.2 below. The corresponding figures for GB are 78% by car, 10% by train, 5% by bus, 1% by bike and 3% on foot. Similarly to Great Britain, public transport passenger km (especially for train) have been increasing in Denmark since 2000.
WHAT DOES THE PUBLIC TRANSPORT USER ENCOUNTER IN TERMS OF SERVICES AND FARES?
Service levels The general approach is to provide a level of service on main urban corridors which provides an attractive alternative to the car. In Copenhagen, the “Finger Plan” or strategic land use plan adopted in 1947 was closely linked to public transport, since development was focused on suburban rail routes radiating from the city.
Copenhagen, Denmark’s capital city (urban population of approximately 1.8 million), has an extensive network of public transport, consisting of buses, two metro lines, seven S-train (S-tog) lines and water buses. There are several types of buses in Copenhagen; the reason for this product differentiation is so that there is a network that caters appropriately for the level of demand in different areas and corridors, that grows demand where it can, and where one type of service complements another:
• A-bus: high-frequency buses in Central Copenhagen
— rush hours: every 3 to 7 minutes
— every ten minutes in the daytime outside of the rush hours
— half hourly all night service
• S-bus: fast buses between regional centres in the urbanised areas
— faster than A-buses due to fewer stops
— rush hours: every 5 – 10 minutes
— every 20 minutes outside of the rush hours
— services run early and late (generally between 6am and 1am)
Figure 2.1 Share of passenger km, Denmark, 2015. Source: Vejdirektoratet, 2016
Figure 2.2 Modal share for different trip categories in Copenhagen. Source: City of Copenhagen Bicycling Account 2014
Figure 2.2 opposite shows the importance of public transport as a mode in Copenhagen (2014), the country’s largest city, for various types of trip. In no case is public transport more than 30% of the trips made.
5%
45%
27%
23%
63%
10%10%
17%
30%
20%
33%
17%
36%
24%
40%
Bicycle Public Transport Car Walking
Copenhageners’ journeys to work and education in the City of Copenhagen
All journeys with start and / or stop in the City of Copenhagen
All journeys with start and / or stop in the City of Copenhagen, except walking
Journeys to work and education in the City of Copenhagen
0.5%0.3%
77% 9%
4.2%
8.4%
12 13
2.3
2.4

Denmark 15
The Metro runs 24 hours a day seven days a week with frequencies of two to four minutes in the rush hours and three to six minute frequencies in the off-peak. The night time service runs at frequencies of between seven and twenty minutes. The S-trains run between 5am and 00.30am with frequencies of between four and twenty minutes.
In smaller Danish cities, such as Aalborg with an urban population of approximately 110,000, public transport is commensurately less extensive, but still seeks to be competitive with the car on major routes. The frequency of buses differs from every four minutes on the main routes (metro bus) to every hour between 08:00 and 20:00 (local bus). Most of these buses run via the central bus station (Aalborg Busterminal). The city of Aalborg also has a system of Telebuses and taxis, providing service to areas without conventional bus services and to those who cannot use such services.
The level of public transport in the Danish countryside differs. Rural communities close to cities are more easily accessible from nearby cities (e.g. twice an hour), more remote villages are less well connected with frequencies varying from one bus a day to one bus per hour. Some regions also have so-called Telebus that run when a passenger has ordered the service by telephone beforehand.
Ticketing Tickets can be bought on buses, on trains, at metro stations as well as at kiosks. Tickets can also be bought via the Mobilbilleter Hovedstaden app. Single journey tickets cost between DKK 24 (two zones) and DKK 108 (all zones). A two zone ticket would typically allow for around eight kilometres of travel. As well as local integrated ticketing systems (such as the multi-modal scheme in Copenhagen) there is also a national stored-value Rejsekortet smartcard that can be used on all public transport services. The pass itself costs DKK 80 and can be topped up using Rejsekortet machines, online or via the user’s bank account.
Figure 2.3 shows changes in fare levels in Copenhagen between 2004 and 2014 for a two zone trip. It also shows how season tickets have seen the lowest increases.
Vehicles Given the priority given to reducing emissions the bus fleet has a relatively low average age. Indeed all new buses in the Movia (Greater Copenhagen) area must meet at least Euro Six standards. As part of Copenhagen’s aim to become the world’s first zero-emission capital by 2025, Movia will also be introducing electric buses in the City. Buses must also meet demanding specifications for noise reduction.
14 The Scandinavian Way to Better Public Transport
Figure 2.3 Trends in fares in the metropolitan area of Copenhagen, 2004-2014 (DKK) Source: Trafikstyrelsen, 2014
2004 2005 2006 2007 2008 2009 2010 2011 2012 2013 2014
Single 17 17 18 19 20 21 23 24 24 24 24
Carnet strip ticket 10.5 11 11.5 12 12.5 13 13.5 14 14.5 15 15
Monthly season ticket 7.3 7.5 7.6 7.8 7.8 8 8 8 8.4 8.8 9
30
25
20
15
10
5
0

Denmark 17
2. Trafik- og Byggestyrelsen (2015): Den kollektive trafik i Danmark 2015. Status over udviklingen i sektoren. Copenhagen: Trafik- og Byggestyrelsen. 3. Økonomi- og Indenrigsministeriet (2015):
Figure 2.4 The six trafikselskaber in Denmark Source: Forbrug, 2016
The Scandinavian Way to Better Public Transport16
GOVERNANCE AND LEGISLATION
For many years Danish Governance has been based on three tiers:
1. The state
2. Regions
3. Municipalities
Regions and municipalities are distinct entities as they have different tasks and responsibilities. Denmark is made up of 98 municipalities (kommuner). The local and regional governments are responsible for different functions but are independent of one another (that is, regions have no formal power over municipalities or vice versa). Regions and municipalities have a wide remit including primary education, healthcare, land use planning and transport.
In 2010 the regions and municipalities were responsible for 71% of public expenditure (22% by regions and 49% by municipalities). The income of the municipalities was composed of (in order of importance): income taxation, block grants, reimbursements, user payment and land/property taxes. The regions are not entitled to levy taxes; they are financed by the Danish state and municipal contributions. The central Danish government is responsible for the areas of national sovereignty but is also involved in many welfare state issues that the municipalities and regions provide. Local governments are held responsible for a great variety of fields, including primary education, health, land use planning and transport. For example, road management is now a municipal responsibility, covering 90% of Danish roads (in 2009), yet, state roads carry a larger proportion of the traffic.
In general, public transport in Denmark is organized as follows:
• National government funds the state owned railway.
• Municipalities determine and fund their local bus networks.
• Regions determine and fund regional bus networks and in some cases own the infrastructure of a small number of Privatbaner local railways, and either operate those railways directly or contract for them.
• Long distance coach services (Fjernbusserne) are commercially operated however operators can claim reimbursement from the national Government for providing concessionary fares (for example for children and students).
Denmark has two types of rail provision: state railways (Statsbanen) and a small number of private railways (Privatbaner). The state railways consist of the rail infrastructure (including that which is used by regional rail services) and operations.
2.5 services; and operations, mostly covered by the state-owned operator DSB (via a directly awarded contract) but also to a small extent by private operators who have won tenders (Arriva in the Jutland area, for example). The state-owned railway is responsible for the operation of intercity traffic, regional traffic and S-trains (in the Copenhagen area), and the maintenance and enhancement of associated infrastructure.
Privatbaner on the other hand are local branch railways, of which there are four. They are owned by the passenger transport authorities (trafikskaber), municipalities and small private owners3. They are mostly operated in-house except for one which has been contracted out for operation to Arriva.
In Denmark local and regional public transport services are determined and funded by local government (municipalities for local bus services and regional government for regional bus services and the Privatbaner). For the detailed planning, contracting and oversight of those services regions and municipalities group together into wider Passenger Transport Authorities (Trafikskaber) which they collectively own and govern. So whilst the municipalities and regions decide on the overall level of services they want and how much they are prepared to fund, the PTA is responsible for translating that into planning, travel information, fares and ticketing and procurement of networks of services that fulfill the overall aims and wishes of their constituent regions and municipalities.
Overall (as figure 2.4 shows) there are six PTAs in Denmark. Movia (which includes Copenhagen) is made of two regions and 45 municipalities whilst the other five PTAs each cover one region and between ten and nineteen municipalities.

The Scandinavian Way to Better Public Transport Denmark18 19
Figure 2.5 Share of bus market by operator (grey area of 17% is smaller operators with fewer than 50 buses each) Source: Danish Transport & Construction Agency, 2015, p. 14. 2.7
Since local roads are planned, operated and maintained by municipalities, they are responsible for the majority of the infrastructure for bus services: stops, shelters, bus lanes and signal priority. Following some changes in legislation, regions can also provide infrastructure, although they then hand ownership to the municipalities. Examples of the infrastructure that the regions can provide include terminals, travel information systems and waiting rooms.
The Danish government does not produce a single national integrated transport plan however the Danish Transport and Construction Agency produces a rail plan every four years. There have also been multi-modal studies and plans for particular areas (such as for connections between Eastern and Western Denmark).
SHARE OF BUS MARKET BY OPERATOR
Private operators now provide almost all bus services in Denmark (compared to the 1980s when all services were publicly provided). The main operator is Arriva and the second Keolis. Figure 2.5 shows the expected market share of bus operators for 2014/15 (the grey area of the graphic shows the 17% of the market operated by small operators with fewer than 50 buses each. As can be seen from fi gure 2.6 the industry is not as concentrated as in the UK although two large operators have a signifi cant market share between them. The larger operators are often advocates of net cost contracts, while the smaller operators usually prefer the current gross cost system because it reduces revenue risk for them.
The rail market is dominated by the incumbent operator DSB on a negotiated contract with the Ministry of Transport and Building. There are few experiences of tendering in the rail sector. However, Arriva operating in Mid and Western Jutland is generally considered a success in terms of the quality that was secured for the price.
HOW FRANCHISING WORKS IN DENMARK
Almost all local and regional bus transport in Denmark is now tendered, together with the Copenhagen Metro and one state railway service. This move to tendering came about in the late 1980s and had three main motivations:
• To improve service quality and customer friendliness and therefore customer satisfaction.
• To cut costs.
• To drive continuous improvement.
It was also the product of dissatisfaction caused by problems in the industry during the 1980s – particularly several strikes, stagnant ridership and rising costs. It was fi nally also motivated partly by free market ideology, but unlike in the British case, tendering was selected as the way to introduce market forces into the Danish bus industry, beginning with the Copenhagen region.
Figure 2.6
35% 13%
6%
6%
6%
4%
4%2%2%2%
17%
Arriva Keolis Bus Danmark A/S Arhus Sporveje Thykjær Tide Bus Nobina A/S Ditobus A/S De Blå Omnibusser A/S Anchersens Rute ApS Fjordbus A/S Rutebilselskabet Haderslev Brande Buslinier / Herning Turist Busentreprenører m. < 50 busser2.6
2.7

The Scandinavian Way to Better Public Transport20
Regarding bus transport, tendering is now found in all regions in Denmark (except for the small exception of the island of Bornholm, where there is a municipal in-house operation).
On rail there has only been very limited tendering so far with DSB (Danish State Railways) continuing to operate the vast majority of services on the basis of a negotiated contract. The three examples of tendering so far include two rounds of tendering of £27 million per annum of rail services in Mid and Western Jutland (which was won both times by Arriva). The Coast Line in Eastern Zeeland is the third example. This contract was coordinated with a similar tendering exercise in Sweden, given that services run across the border via the Oresund bridge. The contract was won by DSB First (owned by DSB and First Group). However, when the contract expired in 2015 the Danish services were re-integrated into DSB’s negotiated contract whilst the Swedish services were once again competitively tendered.
Regarding the Copenhagen Metro, the responsible franchising authority is not Movia but Metroselskabet, which is a cooperation between the state and the two main municipalities in Copenhagen. The task of operating the metro is tendered and currently operated by Metroservice (which is a joint venture between the municipal public transport operator of Milan (Azienda Trasporti Milanesi and AnsaldoSTS).
Figure 2.74. Trafi k- og Byggestyrelsen (2016): Trafi kselskabernes forventede udbud af buskørsel. For perioden 2017 – 2026.5. Trafi k- og Byggestyrelsen (2016): Entreprenørstatistik. For perioden 2015-2016. Copenhagen: Trafi k- og Byggestyrelsen.6. Aftale mellem regeringen (S og RV) og SF og Enhedslisten om: Passagertogtrafi k i Danmark 2015-2014. Copenhagen:
Transport- og Bygningsministeriet.
Both contracts are very detailed, specifying the routes, timetables, fares and quality standards that the operator should run and meet. The duration of bus contracts varies. The shortest contracts are four years with the option of a one year extension (for example some of the contracts in Nordjyllands Trafi ckselskab) whilst at the other end of the spectrum Sydtrafi k has ten year contracts with the option of a two year extension and Movia has contracts of six years with the potential for a further three extensions of two years each4.
The contract for Mid and Western Jutland rail services is eight years with the option of an additional two years.
In Denmark contracts for bus services are mostly gross cost with incentives for passenger satisfaction and in some cases for increased patronage. Gross cost contracts are also the norm for metro services.
Although there are no published statistics on the number of bidders for bus contracts four to six bidders is broadly typical (however there are cases where there has been only one bidder). A policy for many of the PTAs has been to establish conditions which make it likely that small operators will bid, thereby securing competition5 such as, for example, keeping tenders relatively small rather than covering a whole area (area wide contracts for bus services are rare in Denmark).
On rail there were fi ve bidders for the fi rst round of tendering in Mid and Western Jutland and three for the second round (this may have been partly due to the incumbent’s strong position in the second round). For the Coast Line tender in Eastern Zeeland there were fi ve tenders.
DSB and the Danish Ministry of Transport and Building have negotiated a new ten year contract for 2015 to 2024. No new tenders are expected on the railways in the near future though an evaluation of DSB’s performance will take place in 2019 and the intention is to progressively introduce tendering from 2024 with all passenger services tendered by 20306.
21Denmark
The Scandinavian Way to Better Public Transport Denmark22 23
There are several franchising authorities in the Movia area, refl ecting its size, the variety of modes and its status as the capital region. Movia itself is the PTA, covering the entire area, responsible for bus transport and the region’s one private railway (the ‘Privatbaner’). Metroselskabet is the authority responsible for the Metro in central Copenhagen, while the Ministry of Transport and Building, in a contract with DSB, is the authority responsible for intercity and regional train traffi c, as well as the high frequency suburban S-trains in Greater Copenhagen.
To provide coordination and integration across public transport modes, DOT (Din Off entlige Transport) was established in 2012 as a coordinating, umbrella body. The owners of DOT are Movia, the Metro and DSB. In addition to DOT, the ‘Timetabling Group’ (Køreplangruppen) is a partnership, established over 20 years ago, to facilitate coordination of timetables between diff erent operators and modes across the region. This group includes the members of DOT, and also the national rail infrastructure manager Railnet Denmark (Banedanmark), while the Danish Transport and Construction Agency (Trafi k- og Byggestyrelsen) is an observer7.
CITY REGION CASE STUDY: MOVIA
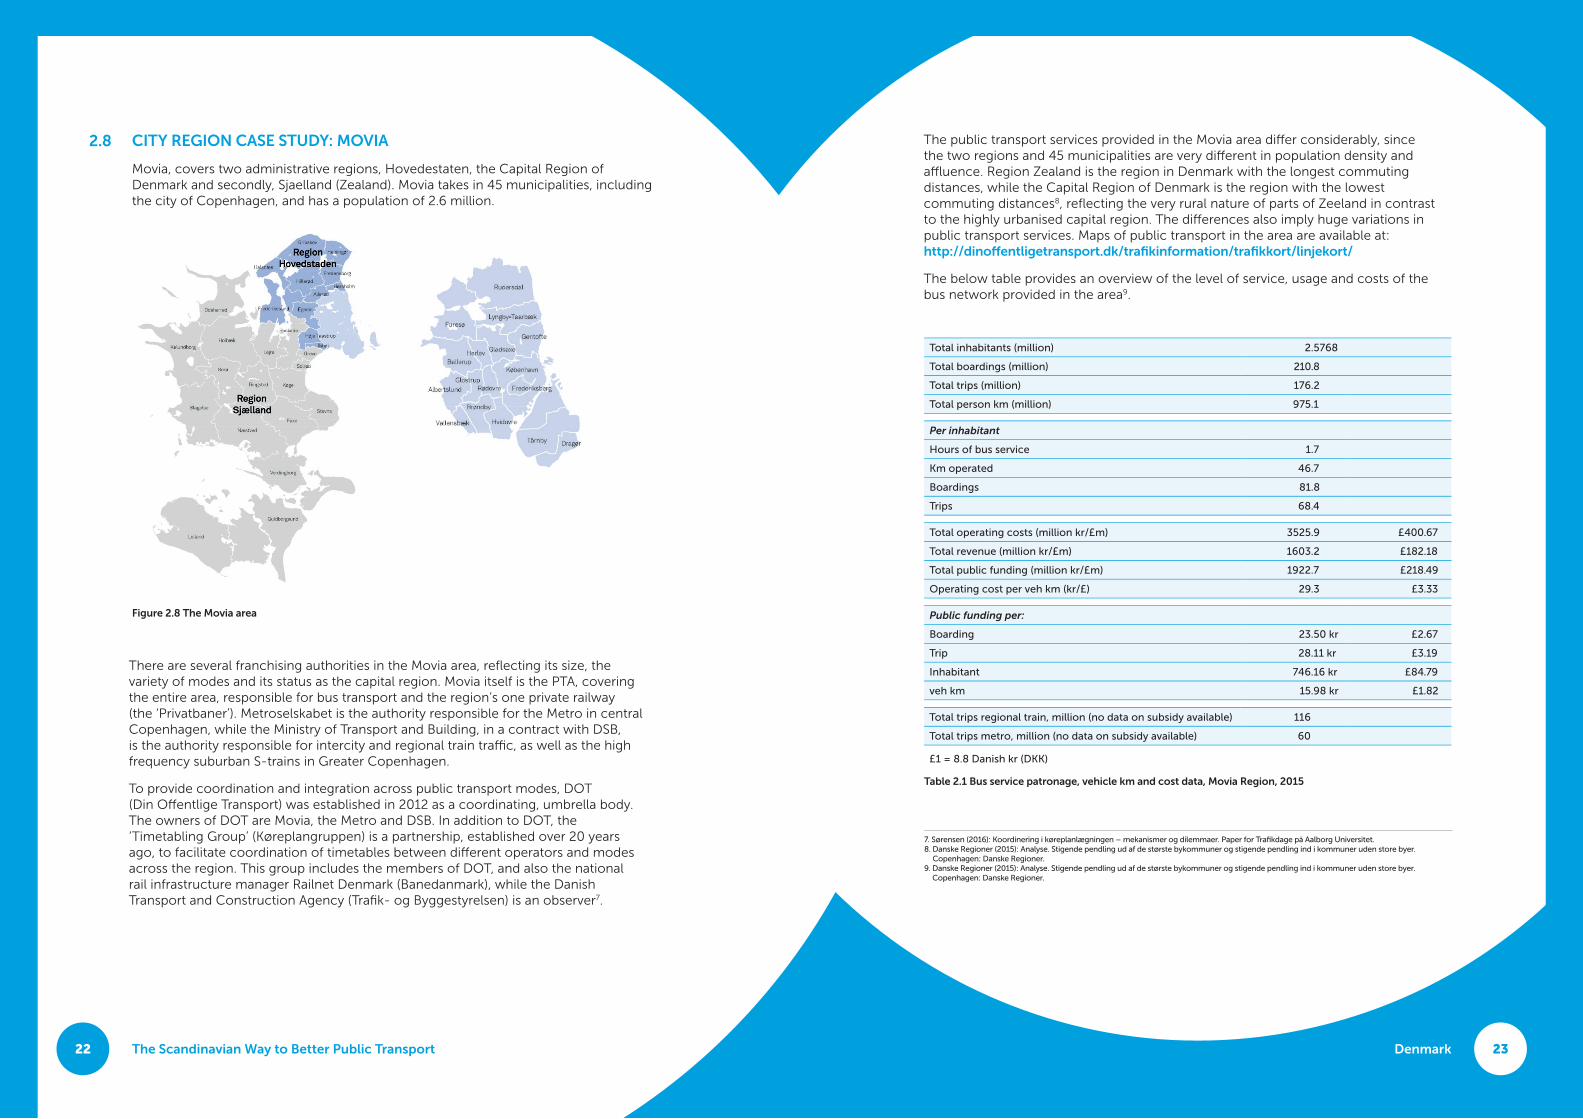
Movia, covers two administrative regions, Hovedestaten, the Capital Region of Denmark and secondly, Sjaelland (Zealand). Movia takes in 45 municipalities, including the city of Copenhagen, and has a population of 2.6 million.
Figure 2.8 The Movia area
The public transport services provided in the Movia area diff er considerably, since the two regions and 45 municipalities are very diff erent in population density and affl uence. Region Zealand is the region in Denmark with the longest commuting distances, while the Capital Region of Denmark is the region with the lowest commuting distances8, refl ecting the very rural nature of parts of Zeeland in contrast to the highly urbanised capital region. The diff erences also imply huge variations in public transport services. Maps of public transport in the area are available at: http://dinoff entligetransport.dk/trafi kinformation/trafi kkort/linjekort/
The below table provides an overview of the level of service, usage and costs of the bus network provided in the area9.
Total inhabitants (million) 2.5768
Total boardings (million) 210.8
Total trips (million) 176.2
Total person km (million) 975.1
Per inhabitant
Hours of bus service 1.7
Km operated 46.7
Boardings 81.8
Trips 68.4
Total operating costs (million kr/£m) 3525.9 £400.67
Total revenue (million kr/£m) 1603.2 £182.18
Total public funding (million kr/£m) 1922.7 £218.49
Operating cost per veh km (kr/£) 29.3 £3.33
Public funding per:
Boarding 23.50 kr £2.67
Trip 28.11 kr £3.19
Inhabitant 746.16 kr £84.79
veh km 15.98 kr £1.82
Total trips regional train, million (no data on subsidy available) 116
Total trips metro, million (no data on subsidy available) 60
£1 = 8.8 Danish kr (DKK)
Table 2.1 Bus service patronage, vehicle km and cost data, Movia Region, 2015
7. Sørensen (2016): Koordinering i køreplanlægningen – mekanismer og dilemmaer. Paper for Trafi kdage på Aalborg Universitet. 8. Danske Regioner (2015): Analyse. Stigende pendling ud af de største bykommuner og stigende pendling ind i kommuner uden store byer.
Copenhagen: Danske Regioner.9. Danske Regioner (2015): Analyse. Stigende pendling ud af de største bykommuner og stigende pendling ind i kommuner uden store byer.
Copenhagen: Danske Regioner.
2.8
Denmark 25
The average speed of the buses in 2015 was 26.6 km/h, the lowest among all the regions, reflecting the heavily urban area of the Copenhagen part of the region.
As Movia was previously two regions, two different fare and ticket systems were in use until December 2016 (although the traveller card, rejsekortet, can be used in the entire area). However, since January 2017 this situation changed, and the same fare- and ticket system is available in the whole area to benefit inter-regional travellers.
In relation to contract specifications, Movia’s tendering material for bus operations consists of a relatively short contract as well as several annexes. The following headlines are covered:
10 Movia (2016): Størst mulig kvalitet i udbud og kontrakter. Copenhagen: Movia, https://www.moviatrafik.dk/media/3989/movias-udbudsstrategi.pdf.
11 Movia (2015): Udbudsmateriale til A14 – Udbud af almindelig rutekørsel i Movia. Copenhagen: Movia.12 1 euro is ca. 7,5 DKK13 Movia (2015): Udbudsmateriale til A14 – Udbud af almindelig rutekørsel i Movia. Copenhagen: Mobvia14 Lokaltog (20+16): Årsrapport 2015. Hillerød: Lokaltog A/S.
The criteria for choice of operators are: price (40 %), quality of performance (35 %), environment (15 %), and vehicle specifications and quality (10 %)10. Clearly therefore there is considerable emphasis put on quality as well as price.
The majority of Movia’s contracts with bus operators include performance incentives to increase performance. Passenger satisfaction and service level (percentage of service performed) forms the basis of a bonus-malus system. The maximum bonus represents 3 % of the entire contract sum. Passenger satisfaction and service levels are also applied in Movia’s decisions about whether or not to extend the contract periods. If passenger satisfaction and service levels are extraordinary low, Movia can apply the contract’s provision on non-compliance11.
Incentives based on passenger numbers are also applied to a limited extent, in order to encourage operators to take steps to grow the market. In Movia’s tendering in 2015, this was applied in one of 12 tender units covering two bus lines. The tender unit was by far the biggest of the tender units in 2015. The incentives were12:
• 0.50 DKK extra for each passenger that is retained.
• 1.00 DKK for each additional passenger.
• An agreement on higher payment for extra passengers can be made, if the operator wishes to and is ready to negotiate a plan with Movia for additional activities13.
A private consultancy monitors passenger satisfaction on behalf of Movia based on passenger surveys and this feeds back into the performance incentive regime.
In the bus sector vehicles are owned by the operators, while municipalities and the Danish Road Directorate own the roads. Regarding the metro system, Metroselskabet owns the infrastructure as well as rolling stock. Railnet Denmark (Banedanmark) owns all railway infrastructure except for the single local private railway in the region, while DSB owns the rolling stock. For the local rail (Privatbaner), the operator in the area, Lokaltog Ltd owns the rolling stock, while two infrastructure providers own the infrastructure. One of these providers is owned 100 % by Lokaltog, while Lokaltog owns 78.7 % of the other infrastructure provider14.
24 The Scandinavian Way to Better Public Transport
• Tender conditions
• The extent of procurement
• Bus material
• Transfer of bus material
• Environment
• IT systems and equipment
• Information, advertisement, and other services
• Requirements regarding steering of operations and traffic
• Steering of quality
• Incentives to passenger growth
• Changes in the extent of operation during the contract period
• The operator’s information provision
• Corporate Social Responsibility
• Business transfer
• Staff conditions
• Facilities for drivers
• Payment
• Adjustment of payment
• Confidentiality – document access – disclosure

Denmark 2726 The Scandinavian Way to Better Public Transport
Public transport’s market share by area
Area commuting leisure business
Copenhagen City 24% 11% 13%
Hovedstadsområde 17% 7% 6%
Sælland 16% 3% 5%
The most recent innovations in the area cover improvements in services; multi-modal mobility; and new infrastructure. This reflects Movia’s attempts to be more than a public transport organisation but at the same time to ensure that it meets its core objectives and grows the public transport market. Examples are as follows:
• A recent success has been the establishment of the bus R-network outside the metropolitan area. The R-network consists of relatively direct routes departing in fixed minutes operating all through the week. With more direct routes and fewer stops the new network has attracted a considerable number of passengers.
• The Copenhagen metro is being expanded by introducing more lines, such as a city ring that will be in operation from 2019. In addition, a light rail line will be constructed along the ring road in the Western part of Greater Copenhagen. It is expected to be in operation from 2024.
• The establishment of a stretch of five kilometres of semi-BRT in the centre of Copenhagen. Within 80 % of the stretch buses either drive in BRT standard or in bus lanes. Other similar stretches are planned in central Copenhagen.
• In Movia a unit dealing with broader mobility issues has been formed. The unit for example informs and enters into negotiations on mobility issues with municipalities, public and private companies and high schools. The unit is further involved in preparing a trial on Mobility as a Service (MaaS) in the central municipalities in Greater Copenhagen (the cities of Frederiksberg and Copenhagen).
Due to huge differences in population density across the entire Movia area, the market share of public transport differs considerably. The table below shows the difference in public transport’s market share between the centre of the region and other municipalities in the Capital Region of Denmark, as well as Region Zealand for commuting, leisure and business trips.
15Movia (2016): Trafikplan 2016. Udkast til administrativ høring. Copenhagen: Movia.
Public transport’s market share is particularly high in commuting traffic in the dense central parts of the metropolitan area. In these central areas, the share of leisure and business traffic also is considerable. The share of commuting traffic has increased over the past few years, due to a 5% increase in the number of jobs located in the Capital Region15.
Table 2.2
DENMARK CONCLUSIONS
Public transport in Denmark has for many years been viewed as a public service and therefore something that is worthy of public sector support, although the general transport planning climate outside cities has adopted a predict and provide approach to planning for car traffic. Since 2000, policy decisions have put greater emphasis on public transport as an alternative to the car and as a means of reducing local and global emissions. Politically, all parties agree on the general role for public transport and the principle of supporting it with public funds.
Within each PTA area, the passenger experiences a relatively integrated offer, with integrated multimodal zonal ticketing, high frequencies on main corridors, a common corporate image, and services that complement rather than compete with one another.
The increase in public transport provision in recent years has come at a price of increasing government support. It is also the case that the subsidy for buses per passenger trip in Denmark is high compared to Norway, Sweden and Britain outside London. The cost of the increase in service has been ameliorated somewhat by the efficiency gains resulting from the competitive tendering of bus and metro services; these have reduced costs whilst at the same time driving up service quality. Rail services continue to be the largely in the hands of the incumbent national operator DSB which has a negotiated contract with national government.
2.9

The Scandinavian Way to Better Public Transport
In urban areas, on the other hand, there is now strong public and political support for an increase in the market share of public transport. This is both for environmental reasons and to promote intra-regional access to employment. The background for the political support for urban public transport is twofold: rapid population growth in urban areas; and the “climate settlement” of the national government. The “climate settlement” refers to an agreement reached by the Norwegian Parliament in 2012, which specifies “zero growth” in the use of cars in urban areas, measured as a percentage of journeys (Nilsen, 2014). In contrast to this clear political strategy to grow public transport, legislation relating to its organisation or to service provision in general is not in any way part of the national political agenda. All political parties have historically seen local public transport as a public service, but now all also support the development of public transport as a means of combating transport problems in Norwegian urban areas and of reducing emissions. Thus the political environment for public transport has improved in recent years.
Congestion charging has been introduced at various times in six Norwegian cities primarily in order to raise revenue for investment in new highway and public transport infrastructure. Only two of these seven schemes currently operate, as each scheme is always set up with a finite lifespan to raise money for specific infrastructure investments, after which it is removed. In general, in these rural areas, and for interurban transport more generally, there has been consistent long term investment in new roads, including the replacement of ferry crossings with bridges and tunnels. Public transport has been seen as a social service and safety net.
USAGE OF PUBLIC TRANSPORT IN THE COUNTRY
Results from the Norwegian National Travel Survey 2013/14 show that the total public transport market share is 9 % for the country as a whole. Trips by car (driver and passenger) dominate with a total market share of 64 %. Walking has a market share of 21 % and cycling 4 %. This is very similar to Great Britain except that in Norway bicycle use is higher and public transport use lower.
Norway28 29
NORWAY
GEOGRAPHIC CONTEXT
Norway is a very large sparsely populated country with a land area of 385,000 square km (compared to 244,000 square km for the UK) and a population of 5.1 million in 2015. Eurostat Local Administrative Unit 2 data (showing the proportion of population in rural and urban areas) is not easily available for Norway but it is likely that a higher proportion of its population lives in rural areas than the 14% in the UK’s.
On an index of purchasing power parity adjusted GDP, where the EEA average is 100, Norway sits at 160, compared to the UK’s 108 (2014). It has a Gini coefficient (measuring income equality) of 23.9 compared to the UK’s much less equal 32.4. Car ownership at 500 per 1000 people in 2014 is a little higher than the UK’s 468.
In December 2016 one British pound (GBP) was worth 10.75 Norwegian kroner (NOK).
OVERALL APPROACH TO TRANSPORT, MOBILITY AND PUBLIC TRANSPORT
Norway is not a very urbanized country, and a large part of the population live in rural areas or in small urban areas (Statistics Norway, 2016a). The provision of public transport is closely related to the type of area served. In rural areas, public transport is provided to ensure mobility for people who otherwise cannot travel because they do not own or cannot drive a car. There is a focus on public transport to access schools, hospitals and for disabled people, and such services account for between 80 and 100 % of the public transport service provided in the most rural areas (Nilsen, 2014). In general, in these areas, and for interurban transport more generally, there has been consistent investment in new roads over a long period, including the replacement of ferry crossings with bridges and tunnels, aligning with the general post-war “predict and provide” approach to transport planning; and public transport has been a social service.
1. City of Copenhagen (2015): København. Cyklernes By. Cykelregnskabet 2014.
3.1
3.2
3.3
The Scandinavian Way to Better Public Transport
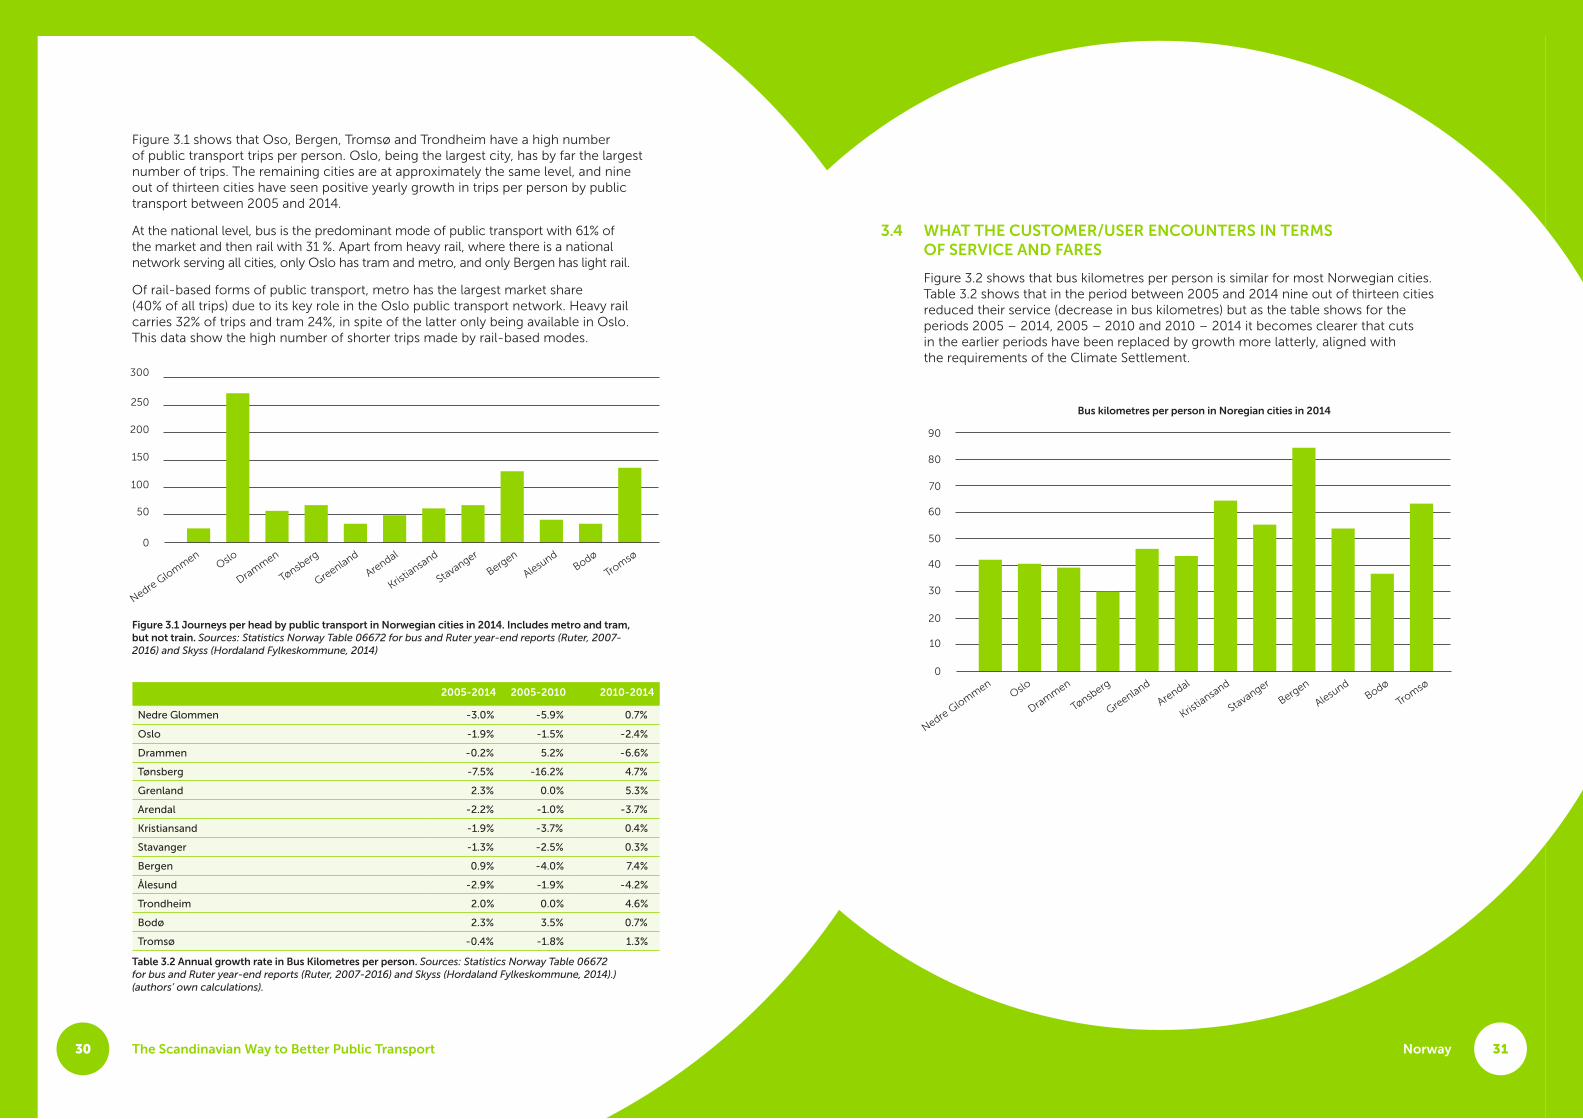
Figure 3.1 shows that Oso, Bergen, Tromsø and Trondheim have a high number of public transport trips per person. Oslo, being the largest city, has by far the largest number of trips. The remaining cities are at approximately the same level, and nine out of thirteen cities have seen positive yearly growth in trips per person by public transport between 2005 and 2014.
At the national level, bus is the predominant mode of public transport with 61% of the market and then rail with 31 %. Apart from heavy rail, where there is a national network serving all cities, only Oslo has tram and metro, and only Bergen has light rail.
Of rail-based forms of public transport, metro has the largest market share (40% of all trips) due to its key role in the Oslo public transport network. Heavy rail carries 32% of trips and tram 24%, in spite of the latter only being available in Oslo. This data show the high number of shorter trips made by rail-based modes.
30 31
WHAT THE CUSTOMER/USER ENCOUNTERS IN TERMS OF SERVICE AND FARES
Figure 3.2 shows that bus kilometres per person is similar for most Norwegian cities. Table 3.2 shows that in the period between 2005 and 2014 nine out of thirteen cities reduced their service (decrease in bus kilometres) but as the table shows for the periods 2005 – 2014, 2005 – 2010 and 2010 – 2014 it becomes clearer that cuts in the earlier periods have been replaced by growth more latterly, aligned with the requirements of the Climate Settlement.
Norway
Figure 3.1 Journeys per head by public transport in Norwegian cities in 2014. Includes metro and tram, but not train. Sources: Statistics Norway Table 06672 for bus and Ruter year-end reports (Ruter, 2007-2016) and Skyss (Hordaland Fylkeskommune, 2014)
300
250
200
150
100
50
0
Nedre Glommen
Oslo
Drammen
Tønsberg
Greenland
Arendal
Kristia
nsand
Stavanger
Bergen
Alesund
Bodø
Tromsø
Bus kilometres per person in Noregian cities in 2014
60
70
80
90
50
40
30
20
10
0
Nedre Glommen
Oslo
Drammen
Tønsberg
Greenland
Arendal
Kristia
nsand
Stavanger
Bergen
Alesund
Bodø
Tromsø
3.4
2005-2014 2005-2010 2010-2014
Nedre Glommen -3.0% -5.9% 0.7%
Oslo -1.9% -1.5% -2.4%
Drammen -0.2% 5.2% -6.6%
Tønsberg -7.5% -16.2% 4.7%
Grenland 2.3% 0.0% 5.3%
Arendal -2.2% -1.0% -3.7%
Kristiansand -1.9% -3.7% 0.4%
Stavanger -1.3% -2.5% 0.3%
Bergen 0.9% -4.0% 7.4%
Ålesund -2.9% -1.9% -4.2%
Trondheim 2.0% 0.0% 4.6%
Bodø 2.3% 3.5% 0.7%
Tromsø -0.4% -1.8% 1.3%
Table 3.2 Annual growth rate in Bus Kilometres per person. Sources: Statistics Norway Table 06672 for bus and Ruter year-end reports (Ruter, 2007-2016) and Skyss (Hordaland Fylkeskommune, 2014).) (authors’ own calculations).

The Scandinavian Way to Better Public Transport32 33
Table 3.3 Distance between home and nearest public transport service. Source: National Transport Survey 2013/14.
Table 3.4 Share of population by city with access to different levels of public transport service provision. (N: 33 193. Source: National Transport Survey 20013/14.)
Less than 500 metres
Between 500 and 999 metres
More than 1000 metres
Mean distance (metre)
Oslo 61.4 % 23.7 % 14.9 % 503
Bergen 64.5 % 23.8 % 11.8 % 438
Stavanger 70.1 % 20.7 % 9.2 % 390
Trondheim 69.6 % 16.7 % 13.7 % 518
Buskerudbyen 64.5 % 18.0 % 17.5 % 529
Kristiansand 66.8 % 16.3 % 16.9 % 547
Nedre Glomma 69.6 % 17.2 % 13.2 % 464
Grenland 63.6 % 21.5 % 14.9 % 504
Tromsø 86.5 % 10.8 % 2.8 % 244
7.5 min 15 min 30 min 60 min and more
Oslo 23.9% 32.8% 20.5% 12.6 %
Bergen 9.8% 22.5% 29.7% 24.7 %
Stavanger 8.1% 37.8% 30.2% 7.6 %
Trondheim 9.7% 33.2% 24.7% 17.6 %
Buskerudbyen 3.0% 16.9% 34.4% 30.0 %
Kristiansand 4.4% 16.2% 40.3% 23.0 %
Nedre Glomma 3.7% 14.1% 18.5% 41.8 %
Grenland 2.3% 31.8% 24.5% 19.9 %
Tromsø 3.6% 26.1% 47.6% 10.1 %
LEVEL OF SERVICE
The overall approach to public transport provision in and around cities is to ensure from early morning to at least mid-evening a “turn up and go” frequency on main corridors (including tram and metro), a frequent timetabled service on secondary corridors, and a half hourly or hourly service elsewhere. This is in order to provide an attractive alternative to the car on main corridors and to ensure accessibility elsewhere. The table below shows that in Norwegian urban areas around two thirds of the population live 500 metres or closer to a public transport service. The average varies from 244 metres in Tromsø (where the built up area is concentrated on radial corridors) to 529 metres in more dispersed lower density Buskerudbyen.
Table 3.4 provides analysis of how close people are to public transport services of different frequencies in different Norwegian Cities. 8% of the population live close to a service with at least a frequency of eight departures each hour during the daytime, while 9% have this frequency during the rush hour. In the Oslo urban area, 29% of the population live close to a public transport service with a frequency of at least eight departures each hour all day, rising to 32% during rush hour.
Norway
3.4.1
2015 2020 2025
Diesel 77 %
Biodiesel 6 % 36 % 18 %
Bioethanol 1 %
Biogas 14 % 47 % 44 %
Hybrid (diesel) 2 %
Hybrid (biodiesel) 3 % 3 %
Hybrid (biogas) 3 %
Plug-In-Hybrid (Biodiesel) 4 % 4 %
Battery (charging underway) 9 % 20 %
Battergy (charging by night) 3 %
Hydrogen 0.50 % 1 % 5 %
QUALITY OF SERVICE AND VEHICLES
Contracts for bus services are based on ensuring the bus fleet becomes as environmentally friendly as possible in as short a time as possible in order to reduce carbon and toxic emissions. In the Oslo/Akershus urban area, for example, investment plans aim to achieve a 100 % environmentally friendly energy mix by 2020, meaning that diesel will be phased out and replaced by different non-fossil fuels (biodiesel, bioethanol, biogas, hydrogen and renewable electricity). The target is that by 2020 100% of the fleet will be either electric or biogas (see table 3.5).
Table 3.5 Current and planned breakdown of the bus fleet in the Oslo/Akershus urban area. Source: Ruter, 2015.
3.4.2

The Scandinavian Way to Better Public Transport34 35
Figure 3.3 Illustration of zones in Oslo/Akershus. Source: Ruter, 2016a.
One way 24 hours 7 days 1 month 1 month youth 1 year
1 zone 33 NOK 85 NOK 260 NOK 700 NOK 350 NOK 7,000 NOK
2 zones 53 NOK 135 NOK 400 NOK 1,100 NOK 350 NOK 11,000 NOK
3–5 zones 73 NOK 185 NOK 500 NOK 1,500 NOK 350 NOK 15,000 NOK
Fares and ticketingThe general approach is to provide fares and ticketing that are easy to understand, zonal, multi-modal, that permit interchange, and that are consistent across the country, whilst off ering best value for money to regular travellers. In urban areas, the following products are typically off ered: single-journey, 24-hours, 7-days, monthly and yearly tickets. The price of these products does not vary substantially between the larger urban areas in Norway. Table 3.6 below shows the prices of diff erent ticket products (in Rogaland, the region with Norwary’s fourth largest city, Stavanger).
Norway is nowadays an almost cashless economy, which also is evident in the public transport sector. It is still possible to pay the driver on boarding the bus or tram, but a considerable surcharge applies, meaning that most people buy tickets off -bus at corner shops, online or at machines at stops and stations. In addition, an increasing proportion of ticket sales are via mobile apps provided by the diff erent regional transport providers. In the Oslo/Akershus (Oslo is the municipality of the capital, and Akershus is the surrounding region) urban area between 28% and 38% of the tickets sold in 2015 were mobile tickets (Ruter 2016b).
In some areas, for example in the urban areas of Oslo and Bergen, the number of fare zones reduced in recent years, in order to make the system easier to understand. In Oslo and Akershus there are now only four zones whose size and location is based on distance from the city centre and the direction of the main public transport fl ows in the region. The price of the ticket is dependent on the number of zones that one travels through.
Norway
Table 3.6 prices of diff erent ticket products in Rogaland, the county in which Norway’s fourth largest city, Stavanger, is located.

The Scandinavian Way to Better Public Transport36 37
Sources of funding for investment in, and provision of, public transport NOK (billions)
Funding for the provision of public transport
Block grant and county tax 12.2
Income from tickets sale 7.2
Income from toll roads (only in the Oslo urban area) 0.8
Funding for investment in public transport
Income from toll roads 1.4
Urban Environment Agreements Reward Scheme 1.7
Total 23.3
Total spending on public transport in Norway was 20 billion NOK in 2016. This includes investment and operating costs, and covers both urban and regional public transport, except transport by rail. The block grant and county tax account for around 12.2 billion NOK, of which around 3.5 billion NOK was spent in the nine largest urban areas. The income from the sale of tickets was 7.2 billion NOK and, on top of this, in the urban area of Oslo/Akershus, 0.8 billion NOK was raised from the income from toll roads. In addition, a total of 3.1 billion NOK was spent on public transport infrastructure nationally. Of this 1.4 billion NOK was generated by income from toll roads, and 1.7 billion NOK came from the Urban Environment Agreements Reward Scheme.
Norway
Network coherence and service integrationThe network and system are planned as a whole, even though many diff erent transport companies actually operate the service in one area, under contract to the local transport authority. Buses connect into tram routes which connect into metro and rail routes, and there are timetabled connections between low frequency services, even of diff erent modes. Information about fares and routes is provided through a common website, administered by the regional transport provider, and the livery and design of vehicles and information material is consistent so that travellers only encounter the corporate image of one body, the regional transport authority, unrelated to the transport operator that is running a particular service. The overall approach is one of providing an integrated network with a unifi ed image, information and ticketing.
GOVERNANCE STRUCTURES AND LEGISLATION, AND HOW THESE HAVE CHANGED
Norway has three diff erent levels of government: municipalities, counties and the national government, a system that has remained broadly unchanged for many decades. There are elected assemblies at all three levels. Counties and municipalities provide the majority of public services.
Counties are the key actors in terms of local and regional public transport. They are the primary providers of public transport, responsible for scheduled local public transport (bus, tram, metro, boat), and in addition for granting permission to operators to provide passenger and cargo transportation. They also provide school transport (although part of the cost comes from municipalities) and for public transport services for disabled people. They are in addition responsible for land use planning at regional level, and for “county roads,” including transport hubs and road infrastructure connected to public transport (Nilsen, 2014).
National Government is responsible for the overall transport policy, funding of counties as well as the national rail. Municipalities are responsible for land use planning.
The funding of scheduled local public transport provided by the counties comes from fi ve main sources (Nilsen, 2014):
• County tax.
• Block grant from the Ministry of Municipalities and Regions.
• Urban environment agreements Reward Scheme.
• Income from toll roads.
• Income from ticket sales.
Figure 3.4 illustrates how transport decision making and funding works in Norway. (Source: Norheim et al., 2016)
Table 3.7 Overall funding of investment and provision of public transport in Norway in 2016. Source: Norheim et al., 2016.
3.5
Urban environment agreements
Reward Scheme
Others
Taxes
Block Grant
Ticket sales
The Government
Counties
Transport company
Tarrif compensation
Road ownersPublic Roads Admin
CountiesMunicipality
These factors are crucial for costs and need for public grants
Municipalitiesland use Parking
Population growth
Railway
OperatorsTransport company
Road ownersPublic Roads Admin
CountiesThese factors are crucial for costs and need for public grants
Municipalitiesland use Parking
Population growth
Railway
Operators
Traffi c basis
Purchase
Ro
ad in
fras
tru
ctu
re
The Scandinavian Way to Better Public Transport38 39
Including the toll road income as revenue makes the annual operating subsidy for bus, tram and metro around 4.2 billion NOK. According to the Norwegian National Travel survey, 7.4% of all trips are made by these modes, totalling around 420 million trips per year across the country. The public funding per trip is therefore about 10 NOK (around 95 pence). The annual public funding per head of population is 825 NOK (around £76).
Planning and legal framework The National Transport Plan (Nasjonal transportplan) is published every fourth year, and describes the national government’s prioritised projects for the coming 10 years. The current National Transport Plan was adopted in 2013, and relates to the period of 2014-2023. The next plan will be adopted in 2017, covering the period of 2018-2029 (Transportetatene 2016).
Each county is, according to the law on planning and building (Lovdata 2016c), responsible for the development of a regional land use and transportation plan (Regional areal transport plan) every fourth year. These plans should provide the link between land use planning and transport planning, and are believed to lead to more sustainable land use in urban areas. Each land use and transportation plan should be preceded by a land use and transportation plan strategy, which states the overall goals of the plan and secures a more coherent process.
The municipalities present their land use plans (Kommuneplanens arealdel) every fourth year, according to the law on planning and building (Lovdata 2016c). The municipalities are the authority when it comes to land use, a principle that is strongly valued, and their competence when it comes to these issues is strong. The municipal land use plan covers the whole area of the municipality, and defines the possibilities and restrictions upon use. In addition, the municipalities also produce detailed plans for the use of an area (Reguleringsplaner).
All schemes with a value of more than 750 million NOK are subject to ‘choice of concept’ appraisal which uses a multi-criteria analysis of the options. The resulting report presents a multi-criteria analysis of possible solutions to an investment, and on this basis recommends the best option. This process is carried out before the investment plans at the municipal level are developed (Norwegian Road Authority, 2013).
• Law on the carriage of motor vehicles and vessels.
• Regulations on occupational domestic travel by motor vehicle or vessel.
• Regulations on tendering in local bus transport.
• Regulations on international passenger and goods transport, and cabotage.
• Regulations on transport by ferry.
Through the EEA-agreement between Norway and the European Union, the tendering of public transport is subject to the regulation EC 1073/2009, on common rules for access to the international market for coach and bus services. The Ministry of Transport has also issued a set of conditions further regulating the provision of public transport in Norway (Samferdselsedepartementet 2004).
Whilst public transport is not generally politically controversial there have been some debates at the local level about different approaches that have been taken to franchising. This can arise from resistance to change by incumbents. This is evident in the county of Telemark (Solli et al., 2015), for example, where municipalities initially worked together to procure public transport through a jointly-owned municipal company, but then one municipality dropped out because of disagreements about the level of operator flexibility that there should be in contracts – which led to a breakdown in trust between the bodies involved. Overall, though, such controversies are rare and do not surface greatly in the public arena. The overall view of public transport as a public service and a tool for managing mobility and accessibility, to be delivered efficiently but not at zero cost to the public purse, is one that is shared across political and geographical boundaries within the country.
OPERATORS – NUMBERS AND PROFITABILITY
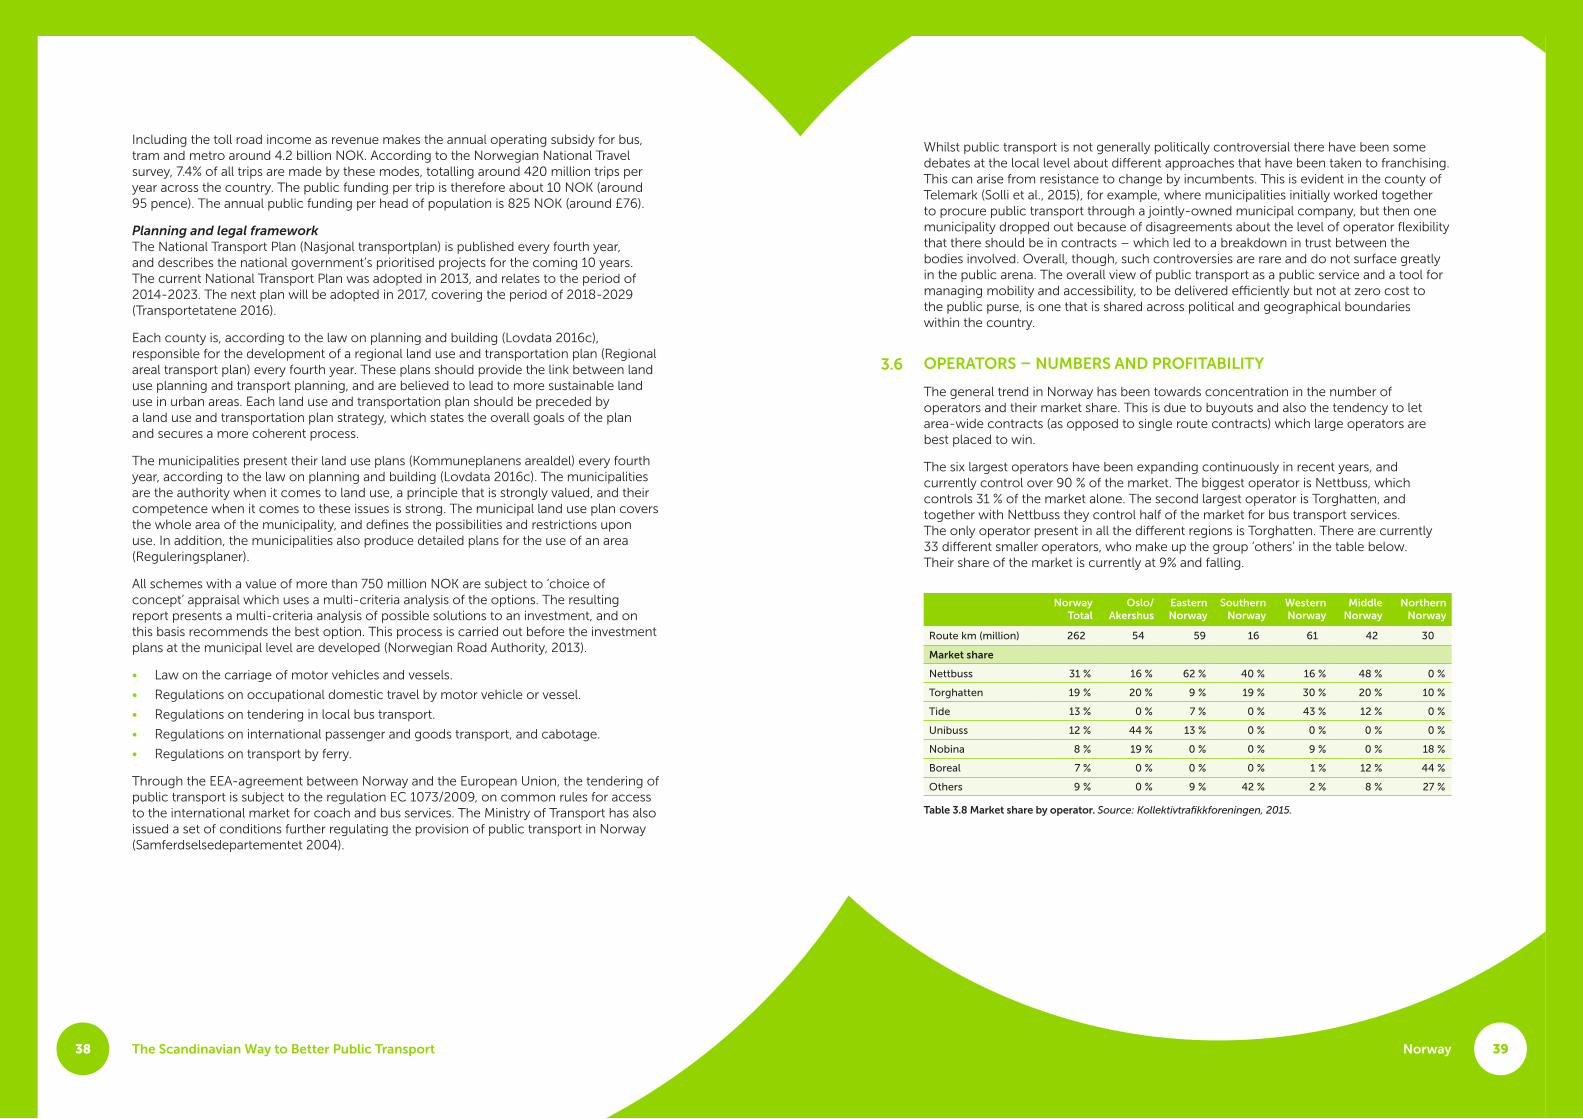
The general trend in Norway has been towards concentration in the number of operators and their market share. This is due to buyouts and also the tendency to let area-wide contracts (as opposed to single route contracts) which large operators are best placed to win.
The six largest operators have been expanding continuously in recent years, and currently control over 90 % of the market. The biggest operator is Nettbuss, which controls 31 % of the market alone. The second largest operator is Torghatten, and together with Nettbuss they control half of the market for bus transport services. The only operator present in all the different regions is Torghatten. There are currently 33 different smaller operators, who make up the group ‘others’ in the table below. Their share of the market is currently at 9% and falling.
Norway Total
Oslo/ Akershus
Eastern Norway
Southern Norway
Western Norway
Middle Norway
Northern Norway
Route km (million) 262 54 59 16 61 42 30
Market share
Nettbuss 31 % 16 % 62 % 40 % 16 % 48 % 0 %
Torghatten 19 % 20 % 9 % 19 % 30 % 20 % 10 %
Tide 13 % 0 % 7 % 0 % 43 % 12 % 0 %
Unibuss 12 % 44 % 13 % 0 % 0 % 0 % 0 %
Nobina 8 % 19 % 0 % 0 % 9 % 0 % 18 %
Boreal 7 % 0 % 0 % 0 % 1 % 12 % 44 %
Others 9 % 0 % 9 % 42 % 2 % 8 % 27 %
Table 3.8 Market share by operator. Source: Kollektivtrafikkforeningen, 2015.
Norway
3.6
The Scandinavian Way to Better Public Transport40 41
APPROACHES TO FRANCHISING IN NORWAY
As noted above, competitive tendering was introduced in Norway in order to be able to continue to provide and improve bus based public transport whilst obtaining efficiencies. The idea spread from Sweden during the 1990s. Prior to that, small local publicly-owned monopolies were the standard form of operation.
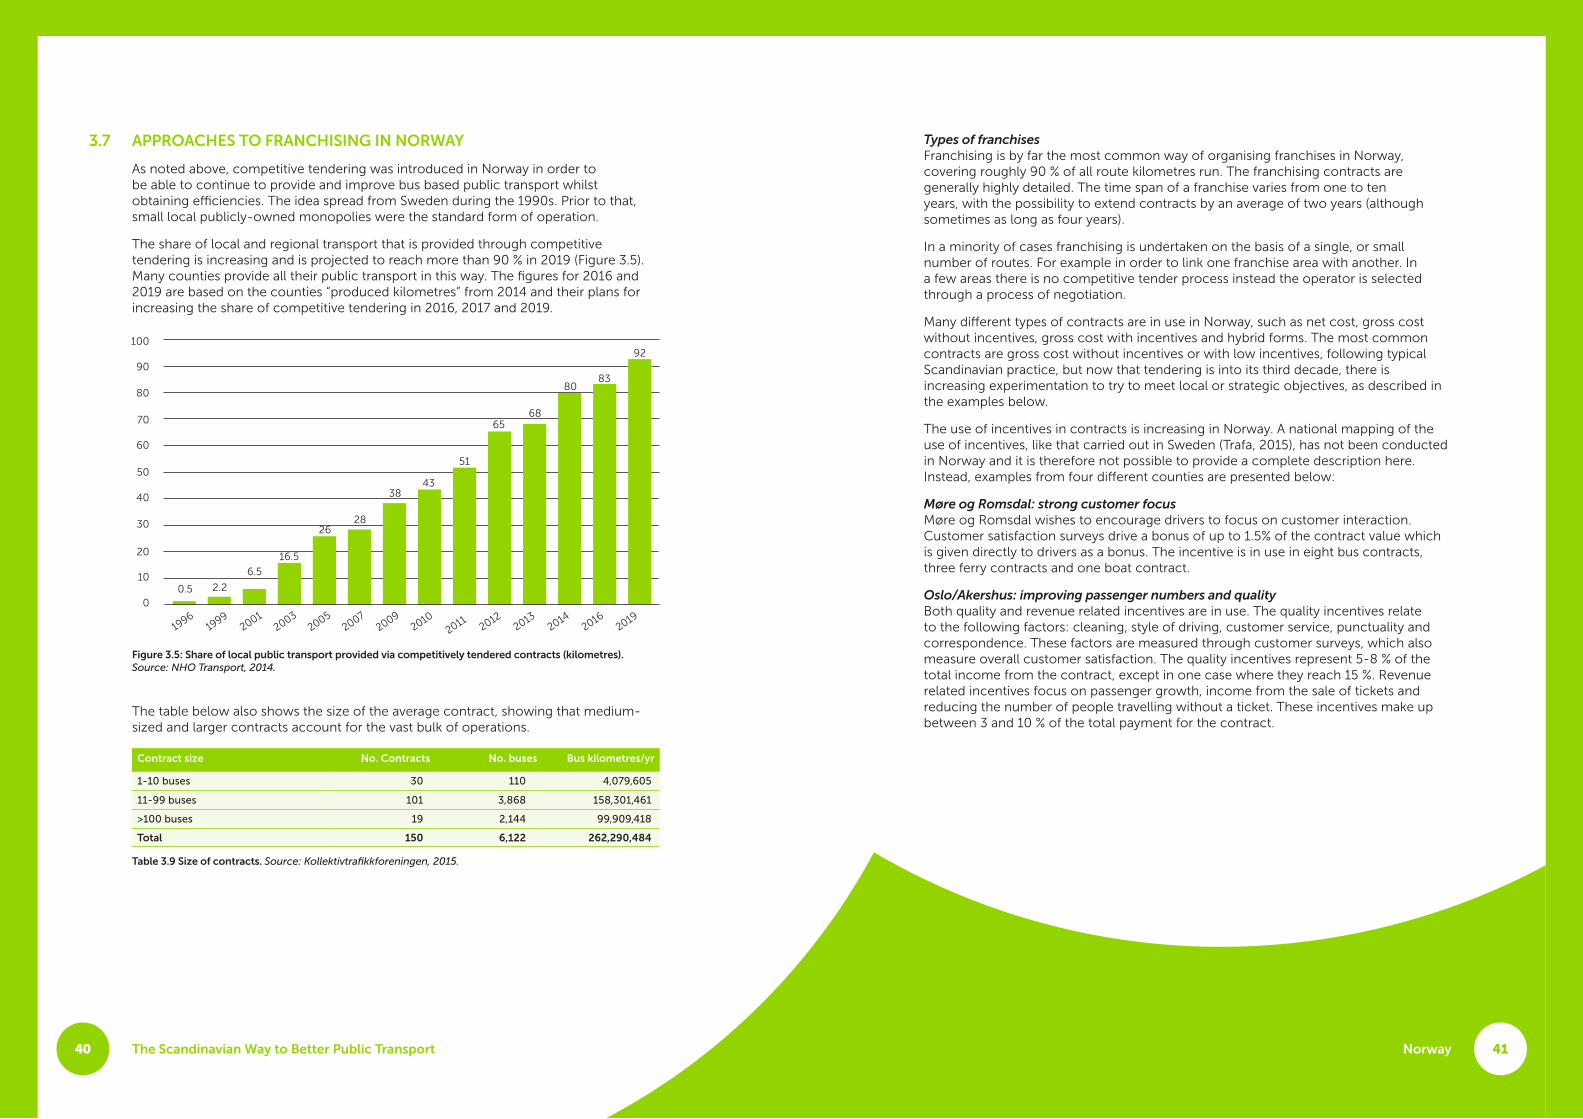
The share of local and regional transport that is provided through competitive tendering is increasing and is projected to reach more than 90 % in 2019 (Figure 3.5). Many counties provide all their public transport in this way. The figures for 2016 and 2019 are based on the counties “produced kilometres” from 2014 and their plans for increasing the share of competitive tendering in 2016, 2017 and 2019.
The table below also shows the size of the average contract, showing that medium-sized and larger contracts account for the vast bulk of operations.
Types of franchisesFranchising is by far the most common way of organising franchises in Norway, covering roughly 90 % of all route kilometres run. The franchising contracts are generally highly detailed. The time span of a franchise varies from one to ten years, with the possibility to extend contracts by an average of two years (although sometimes as long as four years).
In a minority of cases franchising is undertaken on the basis of a single, or small number of routes. For example in order to link one franchise area with another. In a few areas there is no competitive tender process instead the operator is selected through a process of negotiation.
Many different types of contracts are in use in Norway, such as net cost, gross cost without incentives, gross cost with incentives and hybrid forms. The most common contracts are gross cost without incentives or with low incentives, following typical Scandinavian practice, but now that tendering is into its third decade, there is increasing experimentation to try to meet local or strategic objectives, as described in the examples below.
The use of incentives in contracts is increasing in Norway. A national mapping of the use of incentives, like that carried out in Sweden (Trafa, 2015), has not been conducted in Norway and it is therefore not possible to provide a complete description here. Instead, examples from four different counties are presented below:
Møre og Romsdal: strong customer focusMøre og Romsdal wishes to encourage drivers to focus on customer interaction. Customer satisfaction surveys drive a bonus of up to 1.5% of the contract value which is given directly to drivers as a bonus. The incentive is in use in eight bus contracts, three ferry contracts and one boat contract.
Oslo/Akershus: improving passenger numbers and qualityBoth quality and revenue related incentives are in use. The quality incentives relate to the following factors: cleaning, style of driving, customer service, punctuality and correspondence. These factors are measured through customer surveys, which also measure overall customer satisfaction. The quality incentives represent 5-8 % of the total income from the contract, except in one case where they reach 15 %. Revenue related incentives focus on passenger growth, income from the sale of tickets and reducing the number of people travelling without a ticket. These incentives make up between 3 and 10 % of the total payment for the contract.
Norway
Contract size No. Contracts No. buses Bus kilometres/yr
1-10 buses 30 110 4,079,605
11-99 buses 101 3,868 158,301,461
>100 buses 19 2,144 99,909,418
Total 150 6,122 262,290,484
Table 3.9 Size of contracts. Source: Kollektivtrafikkforeningen, 2015.
Figure 3.5: Share of local public transport provided via competitively tendered contracts (kilometres). Source: NHO Transport, 2014.
60
70
80
90
100
0.5 2.2
6.5
16.5
2628
3843
51
6568
8083
92
50
40
30
20
10
0
1996
1999
20012003
20052007
20092010
2011 20122013
20142016
2019
3.7
The Scandinavian Way to Better Public Transport42 43
Vestfold: driving higher public transport use Here the key incentives aim to increase verified passenger numbers and revenue, and also to encourage operators to change to fossil fuel free buses. In the period of 2014-2016 the public transport provider gave an incentive of 2.5 NOK per verified passenger. In addition, since 2016 a further incentive has been introduced aimed at increasing the use of biogas.
Telemark: net cost, with operator incentivesIn the Grenland urban area, a new contract has just been awarded covering 45 million bus kilometres per year, 50 % of which must be biogas based. The county sets the overall framework for the service provided, but the operator retains the revenue. However, the contract further specifies that the operator must implement measures, including marketing, to increase the use of public transport, by setting aside 1 NOK per registered passenger. These funds are to be used for marketing activities, and cannot be used for bonuses or salaries for employees. In addition, the operator gets an incentive of 20 NOK for each passenger carried above the 2015 level of 3.8 million passengers. Any decrease in the number of journeys will not require the operator to repay incentives, but they will not receive any further incentives before the previous level has been attained once more.
THE CITY/REGION CASE STUDY: OSLO REGION
Oslo/Akershus has been chosen as the case study for this report because, with 1.22 million inhabitants, it is the only metropolitan region in Norway approaching in size those of the UTG members. The organisation of public transport services in the region is the responsibility of “Ruter” (‘The Lines’) which is a collaboration between the two local authorities.
Public transport provisionThe Ruter area consists of Norway’s capital Oslo and the more suburban Akershus municipality. Oslo has about 650,000 inhabitants and Akershus 570,000. In 2014, 1.4 billion journeys were made in Oslo and Akershus (all modes combined). The area accounts for 55% of all trips by public transport in Norway, and this is in part due to the extensive offer: city and regional buses, metro (T-banen), tram and the passenger ferry. Train services are not operated by Ruter but Ruter tickets are valid on regional rail.
Economic and population growth is leading to growing traffic congestion which Ruter aims to address. To do this it designs and provides an easy to use network, which as far as possible provides turn up and go frequencies and a user friendly service.
There is strong branding across all promotional materials as well as on vehicles. There is a hierarchy of modes, with the highest capacity modes providing high frequencies, and lower capacity modes feeding into these, avoiding duplication of modes on the same corridor. Services, including regional trains, run at stable 5 to 10 minutes intervals on major corridors and in dense urban areas, while regional bus and ferry services should run at least once an hour. However, these general principles are adapted to local conditions in terms of population density and the geography of settlements. A further planning principle aims to achieve a better environmental footprint for public transport than for the car (which requires at least 5 passengers per bus).
In terms of information, Ruter provides real time information at stops and stations, and via an app. Fares are based on distance travelled (the number of fare zones crossed). They can be bought at a wide range of outlets including via an app, on board vehicles, at kiosks and service points, and at ticket machines. Single trip, daily, weekly, monthly and annual tickets are available as is a stored value smartcard. Tickets are valid on all modes of transport, including trains (except the express train to the airport). The level of service is rated highly: 97% of passengers were satisfied with their journey in 2014. Bikes can also be taken on Metro and train services outside of the rush hour.
Norway
Region Patronage Incentives Vehicle Incentives
Møre og Romsdal 1.5 % of tickets sale Income from the incentives is to be used to give bonuses to the drivers
Oslo/Akershus 5 to 8 % quality incentives and 3 to 10 % income incentives, of total income
Additional pilot projects with even larger incentives are carried out
Vestfold 2.5 NOK per verified passenger Additional incentives to boost the use of biogas
Telemark 20 NOK per verified passenger above 2015 level
The operator must use 1 NOK per passenger on marketing, and this cannot be used to give bonuses to employees
Table 3.10 Summary of incentives in four counties. Source: Kollektivtrafikkforeningen, 2015.
3.8

The Scandinavian Way to Better Public Transport44 45
Levels of detail in the franchise specifi cation
Ruter is responsible for network design, service planning and marketing, as well as infrastructure investment. Operators are responsible for service operation as well as for providing their own vehicles and depots. The type of contracting depends on the type of service:
• Ferry and bus services are competitively tendered.
• Local rail, metro and tram services are negotiated contracts (rail services with the state and national rail operator and metro and tram services with the municipal operator).
Competitive tendering was introduced on Norwegian railways in January 2017 in order to improve effi ciency and comply with EU law, but there was no data available at the time of writing this report on the impacts of this in the Ruter area.
Traditionally contracts are specifi ed with a considerable level of detail such that operators have limited opportunities to come up with solutions or options other than those specifi ed. In a typical contract, the following aspects are specifi ed:
• The specifi c responsibility of the operator, for example timetable information, monitoring, ticketing equipment.
• The minimum features and quality of the buses (owned by the operators) and other vehicles. Here factors such as fuel type, accessibility, number of doors, number of seats and so on are specifi ed.
• Routes (including stops, timetable and fi rst/last rides).
The use of competitive tendering is no longer a matter for debate; it has led to effi ciency gains and is seen as the only sensible way to proceed. The best way to conduct tendering and contracting is, however, still a matter of discussion and improvement, in particular in view of the challenges facing the city, such as its expected growth in the years to come; and also the perennial question of the level of freedom/fl exibility the operator should have in making decisions about the service it provides.
Ruter currently has 24 bus contracts and 4 ferry contracts, plus a number of special transport contracts. Standard bus contracts vary in size (5-140 buses) and were normally valid for 10 years, but are now more usually for a shorter period with an extension option (such as six years plus a potential three year extension). Five major operators currently operate in the Ruter area, all of them based in Scandinavia.
More than half (54%) of rail-based traffi c runs on renewable energy. In addition to this, 44% of buses in the Ruter area are hybrid, CNG, or run on biodiesel. Additionally, Ruter is investing in electric buses with batteries that will be charged at the depot and at specifi c stops along the route, but this is still at the developmental stage.
Performance regimes and review mechanisms Ruter is one of the PTAs in Norway with the greatest use of incentives in its bus contracting regime. It uses both bonuses and penalties, and it is planned that this will gradually increase from 2.5% of total operator reimbursement to 8%. Financial incentives are based on customer satisfaction levels. Each day travellers give feedback using the online Markedinformasjonssystemet (MIS) tool where they rate various aspects of customer service including the temperature in the vehicle, travel information, seat capacity and punctuality. At least 93% of the customers must be satisfi ed with their journey for the operator to get a bonus.
Costs in terms of subsidy per tripThe average cost per trip was 24 NOK with about 56% of these costs being met by subsidy. The total amount of absolute subsidy can be found in the table below. It increased by over 1 billion NOK (about 50%) from 2008 to 2014 as Ruter has improved its services but at the same time kept fares increases level with infl ation.
2014 2013 2012 2011 2010 2009 2008
Transport revenues (in millions)
3358 3176 3037 3061 2998 2899 2920
Subsidy (in millions) 3123 2987 2838 2693 2518 2377 2011
Expenditure (millions)
6654 6390 6029 5847 5614 5371 5013
Table 3.11 Revenue, subsidies and expenditure in Ruter.
Norway
Figure 3.6 Example of detailed design guidelines. Source: Ruter, 2014b

The Scandinavian Way to Better Public Transport46 47
Share of trips using public transport in total trips As Figure 3.7 shows public transport’s share of trips in the region is high and growing. In 2014 public transport had 23% of all trips (car, walking, bike or public transport) and 32% of motorised trips (up from 27% in 2008).
CONCLUSIONS ON NORWAY
There has been a history of support for public transport as a key public service. In the last ten years this has been enhanced by the political importance attached to the provision of high quality public transport as a means of reducing emissions, supporting growing urban economies and spreading the benefits of growth. This has led to increased funding for better services which in turn has resulted in passenger growth and higher mode share in the larger cities. Passengers now experience an integrated public transport system in each region, with good value, multi-modal zonal ticketing and high frequency services provided by modern low or zero emission vehicles.
The provision of better services, with fares increases held to the level of inflation, has led to higher levels of public support. But rising costs have been kept in check through the use of competitive tendering. With more than twenty years of experience of tendering Norwegian public authorities are developing and testing many sophisticated types of contract which aim to balance the benefits of a planned service with the benefits of giving operators the flexibility to respond to customer needs.
Norway
Figure 3.7 Public transport’s share of all motorised trips in the Ruter area. Source: Ruter, 2014a, p. 14
2008 2014
30%
35%
40%
45%
50%
27%
32%
41%
44%
15%
21%
14%
24%
19%
27%
16%
19%
11%12%
Ruter Oslo Akershurs West area Folio Nédro Romerike
Øvre Romerike
25%
20%
15%
10%
5%
0%
3.9

The Scandinavian Way to Better Public Transport
Most Swedish urban areas were built since WW2, to very modernist principles, with quite strict segregation of cyclists, pedestrians and motor vehicle traffic. In Stockholm in particular, public transport has been a key aspect of urban development, with high densities focused at underground stations, but even in smaller cities it is not uncommon to find small lengths of bus only road within areas developed in the 60s, 70s and 80s that give buses preferential access to these areas. For short distance trips within urban areas, travel distances by car can be considerably longer than by bike or public transport due to these segregated facilities for the sustainable modes. Nonetheless, there has been considerable urban road building, particularly in the suburbs of the major cities, and this continues with the current construction of a further bypass of Stockholm.
There is a higher level of environmental awareness in Sweden than in many other countries, which has translated to a consensus amongst almost all political parties that carbon dioxide emissions must be reduced – in fact the target is for Sweden to become a zero emitter of greenhouse gases by 2050. Public transport is seen as an important contributor to this goal. Partly for this reason, a target to double public transport ridership by 2020 and to double its mode share as soon as possible thereafter, originally developed by the broadly defined public transport industry, has become near enough government policy and has been adopted by almost all regional public transport authorities. It is not however clear that the cost implications of pursuing this goal have been fully considered by the regional authorities whose taxes are used to subsidise local and regional public transport, but whose other main funding responsibility is the healthcare system.
Sweden48 49
SWEDEN
GEOGRAPHIC CONTEXT
Sweden is a large and sparsely populated country of 447,000 square kilometres (compared to 244,000 square kilometres for the UK) and a population of 9.8 million people. The vast majority of the population live in the south of the country and 26% of the population lives in rural areas (compared to 14% in the UK).
On an index of purchasing power parity adjusted GDP, where the EEA average is 100, Sweden sits at 124, compared to the UK’s 108 (2014). It has a Gini coefficient (measuring income equality) of 25.2 compared to the UK’s less equal 32.4. Car ownership at 500 per 1000 people in 2014 is a little higher than the UK’s 468.
In December 2016 one British Pound (GBP) was exchanged for eleven Swedish kroner (SEK).
OVERALL APPROACH TO TRANSPORT, MOBILITY AND PUBLIC TRANSPORT
There is political consensus around public transport’s role as both an essential public service and a key driver of economic growth. All parties are also committed to combating climate change and see public transport as key to this. Significant differences emerge only in views regarding the level of operator involvement and autonomy that there should be in providing services; more conservative parties want to see a greater role for the operator. There was some debate in the late 2000s as to whether or not to deregulate the bus industry in order to stimulate a greater degree of customer focus and better service quality. In the event, the Green Paper that proposed this was ultimately transformed into a new law that allows private operators to register deregulated services to fill gaps in the network left after public tendering authorities have secured what they see as the necessary level of service.
1. City of Copenhagen (2015): København. Cyklernes By. Cykelregnskabet 2014.
4.1
4.2
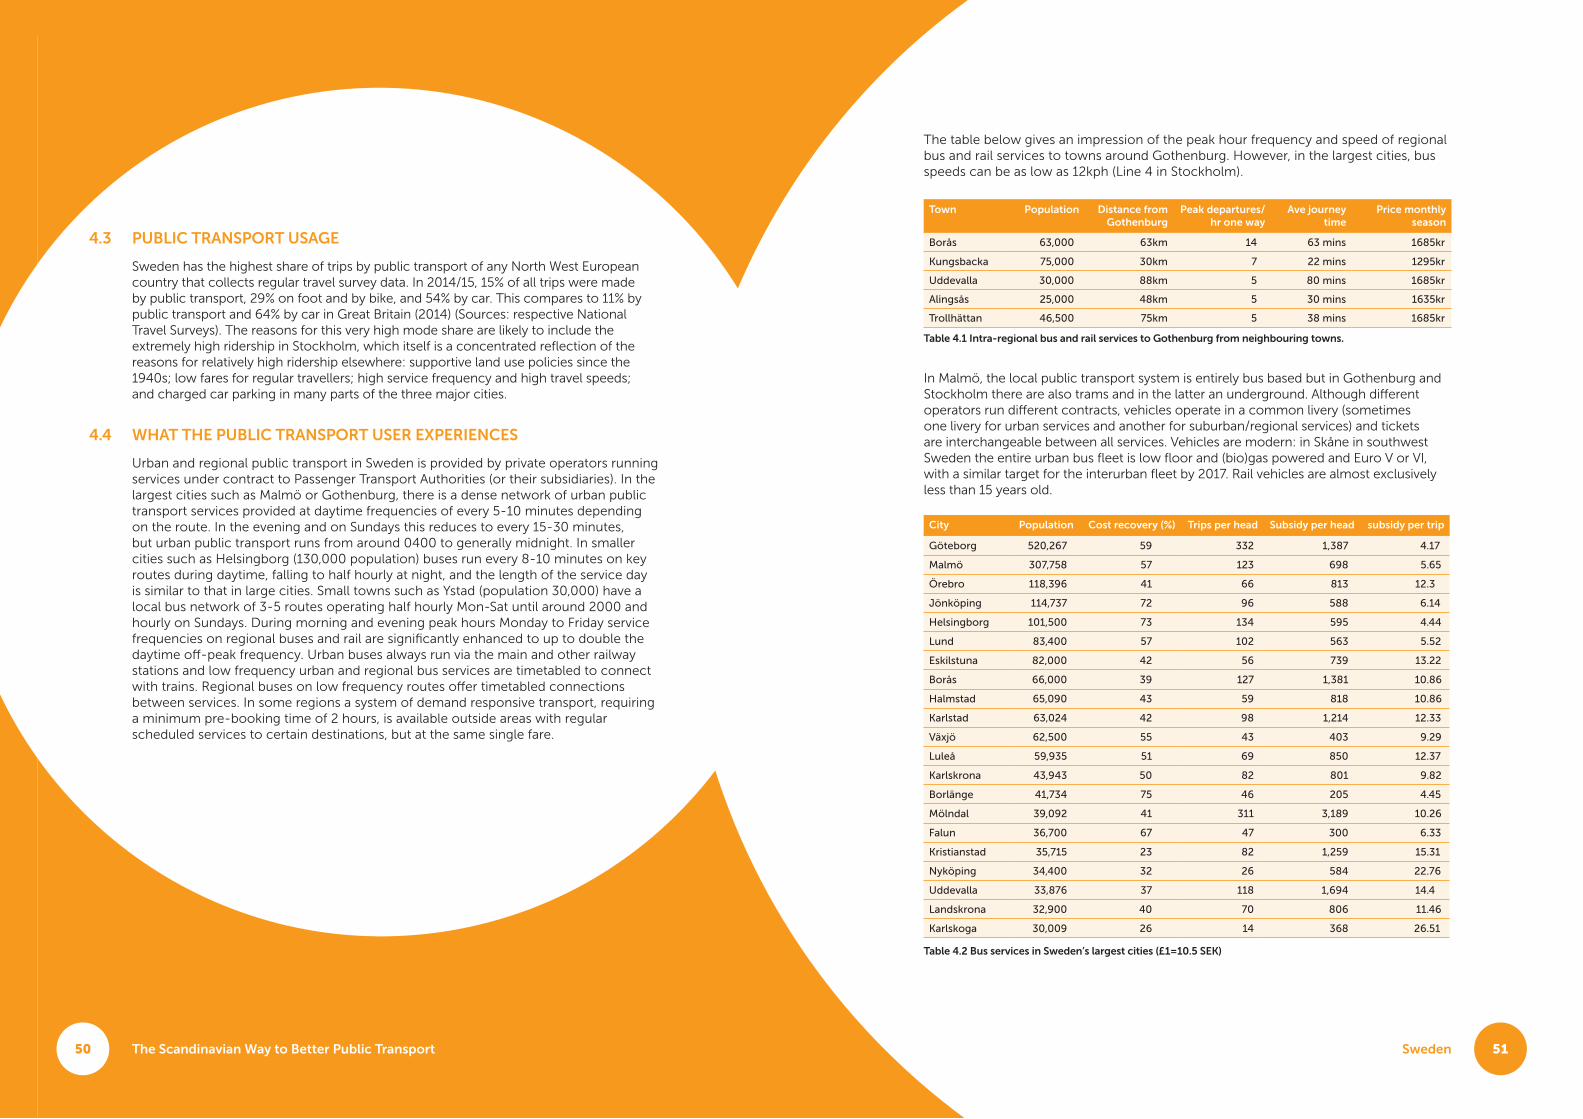
The Scandinavian Way to Better Public Transport50 51
The table below gives an impression of the peak hour frequency and speed of regional bus and rail services to towns around Gothenburg. However, in the largest cities, bus speeds can be as low as 12kph (Line 4 in Stockholm).
In Malmö, the local public transport system is entirely bus based but in Gothenburg and Stockholm there are also trams and in the latter an underground. Although different operators run different contracts, vehicles operate in a common livery (sometimes one livery for urban services and another for suburban/regional services) and tickets are interchangeable between all services. Vehicles are modern: in Skåne in southwest Sweden the entire urban bus fleet is low floor and (bio)gas powered and Euro V or VI, with a similar target for the interurban fleet by 2017. Rail vehicles are almost exclusively less than 15 years old.
Table 4.2 Bus services in Sweden’s largest cities (£1=10.5 SEK)
City Population Cost recovery (%) Trips per head Subsidy per head subsidy per trip
Göteborg 520,267 59 332 1,387 4.17
Malmö 307,758 57 123 698 5.65
Örebro 118,396 41 66 813 12.3
Jönköping 114,737 72 96 588 6.14
Helsingborg 101,500 73 134 595 4.44
Lund 83,400 57 102 563 5.52
Eskilstuna 82,000 42 56 739 13.22
Borås 66,000 39 127 1,381 10.86
Halmstad 65,090 43 59 818 10.86
Karlstad 63,024 42 98 1,214 12.33
Växjö 62,500 55 43 403 9.29
Luleå 59,935 51 69 850 12.37
Karlskrona 43,943 50 82 801 9.82
Borlänge 41,734 75 46 205 4.45
Mölndal 39,092 41 311 3,189 10.26
Falun 36,700 67 47 300 6.33
Kristianstad 35,715 23 82 1,259 15.31
Nyköping 34,400 32 26 584 22.76
Uddevalla 33,876 37 118 1,694 14.4
Landskrona 32,900 40 70 806 11.46
Karlskoga 30,009 26 14 368 26.51
Sweden
Table 4.1 Intra-regional bus and rail services to Gothenburg from neighbouring towns.
Town Population Distance from Gothenburg
Peak departures/hr one way
Ave journey time
Price monthly season
Borås 63,000 63km 14 63 mins 1685kr
Kungsbacka 75,000 30km 7 22 mins 1295kr
Uddevalla 30,000 88km 5 80 mins 1685kr
Alingsås 25,000 48km 5 30 mins 1635kr
Trollhättan 46,500 75km 5 38 mins 1685kr
PUBLIC TRANSPORT USAGE
Sweden has the highest share of trips by public transport of any North West European country that collects regular travel survey data. In 2014/15, 15% of all trips were made by public transport, 29% on foot and by bike, and 54% by car. This compares to 11% by public transport and 64% by car in Great Britain (2014) (Sources: respective National Travel Surveys). The reasons for this very high mode share are likely to include the extremely high ridership in Stockholm, which itself is a concentrated reflection of the reasons for relatively high ridership elsewhere: supportive land use policies since the 1940s; low fares for regular travellers; high service frequency and high travel speeds; and charged car parking in many parts of the three major cities.
WHAT THE PUBLIC TRANSPORT USER EXPERIENCES
Urban and regional public transport in Sweden is provided by private operators running services under contract to Passenger Transport Authorities (or their subsidiaries). In the largest cities such as Malmö or Gothenburg, there is a dense network of urban public transport services provided at daytime frequencies of every 5-10 minutes depending on the route. In the evening and on Sundays this reduces to every 15-30 minutes, but urban public transport runs from around 0400 to generally midnight. In smaller cities such as Helsingborg (130,000 population) buses run every 8-10 minutes on key routes during daytime, falling to half hourly at night, and the length of the service day is similar to that in large cities. Small towns such as Ystad (population 30,000) have a local bus network of 3-5 routes operating half hourly Mon-Sat until around 2000 and hourly on Sundays. During morning and evening peak hours Monday to Friday service frequencies on regional buses and rail are significantly enhanced to up to double the daytime off-peak frequency. Urban buses always run via the main and other railway stations and low frequency urban and regional bus services are timetabled to connect with trains. Regional buses on low frequency routes offer timetabled connections between services. In some regions a system of demand responsive transport, requiring a minimum pre-booking time of 2 hours, is available outside areas with regular scheduled services to certain destinations, but at the same single fare.
4.3
4.4

The Scandinavian Way to Better Public Transport
In larger urban areas, it is not generally possible to pay in cash for public transport services. Stored value or period tickets on contactless smartcards are the principal means of payment. Mobile ticketing is also common. Payment is made by the subscriber’s phone not via an app. Stored value smartcards can be topped up at machines at stations/bus stations. Season smartcards can be bought at sales outlets and online. Rail tickets can be bought by credit/debit card from machines, but generally at a price premium. Only a very few ticket machines still accept cash – however, in general Sweden has a very cashless economy, so this is not a peculiarity of the transport system.
As well as monthly season tickets which offer the best value for money (for example the monthly season ticket valid on all bus and tram services and the train services of 5 rail operators in West Gothia costs £150 per month for a region of 2 million people and 25,000 square km; the equivalent in Skåne costs £120 per month), singles and family singles (offering discounted travel for two adults and up to five children at less than the cost of two adult singles) are available. Due to predominantly gross cost contracts, revenue allocation is relatively straightforward but, given the universality of smart ticketing, even where operators earn a bonus based on passenger numbers, revenue allocation is relatively accurate.
A single ticket is purchased for travel from one zone to another and allows travel to anywhere in the final zone. For example, a ticket can be bought on an urban bus on the outskirts of Malmö (the city is a single zone) to Lund, some 18km distant (also a single zone), a total distance of 4 zones. It can then be used to travel on that urban bus to the nearest station or regional bus stop, for travel on the train or regional bus between Malmö and Lund, and then for onward travel by urban bus in Lund. The zonal system operated by Skånetrafiken in southwest Sweden also extends into the Copenhagen region, such that one ticket can be purchased on a bus in Lund or any other part of Skåne that is then valid for travel to and within the Copenhagen area.
GOVERNANCE OF LOCAL TRANSPORT IN SWEDEN
Levels of government In Sweden there are three levels of government: local, regional and national. All are responsible to elected politicians. Local and regional government levy an income tax on all their residents; national government levies VAT, excise duties and a supplementary income tax on the highest earners. Local municipalities have historically been strong and independent, and they retain very strong control of land use planning (making plans and granting planning permission). They run most local public services. Regional government runs the health service, public transport and has some limited economic development functions; in some regions, the regional government also tries to steer/influence local land use planning, but it has no statutory power to do so. National government owns the national road and rail network through its agency, Trafikverket; and in addition, it sets the regulatory framework for transport, and part funds large transport investments.
Subsidy for local and regional public transport is funded from local and regional income tax. There has been a trend in recent years for a greater proportion of this subsidy to be passed from the local to the regional level as the benefits of planning and delivering public transport at the regional level have become clearer.
52
In most regions there is a politically controlled body, the PTA, that sets the policy direction for local and regional public transport. It is a sub-body of the elected regional council and one politician in the government of the regional council gives it day to day direction, although major decisions are taken by the whole regional council. In most regions this body then owns an arm’s length public sector company that is responsible for the planning and franchising of urban and regional public transport, timetable and service planning, ticketing, and longer term planning of investments and improved services. For example, in the Gothenburg region the regional public transport authority is part of the regional council, Västra Götalands Region. The arm’s length company is called Västtrafik which procures services from private operators.
In some regions, some large municipalities retain control of the specification of their local public service. They pass less of their local income tax revenue up to the regional level and instead pay it directly to the public sector company mentioned above, which then delivers the local public transport services in the city. Alternatively, the municipality may own its own arm’s length company that plays this role, and an equivalent but separate regional public transport organisation plans and procures regional services. The city of Karlstad and the surrounding region of Värmland have adopted this model.
Rail provision Long distance national rail provision is not subsidised and is entirely open access. The incumbant national operator SJ is beginning to face competition, particularly on the Stockholm to Gothenburg route. In some areas, open access national operators accept regional public transport ticketing. In areas where subsidised regional rail services run relatively long distances it can be difficult for open access services to compete; this appears to be permitted in Swedish competition law, however.
As previously noted rail infrastructure is publicly owned by the national transport agency, Trafikverket, which is also responsible for granting access and train paths to open access operators (there is no equivalent of the UK’s Rail Regulator in Sweden).
The arm’s length companies that procure public transport services work together to provide interregional subsidised rail services – for example, the Öresund trains in south west Sweden run services through 7 regions, accept the tickets of all regional public transport organisations in the area, and offer through ticketing from, for example, Malmö on the west coast right through to Kalmar about 300km distant on the east coast of Sweden.
Rail contracts for regional trains seldom include rolling stock. These contracts generally cover maintenance and operation, and the authority owns or leases the rolling rail stock, so that there is no charge to the operator. Leasing contracts generally have a duration of 15 years, with an amortization of around 50%. The regional PTAs pay access charges to the Swedish Transport Authority based on the marginal costs of those services (which factors in the characteristics of the train and available capacity). Overall access charges are relatively low which helps promote competition and new entrants.
Rail depots are owned by the public sector and leased to operators (who are then also responsible for day to day maintenance of the buildings). However, operation and maintenance of the trains, which is paid for by the operators, generally includes indoor building maintenance. Total maintenance costs (Öresundståg, Skåne, 2014) for 75 coaches in 25 three coach units amounts to 330 million (M)SEK (260 MSEK technical maintenance, and 70 MSEK daily cleaning etc) per year, and roughly 10% of this could be attributed to depot renting costs.
Sweden
4.5
53

The Scandinavian Way to Better Public Transport54 55
Changes in public transport legislation over time Over 100 years ago, concession rights to operate local and regional public transport were introduced, reflecting the general view that public transport was a public service and that for this reason it was justifiable to permit regulated local monopolies. The county government made the authorisation and determined fares and timetables. In 1961, state subsidies were introduced to support unprofitable routes outside cities, and in 1974 strategic plans became mandatory in order to obtain national funding.
A 1978 public transport governance act shaped the organisational landscape up until 2012. Municipalities and regions were to share responsibility for local and regional public transport, although the precise structure of this sharing could vary from region to region. This governance change led to two main developments: firstly, a desire to improve public transport and increase its ridership for social, congestion management and environmental reasons; and, secondly, the idea of competitive tendering rather than public monopoly in the provision of bus and then later regional rail transport. As a result, from 1980 to 1984 supply increased by 20% and ridership by 30%, whilst cost coverage increased from 38% to 42%. Adding the effects of competitive tendering, cost reductions of 20% were common due to enhanced efficiency. By around 1990, 98% of all bus services were tendered. By the end of the nineties, cost coverage was on average 55%. A further impetus for efficiency gains was the Swedish financial crisis of 1992 which led to limits on public spending.
Smaller operators merged, and the number of publicly-owned operators decreased: from 40 in 1989 to 9 in 2004. However, after the year 2000, ridership stagnated (due partly to economic recovery and a consequent increase in car use). Quality, standards and the environment, together with heavy investments in regional rail, were characteristic of this period and helped to drive above-inflation increases in operating costs. Following the legal changes until 2012, new possibilities opened up for market initiatives by local and regional bus operators although in practice these have not been taken up since the publicly-procured public transport network is so extensive in most regions and profitable gaps in this network are very few.
Sweden
Buses are generally owned by the operator with the standards which vehicles must meet set by the authority. Contract duration and the depreciation time for a bus are often different. Contracts are generally 10 years but buses could be in operation for both longer and shorter periods according to service conditions. Contracts generally stipulate both a maximum and a highest mean age, which means that relatively new vehicles must be replaced during the contract period in order to meet both conditions. However the purpose of this is to meet public policy objectives related to vehicle quality, accessibility, emissions and fuel type.
In Stockholm the authority owns the depots and rents them to the winning contractor. In some counties there is a depot company and the winning company has to pay a rental fee and share facilities (possibly with competing companies). The latter is common when there is a decision to run on biogas, which then requires access to specialised and costly fuel infrastructure and pipelines which individual operators cannot afford to provide at their own depots. However, in mid-sized, smaller cities and regions the operator owns and operates their own depot.
Legislation on public transport Law on the regulation of public transport is made at the national level and the most recent new legislation was Prop. 2009/10:200, which was enacted in 2012. In its Green Paper stages, the proposal was that the new law should bring in full deregulation of at least local and regional bus services. This was due to dissatisfaction in some quarters about a lack of “customer focus” in the Swedish public transport market (although total passenger numbers rose strongly through the 2000s). In the event, the new law left the broad specification of local and regional public transport to the public sector through a basic structure of franchised services; private operators do however have the option to register a deregulated service, should they identify a gap in the publicly-provided network. There is no obligation on the public sector operation to permit such private operations to join any regional integrated ticketing scheme.
In addition, the new law placed new emphasis on the strategic level, as the regional public transport authority now has to produce a regular Regional Transport Supply Plan (RTSP). The RTSP was to be developed by the new legal organisation: the Regional Public Transport Authority [RKM-Regional KollektivTrafikMyndighet], the political organisation that (in most regions) owns the arm’s length body that does the contracting and planning of public transport services. In Skåne, in Southwest Sweden, for example, a branch of the regional council (with only two staff) is the Regional PTA and prepares the RTSP. The RTSP is then put into effect by Skånetrafiken, an arm’s length company owned by the region that contracts, plans and markets all public transport services in Skåne.
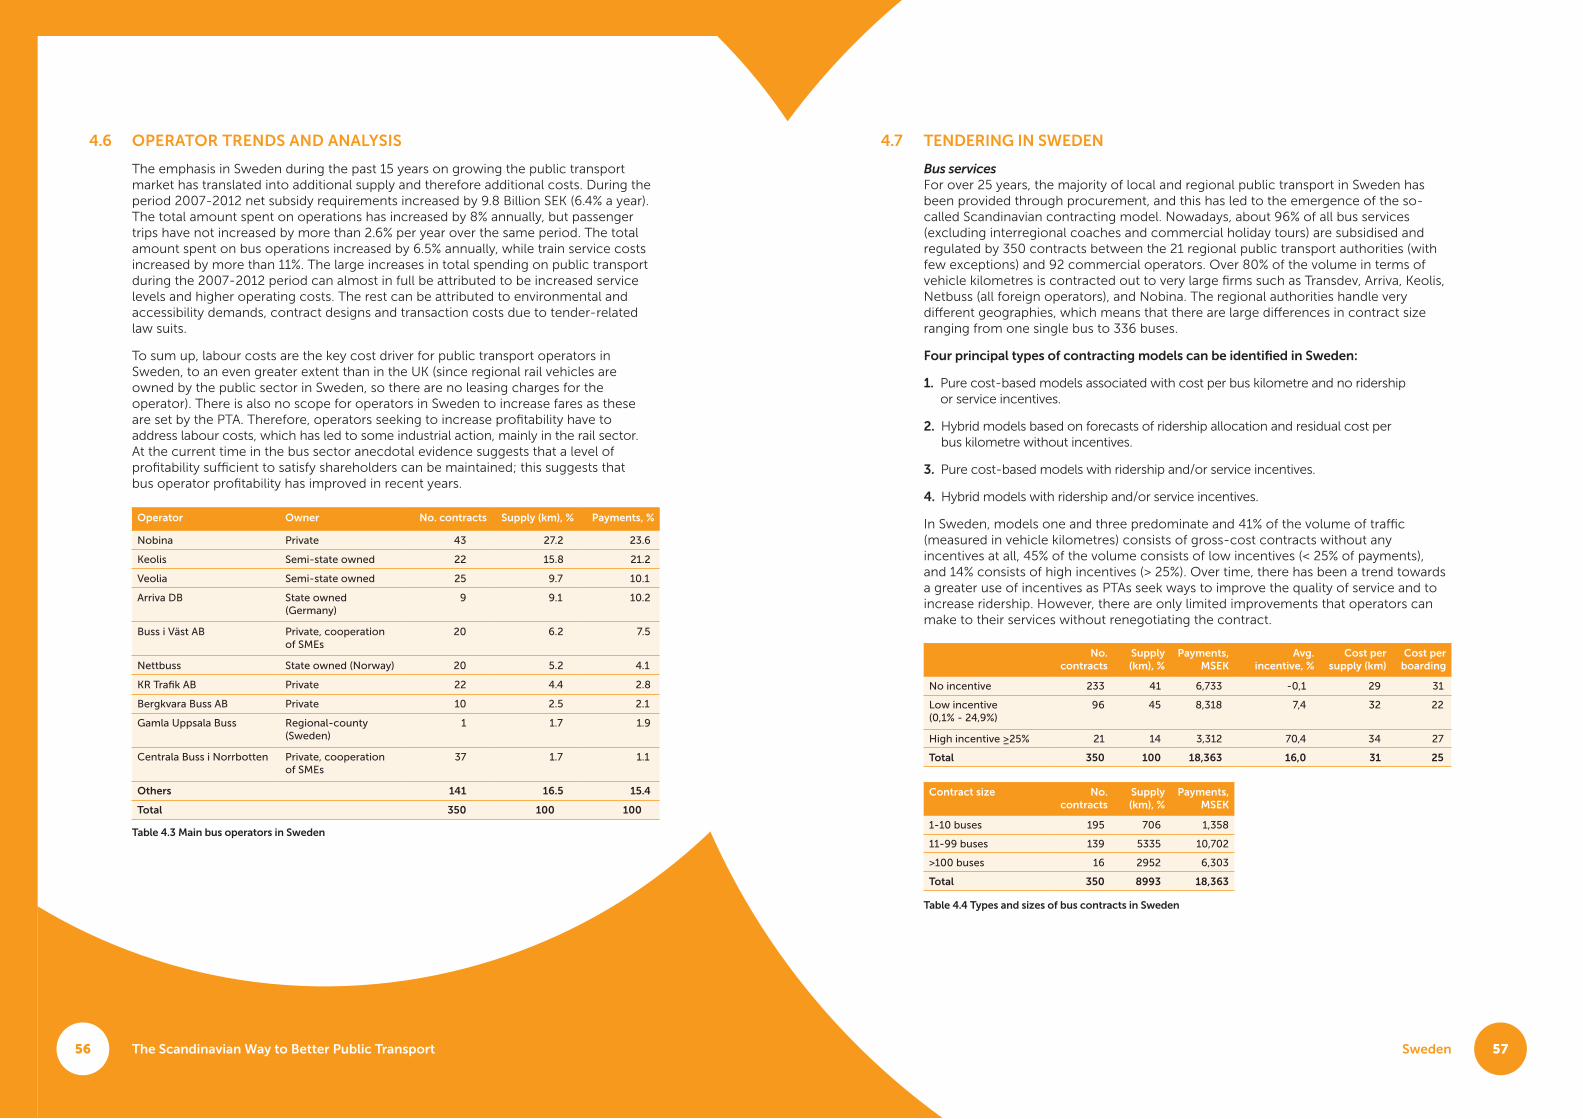
The Scandinavian Way to Better Public Transport56 Sweden
4.6 TENDERING IN SWEDEN
Bus services For over 25 years, the majority of local and regional public transport in Sweden has been provided through procurement, and this has led to the emergence of the so-called Scandinavian contracting model. Nowadays, about 96% of all bus services (excluding interregional coaches and commercial holiday tours) are subsidised and regulated by 350 contracts between the 21 regional public transport authorities (with few exceptions) and 92 commercial operators. Over 80% of the volume in terms of vehicle kilometres is contracted out to very large firms such as Transdev, Arriva, Keolis, Netbuss (all foreign operators), and Nobina. The regional authorities handle very different geographies, which means that there are large differences in contract size ranging from one single bus to 336 buses.
Four principal types of contracting models can be identified in Sweden:
1. Pure cost-based models associated with cost per bus kilometre and no ridership or service incentives.
2. Hybrid models based on forecasts of ridership allocation and residual cost per bus kilometre without incentives.
3. Pure cost-based models with ridership and/or service incentives.
4. Hybrid models with ridership and/or service incentives.
In Sweden, models one and three predominate and 41% of the volume of traffic (measured in vehicle kilometres) consists of gross-cost contracts without any incentives at all, 45% of the volume consists of low incentives (< 25% of payments), and 14% consists of high incentives (> 25%). Over time, there has been a trend towards a greater use of incentives as PTAs seek ways to improve the quality of service and to increase ridership. However, there are only limited improvements that operators can make to their services without renegotiating the contract.
4.7
Table 4.4 Types and sizes of bus contracts in Sweden
No. contracts
Supply (km), %
Payments, MSEK
Avg. incentive, %
Cost per supply (km)
Cost per boarding
No incentive 233 41 6,733 -0,1 29 31
Low incentive (0,1% - 24,9%)
96 45 8,318 7,4 32 22
High incentive ≥25% 21 14 3,312 70,4 34 27
Total 350 100 18,363 16,0 31 25
Contract size No. contracts
Supply (km), %
Payments, MSEK
1-10 buses 195 706 1,358
11-99 buses 139 5335 10,702
>100 buses 16 2952 6,303
Total 350 8993 18,363
57
OPERATOR TRENDS AND ANALYSIS
The emphasis in Sweden during the past 15 years on growing the public transport market has translated into additional supply and therefore additional costs. During the period 2007-2012 net subsidy requirements increased by 9.8 Billion SEK (6.4% a year). The total amount spent on operations has increased by 8% annually, but passenger trips have not increased by more than 2.6% per year over the same period. The total amount spent on bus operations increased by 6.5% annually, while train service costs increased by more than 11%. The large increases in total spending on public transport during the 2007-2012 period can almost in full be attributed to be increased service levels and higher operating costs. The rest can be attributed to environmental and accessibility demands, contract designs and transaction costs due to tender-related law suits.
To sum up, labour costs are the key cost driver for public transport operators in Sweden, to an even greater extent than in the UK (since regional rail vehicles are owned by the public sector in Sweden, so there are no leasing charges for the operator). There is also no scope for operators in Sweden to increase fares as these are set by the PTA. Therefore, operators seeking to increase profitability have to address labour costs, which has led to some industrial action, mainly in the rail sector. At the current time in the bus sector anecdotal evidence suggests that a level of profitability sufficient to satisfy shareholders can be maintained; this suggests that bus operator profitability has improved in recent years.
Operator Owner No. contracts Supply (km), % Payments, %
Nobina Private 43 27.2 23.6
Keolis Semi-state owned 22 15.8 21.2
Veolia Semi-state owned 25 9.7 10.1
Arriva DB State owned (Germany)
9 9.1 10.2
Buss i Väst AB Private, cooperation of SMEs
20 6.2 7.5
Nettbuss State owned (Norway) 20 5.2 4.1
KR Trafik AB Private 22 4.4 2.8
Bergkvara Buss AB Private 10 2.5 2.1
Gamla Uppsala Buss Regional-county (Sweden)
1 1.7 1.9
Centrala Buss i Norrbotten Private, cooperation of SMEs
37 1.7 1.1
Others 141 16.5 15.4
Total 350 100 100
Table 4.3 Main bus operators in Sweden

The Scandinavian Way to Better Public Transport58 59
In Sweden, only a few pure net cost contracts have been signed, but a few of the recent contracts have 100% incentive payments with some similarities to the simplified performance-linked payment (SPLP - Australia). Essentially, these contracts provide a basic level of operator remuneration related to km operated, and then as much finance again on the basis of a per passenger payment. As stated by Transport Analysis, the Swedish governmental agency for transport analysis and statistics, this kind of ‘super-incentive contract’ is new to Sweden and therefore little is known about its effects (Transport Analysis, 2015).
Performance of urban and regional bus services The tables below present some performance data, firstly by region for all bus services, and then for urban bus services in those cities with 100,000 or more population (excluding Stockholm as it is not possible to decouple bus and tram data). There are variations in subsidy per trip and per inhabitant which are difficult to explain without more detailed analysis.
Sweden
Table 4.5 contracted local and regional bus services, supply, cost and revenues, in selected regions
Inh
abit
ants
Bo
ard
ing
s
Veh
icle
km P
axkm Se
at
km Rev
enu
es(M
SEK
)
Eco
no
my
Co
sts
(MSE
K)
Sub
sid
y(S
EK
)
County (* 1000) (* 1000) (* 1000) (* 1000) /board /vkm /inhab
Stockholm 2,198,044 318,000 125,725 1,835,000 6,239,075 3,438,237 6,317,111 9 23 1,310
Västra Götaland
1,632,012 143,026 117,997 1,258,756 5,431,959 1,638,100 3,848,834 15 19 1,355
Skåne 1,288,908 114,030 73,655 814,176 3,167,165 1,379,055 2,778,213 12 19 1,086
Uppsala 348,942 30,000 30,000 300,000 1,530,000 463,927 1,107,753 21 21 1,845
Jönköping 344,262 17,975 18,070 168,922 825,704 271,851 524,308 14 14 733
Örebro 288,150 10,876 13,629 92,671 709,000 221,319 494,904 25 20 949
Sweden as a whole
9,747,355 775,198 602,269 6,778,680 26,777,636 9,956,339 21,228,413 15 19 1,156
Table 4.6 KPIs for selected city bus services
Inh
abit
ants
Bo
ard
ing
s
Veh
icle
km P
axkm Se
at
km Rev
enu
es(M
SEK
)
Eco
no
my
Co
sts
(MSE
K)
Tic
ket
inc.
/tr
ip, S
EK
Sub
sid
y(S
EK
)
Göteborg 520,267 59 332 1,387 4,17 3,366 48,02 6,02 3
Malmö 307,758 57 123 698 5,65 694 36,48 7,38 3
Uppsala 140,000 120 857 38,71 10
Örebro 118,396 41 66 813 12,3 638 41,27 8,53 20
Jönköping 114,737 72 96 588 6,14 961 37,71 15,15 10
Linköping 111,200 42 80 747 41,55 8,88 10
Helsingborg 101,500 73 134 595 4,44 762 35,68 11,84 6
Norrköping 94,058 46 75 779 50,10 8,56 10
Lund 83,400 57 102 563 5,52 587 35,27 7,20 10
CITY REGION CASE STUDY: SKANE
Skåne in southwest Sweden has been selected as the Swedish case study as it includes the third largest city in the country, Malmö, but as a polycentric region it also includes several rather smaller towns, and a large rural hinterland. There are 33 municipalities and 1.3 million inhabitants (the population density being 119 inh./km²). A unique feature of Skåne is its bridge/tunnel link from southwest Malmö to Copenhagen (and its airport) in Denmark.
Skåne was two regions until 1999, when they were merged for reasons of economies of scale. At this point the arms-length PTA Skånetrafiken was formed to put into practice an approach to public transport that had two main objectives: firstly, to reduce the environmental and congestion problems of car use through modal shift to public transport; and, secondly and just as importantly, to knit the new region together and spread economic development around the region by improving links between its more rural east, and its more urban west, where the majority of jobs are found.
The current targets for the public transport system maintain the approach that has been followed since 1999. They are:
• Number of trips to double by 2020, compared to baseline of 2006.
• Public transport’s market share of motorized trips to double and reach at least 40% by 2030.
• By 2020 eight in ten passengers to be “satisfied” or “very satisfied” in service quality surveys.
• At least 91.5% of the inhabitants to have access to at least 10 daily departures (on a workday) to at least one of the central growth centres (the cities of Malmö, Lund, Helsingborg and Hässleholm/Kristianstad).
• All stops with more than 15 boarding’s a day to be fully accessible by 2021.
• Public transport to be fossil-fuel free by 2020.
In order to achieve these targets public transport provision has been significantly increased. For example between 1999 and 2005 public transport service levels (measured by vehicle kilometres operated) have been progressively increased from 60 million kilometres a year in 1999 to 75 million kilometres in 2005 to 111 million kilometres a year in 2015.
4.8

61The Scandinavian Way to Better Public Transport60 Sweden
This was partly due to the transfer of regional rail services from the national operator to Skånetrafiken, but mainly due to new rail services and inter-regional express bus services. Costs have been partly controlled through competitive tendering but the shift from bus to rail and to higher quality bus services inevitably led to increased costs per kilometre. The Öresund link to Denmark (opened in 2000) helped to offset these costs through increased rail revenue, since a significantly higher fare per km is charged to passengers on this route than elsewhere in Skåne but the access charge is very low, and the bridge increased travel demand to Copenhagen airport in particular, for both staff and travellers.
A non-exhaustive list of some of the public transport investments made in Skåne since 2000 are as follows:
• Smartcard (“JoJo”) and zonal fare system allowing travel all over Skåne but also into neighbouring Denmark.
• £1 billion central Malmo rail scheme involving construction of 5km of deep bored tunnel and three new underground stations in 2011. This meant that trains no longer had to reverse at the old Malmo Central terminus and improved journey times from the rest of Skane to Copenhagen.
• £12 million grade separation of west coast and Stockholm line junction in Lund in 2007.
• £70 million reopening of 40kms Markaryrds passenger service in 2014 including ten stations and two passing loops on existing lines in North East Skane.
• £20 million reopening to passenger traffic of a line to Trelleborg, south of Malmo in 2015.
• Construction of 5km of deep bored tunnel and three new stations under central Malmö, opened 2011. This avoided trains having to reverse at the old Malmö Central, a terminus, and improved journey times from the rest of Skåne to Copenhagen. Cost just under £1 billion.
• Regional bus services on motorways and high speed A roads, with associated bus stops on these roads, serving peripheral employment sites as well as city centres.
• £7.5 million scheme to transform Malmo’s busiest bus route (the 8.5km route 5) which includes new low emission vehicles, fully segregated Bus Rapid Transit as well as bus lanes.
Typically rail investments are 50% regionally and 50% nationally financed; smaller investments such as the BRT in Malmö are 100% regionally and locally financed. Some 133 regional bus routes and 75 city bus routes serve the 33 municipalities, whilst in total the region now runs 23 million train km of regional services per year. City buses are fully accessible and now all are Euro 6 or better with the majority running on bio-CNG and 100% on non-fossil fuels (including biodiesel). The regional fleet will meet the same standard by 2018.
During 2015, 158.8 million trips were made by public transport: 50% by urban bus, 21% by regional bus, 14 % by regional trains, 14% by Öresundståg (long range, cross-border regional trains) and 1% by special (accessible/DRT) transport services.
Ridership has increased substantially over the years, and the target for 2025 seems possible to achieve. However, Figure 4.1, below shows clearly that this will not come without a cost. This is partly due to the rapid expansion of regional rail services but also the ambition for more extensive, cleaner (100% non-fossil fuel by 2017) and higher quality regional bus services.
So far political consensus for this policy has been maintained because of wider environmental and economic objectives as well as the success of the policy in increasing ridership.
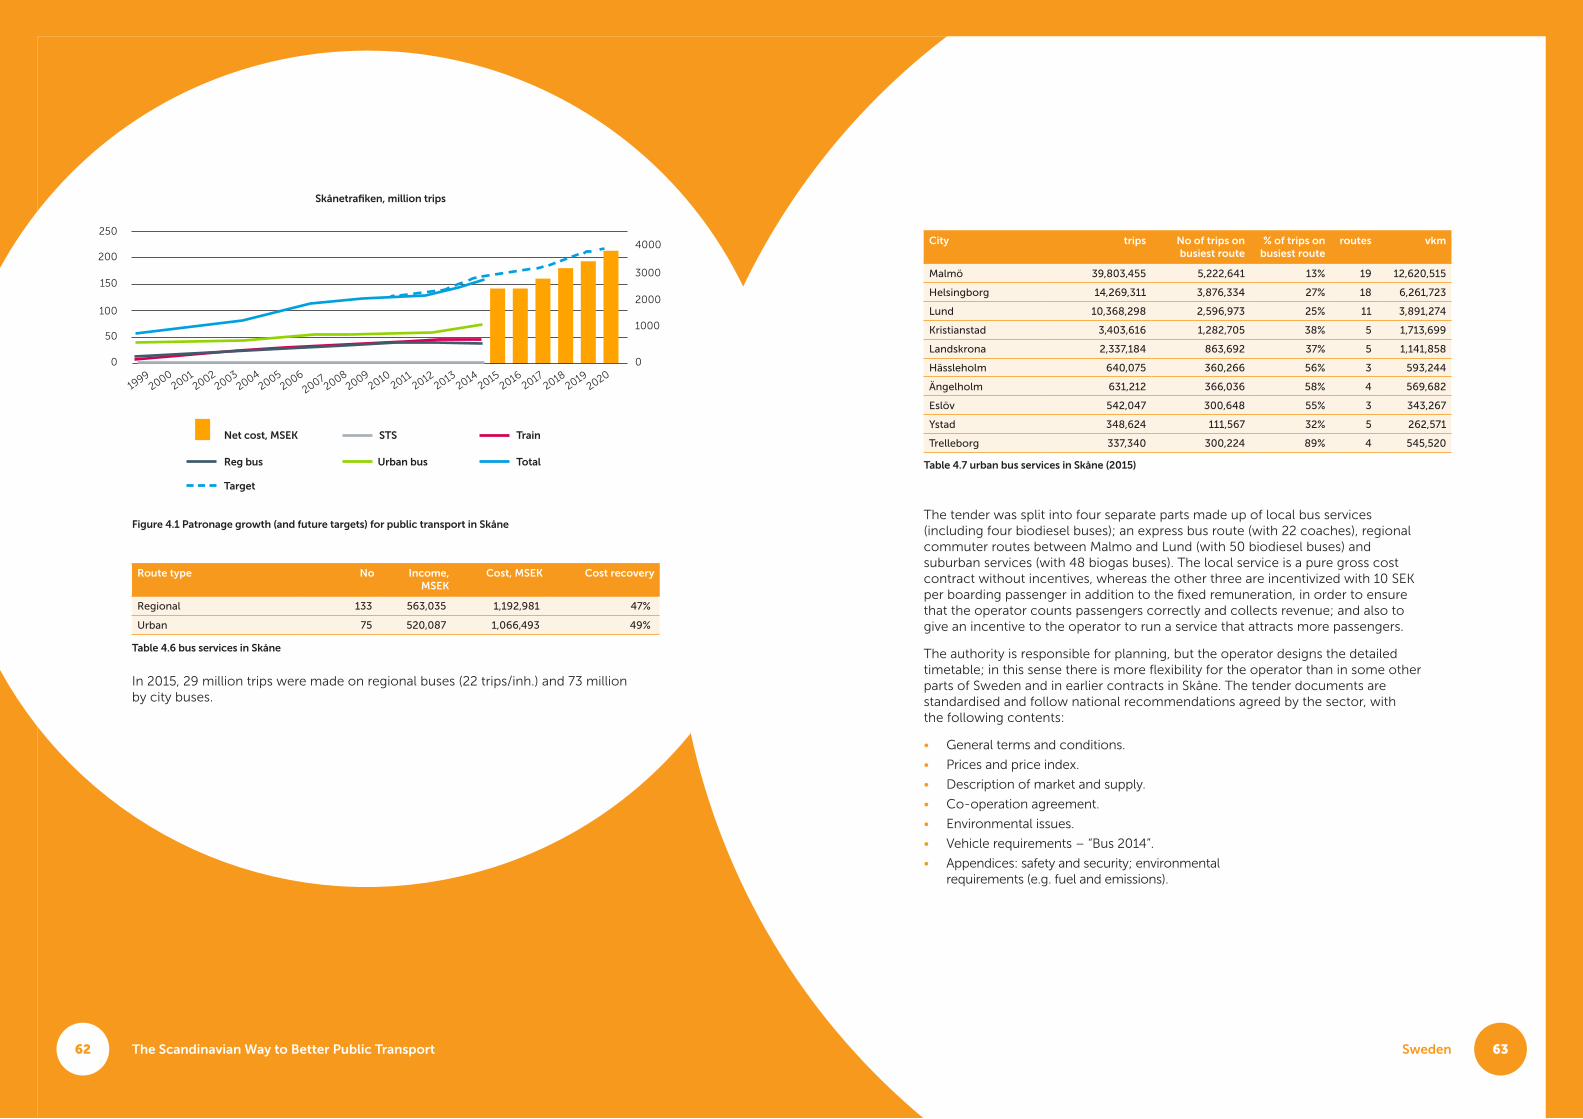
63The Scandinavian Way to Better Public Transport62
The tender was split into four separate parts made up of local bus services (including four biodiesel buses); an express bus route (with 22 coaches), regional commuter routes between Malmo and Lund (with 50 biodiesel buses) and suburban services (with 48 biogas buses). The local service is a pure gross cost contract without incentives, whereas the other three are incentivized with 10 SEK per boarding passenger in addition to the fixed remuneration, in order to ensure that the operator counts passengers correctly and collects revenue; and also to give an incentive to the operator to run a service that attracts more passengers.
The authority is responsible for planning, but the operator designs the detailed timetable; in this sense there is more flexibility for the operator than in some other parts of Sweden and in earlier contracts in Skåne. The tender documents are standardised and follow national recommendations agreed by the sector, with the following contents:
• General terms and conditions.
• Prices and price index.
• Description of market and supply.
• Co-operation agreement.
• Environmental issues.
• Vehicle requirements – “Bus 2014”.
• Appendices: safety and security; environmental requirements (e.g. fuel and emissions).
Sweden
Figure 4.1 Patronage growth (and future targets) for public transport in Skåne
Route type No Income, MSEK
Cost, MSEK Cost recovery
Regional 133 563,035 1,192,981 47%
Urban 75 520,087 1,066,493 49%
Table 4.6 bus services in Skåne
City trips No of trips on busiest route
% of trips on busiest route
routes vkm
Malmö 39,803,455 5,222,641 13% 19 12,620,515
Helsingborg 14,269,311 3,876,334 27% 18 6,261,723
Lund 10,368,298 2,596,973 25% 11 3,891,274
Kristianstad 3,403,616 1,282,705 38% 5 1,713,699
Landskrona 2,337,184 863,692 37% 5 1,141,858
Hässleholm 640,075 360,266 56% 3 593,244
Ängelholm 631,212 366,036 58% 4 569,682
Eslöv 542,047 300,648 55% 3 343,267
Ystad 348,624 111,567 32% 5 262,571
Trelleborg 337,340 300,224 89% 4 545,520
Table 4.7 urban bus services in Skåne (2015)
In 2015, 29 million trips were made on regional buses (22 trips/inh.) and 73 million by city buses.
Skånetrafiken, million trips
Net cost, MSEK STS Train
TotalUrban busReg bus
Target
250
2004000
1503000
1002000
501000
0 0
1999
20002001
20022003
20042005
20062007
20082009
20102011
20122013
20142015
20162017
20182019
2020

65The Scandinavian Way to Better Public Transport64
CONCLUSIONS ON SWEDEN
The situation in Sweden is instructive in several ways:
• It has a long history of competitive tendering of both bus and rail services which has increased efficiency and improved quality.
• It has the highest percentage of trips by public transport of any western European country that collects regular national travel survey data.
• Politically public transport is on the national and regional agenda as a means of reducing local and global emissions from transport, and as an economic development and congestion management tool.
• Each region offers their customers an integrated package of services with multi-modal smartcard and mobile ticketing and a unified corporate image with frequencies and journey times on main corridors designed to be competitive with the car. Fares in relation to incomes are reasonable, particularly for regular travellers.
• Many regions have significantly improved and increased public transport services (Skåne for example has doubled vehicle km operated in just under 20 years) and this has increased ridership and mode share.
• There are many examples of innovative public transport services and infrastructure in Sweden that are delivered at moderate cost to the public purse.
Sweden
This section describes the market and supply of services contains the authority’s short term and long term strategies. It informs the operation of transport and land use plans and strategies that it should be seeking to help to achieve; travel statistics; previous ticket sales data and passenger satisfaction surveys. It also contains monitoring, deviation and malus specifications. It offers a full description of the current/planned network and timetable. Finally, it contains an explanation of the operator’s degree of flexibility in terms of varying the timetable, supply, providing marketing and so on. In the case of a pure gross cost contract without incentives, this section is shorter.
The main content of the price section is “basic annual remuneration” and then, in cases where incentives apply, a unit price per recorded boarding passenger. Currently, this leads towards an incentive share of 25% in contracts with “high” incentives, but the percentage is not actually specified. Stockholm is currently the only region where contracts have 50% or more of the remuneration linked to passenger numbers. Furthermore, there are several variable prices, per vehicle type: timetable kms; timetable hrs; additional vehicles; outgoing vehicles; and for planned and unplanned occasional service changes.
There is a price inflation index normally applied to 100% of the remuneration. The index basket considers rises in labour costs (weight 50-60%), fuel (10-25%), new vehicles (5-15%), vehicle financing (interest rates, 0-5%), and CPI (10-20%).
The co-operation agreement also contains a description of all important parties/stakeholders that will work together during the contracting period, for example the authority, operator(s), municipality(s), and the Swedish Transport Authority. It emphasises the need for co-operation when it comes to land use and transport planning and operation, stressing the key role of municipalities here, and therefore the need for the operator to collaborate with the Municipality in such matters.
The vehicle standard document entitled “Bus 2014” specifies the vehicles requirements that the sector has adopted to make the vehicle as attractive to passengers as possible, and which apply over and above current legislation. It contains items such as: aspects of safety and security; seating; embarking/disembarking and moving around inside; comfort; information and communication technology; exterior, driver environment/ergonomics; and aspects of accessibility.
This section demonstrates that there is a sophistication but also standardisation in contracting that has developed from the many years of experience of tendering bus services in Skåne and other parts of Sweden.
4.9

Denmark 67The Scandinavian Way to Better Public Transport66
Ellis, I. O., Haugsbø, M. S., & Johansson, M. (2015). Reisevaner i Region Sør 2013/14. UA-rapport 57/2015. Oslo: Urbanet Analyse.
Jernbaneverket. (2016). Jernbanestatistikk 2015. Oslo: Jernbaneverket.
Jernbaneverket. (2016). About us. Hentet fra Jernbaneverket. http://www.jernbaneverket.no/en/startpage1/About-Us/
Hordaland Fylkeskommune. (2014). Kollektivmeldinga 2014.
Krogstad, J. R and Aarhaug, J. 2015. Bedre samordning av offentlig kjøp av tog og lokal kollektivtransport. TØI-rapport 1434/2015.
Lovdata (2016a): Lov om aksjeselskaper (aksjeloven) av 13. Juni 1997 nr. 44. https://lovdata.no/dokument/NL/lov/1997-06-13-44.
Lovdata (2016b): Lov om yrkestransport med motorvogn og fartøy (yrkestransportloven) av 21. Juni 2002 nr. 45. https://lovdata.no/dokument/NL/lov/2002-06-21-45/KAPITTEL_2#§4
Lovdata (2016c): Lov om planlegging og byggesaksbehandling (plan- og bygningsloven) av 8 mai 2009 nr. 27. https://lovdata.no/dokument/NL/lov/2008-06-27-71.
Lovdata (2016d): Lov om kommuner og fylkeskommuner (kommuneloven) av 25. September 1992 nr. 107. https://lovdata.no/dokument/NL/lov/1992-09-25-107.
Kjørstad, K., Ellis, I., Berg, M., Betanzo, M., Norheim, B. (2014): Nullvekstmålet og fordeling av transportvekst (UA-rapport No. 50/2014). Urbanet Analyse, Oslo.
Kollektivtrafikkforeningen (2015): Markedsoversikt - bussoperatører i fylkeskommunal regi. Sist oppdatert 30.11.2015 med informasjon pr. 10.11.2015
Kolumbus (2016): Kolumbus innfører færre soner og bedre billetter. https://www.kolumbus.no/aktuelt/kolumbus-onsker-farre-soner-og-bedre-billetter/.
Miljøverndepartementet (2012): Klimaforliket vedtatt i Stortinget. https://www.regjeringen.no/no/aktuelt/klimaforliket-vedtatt-i-stortinget/id684927/.
NHO Transport (2014): Anbudsoversikt bussbransjen i Norge pr. 01.07.2014.
Nilsen, J. (2014): Kollektivtransporten ved en kommunereform. Muligheter, forutsetninger og konsekvenser av et bykommunalt ansvar (NIVI notat No. 2014:2). NIVI Analyse.
Norheim, B., Betanzo, M., Solli, H., Nilsen, J. (2016): Framtidig behov for økt tilskudd til kollektivtransport. Mulighet for mer målrettet statlig finansiering? (UA-rapport No. 74/2016). Urbanet Analyse, Oslo.
Norheim (red), B. (forthcoming): Kollektivtransportboka.
Norwegian Road Authority (2013): Konseptvalgutredning (KVU) og (KS1). http://www.vegvesen.no/fag/Veg+og+gate/Planlegging Konseptvalgutredninger+%28KVU%29+og+%28KS1%29.
Osland, Oddgeir and Merethe Dotterud Leiren (2006): Anbud, virksomhetsoverdragelse og ansettelsesforhold i lokal kollektivtransport. TØI-rapport 860/2006. https://www.toi.no/getfile.php?mmfileid=5063.
Regjeringen. (2016, August 28). Organisatoriske endringer. Hentet fra Jernbanereformen: http://jernbanereformen.regjeringen.no/fakta/organisatoriske-endringer/
Regjeringen. (2016, August 28). Tidsplan. Hentet fra Jernbanereformen: http://jernbanereformen.regjeringen.no/tidsplan/
Ruter. (2007-2016). Year-end reports. https://ruter.no/om-ruter/rapporter-planer-prosjekter/.
Ruter. (2016a): Soner og sonekart. https://ruter.no/kjop-billett/soner/.
Ruter. (2016b): Årsrapport Ruter 2015. https://ruter.no/globalassets/dokumenter/ruterrapporter/2015/arsrapport_2015_komplett.pdf.
Ruter. (2015): Planen klar for å kjøre kun på fornybar energi i 2020. https://ruter.no/om-ruter/rapporter-planer-prosjekter/fossilfri2020/ planen-klar-for-a-kjore-kun-pa-fornybar-energi-i-2020/.
Samferdselsdepartementet. (2004): Vilkår for transport med rutegående busstrafikk I Norge. https://www.regjeringen.no/no/dokumenter/vilkar-for-transport-med-rutegaende-buss/id107494/.
Samferdselsdepartementet. (2012). Avtale om utførelse av persontransport med tog som offentlig tjeneste i 2012-2017 “Trafikkavtalen”. Oslo.
Samferdselsdepartementet. (2013). Meld. St. 26. (2012-2013). Nasjonal transportplan 2014 - 2023. Oslo.
Samferdselsdepartementet. (2015). Meld. St. 27 (2014-2015). På rett spor. Reform av jernbanesektoren. Oslo.
Samferdselsdepartementet (2016): Rundskriv N-1/2016. https://www.regjeringen.no/no/dokumenter/rundskriv-n-12016---gjennomforing-av-kollektivtransportforordningen-forordning-nr.-13702007-i-norsk-rett/id2508391/
Solli, H., Resell, M.B., Haugsbø, M. (2015): Sammenhengen mellom strategiske mål og organisering av kollektivtrafikken (UA-rapport No. 68/2015). Urbanet Analyse, Oslo.
Statistics Norway (2016a): Befolkning i areal og tettsteder. http://www.ssb.no/befolkning/statistikker/beftett/aar/2015-12-11
Statistics Norway. (2016b). http://www.ssb.no/.
Transportetatene (2016): Forslag til nasjonal transportplan. http://www.ntp.dep.no/.
REFERENCES