the sailmast flight validation experiment 2005-18840... · the st8 sailmast validation experiment...
TRANSCRIPT

American Institute of Aeronautics and Astronautics1
The ST8 SAILMAST Validation Experiment
Michael E. McEachen*, Thomas A. Trautt† and David M. Murphy‡
ATK Space Systems, Goleta, CA 93117
The SAILMAST Validation Experiment employs an ultra-light graphite Coilableboom in a Scalable Architecture for the Investigation of the Load ManagingAttributes of a Slender Truss. The investigation will validate the strength andstiffness attributes of versatile gossamer boom technology through correlation of in-flight measurement with analytical prediction. Successful flight validation ofdeployable gossamer truss technology is a critical step forward in risk mitigation tomake gossamer spacecraft systems a reality, enabling new classes of missions.Propellantless propulsion (solar sailing), large aperture sensors, and applicationsnot yet conceived will be made feasible through the validation of this fundamentalbuilding block of gossamer structure. Analysis tools and techniques have beendeveloped, correlated, and scaled to the proposed experiment system in order topredict on-orbit behavior and verify the suitability of measurement range andaccuracy to ensure a successful, informative flight validation experiment.
Nomenclaturea = longeron eccentricityC = follower load lengthe = mast eccentricity under loadEI = bending stiffnessFEM = Finite Element ModelGA = shear stiffnessISP = In-Space PropulsionL = mast lengthLbay = mast bay lengthNMC = New Millennium CarrierNMP = New Millennium ProgramP = applied loadPcr = critical buckling loadQ = shear forceT = lanyard loadULGC = Ultra Light Graphite Coilableytip = tip deflectionθ = loading angleρ = radius of curvature
I. IntroductionOSSAMER applications pose new challenges in spacecraft architecture consisting in large part of deployablespace structure - where mass and stowed volume effectiveness are particularly critical, as these metrics together
drive launch costs. Solar sailing1,2 is the ideal example: very large structures are required, and low mass is crucialsince thrust is inversely proportional to the mass needed to deploy and stabilize the reflective sails. The volume ofthe stowed sail system must not drive the payload to a larger launch vehicle, as this may offset the cost savings of
* Senior Mechanical Engineer, ATK Space Systems, 600 Pine Ave, Goleta, CA 93117, Member AIAA† Senior Mechanical Engineer, ATK Space Systems, 600 Pine Ave, Goleta, CA 93117‡ Chief Research Engineer, ATK Space Systems, 600 Pine Ave, Goleta, CA 93117, Member AIAA
G
46th AIAA/ASME/ASCE/AHS/ASC Structures, Structural Dynamics & Materials Conference18 - 21 April 2005, Austin, Texas
AIAA 2005-1884
Copyright © 2005 by Michael E. McEachen. Published by the American Institute of Aeronautics and Astronautics, Inc., with permission.
American Institute of Aeronautics and Astronautics2
this new propulsion technology. Stiffness is not generally a driving requirement, since it has been accepted by thegossamer community that the sailcraft attitude and trajectory control system must be engineered to function with thegossamer structure’s modal response is critical to the viability of these structures in real applications.3 Therefore, agossamer truss has slender, strength-based, structural elements. As elements are made more slender, they becomemore susceptible to waviness. This waviness is caused by the manufacture of the composite and by minuteinaccuracies in assembly from bay to bay. Additionally, since the truss itself is slender it is also subject to globalbow and twist from manufacturing inaccuracy and thermal distortion. In the gossamer regime the potential range oflocal and global imperfections can combine in complex ways to reduce load-carrying capability.
NASA’s New Millennium Program (NMP) recognizes the importance of validating gossamer boom technologywithin the zero gravity environment provided uniquely by a flight experiment and has funded efforts to developpertinent technology validation plans. The work described herein was performed under a Concept Definition (studyphase) contract. The experiment under development for the eighth NASA NMP Space Technology (ST8) flightprogram is a Scalable Architecture for the Investigation of the Load Managing Attributes of a Slender Truss. TheSAILMAST experiment plan provides a thorough investigation of the fundamental attributes of an ultra-lightweight(slender) Coilable truss, allowing extrapolation to generalized gossamer truss structures that may be different ingeometry, loading, or design. These efforts will reduce the risk to the first users of gossamer structure technologies,allowing incorporation into science missions to occur at an accelerated pace. The SAILMAST experiment willprovide validation of the most fundamental building block of gossamer space structure technology and, in particular,the essential element needed for near term solar sailcraft to support key NASA roadmap missions.
For the ST8 Concept Definition Phase, a 7-m length of gossamer SAILMAST structure was built and tested in a1g (laboratory) environment. This technology stows in less than 1% of its deployed length. The linear mass of thisstructure is 34 g/m, which is less than 15% of the mass of comparable flight heritage structures and less than 50% ofthe mass of the sail mast structure built in 2003 under the NASA In-Space Propulsion (ISP) Solar Sail GroundSystem Demonstrator program.4,5 Static and dynamic bending tests of this most advanced gossamer structure wereperformed and correlated with a Finite Element Model (FEM) of the test system as well as a newly developedanalytical treatment for slender trusses. This effort has brought the technology readiness level (TRL) to 4. Thefollow-on activities in the Formulation Refinement and Implementation phases are carefully planned to increaseincrementally, with managed risk, the experiment definition with progressively higher-fidelity analysis tools,hardware, and test environments.
II. Technology Validation Experiment ObjectivesIn order for the flight experiment to be considered a success it must measure the global shape of the mast and
obtain the degree of bow, and it also must quantify the load capability of the mast. Measured results must havesufficient fidelity to allow identification of the influence of separate effects, i.e. photogrammetric measurement ofglobal bow must be sufficiently accurate to discern distortions that have an effect on strength within the predictiveaccuracy of the analysis. By looking at sources of error, and correlation with hardware testing performed during theStudy Phase, a reasonable assessment of our analytical predictive accuracy has been achieved. The model correlateswith test results within 3%, in the range tested so far. Further insight into the performance of long slender boomswill be possible with refinements to the model made after testing and correlation with the full-length test boom, aswell as a reduction in predictive error. The scalability of the experiment’s results will be established by dual-measurement-method correlation of test results with predicted values. The two data acquisition methods areindependent and are configured to capture similar data with a similar level of accuracy.
Parametric studies will be performed on the 40-m boom in order to access validity of the model under a widerange of potential circumstances. In particular, the global bow can be deliberately adjusted by external means, andthe stiffness and load capability assessed. This will enable flight data acquisition throughout a range of possible free-state shape conditions. Along with validating the applicability range of the analytical model, the hardware itself willprove out the range of possible global distortion that may be accommodated by the loading and imaging techniquesplanned for flight.
The performance of the flight structure will, of course, be investigated in the laboratory environment prior toflight. The SAILMAST will be supported to negate, to the extent possible, the effects of gravity on shape. Loadversus deflection experiments, analogous to the flight regimen, will be measured and compared with those predictedby the models, accounting for measured global and local shape. In order to provide a range of data points foranalytical correlation, known distortions will be induced to the local and global mast shape. Mast displacement willbe measured both by the flight video method and by a laser target tracker. While true free-state shape will beimpossible to generate in 1g, measuring the shape in two orthogonal positions, then combining the data will

American Institute of Aeronautics and Astronautics3
NM
C-1
bus
piezo actuators underlongerons Digital video camera LED optical targets
2-axisaccelerometer
lanyard(wound on reelat mast root)
Global shape and load-induced deflection (stiffness & strength) measured byphotogrammetry and dynamic excitation/response
Axial compressive loading applied to mast
Load cell measurestension in lanyard
Experimentcontroller
40m
Figure 1. Experiment Functional Diagram
approximate the 3-d shape. This data can then be input to the FEM and the analytical model, and sources of variancediagnosed. By the end of this phase, there will be high confidence in the precision of predictive capability providedby the analytical model.
The planned Formulation Refinement activity includes fabrication of the flight experiment mast, while theImplementation Phase will provide the remainder of the flight hardware involved in the experiment. This will allowsystem-level testing to be performed, ensuring that the experiment will function as planned and provide the desiredmeasurements, with the range and precision required to achieve the post-flight TRL of 7. The 40-m structure will beintegrated with the stowage canister, hold-down release and other structure and mechanisms used for flight, as wellas video, telemetry and accelerometers necessary for the in-flight experiment. The complete system will be tested asproto-flight hardware to establish final mass properties, functional deployment capability, stowed sine and randomvibration testing, thermal cycling survivability, and deployed stiffness and buckling strength.
III. Validation Flight Experiment Scenario
The in-space experiment will begin by deploying the SAILMAST from the stowage canister, to zenith, bypaying out a lanyard with a motor. When the boom is deployed 80%, the spacecraft ACS may be placed on standby,since the mast will provide gravity gradient stabilization, allowing the dynamics of the coilable kick-over to berecorded. Upon full deployment, a baseline measurement of mast shape will be performed by photogrammetricanalysis of targets as imaged by a video camera mounted at the mast root. Actuation of piezos in line with the 3longerons, at their root, will induce small oscillations of the structure as a sine input is swept. The tip accelerometerand videogrammetry will observe the first mode response amplification, and the damping after the input forcesuccession. The mast shape will then be entered into the mast sizing spreadsheet. Next, the motor will be slowlyreversed, pulling on the lanyard,until a known axial load hasbeen applied to the boom,measured by a load cell on thelanyard pulley. This load willhave produced somedisplacement in the mast, to bemeasured by again takingimages with the root camera.This process is repeated atseveral loads until additionallanyard stroke does not increaselanyard load, at which point themast will be “buckled”. Theload is then reduced, andimages taken as before, atincrements until the load hasbeen fully removed.
IV. Predictive ModelsThe majority of effort expended during the Study Phase was devoted to developing and refining analytical
models. Without highly accurate, refined models, the flight experiment would only represent a single design datapoint. However, the modeling performed and correlated withthe 7-m mast justifies TRL 4 status, and when the full-lengthhardware is built and tested, the models’ scalability andapplicability to truly slender, gossamer hardware will havebeen validated. In the section below, both finite element andclosed-form mathematical modeling is described.
A. Modeling LongeronsThere are several steps involved in modeling the
SAILMAST longerons in the finite element model. Thebuckling load of a bay length of the longeron with simply
0
0.2
0.4
0.6
0.8
1
1.2
0 0.2 0.4 0.6 0.8 1x/Lbay
wav
ines
sn
orm
aliz
edto
max
imu
mec
cen
tric
ity
half sine
finite element
Figure 2. Local Waviness Approximation

American Institute of Aeronautics and Astronautics4
supported ends is computed using a closed from solution and a simple finite element model. The ratio of the twobuckling loads is used to adjust the area moments of inertia in the finite element model such that the buckling load inthe finite element model matches the theoretical buckling load. This procedure works well to simulate the longeronaxial stiffness in pre-buckled and post-buckled configurations. The number of (equal length) elements per bay wasset to 3 to minimize computational requirements while still providing realistic modeling of the waviness effect. Acorrection of the effective area moment of inertia was also made to make the reduced-element bay match a finelymeshed (test) version. Confirming that a small number of elements per bay per longeron can simulate local wavinesswas a critical step. Local waviness is assumed to take the form of a half sine over one bay length. Locating thenodes of the finite element model on the half sine curve as shown in Figure 2 gave excellent results, with theunderstanding that the eccentricity of the two nodes between the batten frames is 0.866 times the maximumeccentricity to be simulated.
Assuming small angular rotations, the theoretical deflected shape for an axial loaded simply supported columnwith an initial half sine is6
y x( )y 0 x( )
1P
P cr−
(1)
where
y 0 x( ) a sinπ x⋅
L bay
⋅
and
P crπ
2E⋅ I⋅
L bay2
(2) , (3)
In these equations, Lbay is the length of the column, EI is the bending stiffness parameter, y0(x) is the initial shape,y(x) is the shape under axial load, P, and Pcr is the buckling load. The axial load causes a shortening of the column,∆L, due to compressive strain and flexure.
∆LP L bay⋅
E A⋅0
L
x1
2y' tot x( )
2y' 0 x( )
2−
⋅
⌠⌡
d+P L bay⋅
E A⋅1
1P
P cr−
21−
π2
a2⋅
4 L bay⋅⋅+
(4)
In Eq. (4), ‘a’ is the maximum eccentricity. Theload deflection curve from the three-element longeronis compared to the theoretical closed form solution andto a 20-element longeron in Fig. 3. The localeccentricity used in this comparison is 0.254 mm. Thethree-element longeron has the reduced area momentsof inertia and the eccentricity of the two nodes is0.866 times the eccentricity. All three load-deflectioncurves match well for strains below 10%. The loaddifference between the 3-element and the 20-elementmodel is less than 10% for strains up to 50%.
0
20
40
60
80
100
120
1E-06 1E-05 0.0001 0.001 0.01 0.1 1
Compressive deflection, dL/L
Co
mp
ress
ive
load
,(N
) 20 elements3 elementsclosed form small deflection
Figure 3. Load Deflection Curves with 0.254 mmLocal Eccentricity

American Institute of Aeronautics and Astronautics5
B. Finite Element Model of 50 Bay MastA 50 bay FE model was created to compare to test results from the 50-bay mast. The bay length and diameter are
equal to those of the 7-m mast. The finite element model has three elements per bay per longeron with the propertiesand derived area moments of inertia of the previous section. In the actual hardware, the battens are buckled in thedeployed configuration to provide tensile preloads in the diagonals and compressive preloads in the longerons. In thefinite element model, the battens are modeled as link elements that carry only tensile and compressive loads.Thermal strains are applied to the battens to make them expand in the model and produce a batten preload of 6.294N. The finite element batten stiffness is very low to simulate the almost constant load of the actual buckled battens.The diagonal length specified on the engineering drawing applies under the actual tensile preload. To account for thepreload strain, an initial strain is applied to the diagonals in the finite element model. The corner fittings are modeledas point masses. The piezo actuators at the root of each longeron are modeled as link elements, as shown in Fig. 4.The cantilevered beam, which flexes under the action of the piezo, is modeled as a beam element with one end fixed.There are moment releases at the interfaces with the longerons. In the actual hardware, the leaf springs are part of analuminum root plate. The tip plate is also aluminum and is modeled with beam elements as shown in Fig. 4. Thereare moment releases at the interfaces with longerons to simulate the end joints. Additional tip mass as added at theends of the longerons as point masses.
C. Closed-Form Mast ModelingIn this section, closed form solutions are derived for lateral deflections of the mast as a function of lanyard load.
The closed form solution will be compared to the finite element model. Global waviness is included as an initialdeflection in the beam-column differential equation. The local waviness is accounted for by iteratively solving forthe bending stiffness parameter, EI, which satisfies the beam column differential equation and also matches theeffective EI due to reduction in stiffness of the longerons under the applied loads and resulting deflections.
The analysis is similar to work done by Crawford and Benton7 and others,8 with several modifications. Sheardeflection has been added. The initial global deflected shape has been changed from a quarter sine to a quadraticshape to simulate a constant curvature. The global bow direction has been changed from the general case to theworst-case direction for buckling strength that was shown in the previous work to be toward a longeron. The mastloading direction has been changed from a root-fixed lanyard (as in the experiment) to the general case where theload effectively pulls from behind the root as in a solar sail. The EI has been changed from the more conservativetangent EI to an effective EI. The effective EI is the moment over the curvature and is more accurate for computingtotal curvature under static loading. The tangent EI is the rate of change of moment over the rate of change ofcurvature and is more accurate for computing natural frequencies and vibrations about some deformed shape.1. Solution to Beam-Column Differential Equation
The closed form solution is derived for the loading configuration shown in Fig. 5
Figure 4. Root Bay and Tip Bay
Figure 5. Mast with Applied Lanyard Load

American Institute of Aeronautics and Astronautics6
The initial shape of the beam prior to applying any lanyard load is assumed to be quadratic in x as follows:
y0 x( ) b 1L x−
L
2
−
⋅(5)
In Eq. (5), b is the initial deflection at the tip. The curvature due to bending moments is given by the followingequation where M is the bending moment with the sign convention shown in Fig. 6, yb(x) is the bending deflectionand the primes indicate derivatives with respect to x.
y'' b x( )M
EI
T− cos θ( )⋅ y x( )⋅ T sin θ( )⋅ x⋅+EI (6)
The shear force, Q, in the mast is approximated by the following equation where y(x) is the total displacementincluding initial displacement and displacements due to applied loads.
))tan()x(y(T)))x(y(arctan(T)))x(y(arctansin(T)x(Q θ−′≈θ−′⋅≈θ−′⋅= (7)
Slope due to shear is given by the following equation where GA is the shear stiffness parameter of the mast.
y' s x( )Q x( )
GA
T y' x( ) tan θ( )−( )⋅GA (8)
The total curvature due to bending, shear and initial shape is
y'' x( ) y'' b x( ) y'' s x( )+ y'' 0 x( )+(9)
Equations (5), (6), (8) and (9) are combined to obtain the beam-column differential equation.
y'' x( )T cos θ( )⋅ y x( )⋅
EI 1T
GA−
⋅+
T sin θ( )⋅ x⋅
EI 1T
GA−
⋅
2− b⋅
L2
1T
GA−
⋅+
(10)
The general solution to this equation is of the following form where C2, C3, and θ are dependent on the boundaryconditions.
y x( ) C 1− C 2 sin λ x⋅( )⋅+ C 3 cos λ x⋅( )⋅+ x tan θ( )⋅+(11)
where
Figure 6. Differential Element Showing SignConvention for Moment and Shear

American Institute of Aeronautics and Astronautics7
λ2 GA T⋅ cos θ( )⋅
EI GA T−( )⋅ and
C 12 b⋅ GA⋅
λ2
L2⋅ GA T−( )⋅ (12) & (13)
The constants C2, C3, and θ are dependent on the following boundary conditions.
y 0( ) 0 y L( ) ytip tan θ( )ytip
C
y' L( ) y's L( )T y' L( ) tan θ( )−( )⋅
GA==> y' L( )
ytip−
C
T
GA T−⋅
(14)
Applying the boundary conditions leads to the following results where L/C can be set to zero for the case whereC is infinite.
y x( ) C 1 cos λ x⋅( ) 1−( )⋅ C 2 sin λ x⋅( )⋅+y tip
L
L
C⋅ x⋅+
(15)
y tip C 1λ L⋅ 1 cos λ L⋅( )−( )⋅
L
C
GA
GA T−
⋅ sin λ L⋅( )⋅ 1L
C−
λ⋅ L⋅ cos λ L⋅( )⋅+
⋅
(16)
C 2 C 1 sin λ L⋅( )⋅ 1L
C−
sin λ L⋅( )⋅L
C
GA
GA T−
⋅cos λ L⋅( )λ L⋅
⋅−
y tip⋅+(17)
The EI that satisfies the differential equation for an assumed load and λ is derived from Eq. (12):
EIGA T⋅
λ2
GA T−( )⋅1
y tip
L
L
C⋅
2
+
1−
⋅
(18)
For any chosen fixed value of λ, T can be varied until EI from Eq. (18) matches the effective EI due to theloading, derived in the following section.
2. Effective Mast EI as a Function of Longeron Initial Eccentricity and Axial LoadThe bending moment in the mast is given by Eq. (6). The moment equation is combined with the boundary
condition, tan(θ) = ytip/C, and some trigonometric identities to obtain the following equation.
M x( ) T y x( )−y tip
L
L
C⋅ x⋅+
⋅ 1
y tip
L
L
C⋅
2
+
1−
⋅(19)
The maximum moment occurs when the derivative is zero.
American Institute of Aeronautics and Astronautics8
0 y' x( )−y tip
C+
(20)
The location of the maximum moment is derived by combining Eq. (20) with Eq. (15).
x 01
λatan
C 2
C 1
⋅
(21)
The maximum eccentricity also occurs at x0 and is given by the following equation.
eM x 0( )−
Ty x 0( )
y tip
L
L
C⋅ x 0⋅−
1
y tip
L
L
C⋅
2
+
1−
⋅(22)
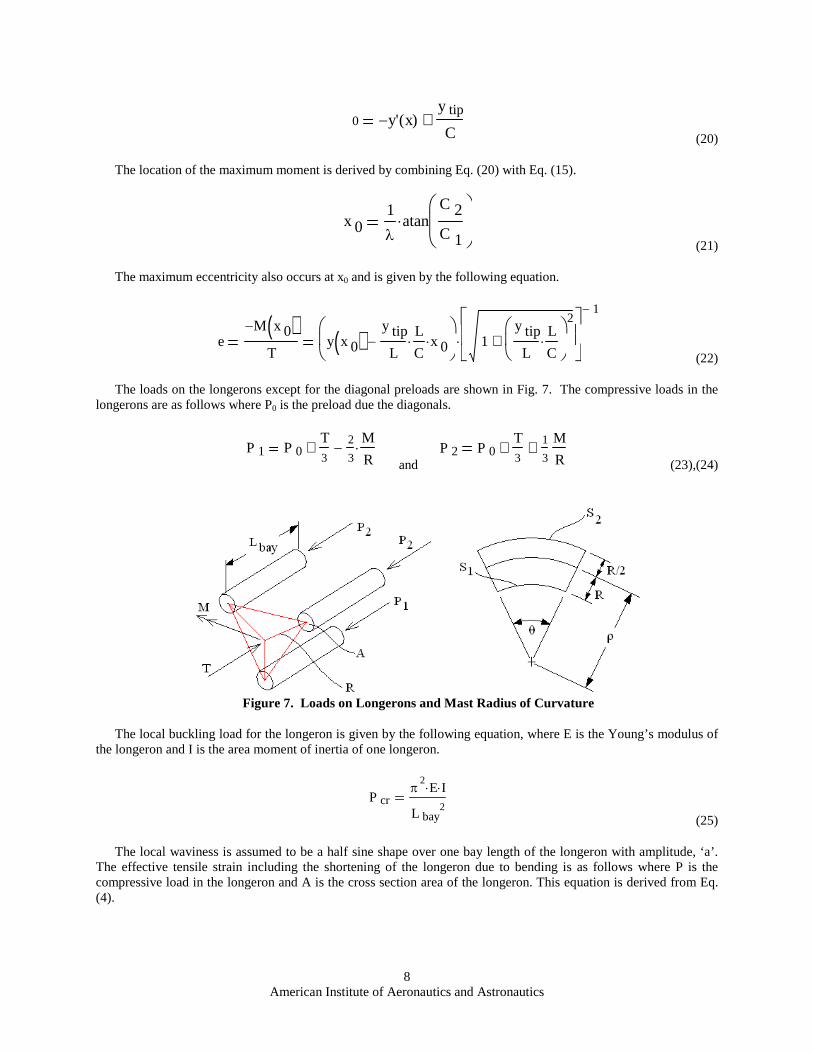
The loads on the longerons except for the diagonal preloads are shown in Fig. 7. The compressive loads in thelongerons are as follows where P0 is the preload due the diagonals.
P 1 P 0T3
+ 2
3
M
R⋅−
andP 2 P 0
T3
+ 1
3
M
R+
(23),(24)
The local buckling load for the longeron is given by the following equation, where E is the Young’s modulus ofthe longeron and I is the area moment of inertia of one longeron.
P crπ
2E⋅ I⋅
L bay2
(25)
The local waviness is assumed to be a half sine shape over one bay length of the longeron with amplitude, ‘a’.The effective tensile strain including the shortening of the longeron due to bending is as follows where P is thecompressive load in the longeron and A is the cross section area of the longeron. This equation is derived from Eq.(4).
Figure 7. Loads on Longerons and Mast Radius of Curvature

American Institute of Aeronautics and Astronautics9
ε 1P 1
E A⋅
P cr
P cr P 1−
2
1−
π a⋅2 L bay⋅
2
⋅+
−(26)
Although the neutral axis shifts, the global displacements and loads are at the zero-load neutral axis. The radiusof curvature of the zero-load neutral axis is derived below with the aid of Fig. 7. The arc lengths of the outer fibersare
S 1 ρ R−( ) θ⋅ 1 ε 1+( ) S 0⋅and
S 2 ρR
2+
θ⋅ 1 ε 2+( ) S 0⋅
(27),(28)
These equations are combined to derive the radius of curvature, ρ.
ρ R3 2 ε 2⋅+ ε 1+( )2 ε 2 ε 1−( )⋅
⋅(29)
The effective EI is
EI eff M− ρ⋅ M− R⋅3 2 ε 2⋅+ ε 1+( )2 ε 2 ε 1−( )⋅
⋅(30)
When ε1 = ε2, this equation blows up. This can be prevented by replacing M with Eq. (31).
M P 2 P 1−( ) R⋅(31)
Equations (26), (30) and (31) are combined to obtain the following equation.
EI eff EI 0
12 ε 2⋅
3+
ε 1
3+
P cr P 1−( )2⋅
P cr P 1−( )2P cr
22 P cr⋅ P 1− P 2−( )⋅
P cr P 2−( )2
π a⋅2 L bay⋅
2
⋅ E⋅ A⋅+
⋅
(32)
where
EI 03
2R
2⋅ E⋅ A⋅(33)
In this equation, EI0 is the stiffness of a straight mast without local waviness. Other useful loads are the shearloads at the root and tip which are derived from equations (7), (14) and (15).
Q root Q L( ) T−y tip
L⋅
L
C⋅
GA
GA T−
⋅(34)

American Institute of Aeronautics and Astronautics10
Q tip Q 0( ) T C 2⋅ λ⋅(35)
3. Iterative SolverThe key to making use of the closed-form equations derived above is by their incorporation into an iterative
solver. With this tool, for any given λ a range of T is automatically generated, and successively refined to narrow thedifference between EI that satisfies the differential equation and the effective EI that accounts for mast loading. Fig.8 illustrates a portion of this spreadsheet, showing the values of T converging closer with each iteration.
4. Closed Form and Finite Element ComparisonThe parameters of the 50 bay mast were programmed into the
solver described above to compute compressive load versusdeflection curves. The results for the 50 bay mast with L/C =0 andtwo different initial waviness configurations are compared to finiteelement results in Fig. 9. Gravity is not included in the models. Inboth cases, the closed form buckling strength is about 7% less thanthe finite element results. In the closed form solution, the effectiveEI at the maximum moment location is applied to the whole lengthof the mast and therefore results in a lower strength than the finiteelement model. Another important effect may be due to the fact thatthe closed form solutions do not yet account for the post-buckledstiffening effect. This effect will be included in future analysisefforts.
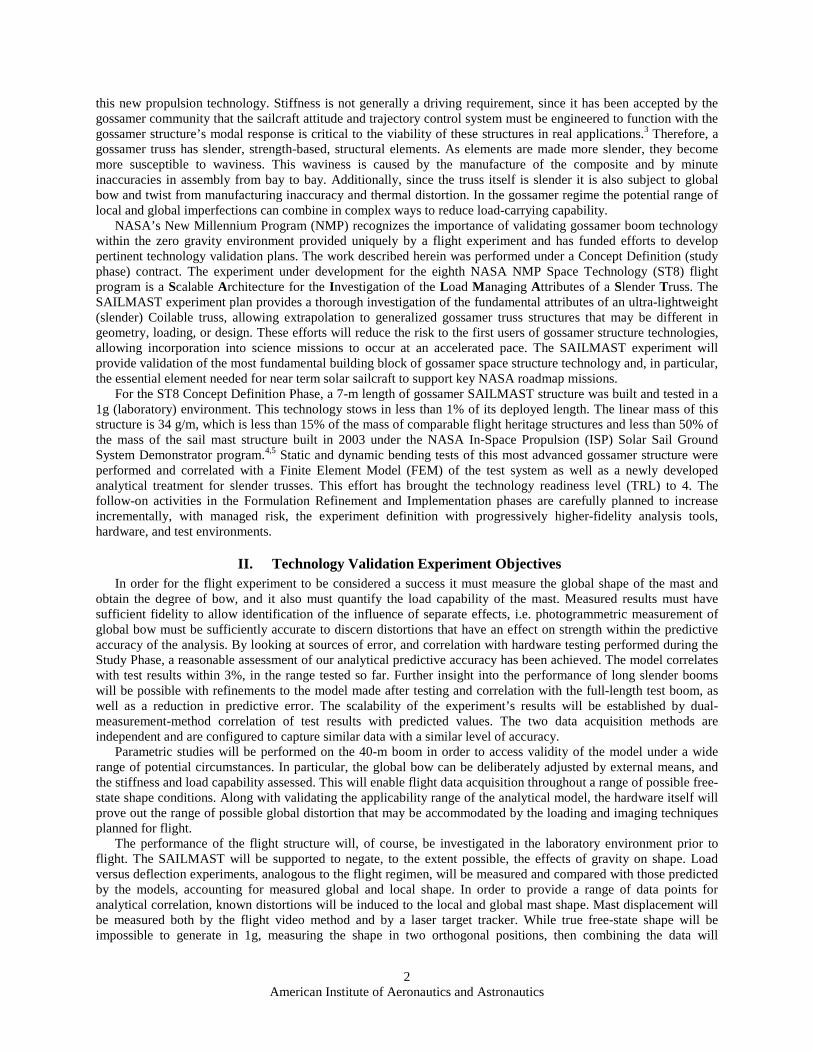
The post-buckled shape from the finite element model is shownin Figure 10. Figure 11 illustrates the very close agreement in the deflected shape between the FEM and closed-formmethods. The difference in load between the two methods is due to the more conservative assumptions for EI usedby the closed-form model.
0
20
40
60
80
100
0 50 100 150 200Lateral displacement, (mm)
Com
pres
sive
load
,(N
)
FEM
Closed form
Figure 9. Closed Form Load-DeflectionCompared to Finite Element, 25.4 mm
Initial Tip Offset, 0.0676 mm LocalEccentricity
Figure 10. Buckled Mast
λ Τ inintiEx0y0eMP1P2EI eEIef f - EI
(1/in) λL (lbf) (inininininn-llblbε1ε2in (lb in 2̂)0.001938 12.420954 562970.001938 12.435566 500120.001938 12.450179 437100.001938 12.464792 373910.001938 12.479405 310560.001938 12.494018 247030.001938 12.508631 183340.001938 12.523244 119470.001938 12.537857 55430.001938 12.552470 -8780.001938 12.567082 -7317
λ Τ nntiEx0y0eMP1P2EI eEIef f - EI
(1/in) λL (lbf) (ininnnnn-lbbε1ε2in (lb in^2)0.0019 0.000000 38280460.0019 1.461289 34285170.0019 2.922577 30255980.0019 4.383866 26180620.0019 5.845155 22039430.0019 7.306443 17799160.0019 8.767732 13399990.0019 10.229021 8725400.0019 11.690309 3524520.0019 13.151598 -2814830.0019 14.612887 -1200589
λ Τ inintiEx0y0eMP1P2EI e EIef f - EI
(1/in) λL (lbf) (ininninnn-llblbε1ε2in (lb in^2)0.001938 11.690309 3524520.001938 11.836438 2957450.001938 11.982567 2378840.001938 12.128696 1787660.001938 12.274825 1182780.001938 12.420954 562970.001938 12.567082 -73170.001938 12.713211 -727200.001938 12.859340 -1400830.001938 13.005469 -2095990.001938 13.151598 -281483
EIeff – EI crosses zero
Figure 8. Iteratively Finding T for Given λ
American Institute of Aeronautics and Astronautics11
V. In-Flight Experiment OperationIn conjunction with the boom technology, there are a number of unique elements required to execute the
SAILMAST flight experiment, particularly related to the challenge of operating the experiment remotely. Remotetesting requires the use of specialized actuators and sensors that must operate effectively in the particular regimeapplicable to our experiment. The standard methods used for ground-based structural characterization are notpractical, and the realities of the flight experiment environment must be accounted for in the analytical modeling.
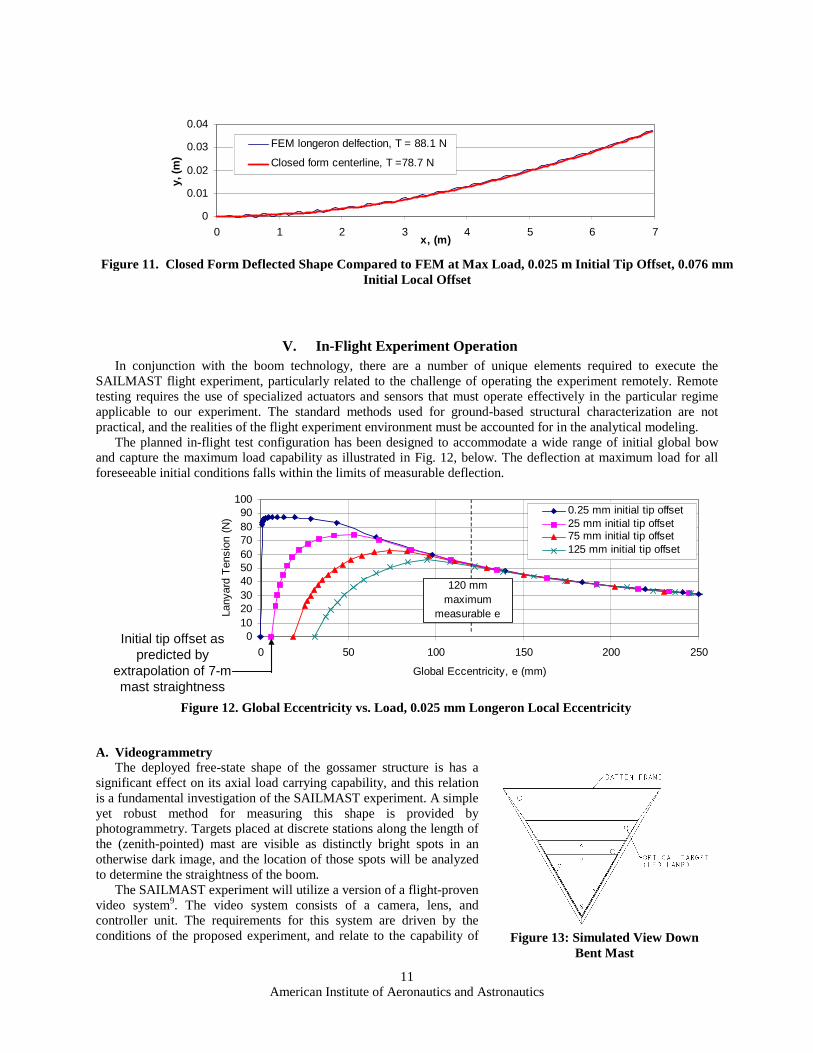
The planned in-flight test configuration has been designed to accommodate a wide range of initial global bowand capture the maximum load capability as illustrated in Fig. 12, below. The deflection at maximum load for allforeseeable initial conditions falls within the limits of measurable deflection.
A. VideogrammetryThe deployed free-state shape of the gossamer structure is has a
significant effect on its axial load carrying capability, and this relationis a fundamental investigation of the SAILMAST experiment. A simpleyet robust method for measuring this shape is provided byphotogrammetry. Targets placed at discrete stations along the length ofthe (zenith-pointed) mast are visible as distinctly bright spots in anotherwise dark image, and the location of those spots will be analyzedto determine the straightness of the boom.
The SAILMAST experiment will utilize a version of a flight-provenvideo system9. The video system consists of a camera, lens, andcontroller unit. The requirements for this system are driven by theconditions of the proposed experiment, and relate to the capability of
0102030405060708090
100
0 50 100 150 200 250
Global Eccentricity, e (mm)
Lany
ard
Ten
sion
(N)
0.25 mm initial tip offset25 mm initial tip offset75 mm initial tip offset125 mm initial tip offset
120 mmmaximum
measurable e
Initial tip offset aspredicted by
extrapolation of 7-mmast straightness
Figure 12. Global Eccentricity vs. Load, 0.025 mm Longeron Local Eccentricity
Figure 13: Simulated View DownBent Mast
0
0.01
0.02
0.03
0.04
0 1 2 3 4 5 6 7x, (m)
y,(m
)
FEM longeron delfection, T = 88.1 N
Closed form centerline, T =78.7 N
Figure 11. Closed Form Deflected Shape Compared to FEM at Max Load, 0.025 m Initial Tip Offset, 0.076 mmInitial Local Offset
American Institute of Aeronautics and Astronautics12
resolving distortions in the boom that affect its stiffness. A spreadsheet has been developed to calculate theserequirements, based on camera pixel density, optical clarity, depth of field, and target distance.
The in-flight photogrammetry takes advantage of the perspective view available along the mast centerline. Thisallows targets to be placed similarly on batten stations distributed along the length without obstructing the cameraview of outboard targets. Figure 13 shows a computer-generated perspective view down the mast from the root. Thisview illustrates a mast bowed by 7 cm at the tip, exceeding the expected worst-case bow in the actual mast. Moresevere bend may still be measured, but without the ability to accurately gauge twist since only a single target of theoutermost stations will be visible. As may be seen, all the targets are still visible from the root, and therefore may beused to indicate the relative straightness of the boom.
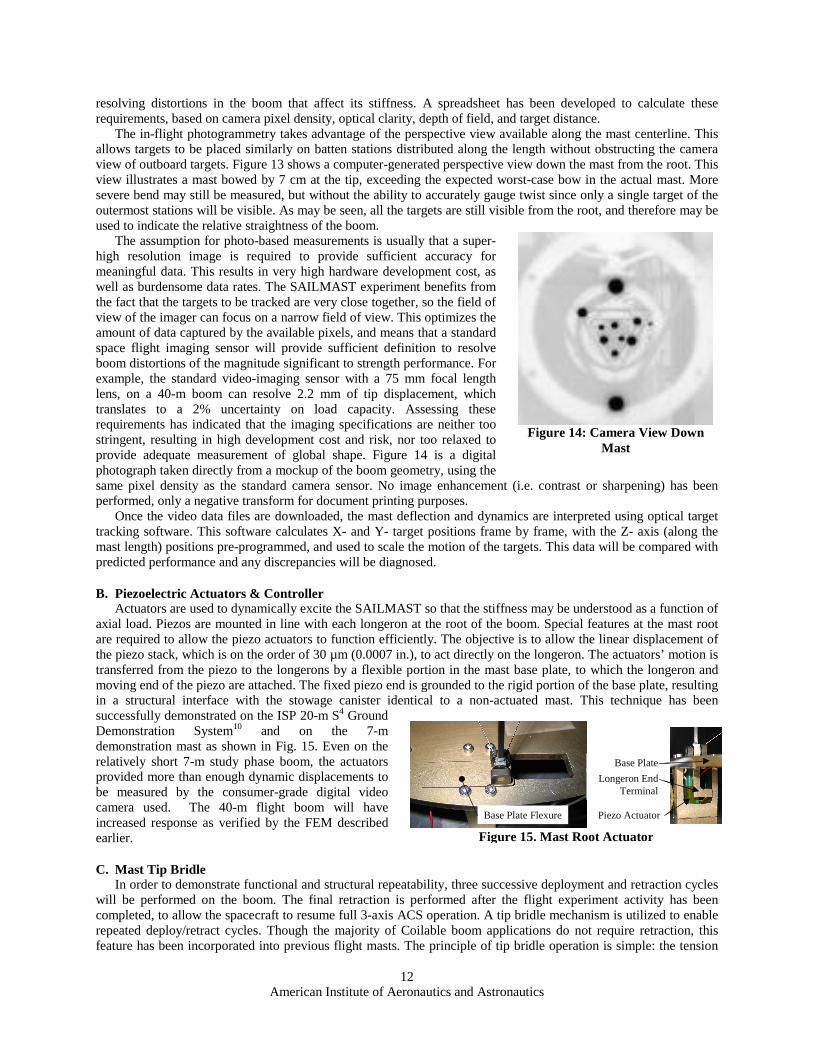
The assumption for photo-based measurements is usually that a super-high resolution image is required to provide sufficient accuracy formeaningful data. This results in very high hardware development cost, aswell as burdensome data rates. The SAILMAST experiment benefits fromthe fact that the targets to be tracked are very close together, so the field ofview of the imager can focus on a narrow field of view. This optimizes theamount of data captured by the available pixels, and means that a standardspace flight imaging sensor will provide sufficient definition to resolveboom distortions of the magnitude significant to strength performance. Forexample, the standard video-imaging sensor with a 75 mm focal lengthlens, on a 40-m boom can resolve 2.2 mm of tip displacement, whichtranslates to a 2% uncertainty on load capacity. Assessing theserequirements has indicated that the imaging specifications are neither toostringent, resulting in high development cost and risk, nor too relaxed toprovide adequate measurement of global shape. Figure 14 is a digitalphotograph taken directly from a mockup of the boom geometry, using thesame pixel density as the standard camera sensor. No image enhancement (i.e. contrast or sharpening) has beenperformed, only a negative transform for document printing purposes.
Once the video data files are downloaded, the mast deflection and dynamics are interpreted using optical targettracking software. This software calculates X- and Y- target positions frame by frame, with the Z- axis (along themast length) positions pre-programmed, and used to scale the motion of the targets. This data will be compared withpredicted performance and any discrepancies will be diagnosed.
B. Piezoelectric Actuators & ControllerActuators are used to dynamically excite the SAILMAST so that the stiffness may be understood as a function of
axial load. Piezos are mounted in line with each longeron at the root of the boom. Special features at the mast rootare required to allow the piezo actuators to function efficiently. The objective is to allow the linear displacement ofthe piezo stack, which is on the order of 30 µm (0.0007 in.), to act directly on the longeron. The actuators’ motion istransferred from the piezo to the longerons by a flexible portion in the mast base plate, to which the longeron andmoving end of the piezo are attached. The fixed piezo end is grounded to the rigid portion of the base plate, resultingin a structural interface with the stowage canister identical to a non-actuated mast. This technique has beensuccessfully demonstrated on the ISP 20-m S4 GroundDemonstration System10 and on the 7-mdemonstration mast as shown in Fig. 15. Even on therelatively short 7-m study phase boom, the actuatorsprovided more than enough dynamic displacements tobe measured by the consumer-grade digital videocamera used. The 40-m flight boom will haveincreased response as verified by the FEM describedearlier.
C. Mast Tip BridleIn order to demonstrate functional and structural repeatability, three successive deployment and retraction cycles
will be performed on the boom. The final retraction is performed after the flight experiment activity has beencompleted, to allow the spacecraft to resume full 3-axis ACS operation. A tip bridle mechanism is utilized to enablerepeated deploy/retract cycles. Though the majority of Coilable boom applications do not require retraction, thisfeature has been incorporated into previous flight masts. The principle of tip bridle operation is simple: the tension
Figure 14: Camera View DownMast
Base Plate Flexure Piezo Actuator
Longeron EndTerminal
Base Plate
Base Plate Flexure Piezo Actuator
Longeron EndTerminal
Base Plate
Figure 15. Mast Root Actuator
American Institute of Aeronautics and Astronautics13
in the deployment lanyard converted into a torque on the tip relative to the mast longerons, initiating thecharacteristic helical stowage process. A feature unique to the SAILMAST is that the tip bridle can be locked out,allowing axial loads to be applied to the mast without initiating stowage.
VI. ConclusionIn the Concept Definition Phase of the ST8 SAILMAST program, analysis tools and techniques have been
developed, correlated, and scaled to a proposed flight experiment system in order to predict on-orbit behavior, refinea notional design configuration, and verify the suitability of measurement range and accuracy to ensure a successful,informative flight experiment. The flight objectives focus on the measurement of free shape of gossamer Coilabletruss technology to correlate and validate models of the effect of global shape on stiffness and strength. Successfulflight validation is essential for risk mitigation prior to more detailed formulation of gossamer spacecraft systemsthat enable new classes of missions, such as propellantless propulsion (solar sailing), large aperture sensors, andother applications yet to be conceived. The models developed and validated by the SAILMAST effort will beinvaluable in the design and analysis of future optimized gossamer systems, whatever their scale.
AcknowledgmentsThe authors wish to recognize Toshio Fujita and John (Jack) Stocky of NASA-NMP (at JPL) for their valuable
technical and programmatic support in this effort. The work described herein was performed as part of NMP ST8Concept Definition Phase contract 1256619 through JPL.
References
1 Mclnnes, C. R., Solar Sailing: Technology, Dynamics and Mission Applications, 1st ed, Springer-Praxis. London, 1999.2 Murphy, D., Murphey, T., and Gierow, P., “Scalable Solar-Sail Subsystem Design Concept,” AIAA Journal of Spacecraft
and Rockets, Vol. 40, No. 4, pp. 539-547, July-August 2003.3 Murphy, D., and Wie, B., “Robust Thrust Control Authority for a Scalable Sailcraft,” 14th AAS/AIAA Space Flight
Mechanics Meeting, AIAA, Washington DC, 2004.4 Murphy, D., Trautt, T., McEachen, M., Messner, D., Laue, G., and Gierow, P., “Progress and Plans for System
Demonstration of a Scalable Square Solar Sail,” AAS 04-105, 14th AAS/AIAA Space Flight Mechanics Meeting, AIAA,Washington DC, 2004.
5 Murphy, D., Macy, B., and Gaspar, J., “Demonstration of a 10-m Solar Sail System,” 45th AIAA Structures, StructuralDynamics, & Materials Conference, 5
thGossamer Spacecraft Forum, Palm Springs, CA, April 19-22, 2004.
6 Timoshenko, S., Theory of Elastic Stability, McGraw-Hill, New York, 1936, pp. 31-33.7 Crawford, R.F. And Hedgepeth, J.M., “Effects of Initial Waviness on the Strength and Design of Built-up Structures,” AIAA
Journal, Vol. 13, No. 5, May 1975.8 Anderson, M. S., “Buckling of Imperfect Periodic Lattice Structures,” Proceedings of the Symposium, London, England,.,
Cambridge University Press, Cambridge and New York, 1983, p. 209-219.9 Ridenoure, R.., "RocketCamTM Systems for Providing Space Situational Awareness on Rockets, Spacecraft and Other
Remote Platforms," SPIE Defense & Security Conference, Proceedings of SPIE Vol. 5418, 2004, pp.94-103.10 Murphy, D., McEachen, M., Macy, B., and Gaspar, J., “Demonstration of a 20-m Solar Sail System,” 46
thAIAA Structures,
Structural Dynamics, & Materials Conference, 6th
Gossamer Spacecraft Forum, AIAA, Washington DC, 2005.