the russian transport infrastructure -...
TRANSCRIPT

Innovative Logistics Consultancy �
Solutions for Your Success
The Russian Transport InfrastructureLogistical Considerations
Moscow, 31st of March 2009

© TransCare AG 2
The Russian Transport Infrastructure � Logistical Considerations
1. Introduction
2. Key transport bottlenecks and how to tackle them
3. Rail network challenges
4. Analysis of port costs and challenges for optimal efficiency
5. Optimization of rail transport concepts
Content

3© TransCare AG
TransCare Facts
1. Introduction
Profile: Management consultancy forlogistics and transportation
Foundation: 1993
Specialisation: Raising efficiency in logistics process chains
1) Rail transport
2) Supply chain management
3) Process-oriented infrastructure planning
Approach: Pragmatic concepts delivering tangible economic rewards
Facts: > 1.000 successful projects with more than 250 customers
Team: 60 international experts in Germany, Russia, India and Spain

4© TransCare AG
TransCare References - Abstract
1. Introduction
Industries PortsLogisticsProviders

5© TransCare AG
Full Cost Structures for Steam Coal Deliveries to ARA 2007in US dollars/t
1. Introduction
With an average share of logistics costs of 63.5 % coal business is logistics business
0
20
40
60
80
100
Australia China Indonesia Russia S.Africa Colombia
54 % 76 % 64 % 66 % 59 % 63 %
Source: Global Insight, London 2008
x % Share logistics costs
Other mine costs
Wages
Royalties / Levies
Profit & ROC
Port & Rail Costs
Average Sea Freight Rates

© TransCare AG 6
The Russian Transport Infrastructure � Logistical Considerations
1. Introduction
2. Key transport bottlenecks and how to tackle them
3. Rail network challenges
4. Analysis of port costs and challenges for optimal efficiency
5. Optimization of rail transport concepts
Content

7© TransCare AG
Expected growth rates of 3 % in coal exports from Russia lead tochallenges in the whole supply chain.
Source: German Coal Importer Federation, Annual report 2008
Overview of Coal Transport Flows in Russia 2007
2. Key transport bottlenecks and how to tackle them
Total mined coal: 314 mln t
Total exported coal: 93 mln t
Exported via ports: 78 mln t
30%
11%
Far East Basin19 mln t
North West Basin43 mln t
South Basin16 mln t
Exported overland5 mln t
Exported to CIS10 mln t
55%
21%
24%
5%
84%
Coal mining regions
Transport nodes Main Coal Ports

8© TransCare AG
Approaches to Handle Forecasted Volumes
2. Key transport bottlenecks and how to tackle them
An integrated solution using several approaches leads to logistics excellence
Port Infrastructure Rail Infrastructure Rolling Stock
� Layout of port facilities
� Floating cranes
� Conveyor systems
� Axle load
� Passing lanes
� New lines
� Net-to-tare ratio
� (Un-)/loading techniques

© TransCare AG 9
The Russian Transport Infrastructure � Logistical Considerations
1. Introduction
2. Key transport bottlenecks and how to tackle them
3. Rail network challenges
4. Analysis of port costs and challenges for optimal efficiency
5. Optimization of rail transport concepts
Content

10© TransCare AG
Novorossiysk
Rostov/D.
Murmansk
St.Petersburg
Krasnoyarsk Khabarovsk
Vanino
Vostochny
Chita
Novosibirsk
Ekaterinb.
Archangelsk
VorkutaN. Urengoy
U-Ude
Moscow
Kazakhstan
Western
Mongolia
Tuapse
UA Ports
Tyumen
Omsk
Ust Luga
Komsomolsk Amur
Russian Railways Network and Investment Activities
2. Key transport bottlenecks and how to tackle them
Russian Railways infrastructure investment program amounts to US $55,5 bln in period 2008-2030.
Coal mining regions
Transport nodes Main Coal Ports
Investment focus

11© TransCare AG
Novorossiysk
Rostov/D.
Murmansk
St.Petersburg
Krasnoyarsk Khabarovsk
Vanino
Vostochny
Chita
Novosibirsk
Ekaterinb.
Archangelsk
VorkutaN. Urengoy
U-Ude
Moscow
Kazakhstan
Western
Mongolia
Tuapse
UA Ports
Tyumen
Omsk
Ust Luga
Komsomolsk Amur
Focus on Investment Activities I
3. Rail network challenges
I Hinterland connection Novorossysk/Tuapse
� New rail lines
� Modernization of existing rail lines
II Hinterland connection Ust-Luga
� New rail connection Ust-Luga / St. Petersburg
III Connectivity North Ural to Northwest ports
� New rail connection N. Urengoy - Vorkuta
Novorossiysk
Rostov/D.
Murmansk
St.Petersburg
Krasnoyarsk Khabarovsk
Vanino
Vostochny
Chita
Novosibirsk
Ekaterinb.
Archangelsk
VorkutaN. Urengoy
U-Ude
Moscow
Kazakhstan
Western
Mongolia
Tuapse
UA Ports
Tyumen
Omsk
Ust Luga
Komsomolsk Amur
Novorossiysk
Rostov/D.
Murmansk
St.Petersburg
Krasnoyarsk Khabarovsk
Vanino
Vostochny
Chita
Novosibirsk
Ekaterinb.
Archangelsk
VorkutaN. Urengoy
U-Ude
Moscow
Kazakhstan
Western
Mongolia
Tuapse
UA Ports
Tyumen
Omsk
Ust Luga
Komsomolsk Amur
Back-up

12© TransCare AG
Focus on Investment Activities II
3. Rail network challenges
IV Capacity extension in Siberia
� Modernization of existing rail lines
� Extension of existing rail lines
V Hinterland connection Vanino
� Construction of new rail line and tunnelplanned (Old route: 37,6 km, new route: 27 km)
� Capacity extension Kmsomolsk-na-Amure - Vanino
Novorossiysk
Rostov/D.
Murmansk
St.Petersburg
Krasnoyarsk Khabarovsk
Vanino
Vostochny
Chita
Novosibirsk
Ekaterinb.
Archangelsk
VorkutaN. Urengoy
U-Ude
Moscow
Kazakhstan
Western
Mongolia
Tuapse
UA Ports
Tyumen
Omsk
Ust Luga
Komsomolsk Amur
Novorossiysk
Rostov/D.
Murmansk
St.Petersburg
Krasnoyarsk Khabarovsk
Vanino
Vostochny
Chita
Novosibirsk
Ekaterinb.
Archangelsk
VorkutaN. Urengoy
U-Ude
Moscow
Kazakhstan
Western
Mongolia
Tuapse
UA Ports
Tyumen
Omsk
Ust Luga
Komsomolsk Amur
Back-up

13© TransCare AG
Comparison of Rail Infrastructure Investments
3. Rail network challenges
0
1.000
2.000
3.000
4.000
5.000
6.000
7.000
8.000
9.000
0
100
200
300
400
500
600
700
Total annual investments[US $ mln]
Investments per track-km[US $ ths]
Source: German transport infrastructure investment program (BVWP), Spanish transport infrastructureinvestment program (PEIT), OAO RZD Investment Program 2008-2030
Planned rail infrastructure investments are insufficient compared to other countries
Germany Spain RussiaTotal annual investment Investment per track-km

© TransCare AG 14
The Russian Transport Infrastructure � Logistical Considerations
1. Introduction
2. Key transport bottlenecks and how to tackle them
3. Rail network challenges
4. Analysis of port costs and challenges for optimal efficiency
5. Optimization of rail transport concepts
Content

15© TransCare AG 15
Overview: Port Handling Costs for Coal Worldwidein US $/t
4. Analysis of port costs and challenges for optimal efficiency
The worldwide benchmark for coal loading/unloading is about 2-3 US dollars/t, Russian ports are far above
Abbot Point [2,10]DalrympleBay [2,20]
Gladstone [2,50]Kooragang [2,40]
Black SeaYuzhny [3,00]Tuapse [4,00]
Tanah Bara [1,40]
Balikpapan [1,90]
Puerto Bolivar [2,80]
Vostochny [10,50]
Murmansk [4,50]
Vanino [6,50]
Baltic SeaVentspils [9,40]*Riga [8,00]*Tallin [6,50]*St.Petersburg [5,20]Vysotsk [5,20]Ust-Luga [6,5]
Main Coal Ports
Richards Bay [2,00]
Paradeep [4,40]
Ennore [4,80]
Rotterdam [2,00]
*including rail transit
16© TransCare AG 16
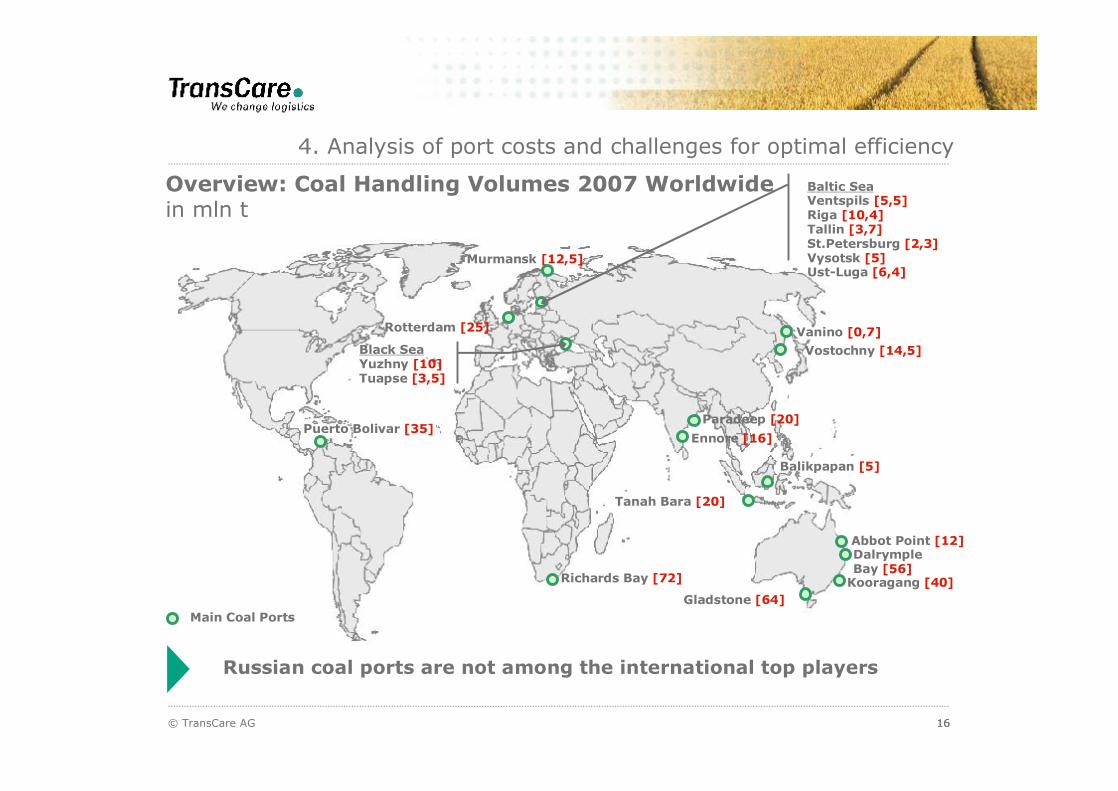
Overview: Coal Handling Volumes 2007 Worldwidein mln t
4. Analysis of port costs and challenges for optimal efficiency
Russian coal ports are not among the international top players
Abbot Point [12]DalrympleBay [56]
Gladstone [64]Kooragang [40]
Black SeaYuzhny [10]Tuapse [3,5]
Tanah Bara [20]
Balikpapan [5]
Puerto Bolivar [35]
Vostochny [14,5]
Murmansk [12,5]
Vanino [0,7]
Baltic SeaVentspils [5,5]Riga [10,4]Tallin [3,7]St.Petersburg [2,3]Vysotsk [5]Ust-Luga [6,4]
Main Coal Ports
Richards Bay [72]
Paradeep [20]
Ennore [16]
Rotterdam [25]

17© TransCare AG
Correlation Volume/Handling Costs
4. Analysis of port costs and challenges for optimal efficiency
Russian handling costs cannot be justified by economies of scale
0
10
20
30
40
50
60
70
80
Abbot
Point
Dalrym
ple B
ay
Koora
gang
Gladsto
ne
Parade
ep
Ennor
e
Richar
ds B
ay
Tanah
Bara
Balikp
apan
Puerto
Boli
var
Rotterd
am
Vanino
Vosto
chny
Mur
man
sk
Vysot
sk
St. Peter
sburg
Ust Lu
ga
Tuapse
Yuzhny
0
2
4
6
8
10
12
Australia India Other Russia/Ukraine
NW BasinFE Basin S Basin
Volume [mln t] Handling costs[US $/t]
cost-price corridor
18© TransCare AG
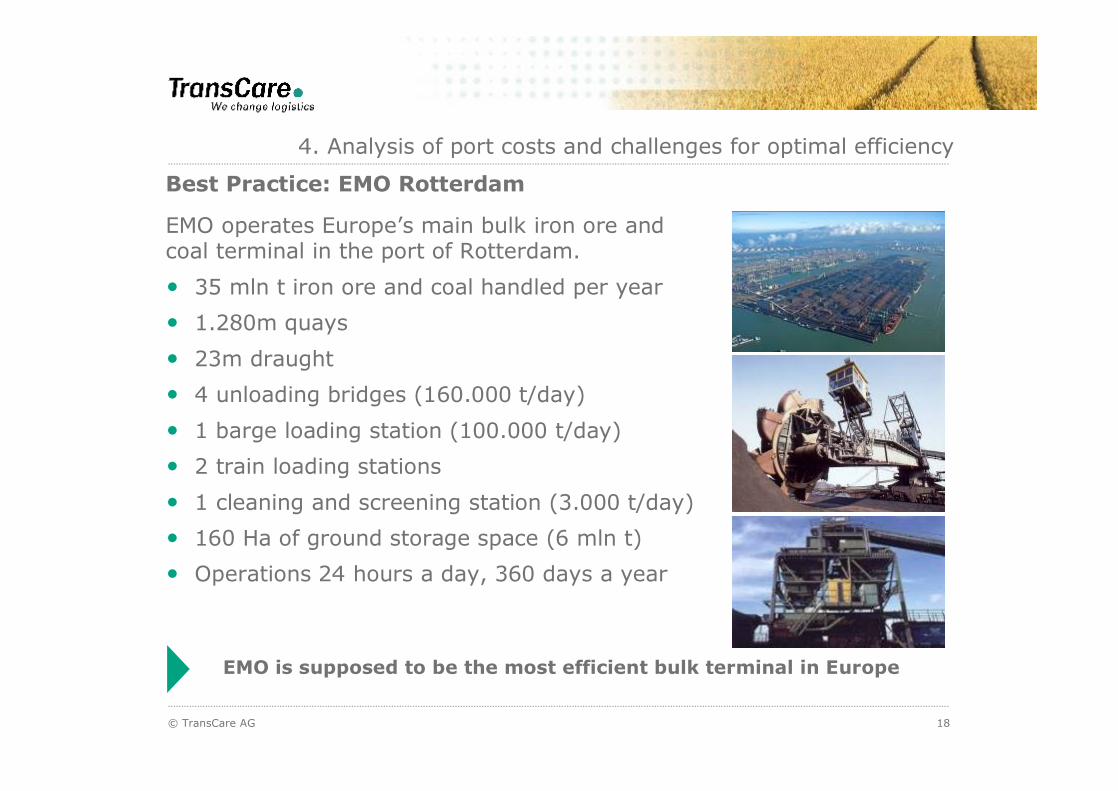
EMO operates Europe�s main bulk iron ore and coal terminal in the port of Rotterdam.
� 35 mln t iron ore and coal handled per year
� 1.280m quays
� 23m draught
� 4 unloading bridges (160.000 t/day)
� 1 barge loading station (100.000 t/day)
� 2 train loading stations
� 1 cleaning and screening station (3.000 t/day)
� 160 Ha of ground storage space (6 mln t)
� Operations 24 hours a day, 360 days a year
Best Practice: EMO Rotterdam
4. Analysis of port costs and challenges for optimal efficiency
EMO is supposed to be the most efficient bulk terminal in Europe

19© TransCare AG
� Loading
Track hoppers for wagon unloading
Stackers
Re-claimers
Ship loaders
� Unloading Conveyor system
Shore-based gantry type grabs
Mobile hoppers
Mechanized wagon loading equipment
19
State-of-the-Art Techniques
4. Analysis of port costs and challenges for optimal efficiency
Mechanized coal handling leads to increased productivity and decreases spillage of coal

© TransCare AG 20
The Russian Transport Infrastructure � Logistical Considerations
1. Introduction
2. Key transport bottlenecks and how to tackle them
3. Rail network challenges
4. Analysis of port costs and challenges for optimal efficiency
5. Optimization of rail transport concepts
Content

21© TransCare AG
Benchmarking
5. Optimization of rail transport concepts
Germany Poland Russia India Australia*
Max. trainlength [m]
Averagespeed [km/h]
The technical framework for rail transport in Russia is quite good, but there are problems in operations
Max. Axleload [t]
700 600 1.050 680 2.500
35-40 30-35 10-15 20-25 n.a.
22,5 20 22,5 22,5 40
*Fortescue Metals Group railway line in Pilbara region

22© TransCare AG
� Construction of dedicated railway line for260km iron ore transport in the Pilbara region
Investment: 1,6 bln US dollars
Axle load: 40t
3 passing loops (each 3km length)
Eight bridges
� Optimized operations
2.5km long trains with 240 wagons (23t tare weight,137t carrying capacity)
2 GE Dash 9-4400CW diesel locomotives
Trainloads of ca. 30.000 t
Train unloading with a twin-cell rotary dumper (80 wagons per hour)
Best Practice: Fortescue Metals Group
5. Optimization of rail transport concepts
Fortescue Metals Group sets the benchmark for further dedicated lines by integrating all necessary components for efficient railtransport

23© TransCare AG
Source: OAO RZD Tariff - average (2009)
0
5
10
15
20
25
30
35
40
45
0 1.000 2.000 3.000 4.000 5.000
Distance [km]
Rail Tariffs for Main Bulk Transport Flows*in US $/t
5. Optimization of rail transport concepts
Macro-level analysis indicates that Russian rail tariffs are much higher than European ones, but still below Indian tariffs
India
Eastern Europe
Russia
* Transport Flows with >500.000 t/year (Iron ore, coal, cement)
Source: TransCare Projects
Western Europe

24© TransCare AG
0
2
4
6
8
10
12
14
0 200 400 600 800 1.000
Distance [km]
Rail Tariffs for Main Bulk Transport Flows*in US dollars/t
5. Optimization of rail transport concepts
Russian rail tariffs are ca. US $2/t higher than in Eastern Europe and US $ 4/t than in Western Europe
* Transport Flows with >500.000 t/year (Iron ore, coal, cement)
Source: TransCare Projects
Eastern Europe
Russia
Western Europe

25© TransCare AG
Train Length and Weight
5. Optimization of rail transport concepts
Max. train weight [t]
Max. trainlength [m]
Upgradelocomotive
Expand train length
4.500
1.050
1
3
2
Increaseaxle load
Restrictions
1 Limited by loco power, brakes, etc.
2 Limited by infra-structure (signaling, passing lanes, etc.)
3 Limited by axle load
useable non-useable optimization approach
Optimization of train length and weight requires high investments and cannot be done in short term period
26© TransCare AG
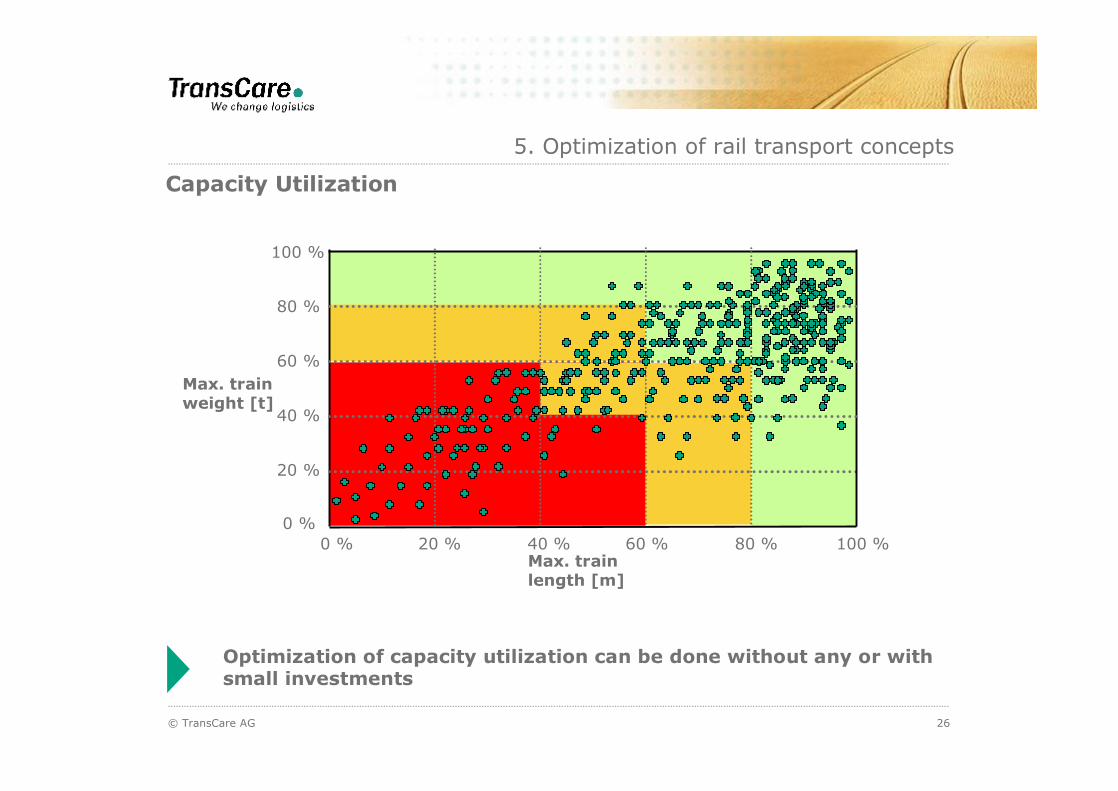
Capacity Utilization
5. Optimization of rail transport concepts
Max. train weight [t]
Max. trainlength [m]
0 %
20 %
40 %
60 %
80 %
100 %
0 % 20 % 40 % 60 % 80 % 100 %
Optimization of capacity utilization can be done without any or with small investments

27© TransCare AG
Comparison Railcars
5. Optimization of rail transport concepts
Tare weight[t]
Max. GrossRail Load [t]
Auto Flood III
Max. CarryingCapacity [t]
Net-to-Tareratio
Length [m]
Max. AxleLoad [t]
Height [m]
22,4
129,8
107,4
4,8
16,2
32,45
4,06
25,5
90
64,5
2,52
13,29
22,5
4,0
Falns
24,0
100
76
3,17
12,1
25,0
3,95
Poluwagon

28© TransCare AG
5. Optimization of rail transport concepts
Overview State-of-the-Art Railcars
Aluminium Quad Hopper BethGon II Tripple Hopper
Auto Flood II Auto Flood III
Source: Freightcar America

29© TransCare AG
Thank you for your attention