the conceptdownload.microsoft.com/documents/hk/technet/techdays2014...rules for good data 1. each...
TRANSCRIPT

The concept

The Process
Get data
Clean
Summarize
Analyze
Take Action
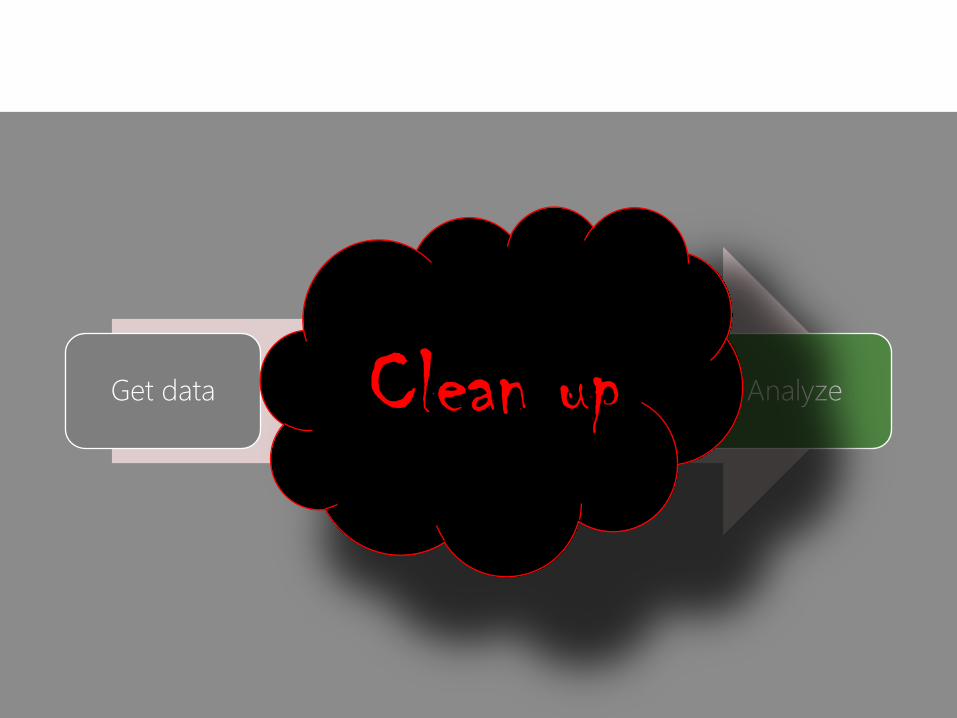
Get data Analyze Clean up
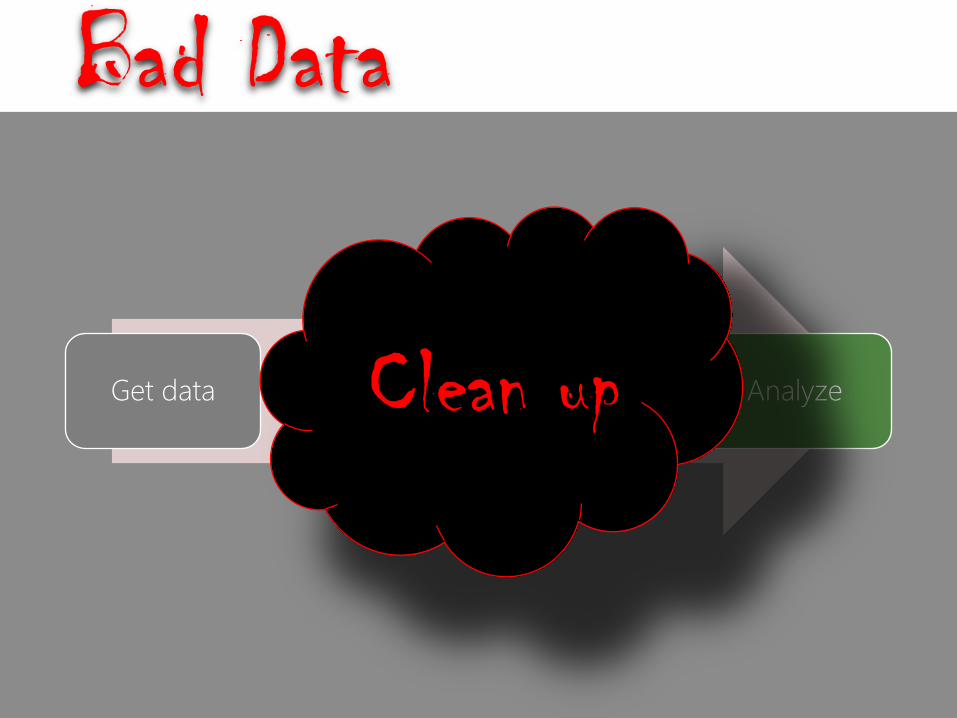
Bad Data
Get data Analyze Clean up

Get data Analyze

Bad Data 34059812

Flash Fill – Amazing new feature

Power Query even more Amazing

Good format = Tabular data
Heading
Data
Data
Data
Data

Good Data

Bad Data

Rules for Good data
1. Each column must have a heading
2. No blank headings
3. No duplicate headings
4. No formulas in headings
5. No merged cells
6. Only one meaning in each column
7. Same data type in a column

Headings contain data!
Heading
has data

Good data

Sheet names should go into a column

Multiple levels in one column

The right way

Cross Tab = Two tables in one

Multiple blocks of crosstab data

Good data behind the crosstab

Multiple Consolidation Ranges option


Add all data blocks

Consolidated Pivot Table

Double click on the Grand Total

Bad data >> Good data

The process
If bad
Demand in
good format
Clean up
smartly
Get data Check it If good,
continue

Export to Excel – Rewrite the code
1. Normalized data
2. Query
3. Denormalized Recordset
4. Report Writer
5. Generate Report Export to

The process
Think
Find
Interpret Act
Reuse

Visualizing Data

Visualizing Data

Visualizing Data

Management Dashboard

Icon Sets

Convert data to Table

Benefits of Excel Tables
1. AutoRefresh formula and other references
2. Auto copy column based calculations
3. Auto copy calculated columns
4. Automatic header after scrolling
5. Simpler formulas
6. Automatic copy of formatting
7. Automatic formatting
8. One time SharePoint upload
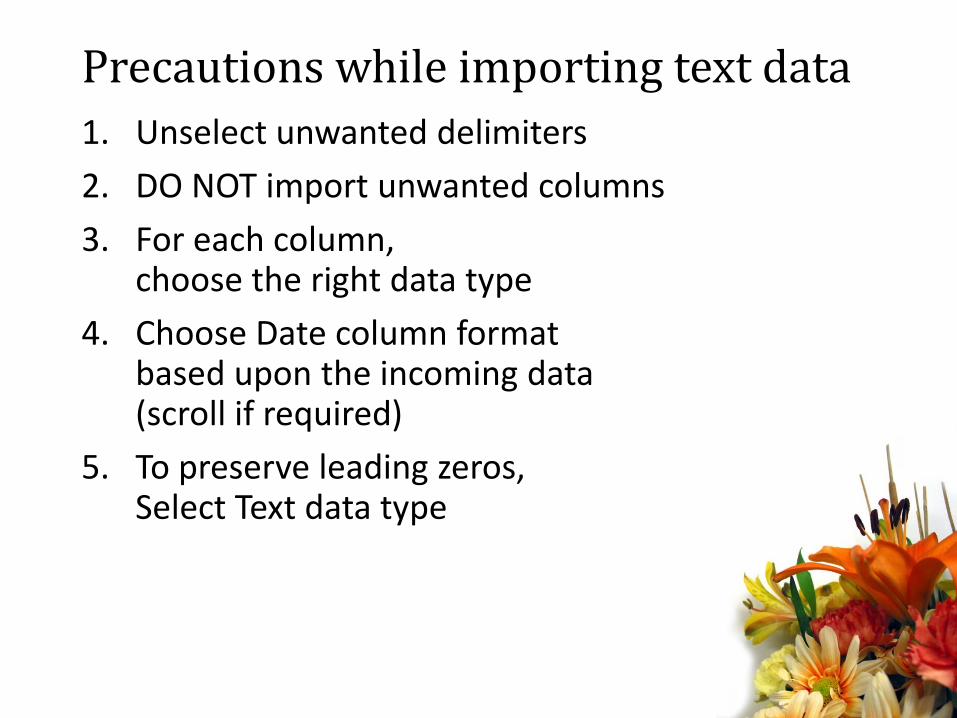
Precautions while importing text data
1. Unselect unwanted delimiters
2. DO NOT import unwanted columns
3. For each column, choose the right data type
4. Choose Date column format based upon the incoming data (scroll if required)
5. To preserve leading zeros, Select Text data type

NEVER import CSV files.
Rename them to TXT before
importing.
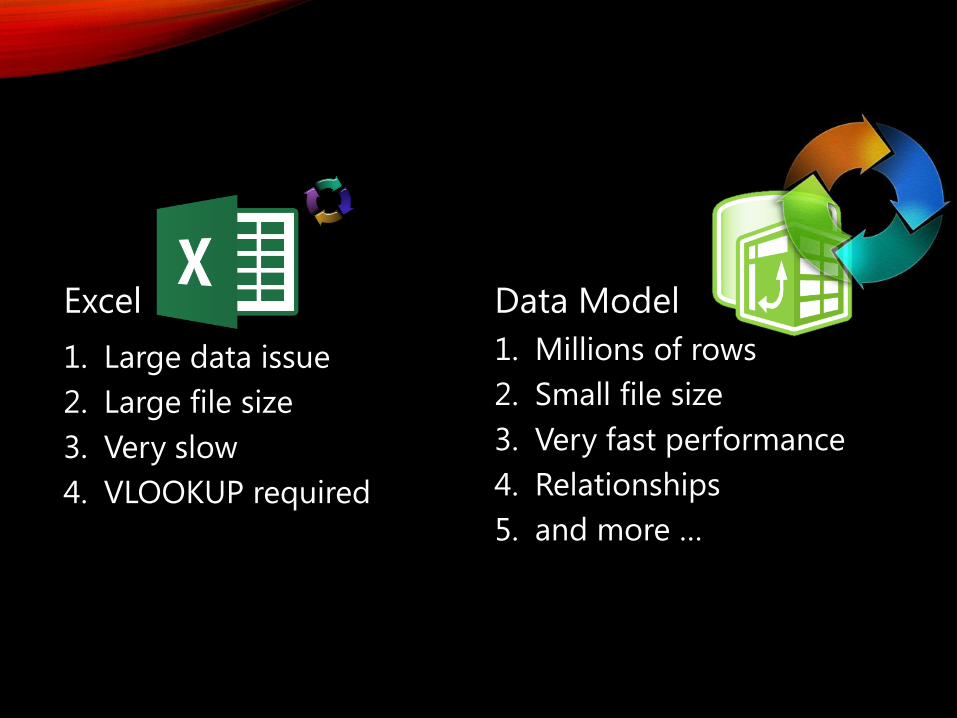
Excel
1. Large data issue
2. Large file size
3. Very slow
4. VLOOKUP required
Data Model
1. Millions of rows
2. Small file size
3. Very fast performance
4. Relationships
5. and more …

Power BI at a glance
Data Model
Power Query
Power View
Power Map
Power Pivot

Standard reports
•Every type of data generates some reports
•But how many?
•Few – based upon statutory requirements or internal norms
•Each report is gives a different insight
•Everyone knows how to interpret it
•Some create reports, some interpret
•Life goes on … but that is just sustenance

Going beyond standard reports
•The insights which you don’t notice are lost opportunities
•What do we miss these?
•Because nobody asked for that report!
•That is where you can add value
•Now you have the awareness as well as the capability
•Finding what others don’t know is called Business Intelligence!

Incentives for Insights
•Many organizations give rewards to any employee who suggests improvements
•Why not provide incentives for anyone who unearths new, useful and actionable information from data?
•“Incentives for Insights”

Delivering data to users
• Data Connection Libraries
• SharePoint Lists
• Business Connectivity Services
• PowerPivot Data Source

What to use when?
Scenario Appropriate Tool
Simple, small data Pivot Table
Large data, Vlookup,
Performance Issue Power Pivot, Power View
Data from multiple sources Power Pivot, Power View
Data from DW Power Pivot, Power View
Data from LOB systems BCS, SharePoint Data
Connection, Power BI
Geographical information Power Map
Dashboards Excel Services, Power BI
CSV type dumps SharePoint List / BCS /
DConn

When use Traditional BI
• Security trimming
• Very large data processing
• Scalability
• Partitioning


ios (version 6 or below):
Please input the below URL:
http://aka.ms/OFC292
Other platform:
QR Code:


[email protected] Instant Efficiency by Dr Nitin @drnitinp Blog: efficiency365.wordpress.com Free Videos: http://sdrv.ms/nsp125