the roles of purchasing and supply management in...
TRANSCRIPT

The roles of purchasing and
supply management in increasing
speed and efficiency
Prof. Ir. I Nyoman Pujawan, M.Eng, Ph.D, CSCP Professor of Supply Chain Engineering
Kepala Laboratorium Logistics & Supply Chain Management
Institut Teknologi Sepuluh Nopember E-mail: [email protected]
Supply Chain Summit, Bali 24 Juni 2014
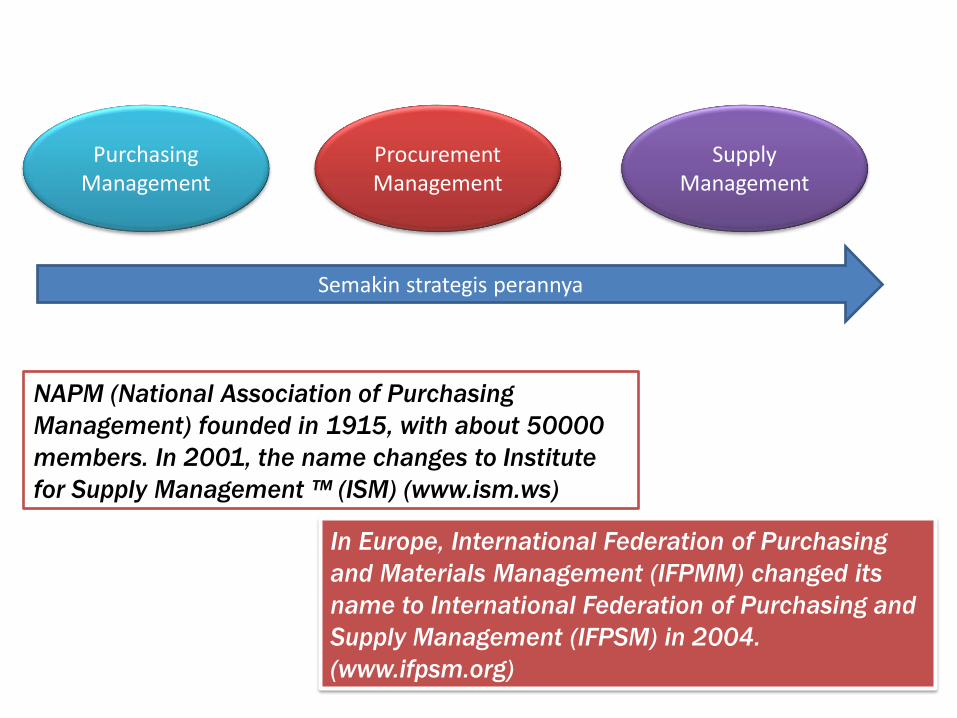
NAPM (National Association of Purchasing
Management) founded in 1915, with about 50000
members. In 2001, the name changes to Institute
for Supply Management ™ (ISM) (www.ism.ws)
In Europe, International Federation of Purchasing
and Materials Management (IFPMM) changed its
name to International Federation of Purchasing and
Supply Management (IFPSM) in 2004.
(www.ifpsm.org)
Purchasing Management
Procurement Management
Supply Management
Semakin strategis perannya

Posisi CPO Relatif Terhadap CEO: Supply Management is becoming more strategic
0
57,14
23,81
9,52
9,52
0 10 20 30 40 50 60
1 level
2 levels
3 levels
4 levels
5 levels
21 respondents of American Utility Industry, 2009
Rata-rata 2.71 level di bawah CEO, dan rata-rata 3.9 level dari layer terbawah SME ke CPO. Di industri aerospace dan defense (26 sample), angka pertama adalah 2.23

From Tactical to Strategic Buying: Bethlehem Steel’s Evolution
Market knowledge Supply base management Commodity strategy Risk management Sourcing strategy Supplier capability assessment Strategic negotiation Supplier selection Supplier development Establish performance metrics Commercial (tactical) negotiation Supplier performance evaluation/reporting Order processing
Tactical
Strategic

Almost 50% SME perform strategic functions (CAPS Survey, 2009)
Industry SME as % of
Total Employees
Strategic
SME (%)
Operational
SME (%)
Aerospace / Defense 3.53 21.43 78.57
Chemical 1.56 45.52 54.48
Computer Software 0.61 58.96 41.04
Beverage & Foods 0.42 77.90 22.1
Electronics 2.89 34.19 65.81
Engineering / Construction 4.06 25.96 74.04
Industrial Manufacturing 0.95 45.85 54.15
Metals / Mining 1.54 40.12 59.88
Petroleum 2.93 32.00 68
Pharmaceutical 0.90 50.90 49.1
Semiconductor 0.92 36.58 63.42
Avarage 1.85 42.67 57.33

At Chevron, there will be a focus on an increased emphasis on the strategic rather than the tactical aspects of procurement (procurement transaction processes will be automated and/or outsourced).
Increased integration of suppliers into the business (integrated work processes, standardized
specifications, shared equity arrangements) is a goal of ours. ...........
(Helmut F. Porkert is chief procurement officer of the global procurement organization at Chevron
Corporation – Interview with Journal of SCM).

Procurement Strategies

Typical Supplier Portfolio Model

Strategi Pengadaan
• Gunakan waktu lebih banyak untuk yang strategis
• Minimalkan waktu / simplifikasi proses untuk yang non-critical (p-card, blanket order, etc.)
• Pelihara bargaining position untuk leverage
• Geser posisi untuk bottleneck (misalnya melalui kolaborasi horizontal)

Petroleum Industry Benchmark (Involving 22 global companies, CAPS 2010)
• Percent of managed spend through stand alone purchase orders 28.81% (Max. 67.81%)
• Percent of managed spend through blanket agreements / long-term contracts 59.45% (max. 95.41%)
• Percent of spend through procurement cards 0.97% (Max. 4.97%)
• Percent of active suppliers that account for 80% of spend 4.64%
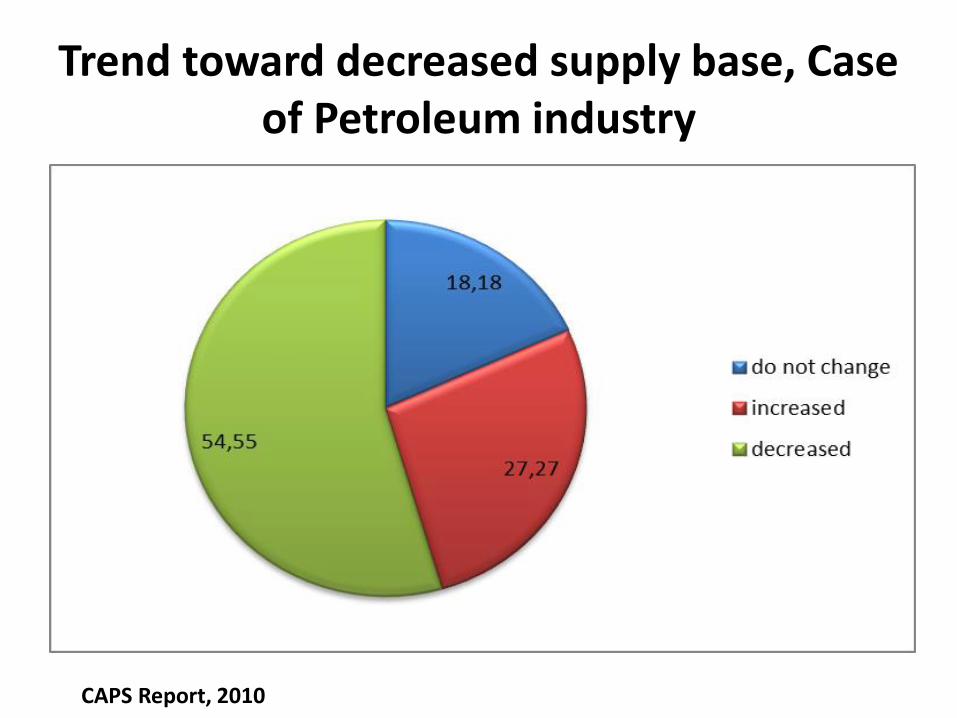
Trend toward decreased supply base, Case of Petroleum industry
CAPS Report, 2010

Relationships with Suppliers
• During the past 5 years, percent of long-term contracts that were awarded to single-source suppliers 24.83% (max. 70%)
• During the past 5 years, percent of long-term contracts that were awarded to sole-source suppliers 21.42% (max. 70%)
• During the past 5 years, percent of long-term contracts that were competitively bid 60.84% (max. 100%)

Pembelian Kuas, 2011
Part No Deskripsi Supplier Nilai (Rp) # PO 1 KUAS -- KUAS-CAT-3IN -- GENERAL 21.900.510 104
2 KUAS -- KUAS-CAT-2IN -- GENERAL
5.318.550 46
3 KUAS ROLL -- KUAS-ROLL-5IN -- GENERAL
10.896.660 45
4
KUAS -- KUAS-CAT-4IN. PROSES SPPBC --
GENERAL
4.179.280 40
5 KUAS ROLL -- KUAS-ROLL-7IN -- GENERAL
9.271.550 36
6 KUAS -- KUAS-CAT-2,5IN -- GENERAL
2.057.680 17
7 KUAS -- KUAS-CAT-1,5IN -- GENERAL
1.294.820 12
8 KUAS ROLL -- KUAS-ROLL-4IN -- GENERAL
2.136.600 10
9
KUAS -- KUAS-CAT-1IN **** SPPBC **** --
GENTOOL
1.392.300 9
10 KUAS -- KUAS-CAT-5IN -- GENTOOL
351.400 3
58.799.350 322 13

Jumlah Item per PO: Kasus 1 PT A
7075
1147
445 285 169 148 113 94 79 77 229
JUM
LAH
1
JUM
LAH
2
JUM
LAH
3
JUM
LAH
4
JUM
LAH
5
JUM
LAH
6
JUM
LAH
7
JUM
LAH
8
JUM
LAH
9
JUM
LAH
10
JUM
LAH
>10
Grafik di samping menunjukkan jumlah item per PO untuk tahun 2011. Sekitar 72% PO hanya memuat satu item. Perlu upaya meningkatkan jumlah item per PO. Single item
72% (7,075)
Multi item 28% (2,786)
Total PO 2011 (9,861 PO)
14

Level Konsolidasi Pengadaan yang Bagus: PT B
0
100
200
300
400
500
600
700
1 4 7 10 13 16 19 22 25 28 31 34 37 40 43 46 49 52 55 58 62 66 69 73 76 80 84 90 99 106 116 128 136 156 184 335
Sampel diambil dari data tahun 2011. Hanya sekitar 26% dari PO yang ada hanya
mengandung satu item. Bahkan ada sekitar 4% PO yang mengandung lebih dari 50 item.
Rata-rata 11,3 item per PO

Internal Integration

Aliran Barang & Informasi dalam Kegiatan Perawatan
OPERATIONS
KEGIATAN MAINTENANCE
MAINTENANCE PLANNING
MATERIALS PLANNING
PROCUREMENT
SUPPLIER / AGENT
GUDANG
OEM

Beberapa Pendekatan Supply Chain
OPERATIONS
KEGIATAN MAINTENANCE
MAINTENANCE PLANNING
MATERIALS PLANNING
PROCUREMENT
SUPPLIER / AGENT
GUDANG
OEM
Pemahaman yang lebih baik tentang perilaku peralatan
Integrasi antar fungsi lebih solid
Penggunaan data lebih efektif untuk perencanaan
Pengembangan supplier lokal
Hubungan dengan supplier lebih kolaboratif
Memperpendek siklus dari PR ke PO
Pemahaman tentang interchangeability
Integrasi data gudang untuk rutin, shutdown, maupun ex-project
Data recording usage dan lead time lebih akurat
Upaya pemendekan lead time pengiriman
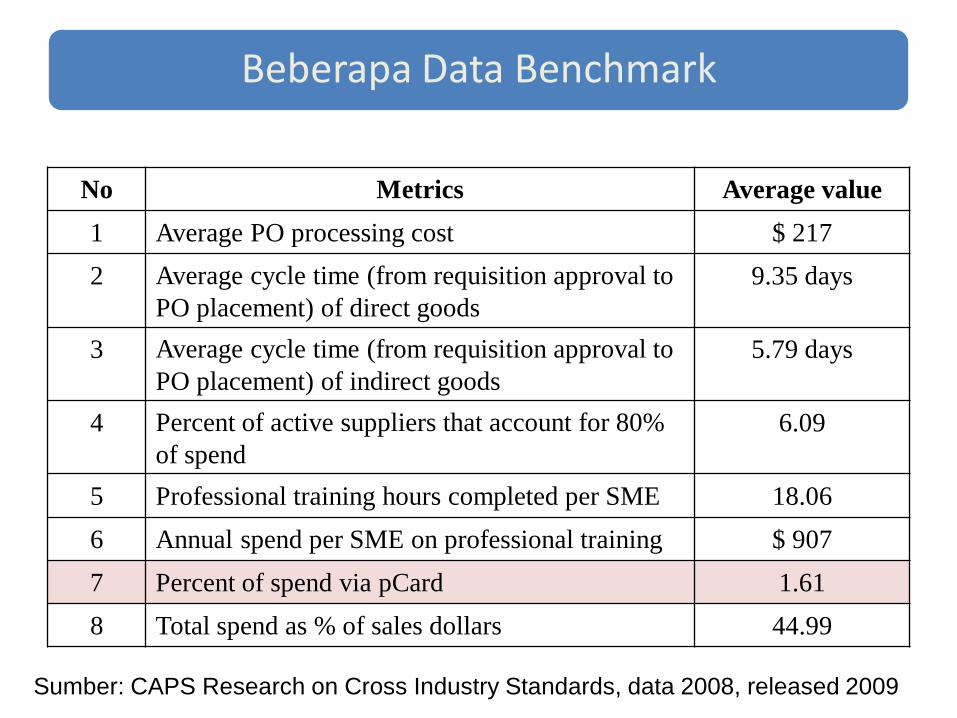
Beberapa Data Benchmark
No Metrics Average value
1 Average PO processing cost $ 217
2 Average cycle time (from requisition approval to
PO placement) of direct goods
9.35 days
3 Average cycle time (from requisition approval to
PO placement) of indirect goods
5.79 days
4 Percent of active suppliers that account for 80%
of spend
6.09
5 Professional training hours completed per SME 18.06
6 Annual spend per SME on professional training $ 907
7 Percent of spend via pCard 1.61
8 Total spend as % of sales dollars 44.99
Sumber: CAPS Research on Cross Industry Standards, data 2008, released 2009
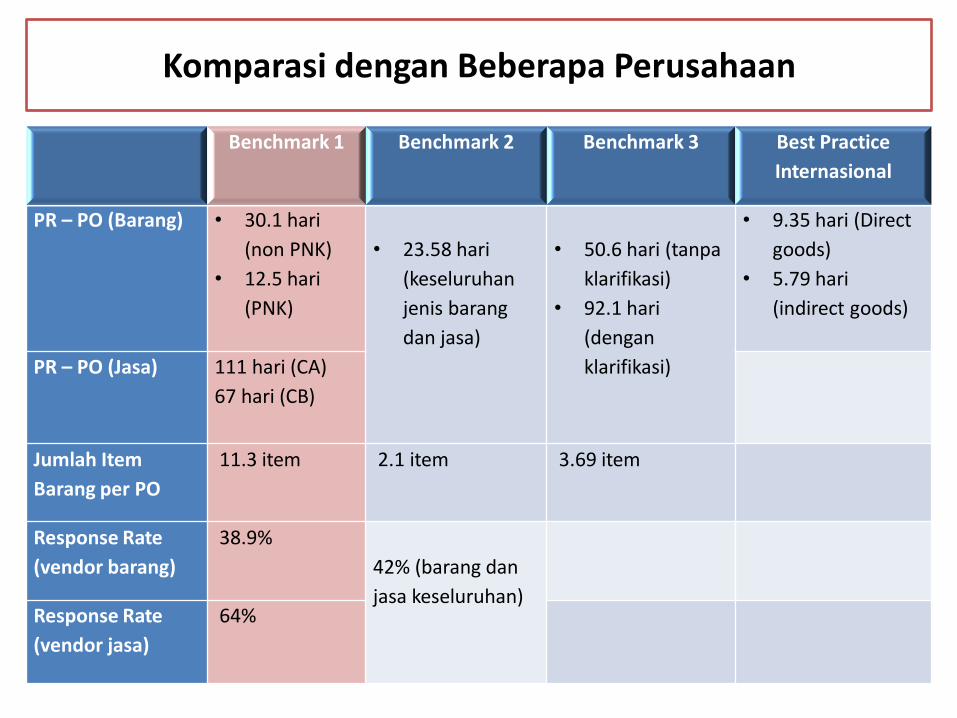
Komparasi dengan Beberapa Perusahaan
Benchmark 1 Benchmark 2 Benchmark 3 Best Practice
Internasional
PR – PO (Barang) • 30.1 hari
(non PNK)
• 12.5 hari
(PNK)
• 23.58 hari
(keseluruhan
jenis barang
dan jasa)
• 50.6 hari (tanpa
klarifikasi)
• 92.1 hari
(dengan
klarifikasi)
• 9.35 hari (Direct
goods)
• 5.79 hari
(indirect goods)
PR – PO (Jasa) 111 hari (CA)
67 hari (CB)
Jumlah Item
Barang per PO
11.3 item 2.1 item 3.69 item
Response Rate
(vendor barang)
38.9%
42% (barang dan
jasa keseluruhan)
Response Rate
(vendor jasa)
64%

Terima Kasih