the role of the liquid chromatography-mass...
TRANSCRIPT

Dow
nloa
ded
By:
[Can
adia
n R
esea
rch
Kno
wle
dge
Net
wor
k] A
t: 01
:54
8 Ju
ly 2
008
Critical Reviews in Analytical Chemistry, 38:93–117, 2008Copyright c© Taylor and Francis Group, LLCISSN: 1040-8347 print / 1547-6510 onlineDOI: 10.1080/10408340801922250
The Role of the Liquid Chromatography-MassSpectrometry in Pesticide ResidueDetermination in Food
Carla Soler, Jordi Manes, and Yolanda PicoLaboratori de Bromatologia i Toxicologia, Facultat de Farmacia, Universitat de Valencia,Valencia, Spain
The use of liquid chromatography (LC) in pesticide residue determination was usually limited togroups of compounds or single compounds for which no suitable gas chromatographic (GC) conditionswere available. However, recent developments have significantly enlarged the LC scope in this fieldof analysis. One of the most important advances was the on-line coupling of efficient LC separationwith mass spectrometry detectors (LC-MS and LC-MS/MS) that makes this technique an excellentmethod for the determination of pesticides and their transformation products in complex matricessuch as food. This review considers the application of LC-MS/MS in this field. Emphasis is placed onthe tandem MS applications: advantages of the technique; the sensitive and unequivocal confirmationof the presence of pesticides in food; and, important factors affecting the performance of LC-MS/MSinstruments, like the type of mass analyzer or the ionization source design which would be discussedon the particular framework of pesticide and their metabolite analysis. This review also highlights anumber of problems associated with the LC-MS/MS analysis of pesticides such as the matrix effectsthat make quantification difficult.
Keywords liquid chromatography, tandem mass spectrometry, atmospheric pressure ionizationsources, pesticides, food
INTRODUCTION
Since its introduction in the late 1950s, gas chromatography(GC) (1) has been one of the most important and widely appliedanalytical techniques in modern chemistry based on a favorablecombination of high selectivity and resolution, good accuracyand precision, wide dynamic concentration range and extraor-dinary sensitivity (2, 3). Traditionally, GC has been the ulti-mate “standard” analytical technique in research, development,and quality control in many industries, especially petrochemicalmanufacturing, in environmental (4), food (5), and drug qualitycontrol and in forensic analysis (6, 7). Within these fields, thepreservation of human health from exposure to pesticide residuesin food remains a major objective of food safety. Pesticide anal-ysis in food samples has been, following the above-mentionedtrend, usually carried out by means of multi-residue methodsthat apply GC as the preferred techniques because many of thesecompounds are low polar, thermally stable and volatile.
Address correspondence to Yolanda Pico, Laboratori de Bromatolo-gia I Toxicologia, Facultat de Farmacia, Universitat de Valencia, Av.Vicent Andres Estelles s/n, 46100 Burjassot, Valencia, Spain. E-mail:[email protected]
However, this bucolic situation was awkward when new ac-tive ingredients that, because of their physicochemical proper-ties such thermal instability and polarity, were not amenable toGC started to appear in the industry of pesticide formulations.Most of these novel compounds can be efficiently separated byliquid chromatography (LC) (8) without a preceding laboriousderivation step. This fact, in addition with some remarkable de-velopments, has turned this technique into a conventional androutine determination method (9–11).
Currently, pesticides comprise more than 1000 active ingredi-ents, which have been and are currently formulated in thousandof different commercial products (12). They include a varietyof compounds, mainly insecticides, herbicides and fungicides,with very different physico-chemical characteristics and largedifferences in polarity, volatility and persistence. For this rea-son, GC and LC have always been considered complementarytechniques (13–16).
Most LC methods use common ultraviolet (UV), diode ar-ray detection (DAD), fluorescence, or electrochemical detection,which are occasionally combined with postcolumn derivatiza-tion. However, these procedures may not be selective or sensi-tive because of the variety and complexity of matrices and lowconcentrations of pesticide residues present in them (17). The
93
Dow
nloa
ded
By:
[Can
adia
n R
esea
rch
Kno
wle
dge
Net
wor
k] A
t: 01
:54
8 Ju
ly 2
008
94 C. SOLER ET AL.
introduction into the market of robust and easy-operating LC-mass spectrometry (MS) instruments provides a new way foranalyzing pesticides more efficiently (18). There is a clear trendto increase the number of applications of LC in pesticide residueanalysis, both in specific/individual and in multiresidue methods(19).
This trend was caused by the recent improvements in LC-MS/MS instrumentation that have increased sensitivity, selec-tivity and robustness of the methods enabling the increase inthe number and diversity of pesticides that can be included in asingle analysis (20). The use of this technique allows, in manycases, one to reduce the sample pre-treatment, even facilitatingthe direct injection of the extracts (21).
Although the LC-MS, advantages such as the simplificationof sample preparation steps and the high sensitivity and selec-tivity that facilitates the analysis of target analytes at low con-centrations, the use of single MS still has severe drawbacks. Themost important is the limited fragmentation of the molecules thatcan induce to uncertainty in pesticides confirmation. The nextone is the matrix effect caused for coeluting undetected compo-nents causing suppression or enhancement in analyte ionizationthat affect both quantitation and detectability of the pesticideresidues in 9 real sample (22, 23).
This article reviews several recent applications of LC-MSand LC-MS/MS techniques for the determination of pesticideresidues in food. A brief account of the various liquid separation,ionization sources and MS techniques, as applied to pesticidesis presented. Important aspects such as the occurrence of pesti-cides, and their transformation products, and the difficulties ofanalyzing complex matrices are discussed, with emphasis on thequantification, identification and confirmation of the analytes infood.
LIQUID CHROMATOGRAPHIC SEPARATION
Pesticides can be classified according to their polarity inneutral and ionic pesticides. The simultaneous multi-residuedetermination of the former pesticides is commonly feasible.On the contrary, ionic pesticides require specific and particularmethods.
Neutral pesticides are mainly separated by reversed-phaseliquid chromatography (RP-LC), which covers more than 95%of applications. In RP-LC, medium polarity and polar pesticidesare separated according to the differences in hydrophobicity bypartitioning between an apolar stationary phase and a polar mo-bile phase.
The mobile phase is a critical issue because it influencesboth the chromatographic separation and the mass spectromet-ric response of the analyte. The most common solvents used asmobile phase in LC/atmospheric pressure ionization (API)-MSare gradient mixtures water, methanol and/or acetonitrile. Theamount of organic modifiers can increase or decrease the ioniza-tion efficiency depending on the interface. The efficiency of theelectrospray ionization (ESI) process depends on the conduc-
tivity and surface tension of the liquid being nebulized. Whenthe conductivity, directly related to the dielectric constant of thesolvent, is too high (i.e., highly aqueous) it is difficult to producea stable spray and to vaporize the droplets formed by the actionof the high voltage and nebulizing gas. Because the surface ten-sion of water is much higher than the surface tension of methanolor acetonitrile, the sensitivity is reduced when using more than70–80% of aqueous mobile phase. The aqueous-organic ratiois more significant when working at high flow rates since thereis more solvent to be nebulized and vaporized. A very high or-ganic content may also decrease the sensitivity, especially if anadditive is not used, because the conductivity of pure organic sol-vent is lower. A small percentage of water in the mobile phaseaids the droplet formation. Commonly, higher organic modifierpercentages improve ionization in ESI and worsen it in atmo-spheric pressure chemical ionization (APCI). Although solutionchemistry is not as critical in APCI as in ESI, the solvent prop-erties still need to be considered for the best performance. Proticsolvents, such as methanol, improve positive ionization.
The effect of methanol and acetonitrile as modifiers in themobile phase has been tested by Jansson et al. (24) for morethan 50 pesticides in a wide variety of fruits and vegetables.For all pesticides included in this study the signal was normallymuch higher in methanol than in acetonitrile. Similar resultshave been reported earlier for different groups of pesticides (9,25). For most compounds the signal in acetonitrile was in therange of 10–40% compared to the signal in methanol, but forsome pesticides the signal was even lower than 10%. Because gasphase basicity or acidity (proton affinity) of the organic solventcan favor positive ionization or negative ionization modes, theuse of methanol instead of acetonitrile is encouraged. In thestudy reported by Jansson et al. (24) all the pesticides can notbe detected at a concentration equivalent to 0.01 mg/kg whenusing acetonitrile instead as the modifier.
The pH of the mobile phase determines the ionization stateof the analytes when working with acids, bases or amphotericspecies, and therefore affects the response in LC/API-MS. Themobile phase pH also determines chromatographic selectivityfor ionizable compounds.
Buffers incorporated in to the mobile phase for chromato-graphic purposes should be volatile to avoid problems with theMS interface; buffers usually consist of acetic acid, formicacid, ammonium acetate, ammonium formate or ammonia (26–28). The signal of analytes in LC-MS is normally affected bythe ionic strength, so that the highest signal is achieved at thelowest ion strength. However, because the characteristics of thesamples analyzed can influence the signal by altering the ionicstrength it is important to use a buffer with sufficient bufferingcapacity to stabilize the system. Most of the reported mobilephase to separate and determine pesticide residues achieves acompromise in this sense using up to 10 mM ammonium for-mate. The higher ionic strength contributes to a more stablesystem both for retention and signal. In addition, the additionof volatile buffers, such as ammonium formate-formic acid or

Dow
nloa
ded
By:
[Can
adia
n R
esea
rch
Kno
wle
dge
Net
wor
k] A
t: 01
:54
8 Ju
ly 2
008
ROLE LC-MS IN PESTICIDE RESIDUE DETERMINATION IN FOOD 95
acetic acid-ammonium acetate, improve the signal intensity ofthe basic analytes and the presence of the ammonium cationhelps to reduce the formation of the sodium adduct in favor ofthe protonated molecule or the ammonium adduct, which aremore easily ionizable than the sodium adduct.
The specifity of LC-MS decreases the interest in obtaininggood chromatographic separation because of the mass selectiv-ity and distinctive fragmentation patterns that achieve properidentification of the compound, even if it is co-eluted with other
FIG. 1. Chromatograms obtained employing (a) Jupiter C5, (b) Max RP and (c) Zorbax Bonus RP analytical column for thedetermination of carbosulfan and its main metabolites. Reproduced from (32), with permission from Elsevier B.V., Copyright2006.
compounds. Most stationary phases are based on silica that hasbeen chemically modified with octadecyl (C18 or ODS) or octyl(C8 or OS) (29–31) chains. However, chromatographic separa-tion is still important in some cases, which in turn are directlyrelated to the vast number (approximately 600) of different sta-tionary phases with available. This facilitates the solution ofmany separation problems simply by selecting appropriate sta-tionary phases with different selectivities to allow polar analyteseparations or to improve peak shape of basic compounds, on the
Dow
nloa
ded
By:
[Can
adia
n R
esea
rch
Kno
wle
dge
Net
wor
k] A
t: 01
:54
8 Ju
ly 2
008
96 C. SOLER ET AL.
other hand, identifying the most suitable column for a specificpurpose can be far from straight forward. A further complicatingfactor is the large groups of nominally identical materials thatoften show very different chromatographic properties.
New alternatives to conventional non-polar alkyl bondedphases have been introduced; the most popular are the embeddedand encapped phases. These are modifications of the traditionalC18 phase, with the addition of a functional non-polar or po-lar group, usually an amide or carbamate group, either within(embedded) or at the end (endcapped) of the alkyl chain, thusmodifying the selectivity in comparison to conventional alkylbonded phases.
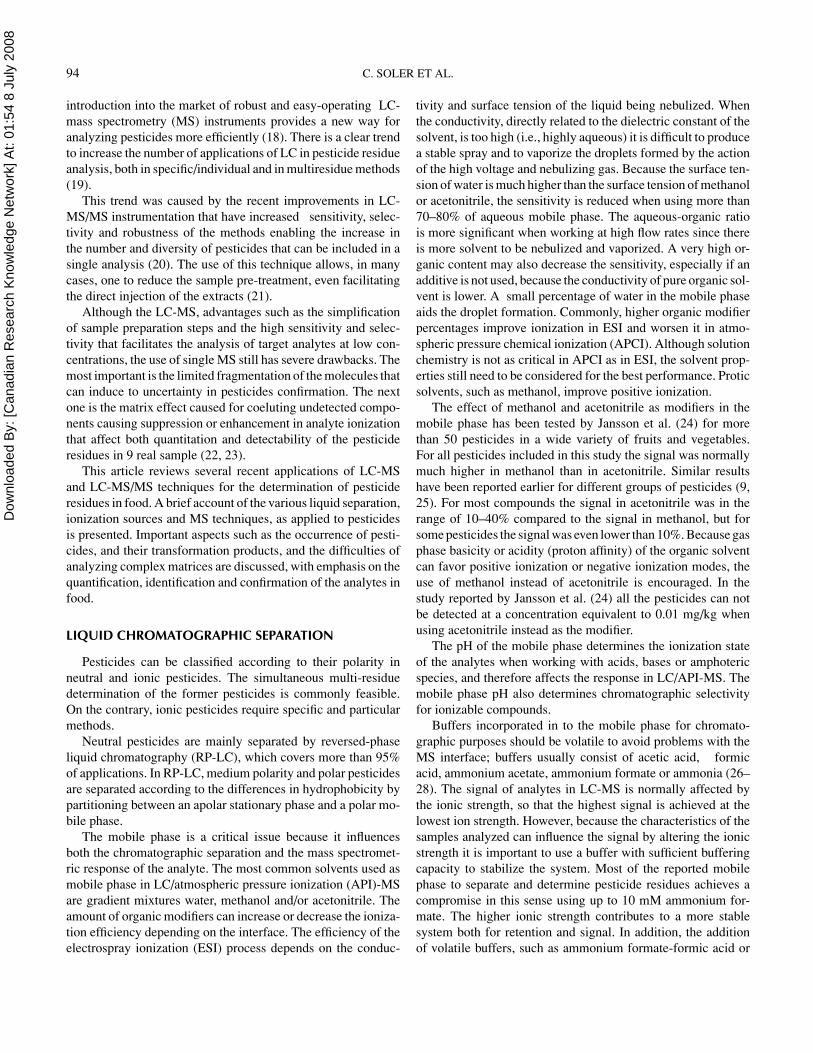
An interesting example can be found in the case of twometabolites of the pesticide carbofuran, 3-ketocarbofuran and3-keto-7-phenolcarbofuran, because in-source fragmentation ofthe former produces the precursor ion of the latter. Soler et al.
(32) compared the performance of six different columns tochoose the most appropriate. Poor peak shapes and deficientresolution were observed using most of the column checked.Figure 1 depicts the most outstanding examples of this studyobtained using the Jupiter C5, Max RP and Zorbax Bonus RPanalytical columns. Figure 1a illustrates the complete peak over-lap obtained for most of the tested columns, which were de-signed for the analysis of polar analytes. Figure 1b shows theincomplete resolution of both peaks obtained using the MAXRP column, which was designed for sharp peak shape of ba-sic compounds at neutral pH. The extracted ion chromatogram(XICs) show in Figure 1c presents resolved peaks for the 3-ketometabolites: 9.12 minutes (3-ketocarbofuran) and 9.68 minutes(3-keto-7-phenolcarbofuran) using the analytical column Zor-bax Bonus-RP. This column, with an embedded amide linkagein the C14-alkyl chain, is also targeted to improve the peak shapefor challenging basic compounds. It should be noted that bothLC columns are able to provide some separation of the 3-ketometabolites, MAX-RP and Zorbax bonded RP are prepared toreduce the interactions of the basic analytes with the bondedphases.
Ionic pesticides are mainly separated by two mechanisms —RP-LC using an ionic pair and ion-exchange liquid chromatog-raphy (IELC).
The ion pair reagents are added to the mobile phase forimproving chromatographic behavior and peak shape of themolecules ionized in solution (33, 34). For analytes present asanionic forms, such as fosetyl, tributyl- or triethylamine are usedas counter ions; for those existing as the cationic forms, such asdiquat, paraquat, chlormequat, or cyromazine, heptabluorobu-tiric acid is added. The ion pair reagent added to the mobilephase must also be volatile.
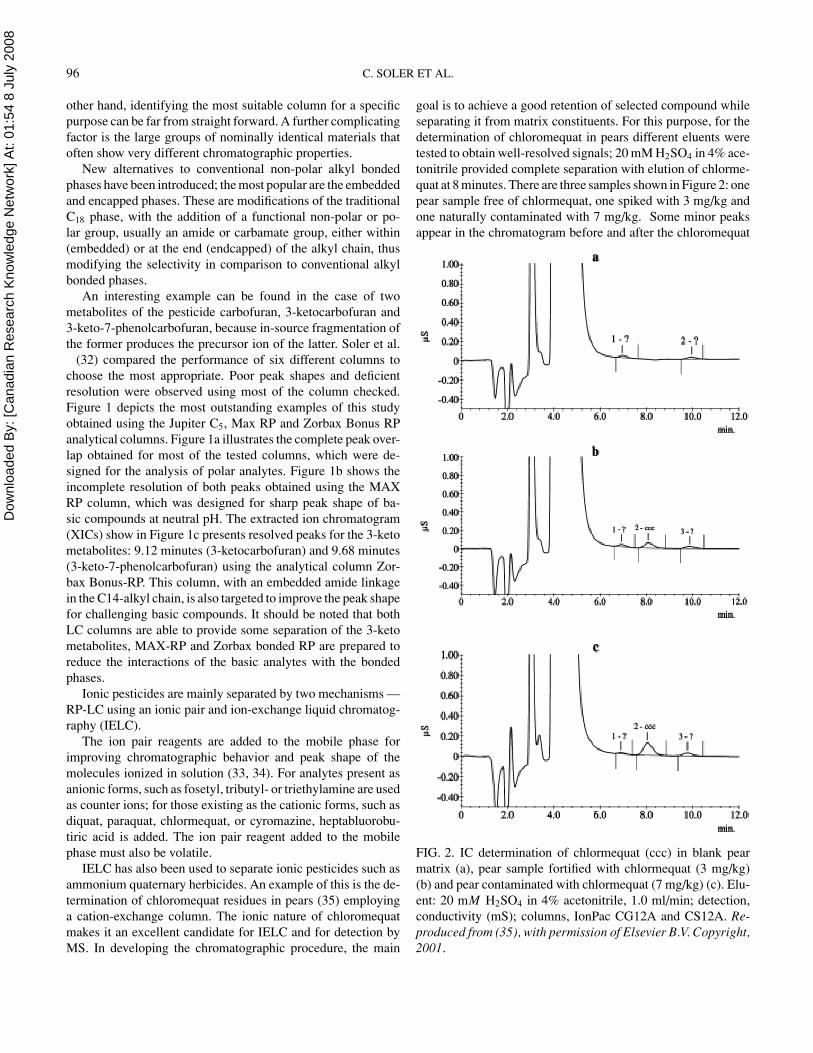
IELC has also been used to separate ionic pesticides such asammonium quaternary herbicides. An example of this is the de-termination of chloromequat residues in pears (35) employinga cation-exchange column. The ionic nature of chloromequatmakes it an excellent candidate for IELC and for detection byMS. In developing the chromatographic procedure, the main
goal is to achieve a good retention of selected compound whileseparating it from matrix constituents. For this purpose, for thedetermination of chloromequat in pears different eluents weretested to obtain well-resolved signals; 20 mM H2SO4 in 4% ace-tonitrile provided complete separation with elution of chlorme-quat at 8 minutes. There are three samples shown in Figure 2: onepear sample free of chlormequat, one spiked with 3 mg/kg andone naturally contaminated with 7 mg/kg. Some minor peaksappear in the chromatogram before and after the chloromequat
FIG. 2. IC determination of chlormequat (ccc) in blank pearmatrix (a), pear sample fortified with chlormequat (3 mg/kg)(b) and pear contaminated with chlormequat (7 mg/kg) (c). Elu-ent: 20 mM H2SO4 in 4% acetonitrile, 1.0 ml/min; detection,conductivity (mS); columns, IonPac CG12A and CS12A. Re-produced from (35), with permission of Elsevier B.V. Copyright,2001.

Dow
nloa
ded
By:
[Can
adia
n R
esea
rch
Kno
wle
dge
Net
wor
k] A
t: 01
:54
8 Ju
ly 2
008
ROLE LC-MS IN PESTICIDE RESIDUE DETERMINATION IN FOOD 97
peak, even in a sample free of pesticides, but these peaks do notdisturb the target compound analysis becoming a convenientmethod for the analysis of this ammonium quaternary pesticidein pears.
INTERFACING SYSTEMS
Actually, the large majority of pesticides analyses are carriedout using either ESI or APCI interfaces. Atmospheric pressurephotoionization (APPI) was commercialized just few years agobut is not yet largely used.
ESI is a soft ionization technique, appropriated for pesticidesthat are ionized in solution or that have a high molecular weight(up to 600 u). The spray is formed by electrically charging theliquid to a very high voltage. The charged liquid in the nozzlebecomes unstable as it is forced to hold more and more chargeuntil it reaches a critical point at which it can hold no moreelectrical charge; at the tip of the nozzle, the droplets explode bycoulomb repulsion into highly charged molecules. The capillaryis held a at high voltage in atmospheric pressure to generatethe spray. Sometimes the spraying is supported by a make-upflow, which allows the use of higher flow rates. Liquid-phasechemistry plays a key role in the ion formation on ESI (36–41).
In APCI, a stable spray is generated by heating an aerosolfrom the liquid effluent of the LC with a sheathflow of gasat atmospheric pressure. Ions are generated by a corona dis-charged in the spray, forming chemical ionization plasma. APCIis better suited for non-ionic pesticides of moderate molecularweight. Chemical ionization occurs in the vapor state to form the[M+H]+ ion. The corona-discharge needle in the APCI sourceproduces a stream of electrons, which ionizes the solvent of the
FIG. 3. Ionization-continuum diagram (A) showing the regions of effective usefulness of the various interfaces for LC-MS in-cluding APCI, ESI, and electron impact ionization (EI) and (B) for pesticides. Key: ESA, ethanesulfonic acid degradate of thechloroacetanilide herbicides; PU, phenylurea herbicides; OP, organophosphate insecticides; Carb, carbamate insecticides; OC,organochlorine insecticides; SU, sulfonylurea herbicides. Adapted from (42), with permission from American Chemical Society,Copyright 2000.
mobile phase. According to the current theory on APCI ion-ization, in the positive ionization (PI) mode the CH3OH+
2 andH3O+, present in the vapor state, transfer protons to the weaklybasic pesticides in the vaporized state in line with their pro-ton affinity, whereas in the negative ionization (NI) mode, theelectronegative compounds attach an electron and become nega-tively charged. APCI interface can produce thermal degradationof thermolabile compounds.
The selection of the most appropriate ionization sourcefor the analysis of pesticide residues depends on the types ofpesticides investigated as well as on the evolution of sourcegeometry for different instruments, brands and types. WhenESI-MS is interfaced to LC, the interface is designed to workwith high flow rates.
Thurman et al. (42) evaluated APCI and ESI for the LC-MSdetermination of over 75 pesticides and degradation products.A diagram called the “ionization continuum” shows that protonaffinity in the gas phase and polarity in solution (pKa) are usefulfor selecting APCI or ESI (Figure 3). The various classes of pesti-cides are plotted on the diagram according to whether they ionizein PI, in NI, or in both modes. Neutral and basic pesticides (car-bamates, phenylureas, triazines) are more sensitive using APCI(especially in positive ion mode) while cationic and anionic her-bicides (bipyridilium ions, sulfonic acids, phenoxy acids, nitro-phenols and bentazone) are best ionized with ESI (specially innegative ionization mode). There are a number of studies usingthe same interface design as that of Thurman et al. that confirmand corroborate the conclusions reported by these authors.
In contrast, in a study of a liquid LC-MS/MS multi-methodfor more than 200 pesticides analysis, the ESI interface was onaverage 20 times more sensitive compared to the APCI interface

Dow
nloa
ded
By:
[Can
adia
n R
esea
rch
Kno
wle
dge
Net
wor
k] A
t: 01
:54
8 Ju
ly 2
008
98 C. SOLER ET AL.
FIG. 4. Schematics of the configuration of three different design sources (a) ESI by Agilent technologies, (b) ZsprayTM byWater/Micromass, and (c) Turbo VTM by MDS SCIEX.

Dow
nloa
ded
By:
[Can
adia
n R
esea
rch
Kno
wle
dge
Net
wor
k] A
t: 01
:54
8 Ju
ly 2
008
ROLE LC-MS IN PESTICIDE RESIDUE DETERMINATION IN FOOD 99
(43). This study is also corroborated by that of Jansson et al. (24),who in a search for the most appropriate conditions to optimizethe MS systems for analysis of 57 pesticide residues, examineddifferent ionization techniques. The comparison resulted in 10–20 times higher response in ESI than in APCI for all of thetested pesticides. Similar results are reported by Hernndez et al.(19). Of the initially 60 selected pesticides, two (formetanateand dithianon) were found to be non-easily ESI ionizable. Onlyin the case of dithianon, the use of APCI in negative mode wasfound to be much more appropriate than ESI.
These divergences can be explained by the differences in thesource design of the MS manufacturers involved in those stud-ies (Agilent technologies, Water/Micromass, and MDS SCIEX).The schematics of the configuration of the three different sourcesare shown in Figure 4. The three sources sample orthogonallyfrom the spray plume to minimize contamination. The study re-ported by Thurman et al. (42) was carried out with the AgilentTechnology source, which incorporated an additional asymmet-rical lens. Their purpose is to help initiate and sustain electro-spray. The study of Klein and Alder (43) uses the TurboIonSpraysource developed by MDS SCIEX, in which heated nitrogen gasthat is released from a unit external to the sprayer is used to assistevaporation of the spray droplets at atmospheric pressure. Thisallows it to vaporize the large amounts of solvent emerging fromthe sprayer as efficiently as possible. Finally, the other two re-ported studies using the Water/Micromass Zpray interface. Thespray is first sampled orthogonally through the sampling coneinto a low pressure chamber. An extraction cone (skimmer) is
FIG. 5. Total ion chromatograms of standard mixtures at 100 ng/mL (A), a grape extract (B), and an onion extract (C) bySIM mode. Peaks: 1, butocarboximsulfoxide; 2, aldicarbsulfoxide; 3, butocarboximsulfone; 4, aldicarbsulfone; 5, oxamyl; 6,thiofanoxsulfoxide; 7, thiofanoxsulfone; 8, methiocarbsulfoxide; 9, dithiocarb; 10, methiocarbsulfone; 11, aldicarb; 12, carbofuran;13, bendiocarb; 14, aminocarb; 15, carbaryl; 16, ethiofencarb; 17, XMC; 18, thiodicarb; 19, pirimicarb; 20, isoprocarb; 21,fenobucarb; 22, methiocarb.Reproduced from (44), with permission of American Chemical Society, Copyright 2004.
oriented at a right a angle relative to the axis of the spray tosample for a second time the next differentially pumped vacumstage. The double orthogonally sampling systems prevent sol-vent and neutral molecules from entering the analyzer, resultingin reduced chemical background. These differences can explainthe contradictory results reported by the different authors.
APPI has been scarcely applied to the determination of pes-ticide residues. All of the studies compared it with the APCI in-terfaces because fundamentals of both sources are similar. Thedifference is that APPI uses photons in the vacuum UV regioninstead of a discharge of electrons. The principal mechanismof APPI of a molecule (M) is photo absorption and electronejection to form the molecule radical [M]+, which extract anH- atom from the water vapor or protonic solvent to form aprotonated molecule [M + H]+. Pesticides, which show lowerfirst ionization potential than the energy of the photons, areionized.
Takino et al. (44) optimized APPI parameters for the deter-mination of 22 carbamates including their metabolites in grapesand onions. As show in Figure 5, both sample matrices led to al-terations in the chromatograms, including some additional peaksand rise in the base line. However, these additional peaks causedno interference, because they were well separated for the peaksof all carbamates. Futhermore, average changes in retentiontime and peak intensity of all carbamates obtained from matrix-matched standard solutions prepared from analyte-free samplewere less than 1 and 10%, respectively. These results pointedout that APPI is a very useful technique for high-throughput

Dow
nloa
ded
By:
[Can
adia
n R
esea
rch
Kno
wle
dge
Net
wor
k] A
t: 01
:54
8 Ju
ly 2
008
100 C. SOLER ET AL.
applications because it minimizes the need to prepare matrix-matched standards. Sensitivity is similar in both interfaces. How-ever, an advantage of using APPI for carbamate determina-tion in fruits and vegetables is the low matrix effect observesdthat makes the use of matrix-matched standards unnecessary(44, 45).
LC-MS specificity can simplify sample preparation. How-ever, the sample complexity and the number of compounds thatco-eluted with the analytes generate a very important problem inLC-MS—the matrix effect caused by the co-extractants presentin the injected sample, which may cause enhancement or sup-pression of the analyte signal (46). These compounds influencethe effectivity of the ionization processes. The matrix effect isrelated to the ionization source in the API interfaces. ESI inter-face is more susceptible than APCI to matrix signal-suppressioneffects.
There are different theories on the origin of matrix effect. Themost instituted one states that the organic compounds present inthe sample at concentrations greater than 105 M may competewith the analyte for access to the droplet surface for gas-phaseion emission, and that the gas-phase basicity or acidity of co-eluting matrix components may be higher than that of the analyteof interest. Thus, the basic or acidic character of the matrixcomponents could promote the formation of the protonated ordeprotonated molecular ions of the analytes during the ionizationprocess, causing enhancement of the signal. There is still a lot tobe done to understand the mechanisms and to properly predictmatrix effects.
These effect demonstrate that the response of an analyte inpure solvent standard varies significantly from that in matrixsamples. They can be easily detected by comparing the responseobtained from a standard solution and that from a spiked pre-treated sample (post-extraction spike). The matrix effects differfrom matrix to matrix to and from pesticide to pesticide beingvery variable. An example of matrix suppression is illustrated forthe pesticide triflumisol in different matrices (Figure 6). Triflu-misol peaks acquired by LC-ESI-MS in selected reaction moni-toring (SRM) mode in solvent or post-extraction spiked extractsof eggplant, lettuce, and pepper are compared. Co-eluting matrixcomponents in the pepper extracts almost completely suppressthe analyte response, while for eggplant and lettuce extracts less,but still significant, suppression is observed (22). Furthermore,it is not possible to use the matrix effect for one pesticide in aspecific matrix to predict the matrix effect of other pesticide inthe same matrix. Jansson et al (24) report more than 2000 testsof matrix effect on pesticides, which showed that, in general,the measured matrix effect is quite small, with a mean valueof 104% and relative standard deviation of 23%. Although themean value is very nearly 100%, within this value there is a vari-ation, mainly depending on different values. Ortelli et al. (47)also showed that matrix effect is generally low. Lemon was theonly matrix that gave a significantly different response for sev-eral substances, probably due to signal suppression or stabilityproblems in very acidic samples.
FIG. 6. Matrix suppression in the LC-ESI-MS analysis of tri-flumisol in different matrices. The compound was isolated byliquid extraction with ethyl acetate, evaporation to dryness, andreconstitution in methanol. Reprinted from (22), with permissionfrom Elsevier.
Different actions can be taken to overcome the matrix ef-fects in the accuracy and/or precision of the method. The sampleconstituents responsible for the matrix effects can be reducedor eliminated by improving the sample pre-treatment and/orthe chromatographic separation (efficiency and/or resolution).This would be the best approach but it could be impractica-ble, especially in multi-residue analysis, where a variety of in-terferences may be involved. The mass spectrometric condi-tions can be modified by changing ESI to another ionizationmethod (APCI or APPI) less sensitive to matrix components.However, the ideal and simplest action is to use an appropriatecalibration technique that compensates for the matrix effects.The most recommended approach is the addition of isotopi-cally labelled analytes as an internal standard in isotope dilutionbased methods. The merit of this approach is that both speciesbehave identically but they can be quantified independently be-cause each can be distinguished by its nominal mass. Althoughit would be the best solution, isotopically labelled standardsare rather expensive (especially in multicomponent analysis)and are not always commercially available. A recently proposedalternative is the Eco-Peak technique, which involves the in-jection of the sample and a conventional standard in the samechromatographic run but displaced by a few seconds in time.The inconvenience is that the double peaks appear in the chro-matogram, causing some problems, especially with structuralisomers.
Although it is not considered the best solution, the use ofmatrix-matched standards is the most reported approach to com-pensate for the matrix effects because it is economical and easyto apply (2, 43, 47–61). These standards are prepared by spikingblank matrices (same matrix as the sample) for confirmation.In this case, the calibration takes into account the matrix effectand the final result is corrected. The drawback of this methodis that there is not a general regression curve for different food

Dow
nloa
ded
By:
[Can
adia
n R
esea
rch
Kno
wle
dge
Net
wor
k] A
t: 01
:54
8 Ju
ly 2
008
ROLE LC-MS IN PESTICIDE RESIDUE DETERMINATION IN FOOD 101
FIG. 7. Common mass spectrometers.
matrices; a particular one should be made for each matrix, whichis extremely time-consuming.
MASS ANALYZERS
Single quadrupole mass analyzer has been the traditional ap-proach to couple chromatography with MS. However, the in-novations in the last year have diversified the mass analyzersavailable for analysis. These recently introduced mass analyzershave been divided into two different groups: the first group com-prises high resolution techniques, such as time-of-flight massspectrometry (TOF-MS), and the second group includes tech-niques capable of carrying out tandem mass spectrometry, suchas triple quadrupole (QqQ), quadrupole ion trap (QIT) or thehybrid quadrupole time-of-flight (QqTOF). Figure 7 illustratessimilarities and differences of the these analyzers.
SINGLE QUADRUPOLE
Quadrupoles are not used only as mass analyzers; they alsoare implemented frequently as ion transfer optics and collisioncells. The quadrupole consists of four parallel metal rods. Whenused as mass analyzers, each opposing rod pair is connected to-gether electrically and a radio frequency (RF) voltage is appliedbetween one pair of rods, and the other. A direct current voltageis then super-imposed on the RF voltage. Only ions of a certainm/z will reach the detector for a given ratio of voltages; otherions have unstable trajectories and will collide with the rods.This allows selection of a particular ion, or scanning by varyingthe voltages.
In full-scan experiment, the DC and RF components areramped at a constant ratio, and ions entering from the ion sourceare enabled to pass through the rod assembly successively, re-sulting in low sensitivity that makes this mode inappropriate todetermine pesticides because they are commonly at trace levelsin the sample.
The sensitivity is much higher in the selected ion monitoring(SIM) mode of the quadrupole (close to 100%). In this case,the DC and RF potentials are held constant, so only a specificm/z ratio can pass through. More than one m/z ratio can be de-tected sequentially by jumping between the different voltages.The drawback of this mode is that only a limited number of ionscan be monitored for each compound because ESI and APCIwere designed to provide a soft-ionization process that leads toa mass spectrum with only a few ions. The poor fragmentationof molecules is translated in deficient specificity because iso-baric interferences (compounds with the same m/z relation) ormultiple-component spectra are frequently observed in extractsof complex matrices such as food.
Single quadrupole instruments are usually limited to measur-ing intact species generated by the ionization source, resulting inless selectivity. In any case, this mass analyzer has been the mostapplied in pesticides analysis for many decades in different foodmatrices because it is relatively inexpensive, rugged, particularlysensitive in SIM mode, and ideal for trace target applications.Table 1 summarizes a large number of examples. However, ei-ther the lack of fragment ions or that those fragment ions couldcome from several compounds which co-eluted in the same peakin LC–MS can make structure assignments difficult (similarly,

Dow
nloa
ded
By:
[Can
adia
n R
esea
rch
Kno
wle
dge
Net
wor
k] A
t: 01
:54
8 Ju
ly 2
008
TAB
LE
1A
pplic
atio
nsof
sing
lequ
adru
pole
inpe
stic
ides
anal
ysis
info
od
Rec
over
yL
OD
LO
QPe
stic
ide
Mat
rix
Ext
ract
ion
Det
erm
inat
ion
(%)
(ng/
ml)
(mg/
kg)
Ref
.
6pe
stic
ides
ofdi
ffer
entg
roup
sC
itrus
frui
tsC
ompa
riso
nM
SPD
and
SLE
.0.
5g
sam
ple
byM
SPD
(C18
+di
chlo
rom
etha
ne-m
etha
nol)
and
5g
sam
ple
bySL
E(e
thyl
acet
ate)
•ESI
posi
tive;
Lun
aC
18(1
50×
4.6
mm
,5μ
m);
grad
ient
MeO
H-w
ater
atflo
wra
te0.
6m
l/min
.•S
IMw
asse
para
ted
info
urtim
e-w
indo
ws.
•Con
firm
ator
yan
alys
isby
QqQ
and
QIT
.
57–9
75–
100.
02–0
.4(9
)
Car
bam
ates
Peac
hes
and
nect
arin
es50
gsa
mpl
eby
SLE
(eth
ylac
etat
e+
sodi
umsu
lpha
tean
hydr
ous)
•APC
Ipo
sitiv
e;L
una
C18
(150
×4.
6m
m,5
μm
);gr
adie
ntM
eOH
-wat
erat
flow
rate
0.8
ml/m
in.
SIM
ofpr
oton
ated
mol
ecul
ew
asus
edfo
r3
pest
icid
esan
da
frag
men
tfor
the
last
one.
•For
confi
rmat
ion
ofth
eco
mpo
unds
,se
cond
ion
was
used
.
14–1
080.
02(2
5)
Imid
aclo
prid
and
benz
imid
azol
esFr
uits
and
Veg
etab
les
15g
sam
ple
bySL
E(e
thyl
acet
ate
+so
dium
sulp
hate
)•E
SIpo
sitiv
e;Z
orba
xSB
-C8
(150
×4.
6m
m,5
μm
);gr
adie
ntM
eOH
-50
mM
amm
oniu
mfo
rmat
ein
wat
erat
flow
rate
1m
l/min
.•F
orco
nfirm
atio
nof
the
com
poun
ds,
seco
ndio
nw
asus
ed.
89–1
100.
5–1
0.05
–0.5
(62)
4po
st-h
arve
stpe
stic
ides
Citr
usfr
uits
50g
sam
ple
byPL
L(w
ater
and
diet
hyle
ter)
•APP
Ipo
sitiv
ean
dne
gativ
e;In
erts
ilO
DS-
3(1
50×
3m
m,5
μm
);gr
adie
ntM
eOH
-wat
erat
flow
rate
0.5
ml/m
in.
Seco
ndio
nsob
tain
edat
high
frag
men
tato
rva
les
wer
eus
edas
qual
ifier
ion
toco
nfirm
the
iden
tity.
67–1
0010
–50
(45)
(Con
tinue
don
next
page
)
102
Dow
nloa
ded
By:
[Can
adia
n R
esea
rch
Kno
wle
dge
Net
wor
k] A
t: 01
:54
8 Ju
ly 2
008
TAB
LE
1A
pplic
atio
nsof
sing
lequ
adru
pole
inpe
stic
ides
anal
ysis
info
od(C
ontin
ued)
Rec
over
yL
OD
LO
QPe
stic
ide
Mat
rix
Ext
ract
ion
Det
erm
inat
ion
(%)
(ng/
ml)
(mg/
kg)
Ref
.
1he
rbic
ide,
1fu
ngic
ide
and
3fu
ngic
ides
Frui
tsan
dve
geta
bles
0.5
gsa
mpl
eby
MSP
D(C
18+
dicl
orom
etha
ne)
•APC
Ipo
sitiv
e;L
una
C18
(2)
(150
×2
mm
,4.
6μ
m);
grad
ient
MeO
H-a
mm
oniu
mfo
rmat
e(5
0m
mol
/l)at
flow
rate
1ml/m
in.
•SIM
ofm
osta
bund
anti
onw
asus
edfo
rqu
antifi
catio
n.Se
cond
frag
men
tsw
ere
used
for
confi
rmat
ion.
70–1
10(5
–50)
×10
30.
02–0
.2(6
3)
Car
bam
ates
Bov
ine
milk
3m
lsam
ple
PLE
(san
d+
wat
er,9
0◦ C,5
min
)•E
SIpo
sitiv
e;A
lltim
aC
18(7
.5×
4.6
mm
,5μ
m);
grad
ient
MeO
H-w
ater
(10
mM
form
icac
id)
atflo
wra
te1
ml/m
in.
•SIM
ofth
epr
oton
ated
mol
ecul
ean
dtw
oad
ditio
nali
ons
sepa
red
infiv
etim
ew
indo
ws.
•Use
ofan
ISfo
rca
libra
tion.
85–1
051–
53–
8(6
4)
Car
bam
ates
Frui
tsan
dV
eget
able
s1
gsa
mpl
eby
MSP
D(B
onde
silC
8+
dicl
orom
etha
ne-
acet
onitr
ile)
•APP
Ipo
sitiv
e;Z
orba
xE
clip
seX
DB
C18
(150
×3
mm
,5μ
m);
grad
ient
MeO
H-w
ater
(10
mM
amm
oniu
mac
etat
e)at
flow
rate
0.5
ml/m
in.
•SIM
ofth
em
osta
bund
anti
ons
([M
+H]+ ,
[M+N
H4]+
or/a
nd[M
+H-C
H3N
CO
]+ ).
82–1
060.
5–5
(44)
Car
bam
ates
Frui
tsan
dve
geta
bles
2g
sam
ple
PLE
(san
d+
wat
er,5
0◦ C,5
min
).•E
SIpo
sitiv
e;A
lltim
aC
18(7
.5×
4.6
mm
,5μ
m);
grad
ient
MeO
H-w
ater
(10
mM
form
icac
id)
atflo
wra
te1
ml/m
in.S
IMof
the
prot
onat
edm
olec
ule
and
two
addi
tiona
lio
nsse
pare
din
five
time
win
dow
s.•U
seof
anIS
for
calib
ratio
n.
84–1
102–
72–
10(6
5)
103

Dow
nloa
ded
By:
[Can
adia
n R
esea
rch
Kno
wle
dge
Net
wor
k] A
t: 01
:54
8 Ju
ly 2
008
104 C. SOLER ET AL.
min0.5 1 1.5 2 2.5 3
0
25000
50000
75000
100000
125000
150000
175000
min0.5 1 1.5 2 2.5 3
0
25000
50000
75000
100000
125000
150000
175000
m/z100 200
0
20
40
60
80
100 202.1
203.1
m/z100 200
0
20
40
60
80
100
Thiabendazole
(a)
H
N
SN
N
100 2000
20
40
60
80
100 2000
20
40
60
80
175.1
100 2000
20
40
60
202.1100
Rela
tive a
bundance
(%
)
Carbaryl
100 2000
20
40
60
80
100
203.1
100 2000
20
40
60
80
100
202.1
100 2000
20
40
60
80
100
100 2000
20
40
60
80
100 145.1
(b)R
ela
tive a
bundance
(%
)
m/z
Rela
tive a
bundance
(%
) OOCNHCH3
FIG. 8. (a) LC-MS chromatogram of a mixture of carbaryl and thiabendazole using LC-MS and appliying a cone voltage (knownalso as fragmentor voltage) of 20 V. (the mass spectrum is shown as an insert) and (b) the mass spectra of carbaryl and thiabendazoleobtained using a cone voltage of 120 V.
quantitative analysis in the SIM mode would be difficult whenisobaric interferences contribute to the chromatographic peaks).Figure 8a shows a typical example of isobaric interferences.Carbaryl and thiabendazole are two pesticides that have a verydifferent structure but the same molecular weight. These pesti-cides generally co-eluted in isocratic LC conditions. In a single-quadrupole instrument, operating with an ESI or APCI source,selectivity can be increased when fragmentation is induced inthe ion source region “in-source collision induced dissociation(CID)”. This procedure refers to the activation of ions in the re-gion between the ion source and the analyzer, in which fragmen-tation can be initiated by collisions with residual gas moleculesat intermediate pressures. The generated fragment ions can beused for limited structure elucidation or confirmation purposes.Figure 8b illustrates that by increasing these fragmentor orcone voltages thiabendazole and carbaryl can be distinguishedby obtaining a characteristic fragment ion of each molecule,175 m/z for thiabendazole and 145 m/z for carbaryl (52). Thedrawback of CID is that it is normally detrimental to sensitivity.A compromise should be achieved between fragmentation andsensitivity, which taken into account the low maximum residuelimit (MRLs) established implies that is not possible to obtainhigh fragmentation.
TOFTOF mass spectrometer is basically composed of an ion-
accelerating region, a flight tube, and a detector. In theory, allions experience the same potential difference during accelera-tion and, consequently, have the same kinetic energy at the startof the flight tube, and thus different velocities depending upontheir mass. Therefore, their arrival time at the detector is pro-portional to their mass and they reach the detector in order ofincreasing mass. TOF instruments commonly employ reflectonsto enhance resolution, which focus ions of the same m/z but ofdifferent kinetic energy. The reflecton is located after the drift
tube, creating a retarding field that the ions penetrate. Dependingupon their kinetic energy, they enter this field at different depthsand then are reflected back into the flight tube, where they driftto the detector, which is placed close to the ion source.
The pulsed nature of TOF analysis makes the coupling withelectrospray —a continuous source of ions— difficult. The nec-essary focusing of the ions coming from the ESI source is usu-ally carried out by an orthogonal acceleration (oa) TOF type.The ions are focused into the orthogonal accelerator as a narrowion beam and a slice of it is pushed down into the flight tube.
LC-TOF-MS instruments present several advantages. Suchas the high mass range that can be analyzed (with a linear TOFinstrument) and the high ion transmission attained by the quasis-imultaneous detection of all ions resulting in high sensitivity“full spectrum” analyses (TOF-MS is not a scanning instru-ment). These characteristics make this instrument just right inqualitative applications such as the identification of non-targetedand/or unknown compounds, in which the acquisition of an en-tire mass spectrum is required. In addition, LC-TOF-MS offersimproved selectivity due to the high-resolution power linked tothe capability to provide exact mass chromatograms over nomi-nal mass chromatograms (1 Da mass range), which attains iden-tification of mass interferences with analytes having the samenominal mass and chromatographic retention time.
A nice example of identification of non-targeted pesticidesand their metabolites was reported by Thurman et al. (53) whouse this technique to identify (without the initial use of stan-dard), different post-harvest fungicides and their metabolites. Insummary, the method involves accurate mass identification ofthe molecule and its isotopic clusters, database searches, andMSn pathway elucidation, followed by standard identificationwhen possible. Figure 9 displays the total ion chromatogramof a lemon extract. A chlorine-containing suspected specie wasfound in this total ion chromatogram (TIC) at the retention timeof 22.7 min. As can be seen in Figure 9a, in the accurate mass

Dow
nloa
ded
By:
[Can
adia
n R
esea
rch
Kno
wle
dge
Net
wor
k] A
t: 01
:54
8 Ju
ly 2
008
ROLE LC-MS IN PESTICIDE RESIDUE DETERMINATION IN FOOD 105
FIG. 9. (a) Accurate mass spectrum of prochloraz, identified in the studied lemon extract at tR 22.7 min; (insert) TIC of the lemonextract and (b) Accurate mass spectrum of the proposed prochloraz degradation product identified in the studied lemon extract attR 16.9 min. Adapted from (53) with permission of Elsevier B.V., Copyright 2005.
Dow
nloa
ded
By:
[Can
adia
n R
esea
rch
Kno
wle
dge
Net
wor
k] A
t: 01
:54
8 Ju
ly 2
008
106 C. SOLER ET AL.
spectrum, there are two main peaks: 376 and 308 m/z. The iso-topic pattern and the difference between both signals evidencethe presence of three chlorine atoms in the studied specie. Usinga large accuracy error threshold and including a minimum anda maximum number of three chlorine atoms in the elementalcomposition calculator tool, only two elemental compositionsmatched with the m/z input: C15H17N3O2Cl3 and C8H17N9SCl3.Using “The Merck Index” data base, a unique match with thesecond formula, corresponding to prochloraz, was found. In thesame lemon extract, an ion with the same isotopic pattern (threechlorine atoms) at the retention time of 16.9 minutes (Figure 9b)appears.
The disadvantage of TOF is its limited dynamic range; thatis, the ratio of the maximum to the minimum observable ionintensities or concentrations over which a linear response is ob-tained from the detector. This is the direct result of the typesof detectors that are employed for handling the large number ofhigh-resolution spectra, making the application of TOF instru-ments to quantitative analyses less attractive, but not impossibleas demonstrated by the number of applications of LC-TOF-MSto quantitative determination of pesticides, shown in Table 2.
Tandem Mass AnalyzersMS/MS involves two or more stages of mass analysis sepa-
rated by a reaction or fragmentation step. The most importantadvantage of MS/MS is the reduction of “chemical noise” dueto the high specificity of the instrument.
There are two fundamentally different approaches to MS/MS:tandem in space and tandem in time. Tandem in space in-struments have different and independent mass analyzers inphysically different locations of the instrument. Examples ofthese instruments includ, but are not limited to, QqQ andQqTOF. Tandem in time instruments are, in general, ion-
FIG. 10. Combined MRM chromatogram of a matrix-matched standard at 0.05 mg/kg prepared in orange. Reproduced from (54)with permission from Wiley InterScience, Copyright 2004.
trapping mass spectrometers which comprise 2-D and 3-Dquadrupole ion traps and Fourier transform ion cyclotron. Thevarious stages of MS are conducted within the same phys-ical trapping volume but at different times during the ex-periment. Of all the instruments described here, the three-dimensional 3-D trap is the only one applied to pesticide residuedetermination.
QqQThe most common mass analyzer for quantitative analyses
is the QqQ. This MS/MS instrument consists of three consec-utive quadrupoles (Q1-q2−Q3; Q refers to a mass-resolvingquadrupole, q to an RF-only quadrupole). This configurationachieves additional ion activation in q2, after the target ion hasbeen selected in Q1. The second quadrupole q2 is operated inthe RF-only mode, in which only an RF voltage is applied to thequadrupole rods (no DC component), thus effectively becominga wide-band pass for the ions. It can be filled with a neutral gassuch as N2 or Ar, acting as a collision gas. The ions leaving Q1
are accelerated into q2 with offset voltages between 0 and 100 V.The results of the CID can be analyzed with the mass analyzerQ3. The common mode of operation in pesticide residue anal-ysis is SRM, in which the two resolving quadrupoles monitorspecific precursor-to-product ion transitions. SRM enhances thedetection limit in analytical procedures. The advantage is thatQqQ can perform this operation for multiple precursor and prod-uct ions with high sensitivity, and selectivity, that is commonlynow as multiple reaction monitoring (MRM). The disadvantageis that the spectrum can not be obtained.
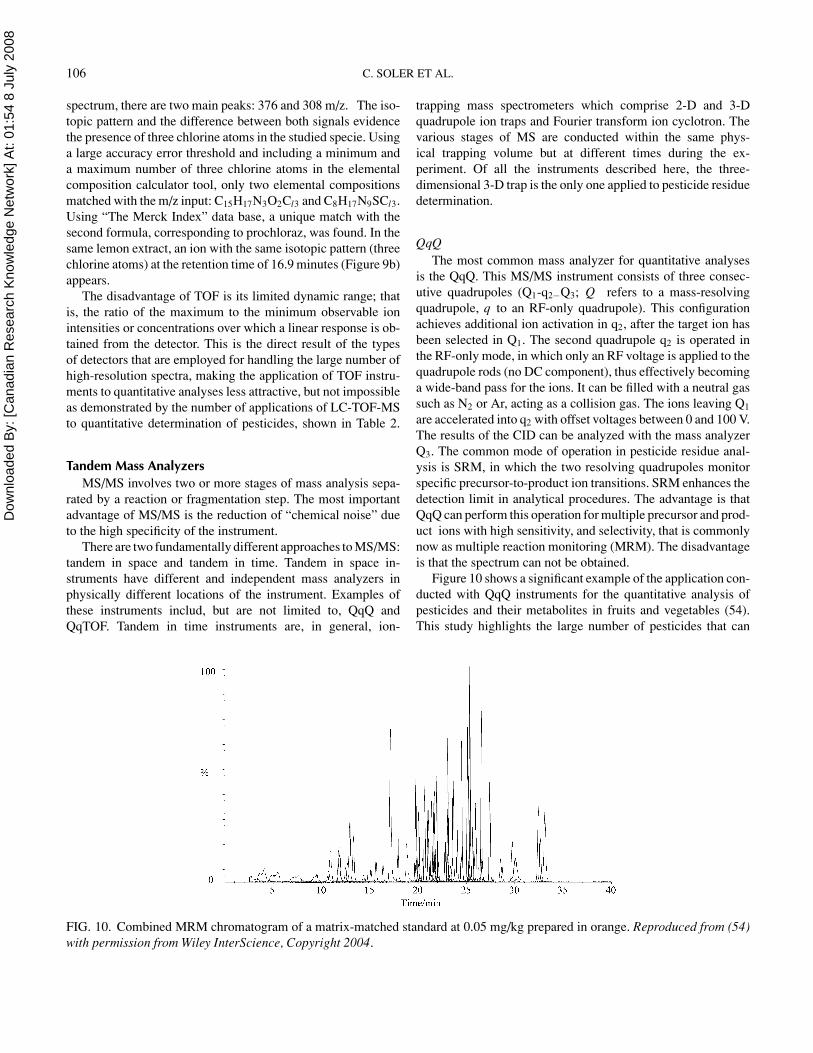
Figure 10 shows a significant example of the application con-ducted with QqQ instruments for the quantitative analysis ofpesticides and their metabolites in fruits and vegetables (54).This study highlights the large number of pesticides that can

Dow
nloa
ded
By:
[Can
adia
n R
esea
rch
Kno
wle
dge
Net
wor
k] A
t: 01
:54
8 Ju
ly 2
008
TAB
LE
2A
pplic
atio
nsof
TO
Fin
pest
icid
esan
alys
isin
food
Rec
over
yL
OD
LO
QPe
stic
ide
Mat
rix
Ext
ract
ion
Det
erm
inat
ion
(%)
(ng/
ml)
(mg/
kg)
Ref
.
3ch
loro
nico
tinyl
pest
icid
esV
eget
able
s15
gsa
mpl
eSL
E(e
thyl
acet
ate
+so
dium
sulf
ate
anhy
drou
s)•E
SIpo
sitiv
e;Z
orba
xE
clip
seX
BD
C8
(150
×4.
6m
m,5
μm
);gr
adie
ntof
acet
onitr
ile-0
.1%
form
icac
idin
wat
erat
flow
rate
0.6
ml/m
in.
•Bet
wee
non
ean
dth
ree
frag
men
tsob
tain
edsi
nce
the
prot
onat
edm
olec
ule
for
each
pest
icid
e.•T
heer
rors
wer
eal
way
sle
ssth
an2
ppm
for
prot
onat
edio
nsan
dle
ssth
an3
ppm
for
the
frag
men
tion
s.
77–1
022–
10(6
6)
15di
ffer
ent
pest
icid
esFr
uits
and
vege
tabl
es15
gsa
mpl
eSL
E(e
thyl
acet
ate
+W
NaS
O4)
•ESI
posi
tive;
Zor
bax
Ecl
ipse
XB
DC
8(1
50×
4.6
mm
,5μ
m);
grad
ient
ofac
eton
itrile
-0.1
%fo
rmic
acid
inw
ater
atflo
wra
te0.
6m
l/min
.•F
ragm
enta
tion
atfr
agm
enta
tor
volta
ges
of19
0an
d23
0V
ofth
epr
oton
ated
mol
ecul
e,ex
cept
orm
etho
myl
,whi
chga
veth
eso
dium
addu
ctw
ere
carr
ied
out.
•The
erro
rsin
ato
mat
oex
trac
tfor
tified
with
the
pest
icid
em
ixtu
rew
ere
<2
ppm
for
allt
hean
alyt
es.
0.5–
300.
01–0
.5(6
7)
Non
-tar
get
chlo
rina
ted
Frui
tsan
dve
geta
bles
15g
sam
ple
bySL
E(a
ceto
nitr
ile+
NaC
l+M
gSO
4)
and
SPE
(PSA
+M
gSO
4)
•ESI
posi
tive;
Zor
bax
Ecl
ipse
XB
DC
8(1
50×
4.6
mm
,5μ
m);
grad
ient
ofac
eton
itrile
-0.1
%fo
rmic
acid
inw
ater
atflo
wra
te0.
6m
l/min
.•T
ICw
assc
rutin
ized
inor
der
tofin
dun
ambi
guou
sst
ruct
ural
info
rmat
ion.
•The
prop
osed
elem
enta
lcom
posi
tion
ofea
chfr
agm
enti
onw
asco
mpa
red
with
the
stru
ctur
eof
the
susp
ecte
dsp
ecie
spr
opos
ed.
(68)
Iden
tifica
tion
ofim
azal
ilan
dpr
ochl
oraz
Citr
usfr
uits
15g
sam
ple
bySL
E(a
ceto
nitr
ile+
NaC
l+M
gSO
4)
and
SPE
(PSA
+M
gSO
4)
•ESI
posi
tive;
Zor
bax
Ecl
ipse
XB
DC
8(1
50×
4.6
mm
,5μ
m);
grad
ient
ofac
eton
itrile
-0.1
%fo
rmic
acid
inw
ater
atflo
wra
te0.
6m
l/min
.•I
dent
ifica
tion
and
confi
rmat
ion
ofpa
rent
com
poun
dsw
ere
base
don
the
accu
rate
mas
sm
easu
rem
ento
fm
olec
ular
and
frag
men
tsio
ns.
Frag
men
tatio
nw
asch
eked
byL
C-I
T-M
S.
(53)
107

Dow
nloa
ded
By:
[Can
adia
n R
esea
rch
Kno
wle
dge
Net
wor
k] A
t: 01
:54
8 Ju
ly 2
008
108 C. SOLER ET AL.
be simultaneously determined (more than 73 in this case). Inthese analyses, the MRM mode is almost always applied, allow-ing enhanced sensitivity and selectivity by circumventing iso-baric interferences from food. LC-MS/MS with QqQ in SRMhas become so far the most widely used technique overall inthe multi-residues methods for the quantitation of pesticides infood (Table 3) because, under these conditions, a high sensi-tivity is achieved. Nowadays, a QqQ mass spectrometer is ableto detect approximately 100 analytes simultaneously with suf-ficient sensitivity for determination at the μg/kg level. The useof time windows programm (periods) is not necessary unlessthe number of analytes to be analyzed within one run is signifi-cantly increased, or the compound presents a very low response.Because of the high sensitivity achieved by MS/MS, gradientelution on a small RP analytical column is usually sufficient foridentification. However, for confirmation purposes, at least twotransitions must be recorded, and then an increase in the limitsof detection (LODs) occurs because the second transition is lessabundant. Usually, transitions from the most abundant precursorto the most abundant product ions are selected. Small fragmentswith m/z ratios of < 80 were generally omitted if alternativeproduct ions are available.
QITThe QIT is the 3- D version of the linear quadrupole mass fil-
ter. In this device, ions are subjected to forces applied by an RFfield but the forces occurs in the three dimensions instead of justtwo (55, 56). This mass analyzer consists of three electrodes:one ring electrode between two hyperbolic endcap electrodes,which form a 3-D trap. The oscillating potential difference estab-lished between the ring and endcap electrodes forms a substantialquadrupolar field (up to 6 kV of RF voltage can be applied toproduce the trapping and the scanning). The ions pass in and outof the traps by holes in the endcaps (56, 57).
The QIT instrument has the advantage, over other tandemmass analyzers, that it multiplies the stages of mass analysisnumerous times by preselecting an ion and analyzing the in-duced fragments, which helps to elucidate fragmentation path-ways (58). This is designated as multi-stage tandem mass spec-trometry (MSn), analysis, where n−1 indicates the number offragmentation steps used (55).
The principal advantages of the QIT in chemical analysisare: high sensitivity of full-scan in MS and MS/MS modesand MS/MS experiments are available by performing sequentialmass analysis measurements. Precursor ion isolation, fragmen-tation and product ion analysis all take place in the trappingvolume by separating the events in time, rather than in space.Supplementary frequencies applied to the end cap electrodesare used both to eject unwanted ions during the precursor ionisolation and to excite precursor ions to carry out CID.
These features make QIT an attractive option to detect pes-ticides in food; some more relevant examples are related inTable 4. For the determination of pesticides that are completely
unknown, data dependent full-scan MS and MSn are proposedby some authors (53, 59).
QIT also suffers from some drawbacks, such as: (i) low res-olution and mass shift, (ii) limited dynamic range (i.e., it cannot handle samples in which the ion abundances vary greatlyand the range of ion traps is limited to ∼106—when there aretoo many ions in the trap, space charge effects led to diminishperformance), (iii) the inability to trap product ions below 50m/z and the existence of an upper limit on the ratio betweenthe precursor mass and the lowest trapped fragment ion mass,which is approximately 0.3 depending on the qz value. and (iv)the limited number of ions that can be simultaneously isolatedand fragmented.
Figure 11 shows an example of MS3 determination of 10 pes-ticides. Chromatograms correspond to tangerine samples (non-spiked and spiked at limit of quantification (LOQ) levels). Thechromatographic resolution and the peak performance were sat-isfactory for the studied pesticides in the spiked samples. Thesample that contains none of the studied pesticides show thelack of interfering peaks that can give a false positive sample(60).
Qq TOFThe implementation of a quadrupole mass filter prior to the
TOF tube is another tandem mass spectrometer that is used in thefield of food toxicant analysis. In fact, this can be taken one stepfurther by adding a second, radio frequency RF-only quadrupoleas a collision cell (Q1-q2-TOF). The TOF analyzer then is usedto provide accurate mass data for fragment ions formed in q2.
QqTOF can work in single MS as well as MS/MS operationmodes. In the former, the first quadrupole is operated in bandpass mode and the analysis is performed on the high-end TOFanalyzer. For MS/MS, a precursor ion is selected in the firstquadrupole, the second produces CID and the mass analysis ofthe fragment ions is performed in the TOF analyzer. By virtueof its MS/MS capabilities, full-scan product ion spectra are ob-tained and any ion can be selected to reconstruct an ion chro-matogram. Contrary to QqQ instruments, the high resolutionanalysis allows the construction of accurate, sub-unit mass in-terval ion chromatogram, which results in a better signal to noiseratio.
However, its applications in the field of pesticides analysisin food are still very scarce due to several disadvantages at-tributed to the QqTOF that, in addition to its high cost, are thesame reported for the TOF: low efficiency in obtaining quanti-tative information at trace levels, narrow dynamic ranges, littlerobustness and lack of accuracy for quantitative purposes. Theonly reported application has been to determine carbosulfan andits main metabolites in citrus (61). The comparison of this massanalyzer with QqQ and QIT demonstrated that the sensitivityfor QqTOF was worse than for QqQ and similar to QIT. In spiteof this disadvantage, the exact mass measurements improvesidentification capabilities very much.

Dow
nloa
ded
By:
[Can
adia
n R
esea
rch
Kno
wle
dge
Net
wor
k] A
t: 01
:54
8 Ju
ly 2
008
TAB
LE
3A
pplic
atio
nsof
trip
lequ
adru
pole
inpe
stic
ides
anal
ysis
info
od
Rec
over
yL
OD
LO
QPe
stic
ide
Mat
rix
Ext
ract
ion
Det
erm
inat
ion
(%)
(ng/
ml)
(mg/
kg)
Ref
.
Car
bam
ates
,be
nzim
idaz
oles
and
orga
noph
osph
ates
.
Frui
tjui
ces
1g
sam
ple
byM
SPD
(dia
tom
aceo
usea
rth
+et
hyla
ceta
te)
•TIS
posi
tive
and
nega
tive
(ipr
odio
ne);
Allt
ima
C18
(250
×4.
6m
m,5
μm
);gr
adie
ntof
MeO
H-w
ater
atflo
wra
te1
ml/m
in.P
ost-
colu
mn
addi
tion
of20
mM
form
icac
idat
flow
rate
0.1
ml/m
in.
•SR
Mof
the
one
mos
tsen
sibl
etr
ansi
tion
•Dat
aac
quis
ition
was
divi
ded
into
4tim
e-w
indo
ws.
77–1
028–
120
0.00
05–0
.01
(69)
74pe
stic
ides
(car
bam
ates
,co
nazo
le,
benz
imid
azol
ean
dpy
rim
idin
e)
Frui
tsan
dve
geta
bles
20g
sam
ple
SLE
(eth
ylac
etat
e)•E
SIpo
sitiv
e;N
ucle
osil
100
C18
(70
×2
mm
,5μ
m);
grad
ient
MeO
H-w
ater
(0.1
%fo
rmic
acid
)at
flow
rate
0.3
ml/m
in.
•SR
Mof
two
abun
dant
MS/
MS
tran
sitio
nfo
rea
chsu
bsta
nce
was
used
divi
ded
in11
acqu
isiti
ongr
oups
.•F
orsu
spec
ted
sam
ples
,tw
oco
nfirm
atio
nan
alys
esw
ere
cond
ucte
d.
63–1
330.
01(4
7)
32m
ulti-
clas
spe
stic
ides
Frui
tsan
dve
geta
bles
10g
sam
ple
bySL
E(e
thyl
acet
ate
+N
a 2SO
4)
•ESI
posi
tive;
Pola
ris
C18
-A(1
50×
2m
m,5
μm
);gr
adie
ntM
eOH
-2m
Mam
mon
ium
form
ate
atflo
wra
te0.
2m
l/min
.•M
RM
ofpr
oton
ated
mol
ecul
ean
dth
em
osta
bund
anta
ndch
arac
teri
stic
frag
men
tion
was
used
for
quan
titat
ion
sepa
rate
din
indi
vidu
altim
e-w
indo
ws
for
each
anal
yte.
•Tw
ose
lect
edfr
agm
enti
ons
wer
ese
lect
edfo
rco
nfirm
atio
n.
74–1
05<
10.
009–
0.02
5(7
0)
8tr
iazo
lican
dpy
rim
idin
efu
ngic
ides
Tom
ato
pure
ean
dle
mon
juic
e20
gto
mat
opu
ree
and
10g
lem
onju
ice
byL
LE
(ace
tone
+N
aCl,
ethy
lac
etat
e-cy
cloh
exan
e+
Na 2
SO4)
•ESI
posi
tive;
Zor
bax
SB-1
8(5
0×
2.1
mm
,3.5
μm
);gr
adie
nt2%
aque
ous
form
icac
id-M
eOH
atflo
wra
te0.
2m
l/min
.•F
oral
lcom
poun
ds,t
hepr
oton
ated
mol
ecul
ario
nw
asth
em
osta
bund
ant
inth
efu
llm
ass
spec
trum
.•T
wo
MS/
MS
tran
sitio
nsw
ere
mon
itore
dfo
rea
chpe
stic
ides
.•F
orPe
ncon
azol
e,th
em
onito
riza
tion
ofa
thir
dtr
ansi
tion
was
poss
ible
.
0.00
5–0.
01(4
9)
109

Dow
nloa
ded
By:
[Can
adia
n R
esea
rch
Kno
wle
dge
Net
wor
k] A
t: 01
:54
8 Ju
ly 2
008
32pe
stic
ides
and
25T
Psbe
nzim
idaz
oles
and
carb
amat
es
Frui
tsan
dve
geta
bles
gsa
mpl
eby
SLE
(eth
ylac
etat
e+
Na 2
SO4)
•ESI
posi
tive
and
nega
tive
mod
e,G
enes
isC
18(1
00×
3m
m,4
μm
),gr
adie
ntM
eOH
-10
mM
amm
oniu
mfo
rmat
ein
MeO
H-w
ater
at0.
3m
l/min
.•T
hefr
agm
enta
tion
ofth
epr
oton
ated
mol
ecul
ega
vetw
oab
unda
ntio
ns.
•Use
ofan
inte
rnal
stan
dard
for
confi
rmat
ion.
70–1
000.
01–0
.5(2
4)
57pe
stic
ides
and
16T
Psm
ainl
yca
rbam
ates
Frui
tsan
dve
geta
bles
10g
sam
ple
SLE
(ace
toni
trile
+M
gSO
4+
NaC
l)
•ESI
posi
tive,
HyP
UR
ITY
C18
(150
×2.
1m
m,5
μm
),gr
adie
nt10
mM
aque
ous
amm
oniu
mac
etat
e-M
eOH
atflo
wra
te0.
2m
l/min
.•T
heM
S/M
Str
ansi
tion
with
high
est
MR
Mre
spon
sew
asus
edfo
rea
chan
alyt
eto
build
asc
reen
ing
met
hod.
•To
confi
rmth
ere
sidu
es,t
hesa
mpl
ew
ere
re-a
naly
zed
mon
itori
ngtw
otr
ansi
tions
for
the
resi
dues
foun
d.
77–1
240.
01–0
.1(5
2)
20ca
rbam
ates
and
othe
rre
lativ
ely
pola
rpe
stic
ides
Frui
ts,v
eget
able
san
dce
real
s10
gsa
mpl
e(f
ruits
and
vege
tabl
es)
and
3g
cere
als
SLE
(20
mM
amm
oniu
mac
etat
e-ac
etic
acid
inM
eOH
-wat
er)
•ESI
posi
tive,
Gen
esis
C18
(100
×3
mm
,4μ
m),
grad
ient
wat
er-
MeO
H/w
ater
(20
mM
amm
oniu
mac
etat
e-ac
etic
acid
)at
flow
rate
0.3
ml/m
in.
•MR
Mde
tect
ion
ofth
em
osts
ensi
tive
MS/
MS
tran
sitio
nse
para
ted
in4
time-
win
dow
sw
ere
used
.•S
econ
dary
tran
sitio
nw
aspo
ssib
lefo
rco
nfirm
atio
nof
only
8pe
stic
ides
.•U
seof
anin
tern
alst
anda
rd(13
C6
I.S.
carb
aryl
)
70–1
200.
01–0
.02
mg/
kg0.
04–2
(13)
24ne
wpe
stic
ides
Lem
onju
ice,
tom
ato
and
appl
epu
ree
10g
sam
ple
LL
E(a
ceto
ne+
ethy
lac
etat
e-ci
cloh
exan
e+
Na 2
SO4+
NaC
l)
•ESI
posi
tive;
Syne
rgy
Pola
r-R
P(1
50×
2m
m,4
μm
);gr
adie
nt0.
1%aq
ueou
sfo
rmic
acid
-ace
toni
trile
atflo
wra
te0.
25m
l/min
.•5
5M
RM
tran
sitio
nsw
ere
carr
ied
out
(2ta
nsiti
ons
for
alm
osta
llan
alyt
esan
d3
inth
eca
seof
7pe
stic
ides
)in
asi
ngle
inje
ctio
nus
ing
only
one
rete
ntio
ntim
ew
indo
w.
76–1
060.
001–
0.01
and
0.00
2–0.
02(5
0)
110
Dow
nloa
ded
By:
[Can
adia
n R
esea
rch
Kno
wle
dge
Net
wor
k] A
t: 01
:54
8 Ju
ly 2
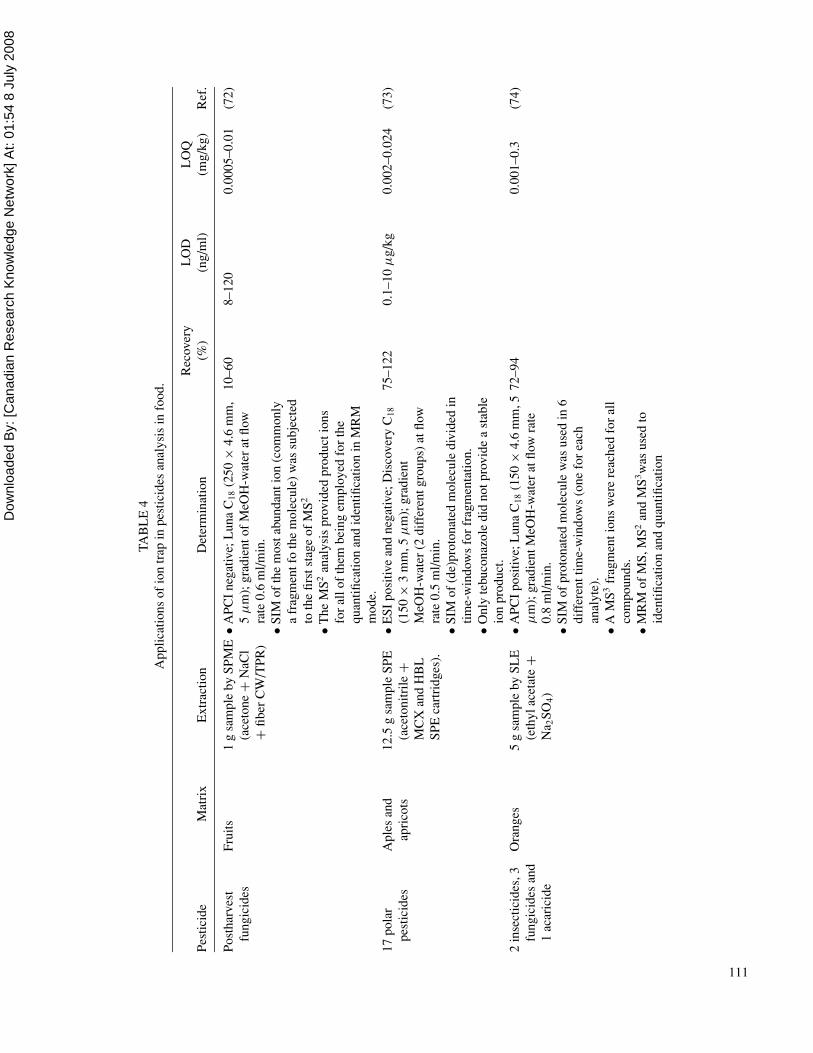
008
TAB
LE
4A
pplic
atio
nsof
ion
trap
inpe
stic
ides
anal
ysis
info
od.
Rec
over
yL
OD
LO
QPe
stic
ide
Mat
rix
Ext
ract
ion
Det
erm
inat
ion
(%)
(ng/
ml)
(mg/
kg)
Ref
.
Post
harv
est
fung
icid
esFr
uits
1g
sam
ple
bySP
ME
(ace
tone
+N
aCl
+fib
erC
W/T
PR)
•APC
Ine
gativ
e;L
una
C18
(250
×4.
6m
m,
5μ
m);
grad
ient
ofM
eOH
-wat
erat
flow
rate
0.6
ml/m
in.
•SIM
ofth
em
osta
bund
anti
on(c
omm
only
afr
agm
entf
oth
em
olec
ule)
was
subj
ecte
dto
the
first
stag
eof
MS2
•The
MS2
anal
ysis
prov
ided
prod
ucti
ons
for
allo
fth
embe
ing
empl
oyed
for
the
quan
tifica
tion
and
iden
tifica
tion
inM
RM
mod
e.
10–6
08–
120
0.00
05–0
.01
(72)
17po
lar
pest
icid
esA
ples
and
apri
cots
12.5
gsa
mpl
eSP
E(a
ceto
nitr
ile+
MC
Xan
dH
BL
SPE
cart
ridg
es).
•ESI
posi
tive
and
nega
tive;
Dis
cove
ryC
18
(150
×3
mm
,5μ
m);
grad
ient
MeO
H-w
ater
(2di
ffer
entg
roup
s)at
flow
rate
0.5
ml/m
in.
•SIM
of(d
e)pr
oton
ated
mol
ecul
edi
vide
din
time-
win
dow
sfo
rfr
agm
enta
tion.
•Onl
yte
buco
nazo
ledi
dno
tpro
vide
ast
able
ion
prod
uct.
75–1
220.
1–10
μg/
kg0.
002–
0.02
4(7
3)
2in
sect
icid
es,3
fung
icid
esan
d1
acar
icid
e
Ora
nges
5g
sam
ple
bySL
E(e
thyl
acet
ate
+N
a 2SO
4)
•APC
Ipo
sitiv
e;L
una
C18
(150
×4.
6m
m,5
μm
);gr
adie
ntM
eOH
-wat
erat
flow
rate
0.8
ml/m
in.
•SIM
ofpr
oton
ated
mol
ecul
ew
asus
edin
6di
ffer
entt
ime-
win
dow
s(o
nefo
rea
chan
alyt
e).
•AM
S3fr
agm
enti
ons
wer
ere
ache
dfo
ral
lco
mpo
unds
.•M
RM
ofM
S,M
S2an
dM
S3w
asus
edto
iden
tifica
tion
and
quan
tifica
tion
72–9
40.
001–
0.3
(74)
111
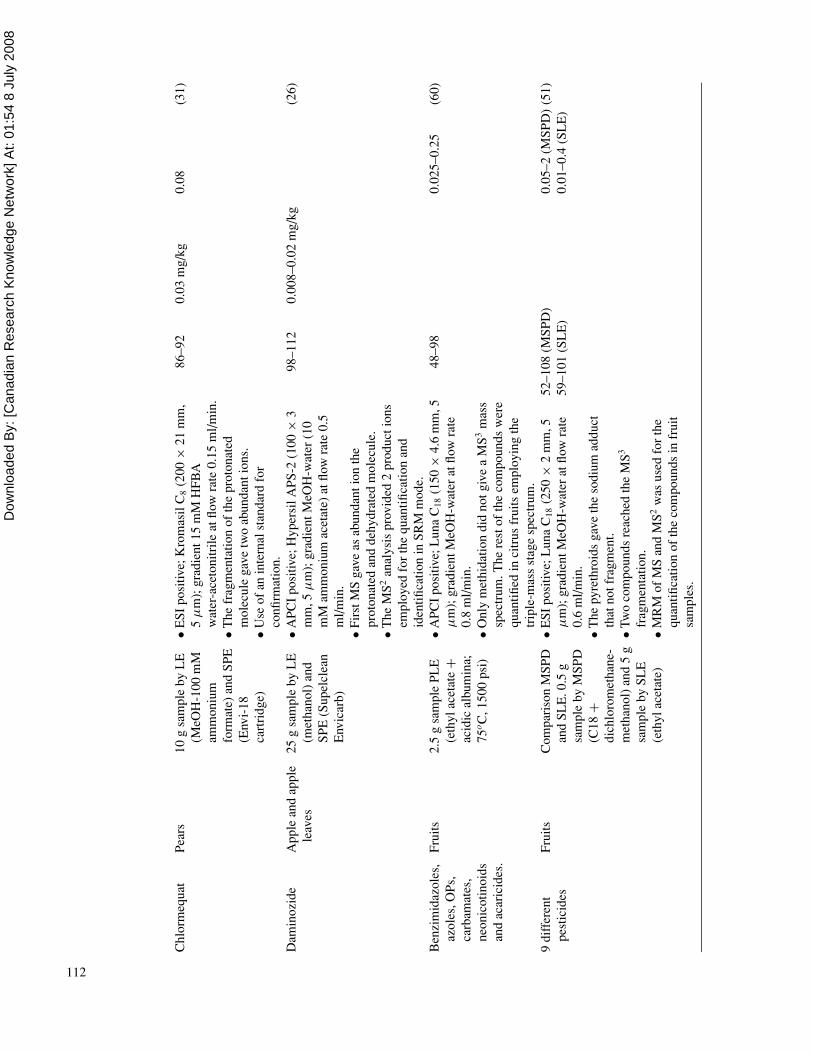
Dow
nloa
ded
By:
[Can
adia
n R
esea
rch
Kno
wle
dge
Net
wor
k] A
t: 01
:54
8 Ju
ly 2
008
Chl
orm
equa
tPe
ars
10g
sam
ple
byL
E(M
eOH
-100
mM
amm
oniu
mfo
rmat
e)an
dSP
E(E
nvi-
18ca
rtri
dge)
•ESI
posi
tive;
Kro
mas
ilC
8(2
00×
21m
m,
5μ
m);
grad
ient
15m
MH
FBA
wat
er-a
ceto
nitr
ileat
flow
rate
0.15
ml/m
in.
•The
frag
men
tatio
nof
the
prot
onat
edm
olec
ule
gave
two
abun
dant
ions
.•U
seof
anin
tern
alst
anda
rdfo
rco
nfirm
atio
n.
86–9
20.
03m
g/kg
0.08
(31)
Dam
inoz
ide
App
lean
dap
ple
leav
es25
gsa
mpl
eby
LE
(met
hano
l)an
dSP
E(S
upel
clea
nE
nvic
arb)
•APC
Ipo
sitiv
e;H
yper
silA
PS-2
(100
×3
mm
,5μ
m);
grad
ient
MeO
H-w
ater
(10
mM
amm
oniu
mac
etat
e)at
flow
rate
0.5
ml/m
in.
•Fir
stM
Sga
veas
abun
dant
ion
the
prot
onat
edan
dde
hydr
ated
mol
ecul
e.•T
heM
S2an
alys
ispr
ovid
ed2
prod
ucti
ons
empl
oyed
for
the
quan
tifica
tion
and
iden
tifica
tion
inSR
Mm
ode.
98–1
120.
008–
0.02
mg/
kg(2
6)
Ben
zim
idaz
oles
,az
oles
,OPs
,ca
rbam
ates
,ne
onic
otin
oids
and
acar
icid
es.
Frui
ts2.
5g
sam
ple
PLE
(eth
ylac
etat
e+
acid
ical
bum
ina;
75o C
,150
0ps
i)
•APC
Ipo
sitiv
e;L
una
C18
(150
×4.
6m
m,5
μm
);gr
adie
ntM
eOH
-wat
erat
flow
rate
0.8
ml/m
in.
•Onl
ym
ethi
datio
ndi
dno
tgiv
ea
MS3
mas
ssp
ectr
um.T
here
stof
the
com
poun
dsw
ere
quan
tified
inci
trus
frui
tsem
ploy
ing
the
trip
le-m
ass
stag
esp
ectr
um.
48–9
80.
025–
0.25
(60)
9di
ffer
ent
pest
icid
esFr
uits
Com
pari
son
MSP
Dan
dSL
E.0
.5g
sam
ple
byM
SPD
(C18
+di
chlo
rom
etha
ne-
met
hano
l)an
d5
gsa
mpl
eby
SLE
(eth
ylac
etat
e)
•ESI
posi
tive;
Lun
aC
18(2
50×
2m
m,5
μm
);gr
adie
ntM
eOH
-wat
erat
flow
rate
0.6
ml/m
in.
•The
pyre
thro
ids
gave
the
sodi
umad
duct
that
notf
ragm
ent.
•Tw
oco
mpo
unds
reac
hed
the
MS3
frag
men
tatio
n.•M
RM
ofM
San
dM
S2w
asus
edfo
rth
equ
antifi
catio
nof
the
com
poun
dsin
frui
tsa
mpl
es.
52–1
08(M
SPD
)59
–101
(SL
E)
0.05
–2(M
SPD
)0.
01–0
.4(S
LE
)(5
1)
112
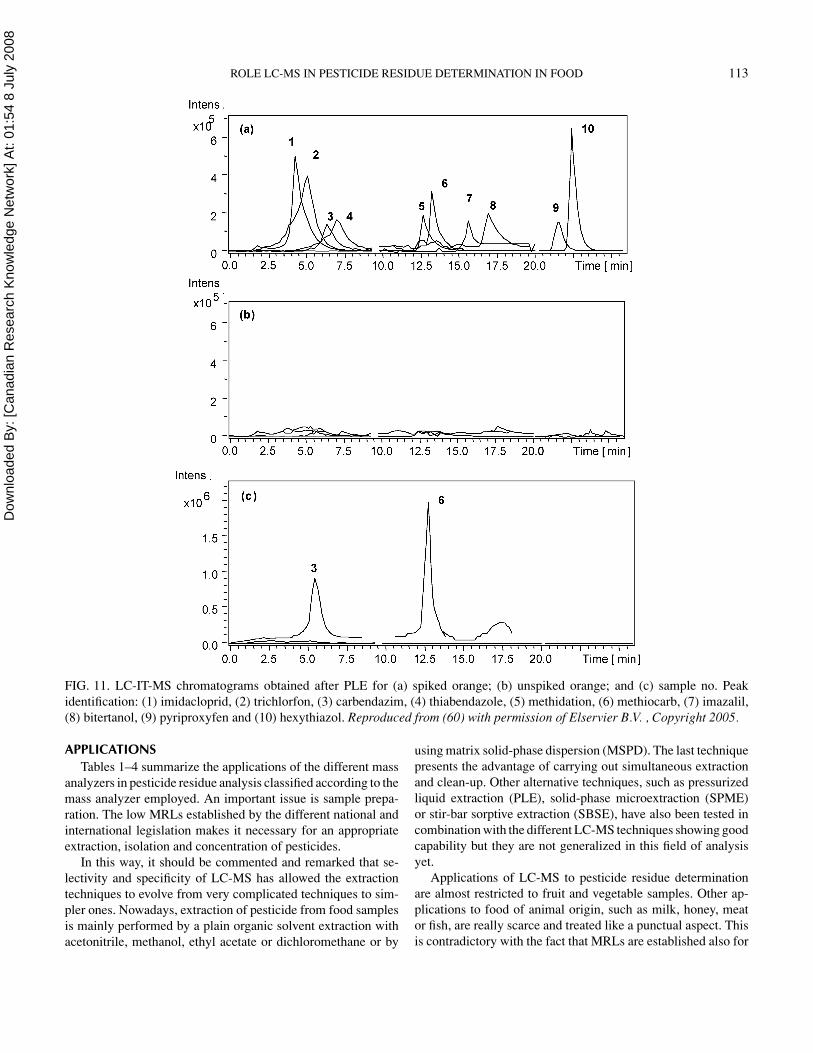
Dow
nloa
ded
By:
[Can
adia
n R
esea
rch
Kno
wle
dge
Net
wor
k] A
t: 01
:54
8 Ju
ly 2
008
ROLE LC-MS IN PESTICIDE RESIDUE DETERMINATION IN FOOD 113
FIG. 11. LC-IT-MS chromatograms obtained after PLE for (a) spiked orange; (b) unspiked orange; and (c) sample no. Peakidentification: (1) imidacloprid, (2) trichlorfon, (3) carbendazim, (4) thiabendazole, (5) methidation, (6) methiocarb, (7) imazalil,(8) bitertanol, (9) pyriproxyfen and (10) hexythiazol. Reproduced from (60) with permission of Elservier B.V. , Copyright 2005.
APPLICATIONSTables 1–4 summarize the applications of the different mass
analyzers in pesticide residue analysis classified according to themass analyzer employed. An important issue is sample prepa-ration. The low MRLs established by the different national andinternational legislation makes it necessary for an appropriateextraction, isolation and concentration of pesticides.
In this way, it should be commented and remarked that se-lectivity and specificity of LC-MS has allowed the extractiontechniques to evolve from very complicated techniques to sim-pler ones. Nowadays, extraction of pesticide from food samplesis mainly performed by a plain organic solvent extraction withacetonitrile, methanol, ethyl acetate or dichloromethane or by
using matrix solid-phase dispersion (MSPD). The last techniquepresents the advantage of carrying out simultaneous extractionand clean-up. Other alternative techniques, such as pressurizedliquid extraction (PLE), solid-phase microextraction (SPME)or stir-bar sorptive extraction (SBSE), have also been tested incombination with the different LC-MS techniques showing goodcapability but they are not generalized in this field of analysisyet.
Applications of LC-MS to pesticide residue determinationare almost restricted to fruit and vegetable samples. Other ap-plications to food of animal origin, such as milk, honey, meator fish, are really scarce and treated like a punctual aspect. Thisis contradictory with the fact that MRLs are established also for

Dow
nloa
ded
By:
[Can
adia
n R
esea
rch
Kno
wle
dge
Net
wor
k] A
t: 01
:54
8 Ju
ly 2
008
114 C. SOLER ET AL.
this type of food and the analysis of these samples is frequentlyrequired.
The “boom” of LC-MS application has been exploited inthe last five years because of the strict regulations in this field.Among the different mass analyzers, QqQ is the most widelyused because of its high sensitivity and because the number tran-sition required for confirmation are easily attained. In addition,until the moment, QqQ is the most suitable mass spectrometerto determine up to 50 pesticides in the same injection.
CONCLUSIONS AND FUTURE TRENDSThe common feature of different approaches to pesticide
chemistry is the appearance of compounds increasingly morepolar. For this reason, LC techniques, especially RP, are use-ful in their separation without any pre-treatment. Moreover, thecontribution of MS, with its high sensitivity and considerablediagnostic power, is fundamental. The relatively high numberof publications on the analysis of pesticides in food samples byLC coupled to MS/MS shows that this technique has becomea powerful tool in the quality control of food and food safetyissues.
Although reported results are controversial, ESI is the mostfrequently utilized ionization source because of its higher sen-sitivity for most important group of pesticides. Deeper studiesinto the different source designs are required to find a relationbetween sensitivity and ionization source.
The benefits of LC-M for pesticide residue analysis in foodare widely recognized. However, some critical aspects need tobe taken into account in relation to quantification, especially thematrix effect is an unresolved question yet. Some approachesto overcome this effect have been commented on and discussedthoroughly in this paper. The tendency is to perform an appro-priate quantification with matrix-matched standards.
QqQ is the instrument most commonly used in this field be-cause the lower LODs achievable permit compliance with thestrict MRLs established by governing authorities. Both QqQand QIT are frequently used in this field. The use of high perfor-mance mass analyzers such as TOF or QqTOF is also expectedto increase in the next few years. This increased use will befor unknown metabolite identification, for non-target pesticidescreening methods and for analyte confirmation in positive sam-ples.
REFERENCES1. A. T. James and A.J.P. Martin, Gas-liquid partition chromatogra-
phy: The separation and micro-estimation of volatile fatty acidsfrom formic acid to dodecanoic acid. Biochemical Journal 50(1952):679–690.
2. K. D. Bartle and P. Myers, History of gas chromatography. Trendsin Analytical Chemistry 21 (2002):547–557.
3. F. J. Santos and M.T. Galceran, Modern developments in gaschromatography-mass spectrometry-based environmental analy-sis. Journal of Chromatography A 1000 (2003):125–151.
4. F. J. Santos and M.T. Galceran, The application of gas chromatog-raphy to environmental analysis. Trends in Analytical Chemistry21 (2002):672–685.
5. S. J. Lehotay and J. Hajslova, Applications of gas chromatographyin food analysis. Trends in Analytical Chemistry 21 (2002):686–697.
6. A. Ishii, K. Watanabe-Suzuki, H. Seno, O. Suzuki, and Y. Kat-sumata, Application of gas chromatography-surface ionization or-ganic mass spectrometry to forensic toxicology. Journal of Chro-matography B 776 (2002):3–14.
7. G. R. van der Hoff and P. van Zoonen, Trace analysis of pesti-cides by gas chromatography. Journal of Chromatography A 843(1999):301–322.
8. M. Careri, A. Mangia, and M. Musci, Applications of liquidchromatography-mass spectrometry interfacing systems in foodanalysis: pesticides drug and toxic substance residues. Journal ofChromatography A 727 (1996):153–184.
9. C. Soler, J. Manes, and Y. Pico. Routine application using sin-gle quadrupole liquid chromatography-mass spectrometry to pes-ticides analysis in citrus fruits. Journal of Chromatography A 1088(2005):224–233.
10. E. Hogendoorn and P. van Zoonen, Recent and future developmentof liquid chromatography in pesticide trace analysis. Journal ofChromatography A 892 (2000):435–453.
11. T. Reemtsma, Liquid chromatography-mass spectometry andstrategies for trace-level analysis of polar organic pollutants. Jour-nal of Chromatography A 1000 (2003):477–501.
12. F. E. Ahmed, Analyses of pesticides and their metabolites in foodsand drinks. Trends in Analytical Chemistry 20 (2001):649–661.
13. G. F. Pang, Y. M. Liu, C. L. Fan, J. J. Zhang, Y. Z. Cao, X. M. Li, Z.Y. Li, Y. P. Wu, and T.T. Guo, Simultaneous determination of 405pesticide residues in grain by accelerated solvent extraction thengas chromatography-mass spectrometry or liquid chromatography-tandem mass spectrometry. Analytical and Bioanalytical Chem-istry 384 (2006):1366–1408.
14. R. B. Geerdink, W. N. A. Niessen, and U.A.Th. Brinkman, Trace-level determination of pesticides in water by means of liquid and gaschromatography. Journal of Chromatography A 970 (2002):65–93.
15. F. Hernandez, J. V. Sancho, and O. J. Pozo, Critical review of theapplication of liquid chromatography/mass spectrometry to the de-termination of pesticide residues in biological samples. Analyticaland Bioanalytical Chemistry 382 (2005):934–946.
16. A. Garrido Frenich, I. Martinez Salvador, J.L. Martinez Vidal,and T. Lopez-Lopez, Determination of multiclass pesticides infood commodities by pressurized liquid extraction using GC–MS/MS and LC–MS/MS. Analytical and Bioanalytical Chemistry383 (2005):1106–1118.
17. J. Wang, W. Cheung, and D. Grant, Determination of pesticides inapple-based infant foods using liquid chromatography electrosprayionization tandem mass spectrometry. Jounal of Agricultural andFood Chemestry 53 (2005):528–537.
18. Y. Pico, G. Font, J.C. Molto, and J. Manes, Pesticide residue deter-mination in fruit and vegetables by liquid chromatography–massspectrometry. Journal of Chromatography A 882 (2000):153–173.
19. F. Hernandez, O.J. Pozo, J.V. Sancho, L. Bijlsma, M. Barreda, andE. Pitarch, Multiresidue liquid chromatography tandem mass spec-trometry determination of 52 non gas chromatography-amenable

Dow
nloa
ded
By:
[Can
adia
n R
esea
rch
Kno
wle
dge
Net
wor
k] A
t: 01
:54
8 Ju
ly 2
008
ROLE LC-MS IN PESTICIDE RESIDUE DETERMINATION IN FOOD 115
pesticides and metabolites in different food commodities. Journalof Chromatography A 1109 (2006):242–252.
20. Y. Pico, G. Font, M.J. Ruiz, and M. Fernandez, Mass SpectrometryReviews 25 (2006):917–960.
21. B.A. Ingelse, R.C.J. van Dam, R.J. Vreeken, and H.G.J. Mol, De-termination of polar organophosphorus pesticides in aqueous sam-ples by direct injection using liquid chromatography–tandem massspectrometry. Journal of Chromatography A 918 (2001):67–78.
22. A. Aguera, S. Lopez, A. R. Fernandez-Alba, M. Contreras, J.Crespo, and L. Piedra, One-year routine application of a newmethod based on liquid chromatography–tandem mass spectrome-try to the analysis of 16 multiclass pesticides in vegetable samples.Journal of Chromatography A 1045 (2004):125–135.
23. M. Careri, F. Bianchi, and C. Corradini, Recent advances in theapplication of mass spectrometry in food-related analysis. Journalof Chromatography A 970 (2002):3–64.
24. C. Jansson, T. Pihlstrom, B. G. Osterdahl, and K. E. Markides,A new multi-residue method for analysis of pesticide residuesin fruit and vegetables using liquid chromatography with tandemmass spectrometric detection. Journal of Chromatography A 1023(2004):93–104.
25. C. Blasco, M. Fernandez, Y. Pico, G. Font, and J. Manes, Simulta-neous determination of imidacloprid, carbendazim, methiocarb andhexythiazox in peaches and nectarines by liquid chromatography-mass spectrometry. Analytica Chimica Acta 461 (2002):109–116.
26. H. G. J. Mol, R. C. J. van Dam, R. J. Vreeken, and O. M. Steijger,Determination of daminozide in apples and apple leaves by liquidchromatography mass spectrometry. Journal of ChromatographyA 833 (1999):53–60.
27. M. Cantero, S. Rubio, and D. Perez-Bendito, Determination of non-ionic polyethoxylated surfactants in sewage sludge by coacervativeextraction and ion trap liquid chromatography-mass spectrometry.Journal of Chromatography A 1046 (2004):147–153.
28. L. H. Levine, J. L. Garland, and J. V. Johnson, HPLC/ESI-quadrupole ion trap mass spectrometry for characterization and di-rect quantification of amphoteric and nonionic surfactants in aque-ous samples. Analytical Chemistry 74 (2002):2064–2071.
29. V. Ingrand, G. Herry, J. Beausse, and M. R. de Roubin, Analysisof steroid hormones in effluents of wastewater treatment plantsby liquid chromatography-tandem mass spectrometry. Journal ofChromatography A, 1020 (2003):99–104.
30. T. Benijts, W. Lambert, and A. De Leenheer, Analysis of multipleendocrine disruptors in environmental water via wide-spectrumsolid-phase extraction and dual-polarity ionization LC-ion trap-MS/MS. Analytical Chemistry 76 (2004):704–711.
31. R. Castro, E. Moyano, and M. T. Galceran, Determinationof chlormequat in fruit samples by liquid chromatography-electrospray tandem mass spectrometry. Journal of AOAC Inter-national 84 (2001):1903–1908.
32. C. Soler, B. Hamilton, A. Furey, J. K. James, J. Manes, Y. Pico, Op-timization of LC-MS/MS using triple quadrupole mass analyzer forthe simultaneous analysis of carbosulfan and its main metabolitesin oranges. Analytica Chimica Acta 571 (2006):1–11.
33. L. Lunar, S. Rubio, and D. Perez-Bendito, Differentiation andquantification of linear alkyl benzenesulfonate isomers by liq-uid chromatography-ion-trap mass spectrometry. Journal of Chro-matography A 1031 (2004):17–25.
34. V. Andreu and Y. Pico, Determination of linear alkylbenzene-sulfonates and their degradation products in solis by liquid
chromatography-electrospray-ion trap multiple-stage mass spec-trometry. Analytical Chemistry 76 (2004):2878–2885.
35. M. C. Peeters, I. Defloor, J. Coosemans, J. A. Delcour, L. Ooms,R. Deliever, and D. De Vos, Simple ion chromatographic methodfor the determination of chlormequat residues in pears. Journal ofChromatography A. .920 (2001):255–259.
36. R. Castro, E. Moyano, and M. T. Galceran, Determinationof quaternary ammonium pesticides by liquid chromatography-electrospray tandem mass spectrometry. Journal of Chromatogra-phy A 914 (2001):111–121.
37. R. Jeannot, H. Sabik, E. Sauvard, and E. Genin, Application of liq-uid chromatography with mass spectrometry combined with pho-todiode array detection and tandem mass spectrometry for moni-toring pesticides in surface waters. Journal of Chromatography A879 (2000):51–71.
38. H. G. J. Mol, R. C. J. van Dam, R. J. Vreeken, and O. M. Steijer,Determination of chlormequat in pears by liquid chromatography-mass spectrometry. Journal of AOAC International 83 (2000):742–747.
39. C. S. Evans, J. R. Startin, D. M. Goodall, and B. J. Keely, Tandemmass spectrometric analysis of quaternary ammonium pesticides.Rapid Communications in Mass Spectrometry 15 (2001):699–707.
40. C. S. Evans, J. R. Startin, D. M. Goodall, and B. J. Keely, Improvedsensitivity in detection of chlormequat by liquid chromatography-mass spectrometry. Journal of Chromatography A 897 (2000):399–404.
41. L. Goodwin, J. R. Startin, D. M. Goodall, and B. J. Keely,Tandem mass spectrometric analysis of glyphosate, glufosinate,aminomethylphosphonic acid and methylphosphinicopropinoicacid. Rapid Communications in Mass Spectrometry 17 (2003):963–969.
42. E.M. Thurman, I. Ferrer, and D.Barcelo, Choosing between at-mospheric pressure chemical ionization and electrospray ioniza-tion interfaces for the HPLC/MS analysis of pesticides. AnalyticalChemistry 73 (2001):5441–5449.
43. J. Klein and L. Alder, Applicability of gradient liquid chromatogra-phy with tandem mass spectrometry to the simultaneous screeningfor about 100 pesticides in crops. Journal of Aoac International 86(2003):1015–1037.
44. M. Takino, K. Yamaguchi, and T. Nakahara, Determination ofcarbamate pesticide residues in vegetables and fruits by liq-uid chromatography-atmospheric pressure photoionization– massspectrometry and atmospheric pressure chemical ionization-massspectrometry. Journal of Agricultural and Food Chemistry 52(2004):727–735.
45. N. Yoshioka, Y. Akiyama, and K. Teranishi, Rapid simultane-ous determination of o-phenylphenol, diphenyl, thiabendazole,imazalil and its major metabolite in citrus fruits by liquidchromatography-mass spectrometry using atmospheric pressurephotoionization. Journal of Chromatography A 1022 (2004):145–150.
46. J. Hajslova and J. Zrostlikova, Matrix effects in (ultra) trace anal-ysis of pesticide residues in food and biotic matrices. Journal ofChromatography A 1000 (2003):181–197.
47. D. Ortelli, P. Edder, and C. Corvi, Multiresidue analysis of 74pesticides in fruits and vegetables by liquid chromatography-electrospray-tandem mass spectrometry. Analytica Chimica Acta520 (2004):33–45.

Dow
nloa
ded
By:
[Can
adia
n R
esea
rch
Kno
wle
dge
Net
wor
k] A
t: 01
:54
8 Ju
ly 2
008
116 C. SOLER ET AL.
48. J. L. Martınez Vidal, A. Garrido Frenich, T. Lopez Lopez, I.Martınez Salvador, L. H. el Hassani, and M. H. Benajiba, Selec-tion of a representative matrix for calibration in multianalyte de-termination of pesticides in vegetables by liquid chromatography-electrospray tandem mass spectrometry. Chromatographia 61(2005):127–131.
49. A. Sannino, Evaluation of a method based on liquid chromatog-raphy/electrospray tandem mass spectrometry for analyzing eighttriazolic and pyrimidine fungicides in extracts of processed fruitsand vegetables. Journal of Aoac International 87 (2004):991–996.
50. A. Sannino, L. Bolzoni, and M. Bandini, Application of liquid chro-matography with electrospray tandem mass spectrometry to thedetermination of a new generation of pesticides in processed fruitsand vegetables. Journal of Chromatography A 1036 (2004):161–169.
51. C. Soler, J. Manes, and Y. Pico, Liquid chromatography-electrospray quadrupole ion-trap mass spectrometry of nine pes-ticides in fruits. Journal of Chromatography A 1048 (2004):41–49.
52. M. J. Taylor, K. Hunter, K.B. Hunter, D. Lindsay, and S. Le Bouhel-lec, Multi-residue method for rapid screening and confirmation ofpesticides in crude extracts of fruits and vegetables using isocraticliquid chromatography with electrospray tandem mass spectrome-try. Journal of Chromatography A 982 (2002):225–236.
53. E. M. Thurman, I. Ferrer, J. A. Zweigenbaum, J. F. Garcia-Reyes, M. Woodman, and A. R. Fernandez-Alba, Discover-ing metabolites of post-harvest fungicides in citrus with liquidchromatography/time-of-flight mass spectrometry and ion traptandem mass spectrometry. Journal of Chromatography A 1082(2005):71–80.
54. C. L. Hetherton, M. D. Sykes, R. J. Fussell, and D. M. Goodall,A multi-residue screening method for the determination of 73pesticides and metabolites in fruit and vegetables using high-performance liquid chromatography/tandem mass spectrometry.Rapid Communications in Mass Spectrometry 18 (2004):2443–2450.
55. C. S. Creaser and J. W. Stygall, Recent developments in analyticalion trap mass spectrometry. TrACs Trends in Analytical Chemistry17 (1998):583–593.
56. G. Stafford, Ion trap mass spectrometry: A personal perspec-tive. Journal of the American Society of Mass Spectrometry 13(2002):589–596.
57. S. A. MacLuckey, G. J. Van Berkel, D. E. Goeringer, and G. L.Glish, Ion trap mass spectrometry using high-pressure ionization.Analytical Chemistry, 66 (1994):737 A–743 A.
58. E. T. Furlong, I. Ferrer, P. M. Gates, J. D. Cahill, and E. M.Thurman, Identification of labile polar organic contaminants byatmospheric-pressure ionization tandem mass spectrometry, inLiquid Chromatography/Mass Spectrometry, MS/MS and Time ofFlight MS: Analysis of Emerging Contaminants, I. Ferrer and E.M. Thurman eds. (American Chemical Society, Washington, DC,2003), 175–187.
59. E. M. Thurman, I. Ferrer, and A. R. Fernandez-Alba, Matchingunknown empirical formulas to chemical structure using LC/MSTOF accurate mass and database searching: Example of unknownpesticides on tomato skins. Journal of Chromatography A 1067(2005):127–134.
60. C. Blasco, G. Font, and Y. Pico, Analysis of pesticides in fruits bypressurized liquid extraction and liquid chromatography-ion trap-triple stage mass spectrometry. Journal of Chromatography A 1098(2005):37–43.
61. Carla Soler, Brett Hamilton, Ambrose Furey, Kevin J. James, JordiManes, and Yolanda Pico, Comparison of four mass analyzers fordetermining carbosulfan and its metabolites in citrus by liquid chro-matography/mass spectrometry. Rapid Communications in MassSpectrometry 20 (2006):2151–2164.
62. A. R. Fernandez-Alba, A. Tejedor, A. Aguera, M. Contreras,and J. Garrido, Determination of imidacloprid and benzimidazoleresidues in fruits and vegetables by liquid chromatography-massspectrometry after ethyl acetate multiresidue extraction. Journal ofAoac International 83 (2000):748–755.
63. X. Pous, M. J. Ruiz, Y. Pico, and G. Font, Determination of imi-dacloprid, metalaxyl, myclobutanil, profam and thiabendazole infruit and vegetables by liquid chromatography-atmospheric pres-sure chemical ionization-mass spectrometry. Fresnius Journal ofAnalytical Chemistry 371 (2001):182–189.
64. S. Bogialli, R. Curini, A. Di Corcia, A. Lagana, M. Nazzari, and M.Tonci, Simple and rapid assay for analyzing residues of carbamateinsecticides in bovine milk: hot water extraction followed by liquidchromatography-mass spectrometry. Journal of ChromatographyA 1054 (2004):351–357.
65. S. Biogialli, R. Curini, A. Di Corcia, M. Nazzari, and D.Tamburro, A simple and rapid assay for analyzing residues ofcarbamate insecticides in vegetables and fruits: hot water ex-traction followed by liquid-chromatography-mass spectrometry.Journal of Agricultural and Food Chemistry 52 (2004):665–671.
66. I. Ferrer, E. M. Thurman, and A. R. Fernandez-Alba, Quantitationand accurate mass analysis of pesticides in vegetables by LC/TOF-MS. Analytical Chemistry 77 (2005):2818–2825.
67. I. Ferrer, J. F. Garcıa-Reyes, M. Mezcua, E. M. Thur-man, and A. R. Fernandez-Alba, Multi-residue pesticide anal-ysis in fruits and vegetables by LC-time-of-flight mass spec-trometry. Journal of Chromatography A 1082 (2005):81–90.
68. J. F. Garcia-Reyes, I. Ferrer, E. M. Thurman, A. Molina-Dıaz,and A. R. Fernandez-Alba, Searching for non-target chlorinatedpesticides in food by liquid chromatography/time-of-flight massspectrometry. Rapid Communications in Mass Spectrometry 19(2005):2780–2788.
69. D. Perret, A. Gentili, S. Marchese, M. Sergi, and G. D’Ascenzo,Validation of a method for the determination of multi-class pesticide residues in fruit juices by liquid chromatogra-phy/tandem mass spectrometry after extraction by matrix solid-phase dispersion. Journal of Aoac International 85 (2002):724–730.
70. A. Garrido Frenich, J. L. Martınez Vidal, T. Lopez Lopez, S. CortesAguado, and I. Martınez Salvador, Monitoring multi-class pesti-cide residues in fresh fruits and vegetables by liquid chromatogra-phy with tandem mass spectrometry. Journal of ChromatographyA 1048 (2004):199–206.
71. K. Granby, J. H. Andersen, and H. B. Christensen, Analysis of pes-ticides in fruit, vegetables and cereals using methanolic extractionand detection by liquid chromatography-tandem mass spectrome-try. Analytica Chimica Acta 520 (2004):165–176.
Dow
nloa
ded
By:
[Can
adia
n R
esea
rch
Kno
wle
dge
Net
wor
k] A
t: 01
:54
8 Ju
ly 2
008
ROLE LC-MS IN PESTICIDE RESIDUE DETERMINATION IN FOOD 117
72. C. Blasco, G. Font, J. Manes, and Y. Pico, Solid-phase microex-traction liquid chromatography/tandem mass spectrometry to de-termine postharvest fungicides in fruits. Analytical Chemistry 75(2003):3606–3615.
73. J. Zrostlikova, J. Hajslova, T. Kovalczuk, R. Stepan, and J. Poustka,Determination of seventeen polar/thermolabile pesticides in apples
and apricots by liquid chromatography/mass spectrometry. Journalof Aoac International 86 (2003):612–622.
74. C. Blasco, G. Font, and Y. Pico, Multiple-stage mass spectromet-ric analysis of six pesticides in oranges by liquid chromatography-atmospheric pressure chemical ionization-ion trap mass spectrom-etry. Journal of Chromatography A 1043 (2004):231–238.