the role of sulfhydryl containing low molecular weight
TRANSCRIPT
The Role of Sulfhydryl‐Containing Low Molecular Weight Ligands for the
Environmental Fate of Zinc Sulfide and Metallic Silver Nanoparticles
by
Andreas P. Gondikas
Department of Civil and Environmental Engineering
Duke University
Date:_______________________
Approved:
___________________________
Heileen Hsu‐Kim, Supervisor
___________________________
Mark Wiesner
___________________________
Lee Ferguson
___________________________
Heather Stapleton
Dissertation submitted in partial fulfillment of
the requirements for the degree of Doctor of Philosophy in the Department of
Civil and Environmental Engineering in the Graduate School
of Duke University
2012
ABSTRACT
The Role of Sulfhydryl‐Containing Low Molecular Weight Ligands for the
Environmental Fate of Zinc Sulfide and Metallic Silver Nanoparticles
by
Andreas P. Gondikas
Department of Civil and Environmental Engineering
Duke University
Date:_______________________
Approved:
___________________________
Heileen Hsu‐Kim, Supervisor
___________________________
Mark Wiesner
___________________________
Lee Ferguson
___________________________
Heather Stapleton
An abstract of a dissertation submitted in partial
fulfillment of the requirements for the degree
of Doctor of Philosophy in the Department of
Civil and Environmental Engineering in the Graduate School
of Duke University
2012

Copyright by
Andreas P. Gondikas
2012
iv
Abstract
Nanomaterials often exhibit enhanced reactivity relative to their larger colloidal
counterparts because of the high specific surface area and number of imperfections on
the crystal lattice at the nanoscale. Understanding the environmental factors that control
the reactivity and bioavailability of natural and manufactured nanomaterials is
important for ecosystems management, contaminated water remediation, and the
assessment of potential risks from the industrial use on nanomaterials. Dissolved
organic matter (DOM) acts as a moderator of reactivity and bioavailability for dissolved
and particulate moieties in natural waters. DOM consists of a range of low and high
molecular weight species that are complex and heterogeneous. It has been historically
categorized based on operational definitions, rather than physicochemical properties. In
order to understand the effect of DOM on nanomaterials, there is an urgent need to
study how specific properties of DOM, such as ligand groups, may interact with the
nanomaterials.
The goal of this research was to study how cysteine, a low molecular weight
metal‐binding ligand, affects the composition and reactivity of nanoparticulate zinc
sulfide and metallic silver. Zinc sulfide was used as an example of nanoparticulate metal
sulfides which occur naturally in sulfidic environments. Metallic silver nanoparticles

v
were used as an example of manufactured nanoparticles, because of thier wide use in
consumer products. Both types of nanomaterials contain metal constituents (zinc and
silver) that are expected to strongly bind to sulfhydryl‐containing ligands (such as
cysteine) in the environment. Serine is structurally similar to cysteine, with the only
difference of a hydroxyl group in the place of the sulfhydryl group of cysteine.
Therefore, serine was used for comparison as a hydroxyl‐containing analogue to
cysteine.
The aggregation kinetics of zinc and other metal sulfide nanoparticles in the
presence of cysteine and serine were investigated using dynamic light scattering.
Cysteine decreased aggregation rates of the particles, while serine had no effect on their
aggregation behavior. Further experiments revealed that the mechanism of stabilization
occurred through the adsorption of cysteine on zinc sulfide, which induced electrostatic
charge on the particles surface. A direct link was established between the amount of
cysteine sorbed and attachment efficiency, an indicator of the tendency of particles to
aggregate. These results shed light on discrepancies in the literature between metal
sulfide precipitation experiments conducted in our lab and work on the formation and
aggregation of zinc sulfide nanoparticles on biofilms of sulfate reducing bacteria.
The early‐stage growth and aggregation kinetics of zinc sulfide nanoclusters in
the presence of cysteine was studied in detail using a suite of complementary
techniques. Growth and aggregation experiments have been traditionally difficult to

vi
study due to instrumental imprecision, but newly developed analytical tools and
software products have made it possible to study the early‐stage formation of
nanoclusters. Experiments with small angle X‐ray scattering, X‐ray diffraction, dynamic
light scattering, and X‐ray absorption spectroscopy at the extended fine structure range
showed that cysteine controlled the growth and aggregation of zinc sulfide nanoclusters.
The molar ratio between zinc, sulfide, and cysteine was a determining factor in the
precipitation process. When zinc and sulfide were in equimolar concentrations with
cysteine, very small nanoclusters of about 2.5 nm formed within 12 hours and
aggregated to structures with hydrodynamic diameter larger than 100 nm. When
cysteine was in excess of zinc and sulfide, aggregation was held to a minimum, but
monomer nanoclusters were able to grow to about 5 nm in 12 hours. Overall, these
results indicate the importance of thiol ligands on the growth, aggregation, and
aggregate structure of metal sulfides.
The effect of metal ligands on metal‐based particle surfaces is of particular
interest for manufactured nanoparticles, because they are typically coated with an
organic coating during the production process. These coatings are sorbed on the
particles surface and are likely to interfere between the metallic surface and ligands in
DOM. Dissolution experiments using citrate and polyvinylpyrrolidone (PVP) coated
zero valent silver nanoparticles in the presence of cysteine and serine showed that
cysteine dissolved both types of particles, while serine did not. Dissolution rates

vii
depended on the aggregation state of the particles exposed to cysteine. As indicated by
zeta potential and adsorption measurements, cysteine replaced the coating on the
particles surface and altered their aggregation pattern. X‐ray absorption spectroscopy
near the absorption edge showed partial oxidation of silver and formation of Ag(+I)‐
sulfur bonds, indicating that the thiol group in cysteine formed chemical bonds with
oxidized surface silver atoms. A comparison between the two coatings showed that
citrate coated particles dissolved approximately three times faster than PVP coated
particles. Overall, these results show that metal binding ligands can drastically change
the fate of manufactured silver nanoparticles in the environment and that this effect is
moderated by surface coatings.
The results of this study suggest that cysteine, a metal binding ligand was able to
induce and control transformations, such as growth, aggregation, dissolution, and
surface reactivity of zinc sulfide and metallic silver nanoparticles. Cysteine adsorbed on
metal sites on both ZnS and Ag particles, inducing changes on their surface charge.
Aggregation kinetics of ZnS particles decreased because of a net decrease in zeta
potential compared to the bare particles. On the contrary, cysteine enhanced the
aggregation of Ag particles, by replacing the citrate and PVP coatings on the particles
surface. Finally, cysteine‐Ag(+I) bonds caused strong polarization on the particles
surface and lead to oxidative dissolution of the particles.

viii
Overall, this research provides a better understanding of the fate of natural and
manufactured nanoparticles in anaerobic waters, where thiols are present in significant
amounts. It may also be used for risk assessment of manufactured nanomaterials and
the production of safer and environmentally responsible materials.

ix
In memory of uncle Harry
and
to my parents

x
Contents
Abstract ......................................................................................................................................... iv
List of Tables ...............................................................................................................................xiv
List of Figures .............................................................................................................................. xv
Acknowledgements ................................................................................................................ xviii
Chapter 1. Introduction ................................................................................................................ 1
1.1 Motivation ......................................................................................................................... 1
1.2 Zinc sulfide nanoparticles ............................................................................................... 4
1.3 Metallic silver nanoparticles ........................................................................................... 6
1.4 Sulfhydryl containing organic compounds in the environment ............................. 10
1.4.1 Cysteine ...................................................................................................................... 13
1.5 Processes controlling metal particle formation and persistence in natural waters
................................................................................................................................................. 14
1.5.1 Surface reactions ........................................................................................................ 15
1.5.1.1 Adsorption .......................................................................................................... 16
1.5.1.2 Adsorption and the special case of nanoparticles ......................................... 17
1.5.1.3 Surface redox reactions ..................................................................................... 19
1.5.1.4 Manufactured nanomaterials with coatings .................................................. 19
1.5.2 Particle aggregation .................................................................................................. 19
1.5.3 Precipitation: growth and aggregation .................................................................. 27
1.5.4 Particle dissolution .................................................................................................... 30
1.6 Research objectives ......................................................................................................... 31
xi
Chapter 2. Influence of amino acids cysteine and serine on aggregation kinetics of zinc
and mercury sulfide colloids ..................................................................................................... 33
2.1 Introduction ..................................................................................................................... 33
2.2. Materials and methods ................................................................................................. 35
2.2.1 Materials ..................................................................................................................... 35
2.2.2 Synthesis and characterization of ZnS and HgS colloids .................................... 36
2.2.3 Aggregation experiments ......................................................................................... 37
2.2.4 Zeta potential of ZnS colloids .................................................................................. 38
2.2.5 Adsorption of amino acids on ZnS colloids.......................................................... 39
2.3. Results and Discussion ................................................................................................. 40
2.3.1 Effects of amino acids, monovalent electrolyte and pH on metal sulfide
aggregation .......................................................................................................................... 40
2.3.2 Zeta potential of ZnS colloids .................................................................................. 45
2.3.3 Adsorption of cysteine on ZnS ................................................................................ 47
2.4 Conclusions ..................................................................................................................... 50
Chapter 3. Early‐stage precipitation kinetics of zinc sulfide nanoclusters forming in the
presence of cysteine .................................................................................................................... 52
3.1 Introduction ..................................................................................................................... 52
3.2 Materials and methods .................................................................................................. 54
3.2.1 Materials ..................................................................................................................... 54
3.2.2 Dynamic light scattering and small angle X‐ray scattering ................................ 55
3.2.3 Zn K‐edge X‐ray absorption spectroscopy (XAS) ................................................. 56
3.2.4 Other particle characterization methods ................................................................ 58

xii
3.3 Results and discussion ................................................................................................... 59
3.3.1 Cluster growth kinetics of ZnS‐cysteine suspensions .......................................... 59
3.3.2 Structure of aggregates ............................................................................................. 66
3.3.3 Particle characterization and speciation ................................................................. 67
3.4 Conclusions ..................................................................................................................... 74
Chapter 4. Cysteine‐induced modifications of zero‐valent silver nanomaterials:
Implications for particle surface chemistry, aggregation, dissolution, and silver
speciation...................................................................................................................................... 77
4.1 Introduction ..................................................................................................................... 77
4.2 Materials and Methods .................................................................................................. 80
4.2.1 Ag NP synthesis and characterization ................................................................... 80
4.2.2 Exposure of Ag NP to cysteine ................................................................................ 82
4.2.3 Quantification of dissolved silver and cysteine .................................................... 82
4.2.4 Aggregation of NPs in the presence of cysteine ................................................... 84
4.2.5 Silver speciation of Ag NPs ...................................................................................... 85
4.3 Results and discussion ................................................................................................... 86
4.3.1 Dissolution of Ag NPs exposed to cysteine ........................................................... 86
4.3.2 Aggregation and zeta potential of Ag NPs exposed to cysteine ........................ 90
4.3.3 The effect of aggregation on dissolution ................................................................ 94
4.3.4 Speciation of particulate silver ................................................................................ 95
4.3.5 Cysteine adsorption .................................................................................................. 97
4.4 Conclusions ..................................................................................................................... 99
Chapter 5. Conclusions ............................................................................................................ 102

xiii
5.1 Summary ........................................................................................................................ 102
5.2 Implications and future research ............................................................................... 104
Appendix A Supporting Information for Chapter 2 ............................................................ 109
Appendix B Supporting Information for Chapter 4 ............................................................. 114
References .................................................................................................................................. 127
Biography ................................................................................................................................... 144

xiv
List of Tables
Table 1.1: Pearsons classification of hard and soft acids ......................................................... 6
Table 1.2: Mechanisms of adsorption for organic compounds in soil solutions ................ 17
Table 3.1: Model fitting parameters for Zn K‐edge EXAFS data in Figure 3.6 ................... 72
Table 4.1: Initial dissolution rates of Ag‐PVP and Ag‐CIT solutions .................................. 90
Table B1: Linear combination fitting of Ag‐CIT samples exposed to cysteine for 2 hours
..................................................................................................................................................... 124
Table B2: Linear combination fitting of Ag‐CIT samples exposed to cysteine for 24 hours
..................................................................................................................................................... 124
Table B3: Linear combination fitting of Ag‐PVP samples exposed to cysteine for 2 hours
..................................................................................................................................................... 125
Table B4: Linear combination fitting of Ag‐PVP samples exposed to cysteine for 24 hours
..................................................................................................................................................... 125
xv
List of Figures
Figure 1.1: Schematic describing silver flows deriving from the use of silver
nanomaterials in consumer products ......................................................................................... 9
Figure 1.2: Ligand concentration (LT) versus formation constants (K) for silver ............... 12
Figure 1.3: The molecular structure of cysteine, serine, N‐acetyl cysteine, glutathione,
and γ‐glutamyl cysteine ............................................................................................................. 14
Figure 1.4: Schematic describing interactions between metals and NOM in natural
waters and their effect on bioavailability ................................................................................ 15
Figure 1.5: The relationship between particle size and percent of atoms on the surface . 18
Figure 1.6: Electrical double layer of a spherical particle with negative surface charge .. 23
Figure 1.7: Simplified scheme of processes involved in nucleation and crystal growth .. 29
Figure 2.1: Attachment efficiency, α for aggregation of (a) ZnS colloids and (b) HgS
colloids .......................................................................................................................................... 42
Figure 2.2: Attachment efficiency for aggregation of ZnS colloids in the presence of
cysteine ......................................................................................................................................... 44
Figure 2.3: Attachment efficiency for aggregation of ZnS colloids in solution containing
cysteine and varying pH ............................................................................................................ 44
Figure 2.4: Zeta potential as a function of pH for ZnS colloids suspended in solution
with cysteine, serine, or no amino acid .................................................................................... 46
Figure 2.5: (a) Sorption of cysteine after 1 h exposure to ZnS colloids at pH 6.5 and 7.5
and (b) effects of cysteine surface density on the attachment efficiency α for ZnS
aggregation .................................................................................................................................. 49
Figure 3.1: Small angle X‐ray scattering curves of precipitating ZnS particles .................. 60
Figure 3.2: (a) Average hydrodynamic diameter of cysteine‐ZnS cluster aggregates
determined by dynamic light scattering; (b) Fractal dimension quantified from small
angle X‐ray scattering data ........................................................................................................ 61
xvi
Figure 3.3: TEM images of ZnS‐cysteine precipitates ............................................................ 62
Figure 3.4: Small angle X‐ray scattering data of 5 mM ZnS precipitating with (a) 5 mM
cysteine (1:1 cys:ZnS) and (b) 10 mM cysteine (2:1 cys:ZnS) ................................................ 64
Figure 3.5: X‐ray diffraction spectra of the ZnS‐cysteine coprecipitated nanoparticles (5
mM ZnS, 10 mM cys), ZnS nanoparticles (no cysteine), ZnS(s) and ZnO(s) commercial
materials, and freeze‐dried Zn(cys) and Zn(cys)2 complexes .............................................. 68
Figure 3.6: Experimental and fitted Zn K‐edge X‐ray absorption spectra .......................... 70
Figure 3.7: Average second sphere Zn‐Zn coordination number (CN) calculated as a
function of the polynuclear zinc sulfide nanocluster size, based on interatomic distances
in the mononuclear ZnS4 tetrahedra......................................................................................... 73
Figure 4.1: Schematic describing the effect of water chemistry on Ag NP bioavailability
....................................................................................................................................................... 78
Figure 4.2: Concentration of nominally dissolved silver (0.025 μm filter) in mixtures of
(a) Ag‐CIT and (b) Ag‐PVP nanoparticles .............................................................................. 87
Figure 4.3: Average hydrodynamic diameter and electrophoretic mobility of Ag‐CIT
nanoparticles ‐(a) and (b)‐ and Ag‐PVP nanoparticles ‐(c) and (d)‐ .................................... 91
Figure 4.4: Attachment efficiency for homo‐aggregation of Ag‐CIT (a) and Ag‐PVP (b)
suspensions .................................................................................................................................. 94
Figure 4.5: Silver L3‐edge XANES spectra of the original Ag NPs, Ag(+I)‐cysteine
complexes Ag(CYS)2, and silver nanoparticles that were exposed to cysteine for 2 or 24 h
....................................................................................................................................................... 97
Figure A1: Intensity‐weighted size distribution of the stock ZnS colloid suspension .... 109
Figure A2: X‐ray powder diffraction spectrum of stock ZnS colloids and ZnS reference
materials sphalerite and wurtzite ........................................................................................... 109
Figure A3: (a) TEM image of the stock ZnS colloids on a copper grid sample holder and
(b) element content of particles in TEM image measured by energy dispersive X‐ray
spectroscopy .............................................................................................................................. 110
xvii
Figure A4: (a) X‐ray diffraction spectrum of HgS stock indicating that the particles
consisted of cinnabar and/or metacinnabar; (b) TEM image of HgS colloids; (c) EDS
spectrum of the particle observed in the TEM image indicating the presence of Hg and S
..................................................................................................................................................... 111
Figure A5: (a) Sorption of cysteine on ZnS colloids at pH 7; (b) Recovery of cysteine
dissolved in pH 7.5 ................................................................................................................... 112
Figure A6: Aggregation of ZnS colloids (50 μΜ) suspended in water (pH 7.5) .............. 113
Figure B1: Transmission electron microscopy images of (A) citrate‐coated and (C) PVP‐
coated Ag NPs; also shown are particle size distributions determined from TEM images
for (B) citrate‐coated and (D) PVP‐coated Ag NPs............................................................... 114
Figure B2: Time‐resolved measurements of nominally dissolved silver with cysteine .. 115
Figure B3: Concentration of nominally dissolved silver (0.025 μm filter) in mixtures of
Ag nanoparticles suspended in solutions .............................................................................. 116
Figure B4: Time‐resolved average hydrodynamic diameter of Ag‐PVP particles
suspended in solution with three different ionic strength values ..................................... 117
Figure B5: Time‐resolved average hydrodynamic diameter of (a) Ag‐CIT and (b) Ag‐
PVP nanoparticles ..................................................................................................................... 118
Figure B6: TEM images of Ag‐PVP aggregates forming in the diffusion limited regime:
(a) 2 hours; (b) 24 hours ............................................................................................................ 119
Figure B7: Silver L3‐edge XANES spectra of model compounds, Ag(+I) complexes, and
Ag‐citrate .................................................................................................................................... 123
FigureB8: (a): Concentration of dissolved cysteine (b): Change in dissolved cysteine
concentration (Δ[CYS]) ............................................................................................................. 126

xviii
Acknowledgements
First and foremost, I would like to acknowledge the uninterrupted support of my
advisor, Prof. Hsu‐Kim, who attempted to shape my scientific character based on truly
scientific values. It has been an honor and a pleasure to work in the Hsu‐Kim research
group. I am also grateful to the members of my Ph.D. committee, Prof. Mark Wiesner,
Prof. Lee Ferguson, and Prof. Heather Stapleton for their ideas and support.
I greatly appreciate the support from the Greek State Scholarship Foundation
(IKY), without which this journey would have been impossible.
I am grateful and honored to be part of the Center for the Environmental
Implications of Nanotechnology (CEINT), and the Department of Civil & Environmental
Engineering at Duke University.
I thank my fellow lab‐mates in Hudson hall and friends in North Carolina,
without the support and advice of which these years would have been unbearable.
Thanks to: Amy, Boris, and Tong for your support and valuable advice; Eileen, Avi,
Karen, Candy, Melanie, Armand, Brian, Amanda, and Stella for your help and patience
during our collaborations. Special thanks to: Rawad for the countless good ones; to
Diana Pilar Perez Arechaederra for her help and support; to Sofia and Kostas for their
friendship and for being a role model of companionship and solidarity. I was very
fortunate to meet and become friends with George, Nikos, and Marianna.

xix
Most of all, I would like to thank my family. My parents, my sister Iris and my
brother Kostas surrounded me with all the love and support a family could possibly
offer. Special thanks to uncle George, aunts Mitsi and Pipitsa, cousins Marina, Daphne,
Dimitris, and Petros for their love and support.

1
Chapter 1. Introduction
1.1 Motivation
Nanoparticles are considered to be colloids with at least one dimension in the
range of 1 and 100 nm. Due to their small size, they can resist settling for extended times
and travel longer distances than larger colloidal particles. In addition, they often exhibit
properties that are different from their bulk counterparts, such as enhanced reactivity
[1]. Recent developments in analytical methods have allowed scientists to study
nanoparticles, which have historically been considered as dissolved species because they
pass through filters that were used to operationally define dissolved and particulate
fractions in water [2]. These tools allowed for a better understanding of processes such
as mineral weathering, mineral‐bacteria interactions, and metal transport in acid mine
drainage systems [3‐5]. For example, the study of biotic or abiotic formation of particles
with metal constituents and the adsorption of metals on particle surfaces was made
possible with the development of synchrotron‐based techniques and electron
microscopy (e.g. [6, 7]). The detection of metal sulfide nanoparticles in acid mine
drainage waters with electron microscopy demonstrated the mobility of zinc sulfide
nanoparticles and their ability to carry other toxic metals, such as Pb and As [8].
The formation of mineral sulfide colloids and nanoparticles is important for the
aquatic fate and transport of toxic metals, such as zinc and mercury in sediment pore
water, wastewater effluent, and other anaerobic environments [9‐13]. Although these

2
particles form in anoxic waters, they may enter oxic waters and remain stable for days
[14, 15]. Therefore, studying the processes that lead to their formation and persistence
can be useful for understanding the biogeochemical cycle of these elements and for
restoring contaminated ecosystems.
The lack of knowledge about the processes governing the fate and transport of
natural nanoparticles poses a barrier for assessing the environmental impact and
possible harm from the emerging industry of nanomaterials [16]. The number of
consumer products with nanomaterials has been rapidly increasing since they first
appeared at the beginning of the century [17]. In many cases nanomaterials get in direct
contact with humans (skin, stomach, hair, etc.) and are readily discharged in wastewater
or natural aquifers [18]. Because of its antimicrobial activities, silver is widely used in
nanomaterials and is present in products such as personal care items, clothing,
cosmetics, sporting goods, and sunscreens. Although silver containing nanoparticles are
not new in nature and consumer products, little is known of their fate in the
environment [19, 20]. The same processes that determine the fate of naturally‐occurring
metal bearing nanoparticles are also likely to determine the fate of manufactured
nanoparticles.
Transport, reactivity, and bioavailability of colloidal particles are important
processes for the fate and transport of metals in natural waters and are often controlled
by dissolved organic matter (DOM). Naturally‐occurring and manufactured

3
nanoparticles may form larger aggregates that settle out of the water column. However,
this process can be slowed by DOM, which is capable of stabilizing colloidal particles in
suspension (e.g. [21, 22]). In addition, organic matter may enhance the dissolution of
particles [9]. Organic molecules adsorb on particle surfaces through hydrophobic
interactions or specific chemical bonding (e.g. [23, 24]). However, the mechanisms of
interactions between DOM and colloids are poorly understood. The greatest obstacle is
the diversity and complexity of the molecules that comprise DOM.
Ligand groups, such as carboxyls (–COOH), hydroxyls (–OH), amines (–NH2),
and thiols (–SH) in DOM react with dissolved metal ions and metal constituents of
suspended particles. The extent to which these reactions occur depends on the
concentrations and reactivity of the ligands. The concentrations of ligand groups in
DOM generally follows the order: –COOH,–OH > –NH2 > –SH. Thiols can be up to four
orders of magnitude less concentrated than carboxyls [25]. However, thiols have up to
eight orders of magnitude higher formation constants with soft metals such as Zn2+, Ag+,
and Hg2+ that are typically at trace levels (i.e. less than the concentration of strong ligand
binding sites such as sulfhydryl). Therefore, thiols can be important for the speciation
and bioavailability of these metals in natural waters [26, 27]. The scientific knowledge on
the reactivity of ligand groups with dissolved metals has expanded over the years, but
little is known of their reactivity with metal‐based particles. Recent studies have
demonstrated that thiol containing ligands decrease the kinetics of precipitation and
4
aggregation of ZnS and HgS [28, 29]. These findings indicate that thiol ligands may play
a key role for the fate of particles with soft metal constituents. In addition to
precipitation, other processes such as surface reactions and dissolution work in
synergistic or antagonistic ways and ultimately determine the particles fate.
The objective of this dissertation was to assess how metal‐binding ligands
influence the reactivity of metal‐based nanomaterials in the environment. Cysteine was
used as a model compound for low molecular weight sulfhydryl organic ligands. ZnS
nanoparticles were used as an example of naturally‐occurring metal sulfides. Metallic
silver nanoparticles were used as an example of metal‐based manufactured
nanomaterials. The reactivity of ZnS and Ag nanoparticles towards cysteine was
determined by studying the formation, surface composition, solubility, and aggregation
of these nanoparticles. Studying the reactivity of metal‐based nanoparticles towards
specific ligand groups may help scientists predict the particles fate in the environment
and direct the nanomaterial industry towards safer and environmentally responsible
products.
1.2 Zinc sulfide nanoparticles
Zinc is a trace metal and essential nutrient that is ubiquitous in nature and can be
toxic at high concentrations. It is present in the soil, air, water, and the biosphere. Its
environmental cycling occurs through transport in natural media (e.g. water and air)
5
and through living organisms (e.g. plant roots and animals). Zinc has been used by
humans since antiquity and is one of the most commonly used metals to date in
industrial products. While zinc mining thrived in the 20th century, for the most part in
North America and Europe [30], the adverse effects of mining activities for the
environment and water quality caused several mining camps to shut down and
subsequently be filled with water. Acid mine drainage that resulted from
biogeochemical reactions in combination with anoxic conditions in abandoned mining
camps has gained a lot of scientific interest since. In these conditions, zinc sulfide
clusters form and are believed to play an important role in the environmental cycle of
zinc and other toxic elements that sorb on particulate matter [8].
The chemistry of metals in anoxic systems is often dominated by reactions with
reduced sulfur species, such as HSˉ and H2S. Although sulfide is an intermediate base,
its reduced species are soft bases and tend to form strong complexes with soft acids,
such as Zn2+, Hg2+, and Ag+ (Table 1.1). Metal sulfide complexes and clusters form in
supersaturated waters and play an important role in the environmental cycling of both
metals and sulfur, because they serve as building blocks for the formation of mineral
structures. Hydrothermal vent systems, sediments of mine drainage, and biofilms of
sulfate reducing bacteria are some examples where ZnS is known to precipitate [8, 31,
32]. Metal sulfide clusters can be stabilized by organic matter and persist as
nanoparticles that are often mistaken by researchers for dissolved species [33].

6
Table 1.1: Pearsons classification of hard and soft acids (only part of the list is
shown) [27]
Classification Acids
Hard (class A) H+, Na+, K+, Mg2+, Ca2+, Fe3+, As3+
Intermediate Fe2+, Co2+, Ni2+, Cu2+, Zn2+, Pb2+
Soft (class B) Cu+, Ag+, Au+, Hg2+, Pd2+, Cd2+
The environmental relevance of these very small particles is not limited to the
cycling of its constituents, but also the cycling of toxic metals, such as Pb, Cd, and As
and radioactive materials that may adsorb on their surface (e.g. [34]). Metal sulfide
particles that precipitate abiotically in supersaturated waters or through microbial
activity, may be stabilized by DOM and remain suspended for extended periods of time.
In addition, manufactured ZnS or ZnS‐coated quantum dots, which are often comprised
of toxic metal constituents, may be released in the environment. The presence of these
particles may hinder water quality.
1.3 Metallic silver nanoparticles
The use of nanomaterials in consumer products has been rapidly increasing in
the past couple of decades and subsequently concerns have been raised about the
potential impact of these materials to the environment. Some of these materials contain
toxic metals, such as silver and cadmium, which once released into the environment

7
could pose a threat for ecosystems and human health (e.g. [16, 35, 36]). Silver, in
particular, due to its antimicrobial activity, is widely used in consumer products
(including, but not limited to health and fitness products, clothing, food, and medical
applications) [17].
The natural cycling of silver occurs mostly through the corrosion of silver loaded
soils into aquifers, but human activity can affect its environmental fate and transport.
Some examples are mining, smelting, coal burning, and the use of silver in industrial
processes [37]. Due to the photosensitive properties of some silver halides, silver has
been systematically used in manufacturing plants of the photographic industry. This
resulted in elevated silver concentrations in the wastewater of the plant which was
typically discharged directly into surface waters or in the wastewater collection and
treatment system. Because Ag(+I) was known to be toxic for a wide range of aquatic
organisms, the potential environmental impact of the industrial use of silver was first
questioned in the late 90’s.
Studies showed that the bioaccumulation of Ag(+I) is low and that it is most
likely to form insoluble AgCl in marine waters, and AgS in surface waters, sediment
pore waters, wastewater treatment plant effluents, and mine sediments and tailings [38‐
42]. The formation of insoluble solids with inorganic ligands is a possible explanation for
the low bioaccumulation of silver, but organic ligands and especially thiol containing
ligands may interfere and alter its availability to living organisms [43‐46]. It was also
8
found that up to about a third of sulfide complexed silver in wastewater treatment plant
effluent was in the colloidal form (possibly stabilized by NOM) [39]. In oxic waters AgS
is likely to be photoreduced to zero‐valent silver, a process that can possibly lead to the
production of zero‐valent silver colloids; however the effect of NOM in the
photoreduction of AgS has not been studied [47].
The incorporation of silver in consumer products by the booming industry of
nanomaterials will eventually lead to releases in the environment through direct
discharge into natural waters, or through wastewater treatment systems (Fig 1.1). In the
past few years a large number of scientific research projects focused on the toxicity of
silver nanoparticles for a wide range of organisms focusing on discerning effects that are
specific for nanoparticle characteristics. Some studies found that toxicity is related with
particle size and others that it is related to the release of silver ions (e.g. [48‐50]). Several
of these studies, used cysteine to bind and “immobilize” ionic silver in an effort to
separate toxicity effects related to silver ions or the nanoparticles. Furthermore, other
studies showed that silver nanoparticles may undergo physicochemical transformations
when exposed to solution conditions such as ionic strength, pH, metal binding ligands,
and NOM (e.g. [51‐53]). It is clear that transformations such as dissolution, aggregation,
and surface reactions play a key role in the mechanism of toxicity and that in order to
understand these mechanisms, such transformations need to be thoroughly understood
[54, 55].

9
Toxicity does not only depend on the characteristics of the particles, but also the
characteristic of the organism that is studied. Overall, studies that study the
physicochemical characterization of the particles in combination with biological effects
indicate that a nano‐specific effect is involved in the toxicity to prokaryotic organisms
such as bacteria and algal cells, but toxicity towards higher eukaryotic organisms such
as algae, fish, fleas, and nematodes is mostly related to the release of ionic silver [56‐59].
The difference in response of prokaryotic and eukaryotic organisms, could possibly be
due to the availability of biological mechanisms that produce metal‐binding ligands
(typically rich in thiols).
Figure 1.1 Schematic describing silver flows deriving from the use of silver
nanomaterials in consumer products, such as plastics and textiles
Taken from Blaser et al [60]

10
Nanomaterials are typically manufactured with organic coatings that serve to
stabilize the suspension during production. Examples of silver nanoparticle coatings are
long chain polymers (e.g. polyvinylpyrrolidone and polyethylene glycol), low molecular
weight organic acids (e.g. citric and ethylenediaminetetraacetic acid), and complex
organic substances (e.g. gum Arabic). These compounds attach on the particles surface
through complexation or hydrophobic interactions and induce steric, electrostatic, or
electrosteric stabilization. These coatings may control the fate of nanoparticles in the
environment and their effect on organisms [58].
1.4 Sulfhydryl containing organic compounds in the
environment
The sulfhydryl chemical group (also known as thiol) is a form of reduced sulfur
and a major intermediate in the microbial cycling of sulfur. Thiols are formed during the
microbial reduction of sulfur and through abiotic reactions of dissolved organic matter
with H2S and elemental sulfur in pore waters [61]. The biological and environmental
importance of thiols lies in their reactivity towards metal ions. Thiols participate in
several biological systems, where they serve as coenzymes or antioxidants for binding
metals. In aquatic systems, they are mostly present in anaerobic waters, such as
sediment pore water, where they bind metals and sorb on colloids [61].
11
The concentration of thiols varies with the type of medium they are dissolved in.
In oxic waters, thiols are present as low molecular weight organic compounds in
concentrations that are lower compared to anoxic systems, because they tend to oxidize
and form disulfide bonds in the presence of oxygen. Anaerobic pore water of sediments
contains nano‐ to micro‐molar concentrations of thiols [62]. Under metal stress some
plants and organisms actively excrete thiol rich compounds known as phytochelatins or
metalothioneins (e.g. [63, 64]) and the rate of excretion is proportional to the level of
metal contamination [65]. In biological media, such as intra‐cellular fluids and blood,
thiol concentrations can reach up to micro mol per gram (hundreds of milli‐molars) and
milli‐molar, respectively [66, 67].
The molecular structure of thiols may also vary. Thiol functional groups are
present in natural waters as part of natural organic matter (NOM) and as smaller
organic compounds. The concentration of reduced sulfur in NOM is low compared to
other functional groups, such as carboxylates and hydroxyls. Total sulfur in NOM
isolates is in the range of 0.4 to 1.4% on a mass basis [68] and 6 to 55% of that can be in
the reduced form (sulfides or thiols) in humic acids, depending on the site where the
NOM was collected and its origin [69, 70]. However, they serve as strong binding sites
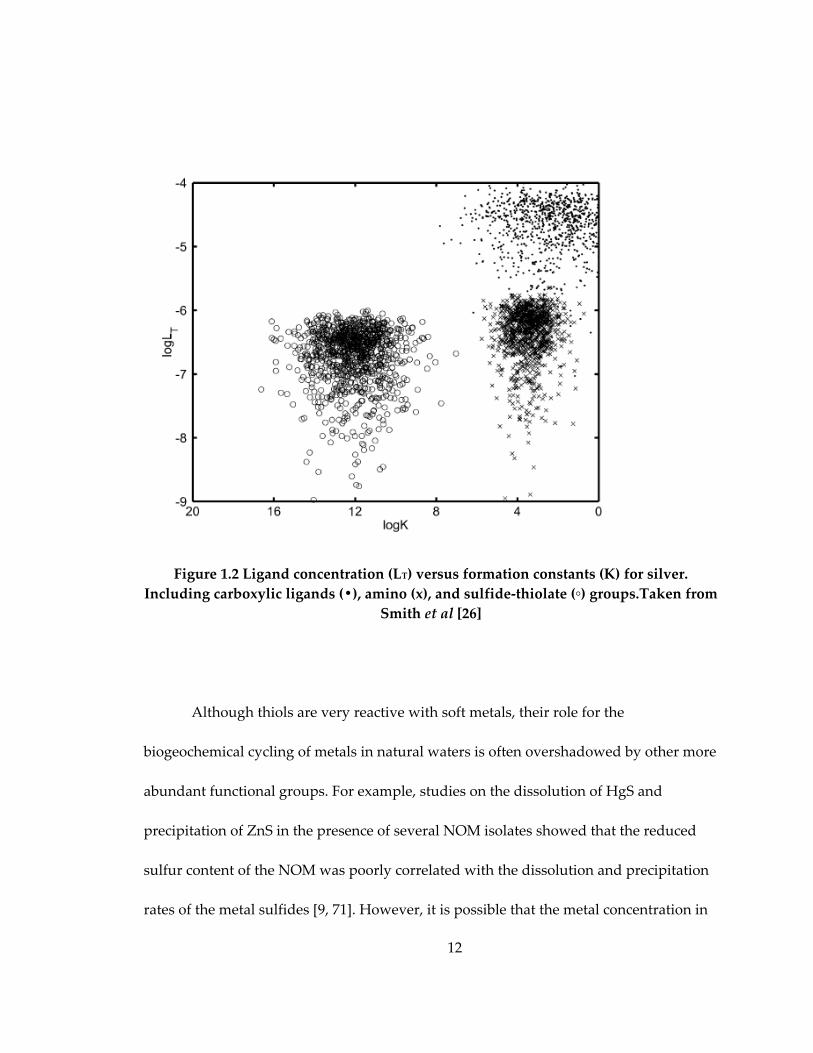
for soft metals, such as Ag+ and Zn2+. Equilibrium formation constants are often used as
indicators of reactivity. Formation constants of soft metals with reduced sulfur can be
more than eight orders of magnitude higher than with carboxyls and amines (Fig. 1.2).
12
Figure 1.2 Ligand concentration (LT) versus formation constants (K) for silver.
Including carboxylic ligands (•), amino (x), and sulfide‐thiolate (◦) groups.Taken from
Smith et al [26]
Although thiols are very reactive with soft metals, their role for the
biogeochemical cycling of metals in natural waters is often overshadowed by other more
abundant functional groups. For example, studies on the dissolution of HgS and
precipitation of ZnS in the presence of several NOM isolates showed that the reduced
sulfur content of the NOM was poorly correlated with the dissolution and precipitation
rates of the metal sulfides [9, 71]. However, it is possible that the metal concentration in

13
these studies was high enough to quickly saturate reduced sulfur sites in NOM, leaving
properties with less metal specificity (e.g. aromaticity and molecular weight) to control
the dissolution and precipitation processes. However, under some environmentally
relevant conditions (e.g. sediment porewater) thiol content in NOM is expected to be in
excess of the metal. In biological media, where low molecular weight thiols are present
in milli‐molar concentrations, the speciation of metals is expected to be dominated by
complexation with sulfhydryl groups.
1.4.1 Cysteine
Cysteine is a low molecular weight thiol and an aminoacid. It’s an important
building block of several proteins and participates in several biochemical reactions,
including its contribution to zinc fingers, an important configuration for protein, RNA,
and DNA functions (e.g. [72]). In most cases cysteine is part of larger structures, such as
proteins and phytochelatins. It is also part of other low molecular weight thiols, such as
glutathione a major antioxidant, γ‐glutamylcysteine a typical monomer of
phytochelatins, and N‐acetyl cysteine another antioxidant (Fig. 1.3). Because of its ability
to bind metals, cysteine has been used as a model thiol ligand in studies of particle‐
bacteria interactions, biochemical reactions, and toxicity effects (e.g. [73‐75]). In this
work, cysteine is used as an example of low molecular weight thiols. Serine, a
structurally similar to cysteine amino‐acid has a hydroxyl group in the place of the thiol
14
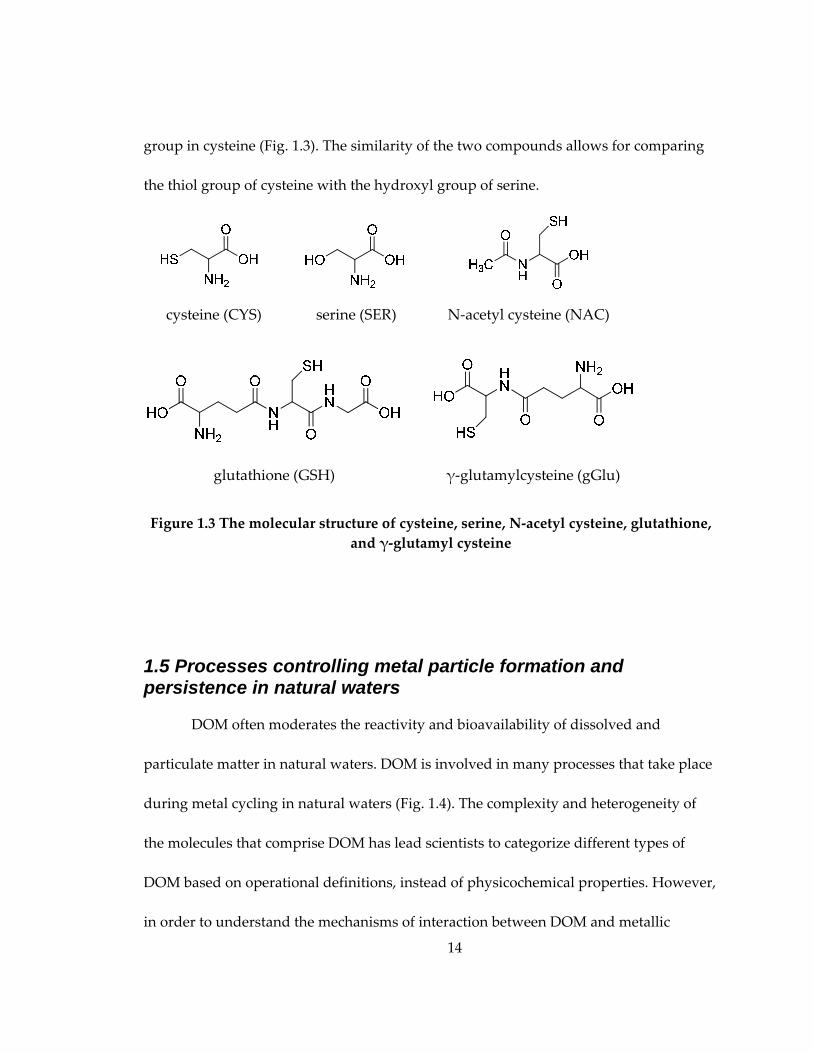
group in cysteine (Fig. 1.3). The similarity of the two compounds allows for comparing
the thiol group of cysteine with the hydroxyl group of serine.
glutathione (GSH)
cysteine (CYS) serine (SER) N‐acetyl cysteine (NAC)
γ‐glutamylcysteine (gGlu)
Figure 1.3 The molecular structure of cysteine, serine, N‐acetyl cysteine, glutathione,
and γ‐glutamyl cysteine
1.5 Processes controlling metal particle formation and persistence in natural waters
DOM often moderates the reactivity and bioavailability of dissolved and
particulate matter in natural waters. DOM is involved in many processes that take place
during metal cycling in natural waters (Fig. 1.4). The complexity and heterogeneity of
the molecules that comprise DOM has lead scientists to categorize different types of
DOM based on operational definitions, instead of physicochemical properties. However,
in order to understand the mechanisms of interaction between DOM and metallic
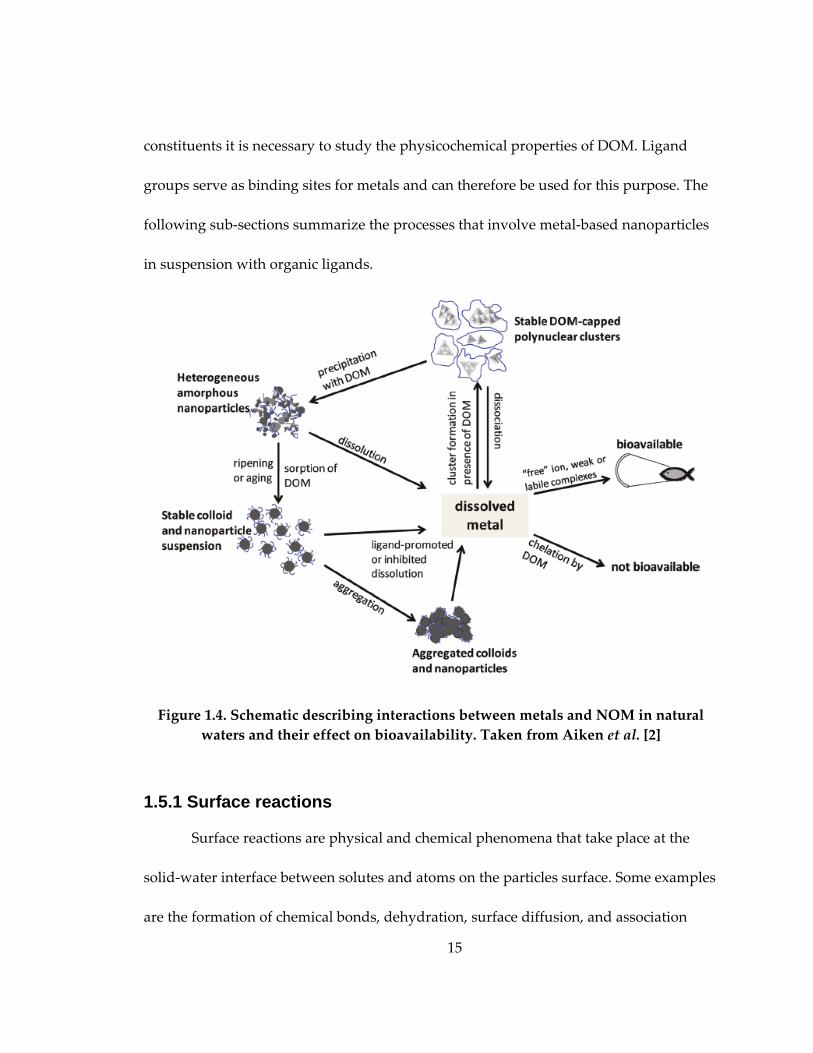
15
constituents it is necessary to study the physicochemical properties of DOM. Ligand
groups serve as binding sites for metals and can therefore be used for this purpose. The
following sub‐sections summarize the processes that involve metal‐based nanoparticles
in suspension with organic ligands.
Figure 1.4. Schematic describing interactions between metals and NOM in natural
waters and their effect on bioavailability. Taken from Aiken et al. [2]
1.5.1 Surface reactions
Surface reactions are physical and chemical phenomena that take place at the
solid‐water interface between solutes and atoms on the particles surface. Some examples
are the formation of chemical bonds, dehydration, surface diffusion, and association

16
processes of the adsorbed constituents [76]. Adsorption is an association process that
may lead to formation of chemical bonds and is a prerequisite for dissolution and
surface chemistry modifications that affect aggregation.
1.5.1.1 Adsorption
Adsorption of solutes on particles can alter surface properties such as charge,
surface atom speciation, and morphology that control aggregation, precipitation, and
dissolution processes; these processes often determine the fate, transport, and
bioavailability of constituents comprising the particles (e.g. [21, 77‐79]). Adsorption of a
solute on the surface of a solid is controlled by temperature, pressure, concentration of
the solute, available surface area, and presence of competing solutes. Solutes such as
metal cations, inorganic oxyanions, and organic matter (OM) can adsorb on particles
surface. In this work we focus on the latter and specifically organic matter that contains
sulfhydryl functional groups, due to the high reactivity of these moieties with soft
metals such as Ag+ and Zn2+ (Fig. 1.2). In contrast to cation and oxyanion adsorption, OM
adsorption has not been fully understood, due to uncertainties regarding the structure
and composition of the complex and diverse organic matter molecules. Adsorption
occurs through several mechanisms, including the interaction between specific
functional groups in OM and surface constituents (Table 1.2).
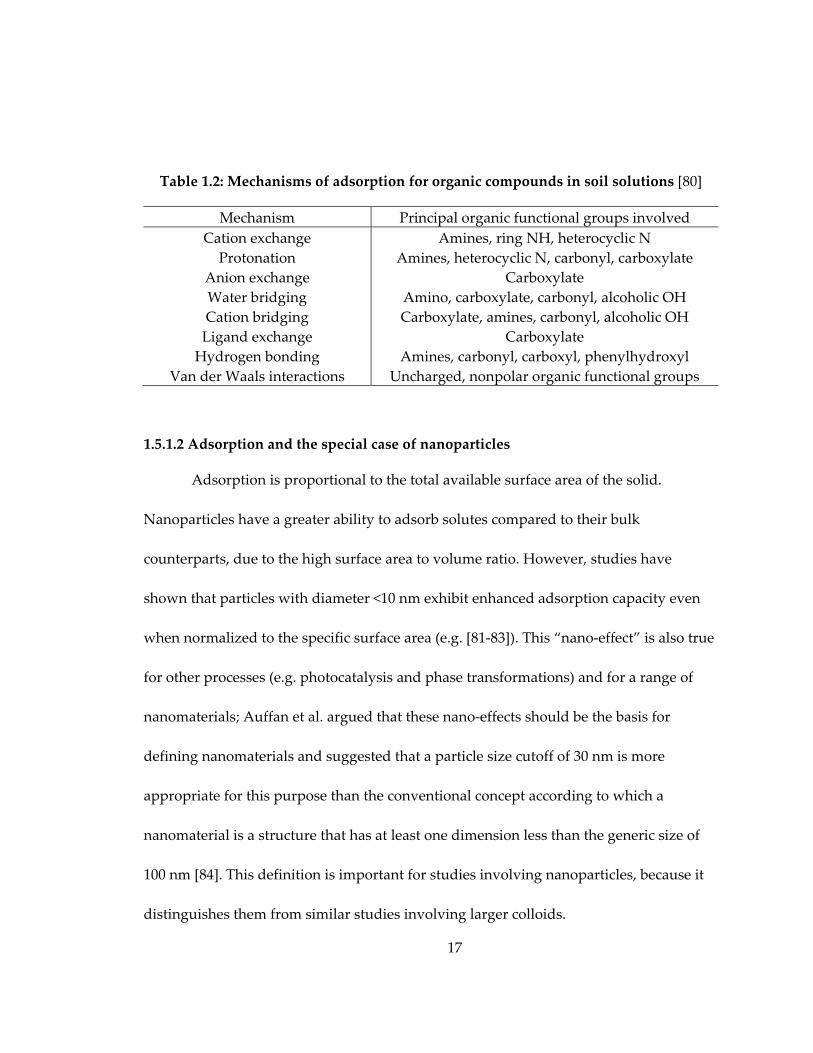
17
Table 1.2: Mechanisms of adsorption for organic compounds in soil solutions [80]
Mechanism Principal organic functional groups involved
Cation exchange Amines, ring NH, heterocyclic N
Protonation Amines, heterocyclic N, carbonyl, carboxylate
Anion exchange Carboxylate
Water bridging Amino, carboxylate, carbonyl, alcoholic OH
Cation bridging Carboxylate, amines, carbonyl, alcoholic OH
Ligand exchange Carboxylate
Hydrogen bonding Amines, carbonyl, carboxyl, phenylhydroxyl
Van der Waals interactions Uncharged, nonpolar organic functional groups
1.5.1.2 Adsorption and the special case of nanoparticles
Adsorption is proportional to the total available surface area of the solid.
Nanoparticles have a greater ability to adsorb solutes compared to their bulk
counterparts, due to the high surface area to volume ratio. However, studies have
shown that particles with diameter <10 nm exhibit enhanced adsorption capacity even
when normalized to the specific surface area (e.g. [81‐83]). This “nano‐effect” is also true
for other processes (e.g. photocatalysis and phase transformations) and for a range of
nanomaterials; Auffan et al. argued that these nano‐effects should be the basis for
defining nanomaterials and suggested that a particle size cutoff of 30 nm is more
appropriate for this purpose than the conventional concept according to which a
nanomaterial is a structure that has at least one dimension less than the generic size of
100 nm [84]. This definition is important for studies involving nanoparticles, because it
distinguishes them from similar studies involving larger colloids.

18
The enhanced adsorption capacity of nanoparticles can be linked to the total free
energy and atomic structure on the surface of particles. Adsorption takes place where it
is most energetically favorable, preferentially on sites of structural imperfections, such
as steps, kinks, and pits. One cause of structural imperfections that is of particular
importance for nanoparticles is the lack of atomic order on the solids surface. While in
the center of a crystalline particle, atoms are arranged in space according to their crystal
structure, this structure is distorted on the surface because surface atoms only have
neighboring atoms towards the center of the particle. This imperfection results in surface
relaxation: a slight change on the spacing between the two surface atomic layers that are
on the edge of the particle. Sorption of water molecules can enhance this phenomenon
[85]. Surface relaxation is especially important for nanoparticles, because a large percent
of the total number of atoms in the particle are located on the surface (Figure 1.5).
0
25
50
75
100
0 20 40
% Surface Atoms
Particle Diameter (nm) Figure 1.5. The relationship between particle size and percent of atoms on the surface

19
1.5.1.3 Surface redox reactions
An oxidation‐reduction (or redox) reaction is a chemical reaction in which
electrons are transferred completely from one species to another [86]. Electrons are used
by microorganisms for metabolic reactions. Therefore, redox reactions occur in nature
mostly as a result of biological activity, but abiotic redox reactions are also possible.
When a ligand adsorbs on a particles surface, outer sphere complexes form. If the ligand
has strong affinity for surface atoms (e.g. sulfhydryl functional groups for soft metals),
the ligand proceeds to form inner sphere complexes, which can lead to further chemical
reactions, including redox reactions.
1.5.1.4 Manufactured nanomaterials with coatings
Natural nanoparticles form under environmental conditions and in the presence
of OM that can sorb on their surface and stabilize them. However, manufactured
nanomaterials are produced under controlled conditions, often in the presence of a
surfactant that sorbs on the particles surface. The surfactants’ primary purpose is to
stabilize the particle suspension during production, but they remain on the particles’
surface in the final product and are likely to interfere between the particle and OM in
natural waters.
1.5.2 Particle aggregation
Aggregation is the time dependent change of the dispersion state of colloids,
towards larger sizes. Because colloid aggregation causes settling and may lead to

20
separation of the particles from the liquid phase, it is of paramount importance for
colloid persistence and the environmental cycle of elements. Therefore, it has been
studied extensively, especially in the context of water and wastewater treatment (e.g.
[87]).
Settling occurs through the gravitational force applied on a particle and the
settling velocity vs can be estimated from Stokes’ law:
2
18d
g ss
(1.1)
where g is the gravity acceleration, ρs the particles’ density, ρ the density of water, n the
absolute viscosity of water, and d the particles’ diameter. Assuming spherical geometry
and low Reynolds number, the settling velocity of a 100 μm ZnS particle at 20˚C is 1.63
cm/s, which means that this particle can fall 5 meters in about 5 minutes. Because the
settling velocity is proportional to the square of the particles’ diameter, it would take 104
and 108 times longer for 1 μm and 100 nm particles, respectively to settle over the same
distance, which is approximately equal to 35 days and 10 years, respectively. Therefore,
particles that do not grow bigger than 100 nm are able to resist settling for a long time
and can travel long distances following the flow of water in rivers and lakes. However,
in natural aquifers the settling velocity is also influenced by the water chemistry and
particle porosity, as well as advection, turbulent diffusion, and dispersion phenomena
caused by the movement of water (e.g. [88]). For very small particles (< 100 nm), which
is the focus of this work, the effect of water movement on particle stability is

21
insignificant compared to surface transformations caused by water chemistry, hence
they were not studied further.
Colloids are present in all natural waters in a variety of sizes and are often
characterized by a continuous particle size distribution. A suspension is stable when its
average size distribution remains constant over time, i.e. the particles move about in the
water without settling or aggregating. The mechanism of stability for a colloidal
suspension depends on particle‐particle and particle‐organic molecule interactions.
These interactions occur as a consequence of attractive and repulsive forces and depend
on several factors such as the type and concentration of ions in solution, the presence of
organic and inorganic ligands, or NOM, the particles’ shape and size distribution, and
the total number of particles.
Higher total number of particles leads to higher chances for collision and hence
less stable suspensions. Although the shape and size distribution may vary greatly
within a suspension, for simplicity most theoretical models that deal with the
interactions between particles assume spherical shape and monodisperse suspensions;
an assumption that is oversimplifying actual conditions. Even if the assumption of
spherical shape holds, as particles attach on each other, they produce non‐uniform
clumps of irregular shapes. Hence, the size distribution becomes more complicated. The
spherical shape assumption may be valid for the very first steps of aggregation, when

22
only monomers are present, but the overall size and fractal dimensions of those clumps
will affect the following aggregation steps (e.g. [89, 90]).
Interactions between particles also depend on the adsorption of long or bulky
organics and the charge on the particles’ surface. Long chain organic polymers and
bulky NOM molecules can sorb on particles and cause steric hindrances that stabilize
particles. This mechanism is called steric stabilization. On the other hand, a suspension
of charged particles is stabilized by electrostatic repulsion and this mechanism is called
electrostatic stabilization. Electrostatic forces may result from the adsorption of charged
molecules or from the consistency of the particle. When both steric and electrostatic
phenomena occur, the stabilization mechanism is called electrosteric.
The presence of surface charge on mineral particles is the result of one of the
following processes: isomorphic substitution within crystal structure (metal ions in
solution replacing ions on the mineral surface), structural imperfections (caused by co‐
precipitation of more than one metals), preferential adsorption of specific ions (ions in
solution adsorbing on the particle surface on specific sites), and ionization of inorganic
groups on particulate surfaces [87]. Surface charge attracts ions of the opposite charge,
which form a layer around the surface, known as the Helmholtz layer (or Stern layer)
and can be up to 5 Å thick (Figure 1.6). The ions in that layer attract a cloud of ions, of
both the opposite and same charge, that surrounds the particle more loosely and forms
the diffuse layer. These two layers comprise the electrical double layer (EDL) of a

23
charged particle, which can extent up to 300 Å. The EDL is characterized by an electronic
potential that produces repulsive electrostatic forces between particles of the same
charge and is a stabilizing factor. On the other hand, particles are attracted by Van der
Waals forces, who are destabilizing factors. Particle stability depends on the balance
between these two forces.
Figure 1.6: Electrical double layer of a spherical particle with negative surface charge.
Taken from Crittenden et al [87]

24
The EDL is dependent on the type and concentration of ions in solution. High
concentration of ions allows them to counterbalance the electronic potential of the EDL.
This causes the EDL to compress and the electrostatic repulsive forces between particles
to weaken. As a result, particles aggregate and the suspension is destabilized. The
dependence of particle stability with the concentration of ions in solution is typically
expressed through the critical coagulation concentration (ccc). As the concentration of
ions in solution increases, the surface charge is gradually neutralized and aggregation
becomes faster, until the electrostatic forces are much weaker than Van der Waals
attractive forces and aggregation occurs as fast as Brownian motion allows. The lowest
concentration of ions where this occurs is defined as the ccc. When there are no
repulsive forces and aggregation is driven by Brownian motion, aggregation occurs in
the diffusion limited regime; otherwise in the reaction limited regime.
The most widely used theory for modeling the repulsive and attractive forces
between two charged surfaces was developed by the combined work of Derjaguin,
Landau, Verwey and Overbeek, and is known as the Derjaguin‐Landau‐Verwey‐
Overbeek (DLVO) theory (e.g. [91, 92]). This theory only takes into account the repulsive
electrostatic forces and attractive Van der Waals forces. Other forces, such as acid‐base
interactions and Born repulsion have been included in the form of the extended DLVO
theory, which is also a simplified model because it does not account for factors often

25
occurring in natural systems, such as steric stabilization and particle bridging by
polymers [93].
One key feature of the DLVO theory is the Hamaker constant used to calculate
the attractive forces between particles, because it is characteristic of the particle surface
composition [94]. This constant can be calculated from experimental measurements of a
given system and then compared to Hamaker values for certain types of materials from
the literature. Comparing the Hamaker constant to published values is used as a
criterion for the validity of the DLVO theory for that specific system (e.g. [95]). In cases
where organics are adsorbed on the surface of colloids, the DLVO theory often does not
apply.
The ccc value and zeta potential measurements are needed to calculate the
Hamaker constant of colloids, using the following approximation based on DLVO
theory [96]:
62
45330 107.04
ezAN
ZTk
L
molccc
A
B
(1.2)
where A is the Hamaker constant, εo is the permittivity in vacuum, εr is the permittivity
of water relative to vacuum, kB is the Boltzman constant, e is the electron charge, NA is
the Avogadro number, and z is the valence of the electrolyte. The function Z is defined
as
Tk
ezZ
B4tanh 0
(1.3)
26
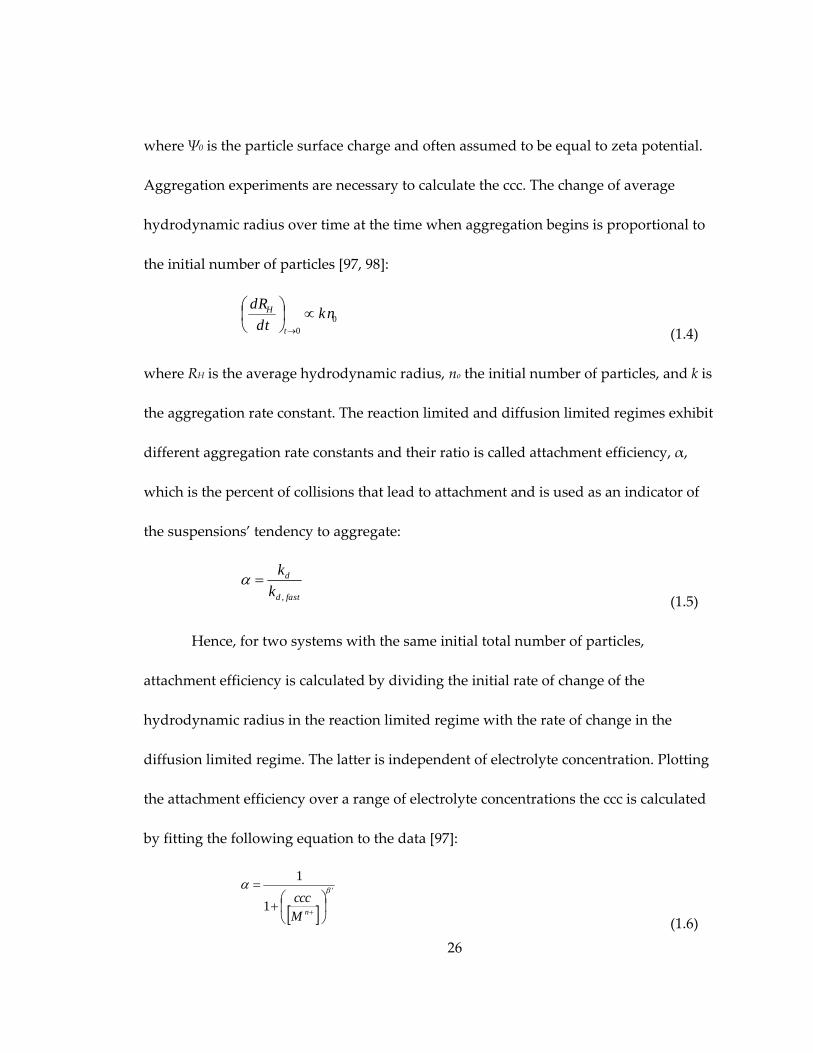
where Ψ0 is the particle surface charge and often assumed to be equal to zeta potential.
Aggregation experiments are necessary to calculate the ccc. The change of average
hydrodynamic radius over time at the time when aggregation begins is proportional to
the initial number of particles [97, 98]:
0
0
kndt
dR
t
H
(1.4)
where RH is the average hydrodynamic radius, no the initial number of particles, and k is
the aggregation rate constant. The reaction limited and diffusion limited regimes exhibit
different aggregation rate constants and their ratio is called attachment efficiency, α,
which is the percent of collisions that lead to attachment and is used as an indicator of
the suspensions’ tendency to aggregate:
fastd
d
k
k
,
(1.5)
Hence, for two systems with the same initial total number of particles,
attachment efficiency is calculated by dividing the initial rate of change of the
hydrodynamic radius in the reaction limited regime with the rate of change in the
diffusion limited regime. The latter is independent of electrolyte concentration. Plotting
the attachment efficiency over a range of electrolyte concentrations the ccc is calculated
by fitting the following equation to the data [97]:
'
1
1
nMccc
(1.6)
27
where Mn+ is the electrolyte (n = 1 for monovalent electrolytes) and β’ is the slope of the
data (plotted as log [α] versus log [electrolyte concentration]) for α values less than 1.
A large amount of research in the field of colloidal stability has focused on metal
oxides, such as iron, manganese, and aluminum oxides. However, less attention has
been given to metal sulfides, especially the ones involving trace metals, such as zinc and
mercury. In addition, most studies incorporate NOM as one of the independent
variables affecting aggregation. However, NOM is not a fully characterized molecule
and is thus treated as a “black box”. In order to study the effect of specific properties of
NOM (e.g. functional groups, molecular weight, and aromaticity) molecules with a
defined structure need to be used.
1.5.3 Precipitation: growth and aggregation
Precipitation is the process during which two or more elements in solution, e.g. a
metal and a ligand, react to form a solid phase. The importance of this process for the
environmental cycle and bioavailability of metals lies in the formation of a separate
phase that has the potential to grow and fall out of solution and may be less bioavailable
than the soluble forms of the metal. Precipitation occurs in supersaturated solutions,
where metals react with ligands to form polynuclear complexes (nucleation) and grow
with the further addition of subunits from solution (growth). If the resulting polymers
become large enough a new phase is formed, a solid particle (Figure 1.7) [99].

28
Precipitation is dependent on parameters such as the concentrations of dissolved
constituents, pH, temperature, the liquid medium in which precipitation occurs, and
coprecipitation. These parameters control the formation of polymers that grow or
combine to form the solid phase [100]. Several ligands can be involved in the
precipitation of metals; hydroxides, sulfides, carbonates, and phosphates are some
typical inorganic ligands. Hydroxide and sulfide, in particular, have been linked to the
evolution and adaptation of living organisms during the Earths lifetime because they
moderate metal bioavailability [101, 102]. Although metal oxides have been extensively
studied, less is known about metal sulfides, especially sulfides of trace metals, such as
zinc and mercury. In their classic study, Rickard and Luther gave a detailed summary of
what is currently known about the formation and stability constants of metal sulfide
complexes and clusters which serve as building blocks for mineral formation [33].

29
Figure 1.7. Simplified scheme of processes involved in nucleation and crystal growth.
Taken from Stumm & Morgan [76]
The presence of organic ligands and NOM can decrease the precipitation kinetics
of metal sulfides; if they remain small in size these particles are able to persist in natural
waters for extended times. Historically, the study of early‐stage formation of precipitates
has been a difficult task due to the physical state and size of these precipitates.
Analytical tools used for dissolved species cannot be used, because the precipitates are
in the solid phase, while at the same time they are so small that detection with tools used
in colloid science is difficult. With recent advancements in techniques such as small
angle X‐ray scattering, X‐ray absorption spectroscopy, atomic force microscopy, and

30
electron microscopy, several technical problems have been tackled and we are now able
to study particle formation from dissolved species in greater detail.
1.5.4 Particle dissolution
Dissolution is a weathering process during which protons or ligands in solution
adsorb on the surface of a solid and form inner sphere complexes with surface atoms.
The bonds near the site of adsorption are gradually polarized and chemical reactions
may take place. Finally, the surface atom is removed from the solid phase into solution
[86]. Parameters affecting dissolution include the concentration of the ligand (e.g. H+),
the concentration of the dissolving constituent in solution (e.g. dissolved metal),
temperature, and the structure of the solid phase. Dissolution is accelerated with
increasing ligand concentration and temperature and decreasing concentration of the
dissolving constituent and crystalline structure.
Particle size, shape, and aggregation state may also affect the dissolution kinetics
of nanoparticulate suspensions. Liu et al found that the surface area normalized
dissolution rate of galena nanoparticles was higher than for bulk galena [103]. In
addition, they found that certain lattice faces dissolve faster than others and that
dissolution of closely packed particles was slower than non‐aggregated particles. These
findings indicate that dissolution of nanoparticles has some unique characteristics
compared to the bulk material.

31
1.6 Research objectives
The goal of this research was to develop a better understanding of the
complexation between metal‐based nanoparticles with soft metal constituents and low
molecular weight thiols in natural waters, and its impact on the fate of the particles. To
achieve this goal, this research was divided into three objectives. The first and second
objectives investigate the interactions between cysteine, zinc, and sulfide. The first
objective (Chapter 2) was to resolve discrepancies in the current literature and determine
whether cysteine can reduce or enhance the aggregation kinetics of ZnS nanoparticles.
To achieve this objective, bare ZnS nanoparticles with average monomer size of 10 nm
were synthesized. This research aimed at mimicking the precipitation of ZnS
nanoparticles in the presence of extracellular biomolecules with thiol constituents. The
aggregation behavior of the ZnS nanoparticles was monitored using dynamic light
scattering. In combination with zeta potential measurements and adsorption
experiments, the mechanism of stabilization was determined.
The second objective (Chapter 3) was to study the effect of cysteine on the early‐
stage formation of ZnS nanoclusters (less than 10 nm) in supersaturated solutions.
Previous studies indicated that thiol containing organic compounds reduce the
precipitation and aggregation kinetics of metal sulfides. This research aimed at studying
the effect of cysteine on the two distinctive and parallel processes that take place during
precipitation: growth and aggregation. A suite of complementary methods was utilized

32
to study the kinetics of growth and aggregation of ZnS nanoclusters in the presence of
excess, equimolar, or lesser cysteine.
The final objective (Chapter 4) was to use similar approaches as in the previous
two objectives to study a wider range of transformations that metallic silver
nanoparticles may undergo in anaerobic environments. The effect of cysteine on
dissolution, aggregation, and surface modifications of metallic silver nanoparticles was
studied. The potential role of coatings in these processes was investigated by utilizing
particles synthesized with two different coatings that are often used in silver
nanoparticle manufacturing.
Finally, in Chapter 5, the implications of this research for understanding the
environmental fate of naturally‐occurring and manufactured metal‐based nanoparticles
are discussed.

33
Chapter 2. Influence of amino acids cysteine and serine on aggregation kinetics of zinc and mercury sulfide colloids
This chapter was published in Gondikas, A.P., Jang E.K., Hsu‐Kim H. (2010).
Journal of Colloid and Interface Science, 347, 167‐171
2.1 Introduction
Colloidal and nanoparticulate metal sulfides play an important role in the
speciation of metal pollutants in the anaerobic aquatic environment, and consequently,
can control their transport and bioavailability to organisms. Moreover, nanoscale
particles (typically smaller than 30 nm), can exhibit size‐dependent properties such as
increased solubility and sorption capacity (even when normalized to surface area) [81,
103]. Zinc, mercury and other metals exist as mineral sulfide colloids and nanoparticles
in environments such as marine ecosystems near hydrothermal vents, sediments of mine
drainage, porewater of anaerobic sediments, and treated municipal wastewater effluents
[12, 15, 31, 81, 104‐106]. Aggregates of ZnS nanoparticles have also been observed as
products of biomineralization in the biofilms of sulfate‐reducing bacteria in stream
sediments [32]. Nanoparticles and colloids of HgS persist in soils and sediments near
abandoned mercury mines [10, 107]. These particles are small enough to pass through
conventional filters (0.2 or 0.45 μm pore size) and can be mistaken as dissolved species

34
in contaminated waters. Furthermore, information regarding the persistence of
incidental or naturally‐occurring metal sulfide nanoparticles is needed to assess the
potential environmental hazards of engineered nanomaterials, such as ZnS‐coated
quantum dots.
Natural organic matter (NOM) is known to play a vital role in the fate and
transport of colloids in the aquatic environment (e.g. [10, 21, 97]). However, little work
has been done to identify the NOM functional groups responsible for surface
interactions with metal sulfide particles under environmental conditions. In our
previous research on ZnS and HgS precipitation [28, 29], we showed that co‐
precipitation with thiol‐containing natural organic acids such as cysteine decreased the
precipitation and growth rates of Zn‐ and Hg‐sulfide nanoparticles. While aggregation
appeared to be the key process controlling particle growth in these precipitation studies,
aggregation could not be separated from nucleation and crystal growth processes that
were occurring simultaneously in the particle suspensions. Moreau et al. [104] also
studied the effects of cysteine on ZnS colloid aggregation. These authors observed a
completely opposite result in that cysteine appeared to enhance colloid aggregation,
rather than prevent it. Differences in water and surface composition may be the reason
for this discrepancy; however, these parameters were not studied in great detail.
The objective of this work was to investigate the aggregation kinetics of ZnS and
HgS colloids and understand how sorption of thiols and water chemistry (e.g., pH, ionic

35
strength) modifies colloidal surfaces and particle attachment efficiencies. We compared
two amino acids, cysteine and serine, which are present in nanomolar to micromolar
concentrations in sediment porewater and the anoxic layer of stratified surface waters
[62, 108]. These amino acids were chosen because they are structurally analogous except
for substitution of the thiol group (on the cysteine) for a hydroxyl group (on the serine).
Aggregation experiments were performed to compare how particle attachment
efficiencies varied as a function of adsorbed amino acid concentration and water
composition (pH and monovalent electrolyte concentration).
2.2. Materials and methods
2.2.1 Materials
All chemicals used in this work were ACS reagent grade and purchased from
Sigma‐Aldrich unless stated otherwise. Barnstead Nanopure‐grade water (>17.8 MΩ cm)
was used to prepare all reagents and samples. Trace‐metal grade acids were used to
adjust the pH of solutions. Borosilicate glass containers for reagents were acid cleaned
by an overnight soak in 1 N HCl followed by three rinses with Nanopure water.
A dissolved Zn(II) stock solution was prepared with ZnNO36H2O (Fisher).
Sulfide stock solutions were prepared by dissolving Na2S9H2O crystals (rinsed and
dried prior to weighing) in water purged with N2 (ultrahigh purity). Stock solutions of
1.5 mM L‐cysteine and 3.5 mM serine were prepared and stored at 4C. The cysteine
stock solution was utilized within 2 weeks of preparation.

36
Reagents for cysteine quantification included 2,2’‐dithiobis(5‐nitropyridine)
(DTNP) dissolved in acetonitrile and 0.5 M sodium acetate buffer dissolved in water and
adjusted to pH 6. Reagents for serine quantification included 2‐mercaptoethanol, o‐
phthaldialdehyde (OPA) dissolved in ethanol, and 0.4 M sodium borate dissolved in
water and adjusted to pH 9.5. HPLC‐grade solvents were utilized for all reagents.
2.2.2 Synthesis and characterization of ZnS and HgS colloids
A stable suspension of uncoated ZnS colloids was prepared using a method
modified from Sooklal et al. [109]. In summary, the sodium sulfide stock solution was
added to a zinc nitrate solution, yielding equimolar concentrations of 0.2 mM zinc and
sulfide at pH ~10.7. After stirring the zinc sulfide solution for less than 1 minute, the
mixture was stored in a capped polypropylene centrifuge tube and allowed to age for at
least 4 days at room temperature before use in aggregation experiments. HgS colloids
were synthesized using a similar approach, except that the pH of the stock suspension
was pH 4.
After the aging period the ZnS stocks contained sphalerite particles with average
hydrodynamic diameter equal to 65 nm, according to dynamic light scattering (DLS)
(Malvern Zetasizer) and X‐ray powder diffraction (Appendix A, Figures A1 and A2).
Images collected by transmission electron microscopy (TEM) indicated that the colloids
ranged from 40 to 150 nm in diameter (Appendix A, Figure A 3). Moreover, TEM images
showed that the colloids consisted of aggregates of monomers that were approximately
37
10 nm diameter. Zeta potential of the particles was ‐36.6 ± 2.8 mV, which is in agreement
with previous work [110]. The BET specific surface area of the particles (freeze dried
from aqueous suspension) was 104 m2/g.
The stock HgS suspension consisted of particles with average hydrodynamic
diameter near 70 nm. The HgS colloids consisted mainly of cinnabar and/or
metacinnabar (Appendix A, Figure A4).
2.2.3 Aggregation experiments
Experiments with the ZnS colloids were performed to determine the effects of
pH, ionic strength, and amino acid concentration on aggregation rates and the
attachment efficiency, α, of the particles. ZnS aggregation experiments were initiated by
diluting an aliquot of the ZnS colloid stock suspension in Nanopure water containing
NaNO3 (between 0.075 M and 0.5 M) and buffered from pH 6.5 to 8.5 by 5 mM 4‐(2‐
hydroxyethyl)piperazine‐1‐ethanesulfonic acid (HEPES). The concentration of particles
in all experimental samples corresponded to 50 μM (as Zn and S). A selection of the
solutions also contained either cysteine or serine, ranging from 5 to 100 μM in
concentration. In HgS aggregation experiments, the colloids were diluted to final
concentration of 2 μM HgS in HEPES‐buffered NaNO3 solutions.
The samples were mixed in polypropylene centrifuge tubes and immediately
transferred to a 1‐cm polycarbonate cuvette before analysis by DLS. A selection of
mixtures, particularly those of the bare particles (no amino acid) and those with serine,

38
was mixed directly in the cuvette. The intensity‐weighted average hydrodynamic
diameter ah of the colloids was quantified over time by DLS using incident light (λ= 633
nm) scattered at 173°. Early stage doublet formation rates were approximated by the
slope of the linear least squares regression of data plotted as ah versus time [111, 112]:
ot
h Nkdt
tda
11
0
(2.1)
where k11 is the aggregation rate constant and No is the initial particle number
concentration. Early stage aggregation was defined for ah values equal to or less than
two times the initial ah. Aggregation experiments were replicated 2‐9 times, as
determined by a relative standard deviation of less than 25% for replicate initial growth
rates
0
t
h
dt
tda.
The attachment efficiency α was calculated from the aggregation rate constant
normalized by the aggregation rate constant (k11)fast in the diffusion‐limited regime:
fastt
h
o
t
h
o
fast
dt
tda
N
dt
tda
N
k
k
fast ,0
0
11
11
1
1
(2.2)
2.2.4 Zeta potential of ZnS colloids
Zeta potential of ZnS colloids was calculated from the electrophoretic mobility
measured at 25°C (Malvern Zetasizer). The samples consisted of ZnS particles

39
(concentration corresponding to 50 μΜ ZnS) suspended in 5 mM HEPES buffer and 0.05
M NaNO3. A selection of samples contained either cysteine or serine. The ZnS colloids
were suspended in solution and allowed to aggregate for approximately 30 min prior to
electrophoretic mobility measurements. Adjustments of pH were made by addition of
HCl or NaOH to the particle suspensions. Electrophoretic mobility was measured in
triplicate sample aliquots.
2.2.5 Adsorption of amino acids on ZnS colloids
Adsorption of cysteine and serine on ZnS colloids was quantified to investigate
how amino acid sorption might affect colloid aggregation. Batch experiments were
prepared by suspending ZnS particles (50 μM) in solution containing 5 mM HEPES
buffer, 50 mM NaNO3, and either cysteine or serine under ambient (i.e., oxic) laboratory
conditions. The particle suspensions were mixed end‐over‐end for 1 h. This adsorption
time was chosen because most aggregation experiments were performed within this
time frame, and sorbed cysteine concentration was relatively constant over 1 h
(Appendix A, Figure A5a). Furthermore, we chose the short sorption time to avoid loss
of cysteine by oxidation, which would be more than 10% over ~1 day (Appendix A,
Figure A5b). In a 1‐h period we observed less than 2% loss of the cysteine in oxic
conditions at pH 7.5.
After mixing, the suspensions were filtered with 0.025‐μm filters (VSWP
Millipore). Zinc concentration in the filtrate was quantified by inductively coupled

40
plasma atomic emission spectroscopy (Prism Teledyne Leeman Labs). The zinc that
remained in the filtered water was 3.5% (±0.5%, n=3) of the initial total Zn, indicating
that this filtration method was capable of separating the particles from the aqueous
phase. Cysteine concentration was measured in the filtrate by derivatization with DTNP
and quantification by reverse phase high performance liquid chromatography (Varian
ProStar) [108, 113]. Serine was measured with a method modified from Lindroth and
Mopper [114]. Samples were derivatized by addition of 1‐mL OPA reagent to 1‐mL
sample. The serine‐OPA derivative was quantified by UV absorbance at 335 nm (Cary‐
Bio‐100 spectrophotometer).
2.3. Results and Discussion
2.3.1 Effects of amino acids, monovalent electrolyte and pH on metal sulfide aggregation
In the ZnS and HgS aggregation experiments, the presence of cysteine in solution
decreased aggregation rates relative to controls with no amino acids. Serine did not alter
aggregation rates. Attachment efficiencies α were calculated from the time‐resolved DLS
data for the diffusion‐limited and reaction limited growth regimes (e.g., Appendix A,
Figure A6). For the range of electrolyte concentration utilized in this study (0.001 ‐ 0.5 M
NaNO3), diffusion‐limited ZnS aggregation (α 1) was observed for particle suspensions
with 100 μΜ serine and in suspensions with no amino acid added (Figure 2.1a). In the

41
presence of cysteine (35 and 100 μΜ), α values were less than 1 over a range of 0.0025‐
0.1 M NaNO3.
The critical coagulation concentration (ccc), defined as the NaNO3 concentration
at the threshold between reaction‐limited and diffusion‐limited aggregation, was
calculated by fitting the data to the equation [98]:
'
3 ][1
1
NaNO
ccc (2.3)
where β’ is the slope of the data (plotted as log α versus log [NaNO3]) for α values less
than 1.
The results indicated that the ccc for ZnS aggregation increased as cysteine
concentration increased. The ccc values were 0.044 and 0.11 M for suspensions with 35
and 100 μΜ cysteine, respectively. These data indicated that cysteine enhanced the
stability of ZnS colloids.

42
(a)
10-3
10-2
10-1
10010-4
10-3
10-2
10-1
100
NaNO3 Concentration, M
Atta
chm
ent E
ffic
ienc
y,
35M cysteine100M cysteineno amino acid100M serine
(b)
10-2 10-1 10010-3
10-2
10-1
100
NaNO3 Concentration, M
Atta
chm
ent E
ffic
ienc
y,
no amino acid100M cysteine100M serine
Figure 2.1. Attachment efficiency, α for aggregation of (a) ZnS colloids (50 μΜ as Zn
and S) and (b) HgS colloids (2 μΜ as Hg and S) suspended in solution with cysteine,
serine, or no amino acid (pH 7.5, 5 mM HEPES buffer).
In similar experiments with HgS colloids, the results also demonstrate that
cysteine reduced HgS aggregation rates (Figure 2.1b). Serine had no observable effect on
aggregation rates compared to controls with no amino acid added. In the presence of 100
43
μM cysteine, the ccc of HgS colloidal aggregation was 0.44 M. This value is
approximately 0.34 M greater than the ccc values for the amino acid‐free control (0.092
M) and the sample with 100 μM serine (0.095 M). For the HgS concentration utilized in
the aggregation experiments (2 μM HgS), reaction‐limited aggregation regimes were
observed in the amino acid‐free controls. Reaction‐limited aggregation was not observed
with the zinc sulfide suspensions containing 50 μM ZnS.
In addition to NaNO3 concentration, pH also changed the aggregation rates of
ZnS colloids suspended in water with cysteine. For water with pH values ranging from
6.5 to 8.5, greater colloidal stability was observed at higher pH values (Figure 2.2). The
ccc was 0.035 M at pH 7.5 and approximately 0.5 M at pH 8.5. At a fixed ionic strength
(e.g., 0.05 M NaNO3 in Figure 2.3), pH had a profound effect on the aggregation rate of
ZnS colloids. Attachment efficiencies decreased by four orders of magnitude as the pH
increased from pH 6.5 to pH 8 (Figure 2.3).

44
10-2
10-1
100
10-4
10-3
10-2
10-1
100
NaNO3 Concentration, M
Atta
chm
ent E
ffic
ienc
y,
pH 8.5pH 7.5pH 6.5
Figure 2.2. Attachment efficiency for aggregation of ZnS colloids (50μΜ) in the
presence of cysteine and as a function of monovalent electrolyte concentration and pH
(35 μΜ cysteine, 5 mM HEPES buffer)
6.5 7 7.5 8
10-4
10-2
100
pH
Atta
chm
ent E
ffic
ienc
y,
35 M cysteine100 M cysteine
Figure 2.3. Attachment efficiency for aggregation of ZnS colloids (50 μΜ) in solution
containing cysteine and varying pH (5 mM HEPES buffer, 0.05 M NaNO3 electrolyte).
Error bars represent one standard deviation of 2‐9 replicate samples.
45
2.3.2 Zeta potential of ZnS colloids
Zeta potential of the ZnS colloids was measured as a function of pH for
suspensions containing bare particles (i.e., no amino acid) and for ZnS suspensions
containing amino acids. Our data in Figure 2.4 indicated that the isoelectric point (i.e.p.)
of bare particles was between pH 7 and 8, which is in agreement with some previous
work [115‐117], but inconsistent with other studies [118‐120] that reported i.e.p. values
less than pH 3. The discrepancy of i.e.p. values in the literature has been attributed to
oxidation of surface S atoms under oxic conditions [119]. Partial dissolution of ZnS
particles may also be occurring, particularly at pH values less than 6 [110]. The Zn:S
ratio used to synthesize ZnS particles could also change the surface charge of the
particles. For example, an excess of HSˉ ions could sorb to particle surfaces, leading to
net decrease in surface charge.
The addition of 100 μΜ serine did not change the zeta potential of the colloids,
but the addition of cysteine decreased zeta potential and i.e.p. values of the particles.
Modification of surface charge to more negative values provides an explanation to the
stabilization effect of cysteine for the ZnS colloids. As cysteine concentration increased
from 35 to 100 μΜ, large changes in zeta potential were not observed (for pH > 7) even
though ZnS aggregation rates decreased under these conditions (Figure 2.3).
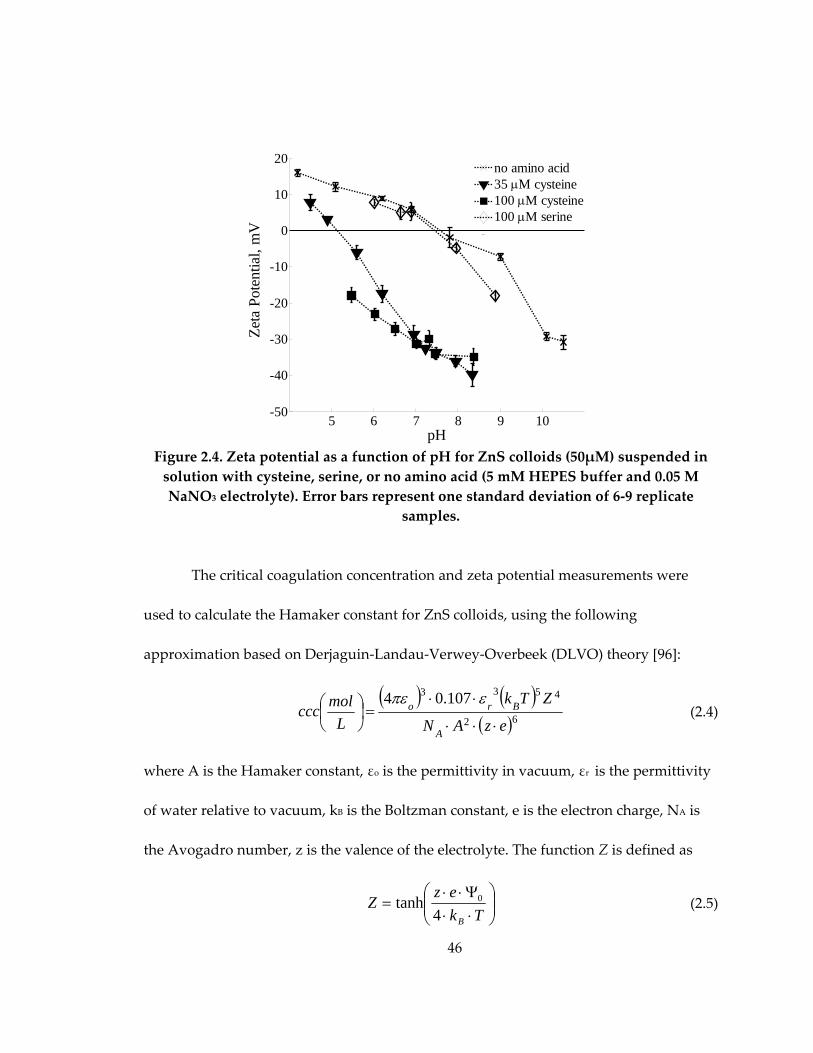
46
5 6 7 8 9 10-50
-40
-30
-20
-10
0
10
20
pH
Zet
a P
oten
tial,
mV
no amino acid35 M cysteine100 M cysteine100 M serine
Figure 2.4. Zeta potential as a function of pH for ZnS colloids (50μΜ) suspended in
solution with cysteine, serine, or no amino acid (5 mM HEPES buffer and 0.05 M
NaNO3 electrolyte). Error bars represent one standard deviation of 6‐9 replicate
samples.
The critical coagulation concentration and zeta potential measurements were
used to calculate the Hamaker constant for ZnS colloids, using the following
approximation based on Derjaguin‐Landau‐Verwey‐Overbeek (DLVO) theory [96]:
62
4533 107.04
ezAN
ZTk
L
molccc
A
Bro
(2.4)
where A is the Hamaker constant, εo is the permittivity in vacuum, εr is the permittivity
of water relative to vacuum, kB is the Boltzman constant, e is the electron charge, NA is
the Avogadro number, z is the valence of the electrolyte. The function Z is defined as
Tk
ezZ
B4tanh 0 (2.5)

47
where Ψ0 is the particle surface charge (here assumed to be equal to the zeta potential).
For the ZnS colloidal suspensions at pH 7.5, Hamaker constants were estimated to
be 4.4×10‐20 and 2.8×10‐20 J in solutions containing 35 and 100 μΜ cysteine, respectively.
At pH 8.5 and 35 μΜ cysteine, the calculated Hamaker constant was 1.3×10‐20 J. These
values for A are approximately an order of magnitude smaller than other previous
reports (generally A >10‐19 J) for copper and other metal sulfide particles in water media
[121]. Adsorption of cysteine may have changed the surface properties of the particles;
however, further studies are needed to evaluate the mechanism of cysteine sorption and
the implications for van der Waals interactions between metal sulfide surfaces.
2.3.3 Adsorption of cysteine on ZnS
Adsorption of cysteine and serine on ZnS colloids was quantified to understand
how the amino acids were interacting with particle surfaces. For the range of cysteine
concentrations utilized in the aggregation experiments, cysteine was observed to adsorb
to the particles within 1 h (Figure 2.5a). The adsorption isotherms, however, did not
differ significantly between pH 6.5 and pH 7.5, even though α values changed by orders
of magnitude with 100 μM cysteine in the suspensions (Figure 2.3). Thus, the decrease in
zeta potential as the pH shifted from 6.5 to 7.5 (Figure 2.4) was likely caused by
deprotonation of surface functional groups (on the mineral surface or adsorbed cysteine
molecules) rather than a change in cysteine surface density.

48
While pH controlled the extent of surface deprotonation and zeta potential,
cysteine surface density also greatly affected ZnS aggregation rates and α values. As
shown in Figure 2.5b, the attachment efficiency α decreased by three orders of
magnitude as cysteine surface density increased from 0.1 to 0.5 μmol/m2.
We did not observe significant sorption of serine on ZnS colloids at pH 7.5. For
dissolved serine concentrations ranging from 50 to 150 μM, we recovered more than
93.5% of the total serine in the aqueous phase after 1 h exposure to ZnS colloids. Thus,
the low binding affinity of serine on the metal sulfide particles is an explanation for no
effect on ZnS and HgS aggregation.

49
(a)
0 50 100 150 2000
0.2
0.4
0.6
Dissolved Cysteine, M
Sor
bed
Cys
tein
e m
ol/m
2
pH 7.5pH 6.5
(b)
0 0.1 0.2 0.3 0.4 0.5
10-3
10-2
10-1
100
Sorbed Cysteine, mol/m2
Atta
chm
ent E
ffic
ienc
y,
Figure 2.5. (a) Sorption of cysteine after 1 h exposure to ZnS colloids (50 μΜ) at pH 6.5
and 7.5 and (b) effects of cysteine surface density on the attachment efficiency α for
ZnS aggregation (pH 7.5, 5 mM HEPES buffer, 0.05 M NaNO3 electrolyte). Error bars
represent one standard deviation of 2‐9 replicate samples (where available).
50
2.4 Conclusions
Colloidal and nanoparticulate metal sulfides can govern the speciation of toxic
metals such as zinc and mercury in anaerobic environments. Surface coatings by small
molecular weight organic acids and humic substances are important for the fate and
transport of these particles in sediment porewater and in the water column. Thiol‐
containing organics are present in natural waters in small concentrations (typically
micromolar or less), but have very high affinity for type B metal ions such as Hg2+ and
Zn2+ [27]. Hence, organic molecules with thiol functional groups may preferentially
adsorb on mineral sulfides and change particle surfaces in a way that can drastically
alter colloidal stability.
Cysteine decreased the aggregation rates of ZnS particles by altering electrostatic
interactions between the particles, as indicated by negative surface charge induced by
the presence of cysteine. Sorption of cysteine also appeared to change particle‐particle
van der Waals interactions because the estimated Hamaker constants were lower than
values expected for metal sulfides. The results also demonstrated that water
composition (e.g., ionic strength and pH) was a parameter that influenced surface charge
and aggregation rates of ZnS colloids. Differences in water chemistry and surface charge
could be the reason for discrepancies between our previous work [29] and the study by
Moreau et al. [104], where pH values and particle zeta potentials were not reported.
51
This study highlights the importance of thiol‐containing organic ligands for
metal sulfide colloid aggregation due to relatively high binding affinities between thiols
and metal sulfide surfaces. Such interactions may not occur to the same extent with
other types of colloids (e.g., silica and other metal oxides). Other thiol‐containing
organics (including proteins with cysteine components) may enhance metal sulfide
particle aggregation rather than prevent it, depending on the size, structure, and
hydrophobicity of those organic compounds. Moreover, non‐specific processes such as
hydrophobic interactions may be important for sorption of humic substances and other
NOM macromolecules. Further studies should address both specific and non‐specific
surface interactions with humic substances and the implications of these interactions for
colloidal stability of mineral sulfides.

52
Chapter 3. Early-stage precipitation kinetics of zinc sulfide nanoclusters forming in the presence of cysteine
This chapter was published in Gondikas, A.P., Masion A., Auffan M., Lau B.L.T.,
Hsu‐Kim H. (2011). Chemical Geology (in press)
3.1 Introduction
Nanoparticles are ubiquitous in the environment and play vital roles in earth
processes such as the global cycling of elements, bioavailability of nutrients, and
contaminant transport [29]. Nanoparticulate metal sulfides such as ZnS are important
for the speciation of metal pollutants in anaerobic and sulfidic settings, and
consequently, can control their transport and bioavailability to organisms [122].
Moreover, nanoscale particles (typically smaller than 30 nm) exhibit size‐dependent
properties such as increased solubility and sorption capacity (even when normalized to
surface area) [81, 83, 103].
ZnS and other mineral sulfide nanoparticles tend to exist in organic‐rich
environments such as anaerobic sediments and municipal wastewater [8, 12, 15, 106,
123‐125]. While natural organic matter (NOM) is capable of changing the interfacial
chemistry of polynuclear ZnS clusters and nanoparticles and altering precipitation and
aggregation kinetics, the mechanism of this process remains poorly elucidated. Such
information would provide insight to the conditions required for the formation of metal
sulfide nanoparticles in the environment. Furthermore, an understanding of the

53
processes that enable nanoparticles to persist will aid risk assessments of synthetic
nanomaterials (e.g., ZnS quantum dots) that may be released to the environment.
NOM is thought to interfere with the early stages of mineral precipitation by
sorbing to the surface of the initial nanocluster or nanoparticle subunits, blocking
surface sites from further crystal growth, and modifying interfacial chemistry of the
particles that ultimately reduce aggregation and deposition rates [126‐128]. This process
has been studied extensively for iron (hydr)oxides and other oxide minerals [21, 97, 129‐
132]; however, little is known regarding such processes for metal sulfides.
Metal sulfides such as ZnS differ from oxide minerals in that thiol‐containing
moieties associated with NOM may preferentially sorb to metal atoms on the surface of
these materials [133] and act as capping agents for the nanoclusters and nanoparticles
formed during the early stages of precipitation. ZnS nanoparticles have been observed
in the biofilms of anaerobic sediment bacteria [134]. These nanoparticles were closely
associated with sulfur‐containing organics within the extracellular matrix of the biofilms
[104]. Previous research has demonstrated that thiol‐containing organic acids such as
cysteine, mercaptoacetate, and glutathione were capable of stabilizing nanoparticulate
ZnS, CdS, and HgS as they precipitated in supersaturated solutions [28, 29, 135]. The
thiols were shown to induce a net negative charge on the particle surfaces, resulting in
electrostatic repulsive forces that were unfavorable for aggregation [136].
54
The objective in this study was to investigate how cysteine altered growth rates
of the initial polynuclear zinc sulfide cluster subunits (termed nanoclusters in this study)
formed during the beginning stages of ZnS precipitation. We used a combination of
small angle X‐ray scattering (SAXS) and dynamic light scattering (DLS) to probe
changes to the clusters as they grow and aggregate in aqueous suspension. The
scattering experiments were complemented with Zn K‐edge X‐ray absorption
spectroscopy (XAS) to determine the speciation of ZnS nanoclusters that formed in the
presence of cysteine. Nanocluster products were characterized by additional methods
including X‐ray diffraction and electron microscopy.
3.2 Materials and methods
3.2.1 Materials
All chemicals used in this work were ACS reagent grade and purchased from
Fisher Scientific unless stated otherwise. Barnstead Nanopure‐grade water (>18 MΩ cm)
was used to prepare all reagents and samples. Ultrahigh purity gases were used for
purging solutions. Trace‐metal grade HCl was used to adjust the pH of solutions.
Borosilicate glass containers for reagents were acid‐cleaned by an overnight soak in 1 N
HCl followed by three rinses with Nanopure water. A zinc(II) stock solution was
prepared by dissolving ZnNO3•6H2O crystals in water. Sulfide stock solutions were
prepared by dissolving Na2S•9H2O crystals (rinsed and dried prior to weighing) in
55
water purged with N2. The sulfide stock solution was utilized within 36 hours of
preparation. Stock solutions of L‐cysteine hydrochloride (Sigma‐Aldrich) were prepared
in water purged with N2 and stored at 4 ˚C. The cysteine stock solution was utilized
within 2 weeks of preparation. Sodium bicarbonate solutions were prepared by
dissolving NaHCO3 in water, stored at 4°C and utilized within three days of
preparation.
3.2.2 Dynamic light scattering and small angle X-ray scattering
Experimental solutions for dynamic light scattering (DLS) and small angle X‐ray
scattering (SAXS) consisted of cysteine dissolved in NaHCO3 (20 or 35 mM) buffered at
pH 7.9 to 8.3. ZnS precipitation was initiated by equimolar addition of Zn(II) followed
by S(‐II) from their respective stock solutions. Zn and S concentrations in the samples
were 2 or 5 mM. Various initial concentrations of cysteine were used to determine its
effect on the precipitation kinetics of ZnS at room temperature.
The hydrodynamic diameter of Zn‐S‐cysteine mixtures was measured with time‐
resolved DLS (Malvern Zetasizer NS) at 25°C. After the addition of sulfide, the sample
was dispensed into a 1‐cm polycarbonate cuvette and placed immediately into the
instrument sample holder for measurement. The intensity‐weighted average
hydrodynamic diameter of the precipitates was quantified over time by DLS using
incident light (λ = 633 nm) scattered at 173°.
56
Nanocluster size and fractal dimensions of ZnS particles were measured by
SAXS at the ID02 high brilliance beamline at the European Synchrotron Radiation
Facility (Grenoble, France). The beamline was configured to wavelength λ=0.1 nm and
fitted with a flow‐through and stop‐flow sampling assembly to allow for time‐resolved
data acquisition. Scattering data was acquired for 0.01 s or 0.03 s intervals for scattering
vector q between 7.5×10‐3 Å‐1 and 0.4 Å‐1. Additional SAXS experiments were performed
at the BM02 beamline at ESRF, with data acquisition intervals of 100 s for q values
between 1.8×10‐4 Å‐1 and 0.17 Å‐1. At BM02, sample suspensions were dispensed in
quartz capillary tubes (1.5 or 2.0 mm inner diameter, Mark‐Röhrchen, Ltd) for analysis.
Each ZnS sample had a corresponding blank that involved the same buffer solution
(without Zn or S) for which SAXS spectra was collected in the same holder prior to the
respective ZnS sample. SAXS data for the samples and the respective blanks were
collected for the same acquisition time. Raw data from SAXS experiments underwent
standard treatment [137], in which time‐ and absorption‐weighted background
scattering of blank samples were subtracted from sample spectra and the corresponding
ʺdark countʺ of the detector was taken into account for background correction.
3.2.3 Zn K-edge X-ray absorption spectroscopy (XAS)
Samples for XAS were prepared by adding aliquots of zinc nitrate and sodium
sulfide stocks to a final concentration of 5 mM into solutions containing cysteine. The
pH was then adjusted by adding NaOH or HCl. The samples were mixed end‐over‐end

57
for 1 h and then centrifuged for 180 min at 11,000 g, 25°C (Sorvall, Super T21). The
settled particles were separated from the supernatant and freeze dried for analysis.
Reference materials for XAS included commercially‐obtained sphalerite ZnS (Sigma
Aldrich), wurtzite ZnS (SPI), and zincite ZnO (Sigma Aldrich) powders. Additional Zn‐
cysteine references were synthesized by dissolving Zn(NO3)2 (5 mM) in a solution
containing dissolved cysteine (5 mM or 10 mM), resulting in solutions of Zn(cys) and
Zn(cys)2 complexes. After adjusting to pH 8 with NaOH, the solutions were freeze‐dried.
The geometry and local atomic structure of Zn(II) was measured with X‐ray
absorption spectroscopy (XAS) in the extended fine structure (EXAFS) range. XAS is a
powerful tool for structural characterization of nanometer‐scaled materials because the
measurements have high selectivity between elements and are independent of the long‐
range order of the material. XAS spectra were recorded at room temperature at beamline
X23A2 at the National Synchrotron Light Source (NSLS, New York, USA). The samples
were diluted into BN and pressed into thin pellets to achieve an edge jump of
approximately unity. Spectra were acquired in transmission mode using a Si(311)
monochromator from 100 to 800 eV above the Zn K‐edge (9.659 keV). The spectra were
compiled from the merge of three to five scans, and the energy was calibrated using a Zn
foil. EXAFS spectra were obtained after performing standard procedures for pre‐edge
subtraction, normalization, polynomial removal, and wave vector conversion using the
IFEFFIT software package [138]. For each atomic shell, the interatomic distance (R), the
58
coordination number (CN), and mean squared displacement (ss2) were adjusted and the
number of independent parameters was never exceeded during modeling. The
amplitude reduction factor So2 and the threshold position E0 were fit to data from
reference compounds (wurtzite, sphalerite, and zincite) and fixed for all subsequent
analyses.
3.2.4 Other particle characterization methods
Sample characterization was also performed with X‐ray diffraction (XRD)
(Philips X’Pert PRO MRD HR). Aliquots of dried samples (same as samples for XAS)
were placed on double‐sided tape. XRD spectra were collected with incident beam
wavelength of 1.54056 Å. Spectra from the blank tape was used for background
subtraction.
Particle morphology was assessed by transmission electron microscopy (TEM)
(Hitachi HF2000) operated at 200 keV beam energy. Samples for TEM were prepared by
depositing a 10 μl droplet on a formvar‐coated copper grid (Ted Pella) and wicking
excess liquid with a lint‐free tissue. The sample was left to dry for 15 min, and the
deposition process was repeated three times. The grid was rinsed by repeating the
deposition/wicking step with Nanopure water. Grids were dried in a desiccator for at
least 24 h before analysis with TEM.
59
3.3 Results and discussion
3.3.1 Cluster growth kinetics of ZnS-cysteine suspensions
The addition of dissolved Na2S to solutions containing dissolved Zn resulted in
particles precipitating from solution. Time‐resolved SAXS was used to probe growth
kinetics of the initial nanocluster subunits with and without cysteine in solution. Log‐log
scattering plots (intensity I versus scattering vector q) did not reveal oscillations or
correlation peaks, suggesting that that the samples consisted of polydisperse
suspensions of particles (Figure 3.1). Scattering intensities were strongly dependent on
Zn and S concentration (Figure 3.1a). The scattering intensity at q values near 10‐2 Å‐1
decreased as ZnS concentration decreased from 5 mM to 0.005 mM (Figure 3.1a), in
agreement with previous work [139]. For our experimental conditions, ZnS
concentrations in the millimolar range were needed to obtain sufficient scattering
intensities. Thus, 2 mM to 5 mM ZnS was chosen for precipitation experiments with
cysteine in solution.
For mixtures where cysteine concentration was less than or equal to ZnS
concentration (cys:ZnS ratios of 1:4, 1:2, and 1:1), scattering intensity curves had a
negative slope at low q values (q ~ 10‐2 Å), indicating that the particles were aggregating
(Figure 3.1b). In contrast, for the sample with excess cysteine relative to ZnS (2:1 ratio),
the scattering curve at low q values (from 10‐2 to 10‐1.5 Å) was flat, indicating little to no
aggregation.
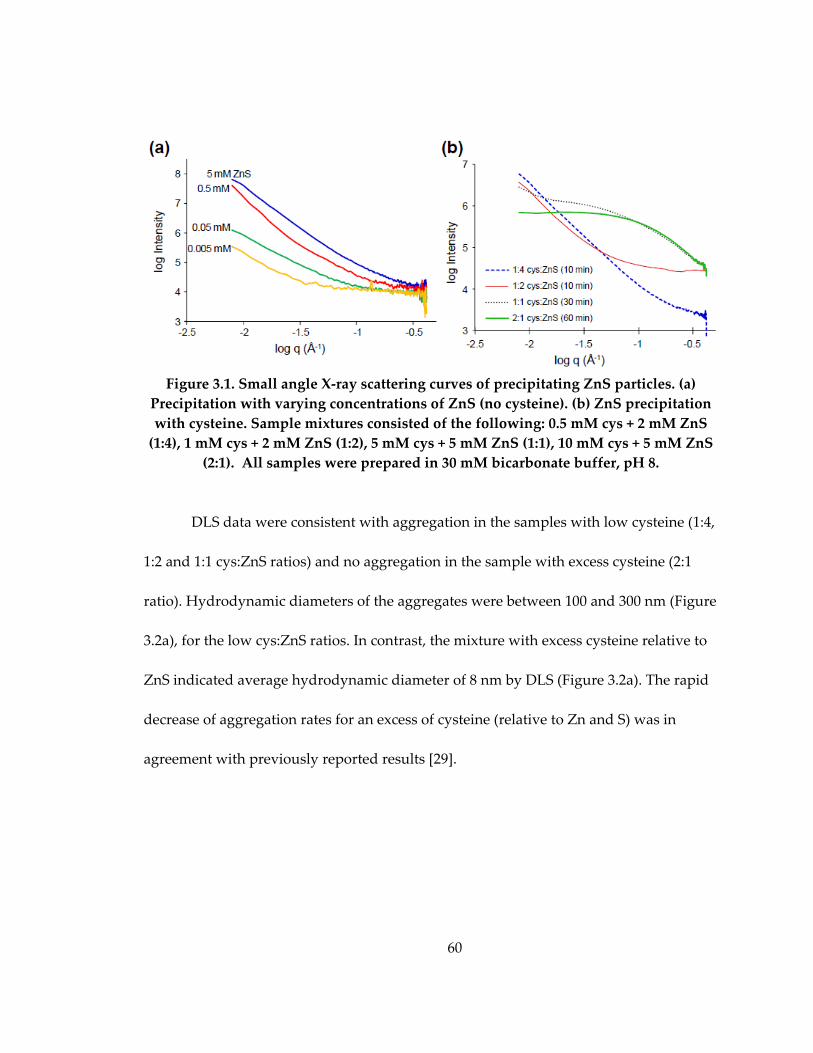
60
Figure 3.1. Small angle X‐ray scattering curves of precipitating ZnS particles. (a)
Precipitation with varying concentrations of ZnS (no cysteine). (b) ZnS precipitation
with cysteine. Sample mixtures consisted of the following: 0.5 mM cys + 2 mM ZnS
(1:4), 1 mM cys + 2 mM ZnS (1:2), 5 mM cys + 5 mM ZnS (1:1), 10 mM cys + 5 mM ZnS
(2:1). All samples were prepared in 30 mM bicarbonate buffer, pH 8.
DLS data were consistent with aggregation in the samples with low cysteine (1:4,
1:2 and 1:1 cys:ZnS ratios) and no aggregation in the sample with excess cysteine (2:1
ratio). Hydrodynamic diameters of the aggregates were between 100 and 300 nm (Figure
3.2a), for the low cys:ZnS ratios. In contrast, the mixture with excess cysteine relative to
ZnS indicated average hydrodynamic diameter of 8 nm by DLS (Figure 3.2a). The rapid
decrease of aggregation rates for an excess of cysteine (relative to Zn and S) was in
agreement with previously reported results [29].

61
Figure 3.2. (a) Average hydrodynamic diameter of cysteine‐ZnS cluster aggregates
determined by dynamic light scattering; (b) Fractal dimension quantified from small
angle X‐ray scattering data (calculated from q range 10‐1.7 to 10‐0.7 Å‐1). Sample mixtures
consisted of the following: 0.5 mM cys + 2 mM ZnS (1:4), 1 mM cys + 2 mM ZnS (1:2), 5
mM cys + 5 mM ZnS (1:1), 10 mM cys + 5 mM ZnS (2:1). All samples prepared in 30
mM bicarbonate buffer, pH 8.
The SAXS data also provided information regarding the size and growth rates of
the aggregate subunits (i.e., the nanoclusters) in the ZnS‐cysteine samples. With
increasing concentration of cysteine (from 1:4 to 1:2 cys:ZnS ratios in Figure 2.1b), the
SAXS curves demonstrated larger intensity at the high q range (>10‐1 Å‐1), indicating
larger subunits or denser clusters [140].
While the SAXS data indicated polydisperse size distribution of particles, the
precise nature and structure of these particles were not known. Indeed we were not able
to derive the amount of cysteine bound to ZnS and the exact structure of the ZnS‐
cysteine nanoclusters from our present data. Therefore, rigorous modeling of the SAXS
data based on atomic scattering factors and interatomic distances was not possible in
this case. However, the sizes of different sub‐structures within the aggregates were

62
estimated for the 1:1 and 2:1 cys:ZnS mixtures by modeling portions of the experimental
data with simple geometric shapes. TEM images of the samples suggested that the
monomer subunits were globular shapes (Figure 3.3). Therefore, we utilized the simplest
shape, the sphere, for the SAXS models.
Figure 3.3. TEM images of ZnS‐cysteine precipitates. (a) 5 mM cys + 5 mM ZnS (1:1);
(b) 10 mM cys + 5 mM ZnS (2:1).
Rayleighʹs equation was used to compute the models for the SAXS intensity I(q)
[141]:
I(q) V 2(3sinqR qRcosqR
(qR)3 )2 (3.1)

63
where R is the radius and V is the volume of the sphere. Standard least squares were
used to fit the models to the experimental data (Figure 3.4a and 3.4b).
In the 1:1 cys:ZnS sample at the 0.5 and 3 h time points, the absence of a Porod
region at the highest q values suggested that the smallest subunit in this polydisperse
suspension of ZnS particles was smaller than the detection limit (< 0.8 nm). The
scattering at 13 h of aging displayed a Porod region (indicated by slope of log I versus
log q approaching ‐4). The SAXS data (for q > 10‐1 Å‐1) was fit with a model for spherical
particles with 2.2 nm diameter (Figure 3.4a). The negative slope of the intensity curve at
q values from 10‐2 to 10‐1 Å‐1 indicated that these 2.2 nm units have minimal spacing
between each other or are in contact. These results suggested that the nucleated subunits
were growing over the first several hours of the experiment (Figure 3.4c).

64
Figure 3.4. Small angle X‐ray scattering data of 5 mM ZnS precipitating with (a) 5 mM
cysteine (1:1 cys:ZnS) and (b) 10 mM cysteine (2:1 cys:ZnS). Solid lines denote
experimental data; dotted lines denote Rayleigh model for monodisperse spherical
particles. (c) ZnS cluster diameter estimated from Rayleigh models in parts (a) and (b).
Solid symbols (●) and ( ) correspond to 2:1 and 1:1 cys:ZnS samples, respectively.
Open symbol (○) corresponds to diameters for the 2:1 cys:ZnS determined from Gunier plots. Minimum ZnS cluster size at 0.5 h and 3 h time points for the 1:1
cys:ZnS sample were less than the detection window corresponding to the maximum
q value (10‐0.3 Å) for SAXS data collection.
Similarly in the 2:1 cys:ZnS sample, cluster sizes were observed to increase with
time. At this cys:ZnS ratio, none of the scattering profiles displayed Porod behavior,
indicating again that the smallest structural unit within the aggregates was a ZnS‐based
cluster smaller than 0.8 nm. The remarkable feature was the absence of aggregates for
65
the 1 and 3 h time points as shown by the flat scattering curve towards low q. The best
fits for the low q portion of the scattering curves were obtained with sphere models of
3.2 and 3.9 nm diameter for 1 and 3 h, respectively. These maximum sizes were in close
agreement with radii of gyration Rg determined by the Gunier approach [137, 142], thus
validating the spherical shape used in our Rayleigh modeling approach. At 13 h of
aging, aggregation occurred. The ʺ Sʺ shape scattering profile was indicative of the
aggregation of non‐touching sub‐structures with diameter of 5.7 nm, based on modeling
of the intermediate q range of the SAXS data. The spacing between the sub‐structures
was presumably due to the presence of excess cysteine. These results were in agreement
with the TEM observations (Fig. 3.3b) Overall, the SAXS data indicated that an increase
in cysteine concentration resulted in faster nanocluster growth rates, while at the same
time the cysteine prevented or slowed aggregation of the monomer clusters. With
cysteine concentration that was double the ZnS concentration, thiol sorption at the
surface was likely sufficient to decrease aggregation rates but insufficient for blocking
cluster growth sites. We did not test the effects of increasing cysteine concentration
beyond the 2:1 cys:ZnS ratio; however, previous work with CdS clusters suggest that the
size of cluster subunits would decrease if cysteine concentration increased further by
one or two orders of magnitude relative to the metal sulfide concentration [135].

66
3.3.2 Structure of aggregates
The DLS and SAXS data both indicated that the 1:4, 1:2, and 1:1 cysteine:ZnS
mixtures contained aggregated nanoclusters. The DLS results also indicated that
hydrodynamic diameters of the aggregates were relatively constant over the first 13 h of
precipitation (Figure 3.2a). Fractal dimension Df of the aggregates was calculated from
the SAXS scattering intensities using the following equation:
fDqqI ~)( (3.2)
For portions of the log‐log scattering curves that were linear (q values ranging
from 10‐1.7 to 10‐0.7 Å‐1), Df values were estimated from the slope of the log‐log SAXS data
(Figure 3.2b). In the case of the 1:1 cysteine:ZnS sample, the fractal dimension during the
first 30 min was approximately 1.1, indicating linear aggregate structures. After 3 and 13
h, Df values increased to 1.6, approaching structures that resembled diffusion controlled
aggregation kinetics (Df ≈ 1.7). At lower cysteine to zinc ratios (1:4 and 1:2), Df values
were approximately 2 for all time points measured except a smaller value at the first
time point (0.5 s) (inset, Figure 3.2b). These results indicated that at lower cysteine
concentrations (1:4 and 1:2 ratios) aggregation was occurring under the reaction limited
kinetics, even though previous work suggested that overall aggregation rates decreased
with decreasing cysteine coverage on ZnS particles [136]. Furthermore, aggregation of
the initial nucleated clusters was occurring on a faster time scale than we were able to
observe (less than 0.5 s). While fractal dimension is an indicator of aggregation kinetics

67
(i.e. diffusion limited or reaction limited), the nanocluster subunits were also growing
and possibly leading to changes in aggregate structure.
3.3.3 Particle characterization and speciation
XRD was used to confirm long‐range atomic structure (e.g., crystal lattice) of the
particles while Zn K‐edge XAS was used to determine short‐range order (e.g., Zn
coordination environment). The diffraction patterns of the ZnS nanoclusters with and
without cysteine (Figure 3.5) demonstrated peaks at 28.5°, 47.9°, and 56.5° (2θ units) and
are in agreement with the crystallographic d‐spacing of the reference compound
sphalerite (cubic ZnS). Those peaks correspond to the (111), (202), and (311) lattice
planes, respectively. In the nanoparticulate ZnS (n‐ZnS) and cys‐ZnS (2:1) samples, the
broad profiles and the large width at half maximum of the peaks highlight the small size
of the crystallites. Using the Debye‐Scherrer formula [143, 144], we estimated coherent
diameters of 3.5 (±0.4) nm, 3.8 (±0.4) nm, and 3.6 (±0.4) nm for the (111), (202), and (311)
lattice planes of the n‐ZnS particles (no cysteine). This calculation indicated that the
clusters were relatively isotropic, in agreement with the globular shape observed by
TEM. For the cysteine‐capped ZnS samples, the broad peak at 28.3° corresponded to a
diameter of 1.8 (±0.2) nm. In this sample, we observed additional peaks at 29.3° and
31.5°, coinciding with the peaks for the Zn(cys)2 reference sample. These peaks probably
corresponded to residual salts such as NaNO3 (29.38˚, 31.9˚) and NaCl (31.7˚) that
precipitated from solution during the freeze‐drying process.
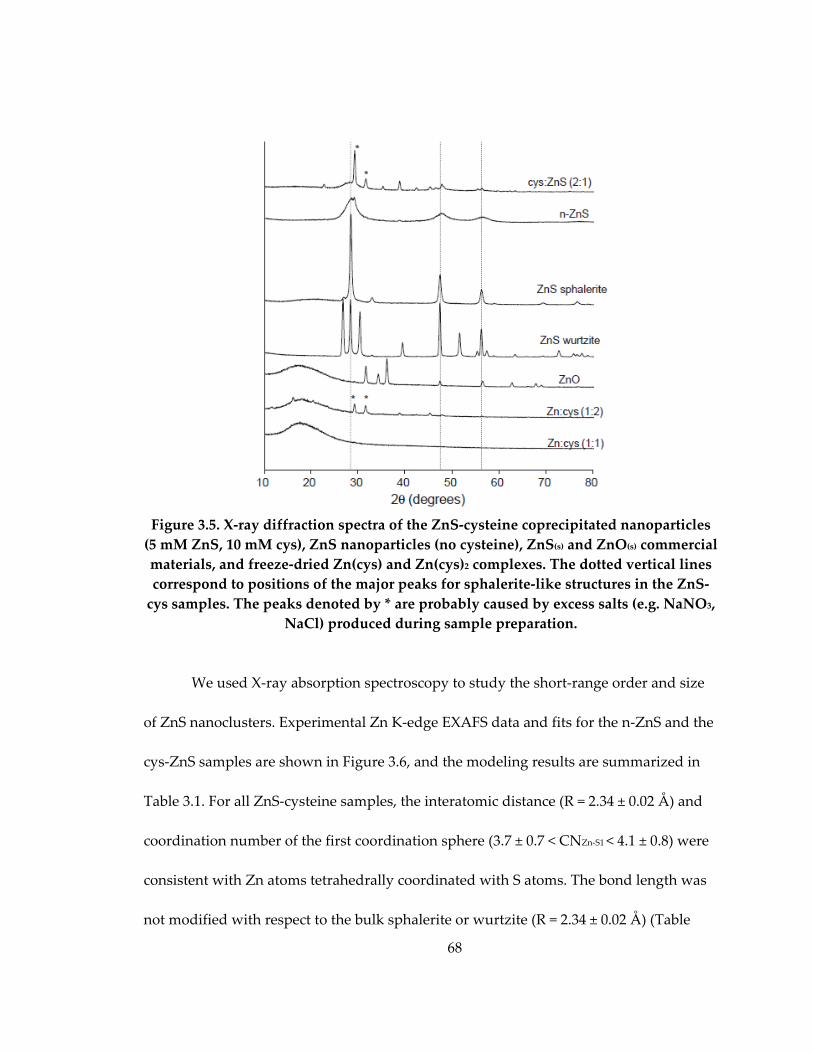
68
Figure 3.5. X‐ray diffraction spectra of the ZnS‐cysteine coprecipitated nanoparticles
(5 mM ZnS, 10 mM cys), ZnS nanoparticles (no cysteine), ZnS(s) and ZnO(s) commercial
materials, and freeze‐dried Zn(cys) and Zn(cys)2 complexes. The dotted vertical lines
correspond to positions of the major peaks for sphalerite‐like structures in the ZnS‐
cys samples. The peaks denoted by * are probably caused by excess salts (e.g. NaNO3,
NaCl) produced during sample preparation.
We used X‐ray absorption spectroscopy to study the short‐range order and size
of ZnS nanoclusters. Experimental Zn K‐edge EXAFS data and fits for the n‐ZnS and the
cys‐ZnS samples are shown in Figure 3.6, and the modeling results are summarized in
Table 3.1. For all ZnS‐cysteine samples, the interatomic distance (R = 2.34 ± 0.02 Å) and
coordination number of the first coordination sphere (3.7 ± 0.7 < CNZn‐S1 < 4.1 ± 0.8) were
consistent with Zn atoms tetrahedrally coordinated with S atoms. The bond length was
not modified with respect to the bulk sphalerite or wurtzite (R = 2.34 ± 0.02 Å) (Table
69
3.1). The addition of other atomic contributions for the first coordination sphere (e.g.
oxygen) did not significantly improve the fit quality. This result indicated that inner
sphere coordination between surface Zn atoms and sulfur atoms (either sulfide or thiol)
were dominant in the first coordination sphere for all ZnS samples, with or without
cysteine. In contrast, the EXAFS spectra for the Zn‐cysteine reference compound
indicated a mixture of bonds with coordination numbers of 1.6 ± 0.3 for Zn‐O bonds (R =
2.07 ± 0.02 Å) and CN of 2.0 ± 0.4 for Zn‐S bonds (R = 2.29 ± 0.02). These results are in
agreement with the dissolved Zn‐cysteine complexes observed by others [145].
For the atoms within the Zn second coordination sphere of the cys‐ZnS samples,
coordination numbers (CNZn‐Zn and CNZn‐S2) and interatomic distances varied with
respect to bulk ZnS and were sensitive to cysteine concentration. In the case without
cysteine, the second sphere CN values for Zn‐Zn (R = 3.85 ± 0.02 Å) and Zn‐S2 (R = 4.52 ±
0.02 Å) bonds were 3 to 4 times lower than the bulk sphalerite (Table 3.1). In the EXAFS
simulations for the n‐ZnS cluster samples (with and without cysteine), we defined CNZn‐
S2 to equal CNZn‐Zn, based on the sphalerite‐type structure suggested by XRD spectra
(Figure 3.5). For the cys‐ZnS sample spectra, we attempted to include second sphere Zn‐
C coordination, as shown in Table 3.1 for the Zn‐cysteine reference compound (CNZn‐C =
1.9 ± 0.4 with R = 3.05 ± 0.02 Å). However, the incorporation of Zn‐C did not improve the
fit quality. This result indicated that most of the S atoms in the first atomic shell were
sulfide‐S and not thiol‐S.

70
Figure 3.6. Experimental and fitted Zn K‐edge X‐ray absorption spectra. (a) k3‐
weighted EXAFS spectra; (b) magnitude of the Fourier transform, including fit to first
and second atomic shells. () experimental data, () fit.
The CNZn‐Zn values within the second atomic shell represent the average over all
Zn atoms in a polynuclear compound with short‐range coherent structure. This average
CNZn‐Zn can be used to determine the size of the ZnS cluster. Indeed, the overall decrease
in CNZn‐Zn values highlights the small size of the n‐ZnS cluster, in which a large fraction
of Zn atoms were ‘surface’ atoms. We theoretically recalculated the CNZn‐Zn for different
size of ZnS clusters (Figure 3.7). While the mean CNZn‐Zn for ‘infinite’ sphalerite particles
is 12, we estimated that a 1 nm‐sphalerite cluster is characterized by a CNZn‐Zn value
close to 5. This estimation assumes that the clusters are isotropic and relatively
monodisperse (as indicated by XRD spectra in Figure 3.5 and TEM images in Figure 3.3).

71
Using the CNZn‐Zn obtained by EXAFS (Table 3.1), we estimated the size of the n‐ZnS
clusters with and without cysteine (Figure 3.7). We found that a CNZn‐Zn of 3.5 ± 0.7
characterizing the n‐ZnS (Table 3.1) might be encountered for a ZnS cluster containing
between 5 and 8 Zn atoms with size ranging between 0.8 to 1.2 nm (Figure 3.7). These
EXAFS simulations do not take into account the multiple scattering paths of Zn‐S‐S
(11.5% of the amplitude of the Zn‐S1 path) and Zn‐Zn‐S (26.8% of the amplitude of the
Zn‐S1 path) that are in phase opposition with the simple scattering within the second
coordination sphere. Thus, the cluster size obtained in Figure 3.7 might be
underestimated, and the ranges in size shown in Figure 3.7 reflect this uncertainty.
Moreover, the coherent diameter calculated from XRD data (3.6 ± 0.4 nm) is larger than
the one estimated by EXAFS (1 ± 0.2 nm) in agreement with previous work suggesting
that XRD measurements in polydisperse systems are weighted towards the larger
particle sizes [146]. In addition, XRD is sensitive only to crystallized species, while the
EXAFS is sensitive to all the Zn species including those with short‐range order. The
discrepancy with the EXAFS results suggests that the 3‐4 nm sphalerite crystals detected
by XRD were in minority.

72
Table 3.1: Model fitting parameters coordination number (CN), interatomic distance
(R), mean squared displacement (ss2), and chi‐square residue (2) for Zn K‐edge EXAFS data shown in Figure 3.6. Spectra of samples (nano‐ZnS and cysteine‐capped
ZnS nanoclusters) were compared to spectra of sphalerite, wurtzite, zincite, and a
freeze‐dried Zn(cysteine)2 solution. Fit ranges: k = 3.9‐10.5 Å‐1; r =1.2‐4.5 Å. Errors:
∂(CN) ≈ 20%; ∂(R) ≈ 0.02 Å; ∂(ss2) = 0.001.
Atomic shells CN R ss2 2
Zincite Zn‐O1 4 1.97 0.007
(ZnO) Zn‐Zn 12 3.21 0.011
Zn‐O2 9 3.86 0.020 1872
Zn‐Zn 6 4.56 0.012
Zn‐O2 6 4.57 0.005
Sphalerite Zn‐S1 (a) 4 2.34 0.008
(cubic ZnS) Zn‐Zn 12 3.84 0.017 1133
Zn‐S2 (a) 12 4.52 0.020
Wurtzite Zn‐S1 (a) 4 2.34 0.007
(hexagonal ZnS) Zn‐Zn 12 3.84 0.017 437
Zn‐S2 (a) 10 4.51 0.020
n‐ZnS Zn‐S1 (a) 3.7 2.33 0.008
Zn‐Zn 3.5 3.85 0.015 107
Zn‐S2 (a) 3.5 4.52 0.021
Cys:ZnS (1:1) Zn‐S1 (a) 4.1 2.34 0.009
Zn‐Zn 1.2 3.82 0.017 357
Zn‐S2 (a) 1.8 4.51 0.020
Cys:ZnS (2:1) Zn‐S1 (a) 3.9 2.34 0.008
Zn‐Zn 3.5 3.84 0.017 356
Zn‐S2 (a) 3.5 4.54 0.020
Cys:Zn (2:1) Zn‐S 2.0 2.29 0.006 71
Zn‐O 1.6 2.07 0.012
Zn‐C 1.9 3.05 0.008 (a) The Zn‐X1 and Zn‐X2 shells correspond to atoms present in the first (short
distance) and second (long distance) coordination spheres, respectively.

73
Figure 3.7. Average second sphere Zn‐Zn coordination number (CN) calculated as a
function of the polynuclear zinc sulfide nanocluster size, based on interatomic
distances in the mononuclear ZnS4 tetrahedra. () denotes theoretical values, ( 10 20 30 40 50 60 70 80
2 (degrees )
Zn:c ys( 1:1)
Zn:cy s( 1:2)
Zn O
Zn S wur tzite
ZnS sphaler ite
c ys:ZnS (2:1)
n- ZnS)
denotes CN values from EXAFS data.
For the ZnS samples precipitating in the presence of cysteine, the EXAFS data
also indicated lower CN values for the second coordination sphere (Table 3.1) compared
to bulk sphalerite; however, the CN values depended on cysteine concentration. In the
sample that contained excess cysteine (2:1 cys:ZnS ratio), CN values for Zn‐Zn and Zn‐S2
were similar to the n‐ZnS formulated without cysteine. A CNZn‐Zn value of 3.5 ± 0.7
(Table 3.1) might correspond to clusters composed of 5 to 8 Zn atoms with a mean
diameter about 1 ± 0.2 nm (Figure 3.7). In that case, the size obtained by XRD (1.8 nm) is
74
closer to estimations by EXAFS, indicating the presence of small sphalerite crystals in
this sample.
In contrast, the sample with lower cysteine concentration relative to ZnS
exhibited a smaller CNZn‐Zn value (1.2 ± 0.24) and CNZn‐S2 value (1.8 ± 0.36), indicating
that the nanoclusters were composed of two ZnS4 tetrahedra that were approximately
0.8 nm in diameter (Figure 3.7). Clusters of this size would probably not be observable
by XRD (data was not obtained). Overall, the EXAFS results for the cys‐ZnS samples
were consistent with SAXS data (Figure 3.4), which indicated that nanocluster growth
kinetics was faster in the sample with excess cysteine (2:1 cys:ZnS).
3.4 Conclusions
Our experiments sought to understand how cysteine, a Zn‐binding ligand,
altered the precipitation and aggregation kinetics of ZnS particles. The early stages of
ZnS precipitation resulted in ZnS nanoclusters with structures similar to sphalerite (as
shown by XRD and EXAFS data in Figures 3.5 and 3.6). Cysteine altered the rates of
nanocluster growth and aggregation by binding to the surface of ZnS particles and
changing the composition at the particle‐water interface. Our SAXS and EXAFS data also
indicated that sorption of cysteine prevented aggregation and facilitated the growth (or
crystal ripening) of the zinc sulfide cluster subunits. These results suggested that the
cysteine sorption was enough to prevent cluster aggregation, presumably by

75
electrostatic repulsion [136]. However, surface coverage by sorbed cysteine molecules
was not enough to block ZnS growth sites on the cluster subunits. Furthermore,
aggregation that occurred at lower cysteine concentrations decreased the driving force
for monomer growth or blocked growth sites on the cluster subunits. Additional studies
that consider higher cysteine sorption density are needed to determine if cysteine is
capable of blocking cluster growth sites, as suggested by previous research with CdS
[135].
Our study demonstrated the value of using a combined approach (SAXS, XRD,
DLS, and EXAFS) for charactering the ZnS clusters during the initial stages of
precipitation and aggregation. Time‐resolved SAXS provided information on the size of
the cluster subunits without additional modification (i.e., drying) of the particle
suspensions. EXAFS, DLS, and XRD allowed for additional information concerning
aggregate and cluster size as well as Zn speciation. While TEM provided direct
visualization of the size and shape of particles, agglomeration is a possibility during
sample preparation. Thus, we used TEM as supporting information for size and
morphology. While SAXS methods enabled elucidation of cluster characteristics as they
were forming in aqueous suspension, a major drawback of this method was the need for
concentrations in the millimolar range. This concentration is relatively high for most
environments except for the most contaminated scenarios. Nevertheless, this work

76
provided clues to the manner in which natural organic ligands influence ZnS cluster as
they precipitate under supersaturated conditions.
Overall, our study points to conditions that would enable ZnS nanoparticles to
form in the environment and how natural organic acids are critical for enabling their
persistence at the nanoscale. In this case, our results show that surface sorption of an
organic ligand is required to prevent aggregation of ZnS nanoparticles that nucleate
from solution. Furthermore, the sorbed organic ligand allows for the nucleated
nanoclusters to increase in size without necessarily aggregating with other particles. We
used cysteine as a surrogate for the strong metal‐binding ligands (thiols) associated with
natural organic matter (NOM) that is ubiquitous in the aquatic environment. NOM,
however, consists of complex macromolecular structures that contribute to other surface
interactions (such steric hinderances) for aggregation and interfacial chemistry[71].
Further studies should consider the macromolecular properties of NOM and their
influence on ZnS nanocluster nucleation and aggregation kinetics.
77
Chapter 4. Cysteine-induced modifications of zero-valent silver nanomaterials: Implications for particle surface chemistry, aggregation, dissolution, and silver speciation
This chapter was submitted for review at the journal Environmental Science &
Technology.
4.1 Introduction
The wide use of silver nanoparticles (Ag NPs) in commercial products has
recently gained much attention due to the potential toxic effects resulting from their
unintended release into the environment [16, 147]. The reactivity and transport of Ag
NPs in the aquatic environment will depend on key transformation processes, which
include aggregation, dissolution, and surface modifications by metal‐complexing
ligands. These processes work in synergistic or antagonistic ways to influence the
lifetime of nanoparticles in the environment and the bioavailability of silver to exposed
organisms (Fig. 4.1). For example, adsorption or desorption of organic matter or metal‐
binding ligands will modify the surface of nanoparticles. Ionic compounds or long‐chain
moieties can induce surface charge or steric effects that influence particle coagulation
and settling kinetics [77, 97, 136]. Aggregation can lead to changes in reaction rates (such
as dissolution and sorption) by decreasing the surface area that is exposed to bulk
solution [82, 148, 149]. Dissolution of nanoparticles will in turn decrease the size of the
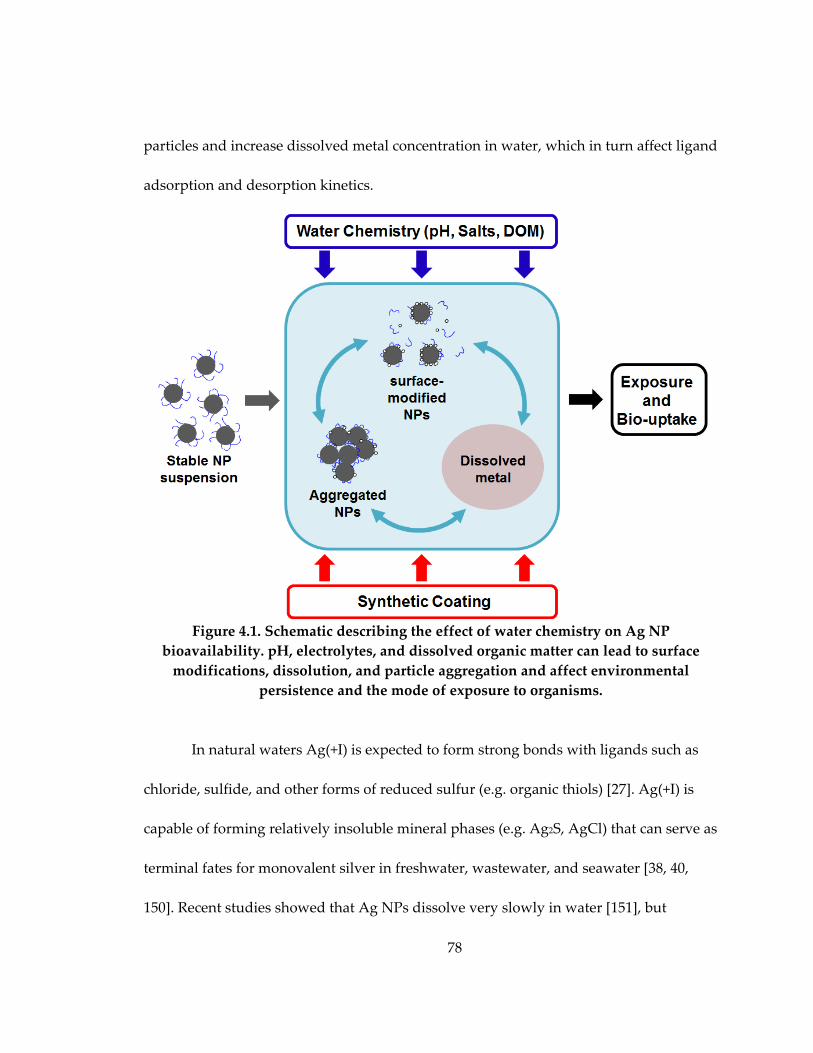
78
particles and increase dissolved metal concentration in water, which in turn affect ligand
adsorption and desorption kinetics.
Figure 4.1. Schematic describing the effect of water chemistry on Ag NP
bioavailability. pH, electrolytes, and dissolved organic matter can lead to surface
modifications, dissolution, and particle aggregation and affect environmental
persistence and the mode of exposure to organisms.
In natural waters Ag(+I) is expected to form strong bonds with ligands such as
chloride, sulfide, and other forms of reduced sulfur (e.g. organic thiols) [27]. Ag(+I) is
capable of forming relatively insoluble mineral phases (e.g. Ag2S, AgCl) that can serve as
terminal fates for monovalent silver in freshwater, wastewater, and seawater [38, 40,
150]. Recent studies showed that Ag NPs dissolve very slowly in water [151], but

79
oxidative dissolution is faster in sulfide‐ and chloride‐rich environments [53, 152‐154]. In
waters rich with organic matter, sulfhydryl‐containing organic compounds (thiols) may
compete with inorganic ligands and increase dissolved silver concentration [43]. Hence,
thiols have the potential to play a key role for the environmental fate of Ag NPs.
In natural waters thiols tend to be associated with low molecular weight organic
ligands and with humic substances. In sediments and water, thiols are typically present
in nanomolar to micromolar concentrations, depending on environmental conditions
such as redox potential, the presence of organisms that actively excrete thiol‐containing
compounds, and other metals that may catalyze the oxidation of thiols [62, 63, 155, 156].
In addition, thiol‐containing biomolecules are abundant in biological media such as
bacterial plasma, tissues, and blood [66, 67].
Hydrophilic thiols of low molecular weight (such as glutathione,
mercaptoacetate and cysteine) are known to decrease the aggregation and precipitation
rates of metal‐sulfide nanoparticles by adsorbing to their surface and changing the
particle surface charge [28, 29, 136]. Cysteine (CYS) has also been used in Ag NP toxicity
studies to chelate dissolved silver ions [57, 157, 158]. Some of these studies noted that
cysteine increased the dissolution of silver and slowed aggregation of Ag NPs; however,
these phenomena were not studied in detail [57, 157]. In order to predict and understand
Ag NP toxicity to organisms, we need to identify the physico‐chemical processes that
80
these particles undergo in the presence of ligands, and particularly thiol‐containing
ligands such as cysteine [58].
The goal of this study was to better define the effect of low molecular thiols such
as cysteine on Ag NP behavior and speciation in aquatic settings. Aqueous suspensions
of metallic Ag NPs were exposed to dissolved cysteine, and the dissolution, aggregation,
and surface modifications of the nanoparticles were monitored. We compared cysteine
reactivity to Ag NPs manufactured with two common types of synthetic coatings used
on Ag NPs: citrate and polyvinylpirrolidone (PVP). Cysteine was selected because of
this amino acid’s well‐defined structure (relative to humic macromolecules) and because
cysteine is widely used in Ag NPs toxicity experiments to assess the effects of dissolved
Ag+. In addition, we used X‐ray absorption near edge spectroscopy (XANES) to study
the speciation of silver in Ag NPs following exposure to cysteine.
4.2 Materials and Methods
4.2.1 Ag NP synthesis and characterization
Synthesis of zero‐valent silver nanoparticles with citrate and PVP (55 kDa
molecular weight) coatings (hereafter referred to as Ag‐CIT and Ag‐PVP, respectively)
followed previously published methods [159, 160]. Particle monomer size and shape
were characterized with transmission electron microscopy (TEM) (Appendix B, Figure
B1). Number‐based size distributions of the two nanomaterials were estimated from the

81
TEM images by counting the number of particles, sorting them into 5‐nm or 2‐nm size
intervals, and plotting the counts in histograms (Appendix B, Figure B1). All samples
containing the Ag‐CIT nanoparticles were prepared in plastic containers and cuvettes,
while Ag‐PVP samples were prepared in glass containers (due to loss of PVP‐coated
nanoparticles on the walls of plastic containers).
Ag‐CIT primarily consisted of spherical particles with some oval‐shaped
particles. The average geometric diameter was 19.1 ± 12.7 nm (n = 188). Ag‐PVP
consisted of spherical particles with average geometric diameter of 7.6 ± 2.0 nm (n = 106).
The specific surface areas (SSA) of the Ag NPs was estimated by summing the surface
areas of all particles in each increment in the size distribution (assuming spherical
geometry) and dividing the total surface area by the total mass of particles:
ii
i
iii
nd
ndSSA
6
3
2
(4.1)
In Eq. 4.1, is the bin number in the size distribution histogram (Appendix B,
Figure B1), is the average diameter in bin , is the total number of particles in bin ,
and the density of silver (10.50 g/ml [161]). We calculated SSA to be 16.1 m2/g for Ag‐
CIT and 66.1 m2/g for Ag‐PVP.

82
4.2.2 Exposure of Ag NP to cysteine
Stock solutions of approximately 8 mM cysteine were prepared in degassed
water, stored at 4C, and utilized within two weeks of preparation. All nanoparticle
dissolution and aggregation experiments were performed with a buffer solution
consisting of 7 mM sodium bicarbonate (Fisher Scientific, Pittsburgh, PA) adjusted to pH
7.5, 10 to 500 mM NaNO3, and 400 μM cysteine. Experiments were initiated by diluting
an aliquot of silver nanoparticle stock suspension in the buffer solution. A selection of
control solutions included Ag NPs suspended in the bicarbonate buffer without cysteine
or with 400 μM serine instead of cysteine. Serine and cysteine are structurally analogous
in that serine has a hydroxyl group where cysteine has a thiol group. Particle
concentrations in all treatments corresponded to 7.6 to 8 μΜ total silver.
4.2.3 Quantification of dissolved silver and cysteine
Each mixture of Ag NPs was produced in 6 to 14 replicates. Dissolved silver and
cysteine concentrations were measured 20 minutes to 48 hours after preparation. For
each time point, two replicates were ‘sacrificed’ for filtration with 0.025 μm membrane
filters (VSWP Millipore) fitted on a glass vacuum filtration apparatus. Before filtering
the suspensions, the membranes were primed with 10 ml of a solution containing 7.5
mM NaHCO3 at pH 7.5. This solution was passed through the filter and then discarded
prior to filtering sample suspensions. Dissolved silver was nominally defined as the
silver concentration in the filtrate, which was quantified with inductively coupled

83
plasma mass spectroscopy (Agilent Technologies, Santa Clara, CA) after acidifying the
filtered samples with 2% HNO3 and 1% HCl.
The concentration of cysteine in aliquots of the filtered samples was quantified
using a previously described method [108, 113] that employed derivatization of CYS,
separation with reverse phase high performance liquid chromatography, and detection
by UV absorbance.
Control experiments were performed to confirm that dissolved Ag‐ CYS
complexes, Ag+, and free CYS were able to pass through the filters. In these experiments,
we prepared three control solutions: 1) 9.3 M AgNO3 + 400 M CYS (pH 7.5, 10 mM
NaNO3); 2) 1.9 M AgNO3 (pH 8.3); and 3) 100 μM CYS alone (pH 7.3, 10 mM NaNO3).
These mixtures were filtered through the 0.025 μm membrane filters. The recovery of
silver in filtrates of the AgNO3 and AgNO3+ CYS mixtures were 94.1% and 92.1%,
respectively. The percentage of total CYS quantified in the filtrate was 92% in the CYS‐
only mixture and 90% in the AgNO3+CYS mixture.
The removal efficiency of nanoparticles by the filtration system was tested by
quantifying the retention of silver after filtration of Ag NP stock solutions. Less than
0.3% (±0.05) and 11% (±0.5) of the total silver were recovered after filtration from Ag‐CIT
and Ag‐PVP stock suspensions, respectively, indicating that these filters were capturing
most of the nanoparticles in suspension. Although the monomer diameters for a portion
of the Ag NPs were smaller than the nominal filter pore size, our measurements of

84
hydrodynamic diameters suggested that the particles were somewhat aggregated in
their stock suspensions. Moreover the retention of nanoparticles on the filters could have
occurred via hydrophobic or electrostatic interactions between particles and the
membrane filter.
4.2.4 Aggregation of NPs in the presence of cysteine
We performed measurements of hydrodynamic diameter to determine if cysteine
altered the aggregation rate of Ag NPs. The light intensity‐weighted average
hydrodynamic diameters in the Ag NP‐cysteine mixtures were determined by dynamic
light scattering (DLS) (Malvern Zetasizer) using incident light (λ = 633 nm) scattered at
173°. Zeta potential was calculated from the electrophoretic mobility of the silver
nanoparticles measured in triplicate at 25°C (Malvern Zetasizer). The average
hydrodynamic diameter ah was monitored over time until it reached twice the initial
diameter. In cases where aggregation was too slow, ah was monitored up to 48 hours.
Growth rates, attachment efficiencies, and critical coagulation concentrations (ccc) were
calculated using previously described methodologies [98, 162, 163]. In summary, early
stage aggregation rates were approximated by the slope of the linear least squares
regression of data plotted as ah versus time;
o
t
h Nkdt
tda
11
0 (4.2)

85
where k11 is the aggregation rate constant and No is the initial particle number
concentration. Aggregation experiments were replicated 2‐9 times, as determined by a
relative standard deviation less than 25% for replicate measurements of
0
t
h
dt
tda.
The attachment efficiency was calculated from the aggregation rate constant
normalized by the aggregation rate constant in the diffusion limited regime (k11)fast:
fastt
h
fasto
t
h
o
fast
dt
tda
N
dt
tda
N
k
k
,0
0
11
11
1
1
(4.3)
4.2.5 Silver speciation of Ag NPs
The speciation of silver particles that collected on the membrane filters was
assessed using silver L3‐edge X‐ray absorption near edge spectroscopy (XANES). The
Ag L3‐edge XANES can be used to study the oxidation state of silver due to a prominent
peak exhibited by the spectra at the adsorption edge [164]. For each Ag NP‐CYS mixture,
approximately 100 ml of sample was passed through the 0.025 μm filters. The filter
membrane was stored at ‐20 ˚C for one hour, freeze dried, and stored in a desiccator
before analysis.
Reference materials for XANES data analysis included PVP‐ and citrate‐coated
Ag NPs collected on the membrane filters directly from their stock suspensions.
Reference materials for monovalent forms of silver included Ag(+I)‐cysteine powders
formulated with 1:1 and 1:2 silver:cysteine molar ratios (Ag(CYS) and Ag(CYS)2), Ag‐

86
citrate, and commercially purchased powders of AgNO3(s), AgCl, Ag2O, and Ag2S. The
SI section contains details regarding the preparation of these reference samples.
XANES spectra for the samples were collected at room temperature in
fluorescence mode at the Stanford Synchrotron Radiation Lightsource (SSRL) beam‐line
4‐3. Background subtraction and normalization of spectra were performed using the
Athena software package following previous procedures [138]. Linear combination
fitting (LCF) for the Ag NP+cysteine samples was performed by fitting a binary mixture
of reference spectra in the range 20 eV below and above the adsorption edge (3351 eV).
We report the relative proportions and the error was determined by the software’s least
squares fitting module. Best fits were considered the ones with the lowest R‐factor, χ2,
and Δχ2, which are fitting residual parameters described further in Appendix B.
4.3 Results and discussion
4.3.1 Dissolution of Ag NPs exposed to cysteine
In our batch experiments, the presence of cysteine not only increased the amount
of dissolved silver released from Ag‐CIT and Ag‐PVP nanoparticles, but the cysteine
also appeared to modify the surface composition and aggregation rates. In the absence
of CYS, the nominally dissolved silver concentration in the diluted Ag‐CIT and Ag‐PVP
suspensions was less than 10% of the total silver. However, in the presence of 400 M
CYS (in Ag NP mixtures containing 7.6 to 8 μM total Ag), dissolved silver increased

87
within the first 12 hours and appeared to reach a maximum concentration in 24‐48 h
(Figure 4.2). At the 48 h time point, the dissolved silver concentration was 36.4 ± 2.2 % of
total silver for Ag‐CIT and 47 ± 5.6 % for Ag‐PVP. When Ag NPs were exposed to serine
instead of cysteine, the dissolved silver was similar to the control without any amino
acids (Figure 4.2), suggesting that Ag‐thiolate interactions were important for Ag
dissolution.
0
2
4
6
8
0 20 40 60
Dissolved
silver (μM)
Time (h)
Total silver
400μM Cysteine
400 μM Serine
No amino acid
(a)
0
2
4
6
8
0 20 40 60
Dissolved
silver (μM)
Time (h)
Total silver400μM Cysteine400 μM SerineNo amino acid
(b)
Figure 4.2. Concentration of nominally dissolved silver (0.025 μm filter) in mixtures of
(a) Ag‐CIT and (b) Ag‐PVP nanoparticles suspended in solutions containing 7 mM
NaHCO3, 10 mM NaNO3, and either 400 μM cysteine, 400 μM serine, or no amino
acid. The solution pH was 7.5 to 8.1. The total silver concentrations measured in
unfiltered samples are indicated by dashed lines.
Our results contrast a previous study [165] in which Liu et al. reported that thiols,
including CYS, inhibited dissolution of Ag NPs. These contradictory results likely stem
from differences in experimental methodology. For example, our control experiments
indicated that our method of filtration separate dissolved silver from particulate, while

88
the centrifugal ultrafilters (utilized by Liu et al.) have been reported to retain significant
amounts of dissolved silver [59]. In addition, cysteine is capable of forming
polymers/particles with Ag(+I) [166], particularly at low ratios of cysteine:silver (e.g. 5 or
less) (Appendix B, Figure B2). We did not observe the formation of particulate silver for
cysteine: silver molar ratio of 50. Therefore, in this study we formulated our Ag NP‐
cysteine mixtures with this ratio to prevent the formation of Ag‐CYS particles.
From the dissolved silver data in Figure 4.2, we calculated an observed initial
dissolution rate by taking data points from the first 12 h and estimating the slope using
linear regression. The error for these rates was estimated as one standard deviation of
the slope. In the presence of cysteine and 10 mM NaNO3, the initial dissolution rate of
Ag‐PVP was 0.15 ± 0.01 μΜ/h, which was greater than the corresponding dissolution
rate for Ag‐CIT (0.10 ± 0.01 μΜ/h) (Table 4.1).
Surface area and particle size can be limiting factors for dissolution of sample
constituents [103, 167]. From the specific surface areas of the Ag NPs, we calculated that
the surface area‐normalized dissolution rate of Ag was 282 ± 25 μmol m‐2 h‐1 for the Ag‐
PVP and 748 ± 96 μmol m‐2 h‐1 for the Ag‐CIT (both with 10 mM NaNO3) (Table 4.1). The
Ag‐PVP dissolution experiment was repeated with 2.0 μΜ Ag‐PVP, which corresponded
to the same total surface area (13.9×10‐3 m2 L‐1) as the samples with 8 μΜ Ag‐CIT (Table
4.1 and Appendix B, Figure B3). The dissolution rate for Ag‐PVP (264 ± 16.9 μmol m‐2 h‐1)
was still less than for Ag‐CIT.

89
Although the surface area‐normalized initial dissolution rate was slower in the
case of Ag‐PVP, the relative proportion of silver that was released into solution after 48
h was greater in the Ag‐PVP mixtures than the Ag‐CIT mixtures (47 ± 5.6 % and 36 ± 2.2
%, respectively). One possible explanation for this difference is that the relative
‘accessibility’ of particle surfaces for cysteine molecules was lower for Ag‐PVP particles
than for Ag‐CIT, resulting in slower dissolution rates for the Ag‐PVP particles. While
we have no direct evidence to demonstrate this phenomenon, we observed a similar
indication that reactions at the surface of PVP‐coated nanoparticles were relatively slow
in aggregation experiments (Appendix B, Figure B4). Here, the aggregation of PVP‐
coated Ag NPs exhibited an initial lag period ranging from 10 to 50 minutes, during
which the hydrodynamic diameters of the particles were constant. After this lag period,
the diameters increased linearly with time. No lag period was observed with the citrate‐
coated nanoparticles.
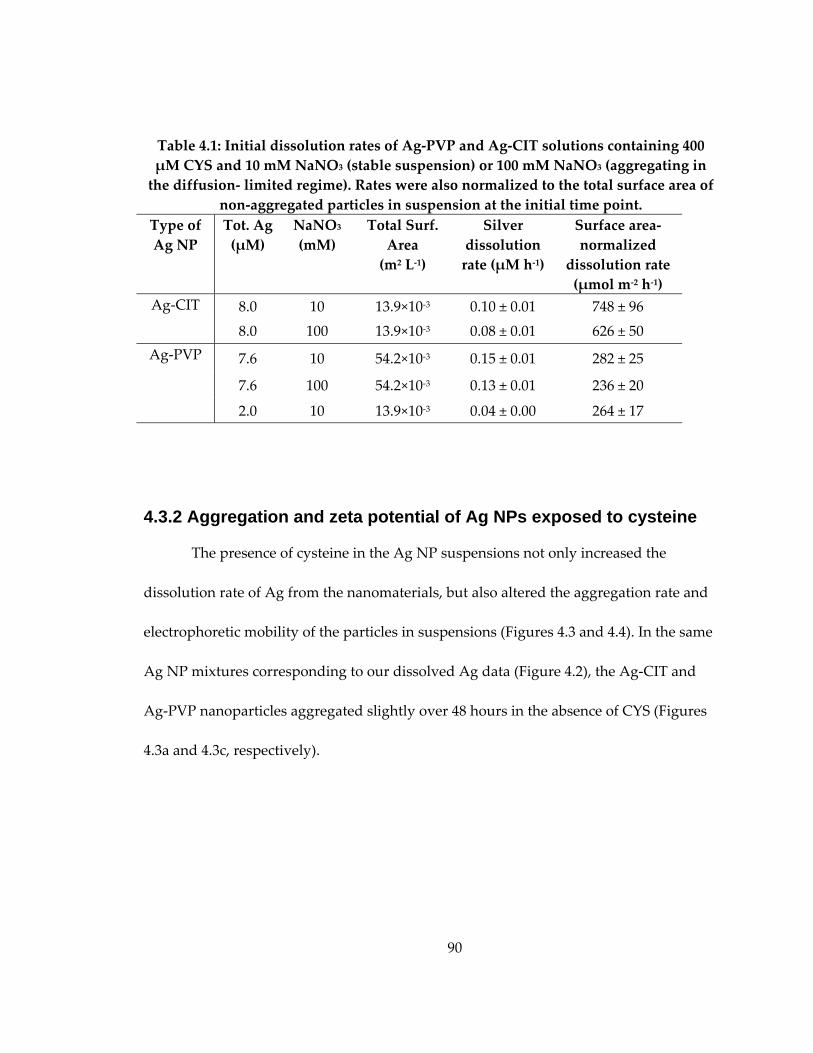
90
Table 4.1: Initial dissolution rates of Ag‐PVP and Ag‐CIT solutions containing 400
μΜ CYS and 10 mM NaNO3 (stable suspension) or 100 mM NaNO3 (aggregating in
the diffusion‐ limited regime). Rates were also normalized to the total surface area of
non‐aggregated particles in suspension at the initial time point.
Type of
Ag NP
Tot. Ag
(μΜ)
NaNO3
(mM)
Total Surf.
Area
(m2 L‐1)
Silver
dissolution
rate (μΜ h‐1)
Surface area‐
normalized
dissolution rate
(μmol m‐2 h‐1)
Ag‐CIT 8.0 10 13.9×10‐3 0.10 ± 0.01 748 ± 96
8.0 100 13.9×10‐3 0.08 ± 0.01 626 ± 50
Ag‐PVP 7.6 10 54.2×10‐3 0.15 ± 0.01 282 ± 25
7.6 100 54.2×10‐3 0.13 ± 0.01 236 ± 20
2.0 10 13.9×10‐3 0.04 ± 0.00 264 ± 17
4.3.2 Aggregation and zeta potential of Ag NPs exposed to cysteine
The presence of cysteine in the Ag NP suspensions not only increased the
dissolution rate of Ag from the nanomaterials, but also altered the aggregation rate and
electrophoretic mobility of the particles in suspensions (Figures 4.3 and 4.4). In the same
Ag NP mixtures corresponding to our dissolved Ag data (Figure 4.2), the Ag‐CIT and
Ag‐PVP nanoparticles aggregated slightly over 48 hours in the absence of CYS (Figures
4.3a and 4.3c, respectively).
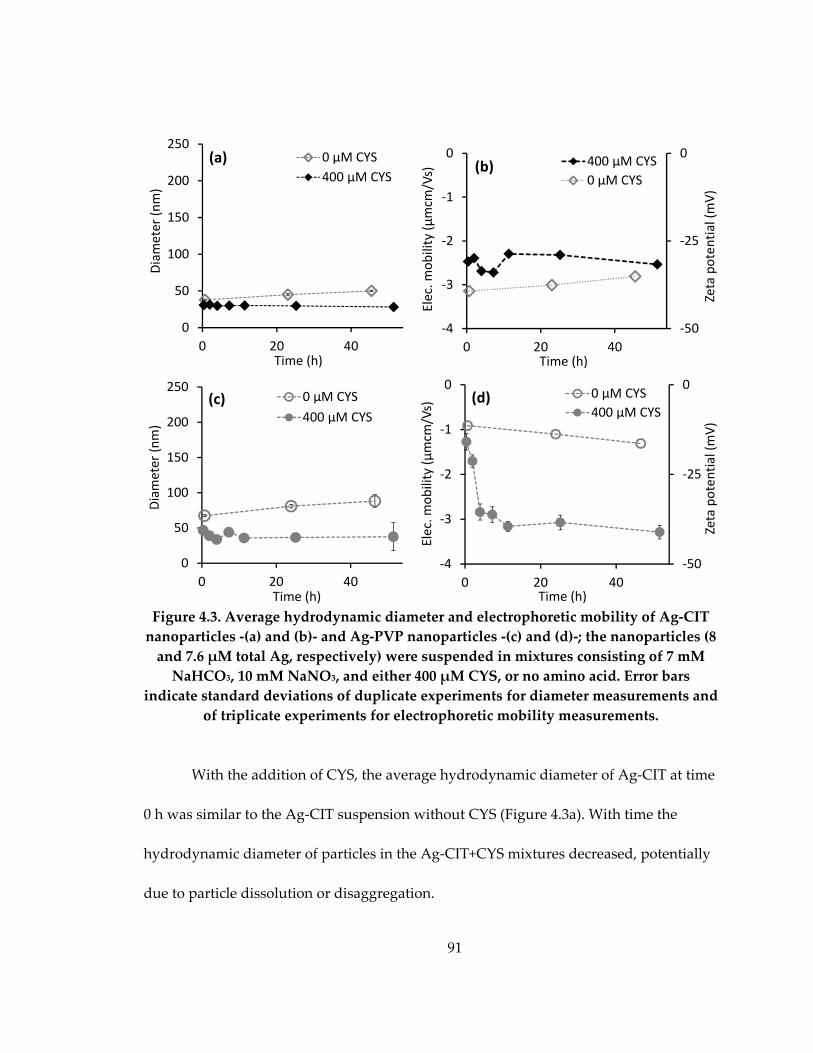
91
‐50
‐25
0
‐4
‐3
‐2
‐1
0
0 20 40
Zeta potential (mV)
Elec. m
obility (μmcm
/Vs)
Time (h)
400 μM CYS
0 μM CYS(b)
0
50
100
150
200
250
0 20 40
Diameter (nm)
Time (h)
0 μM CYS
400 μM CYS
(a)
‐50
‐25
0
‐4
‐3
‐2
‐1
0
0 20 40
Zeta potential (mV)
Elec. m
obility (μmcm
/Vs)
Time (h)
0 μM CYS
400 μM CYS(d)
0
50
100
150
200
250
0 20 40
Diameter (nm)
Time (h)
0 μM CYS
400 μM CYS(c)
Figure 4.3. Average hydrodynamic diameter and electrophoretic mobility of Ag‐CIT
nanoparticles ‐(a) and (b)‐ and Ag‐PVP nanoparticles ‐(c) and (d)‐; the nanoparticles (8
and 7.6 μM total Ag, respectively) were suspended in mixtures consisting of 7 mM
NaHCO3, 10 mM NaNO3, and either 400 μΜ CYS, or no amino acid. Error bars
indicate standard deviations of duplicate experiments for diameter measurements and
of triplicate experiments for electrophoretic mobility measurements.
With the addition of CYS, the average hydrodynamic diameter of Ag‐CIT at time
0 h was similar to the Ag‐CIT suspension without CYS (Figure 4.3a). With time the
hydrodynamic diameter of particles in the Ag‐CIT+CYS mixtures decreased, potentially
due to particle dissolution or disaggregation.

92
In the Ag‐PVP mixtures, the average hydrodynamic diameters at the initial time
point decreased from 67.4 nm in the absence of CYS to 46.6 nm in the presence of CYS.
The decrease in Ag‐PVP diameter due to CYS exposure was potentially caused by
dissagregation of aggregates in the nanoparticle stock or perhaps by the replacement of
PVP (a long chain polymer with an average molecular weight of 55,000 Da) with CYS (a
small amino acid with molecular weight 121 Da) on the surface of the nanoparticles. For
the nanoparticles stabilized with citrate (a low molecular weight coating relative to
PVP), the influence of CYS on hydrodynamic diameter at the initial time point was not
as drastic.
The zeta potential of Ag‐CIT particles increased from ‐37.6 mV to ‐29.0 mV (at 24
h) In the presence of 400 M CYS (Figure 4.3b). The net increase in zeta potential could
be due to the exchange of the trivalent citrate anion for the monovalent cysteine anion
(at pH 7.5) on the surface of the Ag‐CIT nanoparticles. In contrast, the zeta potential of
Ag‐PVP particles decreased in the presence of CYS. The zeta potential was ‐13.8 mV
after 24h in solution without CYS; in the sample with CYS, the zeta potential at 24 h was
‐38.4 mV (Figure 4.3d). This observation is probably due to the lack of surface charge on
original Ag‐PVP particles and that the PVP coating mainly provides steric (rather than
electrostatic) stabilization for the nanoparticles. For both types of Ag NPs, the zeta
potential data indicated that CYS was modifying the surface of the nanoparticles,

93
potentially by sorbing to the surface and by replacing the initial citrate and PVP
coatings.
At a relatively low ionic strength (10 mM NaNO3), the presence of cysteine had a
small effect on aggregation, or perhaps slowed aggregation of the particles in
suspension (Figure 4.3). However, at higher NaNO3 concentrations (up to 1000 mM),
aggregation rates increased for both Ag‐PVP and Ag‐CIT suspensions (Figure 4.4). For
example, the Ag‐CIT suspensions aggregated faster at ionic strength values between 15
mM and 1,008 mM. The critical coagulation concentrations (ccc) for the Ag‐CIT
suspensions decreased from 53 ± 5.3 mM in the absence of CYS to 35 ± 2.2 mM in the
presence of 400 M CYS (Figure 4.4a). The decrease in ccc was consistent with
electrophoretic mobility measurements showing that CYS induced a net shift towards
neutral surface charge for the particles (Figure 4.3b).
The Ag‐PVP suspensions (without CYS) did not aggregate appreciably within 48
h in solutions containing a large range of ionic strength values (from 10 mM to 1000 mM
NaNO3). The presence of CYS in the Ag‐PVP suspensions caused the particles to
aggregate. Based on the attachment efficiencies calculated from the aggregation
experiments, we estimated a ccc value of 33 ± 5.3 mM for Ag‐PVP particles in the
presence of CYS (Figure 4.4b). The observations that CYS induced aggregation (rather
than inhibited aggregation) was inconsistent with observed changes in zeta potential
(Figure 4.3d). Rather, CYS likely replaced the PVP coating, resulting in loss of steric
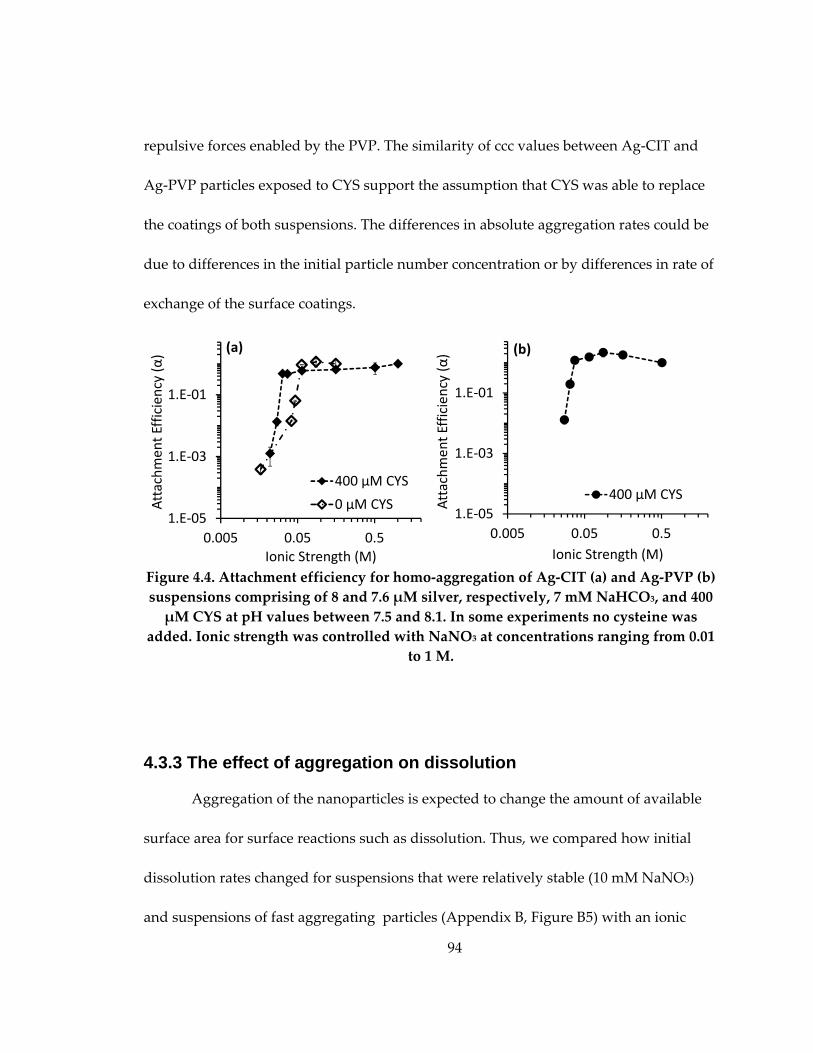
94
repulsive forces enabled by the PVP. The similarity of ccc values between Ag‐CIT and
Ag‐PVP particles exposed to CYS support the assumption that CYS was able to replace
the coatings of both suspensions. The differences in absolute aggregation rates could be
due to differences in the initial particle number concentration or by differences in rate of
exchange of the surface coatings.
1.E‐05
1.E‐03
1.E‐01
0.005 0.05 0.5
Attachment Efficien
cy (α)
Ionic Strength (M)
400 μΜ CYS
0 μΜ CYS
(a)
1.E‐05
1.E‐03
1.E‐01
0.005 0.05 0.5
Attachment Efficiency (α)
Ionic Strength (M)
400 μΜ CYS
(b)
Figure 4.4. Attachment efficiency for homo‐aggregation of Ag‐CIT (a) and Ag‐PVP (b)
suspensions comprising of 8 and 7.6 μΜ silver, respectively, 7 mM NaHCO3, and 400
μM CYS at pH values between 7.5 and 8.1. In some experiments no cysteine was
added. Ionic strength was controlled with NaNO3 at concentrations ranging from 0.01
to 1 M.
4.3.3 The effect of aggregation on dissolution
Aggregation of the nanoparticles is expected to change the amount of available
surface area for surface reactions such as dissolution. Thus, we compared how initial
dissolution rates changed for suspensions that were relatively stable (10 mM NaNO3)
and suspensions of fast aggregating particles (Appendix B, Figure B5) with an ionic

95
strength value (100 mM) greater than the ccc for both nanoparticles. For both Ag‐CIT
and Ag‐PVP, the initial dissolution rates of the fast aggregating samples were lower
than in stable suspensions (Table 4.1). TEM images of the fast‐aggregating samples
(collected for Ag‐PVP suspensions at the 2 and 24 h time‐points, Appendix B, Figure B6)
provided evidence for dendritic aggregate structures, which could result in decrease of
exposed surface area for dissolution [149].
4.3.4 Speciation of particulate silver
XANES analysis was used to determine the oxidation state and speciation of
particulate silver in samples containing Ag NPs and cysteine (Figure 4.5 and Appendix
B, Figure B7). Three component linear combination fitting (LCF) of the spectra was
performed assuming a binary mixture of the original nanomaterial (Ag‐CIT or Ag‐PVP)
and one of the Ag(+I) reference compounds (Table 4.2 and Appendix B, Tables B1
through B4). LCF attempts using four components did not improve these fits; thus, we
do not show these results. The XANES analysis indicated that up to 10% of silver in the
particles was oxidized to Ag(+I) and coordinated to reduced sulfur, as compared to the
original oxidation state of each respective particle suspension. Fitting with several silver‐
sulfur references such as Ag2S, Ag(CYS), and Ag(CYS)2 yielded very similar values of R‐
factor, χ2, and Δχ2, indicating that the nature of the bond between silver and sulfur could
be similar to one or a combination of these references. We selected fits with Ag(CYS)2 as
96
the representative silver‐sulfur model compound for further comparisons between the
Ag NP preparations (Table 4.2 and Figure 4.5).
Ag‐PVP particles that were exposed to CYS exhibited a higher percentage of
oxidized silver (7.2% and 7.9% at 2h and 24 h) than Ag‐CIT (3.7% and 6.8%, respectively)
(Table 4.2). This observation could be explained by our results that the Ag‐PVP particles
were smaller than Ag‐CIT and would comprise a greater proportion of silver atoms at
the particle surface [167]. We note that relative differences of a few percentages in
XANES modeling must be interpreted carefully. The relatively smaller errors reported
from the fitting software (shown in Table 4.2) do suggest a difference in the amount of
oxidized silver for the Ag‐CIT and Ag‐PVP samples. However, in previous XANES
studies that used LCF for known sample mixtures [168], the results of mixing ratios
showed that the error from LCF calculations can be up to ±5%.
Overall, our interpretation of the XANES data suggested that a portion of the
silver atoms (presumably on the surface of the Ag NPs) were in the monovalent
oxidation state and were coordinated to reduced sulfur (either cysteine or sulfide).

97
3330 3350 3370 3390Absorption (a.u.)
Energy (eV)
(b) Ag(CYS)2
Ag‐PVP
2 h (91.5% Ag‐PVP, 8.6% Ag(CYS)2)
24 h (91.0% Ag‐PVP, 8.8% Ag(CYS)2)
3330 3350 3370 3390
Absorption (a.u.)
Energy (eV)
(a) Ag(CYS)2
Ag‐CIT
2 h (97.2% Ag‐CIT, 3.7% Ag(CYS)2)
24 h (94.6% Ag‐CIT, 6.8% Ag(CYS)2)
Figure 4.5. Silver L3‐edge XANES spectra of the original Ag NPs, Ag(+I)‐cysteine
complexes Ag(CYS)2, and silver nanoparticles that were exposed to cysteine for 2 or
24 h: (a) Ag‐CIT; (b) Ag‐PVP. The nanoparticles (8.0 or 7.6 μM total silver in Ag‐CIT
and Ag‐PVP samples, respectively) were exposed to 400 μM CYS in mixtures
containing 7 mM NaHCO3, 10 mM NaNO3, and pH 7.5 to 8.1. After this exposure
period, the particles were collected on filter membranes for XANES analysis. The data
points correspond to linear combination fits for spectra of the original Ag NPs and
Ag(CYS)2 reference material.
4.3.5 Cysteine adsorption
Cysteine was also quantified in the filtered Ag NP+CYS mixtures and showed
that dissolved cysteine decreased within 48 h in both nanoparticle samples (Appendix B,
Figure B8a). A larger decrease of dissolved cysteine was observed in the Ag‐PVP
suspensions than in the Ag‐CIT suspensions. This difference was potentially due to the
larger specific surface area of the Ag‐PVP particles relative to Ag‐CIT particles. To test

98
this hypothesis, we calculated the change in dissolved cysteine concentration (relative to
the initial concentration) and normalized these values to the total initial surface area of
Ag NPs (Appendix B, Figure B8b). For both types of nanomaterials, the change in
dissolved cysteine concentrations were approximately 1 to 2 mmol per m2 of NP after 48
h of mixing. Based on the errors (propagated from the CYS measurements), there were
no apparent differences between Ag NPs (Appendix B, Figure B8b).
Although the loss of dissolved cysteine could be interpreted as adsorption to on
the Ag NPs, the amount of cysteine lost (31 and 96 M) was greater than the total Ag
silver concentration in suspensions (~8M). Thus, sorption would not fully explain the
loss of dissolved cysteine. Control experiments with cysteine in the buffer solution
without Ag NPs were performed to determine if cysteine would oxidize under the
experimental conditions. In this experiment, we quantified a loss of approximately 25
M dissolved cysteine in a 48 h period (Appendix B, Figure B8a). This amount of
cysteine oxidation is close to the decrease of dissolved cysteine in the Ag‐CIT mixture
(31 M), but did not fully account for the loss of dissolved cysteine (96 M) in the Ag‐
PVP mixture. Other reactions at the surface of the PVP‐coated Ag NPs, such as the
production of reactive oxygen species (e.g. superoxide, hydrogen peroxide, hydroxyl
radicals) as the silver nanoparticles oxidize and dissolve, may subsequently react with
and oxidize cysteine. While dissolved O2 appears to be a necessary electron acceptor for
oxidative dissolution of silver nanoparticles [153], we have no knowledge of direct
99
evidence for the production of reactive oxygen species during this process, and further
study is needed to understand the reaction products of oxidative dissolution of Ag NPs.
4.4 Conclusions
This study highlights the multiple transformations that can occur when silver
nanoparticles are exposed to Ag‐binding ligands that can modify the surface
composition of the particles and their aggregation and dissolution rates. In our
experiments, cysteine increased the solubility of the particles; however, the dissolution
rate depended on the aggregation state of the particles and surface modifications caused
by sorption of cysteine. All of these processes (surface modifications, aggregation, and
dissolution) work in concert to influence the overall persistence and composition of the
silver nanomaterials in aqueous suspension. Furthermore, these simultaneous
transformations could alter the bioavailability of the nanomaterials to exposed
organisms. For example, the presence of Ag+‐binding ligands are expected to increase
the amount of dissolved Ag that can be internalized by aquatic organisms; however, the
rate of dissolution would depend on the aggregation state of the particles and surface
modifications by the ligand. Furthermore, previous studies have shown that cysteine
and other low molecular weight thiols can reduce silver toxicity to organisms exposed to
silver nanomaterials [57]. While complexation of dissolved Ag+ by cysteine is the likely
mode of action (due to the relatively strong affinity between Ag+ and cysteine), our

100
results indicated that cysteine can also induce aggregation of the nanomaterials, leading
to a secondary mechanism by which the presence of cysteine could decrease Ag NP
toxicity.
The transformations discussed in our study appeared to take place on the
surface of the particles, which was originally coated with PVP or citrate. Nanomaterials
are typically manufactured with organic coatings that serve to stabilize the suspension
during production. In this work we demonstrated that the dissolution rates of PVP‐
coated particles (when normalized to the specific surface area) were slower than citrate‐
coated particles. One possible explanation for this phenomenon is that diffusion of
cysteine molecules at the particle‐water interface of PVP‐coated nanoparticles is slower
than diffusion at the interfacial region of citrate‐coated nanoparticles. Another possible
explanation is that citrate is capable of binding Ag+, resulting in competition between
citrate and cysteine for ligand sorption sites on the nanoparticle surface. Overall our
results demonstrate the importance of the coatings for the reactivity of Ag NPs.
Cysteine was used in this study as an example of metal‐binding organic ligands
that are ubiquitous in the aquatic environment. The fact that serine did not cause similar
effects indicated the importance of strong Ag+‐binding ligands (i.e., thiols) for
interactions with Ag NPs. Cysteine can be found in nanomolar concentrations in natural
waters [62] (e.g. sediment porewater, surface waters and wastewater) and is also a
component of complex organic structures, such as proteins and natural organic matter

101
(NOM). In these waters, the concentration of all thiol‐containing ligands would be
higher than the expected concentrations for Ag NPs. Such observations have been made
in previous studies investigating wastewater containing silver contamination derived
from the photographic industry [41].
Our study indicated that Ag NPs was altered by cysteine, but further research is
needed to demonstrate whether cysteine will have the same effects on Ag NPs when it is
part of a more complex structure such as proteins or NOM. Steric effects are expected to
occur with macromolecular structures and may alter the rates of reactions between
thiolate functional groups and the surface of Ag. Recent studies have indicated that
molecular weight and aromaticity of NOM are more important properties than reduced
sulfur content in determining the dissolution of HgS cinnabar particles and the
precipitation and aggregation of ZnS nanoparticles [9, 71]. Future studies could consider
the macromolecular structure of more complex ‘ligands’ such as humic substances,
particularly as they influence coupled transformations of the Ag NPs (aggregation,
dissolution, surface reactivity) and bioavailability to exposed organisms.

102
Chapter 5. Conclusions
5.1 Summary
This research studied the complexation between a low molecular weight metal
binding ligand and metal‐based nanoparticles, focusing on the impact of this interaction
for the fate of the particles. The overall goals were to study (1) the growth and
aggregation of naturally‐occurring metal sulfides and (2) the fate and speciation of
metal‐based engineered nanoparticles, in thiol rich aquatic systems. Zinc sulfide was
used as an example for the first goal and metallic silver for the second. Cysteine was
used as a surrogate of low molecular weight thiol ligands.
In Chapters 2 and 3 the effect of cysteine on the growth and aggregation of zinc
sulfide were studied using DLS, SAXS, XRD, EXAFS, and chemical analysis. The molar
ratio of cysteine to zinc and sulfur determined the kinetics of growth and aggregation in
supersaturated solutions. In addition, the mode of stabilization incurred by cysteine was
determined: cysteine adsorbed on the surface of zinc sulfide nanoparticles; at pH values
higher than 7, deprotonation of cysteine induced electrostatic charge on the surface, thus
stabilizing the particle suspension. The fact that serine, a hydroxyl analogue to cysteine
did not induce similar effects suggested that thiols have the potential to enhance the
persistence of metal sulfides in aquatic systems. These results shed light into the
processes that cause nanoparticulate metal sulfides to form and persist in anaerobic
waters.

103
In Chapter 4, the effect of cysteine on the surface chemistry, aggregation, and
dissolution of zero valent silver nanoparticles was studied. Cysteine modified the
surface chemistry of the silver particles and induced aggregation and dissolution. The
extent of surface modifications depended on the coating of the particles. The dissolution
rate of particles coated with a polymer, PVP was approximately three times slower than
the particles coated with an anion and silver ligand, citrate. These results demonstrate
the need to consider multiple and interlinked transformation processes when assessing
the bioavailability, environmental risks, and safety of nanoparticles, particularly in the
presence of metal‐binding ligands.
Overall, the results of this study demonstrated how low molecular weight thiol
ligands may control the fate of naturally‐occurring and manufactured metal‐based
nanomaterials. Cysteine sorbed through the thiol group on both zinc sulfide and
metallic silver particles, inducing changes on their surface properties. While cysteine
stabilized the zinc sulfide, it destabilized the silver particles. The main difference that
affected aggregation rates between the two types of suspensions was the coating on
silver particles. Manufactured nanomaterials are often produced with surface coatings
and our results demonstrated that these coatings may play a critical role in the fate of
the materials and need to be incorporated into risk assessment models, bioavailability,
and toxicity studies.
104
5.2 Implications and future research
Nanoparticulate zinc sulfides and other metal sulfides have been detected in
hydrothermal vent systems, acid mine drainage, and in the vicinity of sulfate reducing
bacteria. The biogeochemistry and bioavailability of these materials should not be
expected to be the same as bulk metal sulfide, because nanomaterials are more reactive
and may pass through biological membranes, such as cell membranes of bacteria and
fish gills. The paradigm for the environmental fate and transport of metal sulfides has
been recently revised, after the discovery of metal sulfide nanoparticles that could pass
through conventional filters and be mistaken for dissolved. However, the processes that
lead to their persistence are poorly understood. Interactions of the metal sulfides with
DOM are assumed to be responsible for their stabilization. This research shed light on
the interactions of a DOM ligand group with metal sulfides. It was demonstrated that
low molecular weight thiols may play a critical role in the fate of naturally‐occurring
nanoparticles in sulfidic environments, such as anaerobic sediment pore water, biofilms
of sulfate reducing bacteria, and municipal wastewater effluent.
Metal sulfide nucleation and biomineralization models may need to be revised.
Nanoparticles are intermediates that form during the mineralization of metals and are
more soluble than bulk minerals. Hence, the use of thermodynamic data from bulk
metal sulfides may not be applicable at the nanoscale [169]. Our results and other
studies suggest that strong metal binding ligands, such as thiols may need to be

105
incorporated in models of metal sulfide precipitation in sediment porewater, biofilms of
sulfate reducing bacteria, and other thiol‐rich systems [106, 135].
Further work is needed in order to improve our understanding of the
biogeochemistry of metal sulfides. One approach to improve the chemical equilibrium
model may be to incorporate other metal ions (e.g. iron and copper) in the precipitation
of zinc sulfides with thiol ligands. In these scenarios co‐precipitation is likely to occur
[76]. In addition, thiols bind strongly to Fe2+ and Cu2+ and are also likely to adsorb on
metal sulfide particles. Finally, the presence of a mix of particles, such as metal sulfides
and oxides is likely to cause hetero‐aggregation, which would increase aggregation
kinetics and settling. Another approach may be to incorporate a wider variety of ligands.
For example, inorganic ligands (e.g. chloride and ammonia), complex thiol‐containing
organic ligands (e.g. phytochelatins and metallothioneins), and complex organic matter
(e.g. fulvic and humic acids, or extracellular polymeric substances) add to the
complexity of the biogeochemistry of metal sulfides.
Knowledge gained from studying the fate and transport of naturally‐occurring
nanomaterials may be applied for understanding transformations that manufactured
nanomaterials may undergo. The same tools may be used for assessing the potential risk
of nanomaterials. This study demonstrated that thiol ligand groups are reactive towards
both zinc sulfide and metallic silver nanoparticles. Using chemical analysis and DLS we
demonstrated that cysteine adsorbed on both types of particles and altered their

106
aggregation kinetics. XAS was employed to study the speciation of the metals exposed
to cysteine. The results of our work suggested that the coating on manufactured
nanoparticles may act as a moderating factor for the interactions of manufactured
particles with DOM. Based on our findings in Chapter 4, long chain polymeric coatings
may be more efficient in protecting the surface of nanomaterials from ligand groups in
DOM. Our results suggest that coatings distinguish manufactured from naturally‐
occurring nanomaterials and should be taken into consideration in models predicting
the toxicity, bioavailability, and biogeochemistry of the nanomaterials.
Further research is needed to elucidate the effect of DOM on manufactured
nanomaterials. As with the case of naturally‐occurring metal sulfides, the presence of
(in)organic ligands (e.g. sulfur, chloride, and ethylene diamine tetraacetic acid), complex
organics with thiol moieties (e.g. phytochelatins), and complex organic matter (e.g.
humic and fulvic acids) are likely to interact with metal‐based manufactured
nanomaterials. Studies have already shown the ability of inorganic ligands and DOM to
react with silver nanoparticles (Chapter 4). Data produced from these studies may be
useful for assessing the environmental impact of nanomaterials. A better understanding
of the physicochemical properties of nanomaterials and their reactivity in natural waters
is sorely needed for the development of risk assessment tools [170, 171]. The findings of
this research may be used in such tools, but our results suggest that further work is

107
needed, especially towards categorizing coatings in respect to their ability to polarize
surface atoms, or block reactive sites on nanomaterials.
Finally, the results of this study may be used for designing improved and more
environmentally friendly materials. For example, due to their antimicrobial activity,
silver nanoparticles have the potential to be used for coating water filtration membranes
to prevent the buildup of biofilms [172]. A recent study by Gunawan and collaborators
showed that it might be possible to use carbon nanotubes enriched with silver
nanoparticles for water treatment with hollow fiber membranes [173]. The presence of
silver nanoparticles added antimicrobial properties to the membrane, which may
increase the life time of the membrane. Bacteria contain high concentrations of thiols,
that are released into solution during lysis of the bacteria, inducing locally increased
concentrations of thiols on the surface of the membrane. Our findings may be used in
this technology to optimize the design of such processes balancing performance and
duration of the product. For example, PVP coated Ag NPs on these membranes are
likely to last longer than citrate coated particles, because they dissolve slower, but that
could reduce the antimicrobial properties of the membranes.
In addition, metallic nanoparticles and metal sulfide quantum dots have the
potential to be used in medical applications, mostly for detecting and treating infected
cells in humans. The surface coating is of paramount importance for the ability of the
nanomaterials to “target” the desired cells. Recent studies showed that the uptake of

108
cysteine coated CdSe(CdZnS) quantum dots from human hepatocellular carcinoma cells
was twice the uptake of the same material from human embryonic kidney cells [174].
The production of quantum dots is typically made in media that are impossible to use
for medical applications, such as chloroform. Tamang and coworkers showed that
InP/ZnS quantum dots produced in chloroform can be transferred to water maintaining
their fluorescence properties when coated with cysteine [175]. These findings support
the potential use of low molecular weight thiols for the design of improved
nanomaterials, but further research is needed to explore this possibility.
Overall, this dissertation work has studied the reactivity of low molecular weight
thiols towards metal‐based nanoparticles and the effects of this interaction on the
particles fate. Our research results demonstrated that improving the scientific
knowledge of naturally‐occurring nanomaterials may be useful for understanding the
fate and transport of manufactured nanomaterials and for designing improved and safer
products.

109
Appendix A Supporting Information for Chapter 2
Figure A1. Intensity‐weighted size distribution of the stock ZnS colloid suspension
(pH 10.7) measured by dynamic light scattering.
20 35 50 652 (degrees)
Inte
nsit
y (c
ount
s)
(111)
(220)
(113)
(102)
(110)
(103)(112)
(101)
(002)(100)
(200) wurtzite
sphalerite
stock ZnScolloids
(201)
Figure A2. X‐ray powder diffraction spectrum of stock ZnS colloids and ZnS reference
materials sphalerite (99.9%, <10 μm , Sigma Aldrich) and wurtzite (99.999%, 10 – 150
μm, SPI‐CHEM). The data indicated that the stock colloids consisted mainly of
sphalerite ZnS due to one primary peak in the range of 26‐30. Peak broadening of the sample spectra (at 29.2, 48.3, and 57.1) indicated that the crystal lattice length
dimensions of our synthesized material were 3.4 nm, 4.3 nm, and 5.2 nm (according to
the Scherrer formula).

110
(a)
(b)
Figure A3. (a) TEM image of the stock ZnS colloids on a copper grid sample holder
and (b) element content of particles in TEM image measured by energy dispersive X‐
ray spectroscopy.

111
(a) (b)
25 40 55 652 (degrees)
Inte
nsit
y (c
ount
s)
cinnabar
meta-cinnabar
stock HgScolloids
(102)
(111)
(200)
(101)
(003)(110)
(104)
(111)
(201) (105)
(113)
(220) (113)(222)
(c)
Figure A4. (a) X‐ray diffraction spectrum of HgS stock indicating that the particles
consisted of cinnabar and/or metacinnabar; (b) TEM image of HgS colloids; (c) EDS
spectrum of the particle observed in the TEM image indicating the presence of Hg
and S.
20 nm

112
(a)
0
5
10
15
20
0 20 40 60
Sor
bed
Cys
tein
e,
mol
/m2
Sorption Time, min
(b)
0
0.2
0.4
0.6
0.8
1
0 5 10 15 20
[cys
] / [
cys]
0
Time, hr
Figure A5. (a) Sorption of cysteine on ZnS colloids (50 μM as ZnS) at pH 7.5 (5 mM
HEPES buffer), no NaNO3 added; (b) Recovery of cysteine (35 μM initial
concentration) dissolved in pH 7.5 with HEPES buffer and no particles added. The
solution was stored in laboratory conditions (e.g., oxic, room temperature).

113
(a)
0 10 20 30 40 50 600
50
100
150
200
250
300
Time (seconds)
Ave
rage
Hyd
rody
nam
ic D
iam
eter
(nm
)
100 M serineno amino acid
(b)
0 10 20 30 40 500
100
200
300
400
500
600
Time (minutes)
Ave
rage
Hyd
rody
nam
ic D
iam
eter
(nm
)
[NaNO3]=10mM
[NaNO3]=40mM
[NaNO3]=60mM
[NaNO3]=75mM
Figure A6. Aggregation of ZnS colloids (50 μΜ) suspended in water (pH 7.5)
containing (a) 5 mM NaNO3 and serine (representing the diffusion‐limited
aggregation regime); (b) 100 μΜ cysteine and varying NaNO3 (representing the
reaction‐limited aggregation regime).

114
Appendix B Supporting Information for Chapter 4
Materials. All chemicals used in this work were ACS reagent grade and purchased from
Sigma‐Aldrich unless stated otherwise. Barnstead Nanopure‐grade water (>17.8 MΩ‐
cm) was used to prepare all reagents and samples. Trace‐metal grade nitric and
hydrochloric acids (Fisher Scientific, Pittsburgh, PA) were used to adjust the pH of
solutions. Ultrahigh purity nitrogen was utilized for purging oxygen from aqueous
samples. Borosilicate glass containers for reagent preparation and storage were acid‐
washed by soaking overnight in 1 N HCl prior to rinsing three times with Nanopure
water.
Figure B1. Transmission electron microscopy images of (A) citrate‐coated and (C)
PVP‐coated Ag NPs; also shown are particle size distributions determined from TEM
images for (B) citrate‐coated and (D) PVP‐coated Ag NPs.

115
0
3
6
9
0 12 24
Ag (μM) through
filter
Time (h)
CYS:Ag=50
CYS:Ag=5
Figure B2. Time‐resolved measurements of nominally dissolved silver with cysteine.
Mixtures of 8 μΜ AgNO3 and 40 μΜ (CYS:Ag=5) or 400 μΜ (CYS:Ag=50) cysteine
with 7 mM NaHCO3 (pH 7.5) and 10 mM NaNO3 were filtered with 0.025 μm filter
membranes.
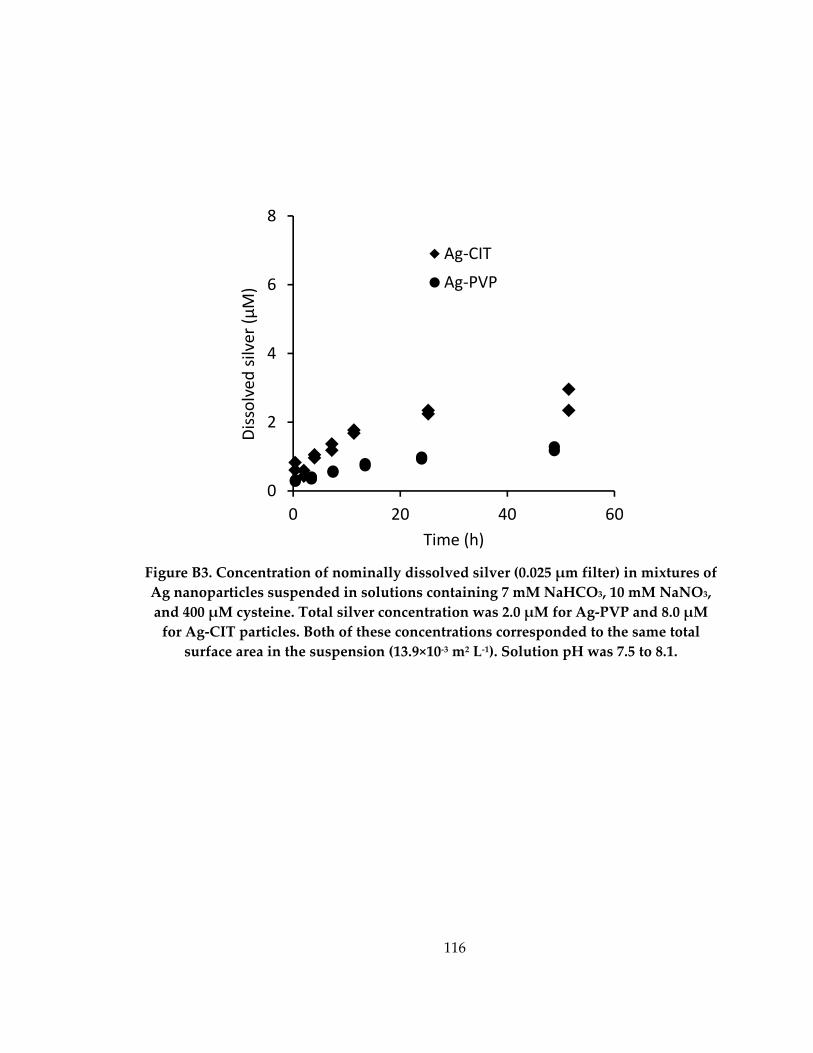
116
0
2
4
6
8
0 20 40 60
Dissolved
silver (μM)
Time (h)
Ag‐CIT
Ag‐PVP
Figure B3. Concentration of nominally dissolved silver (0.025 μm filter) in mixtures of
Ag nanoparticles suspended in solutions containing 7 mM NaHCO3, 10 mM NaNO3,
and 400 μM cysteine. Total silver concentration was 2.0 μM for Ag‐PVP and 8.0 μM
for Ag‐CIT particles. Both of these concentrations corresponded to the same total
surface area in the suspension (13.9×10‐3 m2 L‐1). Solution pH was 7.5 to 8.1.

117
0
40
80
120
0 50 100
Diameter (nm)
Time (min)
I = 0.15 M
I = 0.05 M
I = 0.03 M
Figure B4. Time‐resolved average hydrodynamic diameter of Ag‐PVP particles
suspended in solution with three different ionic strength values (0.15, 0.05, and 0.03
M). The solutions contained 7 mM NaHCO3, 400 μM cysteine and varying NaNO3
concentrations.

118
0
20
40
60
0 2 4
Diameter (nm)
Time (h)
DLR (I = 0.107 M)
Stable (I = 0.017 M)
(a)
0
50
100
150
200
0 2 4
Diameter (nm)
Time (h)
DLR (I = 0.107 M)
Stable (I = 0.017 M)
(b)
Figure B5. Time‐resolved average hydrodynamic diameter of (a) Ag‐CIT and (b) Ag‐
PVP nanoparticles suspended in solutions containing 7 mM NaHCO3, 10 or 100 mM
NaNO3, and 400 μΜ cysteine. Particle suspensions are relatively stable at 0.017 M
ionic strength and aggregate rapidly (diffusion limited regime – DLR) at 0.107 M ionic
strength.

119
Figure B6. TEM images of Ag‐PVP aggregates forming in the diffusion limited
regime: (a) 2 hours; (b) 24 hours. Suspensions comprised of 7.6 μΜ Ag‐PVP, 7 mM
NaHCO3, 100 mM NaNO3 and 0.4 mM cysteine. Solution pH values were 7.5 to 8.1.
Method for TEM imaging
Transmission electron microscopy (TEM) was used to characterize the morphology of
Ag‐PVP aggregates formed in solution containing 7.6 μM total silver, 7 mM NaHCO3, 10
mM NaNO3, and 400 μM cysteine. The solution pH was 7.5 to 8.1. After 2 or 24 h of
aggregation, TEM grids were prepared by depositing a 10 μL droplet of sample on a
formvar‐coated copper TEM grid (Ted Pella). The sample grid was dried for two hours
in a HEPA‐filtered laminar flow hood. Particles were observed by TEM (FEI Tecnai G2
Twin at 160 kV).

120
Preparation of reference materials for silver XANES analysis
Reference materials for XANES data analysis included PVP‐ and citrate‐coated Ag NPs
collected on the membrane filters directly from their stock suspensions. Ag(+I)‐cysteine
reference materials with 1:1 and 1:2 silver:cysteine molar ratios were prepared by mixing
solutions of AgNO3 (12.8 and 8.8 mM, respectively) and L‐cysteine (12.8 and 17.6 mM
respectively) and adjusting the pH to 7.5 with 10 N NaOH. We referred to these silver‐
cysteine references as Ag(CYS) and Ag(CYS)2 in this study. A silver‐citrate reference was
prepared from a solution of 9.2 mM AgNO3 dissolved with 91 mM citrate (at pH 7.5).
The dissolved Ag(+I)‐ligand reference material solutions were frozen without filtration,
freeze‐dried, and stored in 2 mL glass vials in a desiccator until XANES analysis. Other
silver reference materials for XANES analysis included AgNO3(s) (Fisher; ≥ 99.7%), AgCl
(Fisher Scientific, Hampton, New Hampshire, USA; ≥ 99.0%), Ag2O (Sigma Aldrich, St.
Louis, Missouri, USA; ≥ 99%), and Ag2S (Alfa Aesar, Ward Hill, Massachusetts, USA; ≥
99%) that were used directly as powders obtained from commercial suppliers. The
reference compounds and freeze‐dried samples were deposited on double sided tape as
a thin layer, to minimize self‐adsorption, and placed in front of the X‐ray beam for
collection of XANES spectra.

121
Linear combination fitting of XANES data
Three component linear combination fitting (LCF) of the Ag NP+cysteine sample spectra
was performed by for the portion of the data that was 20 eV below and 20 eV above the
adsorption edge (3351 eV). The LCF procedure utilized a binary combination of spectra
from the reference materials. LCF calculations were not forced to sum to 100%, and as a
result, some of the LCF results yielded percentages of model compounds that summed
up to 103%. Errors reported for individual components were calculated by the
software’s least squares fitting module. Best fits were considered the ones with the
lowest R‐factor, χ2, and Δχ2, which are fitting residual parameters defined in the SI
section. These parameters are defined from the following equations[176]:
2
2
data
fitdataR
(B.1)
2
2
i i
ii
pts
idp fitdata
N
N
(B.2)
22
(B.3)

122
where i is the data points, εi the uncertainties at each data point, Nidp the number of
independent points in the model fit, Npts the number of data points, and ν the degrees of
freedom in the fit.

123
3320 3340 3360 3380 3400
Absorption (a.u.)
Energy (eV)
Ag2S
Ag(CYS)
Ag(CYS)2
Ag NP (CIT)
Ag NP (PVP)
Ag‐citrate
Ag2O
AgCl
AgNO3
Ag‐CIT + CYS (2h)
Ag‐CIT + CYS (24h)
Ag‐PVP + CYS (2h)
Ag‐PVP + CYS (24h)
3351 eV
Figure B7. Silver L3‐edge XANES spectra of the model compounds AgNO3, AgCl,
Ag2O, Ag2S, Ag(+I) complexes Ag(CYS), Ag(CYS)2, and Ag‐citrate. The XANES spectra
also include the unexposed Ag nanoparticles (Ag‐CIT and Ag‐PVP) and the same
nanoparticles exposed to CYS for 2 and 24 hours.

124
Table B1. Linear combination fitting of Ag‐CIT samples exposed to cysteine
for 2 hours with spectra from the unexposed particles and one of the model
compounds or Ag(+I) complexes
Ag‐CIT + CYS (2 h) % Ag‐NP % Comp 2 R χ2 Δχ2
Ag2S 95.9 (0.9) 4.9 (0.8) 4.0×10‐5 13.7×10‐4 12.1×10‐4
Ag(CYS)2 97.2 (0.9) 3.7 (0.8) 4.6×10‐5 15.5×10‐4 13.8×10‐4
Ag2O 100.0 (0) 1.3 (0) 4.8×10‐5 16.3×10‐4 14.4×10‐4
Ag(CYS) 99.7 (1.1) 1.7 (1.1) 5.3×10‐5 18.1×10‐4 16.0×10‐4
AgCl 100.0 (0) 0 (0) 26.2×10‐5 88.4×10‐4 78.3×10‐4
Ag‐citrate 100.0 (0) 0 (0) 26.2×10‐5 88.4×10‐4 78.3×10‐4
AgNO3 100.0 (0) 0 (0) 26.2×10‐5 88.4×10‐4 78.3×10‐4
Table B2. Linear combination fitting of Ag‐CIT samples exposed to cysteine
for 24 hours with spectra from the unexposed particles and one of the model
compounds or Ag(+I) complexes
Ag‐CIT + CYS (24 h) % Ag‐NP % Comp 2 R χ2 Δχ2
Ag2S 92.0 (1.2) 9.4 (1.1) 7.8×10‐5 26.9×10‐4 23.8×10‐4
Ag(CYS)2 94.6 (1.4) 6.8 (1.2) 9.9×10‐5 34.2×10‐4 30.2×10‐4
Ag2O 100.0 (0) 2.3 (0) 10.1×10‐5 35.0×10‐4 31.0×10‐4
Ag(CYS) 97.2 (1.6) 5.2 (1.6) 11.7×10‐5 40.3×10‐4 35.7×10‐4
AgCl 100.0 (0) 0 (0) 76.9×10‐5 265.5×10‐4 234.9×10‐4
Ag‐citrate 100.0 (0) 0 (0) 76.9×10‐5 265.5×10‐4 234.9×10‐4
AgNO3 100.0 (0) 0 (0) 76.9×10‐5 265.5×10‐4 234.9×10‐4

125
Table B3. Linear combination fitting of Ag‐PVP samples exposed to cysteine
for 2 hours with spectra from the unexposed particles and one of the model
compounds or Ag(+I) complexes
Ag‐PVP + CYS (2 h) % Ag‐NP % Comp 2 R χ2 Δχ2
Ag2S 90.4 (0.6) 8.9 (0.6) 2.3×10‐5 7.5×10‐4 6.7×10‐4
Ag(CYS)2 91.9 (0.8) 7.2 (0.7) 3.7×10‐5 12.4×10‐4 11.0×10‐4
Ag(CYS) 91.5 (0.9) 8.6 (0.9) 3.8×10‐5 12.7×10‐4 11.3×10‐4
AgNO3 99.2 (0.3) 1.1 (0.3) 6.4×10‐5 21.2×10‐4 18.8×10‐4
Ag2O 99.4 (0.3) 0.8 (0.3) 6.5×10‐5 21.6×10‐4 19.1×10‐4
AgCl 100.0 (0) 0.3 (0) 7.0×10‐5 23.3×10‐4 20.7×10‐4
Table B4. Linear combination fitting of Ag‐PVP samples exposed to cysteine
for 24 hours with spectra from the unexposed particles and one of the model
compounds or Ag(+I) complexes
Ag‐PVP + CYS (24 h) % Ag‐NP % Comp 2 R χ2 Δχ2
Ag(CYS) 91.4 (0.6) 8.8 (0.6) 1.0×10‐5 5.4×10‐40 4.8×10‐4
Ag(CYS)2 91.3 (0.4) 7.9 (0.3) 1.7×10‐5 2.8×10‐4 2.5×10‐4
Ag2S 94.4 (0.8) 5.5 (0.7) 1.9×10‐5 10.5×10‐4 9.3×10‐4
Ag2O 100.0 (0) 0.5 (0) 3.8×10‐5 16.8×10‐4 14.9×10‐4
AgCl 100.0 (0) 0 (0) 4.6×10‐5 28.2×10‐4 24.9×10‐4
AgNO3 100.0 (0) 0 (0) 4.6×10‐5 28.2×10‐4 24.9×10‐4

126
0
1
2
3
4
0 20 40 60
Δ[CYS](m
mol/m
2)
Time (h)
Ag‐CIT
Ag‐PVP
(b)
0
200
400
0 20 40 60
Dissolved
CYS (μM)
Time (h)
0 μΜ Ag NP
8 μΜ Ag‐CIT
7.6 μΜ Ag‐PVP
(a)
Figure B8. (a): Concentration of dissolved cysteine (0.025 μm filter) in mixtures of Ag‐
CIT and Ag‐PVP nanoparticles suspended in solutions containing 400 μM cysteine, 7
mM NaHCO3 and 10 mM NaNO3. Solution pH values were 7.5 to 8.1. The total
cysteine concentration was measured from the stock solution. (b): Change in
dissolved cysteine concentration (Δ[CYS]) (determined from the measured dissolved
[CYS] (at the initial time point) and the measured dissolved [CYS] at time t)
normalized to the total surface area of the particles at the beginning of the
experiment. Errors bars represent 1 standard deviation, estimated by propagating
standard deviations of the measured dissolved CYS concentrations.

127
References
1. Wigginton, N. S.; Haus, K. L.; Hochella, M. F., Aquatic environmental nanoparticles. J. Environ. Monit. 2007, 9, (12), 1306-1316.
2. Aiken, G. R.; Hsu-Kim, H.; Ryan, J. N., Influence of dissolved organic matter on the environmental fate of metals, nanoparticles, and colloids. Environ. Sci. Technol. 2011, 45, (8), 3196-3201.
3. Hochella, M. F., There's plenty of room at the bottom: Nanoscience in geochemistry. Geochim. Cosmochim. Acta 2002, 66, (5), 735-743.
4. Hochella, M. F., Nanogeoscience: From origins to cutting-edge applications. Elements 2008, 4, (6), 373-379.
5. Rosso, K.; Vaughan, D., Sulfide mineral surfaces. Reviews in Mineralogy and Geochemistry 2006, 61, 505-556.
6. Hohmann, C.; Morin, G.; Ona-Nguema, G.; Guigner, J. M.; Brown, G. E.; Kappler, A., Molecular-level modes of As binding to Fe(III) (oxyhydr)oxides precipitated by the anaerobic nitrate-reducing Fe(II)-oxidizing Acidovorax sp strain BoFeN1. Geochim. Cosmochim. Acta 2011, 75, (17), 4699-4712.
7. Lowry, G. V.; Shaw, S.; Kim, C. S.; Rytuba, J. J.; Brown, G. E., Jr., Macroscopic and microscopic observations of particle-facilitated mercury transport from New Idria and Sulphur Bank mercury mine tailings. Environ. Sci. Technol. 2004, 38, (19), 5101-11.
8. Hochella, M. F.; Moore, J. N.; Putnis, C. V.; Putnis, A.; Kasama, T.; Eberl, D. D., Direct observation of heavy metal-mineral association from the Clark Fork River Superfund Complex: Implications for metal transport and bioavailability. Geochim. Cosmochim. Acta 2005, 69, (7), 1651-1663.
9. Waples, J. S.; Nagy, K. L.; Aiken, G. R.; Ryan, J. N., Dissolution of cinnabar (HgS) in the presence of natural organic matter. Geochim. Cosmochim. Acta 2005, 69, (6), 1575-1588.
10. Slowey, A. J.; Johnson, S. B.; Rytuba, J. J.; Brown, G. E., Role of organic acids in promoting colloidal transport of mercury from mine tailings. Environ. Sci. Technol. 2005, 39, 7869-7874.

128
11. Luther, G. W., 3rd; Rozan, T. F.; Taillefert, M.; Nuzzio, D. B.; Di Meo, C.; Shank, T. M.; Lutz, R. A.; Cary, S. C., Chemical speciation drives hydrothermal vent ecology. Nature 2001, 410, (6830), 813-6.
12. Bura-Nakic, E.; Krznaric, D.; Jurasin, D.; Helz, G. R.; Ciglenecki, I., Voltammetric characterization of metal sulfide particles and nanoparticles in model solutions and natural waters. Anal. Chim. Acta 2007, 594, (1), 44-51.
13. Gammons, C. H.; Frandsen, A. K., Fate and transport of metals in H2S-rich waters at a treatment wetland. Geochem. Trans. 2001, 1.
14. Rozan, T. F.; Lassman, M. E.; Ridge, D. P.; Luther, G. W. I., Evidence for iron, copper, and zinc complexation as multinuclear sulphide clusters in oxic rivers. Nature 2000, 406, 879-882.
15. Hsu-Kim, H.; Sedlak, D. L., Similarities between inorganic sulfide and the strong Hg(II)-complexing ligands in municipal wastewater effluent. Environ. Sci. Technol. 2005, 39, 4035-4041.
16. Wiesner, M. R.; Lowry, G. V.; Alvarez, P.; Dionysiou, D.; Biswas, P., Assessing the risks of manufactured nanomaterials. Environ. Sci. Technol. 2006, 40, (14), 4336-4345.
17. Maynard, A., Project on emerging nanotechnologies. Woodrow Wilson International Center for Scholars 2009, http://www.nanotechproject.org/inventories/consumer/analysis_draft/, (Accessed January 2012).
18. Benn, T.; Westerhoff, P., Nanoparticle silver released into water from commercially available sock fabrics. Environ. Sci. Technol. 2008, 42, 4133-4139.
19. Fabrega, J.; Luoma, S. N.; Tyler, C. R.; Galloway, T. S.; Lead, J. R., Silver nanoparticles: Behaviour and effects in the aquatic environment. Environ Int 2011, 37, (2), 517-531.
20. Nowack, B.; Krug, H. F.; Height, M., 120 years of nanosilver history: Implications for policy makers. Environ. Sci. Technol. 2011.
21. Tipping, E.; Higgins, D. C., The effect of adsorbed humic substances on the colloid stability of haematite particles. Colloids and Surfaces 1982, 5, 35-92.

129
22. Tiller, C. L.; Omelia, C. R., Natural Organic Matter and Colloidal Stability Models and Measurements. Colloids Surf., A 1993, 73, 89-102.
23. Meier, M.; Namjesnik-Dejanovic, K.; Maurice, P. A.; Chin, Y. P.; Aiken, G. R., Fractionation of aquatic natural organic matter upon sorption to goethite and kaolinite. Chem. Geol. 1999, 157, (3-4), 275-284.
24. Yoon, T. H.; Johnson, S. B.; Brown, G. E., Jr., Adsorption of Suwannee River fulvic acid on aluminum oxyhydroxide surfaces: an in situ ATR-FTIR study. Langmuir 2004, 20, (14), 5655-8.
25. Filella, M., NOM site binding heterogeneity in natural waters: Discrete approaches. J. Mol. Liq. 2008, 143, (1), 42-51.
26. Smith, D. S.; Bell, R. A.; Kramer, J. R., Metal speciation in natural waters with emphasis on reduced sulfur groups as strong metal binding sites. Comp Biochem Physiol C Toxicol Pharmacol 2002, 133, (1-2), 65-74.
27. Pearson, R. G., Hard and soft acids and bases. J. Am. Chem. Soc. 1963, 85, (22), 3533-3539.
28. Deonarine, A.; Hsu-Kim, H., Precipitation of mercuric sulfide nanoparticles in NOM-containing water: Implications for the natural environment. Environ. Sci. Technol. 2009, 43, (7), 2368-2373.
29. Lau, B. L. T.; Hsu-Kim, H., Precipitation and growth of zinc sulfide nanoparticles in the presence of thiol-containing natural organic ligands. Environ. Sci. Technol. 2008, 42, (19), 7236-7241.
30. Nriagu, J. O., Zinc in the environment. Wiley: New York, 1980.
31. Hsu-Kim, H.; Mullaugh, K. M.; Tsang, J. J.; Yucel, M.; Luther, G. W., Formation of Zn- and Fe-sulfides near hydrothermal vents at the Eastern Lau Spreading Center: implications for sulfide bioavailability to chemoautotrophs. Geochem. Trans. 2008, 9, (6).
32. Labrenz, M.; Druschel, G. K.; Thomsen-Ebert, T.; Gilbert, B.; Welch, S. A.; Kemner, K. M.; Logan, G. A.; Summons, R. E.; Stasio, G. D.; Bond, P. L.; Lai, B.; Kelly,

130
S. D.; Banfield, J. F., Formation of sphalerite (ZnS) deposits in natural biofilms of sulfate-reducing bacteria. Science 2000, 290, (5497), 1744-1747.
33. Rickard, D.; Luther, G. W., Metal sulfide complexes and clusters. Reviews in Mineralogy and Geochemistry 2006, 61, 421-504.
34. Jong, T.; Parry, D. L., Adsorption of Pb(II), Cu(II), Cd(II), Zn(II), Ni(II), Fe(II), and As(V) on bacterially produced metal sulfides. J. Colloid Interface Sci. 2004, 275, 61-71.
35. Wiesner, M. R.; Bottero, J.-Y., Environmental nanotechnology. McGraw-Hill: New York, USA, 2007.
36. Nel, A.; Xia, T.; Madler, L.; Li, N., Toxic potential of materials at the nanolevel. Science 2006, 311, (5761), 622-627.
37. Purcell, T. W.; Peters, J. J., Sources of silver in the environment. Environ. Toxicol. Chem. 1998, 17, (4), 539-546.
38. Miller, L. A.; Bruland, K. W., Organic speciation of silver in marine waters. Environ. Sci. Technol. 1995, 29, (10), 2616-2621.
39. Adams, N. W. H.; Kramer, J. R., Silver speciation in wastewater effluent, surface waters, and pore waters. Environ. Toxicol. Chem. 1999, 18, (12), 2667-2673.
40. Kramer, J. R.; Adams, N. W. H.; Manolopoulos, H.; Collins, P. V., Silver at an old mining camp, Cobalt, Ontario, Canada. Environ. Toxicol. Chem. 1999, 18, (1), 23-29.
41. Shafer, M. M.; Overdier, J. T.; Armstrong, D. E., Removal, partitioning, and fate of silver and other metals in wastewater treatment plants and effluent-receiving streams. Environ. Toxicol. Chem. 1998, 17, (4), 630-641.
42. Ratte, H. T., Bioaccumulation and toxicity of silver compounds: A review. Environ. Toxicol. Chem. 1999, 18, (1), 89-108.
43. Adams, N. W. H.; Kramer, J. R., Reactivity of Ag+ ion with thiol ligands in the presence of iron sulfide. Environ. Toxicol. Chem. 1998, 17, (4), 625-629.
131
44. Liau, S. Y.; Read, D. C.; Pugh, W. J.; Furr, J. R.; Russell, A. D., Interaction of silver nitrate with readily identifiable groups: Relationship to the antibacterial action of silver ions. Lett. Appl. Microbiol. 1997, 25, (4), 279-283.
45. Bell, R.; Kramer, J., Structural chemistry and geochemistry of silver-sulfur compounds: Critical review. Environ. Toxicol. Chem. 1999, 18, (1), 9-22.
46. Bielmyer, G.; Bell, R.; Klaine, S., Effects of ligand-bound silver on ceriodaphnia dubia. Environ. Toxicol. Chem. 2002, 21, (10), 2204-2208.
47. Adams, N. W. H.; Kramer, J. R., Determination of silver speciation in wastewater and receiving waters by competitive ligand equilibration/solvent extraction. Environ. Toxicol. Chem. 1999, 18, (12), 2674-2680.
48. Carlson, C.; Hussain, S. M.; Schrand, A. M.; Braydich-Stolle, L. K.; Hess, K. L.; Jones, R. L.; Schlager, J. J., Unique cellular interaction of silver nanoparticles: Size-dependent generation of reactive oxygen species. J Phys Chem B 2008, 112, (43), 13608-19.
49. Lok, C. N.; Ho, C. M.; Chen, R.; He, Q. Y.; Yu, W. Y.; Sun, H.; Tam, P. K. H.; Chiu, J. F.; Che, C. M., Silver nanoparticles: Partial oxidation and antibacterial activities. J. Biol. Inorg. Chem. 2007, 12, (4), 527-534.
50. Sotiriou, G. A.; Pratsinis, S. E., Antibacterial activity of nanosilver ions and particles. Environ. Sci. Technol. 2010, 44, (14), 5649-54.
51. Gao, J.; Youn, S.; Hovsepyan, A.; Llaneza, V. L.; Wang, Y.; Bitton, G.; Bonzongo, J. C. J., Dispersion and toxicity of selected manufactured nanomaterials in natural river water samples: Effects of water chemical composition. Environ. Sci. Technol. 2009, 43, (9), 3322-3328.
52. Choi, O.; Clevenger, T. E.; Deng, B.; Surampalli, R. Y.; Ross, L., Jr.; Hu, Z., Role of sulfide and ligand strength in controlling nanosilver toxicity. Water Res. 2009, 43, (7), 1879-86.
53. Li, X. A.; Lenhart, J. J.; Walker, H. W., Dissolution-accompanied aggregation kinetics of silver nanoparticles. Langmuir 2010, 26, (22), 16690-16698.
54. Kramer, J.; Bell, R.; Smith, S.; Gorsuch, J., Silver nanoparticle toxicity and biocides: Need for chemical speciation. Integr Environ Assess Manag 2009, 5, (4), 720-2.

132
55. Marambio-Jones, C.; Hoek, E. M. V., A review of the antibacterial effects of silver nanomaterials and potential implications for human health and the environment. J. Nanopart. Res. 2010, 12, (5), 1531-1551.
56. Fabrega, J.; Fawcett, S. R.; Renshaw, J. C.; Lead, J. R., Silver nanoparticle impact on bacterial growth: Effect of pH, concentration, and organic matter. Environ. Sci. Technol. 2009, 43, (19), 7285-7290.
57. Navarro, E.; Piccapietra, F.; Wagner, B.; Marconi, F.; Kaegi, R.; Odzak, N.; Sigg, L.; Behra, R., Toxicity of silver nanoparticles to chlamydomonas reinhardtii. Environ. Sci. Technol. 2008, 42, (23), 8959-8964.
58. Yang, X.; Gondikas, A. P.; Marinakos, S. M.; Auffan, M.; Liu, J.; Hsu-Kim, H.; Meyer, J. N., Mechanism of silver nanoparticle toxicity is dependent on dissolved silver and surface coating in Caenorhabditis elegans. Environ. Sci. Technol. 2011, (in press).
59. Kennedy, A. J.; Hull, M. S.; Bednar, A. J.; Goss, J. D.; Gunter, J. C.; Bouldin, J. L.; Vikesland, P. J.; Steevens, J. A., Fractionating nanosilver: Importance for determining toxicity to aquatic test organisms. Environ. Sci. Technol. 2010, 44, (24), 9571-9577.
60. Blaser, S. A.; Scheringer, M.; Macleod, M.; Hungerbuhler, K., Estimation of cumulative aquatic exposure and risk due to silver: contribution of nano-functionalized plastics and textiles. The Science of the Total Environment 2008, 390, (2-3), 396-409.
61. Mopper, K.; Taylor, B. F., Biogeochemical cycling of sulfur - Thiols in coastal marine sediments. ACS Symp. Ser. 1986, 305, 324-339.
62. Shea, D.; Maccrehan, W. A., Determination of hydrophilic thiols in sediment porewater using ion-pair liquid-chromatography coupled to electrochemical detection. Anal. Chem. 1988, 60, (14), 1449-1454.
63. Ahner, B. A.; Kong, S.; Morel, F. M. M., Phytochelatin production in marine algae. 2. Induction by various metals. Limnol. Oceanogr. 1995, 40, (4), 658-665.
64. Grill, E.; Winnacker, E. L.; Zenk, M. H., Phytochelatins: The principal heavy-metal complexing peptides of higher plants. Science 1985, 230, (4726), 674-676.

133
65. Scheidegger, C.; Behra, R.; Sigg, L., Phytochelatin formation kinetics and toxic effects in the freshwater alga Chlamydomonas reinhardtii upon short- and long-term exposure to lead(II). Aquat. Toxicol. 2011, 101, (2), 423-9.
66. Fahey, R. C.; Brown, W. C.; Adams, W. B.; Worsham, M. B., Occurrence of glutathione in bacteria. J. Bacteriol. 1978, 133, (3), 1126-9.
67. Ellman, G. L., Tissue sulfhydryl groups. Arch. Biochem. Biophys. 1959, 82, (1), 70-77.
68. Thurman, E. M.; Malcolm, R. L., Preparative isolation of aquatic humic substances. Environ. Sci. Technol. 1981, 15, (4), 463-466.
69. Vairavamurthy, M.; Maletic, D.; Wang, S.; Manowitz, B.; Eglington, T.; Lyons, T., Characterization of sulfur-containing functional groups in sedimentary humic substances by X-ray absorption near-edge structure spectroscopy. Energy & Fuels 1997, 11, 546-553.
70. Xia, K.; Weesner, F.; Bleam, W. F.; Bloom, P. R.; Skyllberg, U. L.; Helmke, P. A., XANES studies of oxidation states of sulfur in aquatic and soil humic substances. Soil Science Society of America Journal 1998, 62, 1240-1246.
71. Deonarine, A.; Lau, B. L. T.; Aiken, G. R.; Ryan, J. N.; Hsu-Kim, H., Effects of humic substances on precipitation and aggregation of zinc sulfide nanoparticles. Environ. Sci. Technol. 2011, 45, (8), 3217-3223.
72. Iuchi, S.; Kuldell, N., Zinc finger proteins : From atomic contact to cellular function. Landes Bioscience; Kluwer Academic/Plenum Publishers: Georgetown, New York, 2005; p 276.
73. Amirbahman, A.; Sigg, L.; Gunten, U., Reductive dissolution of Fe(III) (hydr)oxides by cysteine: Kinetics and mechanism. J. Colloid Interface Sci. 1997, 194, (1), 194-206.
74. Iyamu, E. W.; Perdew, H.; Woods, G. M., Cysteine-iron promotes arginase activity by driving the Fenton reaction. Biochem. Biophys. Res. Commun. 2008, 376, (1), 116-20.
75. Williamson, J. M.; Boettcher, B.; Meister, A., Intracellular cysteine delivery system that protects against toxicity by promoting glutathione synthesis. P Natl Acad Sci USA 1982, 79, (20), 6246-9.
134
76. Stumm, W.; Morgan, J. J., Aquatic chemistry : chemical equilibria and rates in natural waters. 3rd ed.; Wiley: New York, 1996; p xvi, 1022 p.
77. Narkis, N.; Rebhun, M., The mechanism of flocculation processes in the presence of humic substances. J Am Water Works Assoc 1975, 101 - 108.
78. Chen, K. L.; Elimelech, M., Influence of humic acid on the aggregation kinetics of fullerene (C60) nanoparticles in monovalent and divalent electrolyte solutions. J. Colloid Interface Sci. 2007, 309, 126-134.
79. Saleh, N. B.; Pfefferle, L. D.; Elimelech, M., Aggregation kinetics of multiwalled carbon nanotubes in aquatic systems: Measurements and environmental implications. Environ. Sci. Technol. 2008, 42, (21), 7963-7969.
80. Sposito, G., The surface chemistry of soils. Oxford University Press; Clarendon Press: New York, Oxford Oxfordshire, 1984; p xii, 234 p.
81. Auffan, M.; Rose, J.; Proux, O.; Borschneck, D.; Masion, A.; Chaurand, P.; Hazemann, J.-L.; Chaneac, C.; Jolivet, J.-P.; Wiesner, M. R.; Geen, A. V.; Bottero, J.-Y., Enhanced adsorption of arsenic onto maghemites nanoperticles: As(III) as a probe of the surface structure and heterogeneity. Langmuir 2008, 24, (7), 3215-3222.
82. Barton, L. E.; Grant, K. E.; Kosel, T.; Quicksall, A. N.; Maurice, P. A., Size-dependent Pb sorption to nanohematite in the presence and absence of a microbial siderophore. Environ. Sci. Technol. 2011, 45, (8), 3231-3237.
83. Madden, A. S.; Hochella, M. F.; Luxton, T. P., Insights for size-dependent reactivity of hematite nanomineral surfaces through Cu2+ sorption. Geochimica et Cosmica Acta 2006, 70, 4095-4104.
84. Auffan, M.; Rose, J.; Bottero, J.-Y.; Lowry, G. V.; Jolivet, J.-P.; Wiesner, M. R., Towards a definition of inorganic nanoparticles from an environmental, health and safety perspective. Nature Nanotechnology 2009, 4, 634-641.
85. Zhang, H.; Gilbert, B.; Huang, F.; Banfield, J. F., Water-driven structure transformation in nanoparticles at room temperature. Nature 2003, 424, 1025-1029.
86. Sposito, G., The chemistry of soils. 2nd ed.; Oxford University Press: Oxford ; New York, 2008; p xii, 329 p.

135
87. Crittenden, J. C.; Trussell, R. R.; Hand, D. W.; Howe, K. J.; Tsobanoglous, G., Water treatment principles and design. John Wiley & Sons, Inc.: Hoboken, NJ, USA, 2005.
88. Schnoor, J. L., Environmental modeling : Fate and transport of pollutants in water, air, and soil. Wiley: New York, 1996; p xvi, 682 p.
89. Hounslow, M. J.; Ryall, R. L.; Marshall, V. R., A discretized population balance for nucleation, growth, and aggregation. American Institute of Chemical Engineers Journal 1988, 34, (11), 1821-1832.
90. Wiesner, M. R., Kinetics of aggregate formation in rapid mix. Water Res. 1992, 26, (3), 379-387.
91. Reerink, H.; Overbeek, J. T. G., The rate of coagulation as a measure of the stability of silver iodide sols. Discuss Faraday Soc 1954, (18), 74-84.
92. Derjaguin, B., On the repulsive forces between charged colloid particles and on the theory of slow coagulation and stability of lyophobe sols. T Faraday Soc 1940, 35, (3), 0203-0214.
93. Vold, R. D.; Vold, M. J., Colloid and Interface Chemistry. Addison-Wesley Publishing Company, Inc. : San Diego, CA, USA, 1983.
94. Hamaker, H. C., The London-Van der Waals attraction between spherical particles. Physica IV 1937, 10, 1058-1072.
95. Huynh, K. A.; Chen, K. L., Aggregation kinetics of citrate and polyvinylpyrrolidone coated silver nanoparticles in monovalent and divalent electrolyte solutions. Environ. Sci. Technol. 2011, 45, (13), 5564-71.
96. Hunter, R., Foundations of colloid science. Oxford University Press: New York, 2004.
97. Mylon, S. E.; Chen, K. L.; Elimelech, M., Influence of natural organic matter and ionic composition on the kinetics and structure of hematite colloid aggregation: Implications to iron depletion in estuaries. Langmuir 2004, 20, 9000-9006.

136
98. Grolimund, D.; Elimelech, M.; Borkovec, M., Aggregation and deposition kinetics of mobile colloidal particles in natural porous media. Colloids Surf., A 2001, 191, 179-188.
99. Benjamin, M. M., Water chemistry. McGraw-Hill: Boston, 2002; p xix, 668 p.
100. Schwertmann, U.; Friedl, J.; Stanjek, H., From Fe(III) ions to ferrihydrite and then to hematite. J. Colloid Interface Sci. 1999, 209, (1), 215-223.
101. Saito, M. A.; Sigman, D. M.; Morel, F. M. M., The bioinorganic chemistry of the ancient ocean: The co-evolution of cyanobacterial metal requirements and biogeochemical cycles at the Archean-Proterozoic boundary? Inorg. Chim. Acta 2003, 356, 308-318.
102. David, L. A.; Alm, E. J., Rapid evolutionary innovation during an Archaean genetic expansion. Nature 2011, 469, (7328), 93-6.
103. Liu, J.; Aruguete, D. M.; Jinschek, J. R.; Rimstidt, J. D.; Hochella, M. F., The non-oxidative dissolution of galena nanocrystals: Insights into mineral dissolution rates as a function of grain size, shape, and aggregation state. Geochim. Cosmochim. Acta 2008, 72, 5984-5996.
104. Moreau, J. W.; Weber, P. K.; Martin, M. C.; Gilbert, B.; Hutcheon, I. D.; Banfield, J. F., Extracellular proteins limit the dispersal of biogenic nanoparticles. Science 2007, 316, 1600-1603.
105. Gilbert, B.; Banfield, J. F., Molecular-scale processes involving nanoparticulate minerals in biogeochemical systems. Molecular Geomicrobiology 2005, 59, 109-155.
106. Moreau, J. W.; Webb, R. I.; Banfield, J. F., Ultrastructure, aggregation-state, and crystal growth of biogenic nanocrystalline sphalerite and wurtzite. Am. Mineral. 2004, 89, (7), 950-960.
107. Lowry, G. V.; Shaw, S.; Kim, C. S.; Rytuba, J. J.; Brown, G. E., Macroscopic and microscopic observations of particle-facilitated mercury transport from New Idria and sulphur bank mercury mine tailings. Environ. Sci. Technol. 2004, 38, 5101-5111.
108. Vairavamurthy, A.; Mopper, K., Field method for determination of traces of thiols in natural-waters. Anal. Chim. Acta 1990, 236, (2), 363-370.
137
109. Sooklal, K.; Cullum, B. S.; Angel, S. M.; Murphy, C. J., Photophysical properties of ZnS nanoclusters with spatially localized Mn2+. J Phys Chem 1996, 100, (11), 4551-4555.
110. Luther, G. W.; Theberge, S. M.; Rickard, D. T., Evidence for aqueous clusters as intermediates during zinc sulfide formation. Geochim. Cosmochim. Acta 1999, 63, (19/20), 3159-3169.
111. Schudel, M.; Behrens, S. H.; Holthoff, H.; Kretzschmar, R.; Borkovec, M., Absolute aggregation rate constants of hematite particles in aqueous suspensions: A comparison of two different surface morphologies. J. Colloid Interface Sci. 1997, 196, (2), 241-253.
112. Mylon, S. E.; Chen, K. L.; Elimelech, M., Influence of natural organic matter and ionic composition on the kinetics and structure of hematite colloid aggregation: Implications to iron depletion in estuaries. Langmuir 2004, 20, (21), 9000-9006.
113. Hsu-Kim, H., Stability of metal - glutathione complexes during oxidation by hydrogen peroxide and Cu(II) catalysis. Environ. Sci. Technol. 2007, 41, 2338-2342.
114. Lindroth, P.; Mopper, K., High-performance liquid-chromatographic determination of subpicomole amounts of amino-acids by precolumn fluorescence derivatization with ortho-phthaldialdehyde. Anal. Chem. 1979, 51, (11), 1667-1674.
115. Pugh, R. J.; Tjus, K., Electrokinetic studies on Cu(II) hydroxyl coated zinc sulfide particles. J. Colloid Interface Sci. 1987, 117, (1), 231-241.
116. Moignard, M. S.; James, R. O.; Healy, T. W., Adsorption of calcium at the zinc sulphide-water interface. Aust. J. Chem. 1977, 30, 733-740.
117. Radhika, V.; Subramanian, S.; Natarajan, K. A., Bioremediation of zinc using Desulfotomaculum nitrificans: Bioprecipitation and characterization studies. Water Res. 2006, 40, 3628-3636.
118. Durhan, J. D. G.; Guindo, M. C.; Delgado, A. V.; Gonzalez-Caballero, F., Stability of monodisperse zinc sulfide colloidal dispersions. Langmuir 1995, 11, (10), 3648-3655.
119. Bebie, J.; Schoonen, M. A. A.; Fuhrmann, M.; Strongin, D. R., Surface charge development on transition metal sulfides: An electrokinetic study. Geochim. Cosmochim. Acta 1998, 62, (4), 633-642.

138
120. Nicolau, Y. F.; Menard, J. C., An electrokinetic study of ZnS and CdS surface chemistry. J. Colloid Interface Sci. 1991, 148, (2), 551-570.
121. Horzempa, L. M.; Helz, G. R., Controls on the stability of sulfide sols - colloidal covellite as an example. Geochim. Cosmochim. Acta 1979, 43, (10), 1645-1650.
122. DiToro, D. M.; Mahony, J. D.; Hansen, D. J.; Scott, K. J.; Carlson, A. R.; Ankley, G. T., Acid volatile sulfide predicts the acute toxicity of cadmium and nickel in sediments. Environ. Sci. Technol. 1992, 26, (1), 96-101.
123. Weber, F.-A.; Voegelin, A.; Kaegi, R.; Kretzschmar, R., Contaminant mobilization by metallic copper and metal sulphide colloids in flooded soil. Nature Geosci 2009, 2, (4), 267-271.
124. Weber, F.-A.; Voegelin, A.; Kaegi, R.; Kretzschmar, R., Formation of copper sulfide nanoparticles in a flooded soil: Potential for colloid-facilitated transport of contaminants. Geochim. Cosmochim. Acta 2007, 71, (15), A1094-A1094.
125. Kim, B.; Park, C.-S.; Murayama, M.; Hochella, M. F., Discovery and Characterization of Silver Sulfide Nanoparticles in Final Sewage Sludge Products. Environ. Sci. Technol. 2010, (in press).
126. Vilge-Ritter, A.; Rose, J.; Masion, A.; Bottero, J. Y.; Laine, J. M., Chemistry and structure of aggregates formed with Fe-salts and natural organic matter. Colloids and Surfaces a-Physicochemical and Engineering Aspects 1999, 147, (3), 297-308.
127. Masion, A.; Thomas, F.; Tchoubar, D.; Bottero, J. Y.; Tekely, P., Chemistry and structure of Al(OH)/organic precipitates. A small angle X-ray scattering study. 3. Depolymerization of the Al13 polycation by organic ligands. Langmuir 1994, 10, 4353-4356.
128. Masion, A.; Bottero, J. Y.; Thomas, F.; Tchoubar, D., Chemistry and structure of Al(OH)/organic precipitates. A small angle X-ray scattering study. 2. Speciation and structure of the aggregates. Langmuir 1994, 10, 4349-4352.
129. Amirbahman, A.; Olson, T. M., Transport of humic matter-coated hematite in packed-beds. Environ. Sci. Technol. 1993, 27, (13), 2807-2813.
139
130. Johnson, R. L.; Johnson, G. O.; Nurmi, J. T.; Tratnyek, P. G., Natural organic matter enhanced mobility of nano zerovalent iron. Environ. Sci. Technol. 2009, 43, (14), 5455-5460.
131. Sander, S.; Mosley, L. M.; Hunter, K. A., Investigation of interparticle forces in natural waters: Effects of adsorbed humic acids on iron oxide and alumina surface properties. Environ. Sci. Technol. 2004, 38, (18), 4791-4796.
132. Bligh, M. W.; Waite, T. D., Role of heterogeneous precipitation in determining the nature of products formed on oxidation of Fe(II) in seawater containing natural organic matter. Environ. Sci. Technol. 2010, 44, (17), 6667-6673.
133. Le Faucheur, S.; Schildknecht, F.; Behra, R.; Sigg, L., Thiols in Scenedesmus vacuolatus upon exposure to metals and metalloids. Aquat Toxicol 2006, 80, (4), 355-61.
134. Labrenz, M.; Druschel, G. K.; Thomsan-Ebert, T.; Gilbert, B.; Welch, S. A.; Kemner, K. M.; Logan, G. A.; Summons, R. E.; De Stasio, G.; Bond, P. L.; Lai, B.; Kelly, S. D.; Banfield, J. F., Formation of sphalerite (ZnS) deposits in natural biofilms of sulfate-reducing bacteria. Science 2000, 290, 1744-1747.
135. Mullaugh, K. M.; Luther, G. W., Spectroscopic determination of the size of cadmium sulfide nanoparticles formed under environmentally relevant conditions. J. Environ. Monit. 2010, 12, (4), 890-7.
136. Gondikas, A. P.; Jang, E. K.; Hsu-Kim, H., Influence of amino acids cysteine and serine on aggregation kinetics of zinc and mercury sulfide colloids. J. Colloid Interface Sci. 2010, 347, (2), 167-171.
137. Glatter, O.; Kratky, O., Small angle x-ray scattering. Academic Press: London ; New York, 1982; p 515 p.
138. Ravel, B.; Newville, M., ATHENA, ARTEMIS, HEPHAESTUS: data analysis for X-ray absorption spectroscopy using IFEFFIT. J Synchrotron Radiat 2005, 12, 537-541.
139. Mehta, S. K.; Kumar, S.; Chaudhary, S.; Bhasin, K. K.; Gradzielski, M., Evolution of ZnS nanoparticles via facile CTAB aqueous micellar solution route: A study on controlling parameters. Nanoscale Res Lett 2009, 4, (1), 17-28.

140
140. Goodell, C. M.; Gilbert, B.; Weigand, S. J.; Banfleld, J. F., Kinetics of water adsorption-driven structural transformation of ZnS nanoparticles. J. Phys. Chem. C 2008, 112, (13), 4791-4796.
141. Masion, A.; Tchoubar, D.; Bottero, J. Y.; Thomas, F.; Villieras, F., Chemistry and structure of Al(OH)/Organic precipitates. A small angle X-ray scattering study. 1. Numerical procedure for speciation from scattering curves. Langmuir 1994, 10, 4344-4348.
142. Guinier, A.; Fournet, G., Small-angle scattering of X-rays. John Wiley & Sons, Inc. : New York, 1955.
143. Langford, J. I.; Wilson, A. J. C., Scherrer after 60 years - Survey and some new results in determination of crystallite size. J. Appl. Crystallogr. 1978, 11, (Apr), 102-113.
144. Suryanarayana, C.; Norton, M. G., X-ray diffraction: A practical approach. Plenum Press: New York, 2005.
145. Foley, S.; Enescu, M., A Raman spectroscopy and theoretical study of zinc-cysteine complexation. Vib. Spectrosc 2007, 44, (2), 256-265.
146. Calvin, S.; Luo, S. X.; Caragianis-Broadbridge, C.; McGuinness, J. K.; Anderson, E.; Lehman, A.; Wee, K. H.; Morrison, S. A.; Kurihara, L. K., Comparison of extended x-ray absorption fine structure and Scherrer analysis of x-ray diffraction as methods for determining mean sizes of polydisperse nanoparticles. Appl. Phys. Lett. 2005, 87, (23), -.
147. Wiesner, M. R.; Lowry, G. V.; Jones, K. L.; Hochella, M. F.; Di Giulio, R. T.; Casman, E.; Bernhardt, E. S., Decreasing uncertainties in assessing environmental exposure, risk, and ecological implications of nanomaterials. Environ. Sci. Technol. 2009, 43, (17), 6458-6462.
148. Vikesland, P. J.; Heathcock, A. M.; Rebodos, R. L.; Makus, K. E., Particle size and aggregation effects on magnetite reactivity toward carbon tetrachloride. Environ. Sci. Technol. 2007, 41, (15), 5277-5283.
149. Liu, J.; Aruguete, D. M.; Murayama, M.; Hochella, M. F., Influence of size and aggregation on the reactivity of an environmentally and industrially relevant nanomaterial (PbS). Environ. Sci. Technol. 2009, 43, 8178-8183.
150. Kramer, J. R.; Adams, N. W. H., Silver speciation in wastewater effluent, surface waters, and pore waters. Environ. Toxicol. Chem. 1999, 18, (12), 2667-2673.

141
151. Ma, R.; Levard, C.; Marinakos, S. M.; Cheng, Y.; Liu, J.; Michel, F. M.; Brown, G. E.; Lowry, G. V., Size-controlled dissolution of organic-coated silver nanoparticles. Environ. Sci. Technol. 2011, (in press).
152. Levard, C.; Reinsch, B. C.; Michel, F. M.; Oumahi, C.; Lowry, G. V.; Brown, G. E., Sulfidation processes of PVP-coated silver nanoparticles in aqueous solution: Impact on dissolution rate. Environ. Sci. Technol. 2011, 45, (12), 5260-5266.
153. Liu, J. Y.; Pennell, K. G.; Hurt, R. H., Kinetics and mechanisms of nanosilver oxysulfidation. Environ. Sci. Technol. 2011, 45, (17), 7345-7353.
154. Kaegi, R.; Voegelin, A.; Sinnet, B.; Zuleeg, S.; Hagendorfer, H.; Burkhardt, M.; Siegrist, H., Behavior of metallic silver nanoparticles in a pilot wastewater treatment plant. Environ. Sci. Technol. 2011, 45, (9), 3902-3908.
155. Ciglenecki, I.; Cosovic, B.; Vojvodic, V.; Plavsic, M.; Furic, K.; Minacci, A.; Baldi, F., The role of reduced sulfur species in the coalescence of polysaccharides in the Adriatic Sea. Mar. Chem. 2000, 71, (3-4), 233-249.
156. Le Faucheur, S.; Behra, R.; Sigg, L., Thiol and metal contents in periphyton exposed to elevated copper and zinc concentrations: A field and microcosm study. Environ. Sci. Technol. 2005, 39, (20), 8099-107.
157. Miao, A. J.; Schwehr, K. A.; Xu, C.; Zhang, S. J.; Luo, Z. P.; Quigg, A.; Santschi, P. H., The algal toxicity of silver engineered nanoparticles and detoxification by exopolymeric substances. Environ. Pollut. 2009, 157, (11), 3034-3041.
158. Kawata, K.; Osawa, M.; Okabe, S., In vitro toxicity of silver nanoparticles at noncytotoxic doses to HepG2 human hepatoma cells. Environ. Sci. Technol. 2009, 43, (15), 6046-6051.
159. Meyer, J. N.; Lord, C. A.; Yang, X. Y. Y.; Turner, E. A.; Badireddy, A. R.; Marinakos, S. M.; Chilkoti, A.; Wiesner, M. R.; Auffan, M., Intracellular uptake and associated toxicity of silver nanoparticles in Caenorhabditis elegans. Aquat. Toxicol. 2010, 100, (2), 140-150.
160. Liu, J.; Cheng, Y. W.; Yin, L. Y.; Lin, S. H.; Wiesner, M.; Bernhardt, E., Toxicity reduction of polymer-stabilized silver nanoparticles by sunlight. J. Phys. Chem. C 2011, 115, (11), 4425-4432.

142
161. Davey, W. P., Precision measurements of the lattice constants of twelve common metals. Phys Rev 1925, 25, (6), 753-761.
162. Holthoff, H.; Egelhaaf, S. U.; Borkovec, M.; Schurtenberger, P.; Sticher, H., Coagulation rate measurements of colloidal particles by simultaneous static and dynamic light scattering. Langmuir 1996, 12, (23), 5541-5549.
163. Schudel, M.; Behrens, S. H.; Holthoff, H.; Kretzschmar, R.; Borkovec, M., Absolute aggregation rate constants of hematite particles in aqueous suspensions: a comparison of two different surface morphologies. J. Colloid Interface Sci. 1997, 196, 241-253.
164. Behrens, P., Bonding in silver-oxygen compounds from Ag LIII XANES spectroscopy. Solid State Commun. 1992, 81, (3), 235-239.
165. Liu, J.; Sonshine, D. A.; Shervani, S.; Hurt, R. H., Controlled release of biologically active silver from nanosilver surfaces. Acs Nano 2010, 4, (11), 6903-13.
166. Andersson, L.-O., Study of some silver-thiol complexes and polymers - stoichiometry and optical effects. J. Polym. Sci., Part A: Polym. Chem. 1972, 10, (7), 1963-1973.
167. Bottero, J. Y.; Auffan, M.; Rose, J.; Mouneyrac, C.; Botta, C.; Labille, J.; Masion, A.; Thill, A.; Chaneac, C., Manufactured metal and metal-oxide nanoparticles: Properties and perturbing mechanisms of their biological activity in ecosystems. Cr Geosci 2011, 343, (2-3), 168-176.
168. Gaur, A.; Shrivastava, B. D.; Joshi, S. K., Copper K-edge XANES of Cu(I) and Cu(II) oxide mixtures. J. Phys. Conf. Ser. 2009, 190, (190 012084), 1-4.
169. Luther, G. W.; Theberge, S. M.; Rickard, D. T., Evidence for aqueous clusters as intermediates during zinc sulfide formation. Geochim. Cosmochim. Acta 1999, 63, (19-20), 3159-3169.
170. Robichaud, C. O.; Tanzil, D.; Weilenmann, U.; Wiesner, M. R., Relative risk analysis of several manufactured nanomaterials: an insurance industry context. Environ. Sci. Technol. 2005, 39, (22), 8985-94.
171. Grieger, K. D.; Baun, A.; Owen, R., Redefining risk research priorities for nanomaterials. J Nanopart Res 2010, 12, (2), 383-392.

143
172. Li, Q.; Mahendra, S.; Lyon, D. Y.; Brunet, L.; Liga, M. V.; Li, D.; Alvarez, P. J., Antimicrobial nanomaterials for water disinfection and microbial control: potential applications and implications. Water Res. 2008, 42, (18), 4591-602.
173. Gunawan, P.; Guan, C.; Song, X.; Zhang, Q.; Leong, S. S.; Tang, C.; Chen, Y.; Chan-Park, M. B.; Chang, M. W.; Wang, K.; Xu, R., Hollow Fiber Membrane Decorated with Ag/MWNTs: Toward Effective Water Disinfection and Biofouling Control. Acs Nano 2011, 5, (12), 10033-40.
174. Al-Hajaj, N. A.; Moquin, A.; Neibert, K. D.; Soliman, G. M.; Winnik, F. M.; Maysinger, D., Short ligands affect modes of QD uptake and elimination in human cells. Acs Nano 2011, 5, (6), 4909-18.
175. Tamang, S.; Beaune, G.; Texier, I.; Reiss, P., Aqueous Phase Transfer of InP/ZnS Nanocrystals Conserving Fluorescence and High Colloidal Stability. Acs Nano 2011, 5, (12), 9392-402.
176. Ulery, A. L.; Drees, L. R., Methods of soil analysis. Part 5, Mineralogical methods. Soil Science Society of America: Madison, WI, 2008.

144
Biography
Andreas Gondikas was born in 1981 in Athens, Greece. Mr. Gondikas obtained a
Bachelor and Master of Science in Chemical Engineering at the National Technical
University of Athens (2004), followed by a Masters in Engineering Management at Duke
University, Durham, North Carolina (2005). Mr. Gondikas worked as a project engineer
at MacConnell & Associates, P.C. environmental consulting (2006).
Published work to date includes the following journal articles: Early stage
precipitation kinetics of cysteine‐capped zinc sulfide nanoclusters, Chem. Geol. (2011) in press;
The mechanism of silver nanoparticle toxicity is dependent on dissolved silver and surface
coating in Caenorhabditis elegans, Environ. Sci. & Technol. (2011) in press; Influence of
amino acids cysteine and serine on aggregation kinetics of zinc and mercury sulfide colloids,
Journal of Colloid and Interface Science (2010) 347 pp. 167‐171; Analysis of Size
Characterized Manganese Species from Liver Extracts using Capillary Zone Electrophoresis
coupled to Inductively Coupled Plasma Mass Spectrometry (CZE‐ICP‐MS), Analytica Chimica
Acta (2006) 573‐574 pp. 172‐180.
Mr. Gondikas has received a scholarship from the State Scholarships Foundation
(IKY) in Greece. He received the Jeffrey Taub Engineering Excellence Award in 2006.