the role of students’ perceptions of...
TRANSCRIPT

THE ROLE OF STUDENTS’ PERCEPTIONS OF CLASSROOM CLIMATE IN
PREDICTING ACADEMIC MOTIVATION AND ASSIGNED GRADES IN MIDDLE SCHOOL MATHEMATICS
By
SUSAN E. DAVIS
A THESIS PRESENTED TO THE GRADUATE SCHOOL OF THE UNIVERSITY OF FLORIDA IN PARTIAL FULFILLMENT
OF THE REQUIREMENTS FOR THE DEGREE OF MASTER OF ARTS IN EDUCATION
UNIVERSITY OF FLORIDA
2004

Copyright 2004
by
Susan E. Davis

To my husband, Jack.

ACKNOWLEDGMENTS
I would like to extend my gratitude to Dr. Heather Davis. Dr. Davis contributed to
this project from its inception, providing me with the concepts and data extracted from
her larger study. Her assistance in developing the project, guiding the research process,
teaching me how to manage large data sets, and translating findings into words was
invaluable to me. I would like to express my gratitude to my committee members, Dr.
Tina Smith-Bonahue and Dr. Randall Penfield. Dr. Smith helped me gain focus and
perspective while working on this project. Her advice and editing skills were
indispensable and much appreciated. Dr. Penfield’s guidance throughout the analysis
provided me with greater insight into statistical procedures as well as realizing the
implications of the findings. I would like to extend a special thanks to Dr. Patricia
Ashton who lent her time and attention during my defense. Finally, I would like to thank
my husband, Jack, and son, Jim for their patience and support. They have encouraged me
throughout my education and I could not have achieved so much without their love
behind me
iv
TABLE OF CONTENTS page ACKNOWLEDGMENTS ................................................................................................. iv
LIST OF TABLES............................................................................................................ vii
LIST OF FIGURES ......................................................................................................... viii
ABSTRACT....................................................................................................................... ix
CHAPTER 1 INTRODUCTION ........................................................................................................1
2 REVIEW OF THE LITERATURE ..............................................................................3
Classroom Climate........................................................................................................4 Role of Belongingness in Classroom Climate, Motivation, and Achievement.....5 Contribution of School Climate to Classroom Climate, Achievement, and
Motivation..........................................................................................................6 Teacher Contribution to Classroom Climate, Achievement, and Motivation .......7 Student Contribution to Classroom Climate in Relation to Motivation and
Achievement ....................................................................................................10 Gender Differences in Classroom Climate..........................................................12 Domain Differences in Classroom Climate.........................................................13 Developmental Differences in Classroom Climate .............................................14
Capturing Classroom Climate.....................................................................................15 Summary.....................................................................................................................16 Purpose .......................................................................................................................16
3 METHODOLOGY .....................................................................................................18
Participants .................................................................................................................18 Measures .....................................................................................................................19
Classroom Climate ..............................................................................................19 Motivation ...........................................................................................................20 Grades..................................................................................................................21
Procedures...................................................................................................................21 Analysis ......................................................................................................................22
Creating Composites ...........................................................................................23
v

Statistical Analysis ..............................................................................................23 4 RESULTS...................................................................................................................25
Descriptive Data .........................................................................................................25 Motivation ...........................................................................................................26 Achievement........................................................................................................28
5 DISCUSSION.............................................................................................................31
Perceptions of Classroom Climate and Motivation ....................................................32 Classroom Climate and Achievement ........................................................................33 Implications ................................................................................................................35 Limitations and Future Studies...................................................................................38
APPENDIX REGRESSION EQUATIONS ...................................................................41
LIST OF REFERENCES...................................................................................................48
BIOGRAPHICAL SKETCH .............................................................................................53
vi

LIST OF TABLES
Table page 1 Means and Standard Deviations ...............................................................................25
2 Motivation Full Model. ............................................................................................26
3 Regression for End of Year Motivation : Final Model ...........................................27
4 Regression for Achievement : Initial Model ............................................................28
5 Regression for Achievement : Revised Model.........................................................29
vii

FIGURE
Figure page 1 Baseline Motivation .................................................................................................40
viii

Abstract of Thesis Presented to the Graduate School
of the University of Florida in Partial Fulfillment of the Requirements for the Degree of Master of Arts in Education
THE ROLE OF STUDENTS’ PERCEPTIONS OF CLASSROOM CLIMATE IN PREDICTING ACADEMIC MOTIVATION AND ASSIGNED GRADES IN MIDDLE
SCHOOL MATHEMATICS
By
Susan E. Davis
December 2004
Chair: Tina Smith-Bonahue Major Department: Educational Psychology
The purpose of this study was to determine if middle school math students’
perceptions of classroom climate could predict their end of year academic grade point
averages and reported levels of end of year motivation. Students were asked to rate their
mathematics class on perception of order and organization as well as perception of rule
clarity and fairness of enforcement . Students also rated how much they valued learning
math and how well they expected to perform in the class. Results of this study indicated
students reported a significant decline in motivation in mathematics at the end of the
year. Students who rated classrooms as more orderly and organized tended to achieve
higher grades and report higher levels of end of year motivation. Students who perceived
rule policies as clear and fair reported higher levels of end of year motivation. There were
no effects for rule clarity on grade achievement.
ix

CHAPTER 1 INTRODUCTION
As a first year graduate student, I had the opportunity to work with Dr. Heather
Davis as a research assistant. Dr. Davis had been examining the role of student-teacher
relationships among middle school students. As part of this extensive study, Dr. Davis
collected a wide range of information concerning middle school students, in a
comprehensive effort to understand the many impacting variables on academic success.
Among the variables, were students self-report of values and expectations of academic
success, their perceptions of school climate, classroom climate, and parent and peer
relationships, as well as their perceptions of their relationships with their teachers. By
exploring the values and expectations of the teachers, their perceptions of students’
success, their perception of school climate, and their perceptions of their relationships
with students, this larger study focused on constructing relationship models to explain the
variables impacting student-teacher relationships in middle schools in relation to student
success.
While working with these data sets, Dr, Davis would discuss the data with me and
answer questions I had regarding the implications each of the measures. During these
discussions, I became interested in how these variables impact student performance in
schools. Of greatest interest to me, was the construct of classroom climate. In the past, I
have had teachers and classrooms that remain prominent in my memory of school. Those
teachers made a difference to me, motivating me to out-perform my previous
performances. Along with this unexpected excellence, came the realization that learning
1

2
was worthwhile and satisfying, intrinsically. Because of the memories of those most
prominent experiences, I was driven to wonder what specific qualities figure most
prominently in positive academic experiences. The data collected in this larger study
gave me an opportunity to explore these qualities.
Of the many questions I had, I wanted to understand how classroom variables
affected student outcomes and if these outcomes were measurable in actual grade
achievement. Classrooms that are orderly and organized, in which rules and expectations
are fair and consistent, closely resemble my thoughts on classroom factors that would
facilitate personal growth and academic success. Therefore, I decided to pursue these
constructs of classroom climate. When discussing possibilities with Dr. Davis, she urged
me to consider other factors involved, such as students’ expectations for success and the
value they place on learning and achievement. In order to understand the effects of
classroom climate on achievement, I realized that I would have to factor in and control
for individual levels of motivation. It was then that I wondered if classroom climate
would also affect motivation levels. By using existing data from Dr. Davis’ larger study,
I decided to pursue this topic as well. In researching academic domains correlated with
classroom climate scales, I selected math classes, since traditionally methods of
instruction appeared to rank highest in correlation to the constructs of Order/Organization
and Rule Clarity (Moos & Trickett, 1974). Finally Dr. Davis and I arrived at this study,
which examines the predictive role of classroom climate on achievement and motivation.
CHAPTER 2 REVIEW OF THE LITERATURE
Focus on educational outcomes has increased in the past decade with statewide
high stakes testing and nationwide school accountability programs. In an effort to
improve the academic success of students, it has become necessary to examine all
components of the educational process in order to maximize the effectiveness of
instruction within the classroom. Demonstrated to enhance the learning process and
affect academic outcomes (Kunc, 1992; Osterman, 2000) classroom climate has been
emerging as an important component of education (Haertel, Walberg, & Haertel, 1981).
The purpose of this study is to examine the effects of classroom climate on motivation
and achievement. In order to understand and measure its effects, this study will examine
the roles of the school, the teacher, and the individual student as they contribute to
classroom climate in relation to student motivation and achievement. In examining role
of classroom climate and motivation on academic achievement, this study seeks to
answer two questions. First, if individual levels of motivation are controlled for, will
students who perceive a more positive classroom climate score higher grades than those
with less positive views? Second, if controlling for initial levels of motivation, will
students with more positive perceptions of classroom climate report feeling more
motivated at the end of the year?
In the following sections, this study will define classroom climate and describe the
contributory components comprising classroom climate in relation to motivation and
learning. The contribution of school climate to classroom climate will then be considered
3

4
as it relates to student motivation and achievement. This study will examine how
teachers contribute to classroom climate through their own qualities and experiences
(Crohn, 1983) and how students contribute to classroom climate with personal
characteristics affecting how they interpret classroom climate (Chapin & Eastman, 1996).
Contributions of student motivation to perceptions of classroom climate in relation to
achievement (Alspaugh, 1998) will also be examined. Because individual motivation has
been found to impact achievement, it will be necessary to understand its effects in order
to clarify the roles of motivation and classroom climate on achievement.
Because this study is interested in students’ perceptions of classroom climate on
achievement and motivation for mathematics, possible differences will be considered for
gender, developmental age, and preferences for math. Finally, the impact of perceptions
of classroom climate on achievement and motivation will be examined. In order to
understand the impact of classroom climate, it must be first understood.
Classroom Climate
Wang, Haertel, and Walberg (1993) described classroom climate as encompassing
all the socio-psychological dimensions of classroom life. This included common interest
and the pursuit of common goal achieved through focused, organized and well planned
lessons. The physical arrangement of the classroom furniture, the availability of resource
materials, length of the class period (Chapin & Eastman, 1996), and type and pace of
instruction (Wang et al., 1993) were also considered to influence the climate of the
classroom. In sum, all events and influences within the classroom, including classroom
management, comprised the construct of classroom climate (Gottfredson & Gottfredson,
1989).
5
Classroom climate encompassed the level of task difficulty (Wang et al., 1993),
individual values, and interpersonal relationships (Gottfredson & Gottfredson, 1989).
Review of the literature suggested that individual values and level of task difficulty were
important determinants of student motivation to achieve (Wigfield, 1994). Therefore, in
order to understand the role of classroom climate on student achievement it was
necessary to understand the role of motivation in classroom climate as well as on
academic outcomes.
The next section will review how fundamental needs to belong to a community,
school, and classroom affect perceptions of classroom climate as well as motivation and
achievement.
Role of Belongingness in Classroom Climate, Motivation, and Achievement
Baumeister and Leary (1995) posited that the need to belong is a fundamental
human motivation. Belongingness, or the feeling of relatedness to others, has been
suggested as an influential factor in academic outcomes owing to its importance in
behavioral and socio-emotional development (Deci, Vallerand, Pelletier, & Ryan, 1991).
Belongingness has been correlated with lower rates of emotional distress, drug abuse,
violent behavior, criminal behavior, suicide, and school dropout rates (Battistich & Horn,
1997; Resnick et al., 1997). Deci and colleagues (1991) suggested the need for a sense of
belonging, was so important that not meeting these needs could adversely affect
development, motivation, and performance.
Beyond the community of family and peers, belongingness has been directly linked
to student motivation and engagement within the school (Kunc, 1992; Osterman, 2000).
In a study by Goodenow (1993a) belonging and support was demonstrated as having
significant effects on motivation and achievement in individual subjects. Levels of

6
classroom belonging were significantly associated with motivation-related measures
indicating values for academic classwork and expectancies for success (Goodenow,
1995). Children who reported feeling involved within the school community were more
likely to report a stronger sense of identity, a greater sense of autonomy, a better ability to
self-regulate their behavior, a greater tendency to respect authority, with a lesser
propensity for engaging in deviant or negative behavior (Johnson, Lutzow, Strothoff, &
Zannis, 1995; Kunc, 1992; Osterman, 2000).
While the importance of belongingness has been suggested by many to be critical
to the development of cognitive and emotional process of students, research also showed
that needs for belongingness were largely disregarded by schools (Kunc, 1992; Osterman,
2000). According to Kunc, schools were more likely to believe that the meeting of
emotional needs should or did occur within the home community of family and peers.
Students with unmet or greater needs, therefore, might be less likely to experience
belongingness within the school community.
Because the fundamental need to belong, and how it is promoted in the schools,
effects the climate of the school and the individual students level of motivation for
achievement, the next section will review the effects of school climate as it contributes to
classroom climate, motivation and achievement.
Contribution of School Climate to Classroom Climate, Achievement, and Motivation
The extent to which a school community promotes belongingness has been
demonstrated to affect outcomes in student development, motivation, and achievement
(Kunc, 1992; Osterman, 2000). Studies found that schools rated high in the
encouragement of student interrelationships, providing for feelings of safety and security,
7
attention paid to morale, parent and community involvement, and in structure and
organization reported less drop out rates, higher attendance records, greater levels of
student engagement and motivation, and improved student educational outcomes
(Alspaugh, 1998). Alspaugh suggested the significance of school climate was the degree
to which policies and practices support or endorse these qualities. The relationship
between school climate and student performance and student motivation was strong but
indirect, retaining its influence across grades (Fyans & Maehr, 1987).
Directed by policy and practices, the school community, consisting of teachers,
students, and administrators, along with individual values and expectations, comprise the
school climate. Rather than for their unique style of teaching which may contradict with
the traditions within the school, prospective teachers tended to be hired for their
congruity with school administrators’ expectations (Hamilton, 1983). Therefore, school
climate indirectly affects classroom climate through the adopted policies and practices of
the teachers. Ellis (1996) proposed that these practices were brought into the classroom
and became components of the students’ immediate community, the classroom
environment.
Along with the promotion of school climate, teachers contribute their own personal
characteristics to classroom climate, which impacts student motivation and achievement.
To gain a better understanding of the role of the teacher in relation to motivation and
achievement, the contributions of teacher characteristics will be examined.
Teacher Contribution to Classroom Climate, Achievement, and Motivation
Classroom climate variables involving teacher characteristics have been described
by Chapin and Eastman (1996) as teaching methods, clear goals, and standards,
vocational relevance, and appropriate workload. According to Haertel, Walberg, and

8
Haertel (1981), positive classroom climates enhanced deeper rather than surface learning
approaches. A surface approach to learning or reproductive learning has been described
as reliance on the routine, memorization of materials. These more traditional approaches
to learning allowed the student to recite facts and figures, with little interpretation.
Deeper approaches to learning were those in which the teacher prompts the student to
make connections of the new material with previous knowledge or with different aspects
of that knowledge (Dart, Burnett, & Purdie, 2000). Dart (1998) suggested teachers could
promote deep approaches to learning by creating classroom climates that were safe and
supportive, with ample opportunities for exploration and experimentation. Clear and
structured rules (Keyser & Barling, 1981), predictability and clarity (Anderson, Stevens,
Prawat, & Nickerson, 1987), and teacher support (Osterman, 2000) were also found to
promote deeper, rather than surface, approaches to learning. Additionally, explicit
learning objectives, guided student practice, appropriate instructional pace, frequent
assessment and positive feedback (Wang et al., 1993) with frequent opportunities for
active engagement and participation (Keyser & Barling, 1981) promoted deeper
approaches to learning. These positive classroom climates not only enhanced learning
approaches, they were consistently correlated with higher achievement in a variety of
educational outcomes (Haertel et al., 1981).
Other characteristics found to impact student success were expectations and
behaviors of the teacher (Crohn, 1983) and teacher creativity (Denny & Turner, 1967).
Direct influences, such as the frequency and quality of student-teacher interactions, were
also found to impact student success (Juarez, 2000;Wang et. al., 1993). Jacobson (2000)
suggested that teacher student relationships could promote student motivation and
9
increase students’ values for success through positive rapport and establishing supportive
learning environments. In a study by Goodenow (1993a), teacher support was strongly
correlated with expectancy and values for student success.
While many studies have examined the role of relationships, other studies have
concluded that elements of the instructional style, assignments, and degree of
competitiveness promoted within the classroom were key determinants of educational
outcomes. In a study involving 3rd and 4th grade students, Anderson and colleagues
(1987) demonstrated the importance of the predictability of the task environment.
Among his conclusions, he found learning was enhanced when teachers structured the
classroom environment in a predictable and comprehensible manner. Specifically,
teachers should provide explicit structures of information regarding the predictability, the
consistency and relevance of tasks as well as providing students with a sense of control
over their outcomes (Anderson et. al., 1987). Orderly and organized classrooms allowed
for more emphasis on instruction and less in control, thereby increasing the amount of
time spent on the lessons (Proctor, 1984). Other factors affecting teaching and learning
included appropriate workload, clear goals, and consistent standards (Townsend & Hicks,
1995).
In addition to these elements of classroom environment, the role of interclass
competition was suggested to have an impact on academic success. While in most
studies, a cooperative environment has been shown to enhance educational outcomes
(Fraser, 1986) and attitudes (Zahn, Kagan, & Widaman, 1986), other studies have
suggested that competition, in certain academic areas may, in fact, increase student
productivity and learning ability (Dunn & Harris, 2002).
10
Not only have teacher characteristics been found to contribute to classroom climate,
motivation, and achievement, individual student characteristics have been found to
mediate the effects of classroom climate on achievement and motivation as well. The
next section will be review how the students contribute to classroom climate.
Student Contribution to Classroom Climate in Relation to Motivation and Achievement
Review of the literature suggested each individual brings into the classroom his or
her own personal characteristics as well as previous educational history and experiences.
Some of these characteristics included their sense of well-being, self-efficacy beliefs
(House, 2002; Jackson, 2002), self-concept (Crohn, 1983), sense of belongingness
(Goodenow, 1995; Osterman, 2000), as well as their satisfaction within social activities
(Townsend & Hicks, 1997) and interpersonal relationships (Osterman, 2000).
Just as students may differ in their personal characteristics, such as interest and
knowledge, self-ability, and locus of control, so may their interpretation of the learning
environment, which shapes their approach learning (Chapin & Eastman, 1996). For
example, in a study of classroom motivation, Greene (1983) found classes containing
more motivated students were perceived to have greater involvement, order and
organization, and task orientation. Deci, and collleagues (1991) suggested teachers who
supported active student engagement with mathematical concepts and who promote
personal construction of math ideas may encourage more autonomy and independence in
students, thereby increasing intrinsic interest in math.
Students’ evaluation of their learning environment was found to be guided by their
individual values and expectations for success (Eccles, 1983). Wigfield, and colleagues
(1992) found that as early as the second grade, children have developed values for school

11
activities as well as beliefs about their performance abilities. Although younger children
tended to overestimate their abilities (Winfield, 1994) and engaged in tasks based upon
personal interest, motivation for engagement was recognized early (Wigfield, Eccles, &
Rodriguez, 1994).
Eccles' (1983) model of expectancy-value system assumed that an individual's
belief in, and interpretation of, an event were more influential on his behavior than the
event itself. According to Eccles and colleagues (1983), the value an individual placed
on task engagement related to level of interest, or intrinsic value, how important it was
perceived to be, attainment value, and how useful it was perceived to be, utility value.
They further suggested that the cost of engaging in a task, which excluded engagement in
other, more desirable activities, affected the level of motivation to engage. Additionally,
competency beliefs, or how well one predicts performance level, mediated the motivation
to engage. From this perspective, students with high expectations and values for success
might be more likely to engage in academic tasks with higher motivation to achieve while
students with lower expectations and values for success might be more likely to avoid
academic tasks, which would result in lower achievement.
Likewise, Townsend and Hicks (1997) found students who reported more social
satisfaction reported higher value and lower task cost associated with mathematic and
language curricula. Classroom climates that promoted individual goal setting and
provided choices for students were judged to be more encouraging by middle school
students (Pintrich et al., 1994). Classrooms reporting variations in the use of learning
strategies, valued effort, and fostered positive feelings toward learning were found to be
more successful in promoting mastery of subject material (Ames & Archer, 1987).

12
Perceptions of teacher support were positively associated with instructional techniques
that featured mastery and learning goals (Wentzel, 1995). Other studies found that the
degree to which students’ feel they are cared about mediate academic performance
(Goodenow 1993b; Haertel 1996; Wentzel 1995).
Although individual values and expectations for success were found to impact
students’ motivation and achievement, elements in classroom climate were different for
boys and girls. Goodenow (1993a) found that teacher support was found to have a
stronger association with expectancy and value for girls while boys were more likely to
be influenced by peer support. Because of gender differences in motivation, the next
section will examine the potential gender differences in perceptions of classroom climate.
Gender Differences in Classroom Climate
Gender differences have been found in classroom climate ratings (Townsend &
Hicks, 1995) with girls viewing classroom climate more favorably than boys (Goh &
Fraser, 1995). Girls were more likely to favor a cooperative learning atmosphere (Owens
& Barnes, 1982) in which positive social interactions provided a means of student
support rather than individual competitiveness (Slavin, 1991). Because girls may be
more likely to engage in behavior that is consistent with cooperative learning styles
(Charlesworth & Dzur, 1987), Gardner, Mason, and Matyas (1989) found they were more
likely to benefit from this type of classroom structure than boys. Specifically, in areas of
mathematics and language activities, girls’ outcomes were more affected by climate
factors than boys’, with girls having more success in cooperative goal structured
environments such as language curriculum (Townsend & Hicks, 1997). Because the
domain in which the climate is perceived may mediate successful outcomes in relation to
climate classroom, the effects of domains will be considered in the next section.

13
Domain Differences in Classroom Climate
Fraser (1993) found that classroom environment variables might actually
differentiate among different curricula. Different components of classroom climate were
found to correlate with success in different academic areas (Moos & Trickett, 1994).
Deci, Spiegel, Ryan, Koestner, and Kauffman (1982) suggested teachers who support
active student engagement with mathematical concepts and promote personal
construction of math ideas may encourage more autonomy and independence in students,
thereby increasing intrinsic interest in math. Conversely, a study on the effects of
competition upon mathematical achievement determined that competition actually
enhances learning in areas of math computation, concepts and applications (Dunn &
Harris, 2002). While Dunn and Harris (1998) found no evidence that climate influences
mathematical achievement in 4th grade students, Goh and Fraser (1995) not only found
consistent associations between climate and outcome, but also found that in areas of
mathematics, while boys performed better, girls rated classroom environment more
favorably than boys.
The perception of the learning environment may also affect the quality of
educational outcomes (Dart, 1998; Fraser, 1986). Providing a caring and supportive
environment was determined to be a necessary component in academic success (Juarez,
2000). Positive classroom climates have been associated with higher achievement
outcomes for students in schools rated as having more positive climates than those with
less positive outcomes (Alspaugh, 1998). For high school chemistry students, classroom
climate variables have been accountable for a substantial variance in cognitive and
affective outcomes beyond the characteristics of the student (McRobbie &Fraser, 1993).
Specific variables in classroom climate, such as class activities, instructor skill, and the

14
extent of critical demands were found to mediate academic outcomes for students
(Hoffman, 1979). In studying the effects of domain differences, however, Wigfield and
Eccles, (1992) found these differences change as children grow older. The next section
will examine the possible effects of students’ development in perceptions of classroom
climate.
Developmental Differences in Classroom Climate
While belongingness, family, teacher, and peer support play an important role in an
individual’s values and expectancies, the impact of these supports diminish with age.
Goodenow (1993) discovered a decline in the impact of these factors from 6th grade to 8th
grade and concluded that previous external influences on concepts of these constructs
may begin to be replaced the more internalized concepts and self-efficacy beliefs. Fyans
and Maehr (1987) also reported a shift in influence from family, to school to peer as
children aged from 4th to 10th grade. With older students, academic experiences, such as
prior knowledge, successes, and failures were found to play an important role in their
current perceptions of values for learning as well as how successful they expect to be
(Jacobson, 2000). Jacobson, suggested students with previous success in a subject may
feel more confident and have a higher sense of self-esteem and self-efficacy, which may
support a better expectation of future achievement. Those with negative experiences may
feel devalued, reluctant to participate, with less motivation than their counterparts.
Therefore, while individual motivation plays an important role in achievement, it may be
changeable across grades. These findings suggested the effects of students’ perceptions
of classroom climate might be susceptible to grade level differences. In order to
determine the effects of classroom climate perceptions, however, it must be measurable.
The next section reviews scales designed to measure perceptions of classroom climate.

15
Capturing Classroom Climate
Scales not only differ in terminology, but also on focus, according to the authors’
definition of classroom climate (Fraser, 1979; Moos, 1974). According to Moos (1974),
climate refers to a group phenomenon relating to the social and psychological atmosphere
of any social setting. Within this social climate, there exist four dimensions:
Relationships, Personal Development, System Maintenance, and System Change.
Relationships refer to the type and intensity of relationships and include teacher-student,
student-student, and staff-staff. It reflects the extent to which individuals within the
environment are involved, helpful, and supportive as well as the quality of openness
within the relationships. Personal Development includes competition with emphasis on
academic achievement and describes the basic direction in which personal growth and
self-enhancement tend to occur. System Maintenance includes organization and
orderliness within the classroom. Rule clarity, teacher consistency, and clarity of
expectations are among the factors encompassed in this dimension. System Change
refers to the manner and facility of change within the classroom as well as advocated
variety within activities and creativity in student thinking. From these basic dimensions,
a variety of scales were developed to assess classroom climate. The Classroom
Environment Scale (CES) is one assessment scale, developed by Moos, to assess the
social climate of the classroom environment in grades 7-12 (Moos & Trickett, 1973).
The CES is based upon the four dimensions of climate and focuses on student interest
and participation, interclass room relationships, the measurement of support within the
environment, emphasis on task completion, the degree of task difficulty, the factors of
interclassroom competition, the clarity of rules and expectations, the enforcement of rules
and expectations, as well as how the overall environment is organized and managed. In
16
addition, student contribution to creativity and planning, regarding class activities, is also
considered.
Summary
School communities have been found to exert influence upon the classroom in
addition to the influences of teachers and students. The policies and practices of the
schools have been found to direct how the educational process is addressed within the
classrooms. Within the classrooms, teachers have been found to bring unique perspective
into the learning environment through teaching philosophy as well as student-teacher
interaction. Additionally, each student has been found to enter the classroom with their
own expectations and values, competency beliefs, and learning preferences developed as
a result of their unique experiences. These perspectives may be different for girls versus
boys and may be subject to change in response to academic domain and developmental
age. These findings from the literature suggested in order to measure the effects of
classroom climate on motivation and achievement, it will be necessary to include the
influence of gender and grade differences for this study, as well as students’ self-ratings
of motivation at the beginning of the school year.
Purpose
The purpose of this study is to examine the relationships among classroom climate,
motivation, and achievement. Classroom climate has been described as encompassing all
the socio-psychological dimensions of classroom life (Wang et al., 1993). Students in
this study were asked to rate their perceptions of mathematics classroom as to the degree
of order and organization present in the class as well as how clear and consistent they
perceived the rules to be. Motivation has been described as encompassing the expectancy
of success and the value placed on that attainment (Wigfield & Eccles, 1992). Students

17
were asked to rate their levels of motivation in math class at the beginning and end of the
year. Achievement was measured in end of year in numerical points, ranging from 0 to
100. Because the literature regarding motivation, achievement, and classroom climate
ratings suggested students may vary by gender, age (Fyans & Maehr, 1987; Goodenow,
1993a), and the individual characteristics they bring to the classroom (Biggs, 1993;
Chapin & Eastman, 1996), this study attempted to control for these variables.
In past studies, classroom climate ratings were compared to mean grade
achievement. To date, little or no research has centered on class grades, in relation to
classroom climate ratings. This study will examine the relationship between students’
perception of classroom climate with academic outcomes and end of year motivation in
mathematics. Specifically, this study proposes:
• Students’ higher or more positive ratings of the Order/Organization and Rule Clarity scales of CES (Moos & Trickett, 1973) will predict higher academic outcomes
• Students’ higher or more positive ratings Order/Organization and Rule Clarity scales of CES (Moos & Trickett, 1974) will predict end of year motivation

CHAPTER 3 METHODOLOGY
Participants
Data for this study were collected as part of a larger, school-wide case study in a
rural middle school (Davis, 2001). The middle school was situated in a predominately
agricultural county. Participants included 860 of the 1,100 students in the 6th, 7th, and 8th
grades. Of the 860 students, 425 were boys and 435 were girls. Additionally, 45
teachers, including 28 homeroom teachers, also participated. At each grade level,
students are divided into two teams of five teachers for their core classes of English,
reading, mathematics, social studies and science. Within the larger study, multi-method
data were collected simultaneously throughout the year. Survey data were collected at
four time points from the students and three time points for the teachers over the 1999-
2000 school year.
The purpose of this study is to examine the students’ perception of classroom
climate as it predicts academic outcome in mathematics in 6th, 7th and 8th grade at time
point four, at the end of the school year. Additionally, this study examines the effect of
classroom climate perception as it predicts motivation levels at the end of the academic
year. For this study, 342 students (N= 169 boys, N=173 girls, N= 81 6th grade, N= 135
7th grade, and N=125 8th grade) were selected on the basis of participation across all time
samples.
18
19
Measures
Classroom Climate
The Classroom Environment Scale (CES) was developed by Moos and Trickett
(1973) to assess students’ perceptions of the learning environment in junior and senior
high school classrooms, grades 7-12. The development of the CES was based on the
theory that there are four basic dimensions of social climate: relationships, personal
development, and system maintenance and the physical environment. Each of these
dimensions exerts a directional influence on behavior, for example learning and
achievement in the classroom. System Maintenance measures the extent to which the
environment is organized, orderly and clear in expectations. The System Maintenance
dimension includes the subscales of Rule Clarity and Order and Organization. Rule
clarity measures the degree to which the teacher presents clearly defined classroom rules,
ensures the students’ understanding of these rules, and the consistency with which the
teacher enforces these rules. Order and organization measures the emphasis on students
behaving in and orderly, quiet and polite manner and the overall organization of
classroom activities and assignments.
Data for this study were originally collected as part of a larger study encompassing
the role of social context on students’ motivation, learning, and achievement. Rule
Clarity and Order/Organization were two measures that helped define the properties
involved in student-teacher interactions and relationships (Davis & Davis, under review).
The standard methods of mathematical instruction are generally organized into
presentation then practice of new mathematical concepts in primary and secondary
schools. Because of this widely accepted instructional style, mathematical curriculum is
found to be most highly correlated with these subscales. Therefore, these two dimensions

20
were the focus in the assessment of classroom climate. Classrooms rated high on
organization and clarity has been found to correlate with better educational outcomes.
Therefore, by focusing on these, it may be possible to determine if students’ perceptions
of classroom climate can predict their level of mathematical achievement.
A shortened form of the CES was administered encompassing these two
dimensions, with 10 items measuring the qualities of Order/Organization and 10
measuring the qualities of Rule Clarity. The 20 item survey included questions such as
“The Math teacher is consistent in dealing with students who break the rules” and “Math
is well organized” and was completed across the domain of math as well as the domains
of English, social studies, science, and reading. This study focuses on the classroom
climate assessment of mathematics.
The test-retest reliability of the CES was determined using 52 students within a 6-
week interval. Reliability was reported as .85 for Order and Organization, and .72 for
Rule Clarity (Moos & Trickett, 1994). An internal reliability analysis conducted for each
scale in this study revealed an internal reliability of .80 for System Maintenance, .65 for
Order and Organization, and .74 for Rule Clarity.
Motivation
To measure domain-specific motivations, items were drawn from the self-efficacy
and intrinsic scales of the Motivated Strategies for Learning Questionnaire (MSLQ:
Pintrich & DeGroot, 1990). Items on these scales were developed to evaluate students’
perceived confidence and ability to perform in middle school and junior high school. For
this study, items were slightly altered in order to evaluate domain specific motivations.
Questions such as “I think what we are learning in class is interesting” were changed to
“I think what we are learning in math class is interesting.” In addition, three items were

21
eliminated due to similar wording. Internal consistency estimates for this subscale were
reported at r = .89 (9 items) for the expectancy of success and r = .87 for the value of
academic success (9 items) scales (Pintrich & DeGroot, 1990). Our findings revealed
internal consistency estimates of r = .83 for expectations of success (8 items) and r = .82
for value of success (7 items).
Grades
Grades were measured by numerical points, scored 0 through 100, assigned to the
students at the end of the year for mathematics. All grade data were collected at the
completion of the study.
Procedures
Passive parental consent for survey participation was obtained for initial
recruitment of each student. After notifying parents of the nature of the school-wide
project, the purpose of the study, and the types of questions to be asked, parents were
asked to respond only if they did not want their child to participate. Assent was also
obtained from each student.
Students were asked to complete surveys in class at four time points throughout the
school year (time 1 = beginning of year, time 2 = midpoint of year, time 3 = early spring,
time 4 = end of year). All survey items were rated on a 5-point Likert scale ranging from
1-Never true to 5-Always true. Students were allowed to complete the surveys at their
own pace, with make up sessions arranged for those students who were unable to
complete the surveys during class or students who were not present during the original
administration times. For this study, time point 1, beginning of the year, and time point
2, end of the year, were considered.

22
The CES (Moos& Trickett, 1973) abridged form measuring students’ perception of
classroom climate on the System Maintenance and Change dimensions was administered
during class at time 3, in the early spring. Data for motivation were collected at time 1,
for the dependent variable motivation 1, at the beginning of the school year. Data for end
of year motivation were collected at time 4, for the dependent variable motivation 3.
Data on the students’ grades were collected at the end of the year.
Analysis
Data from Classroom Climate (Moos & Trickett, 1973) scales were entered into a
text file and imported to SPSS (10.0 for Windows). An integrity check was performed to
ensure the accuracy of the data. In order to address unavailable data, a correlational
relationship was established among each item with all other items within the same grade
level and domain. Each item was then examined to compare the strongest correlation of
inner-item ratings. For example, ratings for item 1 might be strongest for items 5, 9, 15,
and 17 within the 6th grade math surveys. These four strongest correlations were summed
and averaged to produce a predicted value for the missing response. Owing to the
strength of the correlation selected, these values were considered the best estimate with
greater predictability for individual item response. Because unavailable responses were
rare, these imputed values were not anticipated to affect the overall outcome of the items
rated.
Data files were sorted by descending order using the student identification number
with the order of variables listed in the same sort sequence. Initially, data for climate,
motivation, and grades were entered into imputed files. Data were merged by
identification number per each domain, matching cases listwise. In rare instances, cases
with duplicate numbers were identified and cross referenced with their original hard

23
copy, corrected, and re-entered. Cases that did not have matching cases in the other files
were excluded from analysis (e.g. listwise deletion). Once the files were merged, data for
math domain were selected for the purpose of this analysis.
Creating Composites
In order to maintain consistent direction of response analysis, items whose wording
reflected an opposite direction of strength in perception of quality rating were reverse
coded. For example, item 8 on the classroom climate scale asks Math hardly ever starts
on time. Students responding with a 1 indicate that they always disagree; therefore, the
response reflects that math always starts on time. Items such as these were recoded to
represent “one” to reflect a strong absence of the quality being perceived and “five” to
indicate a strong presence of the quality being perceived. Data for motivation were
entered using the same procedure. The actual grade point averages, collected at the end
of the year, were entered into an SPSS file for each participant.
Observations with multiple omissions across all three measures were excluded.
Coefficient alpha was used as an estimate of reliability. For the System Maintenance
scale, the value equaled .80, and for Order/Organization, the value equaled .74.
Using frequency and descriptive statistics, composite data were screened for
missing values, normality, and outliers. A composite score was computed for each
subscale to create variables for Order/Organization and Rule Clarity by averaging scores
across items.
Statistical Analysis
The independent variable, classroom climate, was examined in relation to the
dependent variable of achievement and motivation. A univariate analysis of variance
between subjects was run on the classroom climate subscales to evaluate homogeneity of
24
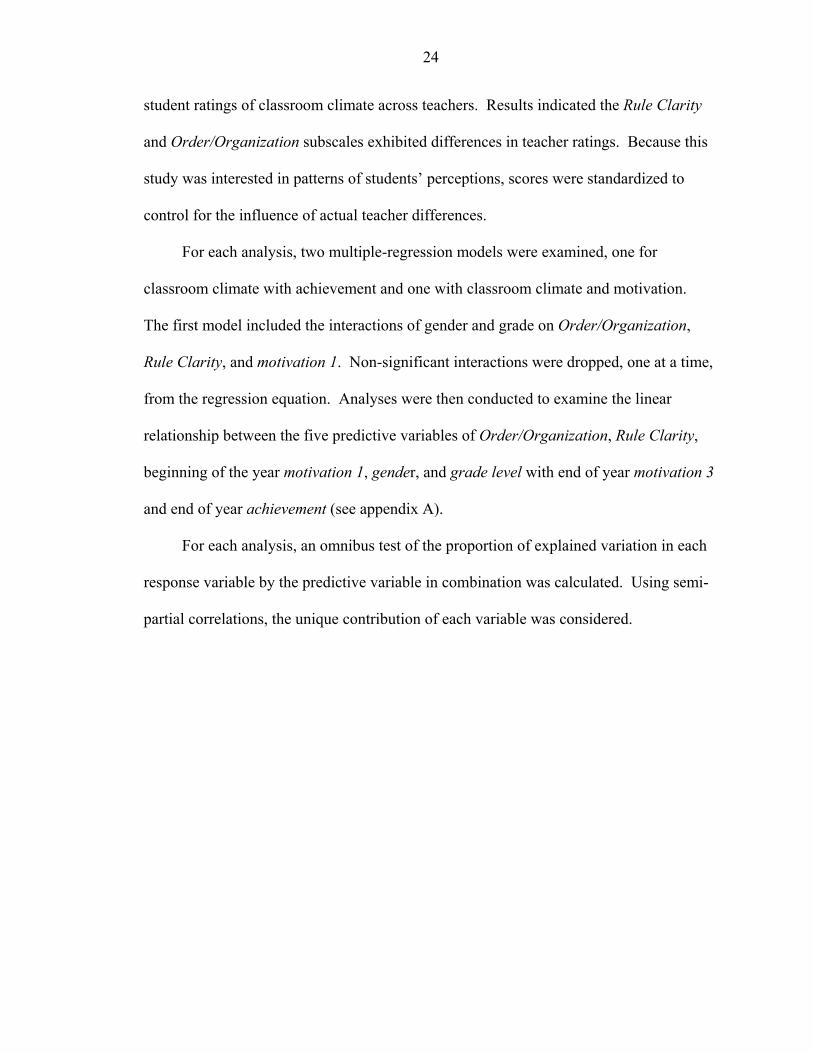
student ratings of classroom climate across teachers. Results indicated the Rule Clarity
and Order/Organization subscales exhibited differences in teacher ratings. Because this
study was interested in patterns of students’ perceptions, scores were standardized to
control for the influence of actual teacher differences.
For each analysis, two multiple-regression models were examined, one for
classroom climate with achievement and one with classroom climate and motivation.
The first model included the interactions of gender and grade on Order/Organization,
Rule Clarity, and motivation 1. Non-significant interactions were dropped, one at a time,
from the regression equation. Analyses were then conducted to examine the linear
relationship between the five predictive variables of Order/Organization, Rule Clarity,
beginning of the year motivation 1, gender, and grade level with end of year motivation 3
and end of year achievement (see appendix A).
For each analysis, an omnibus test of the proportion of explained variation in each
response variable by the predictive variable in combination was calculated. Using semi-
partial correlations, the unique contribution of each variable was considered.

CHAPTER 4 RESULTS
Descriptive Data
The purpose of this study was to examine the relationships between students’
perceptions of classroom climate with end of year motivation in mathematics and
students’ perceptions of classroom climate with academic outcomes in mathematics. By
controlling for student ratings of motivation at the beginning of the year, as well as
gender and grade differences, this study proposed:
• Higher ratings of Order/Organization and Rule Clarity scales of the CES (Moos & Trickett, 1973) will correlate positively with higher academic outcomes.
• Higher ratings of Order/Organization and Rule Clarity scales of the CES (Moos & Trickett, 1973) will correlate positively with higher ratings for end of year motivation.
Table 1. Means and Standard Deviations 6th grade 7th grade 8th grade
Total Boys Girls Boys Girls Boys Girls End of Year Motivation
3.94 (.70)
4.01 (.61)
3.76 (.73)
3.65 (.83)
3.46 (.75)
3.58 3.70 (.68) (.75)
End of Year Achievement
85.07 (7.28)
87.08 (7.26)
85.16 (9.77)
86.41 (8.41)
75.89 (13.74)
84.30 83.78 (13.16) (11.16)
Perception of Classroom Order/Organization
2.93 (.45)
3.00 (.49)
3.09 (.51)
2.97 (.56)
2.82 (.67)
3.03 2.97 (.54) (.57)
Perception of Classroom Rule Clarity
3.27 (.57)
3.45 (.58)
1.56 (1.88)
1.46 (1.74)
3.12 (.71)
3.28 2.57 (.69) (1.51)
Baseline Motivation 4.05 (.49)
4.09 (.68)
3.96 (.74)
3.82 (.77)
3.54 (.84)
3.82 3.85 (.64) (.73)
N=45 N=36 N=61 N=74 N=62 N=63
N=341
25

26
Motivation
Regarding motivation, this study proposed students’ higher ratings of
Order/Organization and Rule Clarity scales of the CES (Moos & Trickett, 1973) would
positively correlate with higher self- reported ratings of end of year motivation for
mathematics. Data analysis began by testing a full model in Time 1 (baseline) by gender
and grade level.
Table 2 displays findings based on the initial model run. This model accounted for
35.8 % of the variance (F(342.9) = 16.75, p<.000). Table 2 demonstrates interaction of rule
clarity by grade to be significant. To teat for interaction effects, post hoc analysis using
multiple regression, revealed the effects to be non-significant. Interactions were dropped,
yielding a revised model for predicting end of year motivation.
Table 2. Motivation Full Model. Model B t value p value r R F p
End of Year Motivation .599 .358 16.75 .000
Perception of Classroom Order/Organization
0.236 3.474 0.001*
Perception of Classroom Rule Clarity
0.104 2.238 0.026*
Gender -0.112 -0.343 0.732
Grade 0.241 0.649 0.517
Baseline Motivation 0.360 5.135 0.000*
Gender/Order Interaction -0.415 -1.355 0.176
Gender/Rule Interaction -0.046 -0.190 0.849
Gender/Motivation Interaction -0.157 -0.483 0.629
Grade/Order Interaction -0.294 -0.930 0.353
Grade/Rule Interaction 0.573 2.135 0.034*
Grade/Motivation Interaction 0.069 0.238 0.812
Note. * Denotes significant difference at p < .05

27
The final model for end of year motivation in table 3 explained 35 % of the
variance in end of year motivation (F(342,5) = 30.10, p<.000) .
Table 3 Regression for End of Year Motivation : Final Model
Model
B t value p value r R F p
End of Year Motivation .592 .350 30.102 .000
Perception of Classroom Order/Organization
0.153 3.278 0.001*
Perception of Classroom Rule Clarity 0.095 2.116 0.035*
Gender -0.450 -1.889 0.060
Grade -0.136 -3.009 0.003*
Baseline Motivation 0.376 5.865 0.000*
Gender/Baseline Motivation Interaction 0.459 1.886 0.060
Note. * denotes significance at p < .05 Note. Gender differences approach significance
As anticipated, a significant positive relationship was also found between end of year
motivation and students’ ratings of perceptions of classroom Rule Clarity, perceptions of
classroom Order/Organization. These findings suggested students who perceived their
classroom as more orderly and organized with fair and explicit rules tended to report
higher levels of motivation at the end of the year.
Differences by gender and baseline motivation approached significance (p = .06)
When comparing gender, these findings suggested boys may have somewhat lower
competency beliefs and/or value math less at the beginning of the school year than girls.
Differences by gender and end of year motivation approached significance ( p=.06) with
girls reporting higher levels of motivation at the end of the year when comparing across
grades. However, when comparing all the boys’ and girls’ ratings of motivation in
middle school mathematics, overall, there were no significant differences (Figure 1).

28
Lastly, findings revealed significant differences in end of year motivation based on
grade level suggesting students report different levels of motivation across the 6th, 7th, and
8th grades. Students in 6th grade reported the highest levels for motivation in mathematics
while the 8th grade students reported the lowest level of end of year motivation towards
math. This finding supports earlier research that, although values and expectations for
math remain constant in relative to rankings of other domain in terms of importance and
usefulness, such as reading and English, motivation towards mathematics decline as
children grows older (Wigfield et al., 1994).
Achievement
Regarding achievement, this study proposed students’ higher or more positive
ratings of the Order/Organization and Rule Clarity subscales of the CES (Moos &
Trickett, 1973) would predict higher academic achievement in mathematics at the end of
the school year. Data analysis began by testing a full model in Time 1 (baseline) by
gender and grade level. Table 4 displays findings based on the initial model run.
Table 4 Regression for Achievement : Initial Model Model B t value p value r R F p End of Year Achievement 0.442 0.196 8.866 0.000
Perception of Classroom Order/Organization
0.172 2.608 0.009*
Perception of Classroom Rule Clarity
0.089 1.885 0.060
Gender 0.338 1.032 0.303 Grade -0.685 -1.877 0.061 Baseline Motivation 0.202 2.912 0.004* Gender/Order Interaction -0.149 -0.495 0.621 Gender/Rule Interaction -0.036 -0.148 0.882 Gender/Motivation Interaction 0.002 0.007 0.995 Grade/Order Interaction 0.291 0.936 0.350 Grade/Rule Interaction -0.082 -0.263 0.792 Grade/Motivation Interaction 0.328 1.142 0.254
Note. * denotes significance at p < .05 Note. Grade differences approach significance
This model accounted for 19.6% of the variance (F(342,10) = .8.9, p<.000). Post hoc
analysis tests for interaction using multiple regression, dropping each interaction, one at a

29
time, revealed the effects to be non-significant. Interactions were dropped, yielding a
revised model for predicting end of year motivation. The final model predicting end of
year motivation, gender, math grades, and baseline motivation with perceptions of
Order/Organization, Rule Clarity is presented in Table 5.
Table 5 Regression for Achievement : Revised Model Model B t
value p value
r R F p
End of Year Achievement .433 .188 18.836 .000Perception of Order/Organization 0.168 3.533 0.000* Perception of Rule Clarity 0.079 1.756 0.080 Gender 0.221 4.548 0.000* Grade 0.168 3.754 0.000* Baseline Motivation 0.151 3.312 0.001*
Note. * denotes significance at p < .05
This model explained 16.8 % of the variance (F(342,4) = 18.8, p<.000). Findings
indicate a significant positive relationship between achievement and students’ ratings of
Order/Organization. Students who perceived the classroom as more structured and
organized tended to earn higher grades than students who did not.
A significant negative relationship was found between baseline motivation and
achievement. These findings suggested the students who reported lower levels of
motivation for math at the beginning of the school year achieved higher grades than those
who did not. However, student levels of motivation decline when comparing across
grades while achievement improves. When comparing 6th grade students to 8th grade
students, motivation levels tend to decline and achievement in mathematics increases.
Therefore, when combining grade levels, these findings may suggest the overall rate of
decline in motivation is greater than the overall rate of increase in achievement. .
However, this study did not address the level of achievement and motivation across
grades. The negative relationship is not expected for within grade comparisons
30
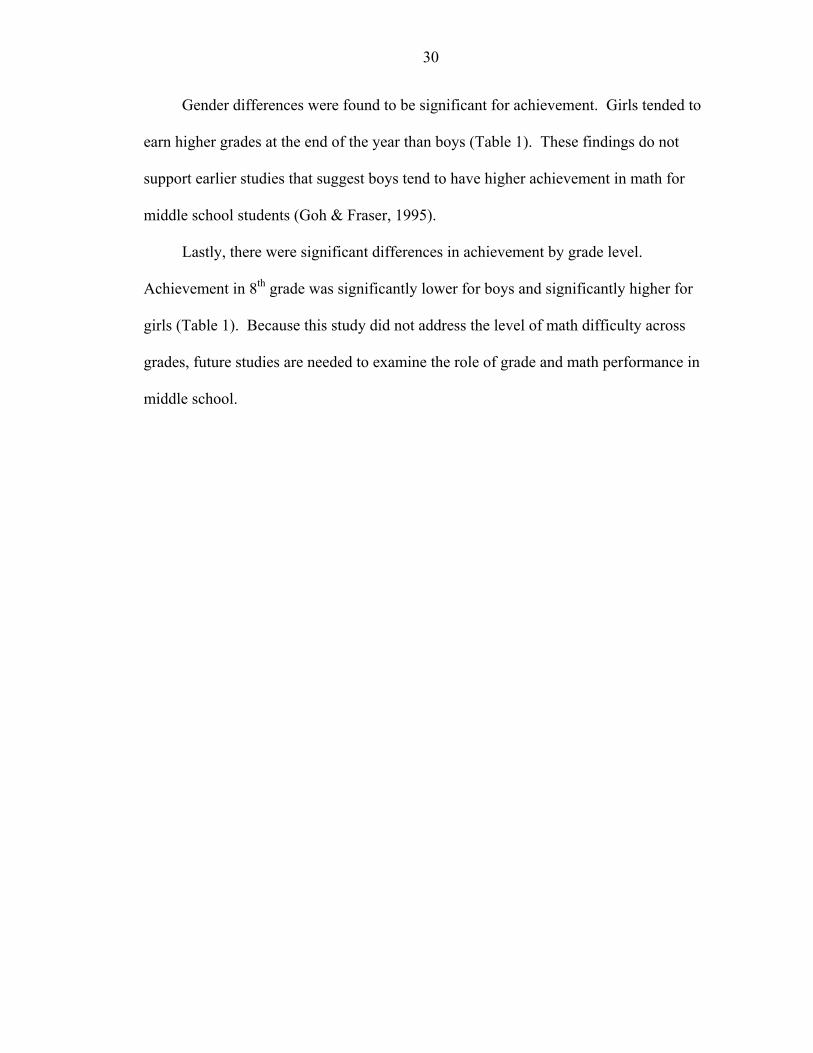
Gender differences were found to be significant for achievement. Girls tended to
earn higher grades at the end of the year than boys (Table 1). These findings do not
support earlier studies that suggest boys tend to have higher achievement in math for
middle school students (Goh & Fraser, 1995).
Lastly, there were significant differences in achievement by grade level.
Achievement in 8th grade was significantly lower for boys and significantly higher for
girls (Table 1). Because this study did not address the level of math difficulty across
grades, future studies are needed to examine the role of grade and math performance in
middle school.

CHAPTER 5 DISCUSSION
The purpose of this study was to examine the relationships among classroom
climate, motivation, and achievement. Classroom climate has been described as
encompassing all the socio-psychological dimensions of classroom life (Wang et.al.
1993). Students in this study were asked to rate their perceptions of mathematics
classroom as to the degree of order and organization present in the class as well as how
clear and consistent they perceived the rules to be. Motivation is described as
encompassing the expectancy of success and the value placed on that attainment
(Wigfield & Eccles, 1992). Students were asked to rate their levels of motivation in math
class at the beginning and end of the year. Achievement was measured at end of year in
numerical points, ranging from 0 to 100. Because the literature regarding motivation,
achievement, and classroom climate ratings suggest students may vary by gender, age
(Fyans & Maehr, 1987; Goodenow, 1993a), and the individual characteristics they bring
to the classroom (Biggs, 1993; Chapin & Eastman, 1996;), this study attempted to control
for these variables.
This chapter presents a discussion and interpretation of the results of the study as
they relate to previous findings in the area of classroom climate and motivation, as well
as the research questions and hypotheses. It also addresses the implications of the
findings. The chapter concludes with a discussion of future directions for research and
limitations of the current study.
31
32
Perceptions of Classroom Climate and Motivation
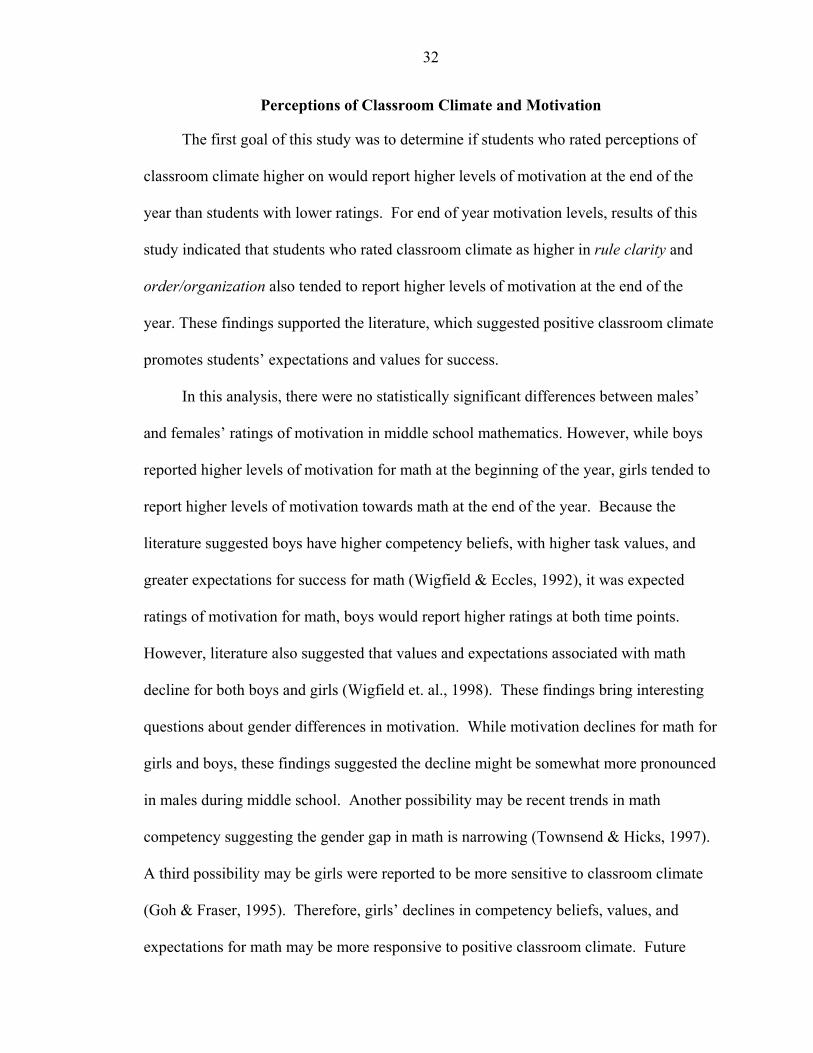
The first goal of this study was to determine if students who rated perceptions of
classroom climate higher on would report higher levels of motivation at the end of the
year than students with lower ratings. For end of year motivation levels, results of this
study indicated that students who rated classroom climate as higher in rule clarity and
order/organization also tended to report higher levels of motivation at the end of the
year. These findings supported the literature, which suggested positive classroom climate
promotes students’ expectations and values for success.
In this analysis, there were no statistically significant differences between males’
and females’ ratings of motivation in middle school mathematics. However, while boys
reported higher levels of motivation for math at the beginning of the year, girls tended to
report higher levels of motivation towards math at the end of the year. Because the
literature suggested boys have higher competency beliefs, with higher task values, and
greater expectations for success for math (Wigfield & Eccles, 1992), it was expected
ratings of motivation for math, boys would report higher ratings at both time points.
However, literature also suggested that values and expectations associated with math
decline for both boys and girls (Wigfield et. al., 1998). These findings bring interesting
questions about gender differences in motivation. While motivation declines for math for
girls and boys, these findings suggested the decline might be somewhat more pronounced
in males during middle school. Another possibility may be recent trends in math
competency suggesting the gender gap in math is narrowing (Townsend & Hicks, 1997).
A third possibility may be girls were reported to be more sensitive to classroom climate
(Goh & Fraser, 1995). Therefore, girls’ declines in competency beliefs, values, and
expectations for math may be more responsive to positive classroom climate. Future

33
studies may wish to address the differential role of gender and motivation as it pertains to
middle school mathematics.
Early motivation, as anticipated, was a significant factor in end of year motivation
levels for girls and boys across grades. Findings revealed students who entered the
classroom with higher expectations and values for success in math reported higher
expectations and values for success in math at the end of the year than those who did not.
There were also grade differences in ratings of motivation. In all grades, students
who perceived their mathematics class as more orderly and organized tended to achieve
higher than those who did not. However, while 6th grade students’ perception of rule
clarity and fairness did not affect their self-ratings of motivation at the end of the year,
students in the higher-grade levels, who rated higher levels of both the Rule Clarity and
Order/Organization factors of classroom climate, expressed higher levels of motivation
at the end of the year.
Classroom Climate and Achievement
This second goal of this study was to determine whether students who rated
perceptions of classroom climate higher on subscales of Order/Organization and Rule
Clarity would achieve higher grades than students with lower ratings. Results of this
study indicated in middle school mathematics, students who perceived the classroom, as
being more orderly and organized tended to earn higher grades than students who did not.
These findings support earlier findings by Williams and Somers (2001), in which the
orderliness of the classroom contributed significantly to test scores in mathematics and
language. Overall, students’ perceptions of Rule Clarity, in which the rules are clearly
defined and fairly executed, were not a significant factor in terms of predicting math
achievement. These findings suggest that students’ perform better in math with a

34
classroom that is structured with organized lessons. However, students’ perceptions of
the fairness of rules, how clearly and defined they are, do not predict higher achievement.
Middle school students’ experiences are reported to become less intimate and more
anonymous than elementary school. Eccles, Midgely, and Adler (1984) suggested middle
schools to be larger and more impersonal. Therefore, these results suggested students in
middle school may be unaware of teacher bias in the enforcement of rules or did not
perceive them to be an important component of their individual success.
Findings revealed a negative relationship of students’ early ratings of motivation
for math achievement. These findings indicated students entering the classroom with
higher expectations and values for success for math earned lower grades at the end of the
year.
Gender was a factor in achievement, with girls earning higher grades in math than
boys. Literature has suggested girls are more sensitive to classroom climate scales and
tend to yield higher ratings while males perform better in climates that are more orderly
and organized (Goh & Fraser, 1995). Results from this indicated no significant gender
differences for ratings of classroom climate but did indicate higher achievement for
females over males in end of year math achievement. These results do not support earlier
findings which indicated boys have higher achievement in math (Townsend & Hicks,
1997). Reasons for these differences were considered to be a result of declines in
motivation for math (Wigfield, & Eccles, 1992), social attitudes reflecting math as a
nontraditional female domain, or classroom bias in the promotion of math achievement
for girls. One reason for higher achievement for girls in middle school may be a
reflection of the change in social values for math. Recent trends in research suggested

35
the gap in gender differences for math achievement might be narrowing. Another
possibility for gender differences in math achievement may be due to girls’ sensitivity to
classroom climate, which was observed in this study with the increase in girls’ motivation
for math at the end of the year. Therefore, while in this study, girls and boys were
analogous in their perceptions of rule clarity and order/organization, achievement for
girls may be more positively effected by positive classroom climates.
Findings did show a difference in middle school students’ achievement as they
progress to grade levels. These results suggested that students tended to achieve higher
grades as they achieved higher-grade levels. One possibility may be students entering
middle school tended to have lower performances across domains. Students in the sixth
grade were prone to declines in school engagement in a study by Simons-Morton and
Crump, (2003). While declines may be influenced by the transition to middle school
(Eccles et al., 1993), academic performances were demonstrated to rebound, improving
as students’ adjusted to their new environment and rose to higher grade levels (Wigfield,
Eccles, &Rodriguez, 1998). Because this study did not address differences in math
curriculum, reasons for improvement in achievement by grade level might be addressed
in future studies.
Implications
In past decades, classroom climate has been established as a salient aspect of
student learning and well- being. The construct of classroom climate has been considered
a critical factor in students’ emotional and intellectual development. Gottfredson and
Gottfredson (1989) explored the positive influential role of safety, morale, personal
security, and classroom orderliness on academic performance, attendance, and dropout
rates among elementary, middle, and high schools. Studies indicated that establishing a
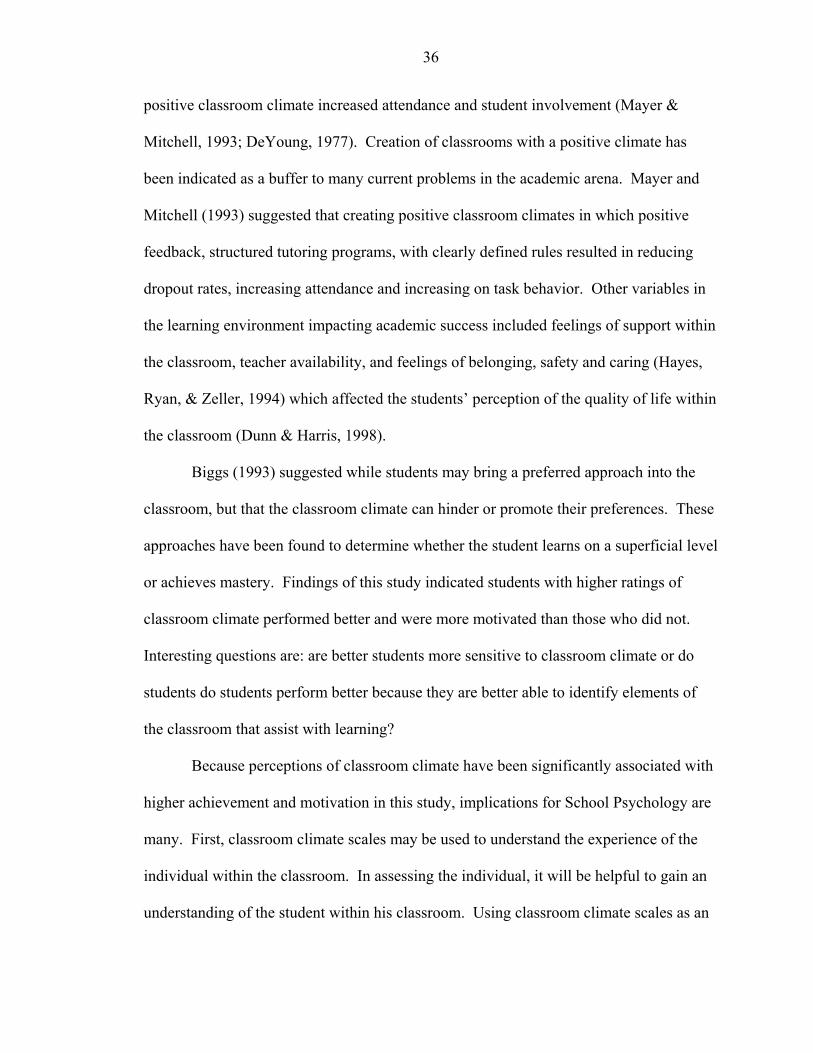
36
positive classroom climate increased attendance and student involvement (Mayer &
Mitchell, 1993; DeYoung, 1977). Creation of classrooms with a positive climate has
been indicated as a buffer to many current problems in the academic arena. Mayer and
Mitchell (1993) suggested that creating positive classroom climates in which positive
feedback, structured tutoring programs, with clearly defined rules resulted in reducing
dropout rates, increasing attendance and increasing on task behavior. Other variables in
the learning environment impacting academic success included feelings of support within
the classroom, teacher availability, and feelings of belonging, safety and caring (Hayes,
Ryan, & Zeller, 1994) which affected the students’ perception of the quality of life within
the classroom (Dunn & Harris, 1998).
Biggs (1993) suggested while students may bring a preferred approach into the
classroom, but that the classroom climate can hinder or promote their preferences. These
approaches have been found to determine whether the student learns on a superficial level
or achieves mastery. Findings of this study indicated students with higher ratings of
classroom climate performed better and were more motivated than those who did not.
Interesting questions are: are better students more sensitive to classroom climate or do
students do students perform better because they are better able to identify elements of
the classroom that assist with learning?
Because perceptions of classroom climate have been significantly associated with
higher achievement and motivation in this study, implications for School Psychology are
many. First, classroom climate scales may be used to understand the experience of the
individual within the classroom. In assessing the individual, it will be helpful to gain an
understanding of the student within his classroom. Using classroom climate scales as an
37
assessment tool provides an opportunity to assess students’ perception these experiences.
Using these results may help design better interventions within the classroom to improve
students’ achievement outcomes. Additionally, just as children may be explicitly trained
in social skills to recognize social cues, students at risk for academic failure may benefit
with explicit training in recognizing classroom supports that may be obscure to students
with low ratings of classroom climate. Students’ with lower ratings may then be able to
benefit from positive classroom climates.
Second, because the positive effects of classroom climate have been demonstrated
in this study to be related to students’ achievement and motivation, teachers may find
having structured and organized lesson plans, with fair and consistent enforcement of
rules may improve student learning. With current emphasis on accountability for
teachers regarding students’ educational success, teachers may find that promoting a
positive classroom climate will increase productivity through high student motivation and
improve academic grades through enhanced student learning. Additionally, teachers who
implement classroom practices designed to promote a positive classroom climate may use
the climate assessment as a means of assessing the success of the programs or as a means
of facilitating changes within the classroom.
Finally, the assessment of perceptions in classroom climate may help understand
the changes in students’ perceptions of their educational experiences. For example, in
this study, students’ perceptions of Order/Organization were associated with higher
motivation and higher achievement. Rule clarity, however, was associated with higher
motivation but did not effect achievement. Closer examination of the data revealed
differences in effects of rule clarity on achievement for different grade levels. These
38
results indicated developmental differences in the effects of classroom climate. By
assessing classroom climate as a means of understanding developmental change, a greater
understanding of students’ needs within the classroom may be achieved in order to
improve academic outcomes.
Limitations and Future Studies
Findings of this study revealed perceptions of classroom climate to be
significantly associated with higher achievement and higher motivation levels in middle
school mathematics students. Because this study involved a large sample of middle
school students, findings may generalize to other middle school students. Additionally,
because this study controlled for gender, grade level and initial levels of motivation, the
impact of classroom climate on achievement and end of year motivation may be more
clearly indicated. Therefore, although students’ enter the classroom with values and
expectations for success in mathematics, the classroom experience relating to positive
classroom climates may be important for student success.
Although the sample for this study was large, a limitation of this study might be
the sample was taken from a predominantly white, rural middle school. Research has
demonstrated the effects of positive classroom climates in rural middle schools were
analogous to racially mixed urban middle schools. However, future studies may wish to
replicate these findings to determine if actual grade achievement and motivation levels
can be predicted by classroom climate in urban schools.
Another limitation was the focus of this research, which did not include
perceptions and ratings from other academic domains. Findings in this study may not
generalize to domains where subscales of classroom climate of Rule Clarity and
Order/Organization are not highly correlated. Research has indicated positive effects for
39
classroom climates rated high on scales of Order/Organization and rule clarity in all
domains (Juarez, 2000). However, future studies may wish to replicate the predictive
role of classroom climate on achievement and motivation in other domains.
A final limitation in the focus of this study was it sought to examine the predictive
quality of positive classroom climate for middle school students. Because findings
indicated different effects of ratings of Rule Clarity for 6th grade, future studies may wish
to examine classroom climate for each grade, separately, to determine if the effects of
classroom climate are stable across grade level.
Future studies are needed to determine the predictive effects of positive classroom
climate as it pertains to individual student achievement and self-ratings of motivation in
elementary schools. Because initial levels of motivation are found to be associated with
previous classroom experiences, promoting positive classroom climates early may help
students develop higher motivation for academic engagement. Additionally,
understanding the role of classroom climate may facilitate changes within the classroom
that promote learning mastery. With the current emphasis on educational accountability,
higher achievement outcomes associated with positive classroom climates are promising.

40
Gender Differences in Motivation
-0.8
-0.6
-0.4
-0.2
0
0.2
0.4
0.6
0.8
1
1 2 3
End of Year Motivation
Bas
elin
e M
otiv
atio
n
girlsboys
Figure 1. Baseline Motivation
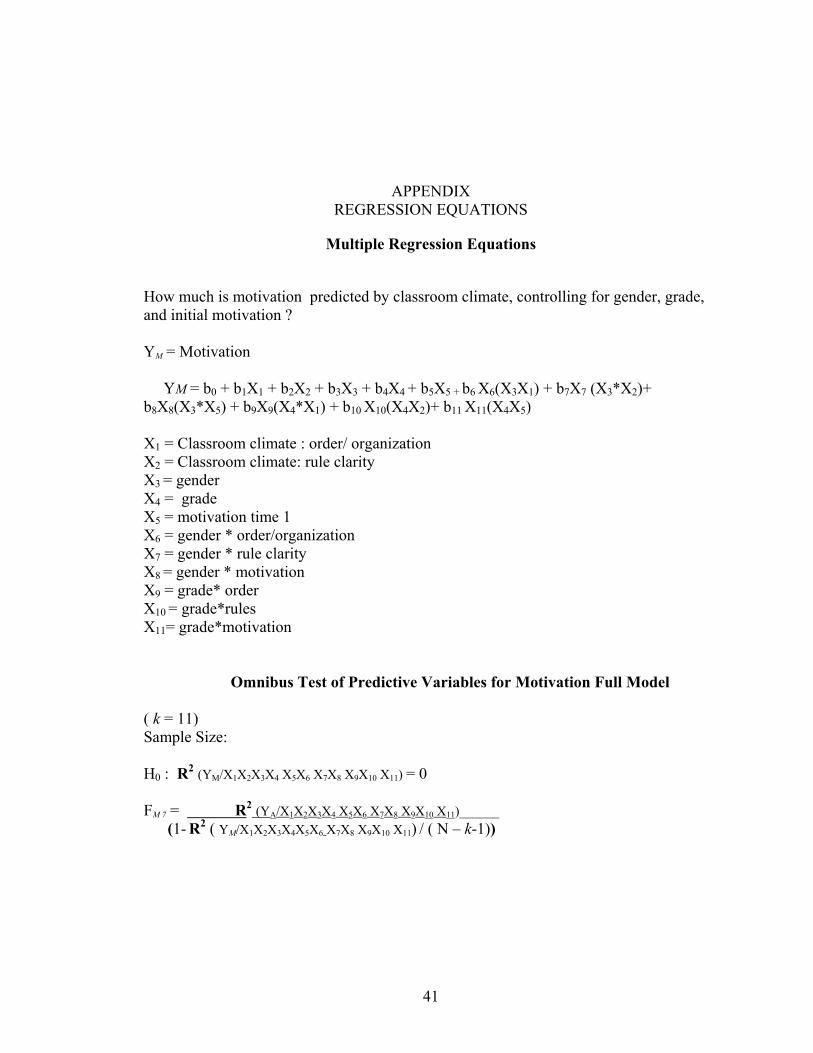
APPENDIX REGRESSION EQUATIONS
Multiple Regression Equations
How much is motivation predicted by classroom climate, controlling for gender, grade, and initial motivation ? YM = Motivation YM = b0 + b1X1 + b2X2 + b3X3 + b4X4 + b5X5 + b6 X6(X3X1) + b7X7 (X3*X2)+ b8X8(X3*X5) + b9X9(X4*X1) + b10 X10(X4X2)+ b11 X11(X4X5) X1 = Classroom climate : order/ organization X2 = Classroom climate: rule clarity X3 = gender X4 = grade X5 = motivation time 1 X6 = gender * order/organization X7 = gender * rule clarity X8 = gender * motivation X9 = grade* order X10 = grade*rules X11= grade*motivation
Omnibus Test of Predictive Variables for Motivation Full Model
( k = 11) Sample Size: H0 : R2 (YM/X1X2X3X4 X5X6 X7X8 X9X10 X11) = 0 FM 7 = R2 (YA/X1X2X3X4 X5X6 X7X8 X9X10 X11)______ (1- R2 ( YM/X1X2X3X4X5X6 X7X8 X9X10 X11) / ( N – k-1))
41

42
Tests of Interaction
H0 : R2 (YM/X1X2X3X4 X5X6 X7X8 X9X10 X11) = 0 FM = R2 (Ym/X1X2X3X4 X5X6 X7X8 X9X10 X11)______
(1- R2 ( YM/X1X2X3X4X5X6 X7X8 X9X10 X11) / ( N – k-1)) H0 : R2 (YM/X1X2X3X4 X5X6 X7X8 X9X10) = 0 FM = R2 (Ym/X1X2X3X4 X5X6 X7X8 X9X10 )______
(2- R2 ( YM/X1X2X3X4X5X6 X7X8 X9X10 ) / ( N – k-1)) H0 : R2 (YM/X1X2X3X4 X5X6 X7X8 X9 X11) = 0 FM = R2 (YA/X1X2X3X4 X5X6 X7X8 X9 X11)______
(1- R2 ( YM/X1X2X3X4X5X6 X7X8 X9 X11) / ( N – k-1)) H0 : R2 (YM/X1X2X3X4 X5X6 X7X8 X10 X11) = 0 FM = R2 (Ym/X1X2X3X4 X5X6 X7X8 X10 X11)______
(3- R2 ( YM/X1X2X3X4X5X6 X7X8 X10 X11) / ( N – k-1)) H0 : R2 (YM/X1X2X3X4 X5X6 X7 X9X10 X11) = 0 FM = R2 (Ym/X1X2X3X4 X5X6 X7 X9X10 X11)______
(4- R2 ( YM/X1X2X3X4X5X6 X7X8 X9X10 X11) / ( N – k-1)) H0 : R2 (YM/X1X2X3X4 X5X6 X8 X9X10 X11) = 0 FM = R2 (Ym/X1X2X3X4 X5X6 X8 X9X10 X11)______
(5- R2 ( YM/X1X2X3X4X5X6 X8 X9X10 X11) / ( N – k-1)) H0 : R2 (YM/X1X2X3X4 X5 X7X8 X9X10 X11) = 0 FM = R2 (Ym/X1X2X3X4 X5 X7X8 X9X10 X11)______
(6- R2 ( YM/X1X2X3X4X5 X7X8 X9X10 X11) / ( N – k-1))
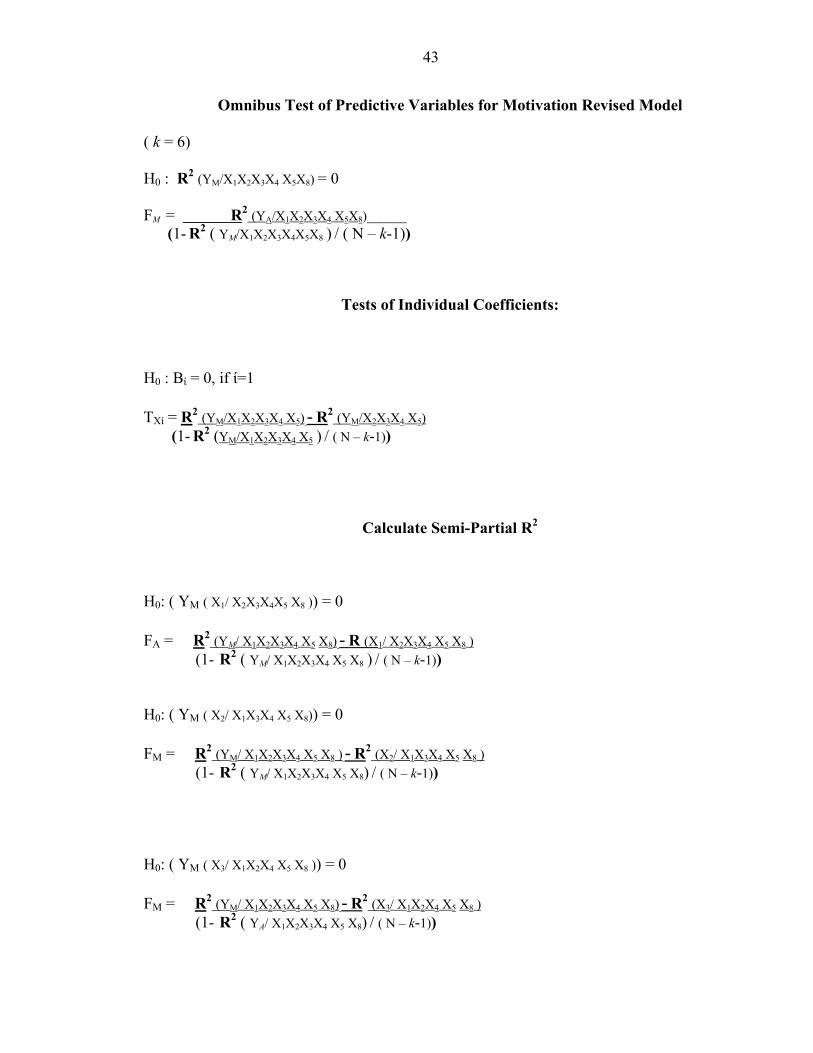
43
Omnibus Test of Predictive Variables for Motivation Revised Model
( k = 6) H0 : R2 (YM/X1X2X3X4 X5X8) = 0 FM = R2 (YA/X1X2X3X4 X5X8)______ (1- R2 ( YM/X1X2X3X4X5X8 ) / ( N – k-1))
Tests of Individual Coefficients:
H0 : Bί = 0, if ί=1 TXί = R2 (YM/X1X2X3X4 X5) - R2 (YM/X2X3X4 X5) (1- R2 (YM/X1X2X3X4 X5 ) / ( N – k-1))
Calculate Semi-Partial R2
H0: ( YM ( X1/ X2X3X4X5 X8 )) = 0 FA = R2 (YM/ X1X2X3X4 X5 X8) - R (X1/ X2X3X4 X5 X8 )
(1- R2 ( YM/ X1X2X3X4 X5 X8 ) / ( N – k-1))
H0: ( YM ( X2/ X1X3X4 X5 X8)) = 0 FM = R2 (YM/ X1X2X3X4 X5 X8 ) - R2 (X2/ X1X3X4 X5 X8 )
(1- R2 ( YM/ X1X2X3X4 X5 X8) / ( N – k-1))
H0: ( YM ( X3/ X1X2X4 X5 X8 )) = 0 FM = R2 (YM/ X1X2X3X4 X5 X8) - R2 (X3/ X1X2X4 X5 X8 )
(1- R2 ( YA/ X1X2X3X4 X5 X8) / ( N – k-1))
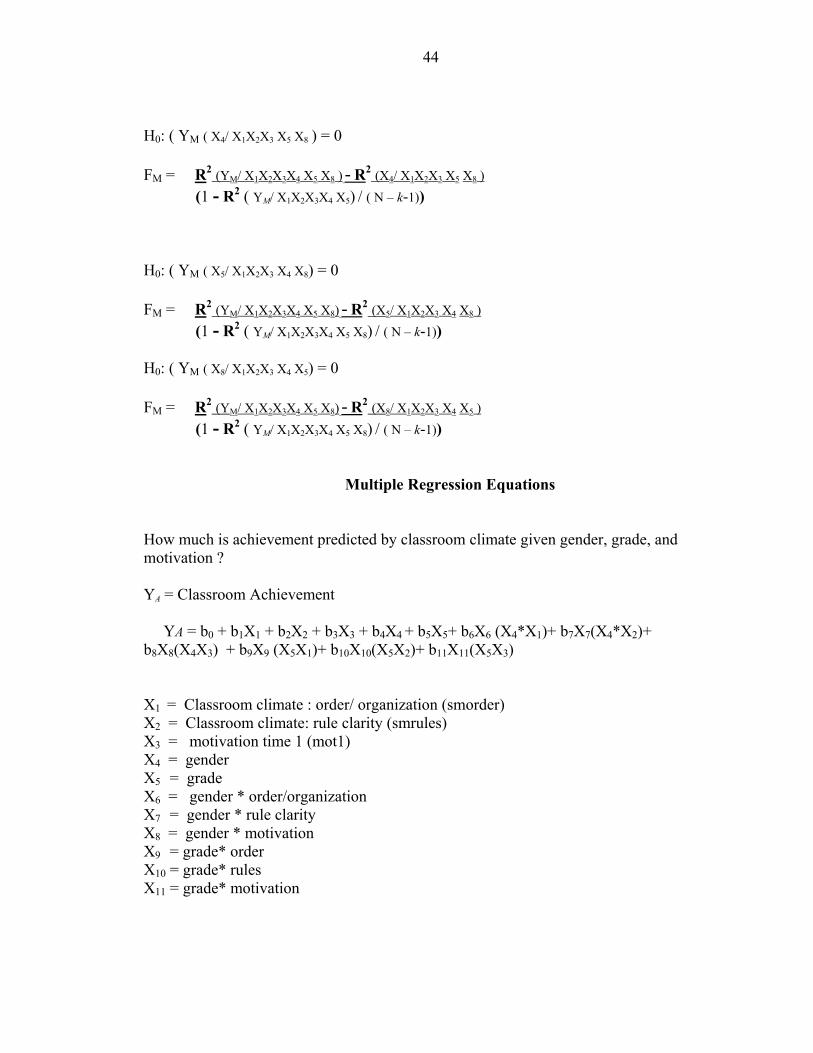
44
H0: ( YM ( X4/ X1X2X3 X5 X8 ) = 0 FM = R2 (YM/ X1X2X3X4 X5 X8 ) - R2 (X4/ X1X2X3 X5 X8 ) (1 - R2 ( YM/ X1X2X3X4 X5) / ( N – k-1)) H0: ( YM ( X5/ X1X2X3 X4 X8) = 0 FM = R2 (YM/ X1X2X3X4 X5 X8) - R2 (X5/ X1X2X3 X4 X8 ) (1 - R2 ( YM/ X1X2X3X4 X5 X8) / ( N – k-1)) H0: ( YM ( X8/ X1X2X3 X4 X5) = 0 FM = R2 (YM/ X1X2X3X4 X5 X8) - R2 (X8/ X1X2X3 X4 X5 ) (1 - R2 ( YM/ X1X2X3X4 X5 X8) / ( N – k-1))
Multiple Regression Equations
How much is achievement predicted by classroom climate given gender, grade, and motivation ? YA = Classroom Achievement YA = b0 + b1X1 + b2X2 + b3X3 + b4X4 + b5X5+ b6X6 (X4*X1)+ b7X7(X4*X2)+ b8X8(X4X3) + b9X9 (X5X1)+ b10X10(X5X2)+ b11X11(X5X3) X1 = Classroom climate : order/ organization (smorder) X2 = Classroom climate: rule clarity (smrules) X3 = motivation time 1 (mot1) X4 = gender X5 = grade X6 = gender * order/organization X7 = gender * rule clarity X8 = gender * motivation X9 = grade* order X10 = grade* rules X11 = grade* motivation

45
Omnibus Test of Predictive Variables for Achievement Revised Model
( k = 11) H0 : R2 (YA/X1X2X3X4 X5X6X7 X8X9X10X11) = 0 FA = R2 (YA/X1X2X3X4 X5X6X7 X8X9X10X11)______ (1- R2 (YA/X1X2X3X4 X5X6X7 X8X9X10X11) / ( N – k-1))
Tests of Interaction
H0 : R2 (YA/X1X2X3X4 X5X6X7 X8X9X10X11) = 0 FA = R2 (YA/X1X2X3X4 X5X6X7 X8X9X10X11)______
(1- R2 (YA/X1X2X3X4 X5X6X7 X8X9X10X11) / ( N – k-1)) H0 : R2 (YA/X1X2X3X4 X5X6X7 X8X9X10) = 0 FA = R2 (YA/X1X2X3X4 X5X6X7 X8X9X10)______
(1- R2 (YA/X1X2X3X4 X5X6X7 X8X9X10) / ( N – k-1)) H0 : R2 (YA/X1X2X3X4 X5X6X7 X8X9X11) = 0 FA = R2 (YA/X1X2X3X4 X5X6X7 X8X9X11)______
(1- R2 (YA/X1X2X3X4 X5X6X7 X8X9X11) / ( N – k-1)) H0 : R2 (YA/X1X2X3X4 X5X6X7 X8X10X11) = 0 FA = R2 (YA/X1X2X3X4 X5X6X7 X8X10X11)______
(1- R2 (YA/X1X2X3X4 X5X6X7 X8X10X11) / ( N – k-1)) H0 : R2 (YA/X1X2X3X4 X5X6X7 X9X10X11) = 0 FA = R2 (YA/X1X2X3X4 X5X6X7 X9X10X11)______
(1- R2 (YA/X1X2X3X4 X5X6X7 X9X10X11) / ( N – k-1)) H0 : R2 (YA/X1X2X3X4 X5X6 X8X9X10X11) = 0 FA = R2 (YA/X1X2X3X4 X5X6 X8X9X10X11)______
(1- R2 (YA/X1X2X3X4 X5X6 X8X9X10X11) / ( N – k-1))
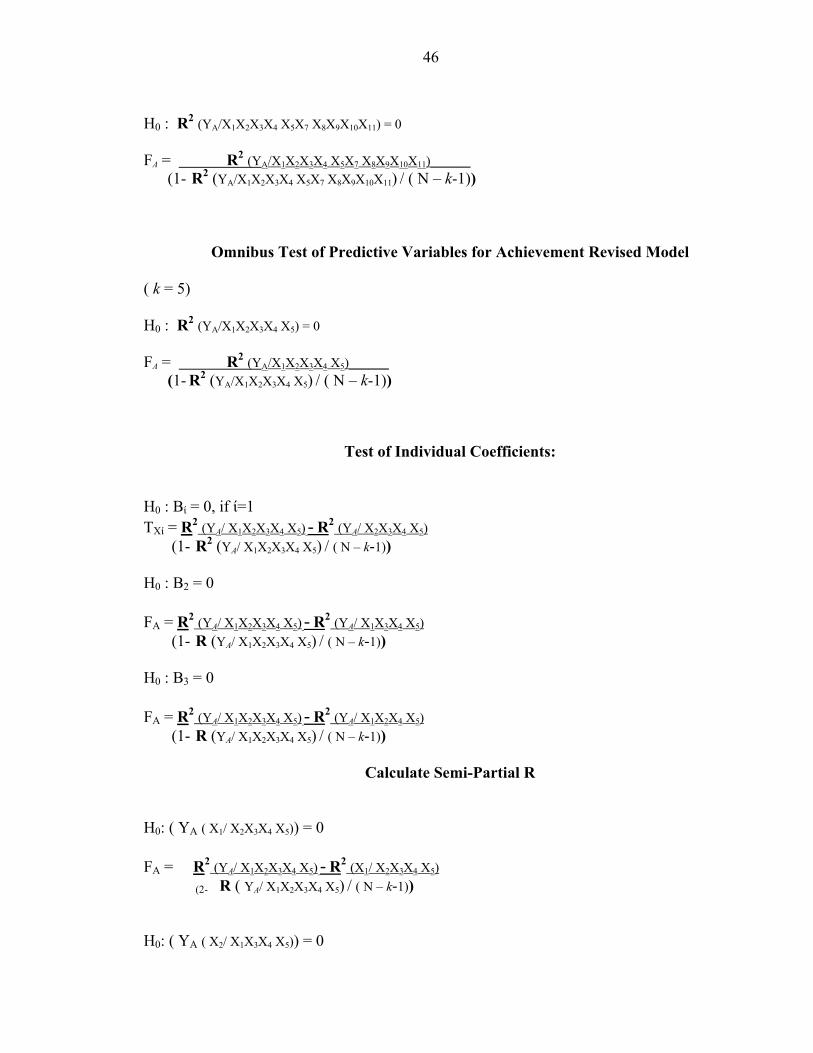
46
H0 : R2 (YA/X1X2X3X4 X5X7 X8X9X10X11) = 0 FA = R2 (YA/X1X2X3X4 X5X7 X8X9X10X11)______
(1- R2 (YA/X1X2X3X4 X5X7 X8X9X10X11) / ( N – k-1))
Omnibus Test of Predictive Variables for Achievement Revised Model
( k = 5) H0 : R2 (YA/X1X2X3X4 X5) = 0 FA = R2 (YA/X1X2X3X4 X5)______ (1- R2 (YA/X1X2X3X4 X5) / ( N – k-1))
Test of Individual Coefficients:
H0 : Bί = 0, if ί=1 TXί = R2 (YA/ X1X2X3X4 X5) - R2 (YA/ X2X3X4 X5)
(1- R2 (YA/ X1X2X3X4 X5) / ( N – k-1)) H0 : B2 = 0 FA = R2 (YA/ X1X2X3X4 X5) - R2 (YA/ X1X3X4 X5)
(1- R (YA/ X1X2X3X4 X5) / ( N – k-1)) H0 : B3 = 0 FA = R2 (YA/ X1X2X3X4 X5) - R2 (YA/ X1X2X4 X5)
(1- R (YA/ X1X2X3X4 X5) / ( N – k-1))
Calculate Semi-Partial R
H0: ( YA ( X1/ X2X3X4 X5)) = 0 FA = R2 (YA/ X1X2X3X4 X5) - R2 (X1/ X2X3X4 X5)
(2- R ( YA/ X1X2X3X4 X5) / ( N – k-1))
H0: ( YA ( X2/ X1X3X4 X5)) = 0

47
FA = R2 (YA/ X1X2X3X4 X5) - R2 (X2/ X1X3X4 X5)
(2- R2 ( YA/ X1X2X3X4 X5X6X7) / ( N – k-1))
H0: ( YA ( X3/ X1X2X4 X5)) = 0 FA = R2 (YA/ X1X2X3X4 X5) - R2 (X3/ X1X2X4 X5)
(2- R2 ( YA/ X1X2X3X4 X5) / ( N – k-1)) H0: ( YA ( X4/ X1X2X3 X5)) = 0 FA = R2 (YA/ X1X2X3X4 X5) - R2 (X4/ X1X2X3 X5) (1 - R2 ( YA/ X1X2X3X4 X5) / ( N – k-1)) H0: ( YA ( X5/ X1X2X3 X4)) = 0 FA = R2 (YA/ X1X2X3X4 X5) - R2 (X5/ X1X2X3 X4) (1 - R2 ( YA/ X1X2X3X4 X5) / ( N – k-1))
LIST OF REFERENCES
Alspaugh, J. (1998). The relationship of school and community characteristics to high school dropout rates. The Clearinghouse, 71, 184-188.
Anderson, L., Stevens, D., Prawat, R., & Nickerson, J. (1988). Classroom task environments and students' task-related beliefs. Elementary School Journal, 88, 281-295.
Battistich, V., & Horn, A. (1997). The relationship between students' sense of their school as a community and their involvement in problem behaviors. American Journal of Public Health, 87, 1997-2001.
Baumeister, R., & Leary, M. (1995). The need to belong personal attachments as fundamental human motivation. Bulletin, 117, 497-529.
Biggs, J. (1993). What do inventories of students' learning processes really measure? A theoretical view and clarification. British Journal of Education, 63, 3-19.
Chapin, S., & Eastman, K. (1996). External and internal characteristics of learning environments. Mathematics Teacher, 89, 112-115.
Charlesworth, W., & Dzur, D. (1987). Gender comparisons of preschoolers' behavior and resource utilization in group problem solving skills. Child Development, 58, 191-200.
Cheung, C., Rudowicz, E., & Lang, G. (2001). Critical thinking among university students: does the family background matter? College Student Journal, 35, 577-597.
Crocker, R., & Brooker, G. (1986). Classroom control and student outcomes in grades 2 and 5. American Educational Research Journal, 23, 1-11.
Crohn, L. (1983). Towards excellence: student and teacher behaviors predictors of school success. Research Summary Report, Retrieved July 1, 2001 from ERIC (ED242704).
Dart, B. (1998). Teaching for improved learning in small classes. In B. Dart & G. Boulton-Lewis (Eds.), Teaching and learning in higher education (pp. 222-229). Melbourne: Australia: Australian Council for Educational Research.
48

49
Dart, B., Burnett, P., & Purdie, N. (2000). Students' conception of learning, the classroom environment, and approaches to learning. The Journal of Educational Research, 93, 262-270.
Deci, E., Vallerand, R., Pelletier, L., & Ryan, R. (1991). Motivation and education. Educational Psychologist, 26, 325-346.
Denny, D., & Turner, R. (1967). Teacher characteristics, classroom behavior, and growth in pupil creativity. Retrieved June 13, 2002 from ERIC (ED011257).
DeYoung, A. (1977). Classroom climate and class success: a case study at the university level. Journal of Educational Research, 70(5), 251-257.
Dunn, R., & Harris, L. (1998). Organizational dimensions of climate and the impact on school achievement. Journal of Instructional Psychology, 25, 100-114.
Eccles, J. (1983). Expectancies, values and academic behaviors. In J.T.Spence (Ed.), Achievement and Achievement Motives: Psychological and Sociological Approaches (pp. 75-146). San Francisco: W.H.Freeman.
Eccles, S., Wigfield, A., Midgely, C., Reuman, D., MacIver, D., & Feldlaufer, H. (1993). Negative effects of traditional middle schools on students' motivation. The Elementary School Journal, 93, 555-591.
Ellis, S. (1996). Staff development is the key to school reform: an interview with Efrain Vila. Journal of Staff Development, 17, 52.
Fraser, B. (1986). Classroom Environnent. London: Croom Helm.
Fyans, L., & Maehr, M. (1987). School "culture" motivation and achievement. In J. Arter (Ed.), Assessing School and Classroom Climate A Consumer's Guide (pp. 1-39). Portland, Or: Test Center of the Northwest Regional Educational Laboratory.
Gardner, A., Mason, C., & Matyas, M. (1989). Equity, excellence and "just plain good teaching.” The American Biology Teacher, 51, 72-77.
Goh, S., & Fraser, B. (1995). Learning environment and student outcomes in primary mathematics. Retrieved June 13, 2002 from ERIC (ED38962).
Goodenow, C. (1993a). Classroom belonging among early adolescent students: relationships to motivation and achievement. Journal of Early Adolescence, 13, 21-43.
Goodenow, C. (1993b). The psychological sense of school membership among adolescents: scale development and educational correlates. Psychology in the Schools, 30, 79-90.

50
Goodenow, C. (1995). Conceptualizing and measuring classroom belonging and support among adolescents. Unpublished. Tufts University. Department of Education.
Gottfredson, G., & Gottfredson, D. (1989). School climate, academic performance, attendance, and dropout. US Dept of Education.
Greene, J. (1983) On the classroom component of classroom motivation. Presented at Annual Meeting of the American Educational Research Association, Montreal
Haertel, G., Walberg, H., & Haertel, E. (1981). Social-psychological environments and learning: a quantitative synthesis. British Educational Research Journal, 7, 27-36.
Hamilton, S. (1983). The social side of schooling: ecological studies of classrooms and schools. The Elementary School Journal, 4, 313-334.
Hayes, C., Ryan, A., & Zeller, E. (1994). The middle school child's perceptions of caring teachers. American Journal of Education, 103, 1-19.
Hoffman, R. (1979). Ability, involvement, and climate as multiple and interactive predictors of performance. Research Report, Retrieved from ERIC (ED183601).
House, D. (2002). The independent effects of student characteristics and instructional activities on achievement: an application of the input-environment- outcome assessment model. International Journal of Instructional Media, 29, 225-239.
Jackson, J. (2002). Enhancing self-efficacy and learning performance (motivation and social processes). The Journal of Experimental Education, 70, 243-255.
Jacobson, L. (2000). Valuing diversity-student-teacher relationships that enhance achievement. Community College Review, 28, 49-66.
Johnson, L., Lutzow, J., Strothoff, M., & Zannis, C. (1995). Reducing negative behavior by establishing helping relationships and a community identity program. Rockford Ill
Juarez, A. (2000). Enhancing student performance through classroom motivation. Dissertation Abstracts, RIEMAR2002. Retrieved June 13, 2002 from ERIC (ED458298).
Keyser, V., & Barling, J. (1981). Determinants of children's self-efficacy beliefs in an academic environment. Cognitive Therapy Research, 5, 29-39.
Kunc, N. (1992). The need to belong: rediscovering Maslow's hierarchy of needs. In R. Villa, J. Thousand, W. Stainback, & S.Stainback (Eds.). Restructuring for caring and effective education. Baltimore: Brookes.
Kutnick, P. (1998). Relationships in the primary classroom. London: Paul Chapman Publishing.
51
Mayer, G., & Mitchell, L. (1993). Dropout prevention program for at risk high-school students: emphasizing consulting to promote positive classroom climates. Education and Treatment of Children, 16, 2.
McRobbie, C., & Fraser, B. (1993. Associations between student outcomes and psychosocial science environment. Journal of Educational Research, 87, 78-85.
Moos, R., & Trickett, E. (1994). A social climate manual. Palo Alto, Ca: Consulting Psychologists Press, Inc.
Osterman, K. (2000). Students' need for belonging in the school community. Review of Educational Research, 70, 323-367.
Owens, L., & Barnes, J. (1982). The relationships between cooperative, competitive, and individualized learning preferences and students' perceptions of classroom learning atmosphere. American Educational Research Journal, 19, 182-200.
Proctor, C. (1984). Teacher expectations: a model for school improvement. Elementary School Journal, 84, 469-481.
Resnick, M., Bearman, P., Blum, R., Bauman, K., Harris, K., Jones, J., Tabor, J., Beuhring, T Sieving, R., Shew, M., Ireland, M., Bearinger, L. & Udry, J. (1997). Protecting adolescents from harm. JAMA, 278, 823-832.
Simons-Morton, B., & Crump, A. (2003). Associations of parental environment and social competence with school adjustment and engagement among sixth graders. Journal of School Health, 73, 121-127.
Slavin, R. (1991). Synthesis of research on cooperative learning. Educational Leadership, 48, 71-82.
Townsend, M., & Hicks, L. (1997). Classroom goal structures, social; satisfaction and the perceived value of academic tasks. British Journal of Educational Psychology, 67, 1-12.
Wang, M., Haertel, G., & Walberg, H. (1993). What helps students learn. Educational Leadership, 51, 74-76.
Wigfield, A., Harold, R., Eccles, J., Blumenfeld, P., Aberbach, A., Freedman-Doon, C. &Yoon, K. (1992). The structure of children’s ability perceptions and achievement values: age, gender, and domain differences. Presented at the Annual Meeting of the American Educational Research Associations. San Francisco.
Wigfiled, A. (1994). Expectancy-Value theory of achievement motivation: a development perspective. Educational Psychology Review, 6, 49-78

52
Williams, J., & Somers, M. (2001). Family, classroom and school effects on children's educational outcomes in Latin America. School Effectiveness and School Leadership, 12, 409-444.
Zahn, G., Kagan, S., & Widaman, K. (1986). Cooperative learning and classroom climate. Journal of School Psychology, 24, 351-362.

BIOGRAPHICAL SKETCH
Susan Davis graduated from the University of Florida in 2001 with a Bachelor of
Science degree in psychology. She is currently a graduate student in the University of
Florida school psychology program and plans to graduate in May of 2006. Susan lives in
Gainesville with her husband, Jack, and son, Jim.
53