the role of social media in the 2013 presidential election
TRANSCRIPT
THE ROLE OF SOCIAL MEDIA IN THE 2013 PRESIDENTIAL ELECTION
CAMPAIGNS IN KENYA
By
HUMPHREY WACHULI WASSWA
K50/69386/2011
A RESEARCH PROJECT SUBMITTED TO THE SCHOOL OF JOURNALISM AND MASS COMMUNICATION, IN PARTIAL FULFILLMENT OF THE REQUIREMENTS
FOR THE AWARD OF THE DEGREE OF MASTERS OF ARTS IN COMMUNICATION STUDIES OF THE UNIVERSITY OF NAIROBI
OCTOBER, 2013
i
DECLARATION
This project is my original work and has not been presented for a degree in any other University.
Signature…………………. Date: 4TH November, 2013
Humphrey Wachuli Wasswa
Reg. No K50/69386/2011
This project has been submitted for examination with my approval as University Supervisor.
Signature………………………. Date………………………….
Mr. Sam Kamau
School of Journalism and Mass Communication
University of Nairobi
ii
DEDICATION
First, I thank the Almighty God for giving me the strength while undertaking my studies. This
paper is dedicated to my family which encouraged and supported me to pursue higher education.
The encouragement I received from my brother Eng. Daniel Webo and Sister Joan Nasenya will
always remain invaluable.
iii
ACKNOWLEDGEMENTS
The completion of this study is a product of help and support from many people. I am highly
indebted to all those respondents who provided me with information and data about the study.
I would like to thank my supervisor, Mr. Sam Kamau, Ph.D., for his kind help, support and
comments which he contributed to the final version of this thesis.
I would also like to thank Mr. Peter Kenneth for his assistance in facilitating an interview with
his social media campaign strategist which provided in depth information on the use of the
platform for campaigning purposes.
Finally, I would like to express my most sincere gratitude to my lovely family for their
encouragement, support, and patience while compiling this paper.
iv

ABSTRACT
This paper examined the role of social media in the 2013 presidential election campaigns. The
study was guided by three main objectives: (i) To investigate the integration of social media into
the 2013 presidential campaigns (ii) To explore how social media users utilize SNS for political
purposes (iii) To explore the impact of social media on the presidential campaign process.
A descriptive survey design was used. This involved administering questionnaires, oral
interviews and focus group discussions as tools for data collection. Political pages on social
media were also examined.
Purposive sampling was used to select the Nairobi County and specifically the University of
Nairobi as the location of study. The target population of this study was the urban youth who are
most likely to be found in universities. Stratified sampling was used to select a sample of 216
undergraduate students who were issued with questionnaires, and with some participating in
focus group discussions. This sampling technique was used because the university students’
population exits in subgroups based on the criterion of departments/faculties in the university.
One social media campaign strategist was interviewed. All of the sampled respondents accepted
to participate and responded to the questions. A total of 216 questionnaires were distributed and
198 were returned. This represented 91.667% response rate. The data was analyzed by the using
a computer software called SPSS.
According to the findings of the study, the 2013 presidential candidates integrated social media
into their campaigns. This platform was majorly used for sharing information on campaign
activities, debate on issues, sharing photos, videos and links, updating of their followers,
soliciting for funds, countering propaganda and updating their followers. The findings further
revealed that although presidential candidates integrated social media into their campaign they
are yet to exploit its full potential. However, social media by itself could not guarantee a
candidate victory in the elections. Therefore, presidential candidates need to strike a balance
between their campaigns on social media with the ground campaigns to ensure that they reach
most of the electorate.
Facebook and Twitter are the most common SNS amongst the urban youth in Kenya. A gender
analysis on the respondent’s use of SNS revealed that Facebook had more female users while
v
Twitter had a majority of male users. However, male users appear to use and spend more time on
SNS than the female users. Findings on the political use of SNS by social media users indicated
that they used the platform to seek political information, keeping up with trending topics, share
political videos, photos and links, discuss political issues, and to get campaign updates. Thus the
urban youth were actively involved in politics when they were on SNS.
An analysis of the trends in media usage and reliance revealed that Television and Radio were
the most popular source of political information on the presidential campaigns for the
respondents. SNS, specifically Facebook and Twitter were the second most popular source of
political information. These findings show that although more people are getting online for
political news and information, they heavily rely on traditional media for the same news.
Social media had a significant impact on the campaign process. The platform provided a cheaper
means of campaigning for less known presidential candidates. It facilitated the recruitment of
volunteers and soliciting of funds which was normally done through party offices and luncheons
respectively. The findings of this study shows that the urban youth developed interest in politics,
became more knowledgeable, relied on social media for election updates and were able to learn
more about the presidential candidates. Majority of the respondents said they did not withdraw
their support for a candidate after reading something about them on social media. Therefore, the
political information that the respondents came across on social media to a larger extent
reinforced their belief on their candidate choice.
The lack of equitable access to the internet across the country and hate speech on SNS emerged
as the main challenges in the use of social media for presidential candidates and social media
users. Therefore, the government needs to step up its efforts to ensure that all parts of country
enjoy universal access to communication technologies such as the internet. Also, the relevant
regulatory bodies must ensure that messages shared on SNS are monitored to curb the spread of
hate speech, defamation, propaganda and cyber bullying. There is need for development of new
policies to ensure that such unlawful acts can be prosecuted in a court of law.
vi

TABLE OF CONTENTS DECLARATION .................................................................................................................................... ii
DEDICATION ....................................................................................................................................... iii
ACKNOWLEDGEMENTS .................................................................................................................... iv
ABSTRACT ............................................................................................................................................ v
LIST OF TABLES .................................................................................................................................. x
LIST OF FIGURES ............................................................................................................................... xii
ABBREVIATIONS/ACRONYMS ........................................................................................................ xiii
GLOSSARY ......................................................................................................................................... xiv
CHAPTER ONE ..................................................................................................................................... 1
INTRODUCTION AND BACKGROUND.............................................................................................. 1
1.0 Introduction ............................................................................................................................. 1
1.1 Background .............................................................................................................................. 1
1.2 Concept of social media ........................................................................................................... 2
1.3 Social media and politics .......................................................................................................... 3
1.4 Problem Statement ................................................................................................................... 4
1.5 Research objective ................................................................................................................... 6
1.5.1 Specific Objectives .................................................................................................................. 6
1.5.2 Research Questions .................................................................................................................. 6
1.6 Justification of the Study .......................................................................................................... 6
1.7 Scope and Limitations of the Study .......................................................................................... 7
CHAPTER TWO .................................................................................................................................... 8
LITERATURE REVIEW ........................................................................................................................ 8
2.0 Introduction ............................................................................................................................. 8
2.1 MASS MEDIA AND POLITICS ............................................................................................. 8
2.1.1 News coverage of political campaigns .................................................................................... 10
2.1.2 Political Advertising............................................................................................................... 11
2.1.3 Radio and Television .............................................................................................................. 13
2.1.4 Printed Material ..................................................................................................................... 15
2.2 INTERNET AND POLITICS ................................................................................................. 16
2.2.1 Structure and Benefits of the Internet...................................................................................... 17
2.2.2 Internet Access and Digital Divide ......................................................................................... 17
2.2.3 Civic Engagement and Participation ....................................................................................... 18
2.2.4 Internet and Political Mobilization.......................................................................................... 19
2.3 SOCIAL MEDIA AND POLITICS ........................................................................................ 20
vii

2.3.1 Social Media and Politics in Africa......................................................................................... 24
2.3.2 Access to Social Media in Kenya ........................................................................................... 27
2.4 Theoretical framework ........................................................................................................... 28
2.4.1 Network Society theory .......................................................................................................... 28
2.4.2 The Mobilization Theory ........................................................................................................ 30
2.5 Study Gap .............................................................................................................................. 31
CHAPTER THREE ............................................................................................................................... 32
RESEARCH DESIGN AND METHODOLOGY ................................................................................... 32
3.0 Introduction ........................................................................................................................... 32
3.1 Research Design..................................................................................................................... 32
3.2 Area of Study ......................................................................................................................... 32
3.3 Population of the Study .......................................................................................................... 32
3.4 Sampling Techniques and Procedure ...................................................................................... 33
3.5 Data Collection Procedures and Instruments................................................................................. 34
3.5.1 Questionnaire ......................................................................................................................... 34
3.5.2 Key Informant Interviews ....................................................................................................... 34
3.5.3 Focus Group Discussion ......................................................................................................... 34
3.5.4 Data Analysis and Presentation............................................................................................. 35
3.5.5 Problems, constraints and limitation ....................................................................................... 35
CHAPTER FOUR ................................................................................................................................. 36
DATA ANALYSIS AND DISCUSSION OF FINDINGS ...................................................................... 36
4.0 Introduction ........................................................................................................................... 36
4.1 Response rate ......................................................................................................................... 36
4.2 Background information of the respondents ............................................................................ 37
4.2.1 Gender Distribution ................................................................................................................ 37
4.2.2 Age Distribution..................................................................................................................... 38
4.3 RQ1: How was social media integrated into the 2013 presidential election campaign? ............ 39
4.3.1 Presidential candidate followed on Facebook between January and March, 2013 .................... 39
4.3.2 Presidential candidate followed on Twitter between January and March, 2013 ........................ 40
4.3.3 Frequency of coming across the listed items when the respondents went online on social media 41
4.3.4 Discussion.............................................................................................................................. 44
4.4 RQ2: How was social media utilized for political purposes by its users? ................................. 44
4.4.1 General social media usage pattern ......................................................................................... 45
4.4.2 Social networking sites of the respondents .............................................................................. 45
viii

4.4.3 Cross-tabulation of Gender of the respondent against Social networking sites the respondents were on.............................................................................................................................................. 46
4.4.4 How often the respondents used social media ......................................................................... 48
4.4.5 Cross-tabulation of the gender of the respondents against how frequent they went on Facebook 48
4.4.6 Cross-tabulation of the gender of the respondents against how frequent they went on Twitter . 50
4.4.7 Time in hours spent on social networking sites ....................................................................... 51
4.4.8 Cross-tabulation of the gender of the respondents against the hours they spent on Twitter ....... 51
4.4.9 Cross-tabulation of the gender of the respondents against the hours they spent on Facebook ... 53
4.4.10 How the respondents used social networking sites .................................................................. 55
4.4.11 Patterns of social media usage and politics ............................................................................. 56
4.4.11.1 What the respondents engaged in on social networking sites between January and March, 2013 56
4.4.11.2 Number of days per week the respondents utilized the listed media as a source of information about political candidates ................................................................................................ 57
4.4.11.3 Discussion ...................................................................................................................... 59
4.5 RQ3: What was the impact of social media on the presidential campaign process?.................. 60
4.5.1 Presidential candidate's profiles or pages on social networks and if they were helpful in learning more about them ................................................................................................................................ 60
4.5.2 Information posted on social networking sites that was related to the presidential election, between January and March, 2013 ..................................................................................................... 61
4.5.3 Impact of social media on the respondents in relation to politics ............................................. 62
4.5.4 Impact of social media on the respondents in relation to politics ............................................. 64
4.5.5 Discussion.............................................................................................................................. 65
CHAPTER FIVE ................................................................................................................................... 67
SUMMARY, CONCLUSIONS AND RECOMMENDATIONS ............................................................ 67
5.0 Introduction ........................................................................................................................... 67
5.1 Summary of the study ............................................................................................................ 67
5.2 Major findings of the study..................................................................................................... 67
5.3 Conclusion of the study .......................................................................................................... 69
5.4 Major recommendations from the study .................................................................................. 70
5.5 Suggestions for further research ............................................................................................. 71
References............................................................................................................................................. 72
Appendices............................................................................................................................................ 76
ix

LIST OF TABLES Table 4.1: Presidential candidates followed on Facebook between January and March,
2013………………………………….…………………………………….…………38
Table 4.2: Frequency of coming across listed items when the respondents went online on social
media………………………………………………………………………………….40
Table 4.3: Cross-tabulation of the gender of the respondent against Social networking sites they
were on………………………………………………………………………………..45
Table 4.4: Chi-square table on the gender of the respondents against social networking sites they
were on………………………………………………………………………………..46
Table 4.5: Frequency of social media use of the respondents……………………………...…..46
Table 4.6: Cross-tabulation of the gender of the respondents against how frequent they went on
Facebook…………………………………………………………………………...…47
Table 4.7: Chi-Square test of the gender of the respondents against how frequent they went on
Facebook...……………………………………………………………………………47
Table 4.8: Cross-tabulation of the gender of the respondents against how frequent they went on
Twitter……………………………………………………………….………………..48
Table 4.9: Chi-Square test of the gender of the respondents against how frequent they went on
Twitter………………………………………………………………………………...49
Table 4.10: Hours spent on social media by the respondents……………………………………49
Table 4.11: Cross-tabulation of the gender of the respondents against the hours they spent on
Twitter………………………………………………………………………………..50
Table 4.12: Chi-Square test of the gender of the respondents against the hours spent on
Twitter………………………………………………………………………………51
Table 4.13: Cross-tabulation of the gender of the respondents against the hours they spent on
Facebook……………………………………………………………………………..52
Table 4.14: Chi-Square test of the gender of the respondents against the hours spent on
Facebook…..………………………………………………………….…………….52
Table 4.15: How the respondents use social networking sites…………………………………53
Table 4.16: What the respondents did between January and March, 2013 on social networking
sites..………………………………………………………………………………..55
x
Table 4.17: Number of days per week the respondents utilized the listed media as a source of
information about political candidates……………………………………………..56
Table 4.18: Impact of social media on the respondents in relation to politics…………………61
Table 4.19: Impact of social media on the respondents in relation to politics…………………62
xi
LIST OF FIGURES Figure 2.1: Estimated number of Internet Users and Internet Penetration…………..………..…27
Figure 2.2: Mobile Penetrations in Kenya from December 2011 to December, 2012 in (%)..….28
Figure 4.1: Distribution of respondents by gender………………………………………………36
Figure 4.2: Distribution of respondents by age…………………………………………………..37
Figure 4.3: Presidential candidates followed on Twitter between January and March, 2013…...39
Figure 4.4: Social networking sites of the respondents………………………………………….44
Figure 4.5: Presidential candidate's profiles or pages on social networks and if they were helpful
in learning more about them…………………………………………………………59
Figure 4.6: Information posted on social networking sites that was related to the presidential
election, between January and March, 2013…………………………………………60
xii
ABBREVIATIONS/ACRONYMS
BDP-Botswana Democratic Party
BMD-Botswana Movement for Democracy
BCP- Botswana Congress Party
CCK-Communication Commission of Kenya
ICC-International Criminal Court
IEA-Institute of Economic Affairs
IT-Information Technology
KNC-Kenya National Congress
ODM-Orange Democratic Movement
SNS-Social Networking Sites
CMC-Computer Mediated Communications
UGC-User generated content
FGD-Focus group discussion
xiii

GLOSSARY
Social Networking Sites - internet-based applications that allow users to develop a public
profile within a closed system, have a list of users whom they have a relation with, and are able
to view their own friends list and that of others within the system
Computer Mediated Technology-The of the internet for communication purposes
User Generated Content-Information or material posted on SNS by social media users
Hate speech-Incitement to violence based in ethnicity and political inclinations
Internet- as a master medium, a revolutionary hybrid of the traditional medium that offers an
opportunity of two way communication feedback loop
Mass Media-Means of public communication which includes radio, TV and newspapers
Social Media- Are social networking sites such as Facebook, Twitter and YouTube
Campaign-A series of communication activities performed with an aim of influencing voters
xiv

xv

CHAPTER ONE
INTRODUCTION AND BACKGROUND
1.0 Introduction
This chapter looks at the background of social media campaigning, statement of the problem,
general and specific objectives, and justification of the study, scope and limitations of the study.
1.1 Background
There is an emerging consensus among scholars that campaigns matter in elections based on
evidence that the public reacts to campaign events (Holbrook 1996; Hillygus 2005). The
aggregate results in elections are influenced by the intensity of the campaigns (Shaw 1999a;
Holbrook and McClurg 2005). Campaigns are strategic in the sense that opposing candidates
channel their resources towards the same location with the aim of targeting a subset of the voting
population (Gerber and Green, 2004). Studies show that campaigns influence voters by
delivering messages that reinforce party identification and remind voters of present issues
concerning presidential performance (McClurg and Holbrook, 2009). Therefore, fundamentals of
vote choice play a stronger role in countries where there are intense presidential campaigns than
in countries which the level of campaign activity is relatively minimal. Presidential campaigns
create a unique electoral context that affects voter behavior especially in terms of their vote
choice.
Political elites who have already established themselves use internet technologies such as social
media to gather intelligence on the voters, organize volunteers, raise funds and research on their
opposition (Howard, 2005). Increasingly, internet technologies are being used to provide
political information in the public sphere and unlike the traditional media, they posses interactive
tools for both production and consumption of political content. Today, political victories are
determined by the quantity and quality of information that campaigns can access with regards to
their political rivals and constituents (McClurg and Holbrook, 2009). Digital communication
technologies cannot be viewed simply as means of delivering news content just like the radio,
television and newspapers since they allow for interaction with the public sphere and generation
of political content. This is not possible with broadcast media technologies. Scholars expect that
the internet would become a mass communication technology despite the difference that exists
between networked systems and traditional media (McClurg and Holbrook, 2009).
1

Castells (2000) predicted that political processes and social movements would be transformed by
the growth in the network society that would ultimately spread across all social structures. As he
forecasted, politics is now increasingly being played on the social media space and leadership
has become personalized through the use of web 2.0. Therefore, political actors who fail to adopt
the medium in their campaigns will lag behind. Tim O’Reilly defines the Web 2.0 as a set of
principles and practices that tie together a wide array of sites that have user-generated content
and make emphasis on social connections (O’Reilly 2005). This core ‘set of principles and
practices’ is applied to common threads and tendencies observed across many different
technologies, and it is heavily defined by online presence (Madden and Fox 2006). Other authors
argue that Web 2.0 has reshaped the way we work and have even referred to it as social e-
revolution (Fraser and Dutta 2009).
The internet is still the preferred tool for the delivery of political information though television
still stands out as the single dominant medium for election news (McClurg and Holbrook 2009).
Internet users argue that the medium provides convenient access to information, sufficient news
that is not available elsewhere and online news sources reflect their personal interests. Citizens
augment their understanding of current events, research on the background of political
candidates or deepen their understanding on issues by visiting websites of news organizations or
that of candidates (McClurg and Holbrook, 2009).
However, critics of digital politics argue that citizens consume political content that reinforce
their ideologies and do not expose themselves to challenging ideas (Sunstein, 2001). The debate
on selective exposure persists today. Kinder (2003) argues that research evidence on selective
exposure reveals that people seek mass communications that reinforces their political
predispositions. On the contrary, Jonas et al. (2005) contend that when people are searching for
new information they are biased in favor of the beliefs they hold and desired conclusion. Though
TV and radio remain a constant source of political information, people's news media patterns are
changing. Specifically, people are moving away from newspapers as a source of political
information and towards the Internet (Rainie and Horrigan, 2007).
1.2 Concept of social media
Social Networking Sites (SNS) are the main form of communication for social media. Therefore,
since social media occurs on the social network platform, then defining social networking sites
2

will provide a working definition for social media. Boyd & Ellison (2007) define social media
networking sites as internet-based applications that allow users to develop a public profile within
a closed system, have a list of users whom they have a relation with, and are able to view their
own friends list and that of others within the system. This is generally the model that social
media follow. They include Facebook, Twitter, MySpace, blogs, and YouTube.
This study will use this definition of social media with the sole focus on Facebook and Twitter.
Social media can also be referred to as “new media”; an umbrella term that is used to refer to
emerging communication technologies that run over the internet and are constantly evolving
(Peters, 2009). What distinguishes social media from other technologies is its reliance on social
networking sites as its main form of communication.
1.3 Social media and politics
Individuals are able to share their ideas, opinions and experiences with each other through social
media. In terms of politics, social media has facilitated participation of citizens in various
democratic processes in various countries. Political actors have successfully used social media
platforms such as weblogs and social networking sites to dissemination information to the
electorate and also engage them in political discussions. Recently, more than 900 million people
worldwide are members of the Facebook network (Facebook 2012) while Twitter counts more
than 500 million users in total (Forbes 2012). With this tremendous growth, these platforms
allow both citizens and politicians to participate in political discussions or to share political
content publicly. Furthermore, it is argued that from the perspective of politicians and political
parties it is essential to actively join social media based political communication, in particular
during election campaigns.
Already, U.S. politicians are said to have a leading role in this regard, with the most prominent
example of Barack Obama being able to successfully employ social media in his last election
campaign (Wattal et al. 2010). The recent 2008 U.S. presidential campaign has shown that the
Web 2.0 has become an influential tool for political communication and persuasion (Towner et
al. 2011; Hoffner & Rehkoff 2011). It became obvious that particularly social networks could be
successfully adapted to contact and discuss with voters as well as to disseminate material
information to them. Specifically young people developed interest in politics after coming across
3
such discussions on social software which is a communication platform (Chen 2009; Kushin &
Kitchener 2009).
The rise in the use of social media in political campaigns on the African continent cannot be
overlooked. Ghana is a good case of efficient use of social media in her political dispensation. A
17 January 2013 article on modernghana.com by Francis Xavier Tuokuu and Billings Tanaa
notes how competing parties in Ghana used Facebook and Twitter in creative ways for
advertising and engaging the public in the country’s 2012 elections. Dr. PaaKwesiNduom, the
presidential candidate for the PPP (Progressive People's Party) who at the time had more than
10,551 subscriptions on his Facebook page, engaged his supporters online via chat, giving them
an opportunity to ask and make comments.
Citizens were able to evade the state controlled media in the Arab Spring revolutions and employ
social media to communicate the ideas of defiance and resistance in North Africa and Middle
East (Simon, 2011). For instance, when a Tunisian Mohammed Bouaziz was denied a chance to
work as a street vendor to fend for his family, he set himself on fire. This act sparked protests
that spread across all cities and capitals as the video of Bouaziz burning was captured by a
passerby and went viral on YouTube. In Egypt, Marcus (2011) notes that Facebook facilitated
the formation of anti regime movements which had no central organization but was significant
forces that later saw the ousting of the then president Hozni Mubarak.
In Botswana, one of the most reputed democracies in Africa, leading politicians in the country
are intensively campaigning on social media ahead of their 2014 elections. The battling ground
has now shifted to Facebook with the ruling Botswana Democratic Party (BDP), Botswana
Movement for Democratic (BMD) and Botswana Congress Party (BCP) reaching out to potential
voters online (Daily Nation, March 9 2012). Botswana president Ian Khama addresses national
issues by responding to posts on the BDP Facebook wall which approximately receives 4,000
visits a day. Khama’s interaction with people on the social network has earned the title “man of
the people” (Daily Nation, March 9 2012).
1.4 Problem Statement
Previous studies have specifically focused on Social Networking Sites and their use in the
political context. In the investigation on the use of Facebook by U.S. Congressional candidates
during election campaigns, Williams and Gulati (2007, 2009) found that a number of their
4
Facebook supporters can be considered a valid indicator of electoral success. In a different study
by Utz (2009) of the 2006 Dutch elections, the findings of his research indicates that SNS
provide an opportunity to reach individuals that are less interested in politics. Thereby, viewing a
candidate’s profile further strengthens existing attitudes. Although social networking sites are
increasingly being utilized in political campaigns, it has not yet been fully established if they can
directly affect election results; but there is already a trend of positive contributions from these
sites that has led to voter decision in favor of a political candidate (Conners, 2005).
In the 2013 presidential elections of Kenya, Narc Kenya presidential hopeful Martha Karua and
Eagle Alliance Peter Kenneth were notably most active and had significant following on social
media. According to statistics from socialbakers.com as of 23 January, 2013, Martha Karua had
the most following on Twitter with 116,000 followers. She also had 230,000 likes on her official
Facebook page. She also came up with “AskMartha” on Thursday where her followers asked her
questions and she would respond to them. Peter Kenneth who was also popular on social media
had 165,000 Facebook likes and 63,000 followers on Twitter. The speech issued by his son,
Andrew Kenneth, during the launch of his presidential bid caused a lot of euphoria and
discussion on social media which subsequently increased his followers online. Kenneth was the
most active and with the largest following on Facebook in comparison to other presidential
candidates and is credited for using social media to raise funds for his campaign (Daily Nation,
October 5 2012).
According to a 21 November, 2011 article published on Forbes.com, the current president of
Kenya, Uhuru Kenyatta is noted to have leveraged the power social media to reach the young
Kenyan electorate. He operated active Twitter and Facebook accounts which he used to keep his
followers informed of his activities. His Twitter handle @UKenyatta had 21,400 followers. He
actively used YouTube where his handlers uploaded videos of him addressing the public in
campaign rallies. A survey by The Guardian (2012) named Uhuru Kenyatta among the top ten
most active African politicians on social media.
Despite Martha Karua and Peter Kenneth acquiring a largest following on social media by
consistently engaging the public on Twitter and Facebook, they both performed dismally when it
came to the 2013 elections whereas Uhuru Kenyatta who equally campaigned on social media
obtained over 50 percent of the total votes casted. The question that remains is whether the social
5
media campaigns had any effect on voters’ choice in the 2013 Kenya presidential elections.
Previous research argue that social media has really no effect on voter behavior. This study seeks
to analyze the how social media was integrated in the presidential campaigns and establish
whether it had any influence on the voter’s presidential choice.
1.5 Research objective
The general objective is to establish the role social media in the 2013 presidential election
campaigns.
1.5.1 Specific Objectives
i. To investigate the integration of social media into the 2013 presidential campaigns.
ii. To explore how social media users utilize SNS for political purposes.
iii. To explore the impact of social media on the presidential campaign process.
1.5.2 Research Questions
i. How was social media integrated into the 2013 presidential election campaign?
ii. How do social media users utilize SNS for political purposes?
iii. What was the impact of social media on the presidential campaign process?
1.6 Justification of the Study
Creating a social media strategy for use during political campaigns has become an essential part
of every candidate’s plan to get into office. With social media sites often getting more traffic
than an official campaign website, it’s important for candidates to get connected.
The use of social media in today’s campaign is not only important but also critical since millions
of people are involved in using social networks daily. It is the opportunity to be in touch with
large numbers of voters quickly, constantly and at a low cost. It has become a common practice
for political campaigns to create pages on social networking sites as part of their marketing
strategy. Social media has a significant impact on elections given its high speed of
communication and the number of its able to reach.
Political actors are using social networking sites to appeal to the youth by generating content that
people share, and gauge where their candidates stand in the race. This shows how advancement
in technology has affected political campaigns and democratic process in general. Therefore the
findings of this research help determine whether there is a causal connection between online
6
strategies and votes. Moreover, this information generated in this study is useful to scholars,
especially those who have expressed interest in new media, political parties, candidates and
campaign strategists.
1.7 Scope and Limitations of the Study
The study was limited to two social networking sites: Facebook and Twitter and specifically the
accounts of the three presidential candidates namely: Uhuru Kenyatta, Peter Kenneth and Martha
Karua. Students at the University of Nairobi were issued with questionnaires to provide
information on how they utilized social media for political purposes. A campaign strategist was
interviewed to provide information on how they integrated social media into their campaign.
This limitation is due to scarcity of resources both financial and human for the research,
preparation, data collection and analysis as well as lack of time due to the limited time schedule.
7
CHAPTER TWO
LITERATURE REVIEW
2.0 Introduction
This chapter critically examined the available literature and studies that have been previously
carried out and are relevant to this research. The chapter will shed light on the research problem
to create a better understanding of the issues discussed.
2.1 MASS MEDIA AND POLITICS
The mass media forms the backbone of democracy as they provide voters with political
information which they use in electing their leaders. According to Dye and Ziegler, (1983), the
mass media serves four political functions that include: news making, interpretation,
socialization, persuasion and agenda setting. Through these functions, the mass media create
political issues they consider of importance to the public, define their meanings and
consequences and ultimately cause the shift of public opinions and attitudes. An example is
when the media gives more coverage to elections than to ongoing cases in the supreme courts.
News making is all about making decisions of “who” and “what” will appear in the news. Media
coverage helps the general public know about personalities whom they have little direct
encounters, events or organization. Viewers are also likely to believe news on distant figures
such as the president since they have no personal experience with them. However, their opinions
on religions or ethnicity are not likely to be influenced by media coverage because they have
their own personal experience of them (Dye and Ziegler, 1983, p.7). At the same time, politicians
understand that a high amount of media coverage tells people what is important and this explains
why they struggle to get the attention of the media. They achieve this by coming up with what is
referred to as media events which among other qualities should attract an unusual audience.
According to a survey by Pew Research Center in the year 2000 on the Americans attitude
towards the credibility of newsmakers showed that 57 percent believed that news media
professionals are influenced by their political preferences in their news reporting while 32
percent believe this happens at times (Mauk & Oakland 2005). With regard to the influence of
news media, a 2004 poll conducted by Harris in America revealed that only 17 percent of the
respondents had confidence in the television news while 15 percent in the press. This evidently
8

shows that a minority of viewers believe everything they see on TV as true (Mauk & Oakland
2005).
Not only do newsmakers decide what appears in the news but also interpret it by placing an
event in a context and thereafter speculate the causes and consequences. Newsmakers normally
take an angle on a story which they give to reporters before assigning them news dockets. Films
and also video tapes are edited for selections of different segments to be aired during news. A
good example is the Iraq war in 2003 where American media reported the attack on Iraq by the
United States as a defensive act against terrorism as it was alleged that Saddam Hussein had
weapons of mass destruction. However, these weapons were not found and this prompted the
media to shift its focus to the poor planning of the attack which caused a decrease in public
support of the war (Shea, Green and Smith, 2007).
Another function of the mass media is political persuasion which is an attempt to change
people’s behavior and attitude through communication. Political parties and candidates try to
convince the public to accept their political beliefs. Propaganda is a form of persuasive
communication which involves transmission of opinions, facts and information that are aimed at
benefiting the communicator (Dye and Ziegler, 1983). Political leaders use persuasion and
propaganda as their most important tools in their profession. Presidents have control over the
time that is allocated for their speeches and announcement. Also, presidential candidates can
create their own campaign organizations, separate from that of their party, which deploy
persuasion and propaganda techniques.
The mass media is responsible for the creation of public opinion through agenda setting. That
news media shape public opinion through priming is one of the most widely accepted results in
political behavior. Politicians are more likely to pay attention to public opinion when it offers an
opportunity for political advantage over their competitors. In the event that they fail to respond to
public opinion due to conflicting convictions, they risk losing voter support and subsequently the
elections. Shea et al. (2007) note that one of the marks of first-rate political leader he knows
when to support or resist public opinion.
9
2.1.1 News coverage of political campaigns
In the mid-1970s and early 1980s, the news media, and television news in particular, were linked
with growing political malaise, not least because of the emphasis on bad news such as political
incompetence, scandals, and corruption (Robinson 1976; Robinson and Sheehan 1983).
Subsequent research on U.S. presidential election campaigns between 1960 and 1992 identified
trends that are no more heartening: campaign news has become more negative, more
interpretative rather than descriptive, and more game oriented than policy oriented (Patterson
1980, 1993). Television news in the United States has been singled out for diminishing what
politicians have to say to an ever shrinking soundbite (Hallin 1997), for providing only
"episodic" coverage of political issues without making sense of them in their larger thematic or
historical context (Iyengar 1994), for reporting complex political issues in simple terms.
Television news viewing in the United States, Britain, and a number of other countries has been
associated with higher levels of political knowledge, participation, and personal efficacy (Brehm
and Rahn 1997; Norris 1996, 2000). The 1997 British election study, for example, revealed a
positive association between attention to news and higher levels of political knowledge and civic
engagement, and an experiment designed to test the effects of television news in the general
election campaign found that exposure to positive news about a party had stronger effects on
vote choice than exposure to negative news (Norris et al. 1999).
The media has the power to determine who are or is the main candidate(s) in an election.
Favorable media reporting over a period of time can create presidential candidates out of
governors, senators and other political figures. The media create name recognition which is the
essential quality of presidential candidate and the first step to successful election. On the
contrary when the media fail to report activities of an aspiring candidate, they can completely
disclaim him. Once the media have agreed on one candidate as a winner in the party, he receives
the majority of the media coverage and all other opponents are sentenced to sink into obscurity.
Financial contributions to opponents begin to dry up because no one wants to patronize the
losing candidate (Ridout and Smith 2008).
One common aspect of campaign coverage by the media is that they tend to create focus on a
horse race; the candidates who appear to have significant support get more coverage than those
10

who seem to be losing. Studies show that presidential campaigns dominate a horse race kind of
media coverage (Patterson and McClure 1976; Robinson and Sheehan 1983; Steger 1999).
The 2013 presidential elections was dubbed as a two horse race by the Kenyan media following
the release of the opinion polls by Infotrack and Ipsos Synovate that placed Raila Odinga and
Uhuru Kenyatta as the two main contenders of the presidency. This was received with a lot of
contempt by other presidential hopefuls such as Eagle Alliance Peter Kenneth who dismissed
such notions as misleading (Daily Nation, June 4 2013). This was also followed by significant
media coverage of the two leading candidates’ campaigns as they transverse the country looking
for votes.
The media has a tendency of focusing on campaign controversies which are also referred to as
campaign issues. Leighly (2004) posits that the media refers to them as campaign issues since
they were formulated in the context of campaigns and lack the backing of public policy. The
media to a larger extent focus on clear cut issues that candidates take positions on than diffuse
issues which they use to solicit voter support (Patterson 1994). Therefore, when a candidate’s
speech talks of infrastructure development and economic growth, the media focus on his
disagreement his opponent on land reforms. Patterson notes that ‘the battlefield’ is a common
metaphor in the media especially in election news as they concentrate on controversies. During
the 2013 elections of Kenya, the media focused on Jubilee Coalition presidential candidate
Uhuru Kenyatta and his running mate William Ruto ICC case and also the formers vast land
ownership.
The media focus on controversies is attributed to commercial pressures that require news outlets
to be sensational in order for them to attract a larger audience. News organizations use this as
their bargaining chip as they negotiate advertising charges (Kaniss 1991). For instance, the story
of John Kerry lying about his heroism in Vietman would appeal to a larger audience than his
plan to reform the health sector (Ridout and Smith 2008). So news audiences are put on a steady
diet of controversy and conflict from the campaign trail by reporters.
2.1.2 Political Advertising
Political advertising also referred to as issue or advocacy advertising plays a big role in
proposition and ballot election and in the advocacy of public policy and issue groups. Modern
11

political advertising is characterized by control of the message and use of mass media for
distributing messages (Kaid, 1999). The ability to control the message is relayed to the audience
is one of the greatest advantage of all forms of political advertising. Other forms of political
communication such as speeches, debates are subject to interpretation or filtering by the news
media.
Control over political ad messages by the source distinguishes it from news content messages.
Political ads allow for inclusion of messages that advocate for the election of candidates and
parties as well as solicit support on political ideas. The channels used in political advertising
include newspapers, posters, broadcast and cable advertising, internet and other electronic
distribution systems (Kaid 1995). The definition of political advertising also encompasses the
free broadcast time that is given to candidates and parties in some countries apart from the free
internet.
Political advertising is considered the modern form of promotion for politicians in democratic
systems of government. Television political advertising is the dominant form of communication
between candidates and voters in presidential elections (Kaid 1999 and Johnston, 2001). This
dominance is measured by the amount of funds spent on television political advertising. For
instance in the 1988 U.S. elections, George W. Bush and Dukasis spent over $ 80 million on
electronic advertising (Devlin, 1989). In the 1996 elections, Clinton, Dole, Al Gore and Perot
advertising expenditure was reported to be $ 200 million. Television is the most dominant
medium in the U.S. electoral process. However, the American style of television advertising is
slowly gaining significance in political processes of other democracies in the world (Kaid 1999).
The differences in mass media systems and cultural constraints are responsible for the speed at
which other democracies have made television advertising a central part of their electoral
politics.
The use of candidate centered advertising is a distinctive feature of American political campaign
processes and has been adopted in the European political campaigns. However, European
countries have stringent restrictions on televised political advertisement than those in the U.S. In
the run up to the 2013 elections in Kenya, media outlets came up with rules and guidelines that
were to be observed by political actors if they wanted them to run their political advertisement.
For instance Nation Media group developed 11 guidelines which they used in vetting
12

advertorials for both their print and electronic media. In the aftermath of the 1988 U.S. elections,
Washington Post Columnist David Broder called on journalists to take a watchdog role in
assessing the validity of claims in political advertising after George W. Bush made attacks on his
competitor Micheal Dukasis Broder (Kaid 1992).
Evidence from studies on the effects of political advertising on voter knowledge behavior
indicate that exposure to political ads enhances candidate name recognition by citizens (Kaid
1992). A study of the 1992 California U.S. senate race found that paid advertising exposure can
be a predictor of candidate recognition than news coverage on television or newspapers. Studies
also show that exposure to political ads influences what voters recall about a campaign issue and
a candidates position on it. The type of advertisement also affects voter’s ability to recall and
research shows that negative ads produce higher recall levels than positive ones. It has been
argued that political ads are superior to television debates.
With regards to the effects of political ads on voter behavior, studies show that campaign
spending seems to have a relationship to voter turnout and success for the candidate (Weaver-
Lariscy & Tinkman 1976; 1987). Wattenberg (1982) found a relationship between spending for
advertising in Congressional campaigns and the salience of candidates for the electorate. Bowers
(1975), notes that newspapers have been covering political ads for a much longer period of time
compared to television which peaked in the 1980’s and subsequent years.
2.1.3 Radio and Television
In the 1920’s, the radio provided a new channel for politicians to campaign. Politicians were then
able to directly communicate with citizens, dispersing their messages over large geographical
locations and thereby bypassing the hostile reporters. Radio played an important role in the 1932
presidential campaign when Franklin D. Roosevelt was elected. Roosevelt’s speeches were brief,
interesting and dramatic; he knew how to use a friendly, conversational style. He scheduled
periodic ‘Fireside Chats’ with the American public, using them to promote his ‘New Deal’
programs.
The emergence of television changed the image of political campaigns as it made a mass
audience available to the candidates for the first time. The first president to make an appearance
on television was Franklin D. Roosevelt while opening the New York World’s Fair in 1939.
13

Harry Truman spoke about the Korean War to a mass audience through the television in 1950.
By 1952 millions of Americans had television sets in their living rooms which implied that
candidates could get television coverage though at a cost and advent of new campaigning styles
that focused on the image of the candidate (Sherrow, 1992).
On 26 September, 1960 the first presidential debate was aired on the television. Senator John F.
Kennedy and Vice President Richard M. Nixon sat in a Chicago television studio, along with
four news people from ABC, CBS, and NBC who were to question the candidates about
domestic policy. This televised debate influenced the election and Kennedy became the next
president (Best and Hubbard, 1999). Presidential debates are major events that provide
candidates with an opportunity to sell the policies and agenda to the electorate. Unlike
convections, debates are highly visible events that can significantly improve a candidate’s
position in the polls. They frequently leave voters with lasting memories such as in the U.S.
when Ronal Reagan asked voters if they were better off than they were five years ago. In Kenya,
presidential candidate Aduba Dida is remembered for the comic relief that he provided while
responding to questions during the televised presidential debate.
An overall conclusion from Kraus's (1962) volume on The Great Debates of 1960 between John
F. Kennedy and Richard M. Nixon was that the debates mattered whether people watched them
or not. There was so much discussion, especially of Kennedy's performance in the first of the
four debates, that a social reality took shape holding that Kennedy had "won" the debates, and
this perception very likely was an important factor in the outcome of a very close election.
Similarly, media commentary following the Ford-Carter foreign policy debate in 1976
contributed substantially to both the salience and negative evaluation of Ford's statement that
there was no Soviet domination of Eastern Europe (Steeper, 1978).
McKinnon, Tedesco, and Kaid (1993) showed that network commentary after the 1992 debates
between George Bush, Bill Clinton, and Ross Perot lessened Clinton's perceived margins of
victory, and McKinnon and Tedesco (1999) showed that network commentary following the
1996 debates raised perceivers' assessments of both Bill Clinton and Bob Dole. While it is not
entirely predictable how commentators' appraisals might affect voter opinion, it seems clear that
they can and do. Geer's (1988) analysis of the 1976 presidential debate (between Jimmy Carter
and Gerald Ford), and 1984 debate (between Ronald Reagan and Walter Mondale) suggests that
14

they had a sizable but not determinative impact on the voter behavior. Shelley and Hangs (1991)
study of the 1988 election indicate that Bush gained 6 percentage points in the second and
nothing from the first debate. However, Lanoueu’s (1991) analysis of the second debate in 1988
asserts that the second debate had little lasting impact on vote choice.
An opinion poll carried out by Ipsos Synovate after the 2013 Kenya presidential indicated that 40
percent of Kenyans who watched the presidential campaign would vote for Uhuru Kenyatta
while 33 percent said they would vote for Raila Odinga. Peter Kenneth would get 7 percent
while Martha Karua 2 percent (Allafrica.com). In previous polling survey, Raila was always in
the lead followed closely by Uhuru but after the presidential debate, polls indicated that Uhuru
surpassed Raila. Millions of people watch debates, discuss them, and read and watch analyses of
the candidates' performances. They have been shown to play a role in the outcome of every
campaign in which they have been held, and they may have been decisive in several elections.
2.1.4 Printed Material
During colonial times, political candidates campaigned through rallies and the print medium as
there were no radio, television and telephones thus they relied on personal contacts and
newspapers to communicate with the electorate. U.S. presidents owned their own newspapers of
which they had control over which stories got published and were therefore called partisan
papers. These papers targeted the elite audience and at times had offensive content. Politicians
then also used posters, pamphlets and handbills to influence public opinion on various issues and
subsequently win votes. Offensive campaigning which involved calling of names was part of
politics at the time and the 1828 elections has been cited by historians as the first negative
presidential campaign as General Andrew Jackson accused president Quincy Adams of
dishonesty whereas his supporters called Adams a murderer.
As the number of literate people began to rise, new kinds newspaper designs came up which
targeted those who were working. There was also a shift from non-partisan reporting by the
newspapers and by 1940, 48 percent of them were considered independent. It has been noted that
President Theodore Roosevelt utilized the media more effectively than any of his predecessors. .
In 1901 he set up the first permanent White House Press Quarters and appointed his secretary,
William Loeb, as a press liaison. This was truly the beginning of a relationship between the print
medium and the president. Today, newspapers assign reporters to cover campaigns and follow
15
what is going on in the political arena, thus playing an important role in this game. The
politicians also recognize this role, especially during campaigns, and they know that if they deny
the press access to them, they are removing themselves from the reach of the voting public.
2.2 INTERNET AND POLITICS
The internet has transformed the way individuals, organizations, political institutions and
governments communicate and negotiate political information and political roles (Tedesco
1999). Mcluhan (1964) posits that the internet has linked the world through a virtual space
creating what he refers to as a global village. Optimists of the internet argue that it will transform
and stimulate participatory democracy whereas pessimists regard the internet as a tool that
reinforces other political communication channels.
Selnow (1988) defines the internet as a master medium, a revolutionary hybrid of the traditional
medium that offers an opportunity of two way communication feedback loop. Another
revolutionary feature of the internet is its lack of a gate-keeping structure which characterizes the
traditional print and broadcast media (Margolis, Resnick & Tu, 1997). What distinguishes the
internet from other media is its unrestricted access and providing citizens a medium to voice
their political agenda to a worldwide audience. It has also appealed to the political organizations
and political candidates because it offers a source controlled communication and are way
cheaper than advertisements.
Furthermore, the internet has provided political actors’ unlimited space to articulate their
positions on policies and a variety of political information such as press releases, manifestos,
speeches among others (Tedesco et al. 1999). However, Tedesco notes that media skeptics
consider the unmediated aspect of the internet as disadvantageous to the citizens since they
heavily rely on the media to contextualize and interpret information for them. Majority of the
Americans reported that television news is their main source of information which bring into
question if they are able to make informed choices on voting decisions based on television news
(Kaid et al. 2000). Swanson (1992) notes that politicians are held hostage to established media as
they have to package their message to the public according to their news structure.
Thus, the information provided by the internet in the cyberspace enables political actors and
institutions to bypass the new organizations control over the content and tone of political
16
communication. This will result in a decline on the hierarchical dependence on established
media though observers note that there is the challenge of too much raw information on the
internet that is unofficial and unsubstantiated (Barber, Mattson, & Peterson 1997). Although
political observers are not quick to assign democratic merits to the internet solely based on its
structural attributes, they suggest that if nurtured, it can a spontaneous source of information and
interaction.
2.2.1 Structure and Benefits of the Internet
The internet potential to contribute to participatory and direct democracy according to an
analysis of the 1996 U.S. presidential elections, specifically the political websites, by researchers
at Rutgers University (Barber et al. 1997). The findings of the study demonstrated the internet
contains structural possibilities that enhance democracy and include: inherent interactivity,
potential for vertical and horizontal communication, direct/non hierarchical modes of
communication, low user costs, its instantaneous, not limited to physical boundaries and free
from government interference (Barber et al. 1987).
In addition to the above structural advantages of the internet as a political tool, Sparks (2001)
includes anonymity of social actors, search mechanism and discursive requirements. Sparks
asserts that anonymity is the internet’s central advantage since it eliminates socially identifiable
criteria such as sex, age and race that may cause prejudices or exclusion of individuals in
political dialogue. Despite these advantages, researchers note that most political websites have
failed to exploit the internet’s interactive potential and succumbed to obstacles of information
overload, hierarchical structure and non interactive design (Barber et al. 1997).
2.2.2 Internet Access and Digital Divide
As the internet penetration rate increases, candidates and political organizations will definitely
rely more on the medium as a means of communication with their constituents (Tedesco, 1999).
Criticism on the role of the internet in politics has been founded on the issue of limited access.
Researchers have attributed the disparity in internet access to economic factors. Anderson et al.
(1996) during the time of his study noted that the usage of computer mediated communication in
America was 3 percent in low income households and 23 percent in high income households.
Hacker (1996) notes that citizens’ have to be tech-savvy for there to be electronic
17

democratization, and adds that those who are active online use other available mediums for
political participation. A 1996 survey by Pew Research showed that the population online was
younger, more educated, most were male and wealthier than the average population. Also, the
diffusion of the internet appears to be following the diffusion pattern of other innovations.
What began as a media outlet that was skewed from the general public because it represented
mostly young, well educated, and affluent (Gainous and Wagner, 2007; Davis, 2005), has since
expanded at exponential rates. According to Gulatti and Williams, education, income, ethnicity,
age and urbanization are all potential influences on a candidate’s Internet use (2010).
Approximately one in three young voters under the age of thirty-six rely on the Internet as their
main source of political information (Panagopoulos, 2009).
However, other researchers have also found the Internet guilty of exacerbating the pattern of
unequal participation based on income (Mossberger and Stansbury, 2003). This further
encourages the digital divide between the haves and the have-nots. Ironically, because findings
on race and ethnicity have been mixed, education has become the most important factor in the
digital democratic divide (Mossberger and Stansbury, 2003). Through the obvious correlation of
education and income, the Internet encourages the digital divide shifting the focus from
outreaching to potential voters to reinforcing participation. Furthermore, even though the Internet
alters the resources necessary for political activity, the individuals who are participating online
are similar to those participating offline (Best, 2005). This sequence further encourages an ever-
evolving circle where Internet participation is reinforcing rather than supplementing. Therefore,
the Internet is not capturing new, potential voters, but instead encouraging and supporting the
beliefs already in place.
2.2.3 Civic Engagement and Participation
The 1992 Clinton campaign is credited as being the first to distribute speech text over the
internet (Wilhock, 1997). His administration with Al Gore promoted electronic democratization
by publishing general information and press releases on the internet in January 1993. By the time
the 1996 elections reached, serious presidential candidates, Congressional hopefuls and interest
groups had established an online presence despite them developing basic websites. D’ Alessio
(2000) analysis of the candidate’s adoption of the internet between 1996 and 1998 indicated that
they preferred adopting the medium as a campaign tool. However, he equated their online
18
presence with an online brochure as they failed to capitalize on the potential of the medium to
promote participatory democracy.
The internet also provided an opportunity for financially mismatched politicians to increase their
popularity through campaigning as it was less costly compared ot other mediums. Websites
provide unmediated access to internet users. Klotz (1997) analysis of the 1996 election shows
that 50 out of 68 party candidates in the senate race had a website. Whillock (1997) posits
strategists for underdog candidates viewed the medium as a means to by-pass the filters of the
traditional media before their message gets to the public.
Studies on the effect of computer mediated political communication in relation to political
activity shows that those who are motivated to use technology exhibit high patterns of political
participation (Garamoe et al 1996). Garamoe adds that new technology has further widened the
gap between the politically active and inactive. Similarly Baran (1995) and Hacker (1996) note
that this would widen the gap between those who are economically and educationally privileged
with the underprivileged.
2.2.4 Internet and Political Mobilization
A survey conducted during the 1996 U.S. elections by Chandrasekaran (1996) indicated that
about 8.5 million Americans admitted that their voter decision was influenced by the information
they had found on the internet. Norris (2000) notes that the influence of the internet on politics
has been speculated on the support of mobilization and reinforcement theories. Mobilization
theories argue that virtual democracy will bring abundance empowerment in a digital world
whereas reinforcement theories argue that internet usage will not transform but strengthen the
existing patterns of social inequality and political participation. Most research on internet with
regards to political communication applies the arguments in one of the above theories. The
common ground for majority of political communication research on the internet is based on
whether it is becoming a new medium form of political engagement or whether it is
strengthening the existent power structures (Norris 2000).
There is optimism among scholars that the internet will empower online communities of
likeminded individuals, create a more informed electorate (Sullivan 2000)and reunite those who
had been alienated politically (Keane, 1995). However, there are scholars who do not share the
19

optimism expressed above. Margolis et al. (1997) argues that despite the fact that the internet has
lowered informational costs, established parties will transfer their offline advantage to the web
thus making it difficult for lesser know parties to build new constituents. Scholarly debate exists
in whether the internet will realize its full potential or whether follow a similar pattern to the
print and broadcast media. Nueman (2001) argues that the internet would further fragment the
society in general as it tends to isolate people from each other on the other hand Rheingold
(1995) holds that the internet would transcend the limitations of the existing mass media.
A study by Hill and Hughes (1997) on on-line USENET groups where they analyzed 1000
messages from a sample 22 political USENET group revealed that they function just like other
political groups where individuals debate, share information, recruit volunteer and reinforce their
social structures. Kern (1997) asserts that candidate and political parties were exploring new
avenues for communication such as the internet in order to reinvigorate their social capital. This
can be achieved through building online communities, through bulletin board information
exchange and reducing the distance between the government and the governed (Norris, 2000).
Scholars argue that the internet may not only be reinforcing political behavior but also media
behavior. For instance the decline use of local and national television and newspaper can be
attributed to the growth of the internet, research shows that internet users and non users still rely
on the traditional media for news (Stempel, Hargrove and Bernt, 2000). Stempel et al. (2000)
further notes that internet users are heavy newspaper readers thus they can be described as
information seekers. Therefore, the internet serves as a reinforcement agent for information
seekers and this would result into widening of the divide between the information rich and
information poor.
2.3 SOCIAL MEDIA AND POLITICS
Social Networking Sites (SNS) are the main form of communication for social media and thus
the definition of SNS applies to Social media. Boyd & Ellison (2007) define social media
networking sites as internet-based applications that allow users to develop a public profile within
a closed system, have a list of users whom they have a relation with, and are able to view their
own friends list and that of others within the system. This is generally the model that social
media follow. They include Facebook, Twitter, MySpace, blogs, and YouTube.
20

Kushin and Yamamoto (2010) posit that the growth of online political behavior has been partly
facilitated by the recent emergence of new interactive, media rich websites. These social media
sites exist under the conceptual umbrella of Web 2.0. The ability to express political views and
opinions online plays an important role for social media in campaigns.
Social media allow users to not only seek information but also interact with others through
online expression such as posting political commentaries on blogs and social network sites and
sharing multimedia commentary (Kushin and Yamamoto 2010). In past campaigns, Facebook
users have expressed themselves politically in many ways, such as making online donations,
encouraging friends to vote, or posting graphics or status updates expressing political attitudes
and opinions. Twitter and blogs have been used by candidates and voters to comment on social
and political issues, share information and encourage participation (Kushin and Yamamoto
2010).
Facebook allows its members to form groups based on a shared topic or theme and connect with
others of the same interest. Once members join a Facebook group, they can post to the group‘s
wall, engage others on an open discussion board, and share photographs, videos and other media
files. To date, several thousand groups have been organized along a political theme (Calahan, E.
& Hughes, C., 2006). On each profile, Facebook displays the number of supporters for each
candidate and provides a continuous snapshot of each candidate‘s percentage of vote in his or her
race. According to Hernnson, et al. (2007), internet use declines with each advancing age group.
Urban areas have greater Internet use than rural areas, but the difference has declined
substantially. These constituency demographics in turn influence candidates’ internet use.
William and Gullati (2006) in a study investigating the use of Facebook for campaigning by
Congressional candidates in the 2006 U.S elections found that candidates who campaigned on
Facebook in 2006 won a larger share of the vote than candidates who did not campaign on
Facebook when controlling for all other variables. In addition, incumbents added 1.1% to their
vote share by doubling the number of supporters on Facebook, while open-seat candidates added
3% by achieving that same increase (William and Gullati, 2006). However, they acknowledge
the need to see how this new technology plays out over several elections and further empirical
research before designating online social networks as a major determinant of election outcomes.
21
If future research can confirm these findings and demonstrate a causal connection between
online strategies and votes, then Facebook and other social networking sites will be an essential
took in enhancing the democratic process. Williams & Gullati (2008) observe that a strong,
viable online campaign can translate into votes, but it is not a substitute for traditional campaign
resources. Rather, it is most effective when highly developed and then integrated with more tried
and true forms of campaign communication and mobilization (i.e., the Barak Obama campaign)
and can be somewhat useful to campaigns that have some place for it in their grassroots
networking strategy. Facebook and other online social networks can offer very little benefit,
however, to candidates who do not integrate the online network into their offline network (e.g.
the McCain and Romney campaigns).
The 2008 US elections were a defining moment for the use of social media in politics.
Demonstrating clearly the importance of internet political campaigning, President Barack
Obama’s campaign staff relied profoundly on social media to engage voters, recruit campaign
volunteers, and raise campaign funds. Statistics provided by Graber (2010) indicate that Obama
had 2 million Facebook friends while McCain had only 600,000. Disparities such as this were
seen on other social media outlets like YouTube, Twitter, Flickr, Digg and BlackPlanet (Graber
193). Obama spent millions on advertising on Facebook and Google, while McCain used mainly
television advertisements (Graber 194). Obama focused on social media sites to target young
people and mobilize millions of volunteers, as well as receive donations. The campaign used
social media to connect with voters and supporters. His widespread use of social media seemed
to be a major factor in his victory over John McCain.
Also, a study by Matthew James Kushin and Masahiro Yamamoto published in Mass
Communication and Society, provided insight into the social media habits of young people
(adults under the age of 30), a demographic targeted by Obama in the 2008 campaign. The study
found that young people tend to get political information from social media more than any other
age group (Kushin and Yamamoto). Bimber and Davis (2003) found that Internet users are not
attempting to bypass traditional media. Rather than using the Internet to displace information,
people are supplementing their current positions with information gathering (Bimber and Davis,
2003).
22
Therefore, the people who are already interested in politics are supplementing the information
they already currently have, displaying that the Internet is not attracting new uninterested voters
into making a conscious choice. Moreover, Hill and Hughes also believe that the Internet
reinforces beliefs that are already developed rather than fundamentally changing people and their
attitudes (1998). The Internet is reinforcing the already present political attachments, providing
additional data and information for voters who are seeking to bolster their vote choices (Bimber
and Davis, 2003). Again, the Internet is enabling voters to find out additional information, not
transform them.
Gibson and McAllister‘s (2006) recent analysis of the 2004 Australian national elections
suggests that online campaigning can have a positive impact on a candidate‘s share of the vote.
Even when controlling for financial resources and competition, they found that having a web site
increased a candidate‘s share of the vote by an average of 2 percent. Gibson and McAllister‘s
findings are not specific to the Australian context since U.S. congressional candidates who
campaigned on Facebook in 2006 won a larger share of the vote than candidates who did not
campaign on Facebook when controlling for all other variables.
D‘Alessio‘s (1997) analysis of the 1996 U.S. Senate elections found that candidates who
launched a campaign web site won, on average, 9,300 more votes than candidates who had no
web presence. Yet this study omitted a number of theoretically important variables, including
financial resources and competition. Since these two variables are correlated with both a web
presence and votes, the observed relationship between web presence and electoral success is
likely spurious. Bimber and Davis‘(2003) in-depth case studies of online campaigns in 2000
further called into question a causal connection between web site presence and vote choice. They
found that citizens ‘viewing of candidates’ web sites had no impact on their decisions about
whether to vote or their vote preference. These findings were derived from research on only a
limited number of races, leaving open the possibility that a positive relationship between web
site presence and vote shares exists more generally.
Wagner and Gainous (2009) also found that web presence is a significant predictor of the total
votes obtained in the 2006 Congressional elections, even when controlling for funding,
experience, and incumbency. This demonstrates that candidates are evolving from simply
supplementing traditional media outlets to engaging the Internet as part of a detailed campaign
23

strategy to win office. Because web presence could be influencing the amount of total votes
obtained, candidates can strategically use the Internet to bypass the once circular motion of
participation and use online campaigning to their electoral victory benefit. Specifically
examining campaigning with Twitter, Williams and Gulati (2010) found that constituency
attributes also influenced the decision to adopt Twitter as a medium of campaigning without
affecting the impact on Twitter usage. This previous research suggests that candidates implement
the Internet as a campaign tool when it will aide and expand the current campaign.
2.3.1 Social Media and Politics in Africa
The Internet’s role in democratic or developed countries can be quite different from its role in
less democratic or developed countries, especially where freedom of speech is not guaranteed
and the state controls the media. In such countries, the Internet can be a catalyst for dramatic
outcomes. Social networking sites, in particular, played a crucial role in the 2011 revolts in
Tunisia, Egypt, and Libya to build extensive networks, create social capital, and organize
political action with a speed and on a scale never seen before. Thanks to these technologies,
virtual networks materialized in the streets.
In light of presidential campaigns, social media is taking shape in Africa with political
candidates and campaign strategists embracing social networking sites such as Facebook and
Twitter to engage their supporters. A lot of similarities can be drawn from the use of these
networking sites by political actors in Africa with the Obama Campaign which has been referred
to the ‘Americanization’ of campaigns.
In 2010, Nigerian President Goodluck Jonathan announced his bid for the highest office on
Facebook. According to a2010 article By George Webster on the CNN website, his Facebook
status update on September 15 read "I Goodluck Ebele Jonathan by the grace of God hereby
offer myself and my services to the Nigerian people as a candidate for the office of President”.
At the time, he had over 200,000 fans on this popular networking site and in 24 hrs he already
had 4,000 more people joining his page. During his presidential campaign in 2011, Dr. Goodluck
Jonathan through Facebook was able to establish a new relationship model between politicians
and their supporters as he personally responded to comments made by his followers, for instance
a youth named Toyin Dawodu indicated that he had an idea for a project that could deliver 4,000
MWs of electricity. In his response, president Goodluck said “Toyin, someone from my office
24
will make contact with you regarding your idea. I know I cannot attend to every comment or
suggestion due to time constraints, but please do know that I read them and they influence my
actions."
Five years ago, there was little interest in the use of social media for campaigning purposes in
Ghana. The situation was different in the Ghanaian 2012 elections as most of the candidates had
adopted the digital media to raise their chances of winning. The current president of Ghana, John
Dramani Mahama, frequently engaged his follower on a verified twitter account during his
campaign. Other candidate also established an online presence by using social media to respond
to questions from their supporters and clarify any issue that had arisen during the campaign. The
Institute of Economic Affairs (IEA) organized a presidential debate in Ghana that was dedicated
a live YouTube channel where Ghanaians both local and internationally could access through a
live feed. Social media acted as source of information for some citizens during the election
season as they followed the hashtag #GhanaDecides on twitter which trended worldwide.
In Botswana, one of the most reputed democracies in Africa, leading politicians in the country
are intensively campaigning on social media ahead of their 2014 elections. The battling ground
has now shifted to Facebook with the ruling Botswana Democratic Party (BDP), Botswana
Movement for Democratic (BMD) and Botswana Congress Party (BCP) reaching out to potential
voters online (Daily Nation, March 9 2012). Botswana president Ian Khama addresses national
issues by responding to posts on the BDP Facebook wall which approximately receives 4,000
visits a day. Khama’s interaction with people on the social network has earned the title “man of
the people” (Daily Nation, March 9 2012).
As opposed to 2007 elections, 2013 elections were held during a period when Kenya was rated
as the 2nd most tweeting nation in Africa. According to a survey by Portland Communications,
Kenyans had an average of 2,476,800 tweets in a period of three months placing it second after
South Africa which had 5,030,226 tweets. Also, statistics from socialbakers.com indicate that
the number of Facebook users in Kenya is about 2,007,960 with the majority of users lying
between the ages of 18-24. The significance of this is the proof that millions of Kenyans are
getting online. By CCK's stats, more than 10 million Kenyans access the internet, majority of
these through their mobile phones.
25

All presidential candidates had a significant number of supporters and followers on the two main
social networking sites, Facebook and Twitter. In fact, excluding media houses and celebrities,
they are the most liked and followed Kenyans on Facebook and Twitter respectively. The main
presidential candidates had official campaign websites apart from their social media accounts.
The 2013 elections had eight presidential candidates namely Peter Kenneth, Martha Karua,
Musalia Mudavadi, Raila Odinga, Uhuru Kenyatta, Aduba Dida, Paul Mwite and James Ole
Kiyiapi. However, of the eight candidates, Narc Kenya presidential candidate Martha Karua had
the largest following on Twitter (@MarthaKarua) with 63,000 followers on Twitter whereas
Eagle Alliance candidate Peter Kenneth had the most following on Facebook with 165,000 likes
on his page. The election winner Jubilee alliance candidate, President Uhuru Kenyatta equally
had a significant following on both Facebook and Twitter with The Guardian naming him among
the top ten most active African politicians on social media. These three candidates carried
intensive campaigns on these two social networks in bid to reinforce their support base and also
create new constituents of followers.
The scramble for the youth votes saw presidential aspirants intensify their campaigns on social
networking sites, making them become official forums to address and appeal to young people.
On the sites, they posted updates about their activities, statements they released to the media and
where they were planning to go hold campaign rallies. Martha Karua had a “AskMartha” session
every Thursdays on Twitter where she would engage with her followers, responding to queries
they fielded to her. Peter Kenneth followed the same trend on Facebook where he would respond
to posts on his Facebook wall by his friends on the network. He also used the network platform
to solicit financial assistance from his followers in bid to support his presidential campaign
activities (Daily Nation, October 5 2012). He equally caused a lot of ripples during his
campaign launch after his son speech which was positively received by the public and
subsequently sparking discussion on social media after the video went viral on YouTube.
However, despite Martha Karua and Peter Kenneth acquiring a largest following on social media
by consistently engaging the public on Twitter and Facebook, they both performed dismally
when it came to the 2013 elections whereas Uhuru Kenyatta who equally campaigned on social
media obtained over 50 percent of the total votes casted. In an article in the Daily Nation
newspaper dated 21/1/2013, Social media consultant Nanjira Sambuli notes that the Kenyans
26

online are very active participating in conversations on policies and governance and discussing
issues with people who have different viewpoints. She asserts that this will have an impact on the
political culture of the country in the long run. Although social media provides a significant
reach of the Kenyan electorate online, it has not penetrated enough to replace the traditional
methods of communication. According to Gullati and Williams (2010), education, income,
ethnicity, age and urbanization are all potential influences on a candidate’s Internet use.
2.3.2 Access to Social Media in Kenya
According to the Communication Commission of Kenya (CCK) 2nd quarter report of the
2012/2013 states that the number of estimated internet users stands at 16.2 million in 2013 up
from 14.5 million as posted in the previous quarter. This represents a growth of 11.6 percent
during the period. This increase is attributed to growing demand for Internet and data services,
including use of social media especially among the youth.
Figure 2.1 Estimated number of Internet Users and Internet Penetration
Synovate (2009) conducted a survey to find out which social networking site people visited
most. They found out that more than 2 million people are on Facebook, outweighing other social
networks. TNS Research International conducted a survey in 2010 to help organizations
understand how people in Kenya use the internet. The research found out that out of a sample of
1421 internet users who have visited a social networking site 56% contributed to a discussion
(Kenya ICT Board, 2010). The above statistics point to the fact that SNS contributes to non-
27

institutionalized political participation. The SNS today have the potential of building on the
backbone of associational life to promote greater democratic participation in Kenya.
The CCK quarterly report further notes that mobile penetration increased to 78.0 per 100
inhabitants up from 77.2 recorded during the previous quarter. This represented a quarterly
increase of 0.8 percentage points, compared to the same period of the previous year that recorded
an increase of 6.7 percent. The mobile data subscribers continued to dominate the internet,
representing 99 percent of the total subscriptions. These statistics show that the penetration of
mobile phones has facilitated the penetration of the internet and subsequently its usage. The
growth trend in the mobile penetration is shown in Figure 2.
Figure 2.2 Mobile Penetrations in Kenya from December 2011 to December, 2012 in (%)
2.4 Theoretical framework
This paper adopts the Network theory and the Mobilization theory to explain the role of social
media in the 2013 Kenya presidential election campaigns.
2.4.1 Network Society theory
Network Society theory was posited by Manuel Castells. In this theory, Castells argues that
social media is an effective tool for organization and mobilization due to the characteristics of
social networks that facilitate political activism. This includes the anonymity provided by the
internet, creation of weak ties and the unrestricted nature of online communication. The internet
allows for creation of weak ties with strangers through open interactions where individuals social
characteristics does not influence or hinder communication. Weak ties are useful in providing
28

information and opening up opportunities at a lower cost compared to other forms of
communication such as face to face communication.
The strength of a tie is determined by the amount of time invested in the communication,
emotional intensity, degree of intimacy and the reciprocal services which characterize the tie.
Therefore, social media networks are founded on the weak ties that exist among acquaintances
that either have mutual friends or share the same interests. The strength in weak ties lies in their
ability to introduce us to new ideas and new information, and the Internet which facilitates
fostering of these ties due its incredible speed and wide geographical reach.
Sociologist Mark Granovetter in his seminal 1973 study, The Strength of Weak Ties, analyzed the
connection between individual or small group interactions (micro-level) and large population
(macro–level) interactions in social networks. Granovetter concluded that the strength of weak
ties lies in their ability to facilitate political organization, social mobility, diffusion and social
cohesion in general across different networks. Weak ties are advantageous compared to strong
ties due to their ability to diffuse information and ideas across social groups.
Granovetter illustrates the application of this theory using the example of how a rumour is
spread. If a person shares a rumour with a friend he considers close (strong ties), then the friend
passes the rumour to another close friend, there is a possibility of individuals hearing the rumour
multiple times since it tends to revolve around friends with strong ties. This implies that the
information stays or contained among one social group. When this is applied in political
mobilization, the same rule applies. For example if president Obama during his 2008 election
campaign only spoke to close friends or family members then he would not be able to mobilize
volunteers, resources and voter support that was instrumental for running his campaign and the
resultant election win.
By capitalizing on the weak ties that are forged online through social networks such as Facebook
and Twitter, politicians have been able to interact with diverse groups and communities and
mobilize the electorate to support their bids for elective posts. In conclusion, weak ties that are
established online help politicians to campaign on their candidature, solicit support and resources
through sharing their posts and messages thus information is not confined among ones supporters
only.
29

2.4.2 The Mobilization Theory
Strandberg (2006) identifies that the mobilization theory provides a summary of several positive
predictions regarding the internet’s ability to shape the political activity of citizens. The theory
argues that the internet has the ability to inform, organize and engage those who are currently
marginalized from the existing political system so that these groups will gradually become drawn
into public life and civic communities.
There are four arguments in support of this view: First, the internet provides an ample
opportunity for political engagement. Second, citizens are able to learn about public matters
easily and at a low cost over the internet. Third, the unlimited information accessible on the
internet gives citizens opportunities to become more informed about public affairs, and thus
more articulate in expressing their views, and more prone to become active concerning public
matters. Fourth, the internet facilitates two-way communication which could help strengthen and
enhance the links between citizens and intermediary organizations. In sum, the internet provides
a unique opportunity for political participation besides the traditional channels for participation.
Lusoli & Ward (2004) posit that the mobilization theory credits the internet with the ability to
inform, engage and activate citizens. They argue that the size of the political online audience has
grown overtime due to the increased penetration of the internet and shift in user preferences in
seeking out political information. Scholars have noted that the internet has increasingly become a
source of political information especially among the youth who are normally less active
politically. Researchers such as Gibson et al. (2005); Norris, (2003) argue that the findings from
their study of the internet indicate that it is has provided an opportunity for political engagement
for those who in other circumstances might not have been active.
On the other hand, scholars such as Johnson and Kaye (2003) argue that the internet has not
changed the wider democratic process but has empowered individuals politically by increasing
their level of political involvement, campaign interest, political interest and their likelihood of
voting. These scholars exemplify their faith in the internet’s ability to facilitate engagement of
citizens.
However, there is a counterargument that questions the optimism expressed by the above
mobilization proponents. Norris (2011) refers to this as the reinforcement theory. This theory
argues that political activity online cannot activate or engage citizens for two reasons. First,
30
access to the internet requires technological resources which are unevenly distributed in different
countries due to socioeconomic reasons. Second and most important, it has been argued that
online politics only attracts citizens who have been active and engaged in offline politics. All
these affect the use of the internet for political mobilization.
2.5 Study Gap
Previous studies on social media indicate there is a positive relationship between online presence
and vote shares such as Gibson and McAllister‘s (2006) study of the 2006 Australian elections
and William and Gulatti (2006) 2006 U.S. elections. However William and Gulatti (2006)
suggest that there is need for future research to confirm these findings and demonstrate a causal
connection between online strategies and votes.
31
CHAPTER THREE
RESEARCH DESIGN AND METHODOLOGY
3.0 Introduction
This chapter describes the research design and specific methodology that was adopted by this
study in examining the role of social media in the 2013 Kenya presidential election campaign. It
includes sampling procedure and sample size, target population, research location, research
instruments, data collection procedure and data analysis.
3.1 Research Design
Research design refers to the method used to carry out a research. Cooper and Schindler (2003)
defined research design as the scheme, outline or plan that is used to generate answers to
research problems. The research design that was applied in this study is descriptive survey
research. Descriptive survey research is a method of collecting information by interviewing or
administering a questionnaire to sample individuals (Orodho, 2003). It can be used when
collecting information about people’s attitudes and opinions on social processes such as the
presidential elections. Qualitative and quantitative methods of research were used in this study to
collect both discrete and non discrete data (Mugenda and Mugenda, 2003).
The researcher used both primary and secondary sources of data. In primary sources, the
researcher gathered information directly from the respondents by use of the questionnaire and
interviews. Secondary sources involved collection of information from journals, papers and other
available literature on social media and political campaigns.
3.2 Area of Study
The area of study was Nairobi County, specifically the University of Nairobi. This is because the
study was targeting the urban youth who are most likely to be using social networking sites.
According to Hernnson, et al. (2007), urban areas have greater internet use than rural areas, but
the difference has declined substantially.
3.3 Population of the Study
A population is a group of individuals, objects or items from which samples are taken from for
measurement (Kombo and tromp, 2006). The population of this study was the urban youth who
32

are most likely to be found in universities. Therefore the researcher targeted university students
who are enrolled in the undergraduate programs. According to socialbakers.com (2003), majority
of social media users are individuals between the ages of 18-25 that are considered as the youth.
3.4 Sampling Techniques and Procedure
A sample is a finite part of statistical population whose properties are studied to gain information
about the whole (Webster, 1985 as cited in Kombo and Tromp, 2006:77). According to Mugenda
(2003), a large sample size is required when the accessible population is highly heterogeneous on
the variable under study. He further adds that if it were possible for the population to be wholly
homogenous, then studying one case would be enough. Therefore, the sample size used in this
study was considered adequate and representative since the population of university students is
homogenous. The study used a sample of 216 university students who were obtained from the
undergraduate student population. Two sampling techniques were used: purposive sampling and
stratified sampling.
Purposive sampling is a sampling technique that allows a researcher to use cases that have the
required information with respect to the objectives of his or her study. Cases of subjects are
therefore handpicked because they are informative or they possess the required characteristics
(Mugenda and Mugenda, 2003). Purposive sampling can be used as part of a multi-stage
sampling procedure where it is applied to get the location or districts in which the units of
observation have the required characteristics (Mugenda and Mugenda, 2003). The researcher
selected Nairobi County and specifically the University of Nairobi (UON) as the location of the
study. This is because the target population of the study was the urban youth who are most likely
to be found in the universities.
The goal of stratified sampling is to achieve desired representation from various subgroups in the
population. In stratified sampling, subjects are selected in such a way that existing subgroups in
the population are more or less reproduced in the sample. Given the population of university
students are found under various departments/faculties, the researcher divided the sample into
five subgroups based on this criterion. The subjects were then selected randomly under each
subgroup/ stratum proportionately.
33

3.5 Data Collection Procedures and Instruments
Data Collection is gathering specific information aimed at proving or refuting some facts
(Kombo and Tromp 2006:99).This study used qualitative and qualitative methods of research.
Qualitative method enabled the researcher get–in-depth data that are in the form of words; non
discrete data (Mugenda and Mugenda, 2003). In this case, the researcher used interviews and
focus group discussions.
Quantitative method entails techniques and measures that produce discrete numerical data. In
this case, the researcher used questionnaires. An examination of pages on SNS was done to
obtain information on campaigns activities online and trends in the use of the platform. The
researcher was issued with an introduction letter from the School of journalism and Mass
Communication, University of Nairobi to facilitate data collection from the field.
3.5.1 Questionnaire
A questionnaire is a research instrument that gathers data over a large sample (Kombo and
Tromp 2006:89).The questionnaire will have both closed and open-ended questions. Relevant
questions on social media usage and its impact on the users were used to capture the opinions of
students in the University of Nairobi.
3.5.2 Key Informant Interviews
An interview is an oral administration of a questionnaire (Mugenda and Mugenda, 2003). The
researcher interviewed a political campaign strategist to obtain information, views and opinion
on the impact of social media on the presidential campaign process.
3.5.3 Focus Group Discussion
A focus group discussion (FGD) is an in-depth field method that brings together a small
homogeneous group to discuss topics on a study agenda. The researcher used groups of eight
students and with the help of a moderator, stimulates discussions among them to reveal
underlying opinions, attitudes and reasons of how and why they use social media for political
purposes.
34

3.5.4 Data Analysis and Presentation
The data collected from the field were both qualitative and quantitative. The qualitative data was
grouped into different categories for analysis. The quantitative data was keyed into the computer
for further analysis using Statistical Package for the Social Sciences (SPSS).
3.5.5 Problems, constraints and limitation
The target population of the study was undergraduate university students who were estimated to
be of the ages of 18-25. However, there were instances where some respondents were above this
age bracket though they were still undergraduate students.
Given the disparity in internet penetration across the country, some students did not have access
to the internet during the campaign period since they were on holiday and come from rural areas.
Therefore, accessing social media at the time was a challenge for them.
The UON offers other program on different levels of education such as masters and Phd. Thus,
the age bracket of the subjects target by the researcher made students who were enrolled in the
above degree programs not eligible to participate in the study. This is because majority of them
are above 25 years.
35
CHAPTER FOUR
DATA ANALYSIS AND DISCUSSION OF FINDINGS
4.0 Introduction
This chapter undertook to measure and analyzes data using various statistical tools for different
constructs and variables in the study. The results from the study was summarized and discussed
in this chapter. Data from questionnaires was organised, coded, analysed and converted into
quantitative summary reports for analysis using the statistical package for social sciences (SPSS)
version 20.
Data was entered into the program under specific category from which analysis was run to obtain
descriptive statistics in the form of frequencies and percentages. Quantitative data was analysed
using descriptive statistics. Using content analysis technique, data was coded, put into theme
categories and tallied in terms of the number of times it occurred. Qualitative and quantitative
data were linked to enable confirmation and elaborate analysis of the variables.
4.1 Response rate
According to (Fowler, 2004), response rate in a research perspective refers to the extent to which
the collected set of data includes all sample members of the targeted population. Response rate is
calculated by the number of questionnaires collected or the number of people with whom
interviews are completed divided by the number of the entire sample.
The researcher applied purposive sampling technique in selecting the Nairobi County and
specifically the University of Nairobi as the location of the study. This is because the target
population of the study was the urban youth. Majority of them are most likely to be studying in
the universities.
Stratified sampling technique was used in selecting the respondents. Given the population of
university students is found under various departments, the researcher divided the sample into
five subgroups based on this criterion. The subjects were then selected randomly under each
subgroup/ stratum proportionately. According to Mugenda (2003), a large sample size is required
when the accessible population is highly heterogeneous on the variable under study. He further
adds that if it were possible for the population to be wholly homogenous, then studying one case
36
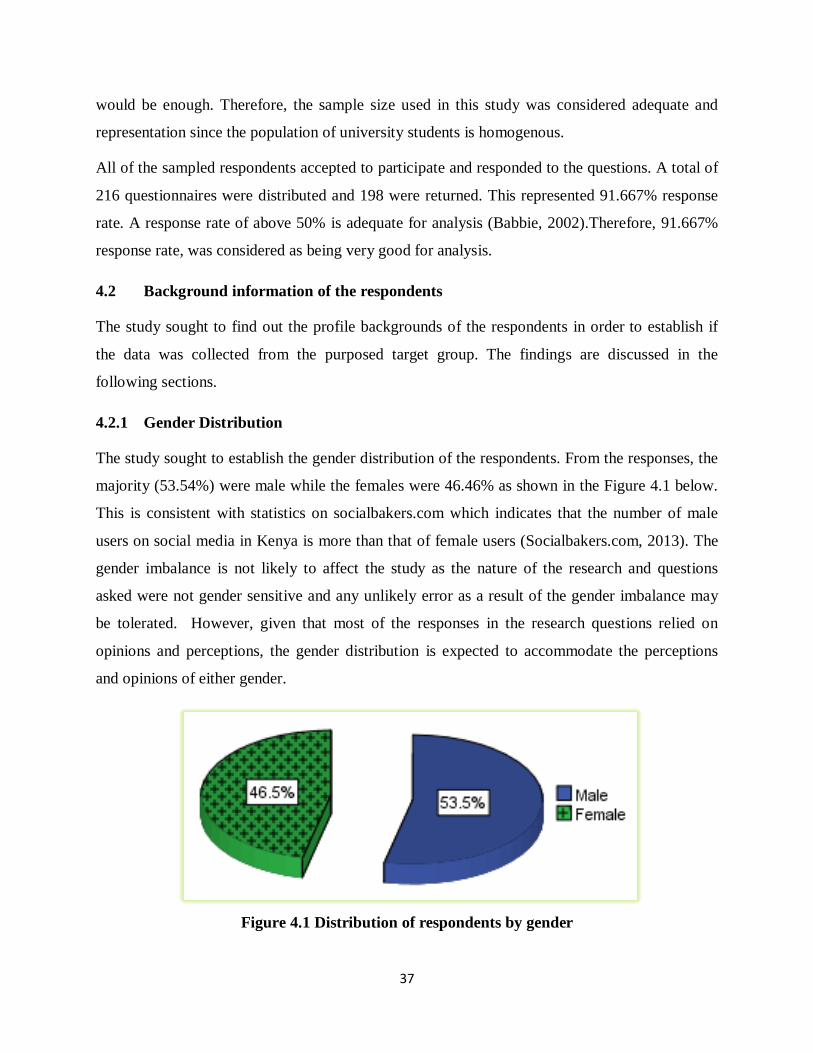
would be enough. Therefore, the sample size used in this study was considered adequate and
representation since the population of university students is homogenous.
All of the sampled respondents accepted to participate and responded to the questions. A total of
216 questionnaires were distributed and 198 were returned. This represented 91.667% response
rate. A response rate of above 50% is adequate for analysis (Babbie, 2002).Therefore, 91.667%
response rate, was considered as being very good for analysis.
4.2 Background information of the respondents
The study sought to find out the profile backgrounds of the respondents in order to establish if
the data was collected from the purposed target group. The findings are discussed in the
following sections.
4.2.1 Gender Distribution
The study sought to establish the gender distribution of the respondents. From the responses, the
majority (53.54%) were male while the females were 46.46% as shown in the Figure 4.1 below.
This is consistent with statistics on socialbakers.com which indicates that the number of male
users on social media in Kenya is more than that of female users (Socialbakers.com, 2013). The
gender imbalance is not likely to affect the study as the nature of the research and questions
asked were not gender sensitive and any unlikely error as a result of the gender imbalance may
be tolerated. However, given that most of the responses in the research questions relied on
opinions and perceptions, the gender distribution is expected to accommodate the perceptions
and opinions of either gender.
Figure 4.1 Distribution of respondents by gender
37

4.2.2 Age Distribution
The study sought to establish the ages of the respondents. From the findings majority of the
respondents were between 18-25 years old while 18.519% were between 25-30 years old, as
indicated in figure 4.2 below. These findings are consistent with statistics on socialbakers.com
which note that the main users of social media are individuals between the ages of 18-25
(socialbakers.com, 2013).
These findings are consistent with a 1996 survey by Pew Research which showed that the
population online was younger, more educated, most were male and wealthier than the average
population. Panagopoulos (2009) further posits that approximately one in three young voters
under the age of thirty-six rely on the Internet as their main source of political information.
The 18.5 % comprises of respondent between the ages of 25-30. This is to a larger extent
attributed to the fact that there are students pursuing post-graduate degrees and diplomas which
are offered at the University of Nairobi. According to socialbakers.com individuals between the
ages of 22-34 constitute the second largest number of social media users after the youth
(Socialbakers.com, 2013). The age imbalance is not likely to affect the study as the nature of the
research and questions asked were not age sensitive and any unlikely error as a result may be
tolerated.
38

Figure 4.2 Distribution of respondents by age
4.3 RQ1: How was social media integrated into the 2013 presidential election
campaign?
The research went out to find how social media was integrated into the 2013 presidential
campaign, as was suggested by research question one of this study. This section discusses the
results.
4.3.1 Presidential candidate followed on Facebook between January and March, 2013
The respondents were asked the presidential candidates they were following on Facebook
between January and March, 2013. Table 4.1 shows the summary of the findings. Out of the
total 198 respondents who filled the questionnaire, 192 responded to this particular question.
Majority of the respondents 34.4% said they followed Raila Odinga. Uhuru Kenyatta was
followed by 25%, Peter Kenneth was followed by 15.6%, Francis Ole Kiyapi was followed by
9.4% and Martha Karua was followed by 6.3%. The candidate with the least number of followers
was Musalia Mudavadi with a 3.1%.
39
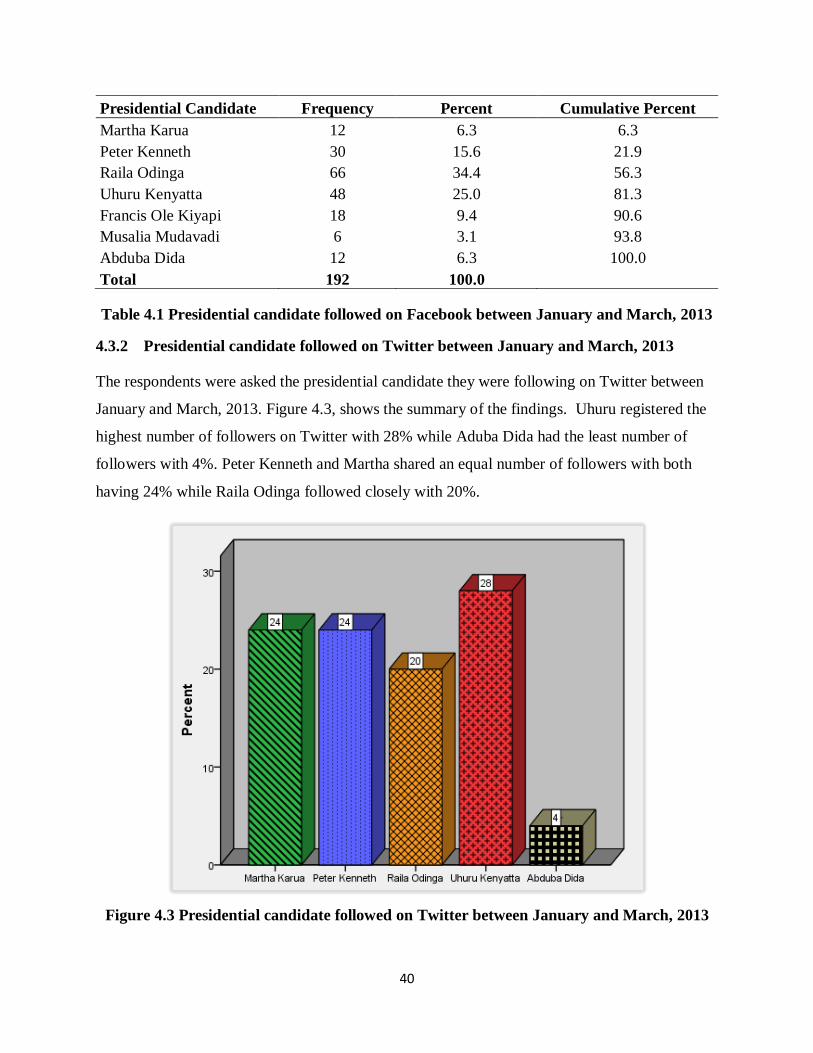
Presidential Candidate Frequency Percent Cumulative Percent Martha Karua 12 6.3 6.3 Peter Kenneth 30 15.6 21.9 Raila Odinga 66 34.4 56.3 Uhuru Kenyatta 48 25.0 81.3 Francis Ole Kiyapi 18 9.4 90.6 Musalia Mudavadi 6 3.1 93.8 Abduba Dida 12 6.3 100.0 Total 192 100.0
Table 4.1 Presidential candidate followed on Facebook between January and March, 2013
4.3.2 Presidential candidate followed on Twitter between January and March, 2013
The respondents were asked the presidential candidate they were following on Twitter between
January and March, 2013. Figure 4.3, shows the summary of the findings. Uhuru registered the
highest number of followers on Twitter with 28% while Aduba Dida had the least number of
followers with 4%. Peter Kenneth and Martha shared an equal number of followers with both
having 24% while Raila Odinga followed closely with 20%.
Figure 4.3 Presidential candidate followed on Twitter between January and March, 2013
40
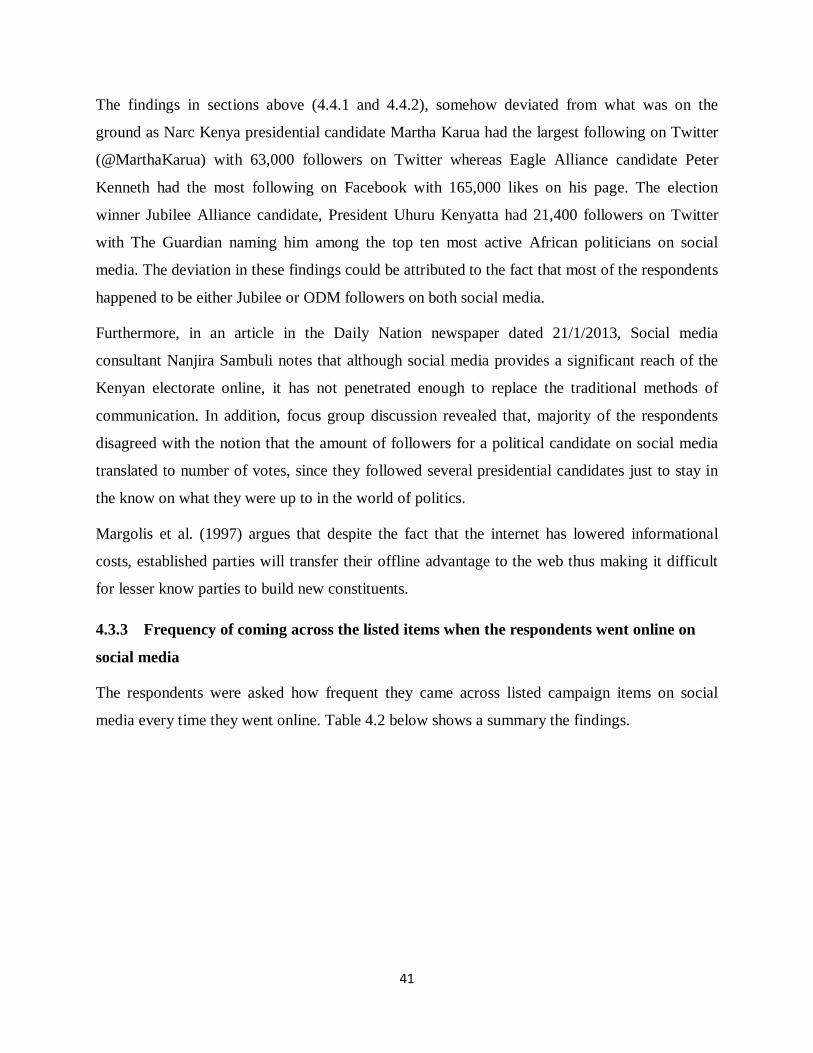
The findings in sections above (4.4.1 and 4.4.2), somehow deviated from what was on the
ground as Narc Kenya presidential candidate Martha Karua had the largest following on Twitter
(@MarthaKarua) with 63,000 followers on Twitter whereas Eagle Alliance candidate Peter
Kenneth had the most following on Facebook with 165,000 likes on his page. The election
winner Jubilee Alliance candidate, President Uhuru Kenyatta had 21,400 followers on Twitter
with The Guardian naming him among the top ten most active African politicians on social
media. The deviation in these findings could be attributed to the fact that most of the respondents
happened to be either Jubilee or ODM followers on both social media.
Furthermore, in an article in the Daily Nation newspaper dated 21/1/2013, Social media
consultant Nanjira Sambuli notes that although social media provides a significant reach of the
Kenyan electorate online, it has not penetrated enough to replace the traditional methods of
communication. In addition, focus group discussion revealed that, majority of the respondents
disagreed with the notion that the amount of followers for a political candidate on social media
translated to number of votes, since they followed several presidential candidates just to stay in
the know on what they were up to in the world of politics.
Margolis et al. (1997) argues that despite the fact that the internet has lowered informational
costs, established parties will transfer their offline advantage to the web thus making it difficult
for lesser know parties to build new constituents.
4.3.3 Frequency of coming across the listed items when the respondents went online on
social media
The respondents were asked how frequent they came across listed campaign items on social
media every time they went online. Table 4.2 below shows a summary the findings.
41

Never Only sometimes
Most of the time
Almost always
Always Total %
F % F % F % F % F %
A poster of a political candidate
0 0 24 13.3 36 20 36 20 84 46.7 100.0
A shared link to a political video on YouTube
12 8 42 28 36 24 36 24 24 16 100.0
A shared link to a political website
6 4.3 54 39.1 36 26.1 6 4.3 36 26.1 100.0
Received an invite to attend a political rally/event
66 33.3 30 20 30 20 12 8 12 8 100.0
Solicitation of financial support
102 70.8 24 16.7 12 8.3 6 4.2 0 0 100.0
Recruitment of volunteers on social media
84 58.3 18 12.5 18 12.5 6 4.2 18 12.5 100.0
A political campaign video
30 21.7 42 30.4 18 13 24 17.4 24 17.4 100.0
A press release made by a political party
24 16 48 32 30 20 12 8 36 24 100.0
A political party manifesto
36 26.1 36 26.1 24 17.4 12 8.7 30 21.7 100.0
A political group(s) 24 16 24 16 24 16 30 20 48 32 100.0
Table 4.2 Frequency of coming across listed items when the respondents went online on
social media
42
Data in table 4.2 shows that majority (46%) of the respondents always came across a poster of a
political candidate while 32% of the respondents always came across a political group on social
media. A screen caption of Uhuru Kenyatta’s Facebook page shows one of the posters he used
during the campaign period and that he had requested his fans to make it their wall cover, as
indicated in the appendix I section. 28% said that only sometime they saw a shared link to a
political video on YouTube. A screen caption of Martha Karua’s Facebook page showed that on
March 1, 2013, she had shared a link to an interview she had with a local TV station, as is
indicated in appendix I. Another caption of her Twitter page showed she ran a
#get4tovoteformarthaonmarch4 and #simamanamama campaign.
A screen caption of Uhuru Kenyatta Facebook page and Twitter showed shared links to
YouTube. For instance, on March 2, 2013, he shared a link to youtube.com and soundcloud.com
as is indicated in his Twitter account in the appendix I section. Still on his Facebook page, there
is a shared link to his website (www.uhuru.co.ke) that was shared on January 4, 2013 to inform
his followers that his website was up, as is shown in the appendix I section.
39.1% said that only sometime they shared link to a political website, 33.3% said they have
never received an invite to attend a political rally/event, 70.8% said they never got any
solicitation of financial support, 58.3% said that never was there any recruitment of volunteers
on social media, 30.4% said that only sometimes there was a political campaign video, 32% said
that there was a press release made by a political party but only sometime, 26.1% said there was
never a political party manifesto on social media and another 26.1% said it was but only
sometimes. 32% said always there were political groups on social media. An interview with
Kenya National Congress (KNC) social media strategist, Peter Ngugi, revealed that they indeed
campaigned on social media. He was the admin of presidential candidate Peter Kenneth’s page.
He noted that they used social media to share information, photos, videos, links and counter
propaganda.
A study by Hill and Hughes (1997) on on-line USENET groups where they analyzed 1000
messages from a sample 22 political USENET group revealed that they function just like other
political groups where individuals debate, share information, recruit volunteers and reinforce
their social structures. The interview with KNC strategist consistent with the findings in the
above study as he noted that they used social media to recruit volunteers, share links, video and
43
photos, update followers on their campaign schedule and activity, share images, fundraising and
get opinions from the supporters and counter propaganda from their competitors. Generally, the
findings of the study were consistent with those of Wagner and Gainous (2009) study of the 2006
US Congressional election where they observed that candidates are evolving from simply
supplementing traditional media outlets to engaging the Internet as part of a detailed campaign
strategy to win office.
4.3.4 Discussion
Presidential candidates had personal accounts on Facebook and Twitter. This is confirmed by the
number of respondents in Figure 4.3 and Table 4.1 who confirm to have been following the
aforementioned presidential candidates on social networking sites during the campaign period. A
closer look at the activities on their Facebook and Twitter accounts between January and March,
2013 showed that they campaigned on social media, using the platform to share political news
and information. An interview with social media strategist for Kenya National Congress, Peter
Ngugi revealed that they used Facebook, Twitter, and Google+ to campaign for presidential
candidate Peter Kenneth. This includes sharing information on campaign activities, debate on
issues, sharing photos, videos and links, updating of their followers, soliciting for funds,
countering propaganda and updating their followers.
This is also supported by the findings in Table 4.2 which indicate that majority of the respondent
came across political content at one when they were online. The table further shows that 70.8%
of the respondents never came across any solicitation of funds on social media, 58.3% of the
respondents said they never came across recruitment of volunteers on and 33.3% of the
respondent said they never received an invite to attend a political rally/event on social media.
These findings show that although politicians are integrating social media into their campaign
they are yet to exploit its full potential.
4.4 RQ2: How was social media utilized for political purposes by its users?
The study sought to find out how social media was utilized for political purposes by its users.
Section 4.4.1 below discusses general social media uses while section 4.5.5.1 further narrows
down to how social media was being used for political purposes.
44
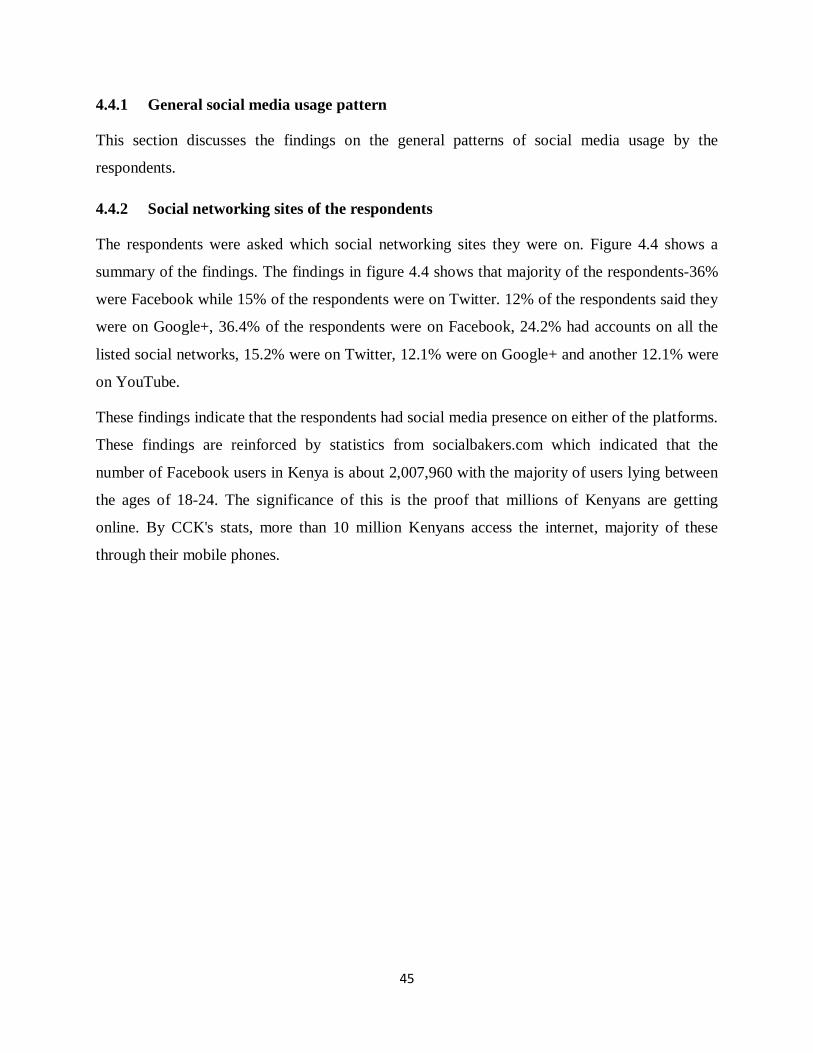
4.4.1 General social media usage pattern
This section discusses the findings on the general patterns of social media usage by the
respondents.
4.4.2 Social networking sites of the respondents
The respondents were asked which social networking sites they were on. Figure 4.4 shows a
summary of the findings. The findings in figure 4.4 shows that majority of the respondents-36%
were Facebook while 15% of the respondents were on Twitter. 12% of the respondents said they
were on Google+, 36.4% of the respondents were on Facebook, 24.2% had accounts on all the
listed social networks, 15.2% were on Twitter, 12.1% were on Google+ and another 12.1% were
on YouTube.
These findings indicate that the respondents had social media presence on either of the platforms.
These findings are reinforced by statistics from socialbakers.com which indicated that the
number of Facebook users in Kenya is about 2,007,960 with the majority of users lying between
the ages of 18-24. The significance of this is the proof that millions of Kenyans are getting
online. By CCK's stats, more than 10 million Kenyans access the internet, majority of these
through their mobile phones.
45
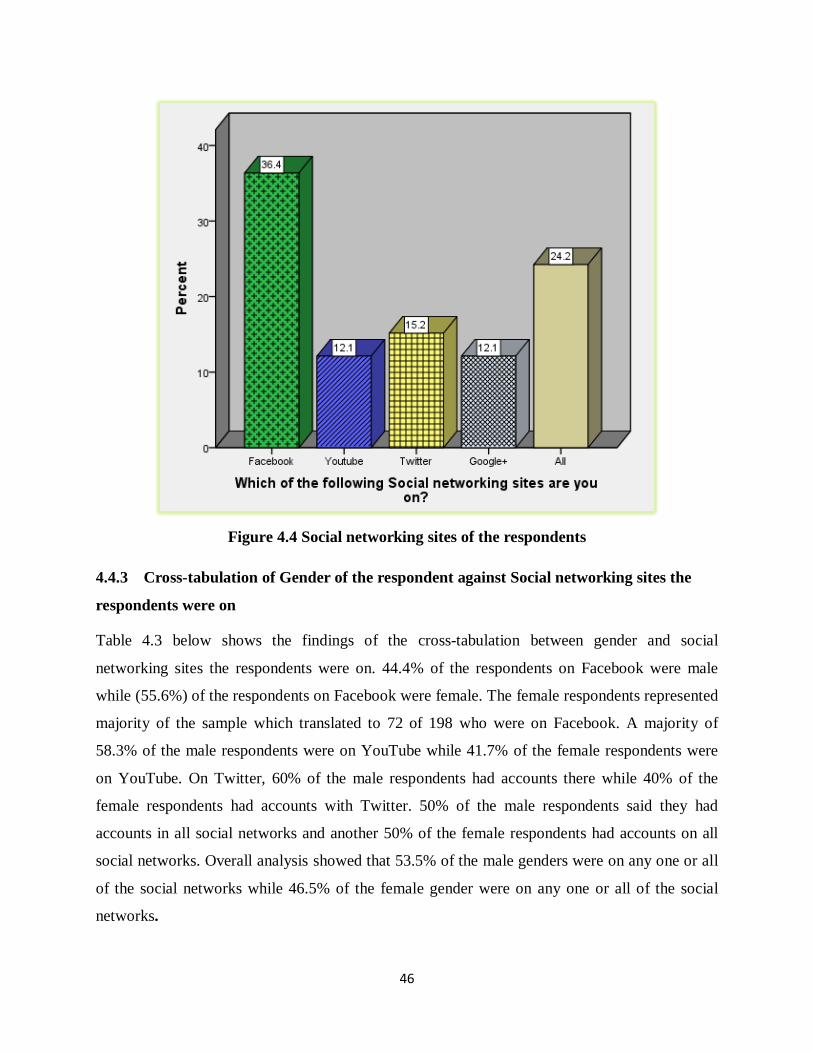
Figure 4.4 Social networking sites of the respondents
4.4.3 Cross-tabulation of Gender of the respondent against Social networking sites the
respondents were on
Table 4.3 below shows the findings of the cross-tabulation between gender and social
networking sites the respondents were on. 44.4% of the respondents on Facebook were male
while (55.6%) of the respondents on Facebook were female. The female respondents represented
majority of the sample which translated to 72 of 198 who were on Facebook. A majority of
58.3% of the male respondents were on YouTube while 41.7% of the female respondents were
on YouTube. On Twitter, 60% of the male respondents had accounts there while 40% of the
female respondents had accounts with Twitter. 50% of the male respondents said they had
accounts in all social networks and another 50% of the female respondents had accounts on all
social networks. Overall analysis showed that 53.5% of the male genders were on any one or all
of the social networks while 46.5% of the female gender were on any one or all of the social
networks.
46
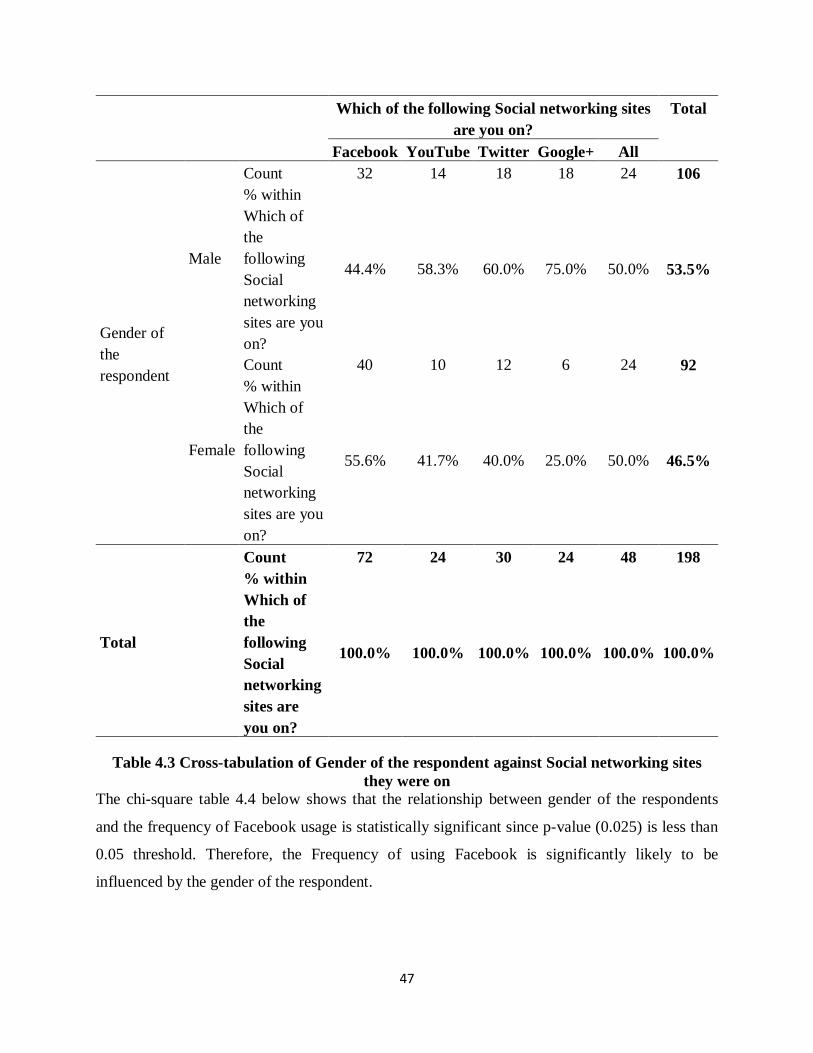
Which of the following Social networking sites are you on?
Total
Facebook YouTube Twitter Google+ All
Gender of the respondent
Male
Count 32 14 18 18 24 106 % within Which of the following Social networking sites are you on?
44.4% 58.3% 60.0% 75.0% 50.0% 53.5%
Female
Count 40 10 12 6 24 92 % within Which of the following Social networking sites are you on?
55.6% 41.7% 40.0% 25.0% 50.0% 46.5%
Total
Count 72 24 30 24 48 198 % within Which of the following Social networking sites are you on?
100.0% 100.0% 100.0% 100.0% 100.0% 100.0%
Table 4.3 Cross-tabulation of Gender of the respondent against Social networking sites they were on
The chi-square table 4.4 below shows that the relationship between gender of the respondents
and the frequency of Facebook usage is statistically significant since p-value (0.025) is less than
0.05 threshold. Therefore, the Frequency of using Facebook is significantly likely to be
influenced by the gender of the respondent.
47
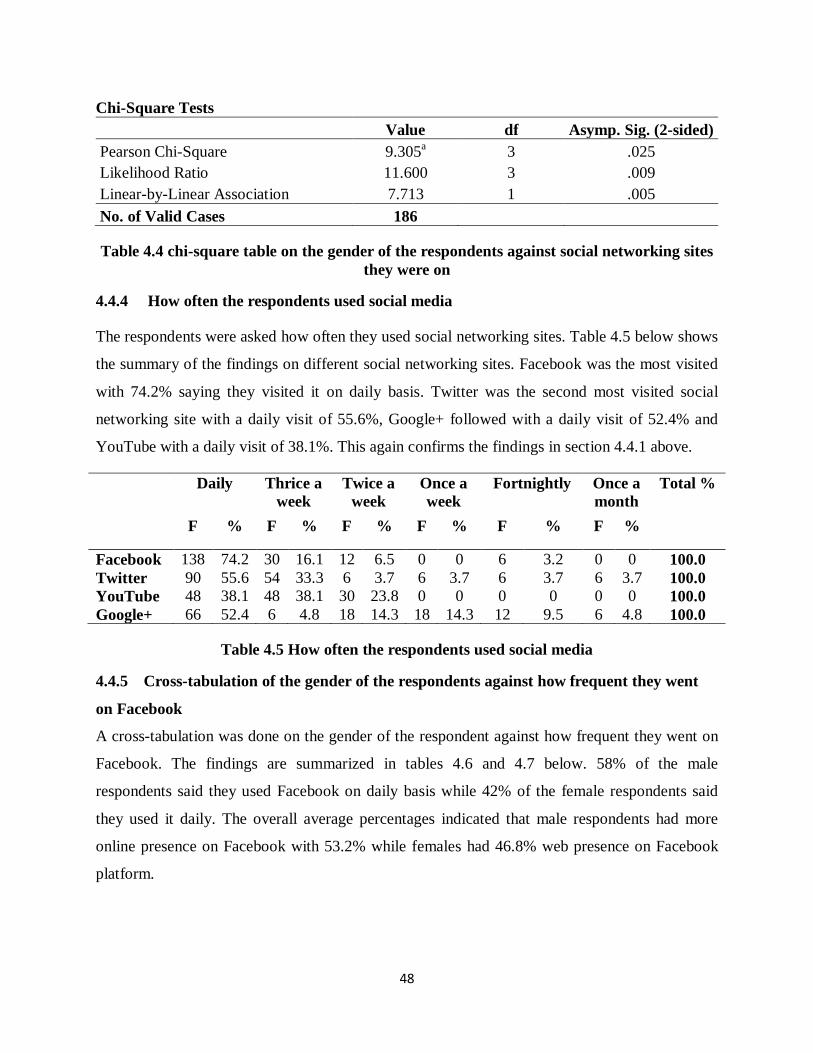
Chi-Square Tests Value df Asymp. Sig. (2-sided) Pearson Chi-Square 9.305a 3 .025 Likelihood Ratio 11.600 3 .009 Linear-by-Linear Association 7.713 1 .005 No. of Valid Cases 186
Table 4.4 chi-square table on the gender of the respondents against social networking sites they were on
4.4.4 How often the respondents used social media
The respondents were asked how often they used social networking sites. Table 4.5 below shows
the summary of the findings on different social networking sites. Facebook was the most visited
with 74.2% saying they visited it on daily basis. Twitter was the second most visited social
networking site with a daily visit of 55.6%, Google+ followed with a daily visit of 52.4% and
YouTube with a daily visit of 38.1%. This again confirms the findings in section 4.4.1 above.
Daily Thrice a week
Twice a week
Once a week
Fortnightly Once a month
Total %
F % F % F % F % F % F %
Facebook 138 74.2 30 16.1 12 6.5 0 0 6 3.2 0 0 100.0 Twitter 90 55.6 54 33.3 6 3.7 6 3.7 6 3.7 6 3.7 100.0 YouTube 48 38.1 48 38.1 30 23.8 0 0 0 0 0 0 100.0 Google+ 66 52.4 6 4.8 18 14.3 18 14.3 12 9.5 6 4.8 100.0
Table 4.5 How often the respondents used social media
4.4.5 Cross-tabulation of the gender of the respondents against how frequent they went
on Facebook
A cross-tabulation was done on the gender of the respondent against how frequent they went on
Facebook. The findings are summarized in tables 4.6 and 4.7 below. 58% of the male
respondents said they used Facebook on daily basis while 42% of the female respondents said
they used it daily. The overall average percentages indicated that male respondents had more
online presence on Facebook with 53.2% while females had 46.8% web presence on Facebook
platform.
48
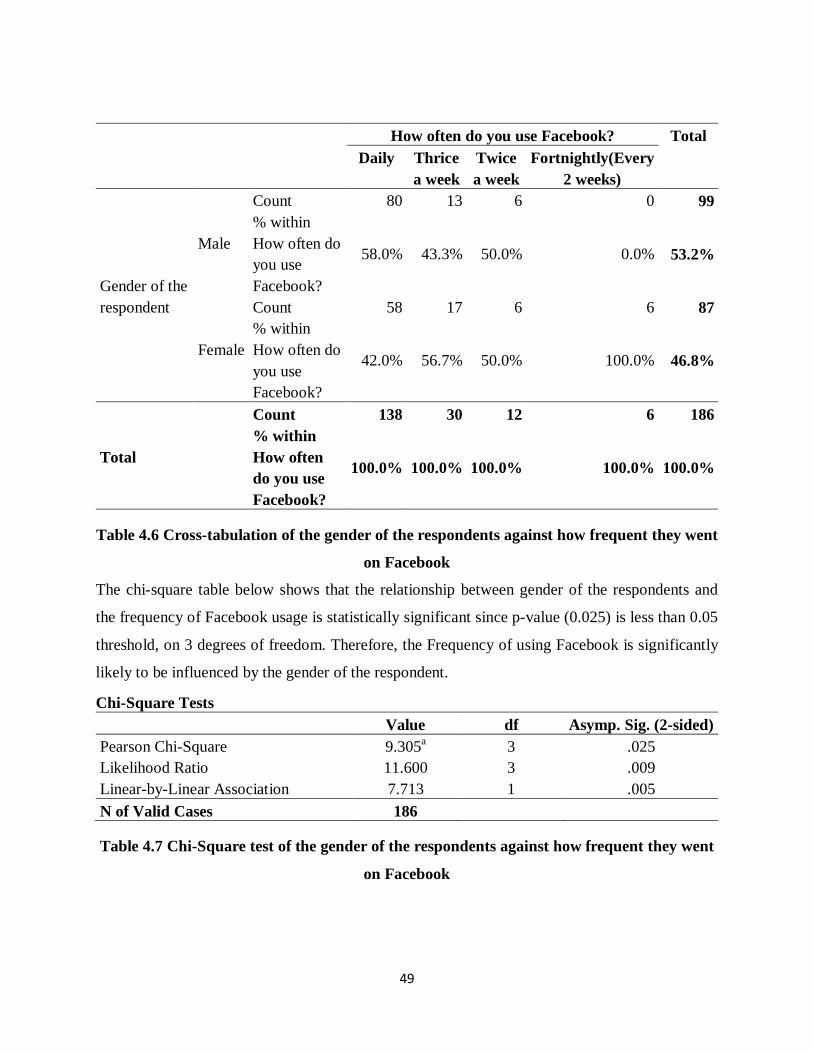
How often do you use Facebook? Total Daily Thrice
a week Twice a week
Fortnightly(Every 2 weeks)
Gender of the respondent
Male
Count 80 13 6 0 99 % within How often do you use Facebook?
58.0% 43.3% 50.0% 0.0% 53.2%
Female
Count 58 17 6 6 87 % within How often do you use Facebook?
42.0% 56.7% 50.0% 100.0% 46.8%
Total
Count 138 30 12 6 186 % within How often do you use Facebook?
100.0% 100.0% 100.0% 100.0% 100.0%
Table 4.6 Cross-tabulation of the gender of the respondents against how frequent they went
on Facebook
The chi-square table below shows that the relationship between gender of the respondents and
the frequency of Facebook usage is statistically significant since p-value (0.025) is less than 0.05
threshold, on 3 degrees of freedom. Therefore, the Frequency of using Facebook is significantly
likely to be influenced by the gender of the respondent.
Chi-Square Tests Value df Asymp. Sig. (2-sided) Pearson Chi-Square 9.305a 3 .025 Likelihood Ratio 11.600 3 .009 Linear-by-Linear Association 7.713 1 .005 N of Valid Cases 186
Table 4.7 Chi-Square test of the gender of the respondents against how frequent they went
on Facebook
49
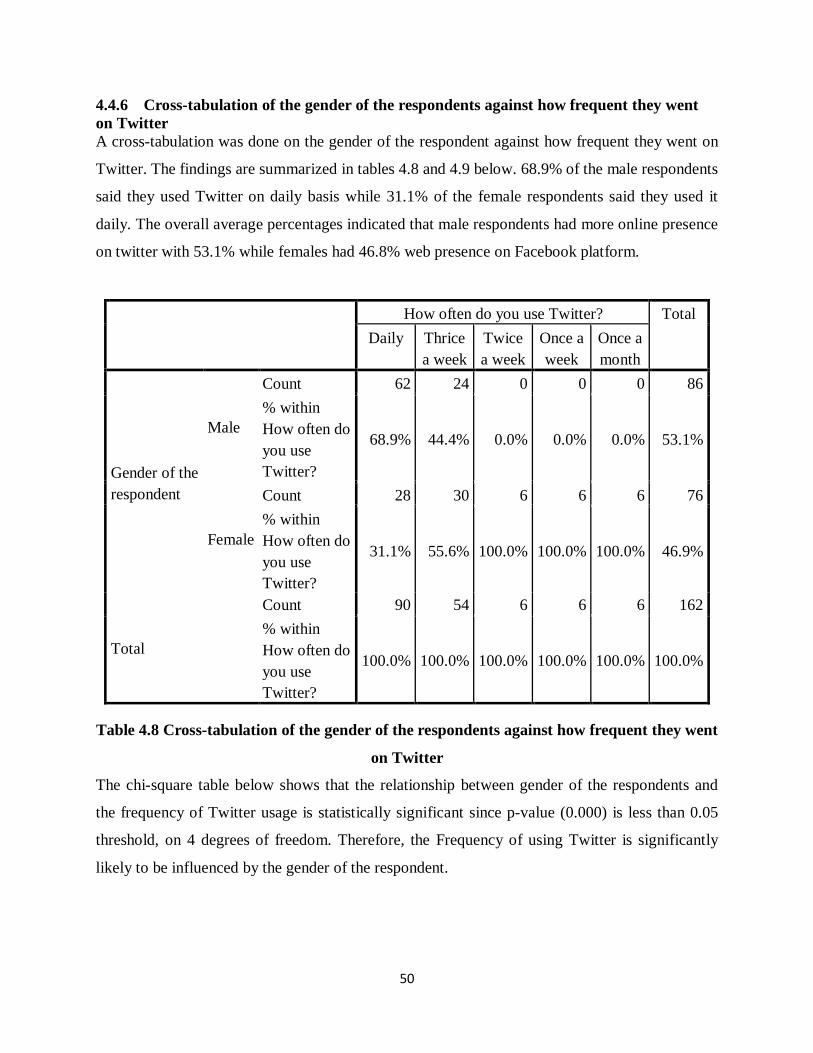
4.4.6 Cross-tabulation of the gender of the respondents against how frequent they went on Twitter A cross-tabulation was done on the gender of the respondent against how frequent they went on
Twitter. The findings are summarized in tables 4.8 and 4.9 below. 68.9% of the male respondents
said they used Twitter on daily basis while 31.1% of the female respondents said they used it
daily. The overall average percentages indicated that male respondents had more online presence
on twitter with 53.1% while females had 46.8% web presence on Facebook platform.
How often do you use Twitter? Total Daily Thrice
a week Twice a week
Once a week
Once a month
Gender of the respondent
Male
Count 62 24 0 0 0 86 % within How often do you use Twitter?
68.9% 44.4% 0.0% 0.0% 0.0% 53.1%
Female
Count 28 30 6 6 6 76 % within How often do you use Twitter?
31.1% 55.6% 100.0% 100.0% 100.0% 46.9%
Total
Count 90 54 6 6 6 162 % within How often do you use Twitter?
100.0% 100.0% 100.0% 100.0% 100.0% 100.0%
Table 4.8 Cross-tabulation of the gender of the respondents against how frequent they went
on Twitter
The chi-square table below shows that the relationship between gender of the respondents and
the frequency of Twitter usage is statistically significant since p-value (0.000) is less than 0.05
threshold, on 4 degrees of freedom. Therefore, the Frequency of using Twitter is significantly
likely to be influenced by the gender of the respondent.
50

Chi-Square Tests Value df Asymp. Sig. (2-sided) Pearson Chi-Square 31.012a 4 .000 Likelihood Ratio 38.173 4 .000 Linear-by-Linear Association 26.374 1 .000 N of Valid Cases 162
Table 4.9 Chi-Square test of the gender of the respondents against how frequent they went
on Twitter
4.4.7 Time in hours spent on social networking sites
The respondents were asked amount of time they spent each day on social networking sites.
Table 4.10 below shows the summary of the findings on different social networking sites.
Majority of the respondents spent more time on Facebook with 34.4% spending more than 4
hours in a day.
0 – 1 hours
1 – 2 hours
2 – 3 hours
3 – 4 hours
More than 4 hours
Never Total %
F % F % F % F % F % F %
Facebook 60 31.3 24 12.5 24 12.5 18 9.4 66 34.4 0 0 100.0 Twitter 90 55.6 54 33.3 6 3.7 6 3.7 6 3.7 6 3.7 100.0 YouTube 48 38.1 48 38.1 30 23.8 0 0 0 0 0 0 100.0 Google+ 66 52.4 6 4.8 18 14.3 18 14.3 12 9.5 6 4.8 100.0
Table 4.10 Hours spent on social media by the respondents
4.4.8 Cross-tabulation of the gender of the respondents against the hours they spent on
Table 4.11 below shows the findings of the cross-tabulation between gender and hours spent on
Twitter on an everyday basis by the respondents. 20.9% of the males spent 0-1 hours while a
majority-60% of the Female respondents was spent the same number of hours. This represented
the second largest majority of the population where 30 of 198 were on Twitter. A minority of 7%
of the male respondents were spent 1-2 hours in a day on Twitter while 17.1% of the female
respondents were spent the same. 27.9% of the male respondents spent 2-3 hours there while
none of the female respondents spent same number of hours. 20.9% of the male respondents said
they spent 3-4 hours a day on Twitter and none of the female respondents spent that time on
51

Twitter. 23.3% of the male genders spent more than 4 hours while 22.9% of the female genders
spent more than 4 hours on Twitter.
Gender of the
respondent Total
Male Female
How many hours do you spend online on Twitter in typical day?
0-1 hours Count 18 42 60 % within Gender of the respondent
20.9% 60.0% 38.5%
1-2 hours Count 6 12 18 % within Gender of the respondent
7.0% 17.1% 11.5%
2-3 hours Count 24 0 24 % within Gender of the respondent
27.9% 0.0% 15.4%
3-4 hours Count 18 0 18 % within Gender of the respondent
20.9% 0.0% 11.5%
More than 4 hours
Count 20 16 36 % within Gender of the respondent
23.3% 22.9% 23.1%
Total Count 86 70 156 % within Gender of the respondent
100.0% 100.0% 100.0%
Table 4.11 Cross-tabulation of the gender of the respondents against the hours they spent
on Twitter
The chi-square table 4.12 below shows that the relationship between gender of the respondents
and the hours spent in a day on Twitter is statistically significant since p-value (0.000) is less
than 0.05 thresholds. Therefore, the hours spent on Twitter are significantly likely to be
influenced by the gender of the respondent.
52
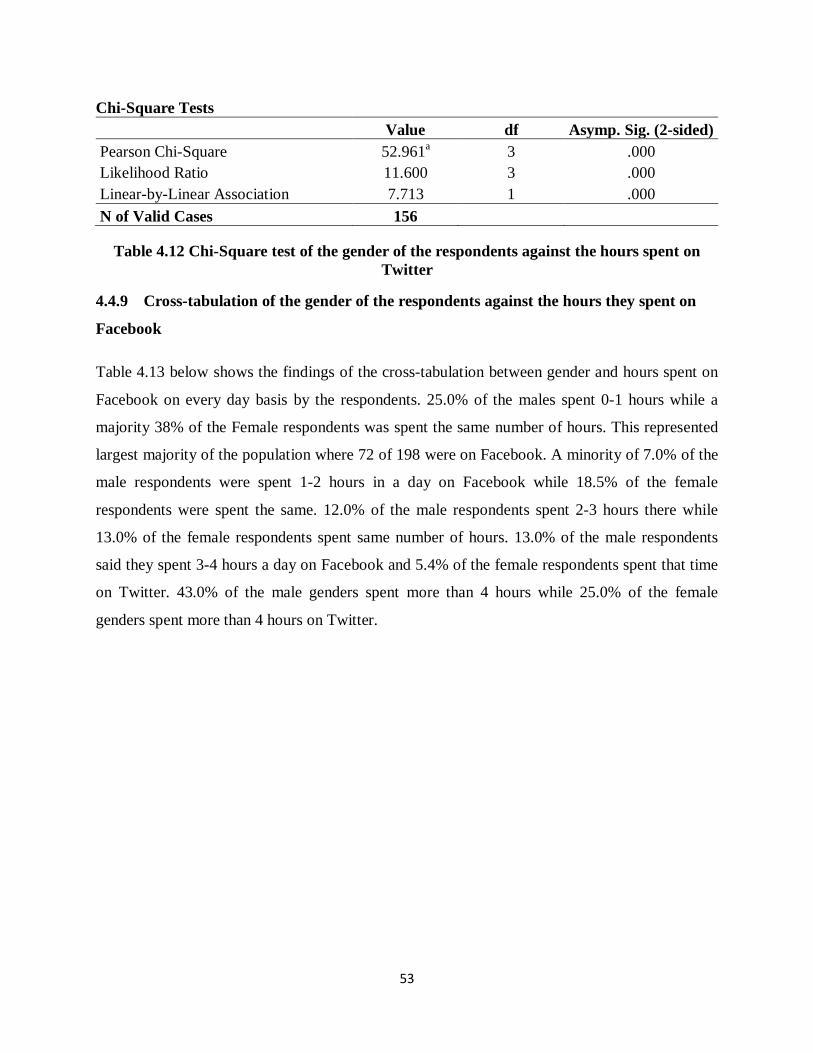
Chi-Square Tests Value df Asymp. Sig. (2-sided) Pearson Chi-Square 52.961a 3 .000 Likelihood Ratio 11.600 3 .000 Linear-by-Linear Association 7.713 1 .000 N of Valid Cases 156
Table 4.12 Chi-Square test of the gender of the respondents against the hours spent on Twitter
4.4.9 Cross-tabulation of the gender of the respondents against the hours they spent on
Table 4.13 below shows the findings of the cross-tabulation between gender and hours spent on
Facebook on every day basis by the respondents. 25.0% of the males spent 0-1 hours while a
majority 38% of the Female respondents was spent the same number of hours. This represented
largest majority of the population where 72 of 198 were on Facebook. A minority of 7.0% of the
male respondents were spent 1-2 hours in a day on Facebook while 18.5% of the female
respondents were spent the same. 12.0% of the male respondents spent 2-3 hours there while
13.0% of the female respondents spent same number of hours. 13.0% of the male respondents
said they spent 3-4 hours a day on Facebook and 5.4% of the female respondents spent that time
on Twitter. 43.0% of the male genders spent more than 4 hours while 25.0% of the female
genders spent more than 4 hours on Twitter.
53
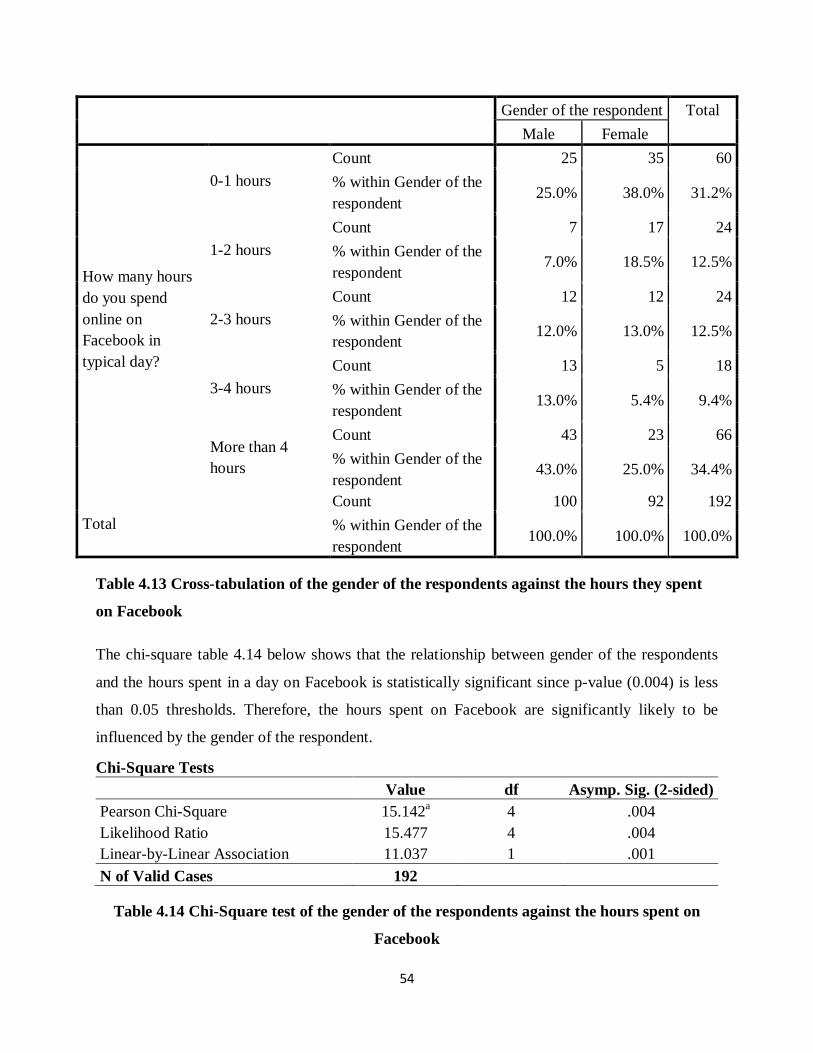
Gender of the respondent Total Male Female
How many hours do you spend online on Facebook in typical day?
0-1 hours Count 25 35 60 % within Gender of the respondent
25.0% 38.0% 31.2%
1-2 hours Count 7 17 24 % within Gender of the respondent
7.0% 18.5% 12.5%
2-3 hours Count 12 12 24 % within Gender of the respondent
12.0% 13.0% 12.5%
3-4 hours Count 13 5 18 % within Gender of the respondent
13.0% 5.4% 9.4%
More than 4 hours
Count 43 23 66 % within Gender of the respondent
43.0% 25.0% 34.4%
Total Count 100 92 192 % within Gender of the respondent
100.0% 100.0% 100.0%
Table 4.13 Cross-tabulation of the gender of the respondents against the hours they spent
on Facebook
The chi-square table 4.14 below shows that the relationship between gender of the respondents
and the hours spent in a day on Facebook is statistically significant since p-value (0.004) is less
than 0.05 thresholds. Therefore, the hours spent on Facebook are significantly likely to be
influenced by the gender of the respondent.
Chi-Square Tests Value df Asymp. Sig. (2-sided) Pearson Chi-Square 15.142a 4 .004 Likelihood Ratio 15.477 4 .004 Linear-by-Linear Association 11.037 1 .001 N of Valid Cases 192
Table 4.14 Chi-Square test of the gender of the respondents against the hours spent on
54

4.4.10 How the respondents used social networking sites
The study sought to establish what the respondents did when they visited social networks or the
purpose they had for visiting social networking sites. Table 4.15 below shows the summary of
the findings. 18.2% said they visited social networking sites to seek information, 15.2% said they
were communicating with friends, 9.1% said to post information, 33.3% said to keep up with
trending topics, as is indicated by the responses from the focus group discussion, which noted
that, information updates on social media was spontaneous, therefore, they were able to stay up
to date on the news regarding election campaigns and more so the candidate that they supported.
9.1% said to engage people in discussions, 6.1% said to seek new friends, 6.1% said networking
and 3.0% said Job seeking.
An analysis on the focus group discussion indicated that young people used the social
networking sites to enlighten themselves on trending issues. Also, they got to learn more about
their preferential candidate which wouldn’t have been possible on other platforms for
communication. Moreover, there was voter education on how to tick the ballot paper which
helped them ensure that they do not spoil their votes come the voting day. Others said they used
social networks to access to party manifestos through shared download links on political pages
on social media.
Respondents Opinion Frequency Percent Cumulative Percent
Seek information and keep up with trending topics
102 51.5 51.5
Communicate with friends and networking
72 36.5 88.0
Post information 18 9.0 97.0
Job seeking 6 3.0 100.0
Total 198 100.0
Table 4.15 How the respondents used social networking sites
55
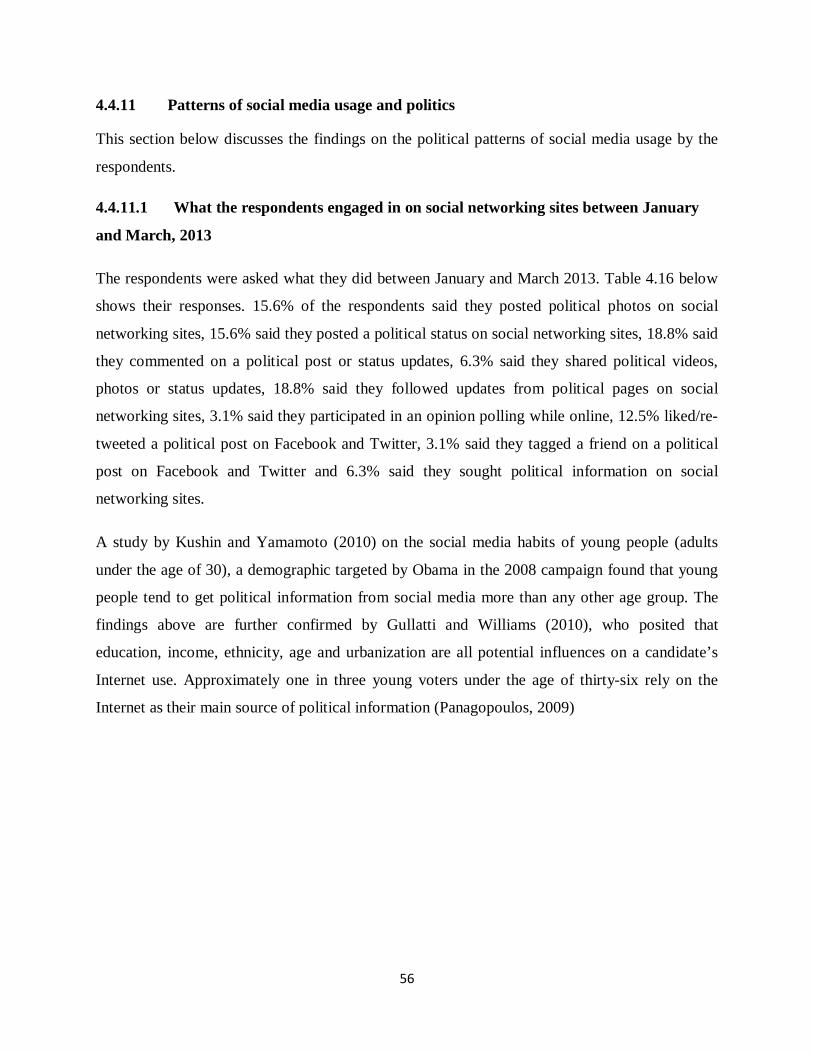
4.4.11 Patterns of social media usage and politics
This section below discusses the findings on the political patterns of social media usage by the
respondents.
4.4.11.1 What the respondents engaged in on social networking sites between January
and March, 2013
The respondents were asked what they did between January and March 2013. Table 4.16 below
shows their responses. 15.6% of the respondents said they posted political photos on social
networking sites, 15.6% said they posted a political status on social networking sites, 18.8% said
they commented on a political post or status updates, 6.3% said they shared political videos,
photos or status updates, 18.8% said they followed updates from political pages on social
networking sites, 3.1% said they participated in an opinion polling while online, 12.5% liked/re-
tweeted a political post on Facebook and Twitter, 3.1% said they tagged a friend on a political
post on Facebook and Twitter and 6.3% said they sought political information on social
networking sites.
A study by Kushin and Yamamoto (2010) on the social media habits of young people (adults
under the age of 30), a demographic targeted by Obama in the 2008 campaign found that young
people tend to get political information from social media more than any other age group. The
findings above are further confirmed by Gullatti and Williams (2010), who posited that
education, income, ethnicity, age and urbanization are all potential influences on a candidate’s
Internet use. Approximately one in three young voters under the age of thirty-six rely on the
Internet as their main source of political information (Panagopoulos, 2009)
56
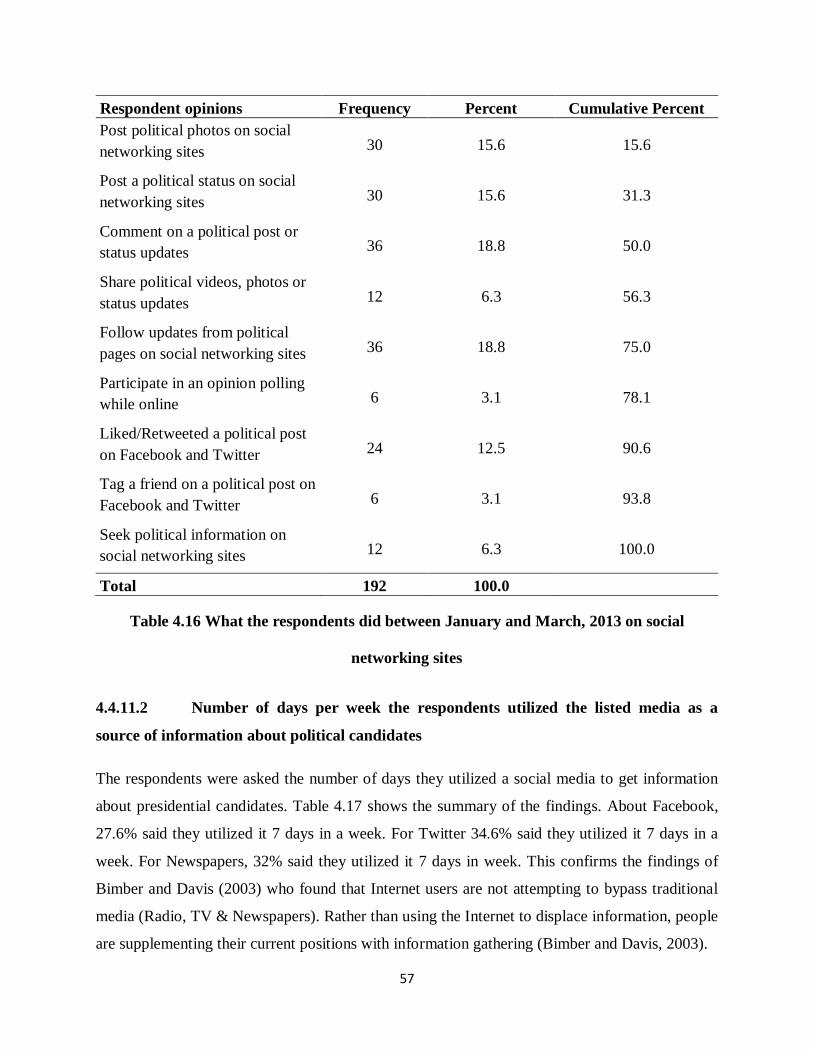
Respondent opinions Frequency Percent Cumulative Percent Post political photos on social networking sites 30 15.6 15.6
Post a political status on social networking sites 30 15.6 31.3
Comment on a political post or status updates 36 18.8 50.0
Share political videos, photos or status updates 12 6.3 56.3
Follow updates from political pages on social networking sites 36 18.8 75.0
Participate in an opinion polling while online 6 3.1 78.1
Liked/Retweeted a political post on Facebook and Twitter 24 12.5 90.6
Tag a friend on a political post on Facebook and Twitter 6 3.1 93.8
Seek political information on social networking sites 12 6.3 100.0
Total 192 100.0
Table 4.16 What the respondents did between January and March, 2013 on social
networking sites
4.4.11.2 Number of days per week the respondents utilized the listed media as a
source of information about political candidates
The respondents were asked the number of days they utilized a social media to get information
about presidential candidates. Table 4.17 shows the summary of the findings. About Facebook,
27.6% said they utilized it 7 days in a week. For Twitter 34.6% said they utilized it 7 days in a
week. For Newspapers, 32% said they utilized it 7 days in week. This confirms the findings of
Bimber and Davis (2003) who found that Internet users are not attempting to bypass traditional
media (Radio, TV & Newspapers). Rather than using the Internet to displace information, people
are supplementing their current positions with information gathering (Bimber and Davis, 2003).
57
Scholars argue that the internet may not only be reinforcing political behavior but also media
behavior. For instance the decline use of local and national television and newspaper can be
attributed to the growth of the internet, research shows that internet users and non users still rely
on the traditional media for news (Stempel, Hargrove and Bernt, 2000). Stempel et al. (2000)
further notes that internet users are heavy newspaper readers thus they can be described as
information seekers. Therefore, the internet serves as a reinforcement agent for information
seekers and this would result into widening of the divide between the information rich and
information poor.
For Magazines 33.3% said they utilized it 7 days in a week. For Television, 65.4% said they
utilized it 7 days in a week. Tedesco (1999) notes that media skeptics consider the unmediated
aspect of the internet as disadvantageous to the citizens since they heavily rely on the media to
contextualize and interpret information for them. Majority of the Americans reported that
television news is their main source of information which bring into question if they are able to
make informed choices on voting decisions based on television news. For radio, 68.2% said they
utilized it 7 days in a week. About Online newspapers, 28.6% said they utilized it 7 days a week
and about E-mail updates 44.4% said they utilized 7 days a week.
KNC’s Social Media Strategist, Peter Ngugi in an interview said that during campaigns,
specifically the just concluded general election, the traditional media in some cases distorted
information and social media updates from the campaign team would help to set the record
straight. In addition, he acknowledged that traditional media still dominates in terms of the
number of people it reaches “What we saw was a start of new way of campaigning, the growth of
using social media is inevitable and soon I can say it will reach more people but at the moment
no”
58

0 1 2 3 4 5 6 7 Total %
F % F % F % F % F % F % F % F %
Facebook 12 6.9 30 17.2 18 10.3 6 3.4 42 24.1 12 6.9 6 3.4 48 27.6 100.0 Twitter 18 11.5 18 11.5 30 19.2 12 7.7 12 7.7 6 3.8 6 3.8 54 34.6 100.0 Newspapers 0 0 18 12 6 4 24 16 30 20 24 16 0 0 48 32 100.0 Magazines 24 22.2 6 5.6 12 11.1 18 16.7 6 5.6 6 5.6 0 0 36 33.3 100.0 Television 6 3.8 0 0 12 7.7 0 0 12 7.7 6 3.8 18 11.5 102 65.4 100.0 Radio 12 9.1 0 0 0 0 12 9.1 12 9.1 6 4.5 0 0 90 68.2 100.0 Online newspapers
18 14.3 30 23.8 12 9.5 6 4.8 6 4.8 6 4.8 12 9.5 36 28.6 100.0
E-mail updates
36 33.3 0 0 0 0 12 11.1 12 11.1 0 0 0 0 48 44.4 100.0
Table 4.17 Number of days per week the respondents utilized the listed media as a source
of information about political candidates
4.4.11.3 Discussion
Majority of the respondents were on Facebook with Twitter having the second largest number of
users as indicated in figure 4.4. This shows that these two SNS are most popular among the
urban youth. A gender analysis on the respondent’s use of SNS revealed that Facebook had
more female users. However, male users appear to often use and spend more time on SNS than
the female users. These findings therefore reveal that gender influences the use of SNS. The
respondents used SNS to seek information, communicate with friends, search for jobs, and to
network. However, the intensity of doing this varied as seeking information and keeping up with
trending topics registered the highest number of users.
In terms of political usage of SNS by the respondents between January and March, 2013, the
respondents acknowledged that they posted political photos, updates, links, and videos. They
also retweeted/ liked, commented on political posts, seek political information, tag a friend on
Facebook and Twitter. This shows that the respondents were actively involved in politics when
they were on SNS. This indicates that although users engage in political activities when they are
offline, they carry on with the same only that this time they are online. Kushin and Yamamoto,
2010 notes that social media allow users to not only seek information but also interact with
others through online expression such as posting political commentaries on blogs and social
network sites and sharing multimedia commentary.
59

Television and Radio were the most popular source of political information on the presidential
campaigns for the respondents. This was followed by social networking sites, specifically
Facebook and Twitter. These findings show that although more people are getting online for
political news and information, they heavily rely on traditional media for the same news.
Research shows that internet users and non users still rely on the traditional media for news
(Stempel, Hargrove and Bernt, 2000). Focus group discussions revealed that respondents would
log into social networking sites just see the reactions of presidential candidates on issues
touching on them that had run on broadcast media. Tedesco (1999) observed that people heavily
rely on the media to contextualize and interpret for them information.
4.5 RQ3: What was the impact of social media on the presidential campaign process?
On the research question above, section 4.5 below discusses the impact of social media on the
presidential campaign process and the university students as social media users.
4.5.1 Presidential candidate's profiles or pages on social networks and if they were helpful
in learning more about them
The study sought to find out if the presidential candidates’ profiles or pages on social media were
helpful in learning more about them. The responses from the respondents were summarized and
recorded in figure 4.5. Majority of the respondents, 72.7%, said yes the profiles or pages helped
them in learning more about the presidential candidates. 21.2% said no the profiles or pages were
not helpful to them in terms of knowing the candidates more and 6.1% said they were not sure if
the profiles or pages were helpful to their adding of knowledge about the presidential candidates.
A screen caption of the Twitter accounts of Martha Karua and Peter Kenneth showed that there
were conversation between them and their followers, as is indicated in the appendix section. This
reinforces the findings in the focused group that showed, the respondents unanimously agreed
that social media facilitated upward communication between the electorate and their leaders.
This is because they can now send messages directly to their leader by simply making a post on
their wall and even engage them in discussions on matters of public interest. KNC Social Media
Strategist Peter Ngugi in an interview noted that Social media also created something close to
personal relationship to the candidate because someone can ask a question and the candidate
60
would take some minutes to reply. He further adds that since their campaign was issue based,
they would make updates which would provoke debate.
Figure 4.5 Presidential candidate's profiles or pages on social networks and if they were
helpful in learning more about them
4.5.2 Information posted on social networking sites that was related to the presidential
election, between January and March, 2013
The research sought to find out how much information related to the presidential election, was
posted on social networks between January and March 2013. Figure 4.6 shows the findings of
the study. 42.4% of the respondents said that most of the information was related to the
presidential election and 24.2% said almost all of it was related to the presidential election.
30.3% said that some of the information was related to the presidential election and only 3.0%
said that none of the information was related to the presidential election. However, KNC’s Social
Media Strategist Peter Ngugi observed that the shortcoming of social media was having to deal
with all “negative” for past or current for example if a politician abuses a traffic rule, a second
later the issue is on Twitter that way you might find the IT team dealing with “petty” things
while they are supposed to be focused on the campaign.
61
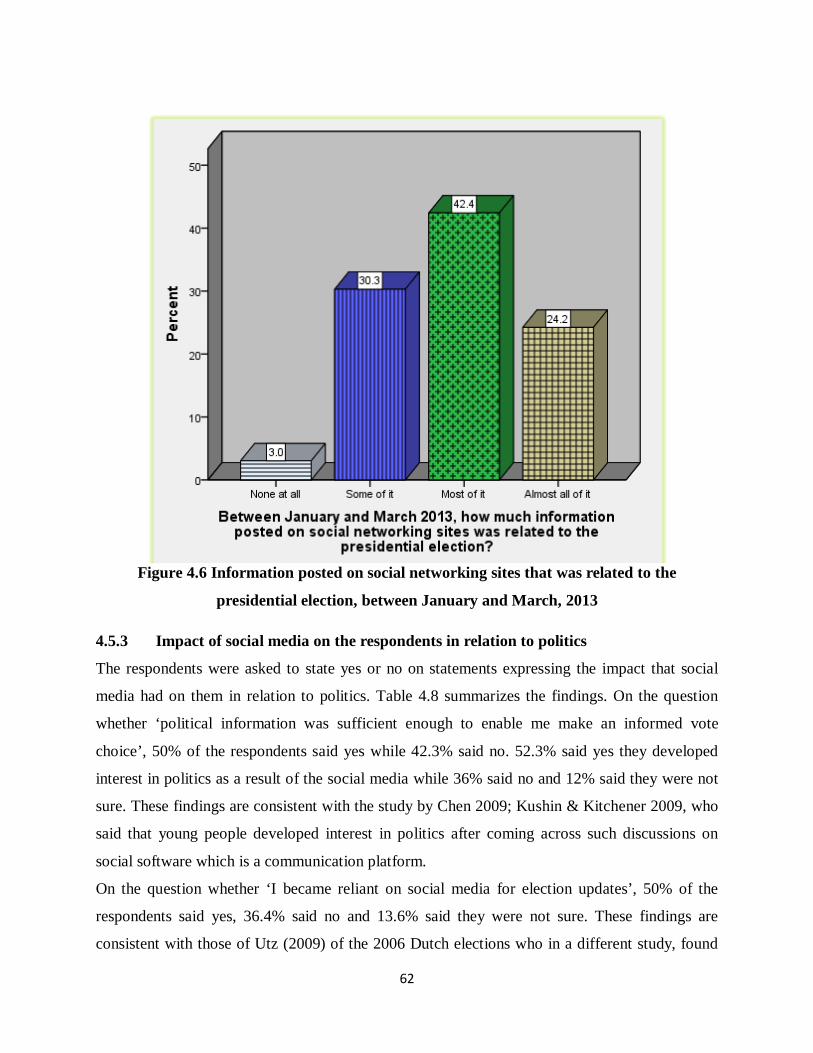
Figure 4.6 Information posted on social networking sites that was related to the
presidential election, between January and March, 2013
4.5.3 Impact of social media on the respondents in relation to politics
The respondents were asked to state yes or no on statements expressing the impact that social
media had on them in relation to politics. Table 4.8 summarizes the findings. On the question
whether ‘political information was sufficient enough to enable me make an informed vote
choice’, 50% of the respondents said yes while 42.3% said no. 52.3% said yes they developed
interest in politics as a result of the social media while 36% said no and 12% said they were not
sure. These findings are consistent with the study by Chen 2009; Kushin & Kitchener 2009, who
said that young people developed interest in politics after coming across such discussions on
social software which is a communication platform.
On the question whether ‘I became reliant on social media for election updates’, 50% of the
respondents said yes, 36.4% said no and 13.6% said they were not sure. These findings are
consistent with those of Utz (2009) of the 2006 Dutch elections who in a different study, found
62

that that SNS provided an opportunity to reach individuals that are less interested in politics.
65.2% said No on the question whether ‘they did not withdraw their support for a candidate after
reading something on social media’. Therefore viewing a candidate’s profile further strengthens
existing attitudes. Best (2005) notes that, even though the Internet alters the resources necessary
for political activity, the individuals who are participating online are similar to those
participating offline. This sequence further encourages an ever-evolving circle where Internet
participation is reinforcing rather than supplementing. Therefore, the Internet is not capturing
new, potential voters, but instead encouraging and supporting the beliefs already in place.
The focused group discussions indicated that majority of the respondents in the group agreed that
political information on social media was to a larger extent instrumental in reinforcing their
beliefs and support for a candidate of their choice. However, some of them observed that there
were instances where they were persuaded to support another candidate, findings supported by
the questionnaire analysis where 21.7% said yes they withdrew their support after reading
something on social media. 65.4% said yes they were more knowledgeable in politics as a result
of the social media. 19.2% said they were not and 15.4% said they were not sure.
Yes No Not sure Total % F % F % F %
Political information was sufficient enough to enable me make an informed vote choice
78 50 66 42.3 12 7.7 100.0
I developed interest in politics
78 52.4 54 36 18 12 100.0
I became reliant on social media for election updates
66 50 48 36.4 18 13.6 100.0
I withdrew my support for a candidate after reading something on social media
30 21.7 90 65.2 18 13 100.0
I am more knowledgeable in politics
102 65.4 30 19.2 24 15.4 100.0
Table 4.18 Impact of social media on the respondents in relation to politics
63
4.5.4 Impact of social media on the respondents in relation to politics
The study sought to find out the extent to which the respondents would agree or disagree with
statements on social media and politics. 66.7% of the respondents either agreed or strongly
agreed that there was a lot of propaganda spread on social media. This was confirmed by the
focused group findings, where majority of the respondents agreed that some political pages
provided accurate political information about the election campaigns. However, there are those
political pages on social media that used the platform to spread propaganda about rival political
candidates and parties.
10.3% of the respondents were neutral and only 13.8% strongly disagreed. This confirms the
findings of a study by Dye and Ziegler (1983) which showed that political leaders use persuasion
and propaganda as their most important tools in their profession. He further observed that
presidential candidates can create their own campaign organizations, separate from that of their
party, which deploy persuasion and propaganda techniques.
On whether hate speech was perpetuated on social media, 66.7% either agreed or strongly agreed
while 13.3% strongly disagreed. 52% agreed or strongly agreed that political updates were
instantaneous. 64.1% either agreed or strongly agreed that they were exposed to political
information without seeking for it, findings confirmed by the focused group, whereby some of
the respondents noted that they developed interest in politics after coming across political
information on social media without soliciting for it.37.5% either agreed or strongly agreed that
they were misinformed by a political post on social networking sites.
64
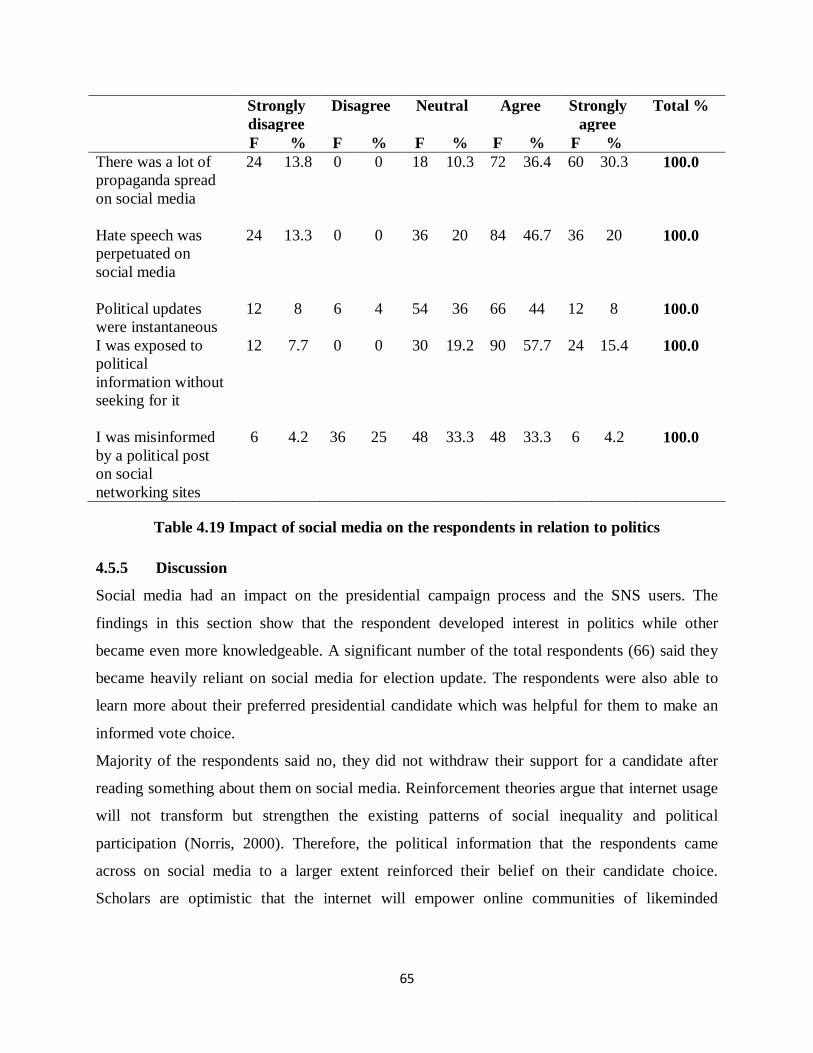
Strongly disagree
Disagree Neutral Agree Strongly agree
Total %
F % F % F % F % F % There was a lot of propaganda spread on social media
24 13.8 0 0 18 10.3 72 36.4 60 30.3 100.0
Hate speech was perpetuated on social media
24 13.3 0 0 36 20 84 46.7 36 20 100.0
Political updates were instantaneous
12 8 6 4 54 36 66 44 12 8 100.0
I was exposed to political information without seeking for it
12 7.7 0 0 30 19.2 90 57.7 24 15.4 100.0
I was misinformed by a political post on social networking sites
6 4.2 36 25 48 33.3 48 33.3 6 4.2 100.0
Table 4.19 Impact of social media on the respondents in relation to politics
4.5.5 Discussion
Social media had an impact on the presidential campaign process and the SNS users. The
findings in this section show that the respondent developed interest in politics while other
became even more knowledgeable. A significant number of the total respondents (66) said they
became heavily reliant on social media for election update. The respondents were also able to
learn more about their preferred presidential candidate which was helpful for them to make an
informed vote choice.
Majority of the respondents said no, they did not withdraw their support for a candidate after
reading something about them on social media. Reinforcement theories argue that internet usage
will not transform but strengthen the existing patterns of social inequality and political
participation (Norris, 2000). Therefore, the political information that the respondents came
across on social media to a larger extent reinforced their belief on their candidate choice.
Scholars are optimistic that the internet will empower online communities of likeminded
65

individuals, create a more informed electorate (Sullivan 2000) and reunite those who had been
alienated politically (Keane, 1995).
The respondents also observed that a lot of hate speech messages were being perpetuated on
SNS. This was evidence from the messages posted on these sites which showed that political
supporter became divided on the lines of their ethnicity. People expressed their support for a
political candidate only because they come from the same tribe/community and not for the
policies that one sold to the electorate. Social media campaign strategist also had to counter
propaganda about their candidates that was being peddled on SNS by their competitors. Given
that updates on SNS are instantaneous, campaign strategists had a lot of trouble controlling the
damage on the image of their candidates in the event news came about on something bad they
did. Since information on SNS spreads in a viral manner, it was important for them to be
prepared to conduct damage control in case of any eventualities.
66
CHAPTER FIVE
SUMMARY, CONCLUSIONS AND RECOMMENDATIONS
5.0 Introduction
This chapter presents a summary of key findings from which conclusions were drawn and
recommendations made. This was a synopsis of what has been tackled in previous chapters in
summary. It also highlights the conclusions made on the findings of the study as well as the
recommendations that can be employed by the stakeholders in the future election campaigns to
help them win the elections by reaching the masses through social media.
5.1 Summary of the study
The study sought to find out the role of social media in the 2013 Kenya presidential election
campaigns. Study objectives were (i) To investigate the integration of social media into the 2013
presidential campaigns, (ii) To explore how social media users utilize SNS for political purposes,
and (iii) To explore the impact of social media on the presidential campaign process.
The instruments used in collection of data included questionnaires, interview guides and focus
group discussions. Quantitative data collected, was then coded and keyed in the statistical
package for social science (SPSS). The results were then carefully analyzed and well presented
to represent the actual situation on the ground. Qualitative data was closely analyzed
qualitatively and important information extracted from what the interviewees said and also what
was observed from the focus group discussions. The data was then presented making relevant
citations in comparison with the studies that had been done earlier and that related to the topic of
study. Summary and conclusions were derived from the findings of the study.
5.2 Major findings of the study
The study found that social media was integrated into the 2013 presidential campaigns. This is
confirmed by the findings in table 4.1 and figure 4.3 in the previous chapter, where all the
presidential candidates had followers on either Twitter or Facebook. As is shown in table 4.2 in
the previous chapter, there were items that were shared by political parties and or groupings on
social media. For instance, a majority (46%) of the respondents said they always came across a
poster of a political candidate while 32% of the respondents always came across a political group
on social media. Further, a screen caption of Uhuru Kenyatta’s Facebook page shows one of the
67
posters he used during the campaign period and that he had requested his fans to make it their
wall cover, as indicated in the appendix I section. The above findings were a clear indication that
social media was well integrated in the 2013 presidential campaigns. According to Wagner and
Gainous (2009) in their study of the 2006 US Congressional election, candidates are evolving
from simply supplementing traditional media outlets to engaging the Internet as part of a detailed
campaign strategy to win office.
The study sought to find out how social media was utilized for political purposes by its users.
The findings in section 4.5.5.1 of chapter four, revealed that between January and March, 2013
the respondents were engaged in various activities on social media. Table 4.12 indicated that
15.6% of the respondents said they posted political photos on social networking sites, 15.6% said
they posted a political status on social networking sites, 18.8% said they commented on a
political post or status updates, 6.3% said they shared political videos, photos or status updates
and 12.5% liked/retweeted a political post on Facebook and Twitter, 3.1% said they tagged a
friend on a political post on Facebook and Twitter. In the same table, 6.3% of the respondents
said they visited social networking sites to seek political information, findings that were in line
with the findings of a study done by Panagopoulos (2009) who posited that approximately one in
three young voters under the age of thirty-six rely on the Internet as their main source of political
information. The findings on table 4.13 generally indicated that most of the social media was
utilized by the respondents every day (7 days in a week).
The study further revealed that social media had an impact on the presidential campaign process.
From figure 4.5 in chapter four, a bigger majority of the respondents, 72.73%, said yes the
presidential candidates’ profiles or pages helped them in learning more about them. Social media
facilitated the interaction between the presidential candidates and their follower. For instance, a
screen caption of the Twitter accounts of Martha Karua and Peter Kenneth showed that there
were conversation between them and their followers, as is indicated in the appendix I section.
Further, findings from the focus group discussion indicate that, the respondents unanimously
agreed that social media facilitated upward communication between the electorate and their
leaders as they could send messages directly to their leader by simply making a post on their wall
and even engage them in discussions on matters of public interest.
68
Table 4.14 findings revealed that social media had a significant impact on the respondents in
relation to politics. For example, 52.3% said yes they developed interest in politics as a result of
the social media, a finding that was confirmed by (Chen 2009; Kushin & Kitchener 2009), who
posited that specifically young people developed interest in politics after coming across such
discussions on social software which is a communication platform. In addition, findings from the
focus group discussions indicated that majority of the respondents in the group agreed that
political information on social media was to a larger extent instrumental in reinforcing their
beliefs and support for a candidate of their choice.
The respondents also revealed that although they follow political candidates on social media so
as to get instant updates on the current activities they are involved in. Therefore, candidate’s
followers on social media cannot be a precise predictor of his expected votes in an election. It
was also observed that seasoned politicians who had a stronger following offline had an added
advantage online over new entrants and less known politicians. Margolis et al. (1997) argues that
despite the fact that the internet has lowered informational costs, established parties will transfer
their offline advantage to the web thus making it difficult for lesser know parties to build new
constituents.
5.3 Conclusion of the study
The study set to investigate the role of social media in the 2013 Kenya presidential election
campaigns. In view of the above summary, it was evident that social media played a major role
in the presidential election campaigns. Most of the presidential candidates integrated social
media into their campaigns and to some it did make returns but to others the returns were not
significant. However, social media by itself could not guarantee a candidate victory in the
elections. Therefore, presidential candidates need to strike a balance between their social media
campaigns with the ground campaigns to ensure that they effectively reach the most of the
voters.
On whether the social media was effectively used, the study found out that to some extent it was
but not exhaustively. A few number of the respondents said they came across the following on
SNS: solicitation of financial support, an invitation to a political rally/event, a shared link to a
political video, a shared link to a political website, a political party manifesto and a press release.
This shows that the candidates who integrated social media into their campaigns have not
69
exhaustively capitalized on the following campaign elements. Therefore, the use of social media
for campaigning did not reach it maximum potential.
The study also revealed that social media had several impacts on the users. Some of these
included enlightening the voters on the procedure of voting and most importantly on the
presidential candidates themselves. It also showed that some of the respondents developed
interest in politics as a result of coming across information on the social media. Some other
respondents agreed that political information on the social media mostly did reinforce the beliefs
they had on particular candidates and as such it also reinforced their support for the same
candidates.
5.4 Major recommendations from the study
i. In order for presidential candidates to get more voters to their side, they need to integrate
social media in their presidential campaigns since majority of the masses are on social
media and it can reach as many at once.
ii. Since integration alone is not enough, presidential candidates exploit the potential that
social media has in reaching the youth electorate by ensuring that they exhaustively
utilize all its capabilities of reaching and raising resources for the campaign
iii. The CCK, a regulatory body in charge of communication in Kenya, needs to step up its
effort to increase the rate of internet penetration in the country especially in rural areas
and other major towns. At the same time, it must reduce the cost of internet connection
which is currently high which is a deterrent in the use of the medium.
iv. The relevant authorities must monitor social media which has become a breeding ground
for hate speech whereby people are defamed, inflammatory remarks are made and
propaganda is continuously spread during the campaign period.
v. The government needs to adopt social media in providing some of its services to the
public given the wide reach of the platform and its ability to send messages instantly.
70

5.5 Suggestions for further research
i. Since the study targeted only the presidential campaigns, a similar study can be done on
other levels of campaigns such as senatorial campaigns, legislative campaigns or
gubernatorial campaigns.
ii. The target population of this study was urban youth only. This cannot be used to draw
inferences on the entire voter population in Kenya. Therefore, another study can be
conducted with the sampling being done on a wider population.
iii. Given the period that this study was conducted was a few months after the 2013 general
elections a similar study can be done during the election campaign window or
immediately after the elections.
iv. There is need to study hate speech on social media which has become prevalent during
election period to determine how this vice can be addressed.
71
References Boyd, D.M., & Ellison, N.B. (2007). Social network sites: Definition, history, and scholarship.
Journal of Computer-Mediated Communication, 13 (1). Retrieved from
http://jcmc.indiana.edu/vol13/issue1/boyd.ellison.html
Castells,Manuel. (2000). The rise of the network society. Cambridge, MA: Blackwell Pub.
O’Reilly, T. (2005). What is Web 2.0: Design patterns and business models for the next
generation of software. Retrieved May 12, 2009, from http://oreilly.com/ web2/archive/what-is-web-20.html
Hillygus, D. Sunshine and Todd G. Shields.( 2008). The Persuadable Voter: Wedge Issues in
Presidential Campaigns. Princeton: Princeton UP. Holbrook, Thomas M. (1996). Do Campaigns Matter? Thousand Oaks, CA: Sage.
Green, Donald P., and Alan S. Gerber. 2004. Get Out the Vote! How to Increase Voter Turnout. Washington, DC: Brookings Institution Press
Utz S (2009) The (potential) benefits of campaigning via social network sites. Journal of Computer Mediated Communication 14: 221–243.
McClurg, S.D. and T. Holbrook. 2009. “Living in a Battleground: Presidential Campaigns and the Activation of ‘Fundamental’ Considerations.” Political Research Quarterly. 62(3):495-506.
Madden, M. & Fox, S. (2006). Riding the waves of ‘Web 2.0’: More than a buzzword, but still
not easily defined, PEW INTERNET, October 5. Available at <http://www.pewinternet.org/pdf/PIP_Web_2.0pdf>
Williams C. B. and Gulati J. (2007). Social networks in political campaigns: Facebook and the 2006 midterm elections. Paper for presentation at the American Political Science
Association conference, Chicago, 30 August – 2 September. Conners J (2005) Understanding the third-person effect. Communication Research Trends 24(2):
1–22. DYE, Thomas R., ZIEGLER, Harmon. American Politics in the Media Age. Belmont:
Wadsworth, Inc., 1983. (Mauk & Oakland 2005)
Shea, D., Connor G., Joanne & Smith, C. (2007). Living Democracy : BRIEF NATIONAL
EDITION. New Jersey: Pearson. Bowers, T. A. (1975). The coverage of political advertising by the prestige press in 1972. Mass
Communication Review.2, 19-24
72
Steeper, F. T. (1978). Public response to Gerald Fords statement on eastern Europe in the second debate. In G. F. Bishop, R.G. Meadow, & M. Jackson Beeek (Eds.), The presidential debates: Media electoral, and policy perspective (pp. 81-101). New York: Praeger.
McKinnon, L. M. & Tedesco, J. C. & Kaid, L. L. (1993). The third 1992 presidential debate:
Channel and commentary effects. Argumentation and Advocacy, 30, 106-188. McKinnon, L. M. &Tedesco, J. C. (1999). The influence of medium and media commentary on
presidential debate effects. In L.L. Kaid & D.G. Bystrom(Eds). The electronic election: perspective on the 1996 campaign communication (pp.191-206).
Lanoueu, D. J., & Schrott, P. R. (1991). The joint press conference: The history, impact and prospects of American presidential debates. New York: Greenwood.
Tedesco, J.C., Miller, J. L., & Spiker J. A. (1999). Presidential campaigning on the information superhighway: An exploration of content and form. In L.L. Kaid & D. G. Bystrom (Eds). The electronic perspective on the 1996 campaign communication (pp. 51-63). Mahwah, NJ: Lawrence Erlbaum.
Kaid, L. L. & Holtz-Bacha, C. (2000). Gender reaction to TV political broadcast; A multi- company comparison. Havard International Journal of Press/Politics, 5(2), 17-29.
Swanson, D. (1992). The political media complex. Communication Monographs,39, 397-400
Sparks, C. (2001). The internet and the global public sphere. In W. L. Bennet & R.M. Entman
(Eds), Mediated Politics: Communication in the future of democracy (pp. 75-98). Cambridge: Cambridge University Press.
Barber, B. R., Mattson, K., & Peterson, J. (1997). The state of “electronically enhanced democracy.” A survey of the internet. New Brunswick, NJ: Walt Whitman Center of the Culture and Politics of Democracy.
Mossberger, K., C. Tolbert and M. Stansbury. 2003. Virtual Inequality: Beyond the Digital
Divide. Washington D.C.: Georgetown University Press. Wilhock, R. K. (1997). Cyber-politics. American Behaviorist Scientist, 40(8), 1208-1225.
D’ Alessio, D. (2000). Adoption of the World Wide Web by the American Political Candidates, 1996-1998. Journal of Broadcasting and Electronic Media, 44 (4), 556-568.
Klotz, R. (1997). Positive spin: Senate campaigning on the web. PS: Political Science & Politics, 30(3), 482-486
Baran, N. (1995). Computers and capitalism: A tragic misuse of technology. Monthly Review, 47(4), 40-46.
Hacker, K. L. (1996b). Virtual democracy and computer mediated political communication
73

(cmpc): The role of the Clinton White House in facilitating electronic democratization and political interactivity. Paper presented to the Speech Communication Association, San Diego.
Chandrasekaran, R. (1996, November 22). Politics finding a home on the net: Post-election surveys show the web gains influence amongst voters. The Washington Post, p. A4. Norris, P. (2000). A virtuous circle. Cambridge: Cambridge University Press.
Keane, J. (1995). Structural transformation of the public sphere. Communication review,1,1-22. Margolis, M., Resnick, D., & Tu, C. (1997). Campaigning on the internet: Parties and candidates
on the World Wide Web in the 1996 primary season. Harvard International Journal of Press/Politics, 2(1),59-78
Nueman, W. R. (2001). The impact of new media. In W.L. Bennet & R.M. Entman (Eds), Mediated Politics: Communication in the future of democracy (pp.299-320). Cambridge: Cambridge University Press.
Rheingold, H. (1995). The virtual community. London:Minerva.
Hill K. A., & Hughes, J.E. (1997). Computer mediated political communication: The USENET and political communities. Political Communication, 14,3-27
Kern, M. (1997). Social capital and citizen interpretation of political ads, news, and website information in the 1996 presidential election. American Behaviorist Scientist, 40(8), 1238-1249.
Norris, P. (2000). a virtuous circle:Political communication in post
Stempel, G.H.,III Hargrove, T., & Bernt, J.P. (2000). Relation of growth of use of the internet to changes in media use from 1995 to 1999. Journalism & Mass Communication Quarterly.77(1), 71-79.
Kushin M and Yamamoto M (2010) Did social media really matter? College students’ use of
online media and political decision making in the 2008 election. Mass Communication
and Society 13: 608–630.
Herrnson PS, Stokes-Brown AK and Hindman M (2007) Campaign politics and the digital
divide: constituency characteristics, strategic considerations, and candidate Internet use in state legislative elections. Political Research Quarterly 60(1): 31–42.
Williams, C. B., & Gulati, G. J. (2006). The Evolution of Online Campaigning in Congressional Elections, 2000-2004. Paper presented at the annual meeting of the American Political Science Association, Philadelphia.
Bimber, B., & Davis, R. (2003). Campaigning online: The Internet in U.S. elections. New York: Oxford University Press.
74

Gibson, R. K., & McAllister, I. (2006). Does Cyber-campaigning Win Votes? Online Communication in the 2004 Australian Election. Journal of Elections, Public Opinion, and Parties, 16(3), 243-263.
D‘Alessio, D. (1997). Use of the World Wide Web in the 1996 US election. Electoral Studies,16(4), 556-568
Gulati GJ and Williams CB (2010) Congressional candidates’ use of YouTube in 2008: its frequency and rationale. Journal of Information Technology & Politics, 7(2/3): 93−109. Strandberg K (2006) Parties, Candidates and Citizens On-Line – Studies of Politics on the
Internet. Åbo: Åbo Akademi University Press. Gibson, R. K., & McAllister, I. (2006). Does Cyber-campaigning Win Votes? Online
Communication in the 2004 Australian Election. Journal of Elections, Public Opinion, and Parties, 16(3), 243-263.
McLuhan, M.(1964): Understanding Media. New York: Mentor Norris, P. (1999). The impact of television on civic malaise”. In P. Norris, J. Curtice , D.
Sanders, M. Scammell & H. Semetko (Eds.), on message: Communicating the campaign. Thousand Oaks, CA:Sage.
75
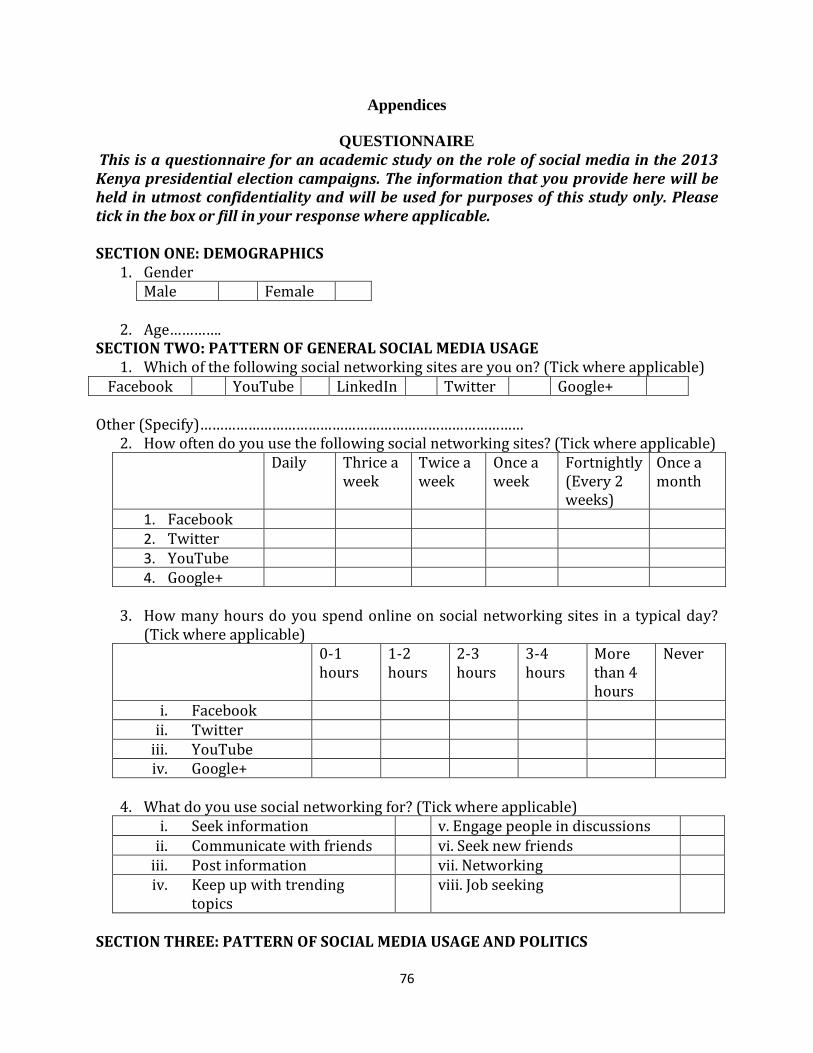
Appendices
QUESTIONNAIRE This is a questionnaire for an academic study on the role of social media in the 2013 Kenya presidential election campaigns. The information that you provide here will be held in utmost confidentiality and will be used for purposes of this study only. Please tick in the box or fill in your response where applicable. SECTION ONE: DEMOGRAPHICS
1. Gender Male Female
2. Age…………. SECTION TWO: PATTERN OF GENERAL SOCIAL MEDIA USAGE
1. Which of the following social networking sites are you on? (Tick where applicable) Facebook YouTube LinkedIn Twitter Google+
Other (Specify)………………………………………………………………………
2. How often do you use the following social networking sites? (Tick where applicable)
Daily Thrice a week
Twice a week
Once a week
Fortnightly (Every 2 weeks)
Once a month
1. Facebook 2. Twitter 3. YouTube 4. Google+
3. How many hours do you spend online on social networking sites in a typical day?
(Tick where applicable)
0-1 hours
1-2 hours
2-3 hours
3-4 hours
More than 4 hours
Never
i. Facebook ii. Twitter
iii. YouTube iv. Google+
4. What do you use social networking for? (Tick where applicable)
i. Seek information v. Engage people in discussions ii. Communicate with friends vi. Seek new friends
iii. Post information vii. Networking iv. Keep up with trending
topics viii. Job seeking
SECTION THREE: PATTERN OF SOCIAL MEDIA USAGE AND POLITICS
76
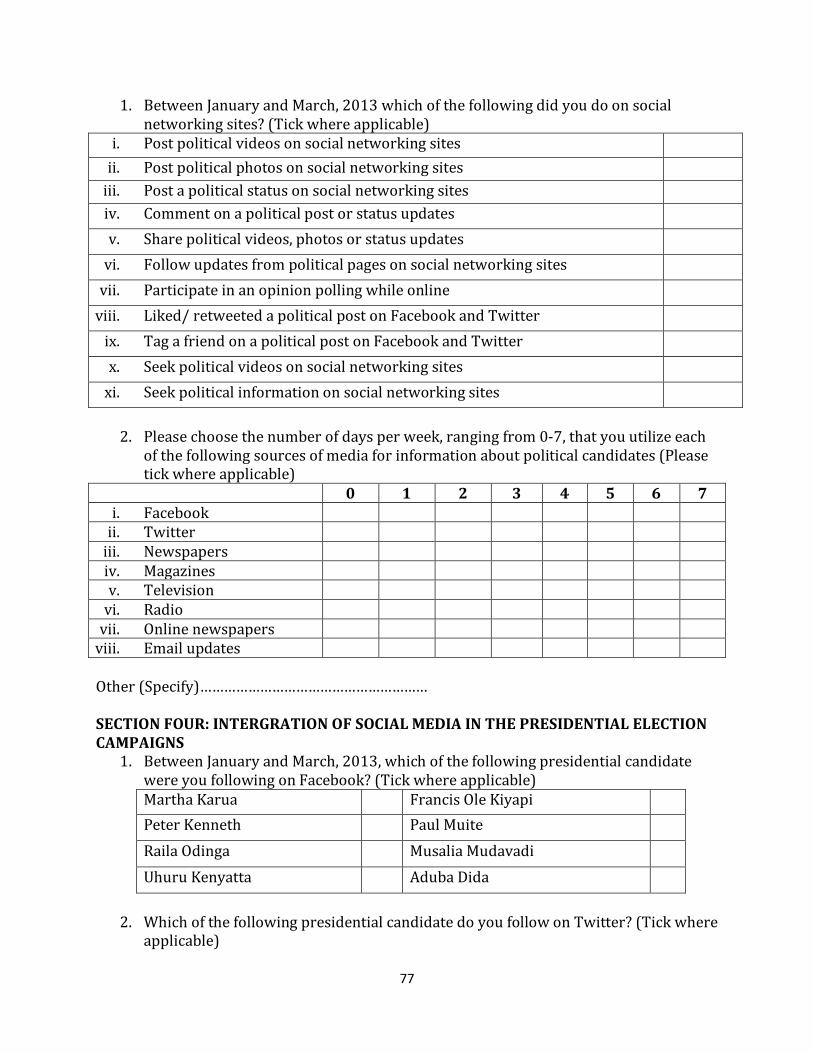
1. Between January and March, 2013 which of the following did you do on social networking sites? (Tick where applicable)
i. Post political videos on social networking sites ii. Post political photos on social networking sites
iii. Post a political status on social networking sites iv. Comment on a political post or status updates v. Share political videos, photos or status updates
vi. Follow updates from political pages on social networking sites vii. Participate in an opinion polling while online
viii. Liked/ retweeted a political post on Facebook and Twitter ix. Tag a friend on a political post on Facebook and Twitter x. Seek political videos on social networking sites
xi. Seek political information on social networking sites
2. Please choose the number of days per week, ranging from 0-7, that you utilize each of the following sources of media for information about political candidates (Please tick where applicable)
0 1 2 3 4 5 6 7 i. Facebook
ii. Twitter iii. Newspapers iv. Magazines v. Television
vi. Radio vii. Online newspapers
viii. Email updates Other (Specify)………………………………………………… SECTION FOUR: INTERGRATION OF SOCIAL MEDIA IN THE PRESIDENTIAL ELECTION CAMPAIGNS
1. Between January and March, 2013, which of the following presidential candidate were you following on Facebook? (Tick where applicable) Martha Karua Francis Ole Kiyapi Peter Kenneth Paul Muite Raila Odinga Musalia Mudavadi Uhuru Kenyatta Aduba Dida
2. Which of the following presidential candidate do you follow on Twitter? (Tick where applicable)
77
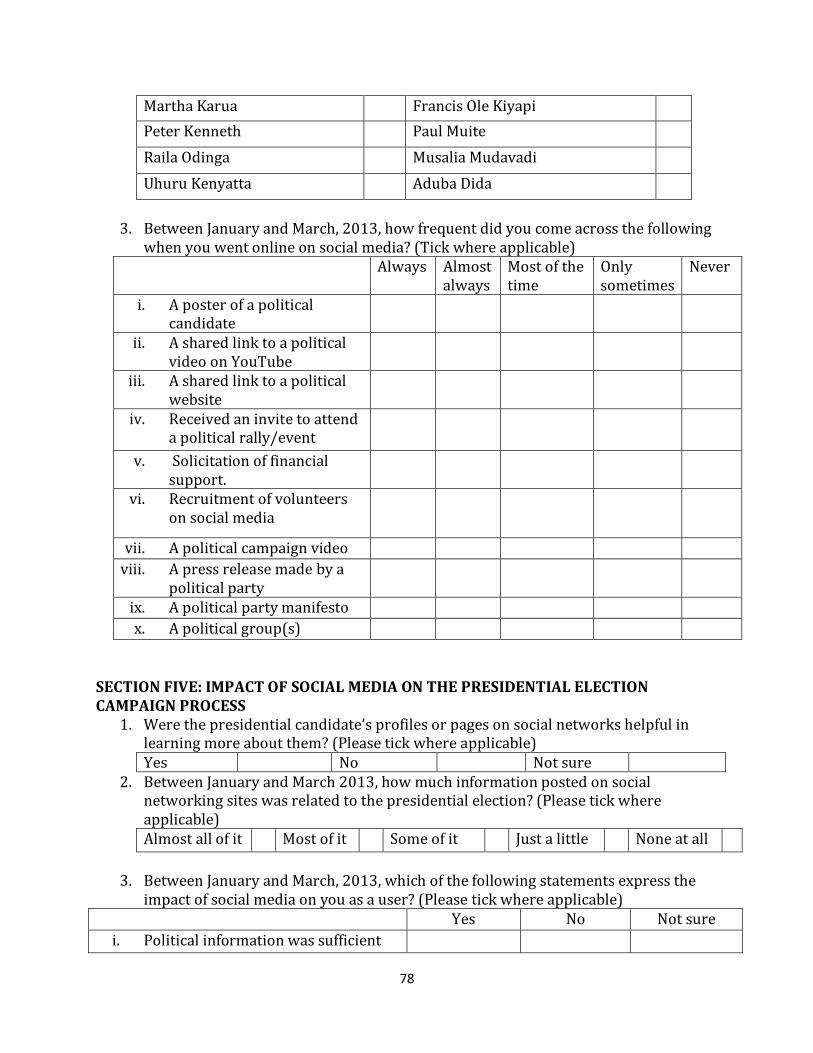
Martha Karua Francis Ole Kiyapi Peter Kenneth Paul Muite Raila Odinga Musalia Mudavadi Uhuru Kenyatta Aduba Dida
3. Between January and March, 2013, how frequent did you come across the following when you went online on social media? (Tick where applicable)
Always Almost always
Most of the time
Only sometimes
Never
i. A poster of a political candidate
ii. A shared link to a political video on YouTube
iii. A shared link to a political website
iv. Received an invite to attend a political rally/event
v. Solicitation of financial support.
vi. Recruitment of volunteers on social media
vii. A political campaign video viii. A press release made by a
political party
ix. A political party manifesto x. A political group(s)
SECTION FIVE: IMPACT OF SOCIAL MEDIA ON THE PRESIDENTIAL ELECTION CAMPAIGN PROCESS
1. Were the presidential candidate’s profiles or pages on social networks helpful in learning more about them? (Please tick where applicable) Yes No Not sure
2. Between January and March 2013, how much information posted on social networking sites was related to the presidential election? (Please tick where applicable) Almost all of it Most of it Some of it Just a little None at all
3. Between January and March, 2013, which of the following statements express the
impact of social media on you as a user? (Please tick where applicable) Yes No Not sure
i. Political information was sufficient
78

enough to enable me make an informed vote choice
ii. I developed interest in politics iii. I became reliant on social media for
election updates
iv. I withdrew my support for a candidate after reading something on social media
v. I am more knowledgeable in politics
4. On a scale of 1-5 to what extent do you agree or disagree with the following statements (Tick where applicable)
1 Strongly Disagree
2 Disagree
3 Neutral
4 Agree
5 Strongly Agree
i. There was a lot of propaganda spread on social media
ii. Hate speech was perpetuated on social media
iii. Political updates were instantaneous
iv. I was exposed to political information even without soliciting for it.
i. I was misinformed by a political post on social networking sites
79
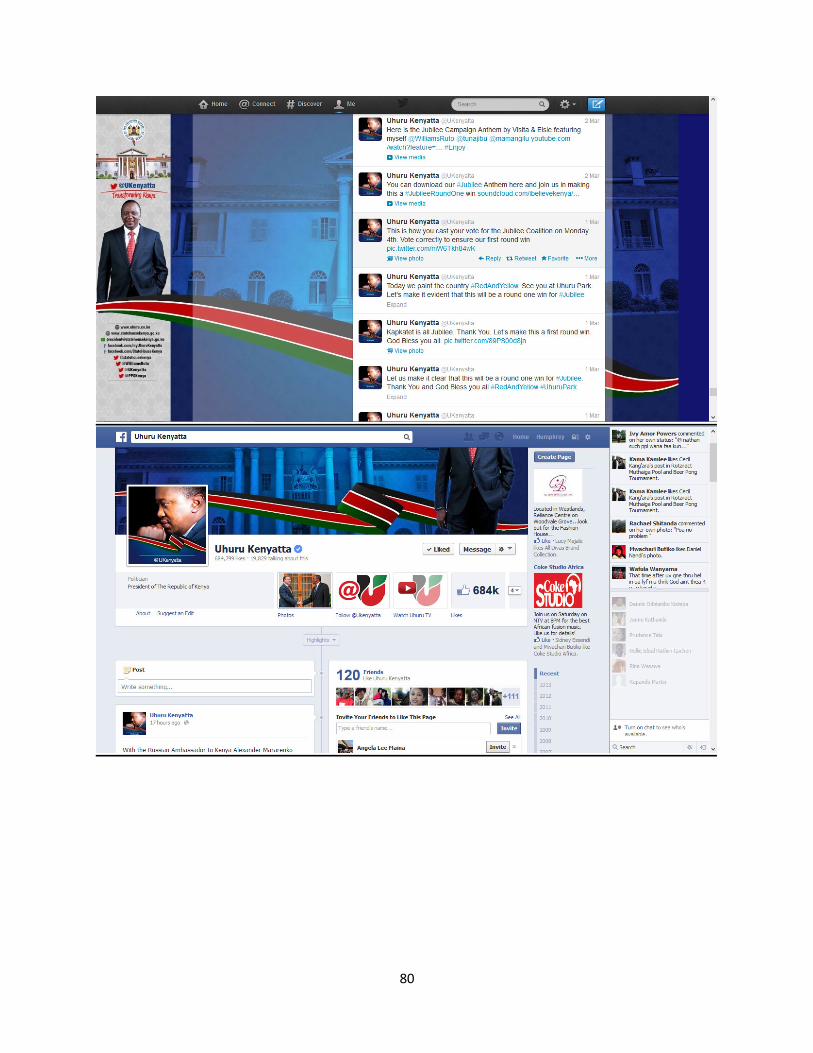
80

81

82
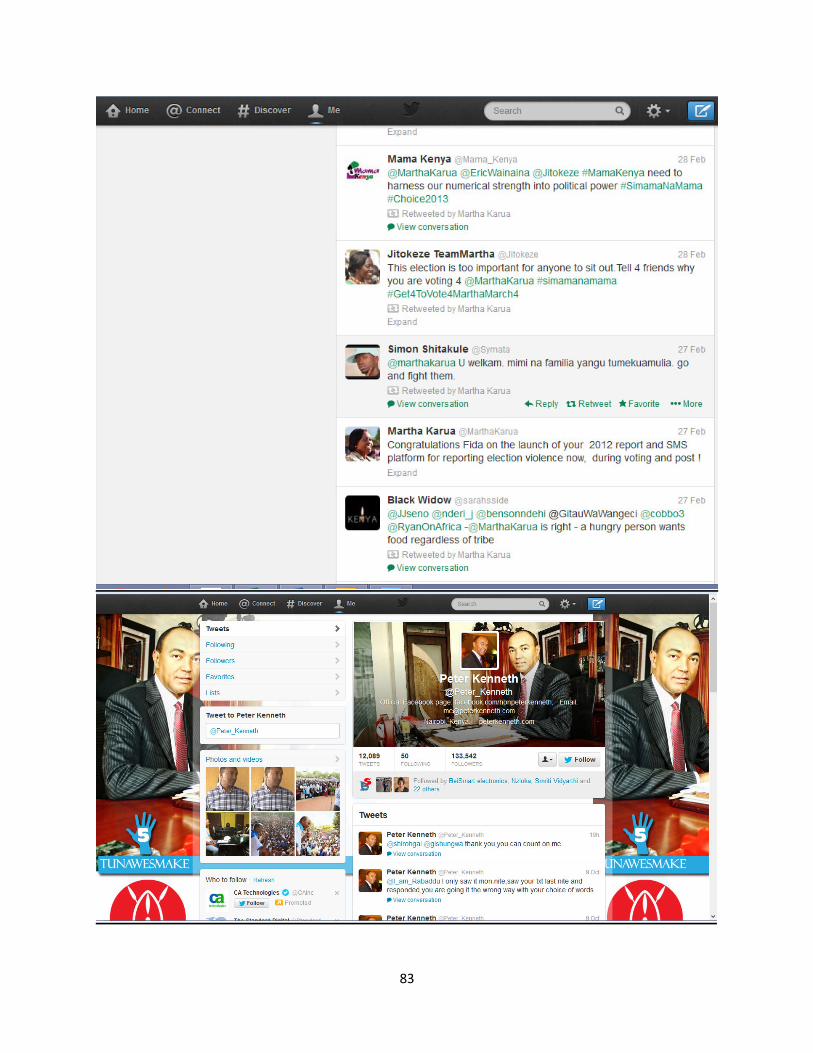
83

84

85

86