the role of remote sensing - home | ubc...
TRANSCRIPT

Data collectionA review of remote sensing

Road map
Data Collection
Remote sensingIntroductionConceptsSpectral signaturesResolutions: spectral, spatial, temporalDigital image processing (classification)Other systems
Remote sensing and GIS

Data Collection
One of most expensive GIS activitiesMany diverse sourcesTwo broad types of collection
Data capture (direct collection)Data transfer
Two broad capture methodsPrimary (direct measurement)Secondary (indirect derivation)

Data Collection Techniques
Raster Vector
Primary Digital remote sensing images(Image classification)
GPS measurements
Digital aerial photographs(Photogrammetry)
Survey measurements(COGO)
Secondary Scanned maps or photos
On-screen digitizing of maps
DEMs from contours
Toponymy data sets from atlases

Surveying

Primary Data CaptureCapture specifically for GIS useRaster – remote sensing
e.g. Landsat, SPOT and IKONOS satellites, and aerial photography (previously analog and vector, but increasingly digital and raster)
Resolution is key considerationSpatialSpectralTemporal(Radiometric)

Remote Sensing“is the measurement or acquisition of information of some property of an object or phenomena by a recording device that is not in physical or intimate contact with the object or phenomena under study”Both a science (math and physics underlie the technology) and an art (image interpretation is not an immutable process)
Who has done remote sensing?

Remote SensingIncludes UAV, aircraft, spacecraft and satellite-based systemsProducts can be analog (e.g., photos) or digital imagesRemotely sensed images need to be interpreted to yield thematic information (roads, crop lands, etc.)
Yellow = Pine leadingOrange = Fir leadingLight Green = Pine and Fd typeDark Green = Fd, Spruce, Pine typePurple = Fd, Spruce, Aspen minor pine

Remote sensing applications
MappingMonitoringModelling
Global, continental, landscape, local
(Scale is always an issue)
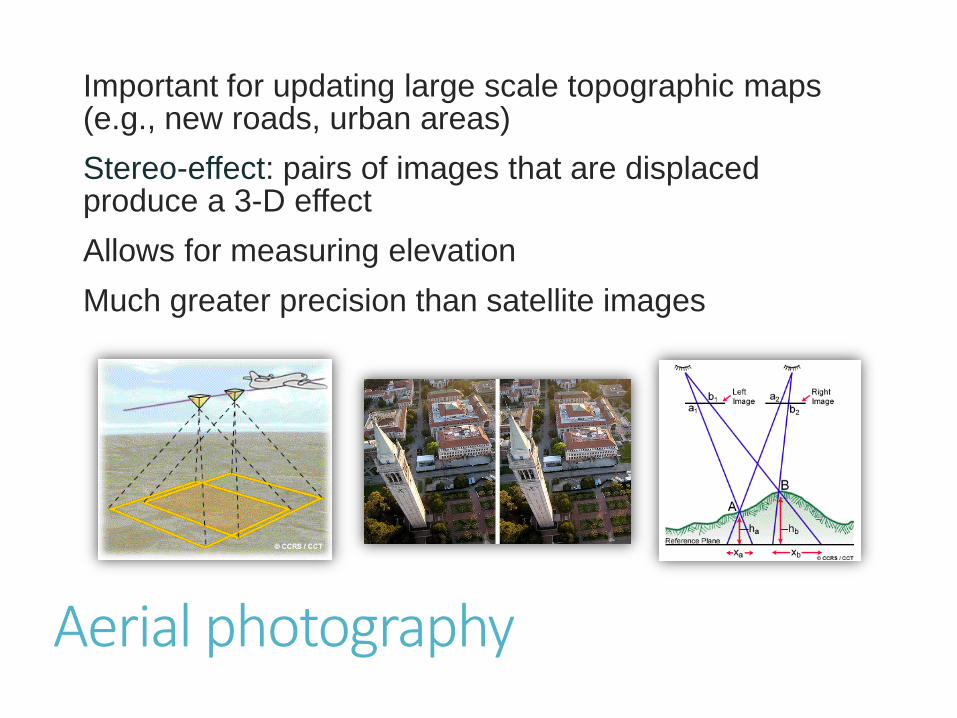
Aerial photography
Important for updating large scale topographic maps (e.g., new roads, urban areas)Stereo-effect: pairs of images that are displaced produce a 3-D effectAllows for measuring elevationMuch greater precision than satellite images

Advantages of Satellite R. S.
Synoptic coverage (study of inter-relations)Repetitive (enables monitoring of change)Multispectral imaging (beyond the visible region)Survey of inaccessible terrainCan also provide stereo coverage

Satellite-based systemsData recorded for pixels (picture elements)Size on-ground of a pixel varies from <1m to 60m or more for commercial systems; up to 1km for many environmental monitoring systemsImages are sent back from satellite as very large raster data sets
MODIS image
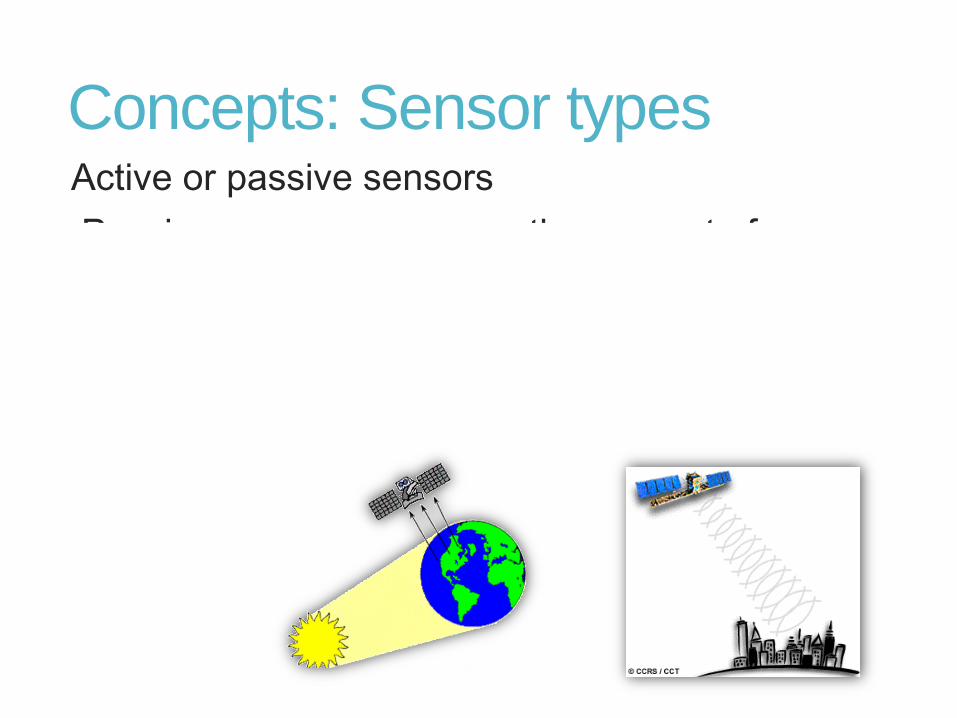
Concepts: Sensor typesActive or passive sensorsPassive: sensors measure the amount of energy reflected (or emitted) from the earth’s surfaceActive: sensor emits radiation in the direction of the target, it then detects and measures the radiation that is reflected or backscattered from the target.
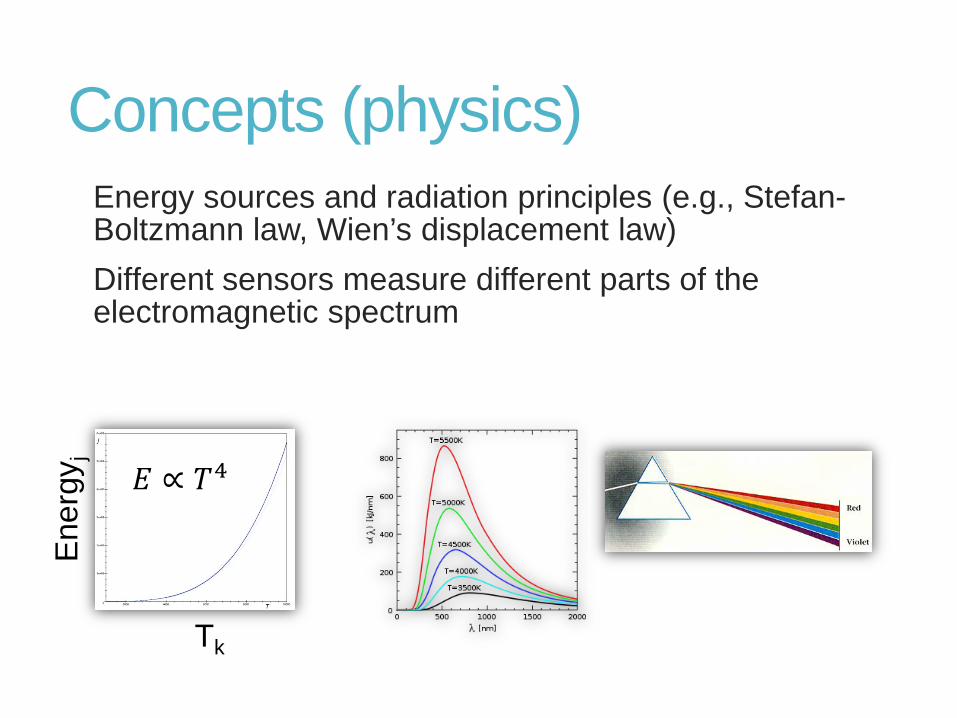
Concepts (physics)Energy sources and radiation principles (e.g., Stefan-Boltzmann law, Wien’s displacement law)Different sensors measure different parts of the electromagnetic spectrum
Tk
Ener
gyj
𝐸𝐸 ∝ 𝑇𝑇4

Electromagnetic spectrumvisible lightnear infraredm
id infraredtherm
al infrared
microw
ave
TV and radio
blue redUV near
infrared
110-110-210-310-410-510-6 10410310210 107106105
wavelength (µm) wavelength (µm)
0.4 0.5 0.6 0.7 µm
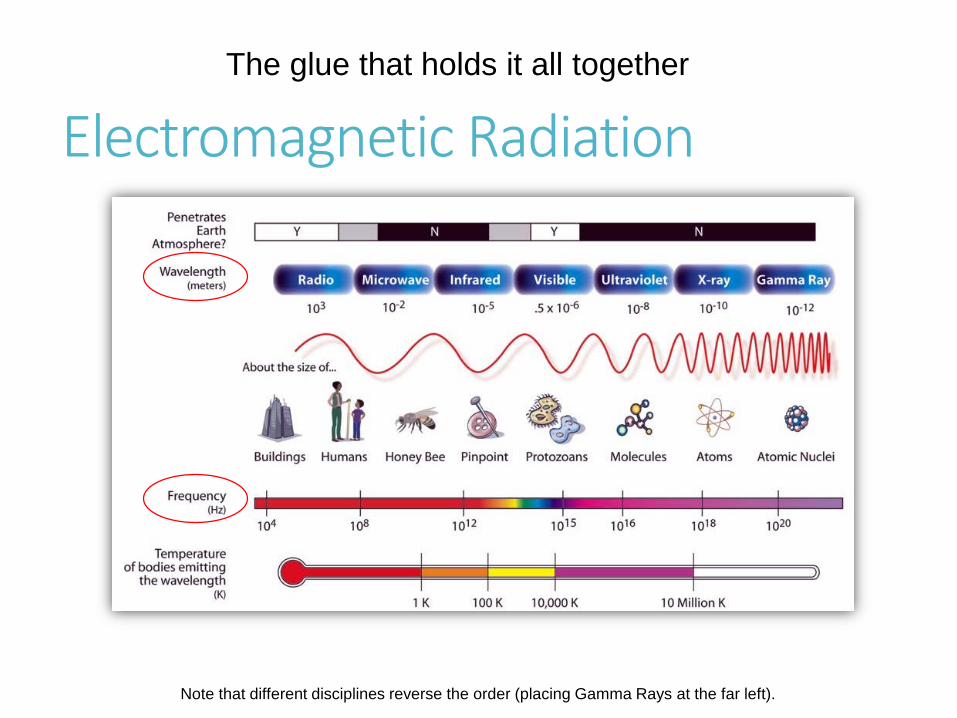
Electromagnetic RadiationThe glue that holds it all together
Note that different disciplines reverse the order (placing Gamma Rays at the far left).

A simple remote sensing systemEarth’s Surface
Sourceof energy
Sensing system

Object-EMR Interactions
EMR can be:
1: scattered2: reflected3: absorbed / emitted4: transmitted
by an object
EMR EMR EMR
EMR
EMR

A complete remote sensing ‘system’
A: Source of EMR
B: Electromagnetic radiation (EMR)
C: Object of interest
D: Sensor
E: Transmission to receiver
F: Data products
G: Results of analyses
A
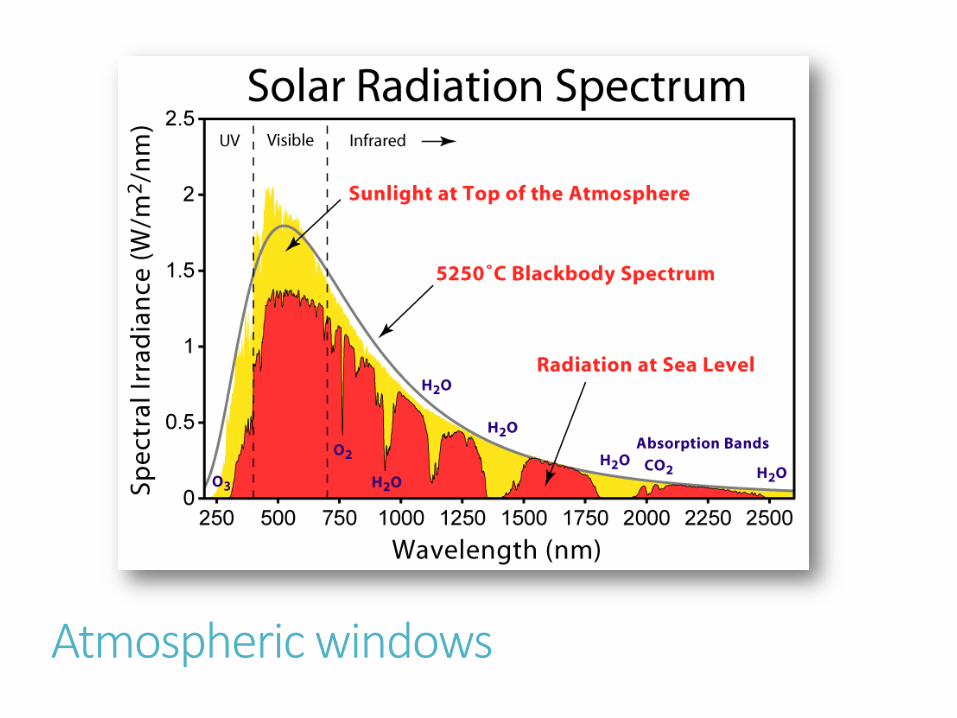
Atmospheric windows
Primary blockers: Ozone, water vapour, CO2
TheoreticalEMR
emissions

Spectral reflectance curves
Road map
Data Collection
Remote sensingIntroductionConceptsSpectral signaturesResolutions: spectral, spatial, temporal, radiometricDigital image processing (classification)Other systems
Remote sensing and GIS

Satellite-based sensors
Landsat, SPOT, IKONOS, GeoEye, …. also: Russian, Indian, Japanese, Chinese, European, and Canadian satellitesThey often differ in their spectralresolutions:
Panchromatic or multispectral orhyperspectral resolution.
What are the different types of spectral resolutions?

Spectral resolution
Multispectral vs Hyperspectral sensors
# and widthof bands
determine howclosely the spectralreflectance curve matches ‘reality’
bands
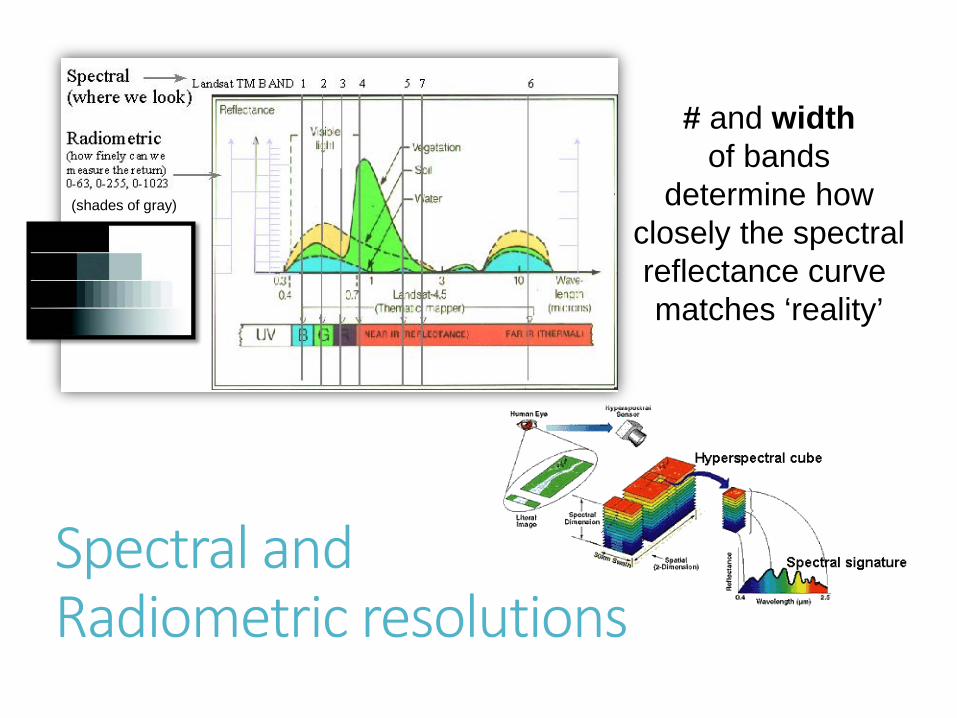
Spectral andRadiometric resolutions
# and widthof bands
determine howclosely the spectralreflectance curve matches ‘reality’
(shades of gray)
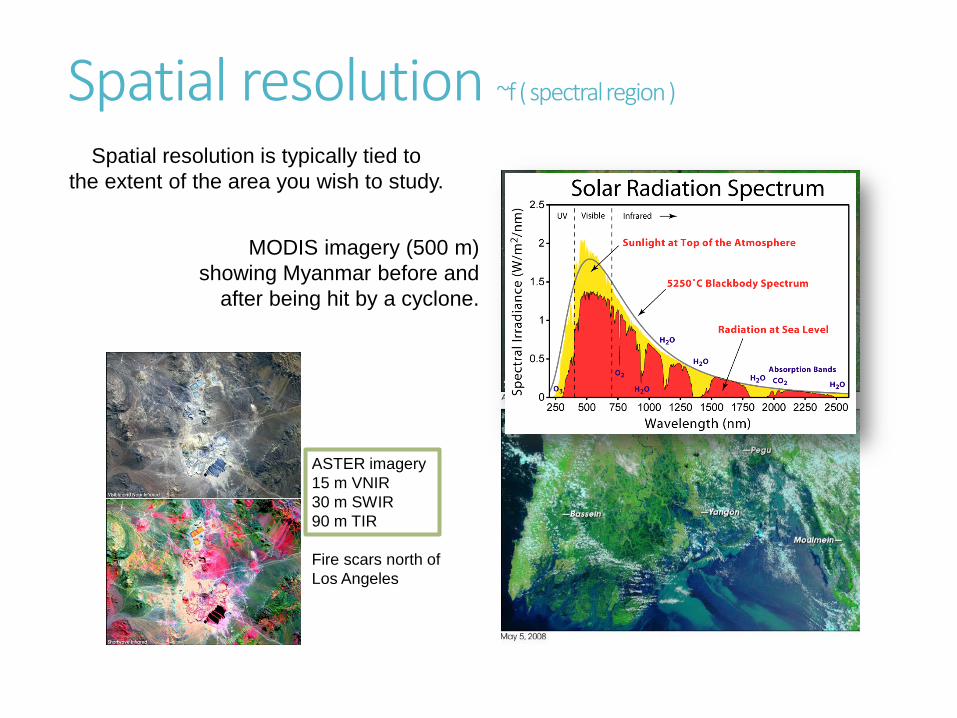
MODIS imagery (500 m) showing Myanmar before and
after being hit by a cyclone.
Spatial resolution ~f ( spectral region )
ASTER imagery15 m VNIR30 m SWIR90 m TIR
Fire scars north ofLos Angeles
Spatial resolution is typically tied tothe extent of the area you wish to study.

from IKONOS-11 m resolution
Source: http://gis.washington.edu/cfr250/lessons/remote_sensing/
Panchromatic image of the Jefferson memorial
Spatial Resolutionpixel resolutionInteractive tools:

Pan sharpening

Temporal resolution
Geostationary Orbit: The satellite appears stationary with respect to the Earth's surface.
Earth observation satellites usually follow sun synchronous orbits. A sun synchronous orbit is a near-polar orbit whose altitude is such that the satellite will always pass over a location at a given latitude at the same local solar time. In this way, the same solar illumination condition (except for seasonal variation) can be achieved for the imagesof a given location taken by the satellite.
Satellite orbits
Road map
Data Collection
Remote sensingIntroductionConceptsSpectral signaturesResolutions: spectral, spatial, temporalDigital image processing (classification)Other systems
Remote sensing and GIS

Digital image processing
Digital satellite data usually need considerable processingRegistration and atmospheric correctionAnalysis: - measurement- classification- estimation
The result of atmospheric correctionfor a pixel from a grass field.
Beforecorrection
Aftercorrection
The issue: we have spectral signaturesderived from ground-based analyses,
but the satellite data is ‘top of the atmosphere’data that is not necessarily equivalent.

Image display
True-color composite image(3, 2, 1)
Near Infrared Composite (4,3,2)
Shortwave Infrared Composite (7,4,3 or 7,4,2)
Vegetation in the NIR band is highly reflective due to chlorophyll, and an NIR composite vividly shows vegetation in various shades of red.
Water appears dark, almost black, due to the absorption of energy in the visible red and NIR bands.
Reflectance in the SWIR region is due primarily to moisture content. SWIR bands are especially suited for camouflage detection, change detection,
disturbed soils, soil type, and vegetation stress.
Interactive tool: band combinations

Measurement
TemperatureVegetation biomass- Normalized Difference Vegetation Index (NDVI)ElevationCrop conditionUrbanized area
High(much vegetation)
(little vegetation)Low

Classification
Identify and map areas with similar characteristicsAssign meaningful categories such as land-use or land-cover classes to pixel values Need “training areas” (ground-truth)Statistical approaches
Unsupervised vs supervised classes

Supervised Classification
ESRI Image Classification
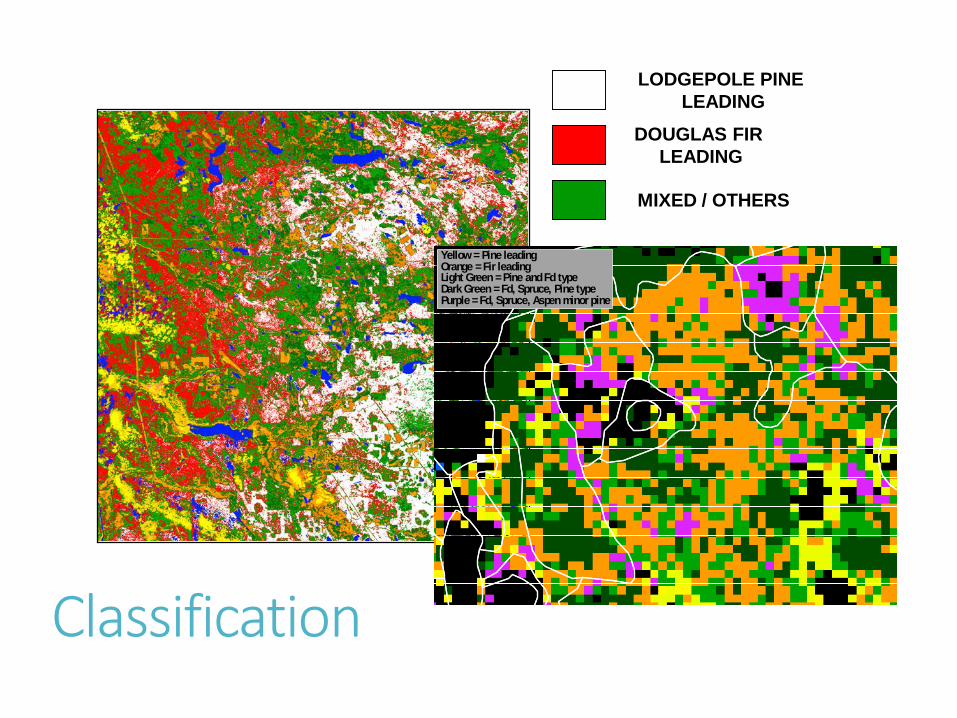
LODGEPOLE PINELEADING
DOUGLAS FIR LEADING
MIXED / OTHERS
Yellow = Pine leadingOrange = Fir leadingLight Green = Pine and Fd typeDark Green = Fd, Spruce, Pine typePurple = Fd, Spruce, Aspen minor pine
Classification

ClassificationReflectance varies with time of dayOften large uncertainty in classification- pixels may contain several classes
Mixed pixelsDespite sophisticated image processing systems, good classification depends upon lots of experience (part art, part science)
Effect of sun angle

Estimation
Objective is to estimate total amounts of a quantity, or areas under cultivation for an administrative or management area Examples: crop areas, forest resources, drought monitoring
JULY 2001 JULY 2002
LANDSAT THEMATIC MAPPER (SOURCE: CCRS 2002)

Road map
Data Collection
Remote sensingIntroductionConceptsSpectral signaturesResolutions: spectral, spatial, temporalDigital image processing (classification)Other systems
Remote sensing and GIS

Other systemsMeteorological satellites
e.g., Advanced Very High Resolution Radiometercoarser resolution but higher frequency and larger areas covereddesigned for meteorology but used for many other purposes (e.g., NDVI) (News of the latest GOES satellite)
Radar remote sensing (e.g., microwave)advantages in areas where cloud cover is frequent (e.g., tropical areas close to the equator)difficult to interpret
http://www.geog.ucsb.edu/~jeff/wallpaper2/page.html

Other systemsAerial video
visible lightusing off-the-shelf video cameras and post-processing systemscheap, rapid data collection for monitoring and data capture (http://www.draganfly.com)

Light Detection and Ranging
Forest canopy (1st return)
Using many rapid small bursts of laser light, an aircraft-borne apparatus records reflection
from multiple sources.
Ground surface (last return)
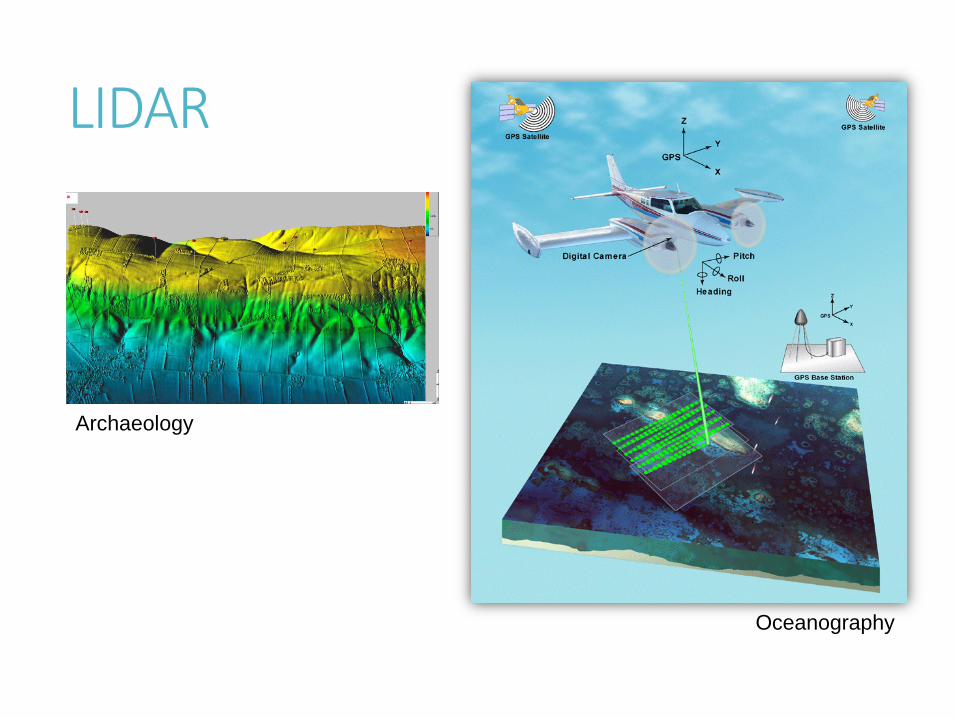
LIDAR
Archaeology
Oceanography
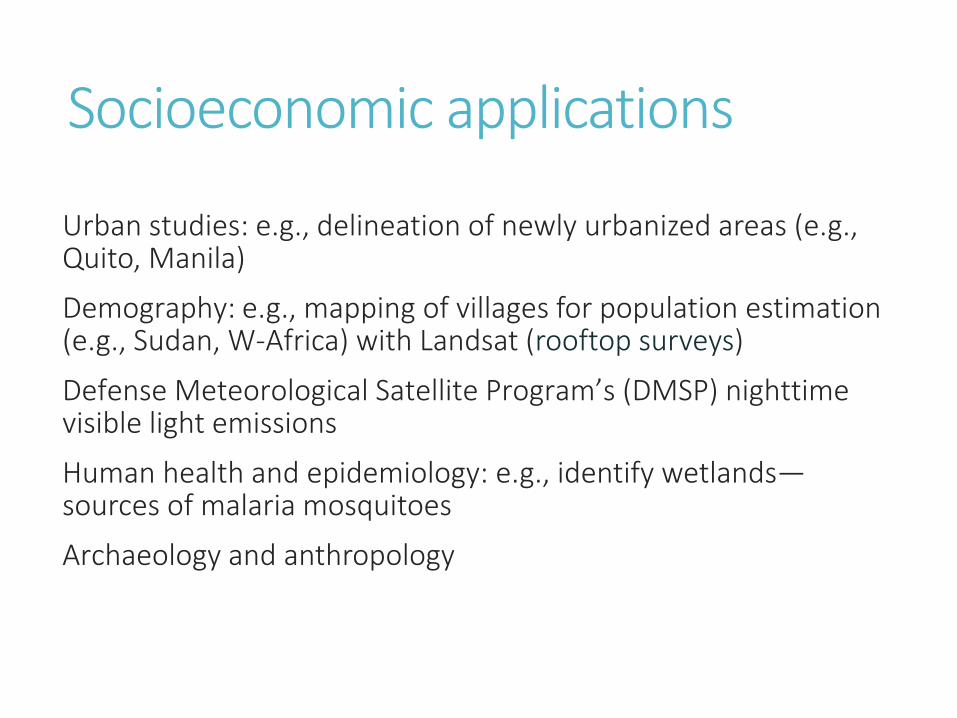
Socioeconomic applications
Urban studies: e.g., delineation of newly urbanized areas (e.g., Quito, Manila)
Demography: e.g., mapping of villages for population estimation (e.g., Sudan, W-Africa) with Landsat (rooftop surveys)
Defense Meteorological Satellite Program’s (DMSP) nighttime visible light emissions
Human health and epidemiology: e.g., identify wetlands—sources of malaria mosquitoes
Archaeology and anthropology

DMSP data
Japan South-East Asia
(water areas masked)

Road map
Data Collection
Remote sensingIntroductionConceptsSpectral signaturesResolutions: spectral, spatial, temporalDigital image processing (classification)Other systems
Remote sensing and GIS

Remote sensing and GISRemotely sensed data is an important data source (currency, frequency)Large scale: e.g., “cities revealed”Medium scale: framework data, urban/non-urban, crop conditions, etc.Small scale: NDVI, global land cover data sets

Remote sensing and GISRequires considerable processing to achieve high accuracy productsImage rectification and registration with GIS data sets introduces uncertainty when working with raster systems (note: resampling types)Image interpretation guided by GIS data
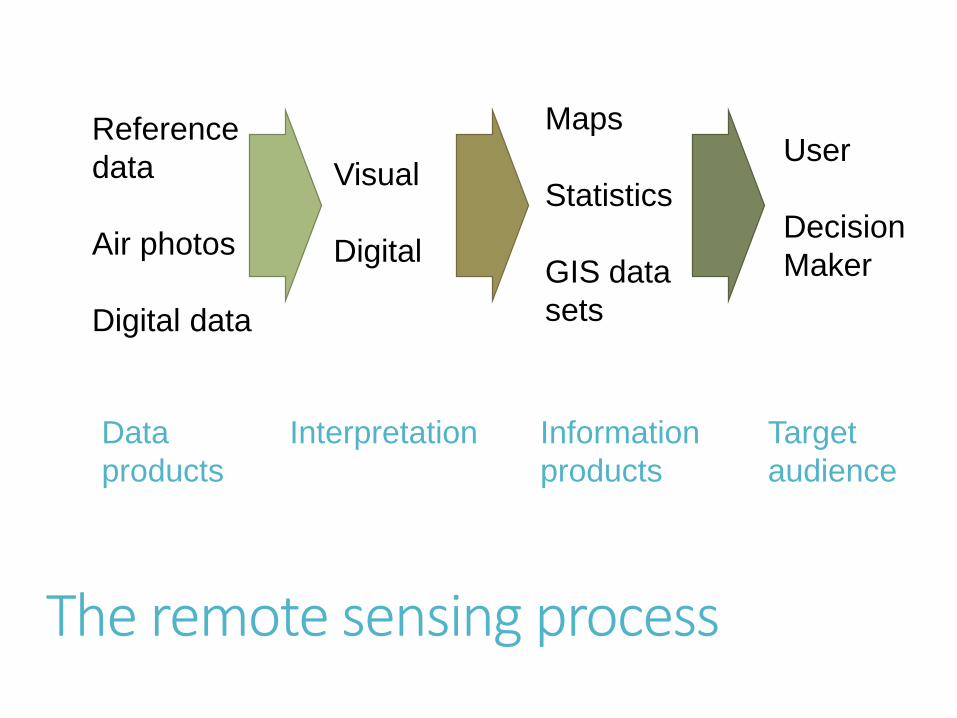
The remote sensing process
Visual
Digital
Reference data
Air photos
Digital data
Maps
Statistics
GIS datasets
User
DecisionMaker
Data products
Interpretation Informationproducts
Targetaudience
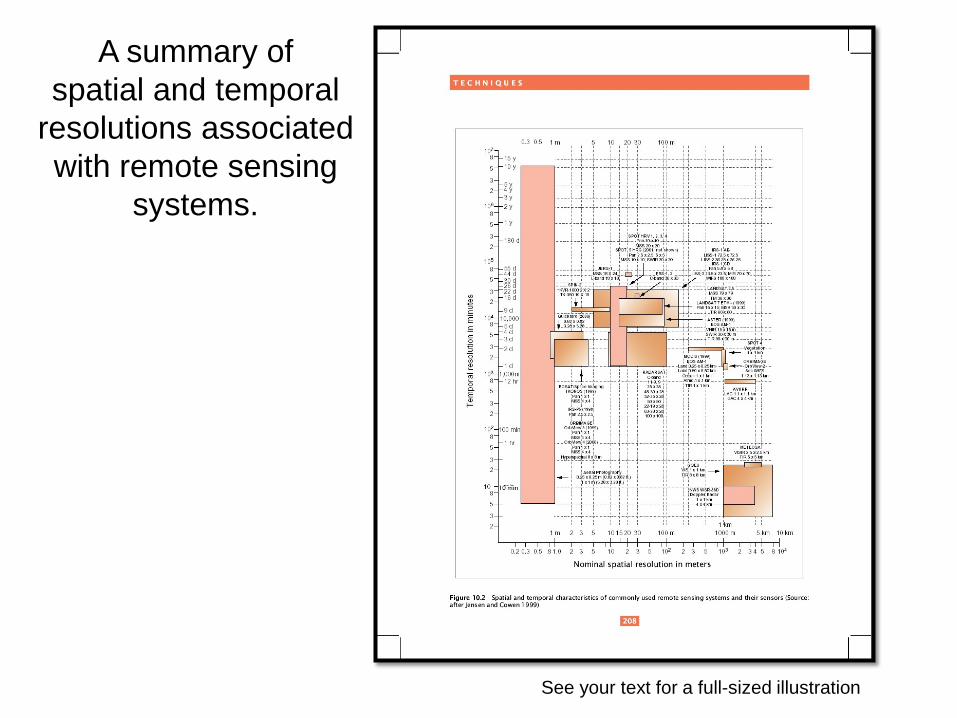
A summary ofspatial and temporal
resolutions associatedwith remote sensing
systems.
See your text for a full-sized illustration

Summary
Data Collection (expensive)
Remote sensingIntroductionConcepts (A/P, EMR)Spectral signaturesResolutions: spectral, spatial, temporal, radiometricDigital image processing (classification)Other systems
Remote sensing and GIS