the role of maps in neighborhood-level heat vulnerability...
TRANSCRIPT

Ryerson UniversityDigital Commons Ryerson
Geography Publications and Research Geography
1-1-2010
The Role of Maps in Neighborhood-Level HeatVulnerability Assessment for the City of TorontoClaus RinnerRyerson University crinnerryersonca
others
Follow this and additional works at httpdigitalcommonsryersoncageography
This Article is brought to you for free and open access by the Geography at Digital Commons Ryerson It has been accepted for inclusion inGeography Publications and Research by an authorized administrator of Digital Commons Ryerson For more information please contactbcameronryersonca
Recommended CitationC Rinner D Patychuk K Bassil S Nasr S Gower M Campbell (2010) The Role of Maps in Neighborhood-Level HeatVulnerability Assessment for the City of Toronto Cartography and Geographic Information Science 37(1) 31-44
The Role of Maps in Neighborhood-level Heat Vulnerability Assessment for the City of Toronto
Claus Rinner Dianne Patychuk Kate Bassil Shiraz Nasr Stephanie Gower
and Monica CampbellABSTRACT Extreme hot weather is a threat to public health and it is anticipated that the number of hot days and the duration of extreme heat events will increase with climate change Already heat-related illness and mortality is the dominant natural hazard in many countries While everybody is at risk to varying degrees there are known factors relating to heat exposure and sensitivity that make some population groups more vulnerable than others The objective of this paper is to assess carto-graphic design decisions in creating heat vulnerability maps and how they may affect the usefulness of different map types Spatial patterns of heat vulnerability were visualized using maps representing individual exposure and sensitivity indicators composite vulnerability indices and geographical hot spots of vulnerability The composite indices were calculated using the ordered weighted averaging (OWA) multi-criteria analysis method Hot spots were determined using local indicators of spatial association (LISA) This study is part of an ongoing project which aims to identify vulnerable popula-tions within the City of Toronto Canada in order to support targeted response and mitigation The maps were found to be a valuable addition to the hot weather planning toolkit supporting neighbor-hood-level interventions
KEYWORDS Climate change cluster maps geographic information systems heat-related illness multi-criteria analysis vulnerability index
Cartography and Geographic Information Science Vol 37 No 1 2010 pp 31-44
Introduction
Hot weather can have a serious impact on human health Researchers have studied the effects of extreme heat
events on the human body and found a spec-trum of impacts ranging from heat rash and sun burn to more complicated illnesses such as heat cramps fainting and heat exhaustion (Smoyer-Tomic and Rainham 2001 Basu and Samet 2002 Smoyer-Tomic et al 2003 Ebi 2007 Pengelly et al 2007) Heat stroke is the most severe illness related to heat and occurs when the bodyrsquos core temperature reaches 41degC or more (Ebi 2007) This usually only occurs when heat exhaustion is not noticed or treated and it is accompanied by hot dry skin fast pulse headache or coma Heat stroke can result in complications including kidney liver and brain damage and ultimately
death (Barrow and Clark 1998 Bouchama and Knochel 2002) According to statistics available from the US National Weather Service over the past ten years heat accounted for almost half of all deaths and injuries attributed to atmo-spheric phenomena in the countrymdashmore than any other weather-related cause (NWS 2008)
The health effects vary depending upon the length and severity of the heat wave as well as the bodyrsquos ability to dissipate extra heat A number of studies have shown that heat-related mortality significantly increases during prolonged hot and oppressive weather conditions (Kalkstein and Greene 1997 Kilbourne 1997) this impact is exacerbated with the additional effect of air pollution (Cheng et al 2007) Further morbidity as indicated by emergency calls and emergency department visits has also been shown to increase during periods of high daily temperatures (Semenza et al 1999 Dolney and Sheridan 2006 Bassil et al 2007)
Claus Rinner Department of Geography Ryerson University 350 Victoria Street Toronto Ontario M5B 2K3 Canada Ph 416 979 5000 x 2686 Email ltcrinnerryersoncagt Dianne Patychuk Steps to Equity 166 Curzon Street Toronto Ontario M4M 3B5 Canada Ph 416 462 9249 Email ltdpatychuksympaticocagt Kate Bassil Simon Fraser University Faculty of Health Sciences 8888 University Drive Burnaby BC V5A 1S6 Canada Ph 778 782 8644 Email ltkate_bassilsfucagt Shiraz Nasr Department of Geography Ryerson University 350 Victoria Street Toronto Ontario M5B 2K3 Canada Email ltsnasrryersoncagt Stephanie Gower Toronto Public Health 277 Victoria Street 7th Floor Toronto Ontario M5B 1W2 Canada Ph 416 338 8101 Email ltsgowertorontocagt Monica Campbell Toronto Public Health 277 Victoria Street 7th Floor Toronto Ontario M5B 1W2 Canada Ph 416 338 8091 Email ltmcampbe2torontocagt
32 Cartography and Geographic Information Science
Populations in temperate regions tend to be at an increased risk for heat stress in comparison with warmer regions in large part due to the greater seasonal fluctuation in temperatures and the lack of acclimatization to increasing temperatures (Kalkstein and Davis 1989 Basu and Samet 2002) The health impacts of insufficient acclimatization have been demonstrated in studies which suggest that heat waves earlier in the season result in more deaths than those occurring later in the summer (Kalkstein and Davis 1989)
Environment Canada predicts that the number of days with temperatures over 30 degrees in Toronto will more than triple from about 15 days per year between 1961-1990 to about 65 days per year by 2080-2100 A historical analysis of heat-related mortality for the period 1953 to 2000 estimated that on average 120 people die prematurely each year in Toronto due to summer heat with large variations from year to year depending on weather conditions (Pengelly et al 2007) Many studies indicate that urban areas such as Toronto are at increased risk for health effects from increased heat The urban environment poses a particular risk for heat episodes given the presence of the ldquourban heat islandrdquo where temperatures can range up to 11degC warmer than surrounding regions due to limited vegetative cover and large expanses of asphalt (Aniello et al 1995)
The City of Toronto has a heat health alert system in place which guides the Medical Officer of Health in calling heat alerts when the weather conditions pose an increased risk to health (Toronto Public Health 2009a) In response to an alert Torontorsquos hot weather response plan is activated by Toronto Public Health which initiates a number of interventions including mass media broadcast messaging opening cooling centers and providing outreach through social services Over the summer of 2007 there were 10 days with a heat alert and five days with an extreme heat alert (Toronto Public Health 2009a) Over the summer of 2008 there were three days with a heat alert and six days with an extreme heat alert (Toronto Public Health 2009a)
In addition to the general physiological risk of heat-related illness there are intrinsic and extrinsic factors that can increase this risk for individual persons and for population groups making them particularly vul-nerable Brooks (2003) makes a distinction between biophysical and social vulnerability Similarly Fuumlssel et al (2004) propose a series of conceptual frameworks for adaptation to the health effects of climate change in which they emphasize the role of non-climatic risk factors including demographic characteristics hous-ing conditions and individual behaviors Yohe and Ebi (2005) compare the concept of vulnerability in
the climate change and public health communities They note that ldquowithin the health sector vulnerability is viewed as the current or baseline state not as the residual state after adaptive capacity has been con-sideredrdquo (Yohe and Ebi 2005 p 21) Thus public health planning is based on current vulnerability the status prior to any intervention
ldquoReaching those who are most vulnerable and at-riskrdquo is identified as a continuing challenge by the Medical Officer of Health in a review of heat response activities during the summer of 2007 (Toronto Public Health 2007 p 1) A report by Mersereau (2007) also notes the challenge of ldquoidentifying and targeting vulnerable populationsrdquo and observes that ldquomunicipal decision-makers in the [Greater Toronto Area] do not have the data tools andor expertise to incorporate informa-tion about housing-stock or population demographics into their decision-making processesrdquo (p 30)
The purpose of this research is to develop mapping tools to identify vulnerable populations and places in order to guide short-term public health interven-tions as well as longer-term urban planning This paper illustrates preliminary results and discusses critical decisions in the mapping process such as geographic scale and aggregation variable selection and the parameters for composite indexing and cluster analysis It is anticipated that spatially explicit intra-urban neighborhood-level adaptation will contribute to reducing heat-related illness and mortality and mitigate the urban heat island effect Access to a map-ping tool will enable health department staff and their community partners to make better use of limited outreach resources through targeting interventions thereby improving the overall cost-effectiveness of heat response programs
The remainder of this paper is structured as fol-lows The next section summarizes previous research on human heat vulnerability current approaches to neighborhood-level assessment of heat vulnerability and geovisualization and map use in climate change research The following section describes the data and methods used in this project This is followed by a presentation and discussion of preliminary results with a focus on the exploratory mapping approach and the factors influencing the usefulness of maps The paper concludes with a summary and outlook on future research
Research BackgroundPopulation Vulnerability to Extreme HeatThe factors that increase the risk of heat-related illness in individuals and population groups are
Vol 37 No 1 33
sible impact (or baseline vulnerability) prior to any response and mitigation activities However many jurisdictions conduct hot weather interventions These short-term inter-ventions (response) as well as long-term inter-ventions (mitigation) are included in the framework as adaptation which reduces potential vulnerability to residual post-adaptation vul-nerability
Analysts increasingly combine multiple indica-tors into composite mea-sures (indices) of health health inequalities or health-related depriva-tion Cutter et al (2003) construct a social vulner-ability index using county-
level socioeconomic and demographic data in the United States Vincent (2004) proposes an index of social vulnerability to climate change for Africa based on a weighted average of five sub-indices representing economic demographic infrastructure global inter-connectivity and resource dependence factors at a country level Schuurman et al (2007) provide an overview of commonly used area-based deprivation indices They also present a tabular overview of the type of index categories of variables used variable weighting method and geographic unit of analysis (Schuurman et al 2007 p 594) Approaches to achieve a weighting of the impor-tance of different deprivation indicators include principal components analysis variable transfor-mationstandardization and expert weighting
Rinner and Taranu (2006) propose to assess population health using GIS-based multi-criteria evaluation (MCE) Generally MCE supports deci-sion-makers with a recommendation of a course of action to be taken The recommendation is based on the integration of multiple decision criteria into a single evaluation score for each decision alternative Rinner and Taranu (2006) employ the analytic hierarchy process (AHP) to structure and weight non-medical determinants of health for public health units across Ontario Bell et al (2007) also use a GIS-based multi-criteria method to construct a health-related index They build a socio-economic deprivation index from census data using ordered weighted averaging (OWA)
often structured according to the three general aspects of climate change vulnerability expo-sure sensitivity and adaptive capacity (Walker 2006 Seacuteguin and Clarke 2008) They can be grouped into socio-demographic and health-related physiological risk factors behavioral risk factors and risk factors relating to the physi-cal built and social environment Individual risk factors and indicators for measuring the risk have been proposed in a number of studies including Greenburg et al (1983) Cutter et al (2000) McGeehin and Mirabelli (2001) Smoyer-Tomic and Rainham (2001) Smoyer-Tomic et al (2003) Harlan et al(2006) and Tan (2008) For example the City of Torontorsquos Hot Weather Response Plan (Toronto Public Health 2009b p 2) lists socially isolated seniors as the high-est-risk group followed by people with chronic diseases including mental illness children and the marginally housed or homeless
To characterize heat vulnerability for the purpose of this study we used a simple conceptual framework adapted from the work by Schroeter et al (2004) and Ebi et al (2005) In the framework shown in Figure 1 the first component of heat vulnerability is the exposure to heat as an external physical impact on individuals The degree to which this impact affects a person is determined by their sensitivity a component that is internal to the host and hisher life circumstances and social networks As shown in Figure 1 exposure and sensitivity combine to form potential vulnerability which represents the pos-
Figure 1 Conceptual framework for heat vulnerability (adapted from Schroeter et al 2004 and Ebi et al 2005)
34 Cartography and Geographic Information Science
ity indicators into deciles and then combine the decile scores into a vulnerability index in order to map hot spots Another study was designed at Indiana University to predict heat-related mortal-ity in Philadelphia from heat exposure and risk factors using geo-statistical methods (Johnson and Wilson 2009) However to our knowledge a spatially explicit heat vulnerability assessment is not yet operational anywhere
Although intra-urban heat vulnerability assessment can be assumed to be more accurate than a-spatial assessments at the city or country level it is still conducted at aggregated geographic levels (eg neighborhoods) and therefore susceptible to the modifiable areal unit problem (MAUP) (Openshaw 1984) The MAUP describes the dependency of spatial relationships within and between variables on the zoning and scale of geographic reference units The zoning in many geographic datasets such as census data is independent of the phe-nomenon under investigation and must therefore be considered arbitrary Furthermore the MAUP affects the transition from one geographic scale to another For example Swift et al (2008) found that point data for disease events aggregated to larger polygons had a correlation of 081 while the correlation for the same data aggregated to smaller polygons was only 047 Incidence rates for larger spatial units tend to be based on larger samples and be more stable because local varia-tions are smoothed out However public health decision-making may require more detailed data distinguishing between higher and lower incidence rates (Swift et al 2008) The MAUP requires deci-sions on the geographic level of analysis depend-ing on the characteristics of the individual study and available datasets
Geovisualization and the Role of Maps in Climate Change ResearchMapping is an important tool for exploring data and communicating results in order to derive measures for policy intervention in climate change (Adger 2006 Eakin and Luers 2006) Maps are considered most powerful for detect-ing general spatial patterns and trends while data tables and lists are the more useful tools to retrieve specific information from a dataset (Slocum et al 2009) Geographic information systems (GIS) have been extensively used for mapping vulnerability to different environmen-tal hazards (Cutter et al 2003)
Cartographers have developed extensive guide-lines for creating effective thematic maps For
The OWA method allows the decision-maker to specify a decision strategy in terms of the degree of ldquoriskrdquo to be taken and the allowable trade-off between criteria (Malczewski and Rinner 2005)
Spatially Explicit Heat Vulnerability AssessmentExisting municipal hot weather response plans frequently refer to vulnerable populations when describing targeted prevention or response action to address a heat alert Many heat response measures such as notifications distri-bution of water or evacuation to cool places are directed at known registered high-risk individu-als at their residential locations as well as facili-ties with known or suspected concentrations of high-risk individuals (a distinction made by US EPA 2006 p 22) However between the level of individual person or facility and the broad scope of addressing the general public there are few interventions directed at the intermediate levels of target population groups or places Currently no outreach activities are conducted at a neigh-borhood level in Toronto with the exception of the cool places operated by the City and the acti-vation of community agencies which may inter-vene in specific neighborhoods
In a research project entitled ldquoSpatial vulner-ability analysis of urban populations to extreme heat eventsrdquo at Monash Universityrsquos Climate Group (Melbourne Australia) in collaboration with the Department of Human Services State of Victoria Australia researchers are creating a vulnerability index in order to visualize spatial patterns of vul-nerability across the City of Melbourne (Loughnan 2009) The project goals are to ldquotarget behavioral adaptationrdquo and to ldquoimplement heat wave response plans within the communities with the highest riskrdquo (Loughnan 2009 p 1) as well as to support longer-term planning to mitigate the urban heat island effect Other related work includes a study by the US National Center for Atmospheric Research in collaboration with the US Environmental Protection Agency and Arizona State University entitled ldquoExploring spatial patterns of societal vulnerability to extreme heatrdquo The project team conducts spatial analysis of heat vulnerability in Philadelphia and Phoenix (Wilhelmi 2007) The same researchers state that the ldquocombination of social and physical factors allowed for identifica-tion of areas and population at risk from excessive heatrdquo (Wilhelmi et al 2008 p 1) For the City of London UK McGregor and Wolf (2008) present an approach where they classify nine vulnerabil-
Vol 37 No 1 35
example McKendry and Machlis (2008) discuss a map of global climate change effects published in a report by the Intergovernmental Panel on Climate Change Their critique includes the recommen-dations to use an equal-area projection provide more focus to the map and simplify the legend use the lightness instead of the hue aspect of color in order to represent temperature as a continu-ous quantitative phenomenon and to improve the visual hierarchy and consistency between map title and legend and the actual contents of the map itself These recommendations are based on standard resources for cartographic design such as Slocum et al (2009)
The nature of maps is changing dramatically with the advent of more powerful computer hardware and easier-to-use mapping software An important direction of cartographic research and practice is the promotion of highly interactive maps used for data exploration and hypothesis generation early in an analytical process This concept of geographic visualization has been introduced by Monmonier (1989) DiBiase (1990) and MacEachren (1994) Examples of applications to public health are pre-sented by MacEachren et al (1998) Jankowski et al (2001) and Rinner and Taranu (2006) Increasingly maps are considered as a tool for visual spatial data analysis and combined with analytical tools (Rinner 2007)
Data and MethodsThis study was conducted at different geo-graphic scales within the City of Toronto which is located in the Greater Toronto Area on the north shore of Lake Ontario in southern Ontario Canada The scales employed within the City
boundaries included the dissemination area (DA) and census tract (CT) levels of Canadian census geography as well as the City neighbor-hood The DAs have a target population size of 400-700 persons while CTs ldquousually have a population of 2500 to 8000rdquo (Statistics Canada 2009) There are approximately 525 CTs which have been combined by Torontorsquos Social Policy amp Research Unit into 140 neighborhoods (City of Toronto 2009a)
In an ongoing project to explore the spatial patterns of heat vulnerability within the City indi-cator maps were created to represent risk factors for exposure and sensitivity Next index maps were developed in which multiple indicators were weighted and combined into a composite measure of heat vulnerability Finally cluster maps were produced to highlight areal concentrations of vul-nerable populations The static maps were created using ArcGIS for visual analysis on screen and in print Interactive maps of vulnerability indices and clusters were explored using CommonGIS and GeoDA respectively
Based on the review of the literature on heat vulnerability and taking into account the local conditions the risk factors shown in Table 1 were considered to be essential in order to assess heat vulnerability for Toronto A satellite thermal image received from Natural Resources Canada was used to represent actual heat exposure The image rep-resents estimated outdoor surface temperatures on September 3 2008 at approximately 10 am (Maloley 2009) The zonal statistics function in ArcGIS was used to extract the mean temperature for each CT and save it with the CT boundary data set Indicators for sensitivity to heat-related illness were selected from the 2001 and 2006 Canadian Census and the 2006 census target profile for seniors
Exposure Sensitivity Adaptation
Outdoor surfaceair temperatureLack of tree canopy green spaces
Old dwellings without ACHigh-density dwellings without AC
Behavior (recreation and events)
Pre-existingchronic illnessCognitive impairment
Elderly residentsInfants and young childrenLow-income households
Rental householdsSocially isolated people
HomelessLow education levelNot English speakingRecent immigrantsRacialized groups
Home cooling common cool roomsHostels drop-in centers
Participating community outreach centersCooling centers libraries malls
Table 1 Risk factors for a Toronto-specific heat vulnerability assessment
36 Cartography and Geographic Information Science
made available through the Community Social Data Strategy (City of Toronto 2009b) Selected facilities that represent adaptation measures in Table 1 will be mapped in the future to offset exposure and sensitivity according to the projectrsquos conceptual framework (Figure 1)
A Toronto-specific challenge results from the fact that about half of the Cityrsquos residents are immi-grants and close to half of the population have a mother tongue other than Canadarsquos two official languages At-risk groups therefore include resi-dents who have difficulty understanding English information and recent immigrants unaware of how to access services These access barriers are aggravated by other risk factors such as high heat exposure and low income
This study uses multi-criteria analysis similarly to the exploration of residential quality of life by Malczewski and Rinner (2005) and the construc-tion of a socio-economic deprivation index by Bell et al (2007) Both of these author groups also demonstrate the use of ordered weighted averag-ing (OWA) (Yager 1988) a family of multi-criteria operators allowing the decision-maker to apply weights of importance to the criteria as well as specify an attitude towards decision risk A decision strategy can be specified mathematically (using an additional set of weights) on a scale from risk-averse (ldquopessimisticrdquo) to risk-taking (ldquooptimisticrdquo) (Rinner and Malczewski 2002)
Local indicators of spatial association (LISA) (Anselin 1995) identify clusters of high low or opposite values within one variable or between two variables For example a statistically signifi-cant accumulation of areas with high values will be highlighted as the core of a high-value cluster Cutter and Finch (2008) use this approach to fur-ther test the social vulnerability index developed by Cutter et al (2003) for US counties Bassil (2008) applies the LISA method to the proportion of heat-related 911 calls by Toronto neighbor-hoods to identify local clusters of high burden of heat-related illness
In transitioning from conceptual risk factors (Table 1) to measurable indicators the availability of specific data limited the accuracy of the heat vul-nerability assessment For example socio-economic data rely on the residence of census population Like other urban centres Toronto has an important population of marginally housed and homeless who are often not captured in government sta-tistics Another example relates to using building age as a proxy for heat exposure through lack of air conditioning In fact many older buildings in Toronto are located in treed neighborhoods and
have been renovated to the highest standards of insulation andor air conditioning
Results and DiscussionToronto Public Health staff found the indicator and index maps highly useful to assess intra-urban patterns of heat vulnerability While intro-ducing a certain level of inaccuracy through data aggregation to administrative boundaries this approach was deemed in line with the general perspective of public health institutions develop-ing policies and interventions at the population rather than the individual level The following text discusses specific parameters in visualiza-tion and analysis which influence the accuracy and usefulness of heat vulnerability maps
Geographic Aggregation and Scale EffectsAs a continuous phenomenon surface tempera-ture is best represented through a raster map (Figure 2a However in order to achieve visual and analytical comparability with population-based indicators the temperature data from the thermal image was also aggregated to adminis-trative boundaries (census tracts) and displayed as a choropleth map (Figure 2b) Despite the known issues of the choropleth map which rep-resents potentially non homogeneous areas with a single symbol (color) we determined visually that the overall spatial pattern of heat exposure was well preserved in the aggregated data We therefore proceeded to combine them with area-based sensitivity indicators in a composite index of heat vulnerability
In order to assess the impact of geographic scale on the usefulness of the indicator maps experi-mentation with different scales took place Figure 3 shows the concentration of high-rise buildings (measured as the proportion of dwelling units located in buildings with five or more storeys) This is a highly inhomogeneous indicator of potential exposure to heat which is best mapped at the largest (most detailed) geographic scale of the census dissemination area (Figure 3a) The census tract (Figure 3b) and City neighborhood levels (Figure 3c) preserve the concentration of high-rise buildings located in the downtown core and along the central shore of Lake Ontario but blur the characteristic spatial pattern of high-rises along major highways elsewhere in the City Using the smaller scale (less detailed) maps would negatively
Vol 37 No 1 37
sensitivity to heat we realized that it would often be useful to narrow the sensitive population by captur-ing combinations of risk factors For exam-ple instead of simply overlaying the sensi-tivity indicators of low-income and elderly (aged 65 and over) populations (Figure 4a) we propose to use selected cross-tabula-tions such as the pro-portion of low-income persons among the elderly (Figure 4b) The spatial distribu-tion of the variables differs significantly For example there are a number of CTs along highway 401 in the western central part of the City which are characterized by high levels of the composite index of low-income and elderly However many of these CTs do not have a signifi-cant proportion of low-income persons among the elderly Conversely a number of CTs along the Gardiner Expressway in the downtown area show high proportions of low-income elderly although the overlay of the related individ-ual variables does not indicate sensitivity
An additional challenge occurred with the commonly used risk factor of being elderly and living alone In Toronto we found that certain areas in the central part of the City with high proportions of elderly living alone were among the wealthiest neighborhoods It is anecdotally known that elderly living alone in these old-grown shaded neighborhoods tend to be well equipped with air conditioning and other resources to stay
affect the ability to target areas of high potential exposure with specific outreach measures
Impact of Variable SelectionsOther studies which assess population sensitiv-ity to heat-related illness use individual census variables as indicators and occasionally combine these into composite indices of vulnerability (eg Vincent 2004) In exploring the mechanisms of
Figure 2 Effects of data representation (a) Thermal remote sensing image vs (b) aggregation of mean temperature by census tract (Data sources Natural Resources Canada Statistics Canada)
(a)
(b)
38 Cartography and Geographic Information Science
cool during a heat event This observation indicates the need to add an additional control-ling factor such as low-income to an already cross-tabulated indicator (ie elderly living alone)
Consideration of Decision-Makersrsquo NeedsThis project uses a task-ori-ented approach to creat-ing ldquoinformation productsrdquo (Tomlinson 2007) which address specific decision-making needs by the end-users in this case City staff who plan and conduct hot weather response activi-ties In particular we argue that there cannot be a single solution to identifying vul-nerable populations and hot spots of vulnerability Instead the vulnerability assessment must be adapted to specific interventions For example the distribution of general information on how to cope with extreme heat could be prioritized by a vul-nerability index for the gen-eral population (Figure 5a) However the planning of resources for evacuation of vulnerable residents to cool-ing centers should be based on a more specific measure such as a vulnerability index focusing on elderly popula-tions (Figure 5b)
The general population index was composed of the fol-lowing standardized variables and weights dwellings requir-ing major repairs (5 percent) dwellings constructed before 1986 (5 percent) apartments in buildings with five or more storeys (5 percent) dwellings rented (5 percent) low income persons before tax (15 percent) speaking neither English nor French (10 percent) recent
Figure 3 Dwelling units in high-rise buildings at different geographic scales (a) 2001 census dissemination areas (b) census tracts and (c) City neighborhoods (Data source Statistics Canada)
(a)
(b)
(c)
Vol 37 No 1 39
immigrants (5 percent) visible minority (5 per-cent) those without a degree (5 percent) persons aged 75 and older (15 percent) working age with disability (10 percent) and rates of ambulatory hospi-tal visits for circulatory (75 percent) and respiratory (75 percent) disease The index targeting seniors included those aged 65 and older among the total population (10 percent) aged 75 and older in private households (25 percent) low income seniors before
tax (25 percent) seniors without a degree (10 percent) seniors without command of either official language (10 percent) seniors who are recent immigrants (10 percent) and visible minority seniors (10 percent) It should be noted that the composition of the indices is preliminary and limited by current data availability The index maps are included here in order to illustrate the approach of using composite indices for the heat vulnerability assessment
Figure 4 The impact of variable selection (a) Overlay of low-income and seniors among total population vs (b) low-income among seniors from cross-tabulated target profile (Data source Statistics Canada Community Social Data Strategy)
(a)
(b)
40 Cartography and Geographic Information Science
An important requirement for effective spatial decision support is a concise summary of results In order to simplify the intra-urban patterns of heat vulnerability hot spots of vul-nerability were identified for the general population index above using the LISA method Figure 6 shows clusters of highly vul-nerable CTs (hot spots) in dark grey and clusters of low vulner-ability CTs (cool spots) in light grey However it is necessary to understand that these clustering patterns are highly dependent upon the input parameters for the LISA method For example a distinct degree of clustering results from statistical significance levels of 005 (Figure 6a) and 001 (Figure 6b) In addition the LISA method in GeoDA employs a randomization approach produc-ing slightly different clusters at each iteration even when using identical significance levels
Consideration of Decision-Makersrsquo Attitude towards Decision RiskThe OWA method supports an explicit definition of deci-sion strategies determined by the decision-makerrsquos attitude towards risk The risk-taking or optimistic strategy consid-ers the highest scores for each decision alternative (eg for each CT) while the risk-averse or pessimistic strategy focuses on the lowest scores For exam-ple in the optimistic strategy an area with a very high score in any of the criteria would per-form well irrespective of its other scores Thus the decision-maker takes the risk of accepting a solution which has one very high score but pos-sibly several very low scores In contrast in the pessimistic strategy a solution must have a sat-isfactory score even in its weakest criterion in order to perform well
Figure 7 shows a series of screen shots of a quin-tile map which ranks CTs using a sample index of heat vulnerability with the most vulnerable
CTs (lowest ranks) shown in dark color When applying the optimistic strategy (Figure 7a) the most vulnerable CTs appear in a patchy pattern which follows the anecdotally known U-shape of population with low socio-economic status in the City of Toronto extending from the northwest to the downtown area at the lake shore and harbor and then towards the northeast (Rinner 2007) This fragmented pattern can be explained by the fact that it is sufficient for an area to have just one high score (low vulnerability indicator) in order to perform well (low overall vulnerability)
The neutral strategy (Figure 7b) is identical to a regular weighted average ie it does not emphasize the high or low scores Following this
Figure 5 Addressing decision-maker needs (a) Heat vulnerability index for the general population vs (b) index for elderly population (Data source Statistics Canada Ministry of Health and Long Term Care)
(a)
(b)
Vol 37 No 1 41
strategy produces the clearest representation of the previously mentioned U-shape because low scores can be compensated by high scores result-ing in the fullest contribution of all criteria to the composite index for each area
A different pattern appears in the pessimistic strategy (Figure 7c) The more vulnerable areas tend to move towards the outskirts of the City and to cluster The U-shape of deprived neighborhoods is more distinct in some areas but it was interrupted in the downtown centre and the southeast (ldquoThe Beachesrdquo) The City centre is now characterized by a large cluster of low vulnerability which results from the fact that these areas have no low-scoring indicators at all In contrast some of the CTs in the northwest and northeast are newly developed and not shaded and their high surface temperature
values are sufficient to assess them as more vulnerable in the pessimistic risk-averse decision strategy than in previous strategies
Conclusion and
OutlookIn this paper we discussed the gaps in research addressing heat vulnerability at finer scale geogra-phy such as the urban neighbor-hood level We reported results from a preliminary assessment of population vulnerability to heat-related illness for the City of Toronto Canada Our assessment focused on the role of maps and on cartographic design decisions as elements of decision support and policy advice The recommen-dations include creating multiple representations of vulnerability indicators indices and hot spots in order to avoid issues result-ing from geographic aggregation and scale effects variable selec-tion and the input parameters of cluster analysis and multi-criteria methods
While it is anticipated that the preliminary project results will support hot weather planning and response in the current heat season additional steps need to be taken to complete the vulner-ability assessment Additional expo-
sure and sensitivity indicators as well as different composite vulnerability indices will be visualized and overlays with adaptation measures such as available cool places created The effectiveness of these maps and accompanying documentation needs to be assessed in interviews with Toronto Public Health staff and external stakeholders in community partner organizations However we envision that the maps can be used to help with preseason planning and operational heat response For example distribution of educational materials information seminars and first-aid training for hot weather could be targeted to organizations oper-ating in neighborhoods where vulnerable people live There is currently one community-level heat registry operating in Toronto the vulnerability
Figure 6 Hot spot maps for different parameters in LISA cluster analysis (a) Significance level of 005 vs (b) significance level of 001 (Data source Statistics Canada Ministry of Health and Long Term Care)
(a)
(b)
42 Cartography and Geographic Information Science
assessment may identify other areas which could benefit from such a program The information will also help with decisions such as where to open cooling centers and extend swimming pool hours during extreme heat alerts
Future research challenges can be grouped into three areas the approach to combining individual risk factors into a composite vulner-ability index the use of more advanced spa-tial analysis techniques and the validation of the vulnerability assessment In our examples indicators for exposure and sensitivity were combined in a composite measure of vulner-ability However these two groups of indicators represent processes of a very different spatial temporal and substantial nature For example surface temperature is a continuous ephemeral phenomenon while urban form is much more stable over time and consists of well defined discrete objects Other ways to compare exposure and sensitivity without integrating them should be explored Related research on testing the validity of the vulnerability assessment through heat-related mortality or morbidity cases also needs to be reviewed and a suitable method for Toronto devised
ACKNOWLEDGMENTS
Staff at Toronto Public Health and the Clean Air Partnership provided assistance and feed-back throughout this project Dan Jakubek helped with data acquisition while Blake Walker assisted with mapping and revised an earlier manuscript The helpful comments by two anonymous reviewers and by the editor are also gratefully acknowledged This research was partially funded by the Natural Sciences and Engineering Research Council of Canada (NSERC)
REFERENCES
Adger WN 2006 Vulnerability Global Environmental Change 16 268-81
Aniello C K Morgan A Busbey and L Newland 1995 Mapping micro-urban heat islands using LandsatTM and a GIS Computers amp Geosciences 21(8) 965-9
Anselin L 1995 Local indicators of spatial association mdashLISA Geographical Analysis 27 93-115
Barrow MW and KA Clark 1998 Heat-related illness American Family Physician 58(3) 749-56
Bassil KL E Gournis E Rea F Scott and D Cole 2007 Utility of 911 ambulance dispatch data for
the syndromic surveillance of heat-related illness in Toronto Ontario 2002-2005 Advances in Disease Surveillance 2 143 [httpwwwisdsjournalorgarticleview886]
Bassil KL 2008 The relationship between temperature and 911 medical dispatch data for heat-related illness in Toronto 2002-2005 An application of syndromic surveillance PhD Thesis Department of Public Health Sciences University of Toronto
Basu R and JM Samet 2002 Relation between elevated ambient temperature and mortality A review of the epidemiologic evidence Epidemiologic Reviews 24(2) 190-202
Bell N N Schuurman M Hayes and L Oliver 2007 Constructing place-specific measures of deprivation using local knowledge Evaluating population health in Vancouver British Columbia The Canadian Geographer 51(4) 444-61
Figure 7 Screenshots of a heat vulnerability index across different OWA decision strategiesa (a) optimistic (b) neutral and (c) pessimistic strategy (Data source Statistics Canada)
(a)
(b)
(c)
Vol 37 No 1 43
Bouchama A and JP Knochel 2002 Heat stroke The New England Journal of Medicine 346(25) 1978-88
Brooks N 2003 Vulnerability risk and adaptation A conceptual framework Tyndall Centre for Climate Change Research Working Paper 38
Cheng CS M Campbell Q Li G Li H Auld N Day D Pengelly S Gingrich and D Yap 2007 A synoptic climatological approach to assess climatic impact on air quality in south-central Canada Part I Historical analysis Water Air and Soil Pollution 182 131-48
City of Toronto 2009a Neighbourhood profiles [httpwwwtorontocademographicsneighborhoodshtm]
City of Toronto 2009b Community social data strategy [httpwwwtorontocademographicscsdshtm]
Cutter SL JT Mitchell and MS Scott 2000 Revealing the vulnerability of people and places A case study of Georgetown County South Carolina Annals of the Association of American Geographers Association of American Geographers 90 713-37
Cutter SJ BJ Boruff and WL Shirley 2003 Social vulnerability to environmental hazards Social Science Quarterly 84(2) 242-61
Cutter SL and C Finch 2008 Temporal and spatial changes in social vulnerability to natural hazards Proceedings of the National Academy of Sciences of the United States of America 105(7) 2301-6
DiBiase D 1990 Visualization in the earth sciences Pennsylvania State University Bulletin of Earth and Mineral Sciences 59(2) 13-8
Dolney TJ and SC Sheridan 2006 The relationship between extreme heat and ambulance response calls for the City of Toronto Ontario Canada Environmental Research 101 94-103
Eakin H and AL Luers 2006 Assessing the vulnerability of social-environmental systems Annual Review of Environment and Resources 31 365-94
Ebi KL JB Smith I Burton and S Hitz 2005 Adaptation to climate variability and change from a public health perspective In KL Ebi JB Smith and I Burton (eds) Integration of public health with adaptation to climate change London UK Taylor and Francis pp 1-17
Ebi KL 2007 Towards an early warning system for heat events Journal of Risk Research 10(5) 729-44
Fuumlssel H-M RJT Klein and KL Ebi 2004 Adaptation assessment for public health In B Menne and KL Ebi (eds) European climate change health impact and adaptation assessment Chapter 3 Cambridge UK Cambridge University Press
Greenburg JH J Bromberg C Reed T Gustafson and R Beauchamp 1983 The epidemiology of heat-related deaths Texas ndash 1950 1970-79 and 1980 American Journal of Public Health 73(7) 805-7
Harlan SL AJ Brazel L Prashad WL Stefanov and L Larsen 2006 Neighborhood microclimates and vulnerability to heat stress Social Science amp Medicine 63 2847-63
Jankowski P N Andrienko and G Andrienko 2001 Map-centered exploratory approach to multiple criteria spatial decision making International Journal of Geographical Information Science 15(2) 101-27
Johnson DP and JS Wilson 2009 The socio-spatial dynamics of extreme urban heat events The case of heat-related deaths in Philadelphia Applied Geography (Sevenoaks England) in press
Kalkstein LS and RE Davis 1989 Weather and human mortality An evaluation of demographic and interregional responses in the United States Annals of the Association of American Geographers Association of American Geographers 79(1) 44-64
Kalkstein LS and JS Greene 1997 An evaluation of climatemortality relationships in large US cities and possible impacts of climate change Environmental Health Perspectives 105(1) 84-93
Kilbourne EM 1997 Heat waves and hot environments In EK Noji (ed) The public health consequences of disasters Oxford University Press pp 245-69
Loughnan M 2009 lsquoHot Spotsrsquo project Spatial vulnerability to heat events in Melbourne Australia Conference abstract Annual Meeting of the Association of American Geographers March 22-27 2009 Las Vegas Nevada
MacEachren AM 1994 Visualization in modern cartography Setting the agenda In AM MacEachren and DRF Taylor (eds) Visualization in modern cartography Oxford UK Pergamon pp 1-12
MacEachren AM CA Brewer and LW Pickle 1998 Visualizing georeferenced data Representing reliability of health statistics Environment amp Planning A 30 1547-61
Malczewski J and C Rinner 2005 Exploring multicriteria decision strategies in GIS with linguistic quantifiers ndash A case study of residential quality evaluation Journal of Geographical Systems 7(2) 249-68
Maloley MJ 2009 Land surface temperature mapping of the greater Toronto area from Landsat TMETM+ thermal imagery 1987-2008 Report Canada Centre for Remote Sensing Natural Resources Canada
McGeehin MA and M Mirabelli 2001 The potential impacts of climate variability and dhange on temperature-related morbidity and mortality in the United States Environmental Health Perspectives 109 185-9
McGregor G and T Wolf 2008 Development and validation of an index for mapping heat vulnerability hotspots in urban areas Presentation at the 18th International Congress of Biometeorology 22-26 September 2008 Tokyo Japan
McKendry JE and GE Machlis 2008 Cartographic design and the quality of climate change maps Climatic Change published online
Mersereau V 2007 A scan of municipal heathealth watch warning systems and hot weather response plans Toronto Ontario Clean Air Partnership
44 Cartography and Geographic Information Science
Statistics Canada 2009 Census tract profiles [httpwww12statcangccacensus-recensement2006dp-pdprof92-597indexcfmLang=E]
Swift A L Liua and J Uber 2008 Reducing MAUP bias of correlation statistics between water quality and GI illness Computers Environment and Urban Systems 32(2) 134-48
Tan JG 2008 Commentary Peoplersquos vulnerability to heat wave International Journal of Epidemiology 37(2) 318-20
Tomlinson R 2007 Thinking about GIS 3rd ed Redlands California ESRI Press
Toronto Public Health 2007 Hot weather response plan update Staff Report Medical Officer of Health November 20 2007
Toronto Public Health 2009a Heat alerts and extreme heat alerts [httpwwwtorontocahealthheatalertsindexhtm]
Toronto Public Health 2009b City of TorontomdashHot weather response plan 2009 [httpwwwtorontocahealthheatalertspdfhwr_plan_2009pdf]
US EPA 2006 Excessive heat events guidebook Washington DC Office of Atmospheric Programs United States Environmental Protection Agency [httpwwwepagovhiriaboutpdfEHEguide_finalpdf]
Vincent K 2004 Creating an index of social vulnerability to climate change for Africa Working Paper 56 Tyndall Centre for Climate Change Research University of East Anglia Norwich UK
Walker A 2006 Vulnerability Whorsquos most at risk In Health Canada Climate change Preparing for the health impacts Health Policy Research Bulletin Issue 11 Chapter 6 [httpwwwhc-scgccasr-srpubshpr-rpmsbull2005-climatindex-engphp]
Wilhelmi O 2007 Annual report Societal-Environmental Research and Education (SERE) Laboratory National Center for Atmospheric Research (NCAR) [httpwwwsereucareduLAR2007catalogwilhelmihtml]
Wilhelmi O C Uejio J Golden D Mills and J Samenow 2008 Intra-urban spatial patterns of societal risk and vulnerability to extreme heat Geophysical Research Abstracts 10 EGU2008-A-05813 [httpwwwcosisnetabstractsEGU200805813EGU2008-A-05813pdf]
Yager R 1988 On ordered weighted averaging aggregation operators in multi-criteria decision making IEEE Transactions on Systems Man and Cybernetics 18 183-90
Yohe G and KL Ebi 2005 Approaching adaptation Parallels and contrasts between the climate and health communities In KL Ebi J Smith and I Burton (eds) Integration of public health with adaptation to climate change Lessons learned and new directions London UK Taylor and Francis pp 18-43
Monmonier M 1989 Geographic brushing Enhancing exploratory analysis of the scatterplot matrix Geographical Analysis 21 81-4
NWS 2008 Natural Hazard Statistics Silver Spring MD National Oceanic and Atmospheric Administration National Weather Service Office of Climate Water and Weather Services [httpwwwnwsnoaagovomhazstatsshtml]
Openshaw S 1984 The modifiable areal unit problem Concepts and techniques in modern geography Norwich UK Geobooks Vol 38
Pengelly LD ME Campbell CS Cheng C Fu SE Gingrich and R Macfarlane 2007 Anatomy of heat waves and mortality in Toronto Lessons for public health protection Canadian Journal of Public Health 98(5) 364-8
Rinner C and J Malczewski 2002 Web-enabled spatial decision analysis using ordered weighted averaging (OWA) Journal of Geographical Systems 4(4) 385-403
Rinner C and JP Taranu 2006 Map-based exploratory evaluation of non-medical determinants of population health Transactions in GIS 10(4) 633-49
Rinner C 2007 A geographic visualization approach to multi-criteria evaluation of urban quality of life International Journal of Geographical Information Science 21(8) 907-19
Schroeter D et al 2004 The ATEAM final report 2004 - Detailed report related to overall project duration Advanced Terrestrial Ecosystem Analysis and Modelling pp 139 Potsdam Institute for Climate Impact Research (PIK) Potsdam Germany [httpwwwpik-potsdamdeateamateam_final_report_sections_5_to_6pdf]
Schuurman N N Bell J Dunn and L Oliver 2007 Deprivation indices population health and geography An evaluation of the spatial effectiveness of indices at multiple scales Journal of Urban Health 84(4) 591-603
Seacuteguin J and K-L Clarke 2008 Introduction In J Seguin (ed) Human health in a changing climate A Canadian assessment of vulnerabilities and adaptive capacity Ottawa Canada Health Canada
Semenza JC JE McCullough WD Flanders MA McGeehin and JR Lumpkin 1999 Excess hospital admissions during the July 1995 heat wave in Chicago American Journal of Preventive Medicine 16(4) 269-77
Slocum TA RB McMaster FC Kessler and HH Howard 2009 Thematic cartography and geovisualization 3rd ed Upper Saddle River New Jersey Prentice Hall
Smoyer-Tomic KE and D Rainham 2001 Beating the heat Development and evaluation of a Canadian hot weather health-response plan Environmental Health Perspectives 109 1241-8
Smoyer-Tomic KE R Kuhn and A Hudson 2003 Heat wave hazards An overview of heat wave impacts in Canada Natural Hazards 28 463-85
- Ryerson University
- Digital Commons Ryerson
-
- 1-1-2010
-
- The Role of Maps in Neighborhood-Level Heat Vulnerability Assessment for the City of Toronto
-
- Claus Rinner
- others
-
- Recommended Citation
-
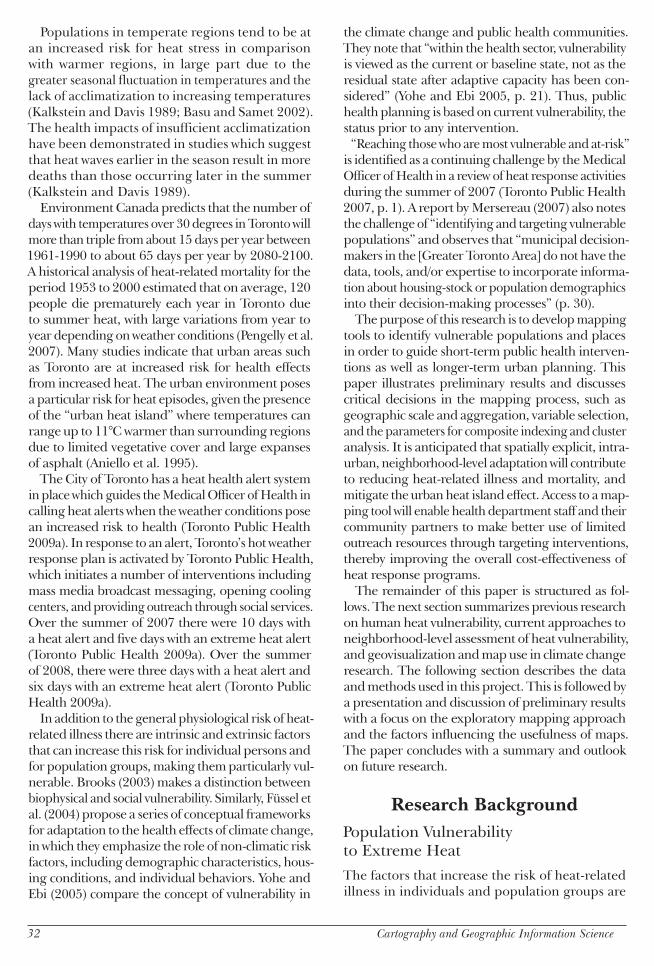
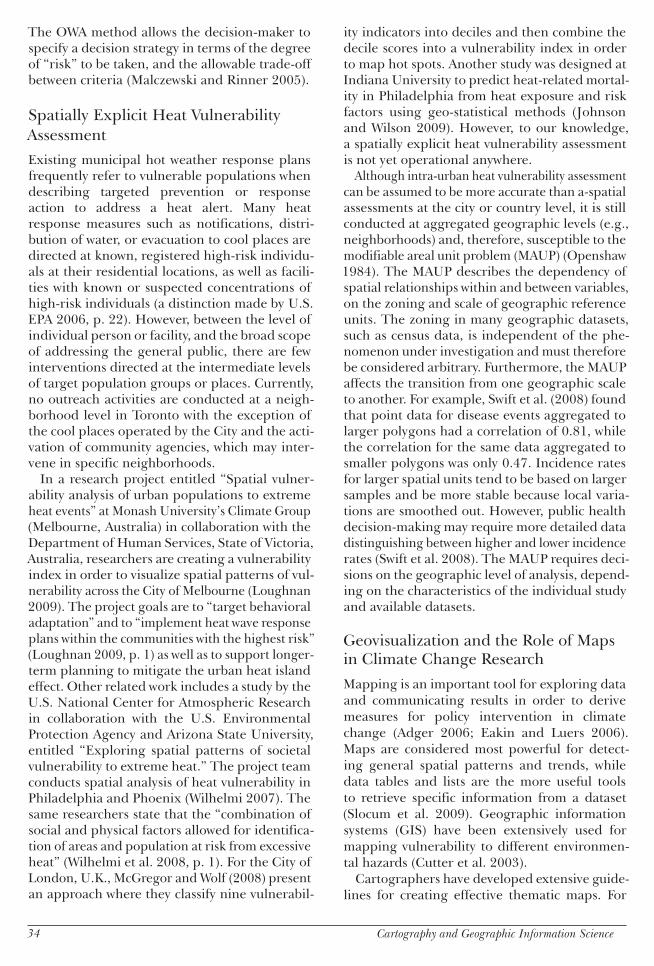
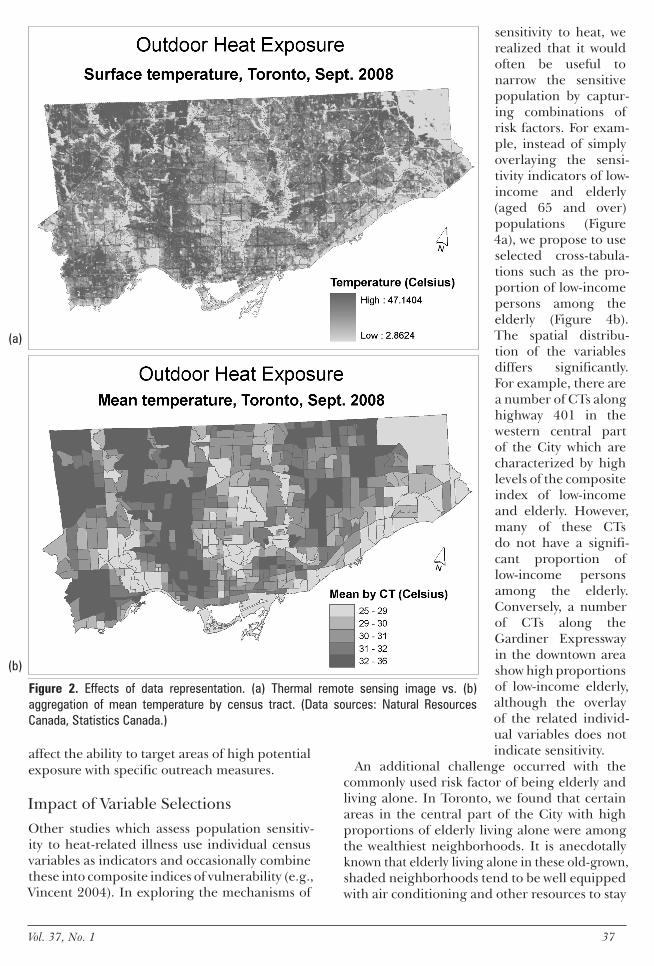
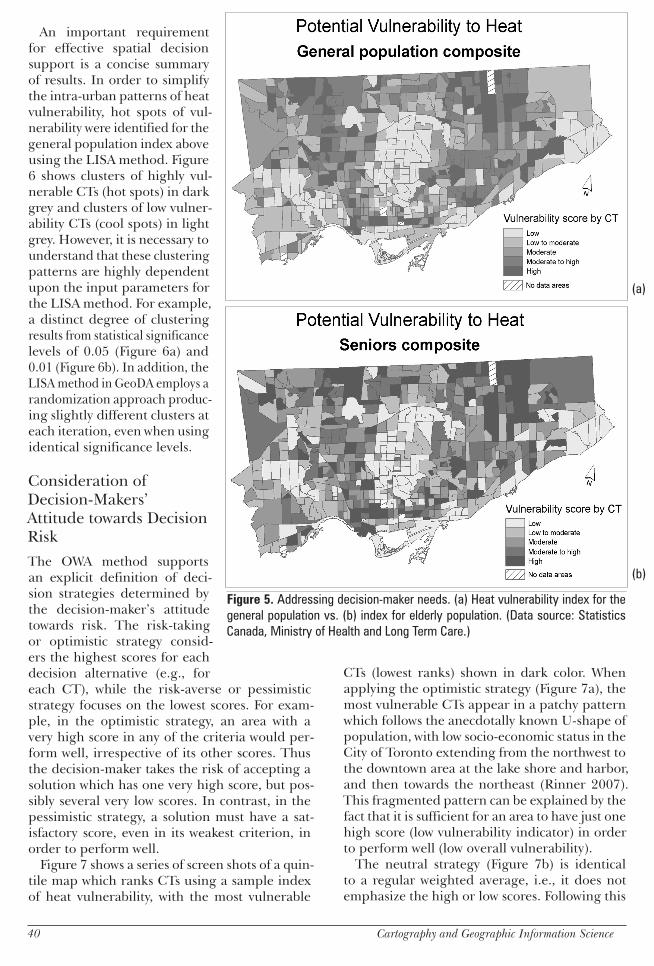