the role of exploratory data analysis (eda) in electricity ... papers/jssh vol. 24 (s) oct... ·...
TRANSCRIPT
Pertanika J. Soc. Sci. & Hum. 24 (S): 93 – 100 (2016)
ISSN: 0128-7702 © Universiti Putra Malaysia Press
SOCIAL SCIENCES & HUMANITIESJournal homepage: http://www.pertanika.upm.edu.my/
ARTICLE INFOArticle history:Received: 24 February 2016Accepted: 30 September 2016
E-mail addresses:[email protected] (Ismail, S.),[email protected] (Zulkifli, M.),[email protected] (Mansor, R.),[email protected] (Mat Yusof, M.),[email protected] (Ismail, M. I.)* Corresponding author
The Role of Exploratory Data Analysis (EDA) in Electricity Forecasting
Ismail, S.*, Zulkifli, M., Mansor, R., Mat Yusof, M. and Ismail, M. I.School of Quantitative Sciences, Universiti Utara Malaysia, 06010 UUM Sintok, Kedah, Malaysia
ABSTRACT
Exploratory Data Analysis (EDA) is an approach introduced by Tukey. The aim is to obtain an in depth understanding of data using graphics. This contradicts the classical approach which uses statistical summaries such as mean and standard deviation among others. Skipping EDA in investigating data can jeopardise the validity and reliability of the results. In this study, we highlight the crucial role of EDA in electricity forecasting via line chart to understand the existence of the four-time series components i.e. trend, seasonal, irregular and cyclical. Daily electricity load for financial year 2002 to 2006 are used. The EDA showed irregular patterns identified in the line chart are not irregular components but moving seasonal components which require different techniques of forecasting.
Keywords: Graphical, classical approach, time series components, line chart, moving seasonal
INTRODUCTION
“Exploratory Data Analysis (EDA) is detective work – numerical detective work – or counting detective work – or graphical detective work ... unless exploratory data analysis uncovers indications, usually quantitative ones, there is likely to be nothing for confirmatory data analysis to consider ... [it] can never be the whole story, but nothing else can serve as the foundation stone - as the first step.” (Tukey, 1977). The EDA is an approach for data
analysis, introduced by, Tukey in which he emphasises the importance of EDA as the first step in understanding data. This aligns with the first step of univariate forecasting procedures that is to plot data and identify the existence of the time series components (Bowerman, O’Connell & Koehler., 2005, Ord & Fildes, 2013) based on data patterns.
Pertanika J. Soc. Sci. & Hum. 24 (S): 93 – 100 (2016)
Ismail, S., Zulkifli, M., Mansor, R., Mat Yusof, M. and Ismail, M. I.
94
The existence of certain components will determine suitable forecasting techniques to be employed. The EDA approach involves arts and science techniques whereby the former is employed to extract information by investigating reasons behind those patterns of data which contradicts with classical approach that focus more on techniques and statistical summaries (such as mean, standard deviation) (Bluman, 2014).
In this study, we highlight the crucial role of EDA in electricity forecasting in Malaysia via a line chart to understand four time series components i.e. trend, seasonal, irregular and cyclical.
METHODOLOGY
The daily electricity load data for financial year 2002 to 2006 were used in this study. The financial year is from 1st September until 31st August each year. Daily data was plotted using line chart and Exploratory
Data Analysis (EDA) approach was used to obtain an in depth understanding regarding data patterns.
RESULTS AND DISCUSSION
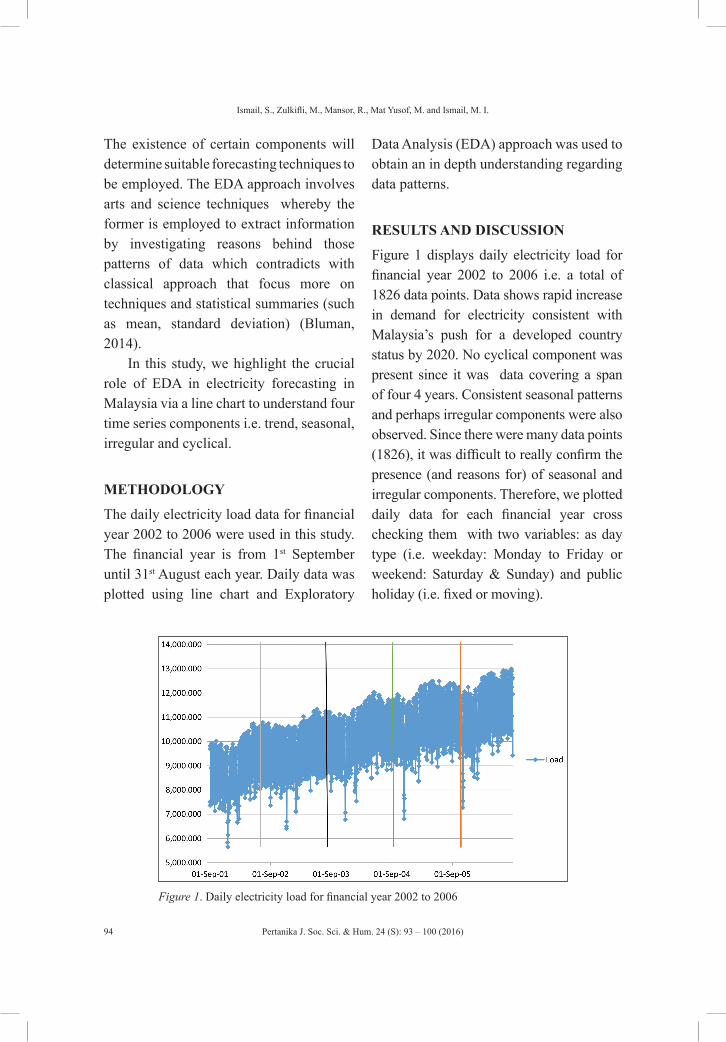
Figure 1 displays daily electricity load for financial year 2002 to 2006 i.e. a total of 1826 data points. Data shows rapid increase in demand for electricity consistent with Malaysia’s push for a developed country status by 2020. No cyclical component was present since it was data covering a span of four 4 years. Consistent seasonal patterns and perhaps irregular components were also observed. Since there were many data points (1826), it was difficult to really confirm the presence (and reasons for) of seasonal and irregular components. Therefore, we plotted daily data for each financial year cross checking them with two variables: as day type (i.e. weekday: Monday to Friday or weekend: Saturday & Sunday) and public holiday (i.e. fixed or moving).
Figure 1. Daily electricity load for financial year 2002 to 2006

Pertanika J. Soc. Sci. & Hum. 24 (S): 93 – 100 (2016)
The Role of EDA in Electricity Forecasting
95
Figure 2 to Figure 7 present daily electricity load according to days and weeks for financial year 2002 (1st Sep 2001 – 31 August 2002). From the figures, it was obvious during weekend (Saturday and Sunday) the load was lower compared with weekdays and Sunday was the lowest. Figure 3 reveals irregular low pattern for week 16 (15 – 21 Dec 2001) due to
EidulFitri celebration starting from the beginning of week 16 and followed by Christmas (Tuesday) in week 17 (22 – 28 Dec 2001). Other low irregular patterns identified were week 11 (Wednesday) due to Deepavali holiday, week 12 (Thursday) because of the King’s birthday celebration and week 18 (Tuesday) due to New Year (1st Jan 2002) celebration.
Figure2. Daily electricity load for financial year 2002 based on days and weeks (1 to 9)
Figure3. Daily electricity load for financial year 2002 based on days and weeks (10 to 18)

Pertanika J. Soc. Sci. & Hum. 24 (S): 93 – 100 (2016)
Ismail, S., Zulkifli, M., Mansor, R., Mat Yusof, M. and Ismail, M. I.
96
As for week 19 to 27 (Figure 4), there were 3 observable irregular patterns. First, the down fall of load at week 24 starting from Monday to Friday due to Chinese
New Year holidays; lower load in week 22 (Monday) due Thaipusam celebration and at week 26, Saturday’s load was lower than Sunday attributable to EidulAdha.
Figure 4. Daily electricity load of financial year 2002 based on days and weeks (19 to 27)
In Figure 5, a bit down fall on Friday week 28 related to Awal Muharam, followed by week 34 (Thursday) due to appointment of new Agong and week 35 (Wednesday, 1st May) was celebration of Labour Day. Figure 6 shows lower load at
week 39 (Sunday & Monday) and week 40 (Saturday) because of Wesak and the King’s birthday celebrations respectively. Lower load at end of week 52 (Saturday: 31st August) was due to National Day (Figure 7) celebrations.
Figure 5. Daily electricity load for financial year 2002 based on days and weeks (28 to 36)

Pertanika J. Soc. Sci. & Hum. 24 (S): 93 – 100 (2016)
The Role of EDA in Electricity Forecasting
97
Figure 6. Daily electricity load for financial year 2002 based on days and weeks (37 to 45)
Figure 7. Daily electricity load of financial year 2002 based on days and weeks (46 to 52)
Similar patterns and results were obtained for financial years 2003 to 2006. These irregular patterns in the plots were due to festive celebrations (EidulFitri, EidulAdha, Chinese New Year, Deepavali and etc) indicating they were not irregular component but moving seasonal effect or special day effect (Soares & Medeiros, 2008, Arora & Taylor, 2013) or calendar variation effects. Therefore, in this study,
only two time series components existed, trend and seasonal, but consisted of fixed and moving seasonal effects.
Table 1 displays the effect of weekend (Saturday & Sunday) and public holidays (fixed & moving) on electricity load. The weekend percent change was calculated based on the difference between weekend load (either Saturday or Sunday) and the average weekday’s value for the same

Pertanika J. Soc. Sci. & Hum. 24 (S): 93 – 100 (2016)
Ismail, S., Zulkifli, M., Mansor, R., Mat Yusof, M. and Ismail, M. I.
98
week. As for public holidays, percent change was measured using the difference between public holiday value and the previous week’s value of the same day.
It means that if a public holiday falls on Wednesday week 16, then Wednesday week 15 will be used in obtaining the percentage change.
Table 1Effect of weekend and public holidays on electricity load for financial year 2002 to 2006
Day Type / Public Holidays
2002%
2003%
2004%
2005%
2006%
Average %
Weekend Saturday -9.01 -8.15 -7.98 -8.58 -7.44 -8.23
Sunday -11.90 -11.34 -10.58 -10.15 -9.56 -10.71
Public Holidays:
Fixed
Christmas -27.88 -20.90 -18.68 -18.72 -15.91 -20.42
New Year - 22.15 -22.94 -20.13 -13.17 -20.43 -19.76
Labour Day -25.55 -26.08 -19.60 -20.49 -26.07 -23.56
Agong Birthday -19.54 -16.75 -20.13 -20.01 -11.65 -17.62
National Day -24.51 -23.75 -24.19 -23.27 -26.94 -24.53
Public Holidays:
Moving
EidulFitri -37.14 -36.66 -38.69 -38.33 -35.81 -37.33
EidulAdha -18.73 -25.84 -25.27 -24.66 -26.61 -24.22
Chinese New Year -31.22 -27.03 -27.91 -29.27 -29.02 -28.89
Deepavali -24.58 -25.61 -21.08 -19.57 -26.36 -23.44
AwalMuharam -15.85 -14.71 -13.92 -17.37 -16.65 -15.70
MaulidurRasul -15.04 -20.71 -16.58 -15.63 -16.73 -16.94
Wesak -21.18 -19.08 -20.41 -12.50 -13.07 -17.25
Thaipusam -15.03 -13.23 -14.02 -9.27 -8.13 -11.94

Pertanika J. Soc. Sci. & Hum. 24 (S): 93 – 100 (2016)
The Role of EDA in Electricity Forecasting
99
The values indicated by percentage changes (Table 1) support earlier findings (as indicated in Fig. 2 to Fig. 7) regarding the reduction of load during weekend. Sunday showed the lowest (average of 10.71%) as compared to Saturday (8.23%). Additionally, all the years revealed decreased during public holidays. On the average EidulFitri contributed to the highest decline of 37.33% followed by Chinese New Year (28.89%). Deepavali, EidulAdha and National Day shared similar percentages of 23% to 25%. Based on the patterns and percentages it is clear that weekends and public holidays (fixed and moving) affect electricity load in Malaysia.
CONCLUSION
Due to EDA, the irregular patterns identified in the line chart are not irregular component but moving seasonal component which requires different techniques of forecasting. Thus, the EDA assists in discovering the components.
ACKNOWLEDGEMENTS
The authors wish to express their gratitude to Universiti Utara Malaysia for its financial support under the LEADS Research Grant Scheme and RIMC, UUM for facilitating this research.
REFERENCESArora, S., & Taylor, J. W. (2013). Short-term
forecasting of anomalous load using rule-based triple seasonal methods. IEEE transactions on Power Systems, 28(3), 3235-3242.
Bluman, A. G., (2014). Elementary Statistics. Mc Graw Hill: New York.
Bowerman, B. L., O’Connell, R. T., & Koehler, A. B. (2005). Forecasting, Time Series, and Regression. Thomson Brooks/cole.
Ord, K., & Fildes, R. (2013). Principles of Business Forecasting. Cengage: South Western.
Soares, L. J., & Medeiros, M. C. (2008). Modeling and forecasting short-term electricity load: A comparison of methods with an application to Brazilian data. International Journal of Forecasting, 24(4), 630-644.
Tukey, J. W. (1977). Exploratory Data Analysis. Pearson.
