the role of ethnicity in choosing and leaving science in ... and strenta.pdf · the role of...
TRANSCRIPT

The Role of Ethnicity in Choosing and Leaving Science in Highly Selective InstitutionsAuthor(s): Rogers Elliott, A. Christopher Strenta, Russell Adair, Michael Matier and JannahScottReviewed work(s):Source: Research in Higher Education, Vol. 37, No. 6 (Dec., 1996), pp. 681-709Published by: SpringerStable URL: http://www.jstor.org/stable/40196227 .Accessed: 24/10/2012 11:18
Your use of the JSTOR archive indicates your acceptance of the Terms & Conditions of Use, available at .http://www.jstor.org/page/info/about/policies/terms.jsp
.JSTOR is a not-for-profit service that helps scholars, researchers, and students discover, use, and build upon a wide range ofcontent in a trusted digital archive. We use information technology and tools to increase productivity and facilitate new formsof scholarship. For more information about JSTOR, please contact [email protected].
.
Springer is collaborating with JSTOR to digitize, preserve and extend access to Research in Higher Education.
http://www.jstor.org

Research in Higher Education, Vol. 37, No. 6, 1996
THE ROLE OF ETHNICITY IN CHOOSING AND LEAVING SCIENCE IN HIGHLY SELECTIVE INSTITUTIONS
Rogers Elliott, A. Christopher Strenta, Russell Adair, Michael Matier, and Jannah Scott
This study sought to assess the role of ethnicity in both initial choice of, and persis- tence in, science majors. Standardized test scores, high school records, initial con- centration preference, college grades, and final majors of all the white, Asian, black, and Hispanic students who enrolled in 1988 at four highly selective institutions pro- vided the database. Despite relative deficits in scores on measures of preparation and developed ability, blacks entered college with a strong interest in majoring in science. Black students interested in science also suffered the highest attrition from it; Asians were lowest, with whites and Hispanics near the average attrition of 40%.
Ethnicity did not add significantly to ability and achievement variables in predicting attrition from science. The results are discussed in terms of two main issues: first, the effect of different standards of selection for the various groups on their success in science curricula; and second, the relevance of various well-known intervention
strategies to the problems of minority attrition in science in highly selective institu- tions.
The question of why much larger proportions of non-Asian minorities leave the science pipeline than do whites or Asians has long concerned all persons and organizations interested in the vitality of science and in equality of oppor- tunity to become a scientist. Science is a rewarding career for those inclined to
pursue it, and many of the world's serious problems cannot be solved without science and technology. If large pools of potential scientists are being shut out
by action of educational institutions themselves, that fact needs to be known, and the problem needs to be described and examined, so that effective amelio- rative policies might be devised.
Our first reports (Strenta et al., 1993, 1994) concerned general issues about choice of, persistence in, and attrition from science, along with the way gender
Send correspondence to: Rogers Elliott, Department of Psychology, Dartmouth College, Hanover, NH 03755.
681
0361 -0365/96/1 200-0681 $09.50/0 © 1996 Human Sciences Press, Inc.

682 ELLIOTT, STRENTA, ADAIR, MATIER, AND SCOTT
affected those issues in our population. Here we will examine these questions with respect to ethnicity.1 Our strategy and goal is as it was with gender: to describe and analyze the predictors of initial interest in science, and then the
predictors of persistence in science - that is, actually majoring in science - in terms of variables measuring intellectual achievement and developed ability.
The situation with respect to minorities differs from that for women very likely in several ways, but surely in one important respect: minorities are at least as interested in pursuing science as whites (Astin and Astin, 1993; Na- tional Science Board, 1993; White, 1992), and the attitude toward science, at least for African Americans, is very positive - more positive, other things being equal, than that of whites (Dunteman, Wisenbaker, and Taylor, 1979; see also citations in Oakes, 1990). In large unselected samples of college-bound stu-
dents, just about a fifth of the whites, blacks, and Hispanics taking the SAT or
filling out a student information form in their first college term intended to
major in science or engineering (College Board, 1988a, or any recent year; National Science Board, 1993), with whites being slightly lower in rate of inter- est than blacks or Hispanics; over a third of Asians intended to major in sci- ence. In the somewhat more selective longitudinal sample reported by Astin and Astin (1993), the rates of initial interest were higher but in similar ethnic order: Asians, 53%; whites, 27%; Hispanics (Chicanos), 36%; and blacks, 34%.
Recent accounts (Oakes, 1990; Suter, 1993; White, 1992) of race, ethnicity, and science make it clear that non-Asian minorities are relatively low on most measures of preparation and developed ability, and that these deficits begin early in their schooling careers. They are considerable just before the point of entrance to college. Both the average SAT mathematics (SATM) scores and the math and science proficiencies of twelfth-grade blacks are about a standard deviation (S.D.) behind, and those of Hispanics are about .75 S.D. behind, those of whites (Suter, 1993). Thus, black grade 12 achievement in math is about the same as, and in science a little worse than, white grade 8 achievement. And while blacks and Hispanics are a little closer to whites on scores on College Board Achievement Tests and Advanced Placement (AP) tests, that is in part because very small and selected proportions of those minority groups take such tests (White, 1992).
Partly for these reasons, not many minority students actually enter science in
higher education, and many who do drop out along the way. White (1992) and the National Science Board (1993) have reported that blacks received about 5.3% of the bachelor's degrees in science in 1989 and 1991, though they consti- tuted about 13% of the population and about 9% of the higher education enroll- ment; Hispanics, who were about 7% of the general population, and 5% of the
higher education enrollment, had 4% of the science degrees. Asians (9%) and whites (82%) together had 91% of the science baccalaureates given in 1991, with Asians obviously greatly overrepresented.
ETHNICITY IN CHOOSING AND LEAVING SCIENCE 683
The recent study by Astin and Astin (1993) illustrates the disproportionately large losses of blacks and Hispanics (in their case, Chicanos). The final pool of blacks in science was only 47% of the size of the pool of those initially intend-
ing to major in science, and of Hispanics only 37%, whereas the corresponding percentages for Asians and whites were 68% and 61%, respectively (all these
figures are overestimates of persistence rates, because there was some recruit- ment from nonscience pools into science). This result occurred even though in the original pools of those initially interested in science and engineering as
freshmen, as shown above, blacks and Hispanics had just over a third of their numbers declaring initial interest in science majors and were 7-8% more likely to do so than whites. Other large and possibly more representative samples (National Science Foundation, 1990) have found persistence rates of only 21% for minorities, compared with 43% for majority students. And Hilton, Hsia, Solorzano, and Benton (1989) reported persistence rates for the high school and
beyond database (high school seniors who had intended to go to college and
major in science or engineering and who were in college still doing or intending to do science 2 years after graduation) as 54% for Asians, 44% for whites, 36% for blacks, and 29% for Latinos; considering only those students who had actu-
ally gotten to college and remained there, the corresponding rates were 61%, 58%, 54%, and 48%. Finally, in Phillips's recent report (1991) of a large repre- sentative sample of engineering students from predominantly white schools, the
5-year graduation rates were as follows: for whites, 67%; for Hispanics, 47%; and for blacks, 36%.
Rates of persistence depend on its definition - they are lower measured in the senior than in the sophomore year of college, and lower in less selective
pools - but it appears that of students who actually begin their first year in
college and intend a science major, Asians will have the highest proportion, they will be best prepared (White, 1992), and they will persist most strongly; whites will have the lowest proportion of students interested in science, but those will be well prepared and about as highly persistent; blacks will be
strongly represented in initial interest, but they will be the least well prepared and over half will leave science; and Hispanics2 will be represented as much as, and a little better prepared than, blacks, but slightly more likely to drop out.
There is some evidence, however, indicating very substantial persistence rates among non-Asian minority students. Hilton et al. (1989), studying gifted (i.e., SATM scores of 550 or more) students interested in science, found that the
persistence of non-Asian minority students in math and science fields in (usu-
ally) the spring of their second year beyond high school was higher than that of
matched whites (61% vs. 55%). Because the black and Hispanic samples of this
study were, like our own, highly selected, we will have more to say about them
below; but the study certainly supports the view that equally developed ability among students interested in science predicts equal persistence, regardless of
684 ELLIOTT, STRENTA, ADAIR, MATIER, AND SCOTT
ethnic or racial affiliation. Finally, historically black colleges and universities
(HBCUs) have a strong record of B.S. (and, later, science Ph.D.) production, more so than more elite, predominantly white institutions (Culotta, 1992; Thurgood and Clarke, 1995), despite student bodies that are on average much less well prepared than black students in elite institutions.
This last fact makes clear that persistence is not just a matter of average preparation, but of competitive position as well: a reasonably well-prepared student at an HBCU who would be in a strong competitive position in his or her institution would be in a far less strong one at an elite institution. The context for judging equality of developed ability is at least as salient within institutions as between them. At white-majority institutions non-Asian minorities are, by virtue of race-preferential admission policies, at an often serious disadvantage with respect to validly predictive indices of talent, and if equally developed ability predicts equal persistence, unequally developed ability should predict differential persistence. For example, Ramist, Lewis, and McCamley-Jenkins (1994) have shown that for thousands of students in various racial and ethnic
categories, from dozens of predominantly white institutions of higher learning, blacks averaged nearly 100 points and Hispanics nearly 50 points lower than whites in SATM, a strong predictor of science and math performance (Astin and Astin, 1993; Ramist, Lewis, and McCamley-Jenkins, 1994; Strenta et al., 1993), and the differences were larger for more selective schools. Since the standard deviation of SATM within their institutions was 85 to 90 points (and less than that in highly selective institutions), these are substantial differences.
Not only SATM but other preadmission indicators (SATV, high school
grades, achievement tests) are significant predictors of success in science courses. Basic science courses are difficult, fast-paced, impersonal, and compet- itive (Hewitt and Seymour, 1991; Manis et al., 1989; Tobias, 1990), and the more selective the school, the more this is likely to be the case. Science is also
hierarchical, so that relative failure at the basic levels is not only discouraging but to some extent incapacitating for the next courses. We would expect, for the
foregoing reasons, that the relative deficit in preparation and ability-achieve- ment measures of the black and Hispanic students who go to very selective and
predominantly white schools will be especially damaging to their prospects in science. There have been dozens of studies showing associations between eth- nic differences in SAT scores and corresponding differences in college grades. We know of none, however, in which both the high school and college grades of different ethnic groups have been separated into science and nonscience cate-
gories for differential prediction of science-relevant outcomes. Such a level of
analysis is important, we think, to a more complete understanding of differen- tial persistence in science.
It is sometimes alleged that predominantly white institutions are difficult for blacks and Hispanics to deal with for reasons that go beyond achievement and
ETHNICITY IN CHOOSING AND LEAVING SCIENCE 685
ability. In a recent special report on minorities in science (Gibbons, 1992, p. 1194), Treisman is quoted as follows: "There is a belief that [minority] kids that are strong will make it anyway. In fact, national data show that's false. If you control for socio-economic background and class rank in high school, black kids still do less well than nonminorities. These [lower performances] are mea- sures of institutional inhospitality." The controls Treisman mentions, however, do not control for SAT total scores: matching on parental income or education
preserves from 75% to 90% of the mean black-white population difference of about 200 points on SAT (e.g., College Board, 1988a). High school grades are
moderately correlated with SAT scores (about r = .55 in the whole population, and less in selective schools; see Ramist, 1984; Ramist et al., 1994; Strenta et
al., 1993). However, SAT scores contribute more to the prediction of individual course grades, especially at selective colleges, than do high school grades (Ramist et al., 1994). In the Ramist et al. sample, blacks were only .36 S.D. lower than whites in high school grades, and Hispanics were actually slightly higher than
whites, which means that with respect to freshman grade-point average, on which those groups were .7 and .4 S.D.s lower than whites, both groups were greatly overpredicted by high school grades. (They were overpredicted by the SAT as
well, but only by about half as much.) A test of whether there is an "inhospitality" effect or any other ethnic effect
is to use a regression analysis of persistence with ethnicity as a predictor, along with high school grades and test scores - if there is no ethnicity effect, there is
nothing to explain in terms that go beyond the preadmission measures. Both Hilton et al. (1989) and Astin and Astin (1993) have done such analyses, with no reported ethnic effects, but their students were attending an enormous num- ber and variety of institutions. We wished to study institutions that were very much alike in being high in selectivity and high in the production of scientists and science practitioners. We have chosen for study four Ivy League schools that are so similar in admission practices and academic standards that they may be treated, as we do here, as one superinstitution with four campuses.
The group of students we are investigating here, especially those initially interested in science, is obviously representative of students in highly selective
private research universities, of which the present four are a part. These four alone are collectively an important producer of scientists, even though the 1,625 science majors in this group represent only 1% of the total science B.A. degrees given by U.S. institutions (National Science Board, 1993: about 165,000 de-
grees in natural sciences, math and computer science, and engineering were conferred in 1991, or about a sixth of all baccalaureates). But however highly selected these students are, and however elite their institutions, we think that
they are not very different from natural science and engineering majors at other selective colleges or public research universities. There are some 30 private universities and technical schools with average SAT totals of about 1,200 or

686 ELLIOTT, STRENTA, ADAIR, MATIER, AND SCOTT
more, and about 25 smaller colleges that are similarly selective. We believe that 8-9% of the total science degrees is a reasonable estimate of their production.
There are at least 15 great public research universities, where the culture, curricula, and standards of high-level science are similar to those that prevail in the ones we are investigating here. Though they are less selective overall than the highly selective private universities, they are closer to them in science than in other areas, because the degree of selection for developed ability in the science departments of selective public research universities is severe: smaller
proportions of students enter such institutions initially interested in science, and
persistence rates are lower (see the review in Strenta et al., 1993). But the select few who remain include many very talented students. Thus, for example, Humphreys and Freeland (1992) have shown that the SAT scores for four suc- cessive groups entering the UC Berkeley School of Engineering are very close to the average for the engineering schools or departments of the group of schools we are studying (Strenta et al., 1994). These public universities are
huge by private standards, a fact that offsets to some extent the smaller propor- tions of science concentrators in them. We assume that they give at least an- other 10-12% of the total of science degrees. Finally, we assume that these
degrees represent the best of science education of students in the high end of the ability range, so that the roughly 20% under discussion will constitute a far
larger percentage of postbaccalaureate science, engineering, and medical stu- dents.
In short, though our argument rests heavily on plausibility grounds, we would not expect the major factors affecting choice of and persistence in sci- ence to be very different at such public research universities as Washington, Michigan, Berkeley, Illinois, San Diego, Texas, UCLA, Wisconsin, Virginia, or North Carolina than they are at Rice, Stanford, Notre Dame, Duke, Chicago, Northwestern, Tufts, Georgetown, Carnegie-Mellon, Washington University, or Johns Hopkins. Chipman and Thomas (1987, p. 425), noting that high-ability students were not much studied, went on: "Yet they are the population of real interest with respect to participation in mathematics and science. It would be
particularly important to study minority students of high ability." That is what we do here.
METHOD
Subjects
In 1988 an average of about 13,000 students applied to each of the four
highly selective institutions whose data are combined here for analysis. These institutions accepted between a fifth to a quarter of them, and matriculated about half of those. The population of students under investigation was thus
highly selected by the institutions, and also highly self-selected in applying.
ETHNICITY IN CHOOSING AND LEAVING SCIENCE 687
With respect to the four ethnic groups targeted here for study, an average of
8,250 whites, averaging a total SAT of 1,268, applied to each institution; 22% were selected, yielding a group of white matriculants with an average SAT of
1,325. Similarly, an average of 735 black students applied to each institution, averaging a SAT score of 1,089; 35% of them were selected, with a resulting group of matriculants having an average SAT of 1,160. Of the 1,620 Asian
applicants per institution, with an average SAT of 1281, 23% were selected,
producing a matriculant group averaging 1,345; and of the 490 Hispanic appli- cants per institution (SAT = 1,152), 29% were selected, resulting in a ma- triculant group with a 1,219 average SAT. The matriculant groups averaged 410
points above their respective population 1987-88 SAT means, ranging from 390 for whites to 425 for blacks.
Measures
The basic data came from high school transcripts, admissions office data, and
college transcripts through June 1992. We employed the following pre- matriculation measures in many of our analyses: SAT verbal score and SAT math score (SATV and SATM); the average of the best three achievement tests
(ACH); the number of high school science and mathematics courses (NSCI); average grade earned in these courses (HSSCI); average grade in high school nonscience courses (HSNON); stated initial interest (INT) in a major (the first stated if more than one), coded 0 for nonscience and 1 for science, where science is defined as natural science and engineering. Students who were unde- cided or wrote nothing were classified as nonscience. Other prematriculation measures occasionally employed were the standard measures used by admission
departments: the high school percentile rank in class converted to a normal deviate with mean 500 and standard deviation 100 (CRS, or converted rank
score), and the Academic Index (AI), which is one-tenth the sum of (a) the
average of the two SAT scores (e.g., 670), (b) the ACH (e.g., 680), and (c) the
CRS (e.g., 690 for someone who was third in a class of 100); in the examples, the AI would be 204. Finally, we coded participation and performance in high school science courses.
College performance measures included the grade-point average for science
and mathematics courses taken during the first 2 years (SGPA), the counterpart measure for nonscience courses (NGPA), and the broad area of actual concen-
tration (MAJ, coded, like INT, as 0 or 1 for nonscience and science, respec- tively). Other measures occasionally used were the yearly and cumulative GPAs.
We were conservative in what we classified as science, not including history of science, cognitive science, psychology, environmental science, science and
ethics, biology and society, or other interdisciplinary concentrations, which
688 ELLIOTT, STRENTA, ADAIR, MATIER, AND SCOTT
were placed into social science (usually) or humanities as seemed most appro- priate. We were interested in analyzing science concentrations like those that are traditionally part of natural science divisions: hierarchical, laboratory-based disciplines with several prerequisites, usually including many mathematics courses, and usually with heavy workloads and frequent assignments.
RESULTS AND DISCUSSION
Preparation
The top panel of Table 1 shows the percentage of each group that took the indicated Advanced Preparation (AP) science course, and the average group grade for each course. The most frequently recorded course was AP Biology, closely followed by AP Chemistry; AP Physics and AP Calculus BC were
substantially less often chosen. With but three exceptions for grades and one for
percent participation, the order of grades and participation was Asian, white, Hispanic, and black. Regardless of these differences, the overall participation in advanced high school science courses was well above the national average (College Board, 1988b). Group differences on these variables, as on those of the lower panel, were highly significant, which simply means that much of the effect of ethnicity occurred prior to college matriculation. We take such differ- ences into account in examining whether there were further ethnic effects dur-
ing college. The bottom panel of Table 1 shows the values of the preadmission variables
used in various analyses. Most of the preadmission data are standard, but we have included as a variable the number of science and math courses (NSCI), and disaggregated the overall high school GPA into science (HSSCI) and non- science (HSNON) components. The standard predictors, SATM, SATV, and Achievement Test average (ACH), are shown in rows 4-6; as noted, these, along with high school record, make up the Academic Index (AI - shown in row 7), which is the chief predictor of grades used by the admission depart- ments of these schools. In this population, AI correlated r = .50 with first-year GPA, and .45 and .46, respectively, with NGPA (the average grade in courses outside the science division in the first 2 years) and SGPA (the average grade in science division courses in the first 2 years). The eighth row indicates the per- centage of each group that expressed an intention to major in science or engi- neering.
These credentials shown in the bottom panel are the ones that admissions officers look at, and they manifested extensive course work in science and math, very good high school grades, and high scores on standardized tests. As the introduction and the AP science course data suggest, the Asian students showed the greatest preparation and the most highly developed ability, espe- cially with respect to science-related scores, averaging just over a third of an

Q "<t «n «n «n O ^ <^ ^ *n m c£ *~ ^
- oS ^ d d d d
_ ^ ~ o o oo jo £ 2 |O<-j
H jj F ^ =|^5
5 o m *o ^ 5 ̂ tj-^vo oi^c ^ < vq vq <n in ^
covqvq ~- ^ "o e ia
VOVOVO<N & & u g
2«n- <cn- ; Q <^ ^. «n cn "8 "S •§ ^
_j. »n s^ c f! _e "C
8 - II - ^sSSc
2 < ^^^^ ^^^i ^ s - * «
_. <n- osvor-oo-a^e
& I ifii o. S ^: ^ ^. ^ Q ^ ^. ^ P o •= .a -
« -g ovo u o^ ^ oo r- - <^u-J?
S ^ ^ II S, t i s b 2
° <5 ^ - h ri in c« S o\rnw-Moow .SP^-SS fl8Q\ (N - < - u Q t > (S O\ J=<U«^2i 5^ fl8Q\ - u Q
vo«nvo- t > (S O\
-oyoc
! g i 1
.22 '-3 sni'i C ^ g 3 .22 '-3 _- C ^
| Jag da a ^ Jf | 8
•O-oo - Sja^^-c
M- •O-oo
1 -
.„„ Ml "
Sja^^-c
if < cn rt\q^ on r^ r- ^t;
" -o & to 'S
a> <« g c c a
I I s 1 if 8. '§ .i I 1 1 1 ^ .5 < £ ^ o '5

690 ELLIOTT, STRENTA, ADAIR, MATIER, AND SCOTT
S.D. above the general average on those. Asians and whites together constituted about 77% of the students who were initially interested (and 82% of the stu- dents who finally majored) in science, with blacks and Hispanics together mak-
ing up about 11% of those interested (and 7% of those who finally majored) in science. (The remainder was made up predominantly of foreign students, many of them Asian, and students of unknown ethnicity, many of them white.) From the point of view of the non-Asian minorities, then, their colleagues and com-
petitors in science classes were overwhelmingly whites and Asians, and we take the combined white-Asian mean as the reference for non-Asian minority disad-
vantage in preadmission and college performance variables. For blacks, that disadvantage was a third of an S.D. in number of high school
science courses taken (NSCI), and four-fifths of an S.D. in high school science
grades (HSSCI). On SATM, ACH, and AI, blacks were 1.3 to 1.5 S.D.s behind. The relative disadvantage for Hispanics was about half that for blacks on the most science-relevant variables - HSSCI, SATM, ACH, and AI. Note, as Ram- ist et al. (1994) showed (particularly at selective colleges of the sort under
study here), that high school grades evinced far smaller disadvantage for blacks
and, especially, for Hispanics, than SAT scores. Note also that nearly all of these minority disadvantages would be larger if measured against the Asian- white standard deviation.
Apart from the Asians, these differences in preparation and developed ability for science did not affect the proportion of each group having an initial intent to
major in science (row 8 of the lower panel of Table 1), with blacks and His-
panics having been a little more interested initially than whites, despite relative deficits in high school preparation, performance, and test scores. Such a result
implies an ethnic effect of the sort suggested in the literature: blacks, especially, aspire to be in science, all other measures held equal (Dunteman, Wisenbaker, and Taylor, 1979; Oakes, 1990). This implied finding is important, because intention to concentrate in science is by far the strongest predictor of actually doing so (in our group overall, the phi correlation was .55).
The implication of an ethnic effect was tested by analyzing the residuals from the multiple regression equation predicting initial interest (Science = 1; Nonscience = 0). In the predictive equation, all the preadmission variables were highly significant (p < .0001), with R2 = .20; number of high school courses in math and science (NSCI), the average grade in them (HSSCI), and SATV were by far the most powerful predictors, the last one being negative. High school nonscience grades (HSNON), SATM, and ACH were weaker pre- dictors, with the first being negative. Analysis of variance of the residual scores
by ethnic group yielded a significant ethnic effect (F(3> 3662) = 5.05, p < .002). Blacks were more likely than predicted to express an intention to major in science (mean residual, .10), and, by Bonferroni /-tests, were more likely than the other groups (whose mean residuals were .00, .00, and - .01 for Asians,
ETHNICITY IN CHOOSING AND LEAVING SCIENCE 691
Hispanics, and whites, respectively) to do so.3 The interactions of ethnicity with the preadmission variables were separately assessed by the tests for covariate-
by-treatment interactions outlined by Stevens (1992, pp. 344-355). No single covariate-by-treatment interaction was significant, nor was the lumped covari-
ate-by-treatment interaction. It does appear, once more, that blacks would be very well represented in
science if intention to be a scientist were the decisive controlling variable. The
present data on rates of initial interest in natural science and engineering agree with data cited in the introduction: Asians and whites are high and low in
interest, with blacks and Hispanics close together in the middle.
Performance
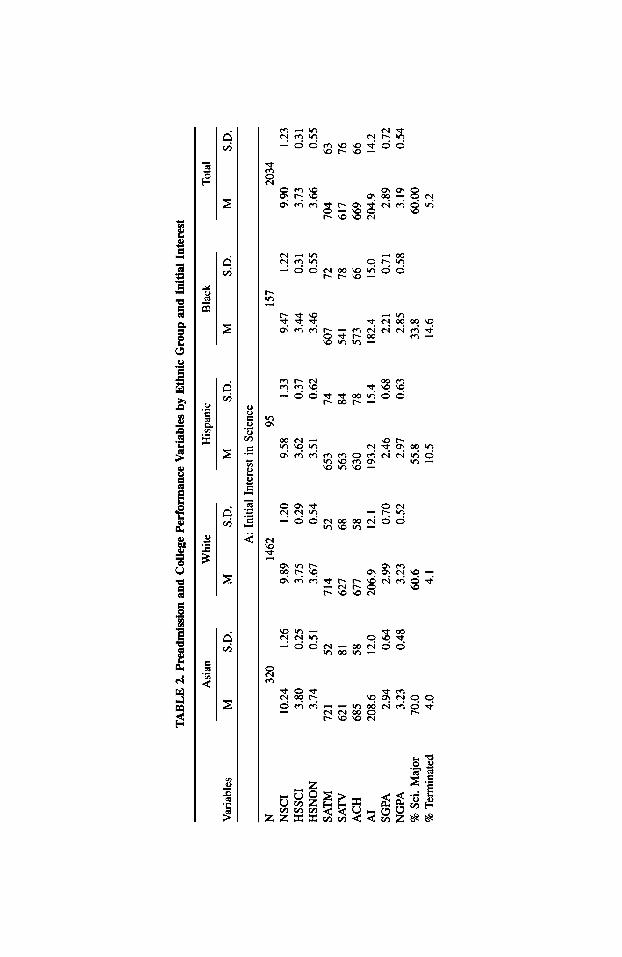
Table 2 shows data for the same variables shown in the lower panel of Table
1, now subdivided by initial interest in either science or nonscience majors; and it adds data on college performance variables of interest. These are grades in the first two undergraduate years in science courses (SGPA), courses not in science (NGPA), and the percentages of each group who finally majored in
science. The chief differences between the two major interest groups were,
understandably, on three variables very strongly predictive of interest in sci-
ence - number of and grades in high school science courses (NSCI and
HSSCI), and SATM, where the differences exceeded a half standard devia-
tion - and on ACH, where the difference amounted to a third of an S.D. Be-
cause grades in nonscience high school courses were nearly the same in each
major group, and SATV scores only moderately favored those not initially inter-
ested in science, the students initially interested in science had a modestly
though significantly higher AI, a common result (Green, 1989; White, 1992) with respect to the relatively high overall quality of academic preparation among science students.
Despite these differences, science grades in the first two college years were
slightly greater for the group not initially interested in science than for the
group that was. We analyzed this anomaly in the earlier paper (Strenta et al.,
1994): science departments offer fairly easy courses for nonscientists and do
not grade them as rigorously as courses that are part of their majors. Here,
however, we are primarily concerned with ethnic differences, in particular dif-
ferences in persistence among the students who came to their colleges intending to concentrate in science. Some can be accounted for by differences in pread- mission measures of preparation and developed ability; whatever cannot be so
accounted for may be fairly attributable to ethnicity or to variables associated
with it. Of the students initially interested in science, the relative position of blacks
and Hispanics on science-relevant variables was worse than it was among all
.2 co ~00£!g°g:£00 •a
I
I I |
I
£
15
8 c m
c
CM
8 c
'2
< <N
1
00 ( in n ON <
o c <s < ^ c
O\ » 00 ( On <
\om in «
3
m oo "
n on D -
0 <N
ON
On 00 »n oi <n o
»n ^
>n d
<N | vo ^ ^ s ^
d

m ^ »n in oq in J r .S m « -dda^vo^'dd 12 < SL 1 '°
VOt^vO^ ^ <*> £ § *g
§ Is ?»» O cm r- vo cm ph^* I O) in vq vq on cm vq in S<^.s2qn w odf^c<io(soo^(sr^o6in w ^ - ^ on
t"^ c*"J ̂ © u > <" ® "
§ i g * s s s s * £ s i -| 3 * a -dd?S!o26d a § .a S 1
2 u -2 ^ « fe m Tt cm (NO 2 2 „, c m <o <m ̂ in n oo in ^ Oij«§
„, oow^ONONOTtririri^ ^Zw-S -
oor^oooo ^ c w « - o inmm-^ « x - S e
I < < 8 §
&° ! § &
i55 S .&|J 8 f .S oo^-m moo •£_£<&£ ^ on oo^-m -^ \q - h; o oo r*: .c •§>**" 52 ** ^ o oo en m jn o vo j
<n en «n o «£§|^ 2 ** vomvo- | «5 2 u
5 m-<N <non ^S^.^S .2 - N*ddm^fnf«Sdd 2 w 2 "S 1-1 O x? i c Z (2 jj r*** -* o *3 *^r DQ o ^ * o
^ h ^ CM 1) ^ C W
oq in vq ospcMvqr^ ^^^^3 oommf^t^mcMmmoo^1 x c ,. S •*
I 1 o g, 8 1 § g "S 1
oincM moN Io^<3<u cncoin in h w ^o^ov-
CM c M c |
« ca
SnS§!£ ^qcooNvq ^Sg.S^I O\rrlW'-^00fr)W(r)fO^^t II £ Q< u u M
R 3 !S 8 - * I g I .| g •r? ^2 - .2; g O c C ^ •r? -a
- .2; ?3 c
694 ELLIOTT, STRENTA, ADAIR, MATIER, AND SCOTT
students (as was shown in Table 1), another example of the rule that the more
rigorous the selection from groups differing at the mean, the greater the relative
disadvantage of the groups with the lower means. The deficits were particularly large on the Academic Index (AI), about 1.7 and 1 S.D., respectively, below the
average of similarly interested white and Asian students. There were somewhat smaller but still substantial deficits in high school science grades (HSSCI of about 1.0 and 0.5 S.D.s, respectively) and ACH (about 1.6 and 0.7 S.D.s), so that the deficits in the Academic Index were about the same as in SATM (in these comparisons we have used as divisors for units of effect size the S.D.s for the students interested in science, since they are the ones populating the serious
introductory science classes - if the white-Asian S.D.s are used, the differences
grow by 15% to 20%).
Persistence
The expected consequences of these differences on science-relevant variables are differences in persistence, the proportion of students initially interested in science who actually majored in science, shown in the next-to-last row of the
top panel of Table 2. Such persistence varied predictably: the rate for Asians, at
70%, was twice that for blacks (34%); and rates for whites (61%) and His-
panics (55%) were intermediate. The differences shown in percent who majored in science were highly significant (x2 = 58.99, df - 3, p < .0001), as were the ethnic differences, in the same order as just given, in rate of recruiting to sci- ence majors (next to last row of the lower panel) from those students who had not expressed an initial intent to major in it (x2 = 23.37, df = 3, p < .001). The high rates for Asians and whites resemble those given in the High School and Beyond (in Hilton et al., 1989) and the Astin and Astin (1993) data dis- cussed in the introduction.
The most serious form of nonpersistence, leaving school altogether, mani- fested similar differences (final row of each panel). For students initially inter- ested in science, the ethnic termination rates were significantly different (x2 =
37.91, df = 3, p < .001), as were the differences among the highly similar termination rates among those students not initially interested in science (x2 =
21.40, df - 3, p < .001). By national standards, of course, the termination rates shown in Table 2 are very low loss rates.
Hispanics appear to have persisted more, and blacks less, than preadmission variables might have indicated. The R2 for the regression of persistence on
preadmission variables was .10, with the strongest predictors being number of, and grades in, high school science courses (NSCI and HSSCI), ACH, and (neg- atively) SATV (all p < .0001). We again analyzed the residuals from this re-
gression by ethnic group. The F-ratio (2.54, df = 3, 1631, p < .06) was non-
significant. Blacks averaged a residual score of - .08 (they persisted less than
ETHNICITY IN CHOOSING AND LEAVING SCIENCE 695
predicted); Hispanics averaged .09 (they persisted more than predicted); whites
(- .01) and Asians (.04) averaged closer to prediction.4 The interactions of pre- admission variables with ethnicity were again assessed for covariate-by-eth- nicity interactions (Stevens, 1992), which were again nonsignificant.
The marginal ethnic effect of the main analysis perhaps warrants some spec- ulation. The decrement for blacks may be to some degree the complement of the "excess" initial interest beyond what preparation and developed abilities would have predicted. The Hispanic increment over the predicted rate may have to do with the uncommonly large proportion, over 50%, of their science-inter- ested group who wanted to go into engineering, the science area where persis- tence is highest. These speculations notwithstanding, however, the main result of this analysis of ethnic group residuals is not significant: preadmission vari- ables accounted for a significant fraction of the variance of persistence deci-
sions and ethnicity did not. This lack of ethnic effects on persistence echoes
similar noneffects in the Hilton et al. (1989) and Astin and Astin (1993) regres- sion analyses.
Overview
For our subjects, the combined effects of persistence, recruiting, and termina-
tion left 45.2% of the entire incoming group of Asians, 30.1% of whites, 27.8%
of Hispanics, and 16.6% of blacks still majoring in science after 4 years. By
comparison, a recent NSF report (National Science Board, 1993) gives corre-
sponding percentages of all science degrees (among all bachelor's degrees
given in 1991) as 33.1% for Asians, 14.0% for whites, 10.3% for Hispanics, and 12.4% for blacks. Astin and Astin (1993) reported corresponding figures of
35.9%, 16.6%, 13.1%, and 16.1%. The Asians, whites, and Hispanics in our
selective sample did much better, but the blacks, though also highly selected, did not.
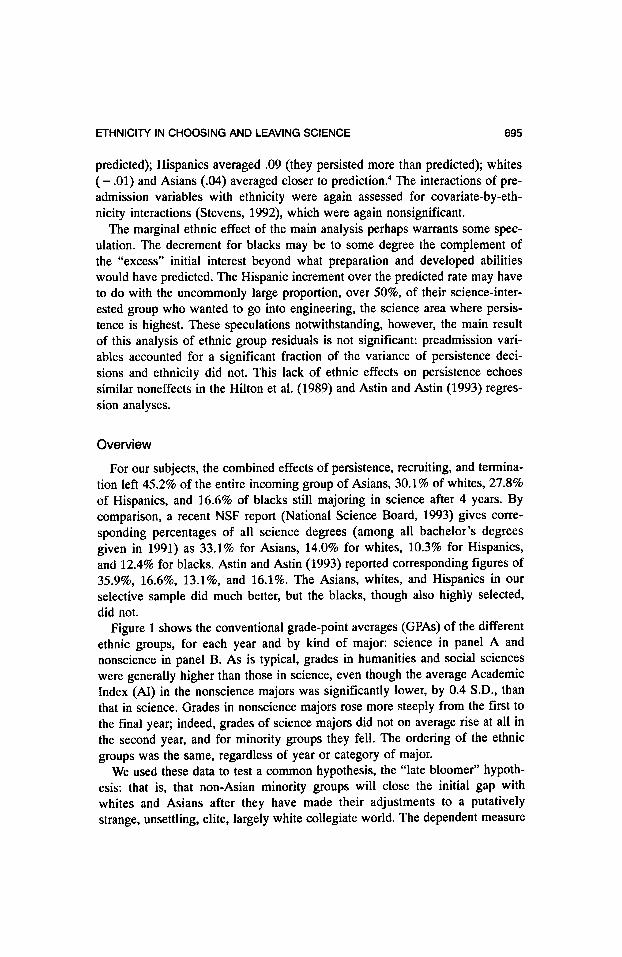
Figure 1 shows the conventional grade-point averages (GPAs) of the different
ethnic groups, for each year and by kind of major: science in panel A and
nonscience in panel B. As is typical, grades in humanities and social sciences
were generally higher than those in science, even though the average Academic
Index (AI) in the nonscience majors was significantly lower, by 0.4 S.D., than
that in science. Grades in nonscience majors rose more steeply from the first to
the final year; indeed, grades of science majors did not on average rise at all in
the second year, and for minority groups they fell. The ordering of the ethnic
groups was the same, regardless of year or category of major. We used these data to test a common hypothesis, the "late bloomer" hypoth-
esis: that is, that non-Asian minority groups will close the initial gap with
whites and Asians after they have made their adjustments to a putatively
strange, unsettling, elite, largely white collegiate world. The dependent measure
696 ELLIOTT, STRENTA, ADAIR, MATIER, AND SCOTT
FIG. 1. Average grades by year, ethnic group, and division.
Figure 1a: Science Majors Figure 1b: Non-Science Majors
3-50 " - - j* - 3.50
uj ^^^^^ ^^^^\&"'"'"
1 " - zXZZ^^' ^^^ * • - 23.00 - .-'* - - .•** y - 3 00 o ..«' •'' /' Q-
•**-... ..-•*"
2 'X ..- * -
250 - white " " White " 2-50
Hispanic - -«- - Hispanic --•-- Asian Asian ^........ Black * Black -*
12 3 4 12 3 4 YEARS YEARS
was the difference between first- and fourth-year GPA, by group and category of final major. The effect of major category was very large (F(It 4186) = 64.5, p < .0001), the effect of ethnic group nonexistent (F < 1), and the interaction of
ethnicity and major category marginal (F(3t 4186) = 2.37, p < .07). This last result arose from the very small net upward shift over years for blacks who
majored in science, and it may have something to do with the fact that their
average science grade in the first 2 years (SGPA = 2.40) was 1.3 S.D.s lower than the average SGPA of white and Asian science majors (3.16), a very diffi- cult competitive position. But the chief result here was one found in every longitudinal test of the "late bloomer" hypothesis we know of (Elliott and
Strenta, 1988; Wilson, 1980, 1981): non-Asian minorities do not catch up with whites and Asians over time. Astin and Astin (1993) reported, in fact, that the African Americans in their longitudinal sample had lost relative ground on
quantitative tests (e.g., from SATM to GREQ) over 4 years, probably because
they were less likely to have studied in quantitative areas.
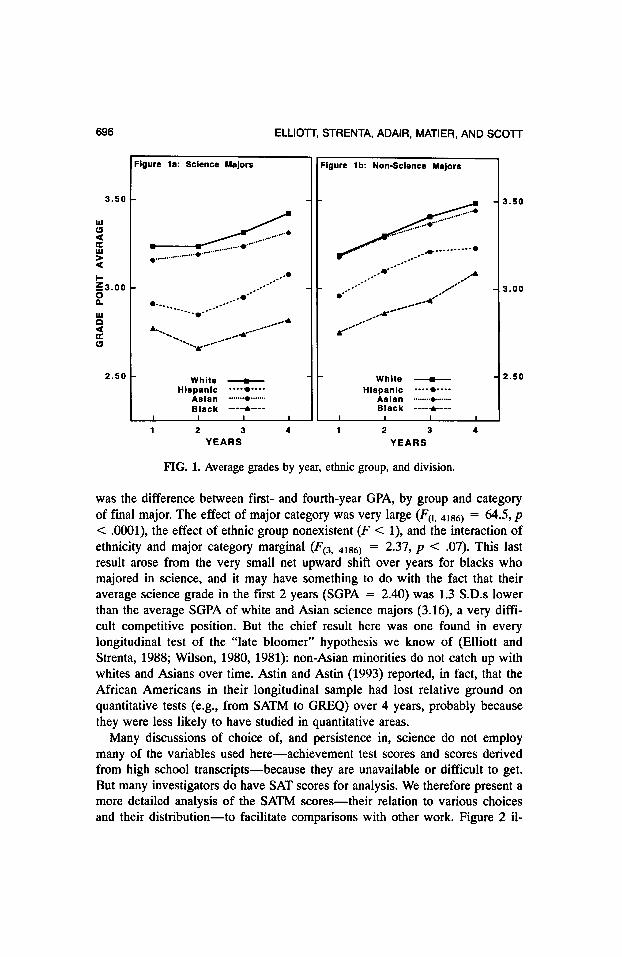
Many discussions of choice of, and persistence in, science do not employ many of the variables used here - achievement test scores and scores derived from high school transcripts - because they are unavailable or difficult to get. But many investigators do have SAT scores for analysis. We therefore present a more detailed analysis of the SATM scores - their relation to various choices and their distribution - to facilitate comparisons with other work. Figure 2 il-
ETHNICITY IN CHOOSING AND LEAVING SCIENCE 697
FIG. 2. Probability of majoring in science given a particular SATM score.
60.0 -
? - o
500 " *^^
UJ / o m
to T 5 40.0 - / o / £ /
2 30.0 - I
u. /
5 200 " /
°- Ik X io.o - rw
i i i i i i i i i
<500 520 560 600 640 680 720 760 800 SATM SCORE
lustrates the general relation between SATM scores and the rate, at any score level, of majoring in science in this sample. For scores below 640 the rate was low and moderately rising. Above 640, there was a steep increase in rate with score level until at the top two score levels over half the students majored in science. Indeed, 89% of all science majors had SATM scores of 650 or more, and 70% had scores at or above 700. The implications of these figures for the representation in science majors of Hispanics and blacks, of whom only 53% and 25%, respectively, had scores of 650 or more, are negative.
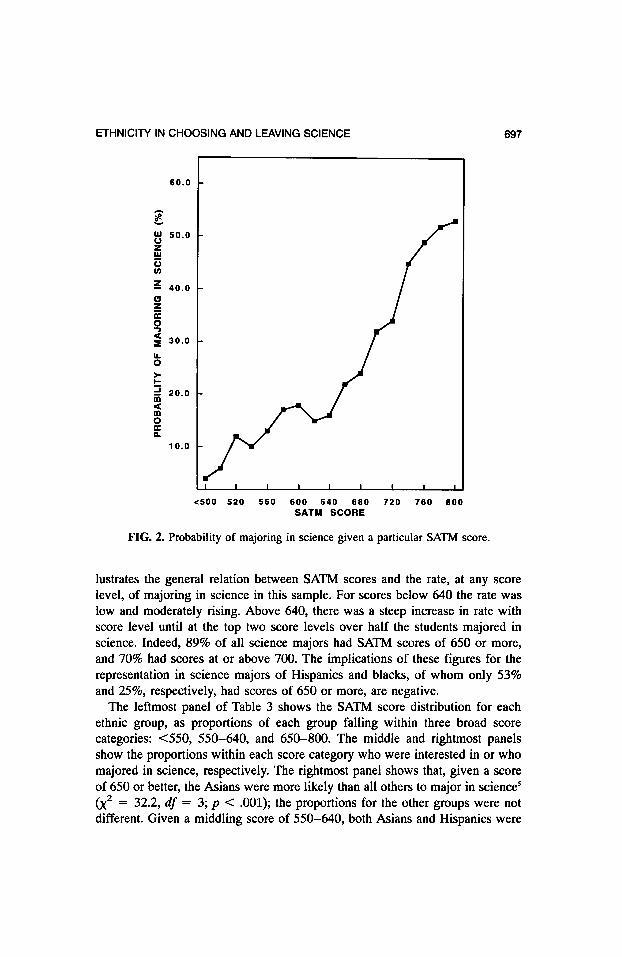
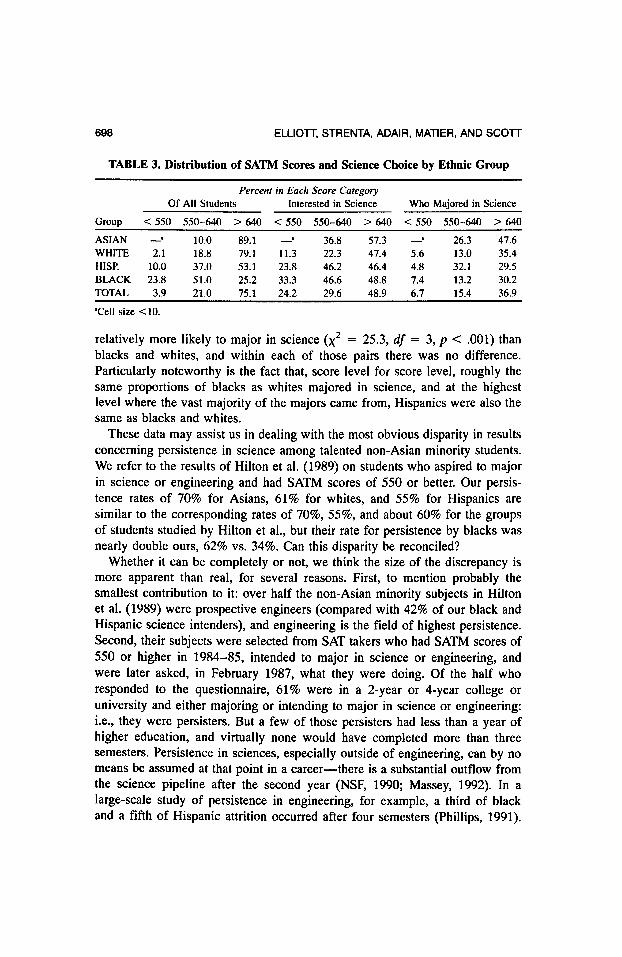
The leftmost panel of Table 3 shows the SATM score distribution for each ethnic group, as proportions of each group falling within three broad score categories: <550, 550-640, and 650-800. The middle and rightmost panels show the proportions within each score category who were interested in or who majored in science, respectively. The rightmost panel shows that, given a score of 650 or better, the Asians were more likely than all others to major in science5 (X2 = 32.2, df = 3; p < .001); the proportions for the other groups were not different. Given a middling score of 550-640, both Asians and Hispanics were
698 ELLIOTT, STRENTA, ADAIR, MATIER, AND SCOTT
TABLE 3. Distribution of SATM Scores and Science Choice by Ethnic Group
Percent in Each Score Category Of All Students Interested in Science Who Majored in Science
Group < 550 550-640 > 640 < 550 550-640 > 640 < 550 550-640 > 640
ASIAN - 10.0 89.1 - 36.8 57.3 - ' 26.3 47.6 WHITE 2.1 18.8 79.1 11.3 22.3 47.4 5.6 13.0 35.4 HISP. 10.0 37.0 53.1 23.8 46.2 46.4 4.8 32.1 29.5 BLACK 23.8 51.0 25.2 33.3 46.6 48.8 7.4 13.2 30.2 TOTAL 3.9 21.0 75.1 24.2 29.6 48.9 6.7 15.4 36.9
•Cell size <10.
relatively more likely to major in science (x2 = 25.3, df = 3, p < .001) than blacks and whites, and within each of those pairs there was no difference. Particularly noteworthy is the fact that, score level for score level, roughly the same proportions of blacks as whites majored in science, and at the highest level where the vast majority of the majors came from, Hispanics were also the same as blacks and whites.
These data may assist us in dealing with the most obvious disparity in results concerning persistence in science among talented non-Asian minority students. We refer to the results of Hilton et al. (1989) on students who aspired to major in science or engineering and had SATM scores of 550 or better. Our persis- tence rates of 70% for Asians, 61% for whites, and 55% for Hispanics are similar to the corresponding rates of 70%, 55%, and about 60% for the groups of students studied by Hilton et al., but their rate for persistence by blacks was nearly double ours, 62% vs. 34%. Can this disparity be reconciled?
Whether it can be completely or not, we think the size of the discrepancy is more apparent than real, for several reasons. First, to mention probably the smallest contribution to it: over half the non-Asian minority subjects in Hilton et al. (1989) were prospective engineers (compared with 42% of our black and Hispanic science intenders), and engineering is the field of highest persistence. Second, their subjects were selected from SAT takers who had SATM scores of 550 or higher in 1984-85, intended to major in science or engineering, and were later asked, in February 1987, what they were doing. Of the half who responded to the questionnaire, 61% were in a 2-year or 4-year college or university and either majoring or intending to major in science or engineering: i.e., they were persisters. But a few of those persisters had less than a year of higher education, and virtually none would have completed more than three semesters. Persistence in sciences, especially outside of engineering, can by no means be assumed at that point in a career - there is a substantial outflow from the science pipeline after the second year (NSF, 1990; Massey, 1992). In a large-scale study of persistence in engineering, for example, a third of black and a fifth of Hispanic attrition occurred after four semesters (Phillips, 1991).

ETHNICITY IN CHOOSING AND LEAVING SCIENCE 699
Thus, the 61% overall figure would probably have diminished in the next 2 to 3
years by some nontrivial amount.
Third, and most challenging, Hilton et al. (1989) give the figures for black
persisters in six Ivy League schools, including three of those studied here, and
they show 58% persistence, well above our 34%. Perhaps the postsophomore attrition just mentioned would bring the figures together, but so might other influences. The 93 black students in those institutions in the Hilton et al. sample were, we estimate, about a third of all the black students on those campuses interested in science, and they may well have been among the best ones, both because none were below 550 in SATM, and because, within the study sample, self- and institutional selection may have worked to that end. In our sample, nearly a quarter of the black students had SATM scores below 550, and while a third of that group were initially interested in science, only a fifth persisted. At the other end, the persistence rates of blacks in our sample with SATM scores of 650 or more was 59%, about the same as the figure of 61% for whites.
Finally, Phillips (1991), reporting on engineering students who began higher education, as most of Hilton et al. (1989) students did, in 1985, and who also had SATM scores of 550 or more, gave graduation rates as of 1990 as 62% for
blacks, 58% for Hispanics, and 83% for nonminority students (these high rates for all groups presumably result from engineering being the science under in-
vestigation). Here, in very large samples going well past the third semester, the
majority-minority persistence difference reasserts itself, even in talented groups. Whites and Asians in such selected groups will still have higher means on SAT scores and high school grades, as they did in the Hilton et al. samples, and can be expected therefore to persist more.
We believe, in short, that the Hilton et al. (1989) results are unusual: the facts that their sample was truncated at the low end, and that their students attended a wide range of institutions and were very early in their college careers when
they responded, complicate the comparison with other results, including our own.
GENERAL DISCUSSION
Though non-Asian minority students in this sample had strong interests in
pursuing science as a concentration, their persistence in that choice was below
average, by a small amount for Hispanics and a large one for blacks. It was the
preadmission variables describing developed ability - test scores and science
grades - that accounted chiefly both for initial interest and for persistence in
science, though being black clearly added something to initial interest. These results - the noneffects of ethnicity on persistence - echo those of Hilton et al.
(1989) and Astin and Astin (1993), who in predicting persistence using elabo-

700 ELLIOTT, STRENTA, ADAIR, MATIER, AND SCOTT
rate regressions with large data sets found no significant ethnic effects. Even so, the persistence of blacks was in our case very low.
Why are so many talented minority students, especially blacks, abandoning their initial interests and dropping from science when they attend highly selec- tive schools? The question has many possible answers, but we will begin with the factor we think most important, the relatively low preparation of black aspi- rants to science in these schools, hence their poor competitive position in what is a highly competitive course of study. As in most predominantly white institu-
tions, and especially the more selective of them (Ramist, Lewis, and Mc-
Camley- Jenkins, 1994), whites and Asians were at a large comparative advan-
tage by every science-relevant measure (see Table 2), and on the composite predictor, the Academic Index, they were at a 1.75 S.D. advantage.
That it is the comparative rather than the absolute status of the qualifications is clear from two strands of evidence. First, students at historically black col-
leges and universities (HBCUs) have quite low average SAT scores and high school grades (The College Handbook, e.g., College Board, 1988c, or any re- cent edition; Barron's Profiles of American Colleges, e.g., 1988, or any recent
edition), but they produce 40% of black science and engineering degrees with
only 20% of total black undergraduate enrollment (Cullotta, 1992; Phillips, 1991). For example, with SATM scores averaging about 400, half the students at Xavier University are reported to be majoring in natural science (Cullotta, 1992); with scores somewhat higher (about 450), Howard University is the top producer of black undergraduate science and engineering degrees (Suter, 1993; Cullotta, 1992). It may be that many of these students will not progress to
higher degrees in science in the same proportions that students with an Ivy League science education do; but it is a virtual certainty that no one goes on in science without either majoring in it or taking a well-prescribed premedical (or predental or preveterinarian) science program. You can't play if you don't stay, and leaving science or premed for education or history usually means leaving science or premed forever.
And enough of the graduates of HBCUs do go on in science to establish an
interesting and significant fact: of the top 21 undergraduate producers of black Ph.D.s during the period 1986-1993, 17 were HBCUs and none were among the 30 or so most selective institutions that so successfully recruit the most talented black secondary school graduates (Thurgood and Clarke, 1995, Table
5). Cullotta (1992) quoted a biology professor from one of the HBCUs: "The
way we see it, the majority schools are wasting large numbers of good students.
They have black students with admission statistics [that are] very high, tops. But these students wind up majoring in sociology or recreation or get wiped out
altogether." In fact, at our institutions, non-Asian minority students tend to shift out of science rather than to drop out altogether.
We think it certain that more of the black students in our sample would have

ETHNICITY IN CHOOSING AND LEAVING SCIENCE 701
TABLE 4. Percentage of Earned Degrees in the Natural Sciences as a Function of Terciles of the SATM Distribution in 11 Institutions
Tercile 1 Tercile 2 Tercile 3
Institution % Degrees SATM % Degrees SATM % Degrees SATM
Institution A 53.4 753 31.2 674 15.4 581 Institution B 57.3 729 29.8 656 12.9 546 Institution C 45.6 697 34.7 631 19.7 547 Institution D 53.6 697 31.4 626 15.0 534 Institution E 51.0 696 34.7 624 14.4 534 Institution F 57.3 688 24.0 601 18.8 494 Institution G 62.1 678 22.6 583 15.4 485 Institution H 49.0 663 32.4 573 18.6 492 Institution I 51.8 633 27.3 551 20.8 479 Institution! 54.9 591 33.9 514 11.2 431 Institution K 55.0 569 27.1 472 17.8 407 Medians 5^6 314 154 Note: Percentages indicate the proportion of natural science degrees awarded to students as a func- tion of terciles of the SATM score distribution. SATM numbers are mean scores for each tercile, which vary depending on the selectivity and general level of developed ability that characterizes an institution. SATM is the score on the mathematical reasoning section of the Scholastic Assessment Test.
persisted in science had they been, say, at Howard, but more of them would also have persisted at any of several majority white institutions as well, and that
brings us to the other strand of evidence for the competition argument. It ap- pears in Table 4, which we calculated from data tapes kindly supplied to us by Warren Willingham from the data sets on nine private colleges he studied for his book, Success in College (1985). We have added the data of two others. The table shows how science degrees are distributed within each institution as a function of terciles of the SATM distribution; institutions are listed in descend-
ing order of average SATM score. Thus, in institution A, over 53% of all the science degrees given were earned by students whose SATM scores were in the
top third of its SATM distribution, averaging 753. A similar percentage of all the science degrees given in institution J were earned by students in the top tercile of their SATM distribution, but the average of that tercile was much
lower, at 591. That figure lies just below the figure for black students in our
sample (Table 1), but it is also just above the score of 581 that characterizes the bottom tercile of Institution A, where only 15% of the science degrees were
awarded. The table makes clear two things about these and presumably similar
schools: first, the proportions of science degrees awarded, by terciles of the SATM distribution, are about 54%, 31%, and 15%. Second, the same SATM

702 ELLIOTT, STRENTA, ADAIR, MATIER, AND SCOTT
score may be associated with any of these terciles, depending on the selectivity and general level of developed ability that may characterize an institution. Put
concretely, a student with an SATM score of 580 who wants to be in science will be three or four times more likely to persist at institutions J and K, where he or she is competitive, than at institutions A and B, where he or she is not. Institutions F-K are only about half as likely to give science degrees - with
only about 15% of their degrees in science - as institutions A-E, which aver-
age 28% science degrees. Still, a 54% chance of getting one of the 15% of the
degrees that are in science is nearly twice as good as a 15% chance of getting one of the 28% of degrees that are in science. Our institutions are collectively like A: 51.6% of the science degrees were given to top tercile students, 31.5% to middle tercile students, and the rest, 16.9%, to the bottom tercile. The associ- ated mean SATM scores were, respectively, 753, 695, and 607, the last figure being exactly the mean score for blacks interested in science in our sample.
The gap in developed ability between the white-Asian majority and non- Asian minorities, especially blacks, especially in science, results from institu- tional policies of preferential admission from pools differing in measures of
developed ability and achievement at the point of entry into higher education, as the Method section (see Subjects) made clear. These policies subserve the several goals collectively categorized as diversity or affirmative action goals, and these institutions are firmly committed to these admissions practices. That
being the case, non-Asian minority students initially aspiring to science will continue for some time to bear a cost in lower grades and in altered academic and vocational goals. It may well be a cost such students regard as worth bear-
ing in return for benefits in quality of education, variety of points of view, richness of social experience, prestige of degree, or enhancement of career
prospects. Still, it is a serious cost that should be acknowledged, and minimized if possible.
There are several methods and combinations of methods that have been pro- posed to reduce the gap, and they can be categorized into three general groups: direct inducements to, or requirements for, greater study, more general support (mentoring, advising, group work and meetings, internships, and monetary in-
centives), and the elimination of institutional racism. It is possible that some features of some of the better-known intervention programs designed to in- crease the number of minority scientists are transportable to highly selective institutions. We discuss three of them briefly.
The Meyerhoff scholars program (Gibbons, 1992; Hrabowski and Maton, 1995; Mercer, 1994) at the University of Maryland, Baltimore County (UMBC), selects some 40 bright African American students (who must have a B average and, currently, a minimum SATM of 600, and whose average SATM is 650) from among some 600 applicants from schools throughout the state; offers tuition, fees, room and board, and a stipend; requires a 6-week program

ETHNICITY IN CHOOSING AND LEAVING SCIENCE 703
of science and math courses in the summer prior to matriculation; requires a B
average to be maintained (this motivational device could not be employed at our schools, which give only need-based aid); provides a program community, including group meetings and common housing; encourages group study and the use of tutoring; links the students with scientists and engineers as mentors; and provides summer internships in various labs.
The program appears to be very successful both in grade performance (no student had gotten a grade below C) and persistence (only three had left the
program, which began in 1989) as of the June, 1994, report in the Chronicle of Higher Education by Mercer. A recent study of its first three cohorts (Hra- bowski and Maton, 1995) found the Meyerhoff scholars getting freshman GPAs
averaging 3.5, while a historical comparison group of black science students
(most of whom who had entered UMBC between 1980 and 1989), matched on SAT and high school grades, averaged only 2.8, with the biggest part of the difference coming in science courses, particularly calculus and chemistry. There are some problems with historical comparisons, as the authors recognize. Also,
Meyerhoff students may get special instruction in calculus and chemistry in their summer program, and perhaps be graded somewhat less rigorously in summer.
Still, it is easy to believe that the Meyerhoff scholars are doing well, and it would be easy to believe that they are doing somewhat better than they would have done without the program features that exercise and reward the further
development of their talent for science. But UMBC is not an unusually selec- tive institution (the white students there average well below 650 SATM): an SATM average of 650 characterizes African Americans at such places as Har- vard and MIT, but virtually nowhere else. So the competitive advantage of the
Meyerhoffs should not be taken lightly as a contributor to their success. The
program is selective and voluntary, which makes control for motivation by ran- dom allocation nearly impossible. The hypothesis that the white-black perfor- mance gap, at least in the case of the Meyerhoff scholars, has been eliminated at UMBC simply by eliminating any gap in entering developed abilities cannot, therefore, be rejected on any evidence given so far.
One of the public technical schools vying for the enrollment of talented non- Asian minority students is Georgia Institute of Technology (Georgia Tech), which also has a well-known program, the Challenge Program, devoted to the recruitment and retention of black and Hispanic scientists and engineers. In its
present form, as described by Smothers (1994), this voluntary program begins with a 5-week summer program of the study of calculus and chemistry, with an
option to take a credit course in psychology in order to reduce the regular fall term course load. There are also provisions for mentoring and counseling, and an annual awards banquet, but before the introduction of the summer program in 1990, these had done little to improve grades and retention. A report of the
704 ELLIOTT, STRENTA, ADAIR, MATIER, AND SCOTT
program's results (Hume, 1994) shows that the black participants now get grades that are better than those of their black nonparticipating compeers, and
nearly as good as those of all Tech students (primarily whites, but including the
minority students). Retention rates for classes entering in 1990 and 1991 appear to be higher than those of all Tech students entering in those years. For the
Hispanic students, the Challenge program has made little difference, but their
grades and retention rates appear to equal or surpass the average for the institu- tion anyway. The advantage for the program participants in GPA is highest in the first term, and drops off to varying degrees thereafter, a fact that points to the summer session as perhaps the chief contributor to program success. (The somewhat longer summer session of the Meyerhoff program may have played a similar role in its effect on freshman grades, cited above. We do not know whether the advantage conferred by that program, however large it might be, also fades with time.)
Again, it is difficult to tell how much is contributed by the Challenge Pro-
gram without knowing the data on the level of developed ability brought to it
by the various groups. Because participation is voluntary, a random allocation
study is unfeasible, so motivation would remain uncontrolled; but a regression of retention or GPA on preadmission scores and grades, with program status added as a predictor, might indicate how much might be due to the program itself. It looks to us as if the largest effect in both of these programs, Meyerhoff and Challenge, may be on retention. Why might that be?
A relatively ill-prepared student has a higher than average likelihood of get- ting one or more shockingly bad grades, perhaps his or her first bad grades, in a
rigorous college science course in the first term. One response is to leave school or leave science. But if the student has just finished a 5- or 6-week summer course emphasizing the very materials offered in that first term, or
making possible a reduced first term course load, there is less chance for such
failure, and less defection from science. The improvement in grades may fade - after all, there will be no more preparatory summer programs - but the student will have gotten over the first and most difficult hurdle. In data cited by Massey (1992), 40% of black students entering college immediately after high school left in the first year, and the figure for science aspirants may well have been higher. The summer sessions of these two programs are ideally suited to
provide help when it is most needed. An important feature of them, emphasized by both sponsoring institutions, is that they demand hard work on college-level material.
How might such a program be adapted for our institutions? To require it of non-Asian minority-aspiring scientists below some level of preparation would be coercive and might be stigmatizing and unpopular. If the program were
voluntary, and were minority only, it might have some of the effect of the
Challenge or Meyerhoff programs, though such exclusiveness might be neither
ETHNICITY IN CHOOSING AND LEAVING SCIENCE 705
necessary nor wise. In our sample, the number of students initially interested in
science, and who had SATM scores less than 600, was 139 - 67 blacks, 42
whites, 23 Hispanics, and 7 Asians - or about 35 per institution. It might be feasible to offer these students such a summer session, and if voluntary and
multiracial, it would scarcely be stigmatizing. There might be equity problems near the border - What about students scoring 600 or 620 or even 640 - but even if the cutoff were raised to 650, there would be only 81 students eligible per institution (46% black and Hispanic), and many would not come. At the
higher cutoff, because of the increased numbers, there is some tension between the ideals of compensation (minorities only) and integration (all students who are eligible) when money is, as it usually is, tight, but the lower cutoff at 600
might serve most goals quite well. Similar calculations could be done by any majority white selective school.
Most of the other features of the two programs considered seem to us less useful than working on essential course material - nothing is quite so motivat-
ing to a student as succeeding at the serious business of learning. For that
reason, any method of encouraging continued hard work would be important. One of the best-known methods of encouraging hard work among minority students was devised by Treisman (1992; see Fullilove and Treisman, 1990, for an evaluation), who recruited black and Hispanic students at Berkelely and later
at Texas to special sections of calculus classes where they put in an extra 4
hours beyond what they would ordinarily have done, spent in small groups working on challenging problems, inevitably teaching and learning from each other and doing whatever remedial work might be necessary in that context.
Calculus is prerequisite to most sciences, so that its successful completion is
critical to advancement in science. Such selected students had stated an interest in a science or math career, had
been specially invited to "honors" sections, and had accepted. Clearly they were
more motivated than the average student in their comparison groups, and they also had slightly but not significantly higher SATM scores than those who
elected not to participate, with both groups having medians in the 470-540
range. That they did significantly better than their comparisons, both in grades and in persistence, is no surprise. More persuasive of the program's power is
the evidence that the nonparticipant minority controls performed the same as all
the minority students (the comparisons reported were exclusively concerned with black students) had done prior to the intervention, which means that the
program was offering a new way of enlisting the motivation and realizing the
potential of at least some substantial fraction of the black population. A later evaluation of the method (Bonsangue, 1994), done on a largely His-
panic population of beginning science students at California Polytechnic State
University, arrived at similar conclusions and added data on comparisons with white and Asian students not in the program. Again, minority students who

706 ELLIOTT, STRENTA, ADAIR, MATIER, AND SCOTT
volunteered for the program did far better in the first quarter of calculus, by close to a full grade, than nonprogram minority students with similar SAT scores and high school grades. They also scored half a grade better than the
large group of whites and Asians taking calculus, even though the latter aver-
aged 70 points higher on SATM. Some of the gains faded in the second year, when the program group got slightly lower calculus grades than the white- Asian group, but the 3-year persistence rate of the program students was far better than that of any other comparison group.
The relevance of the Treisman model to highly selective institutions is uncer- tain. Certainly the establishment of so-called "honors" sections exclusively for blacks and Hispanics would have doubtful merit - the white-Asian "nonhonors" students in calculus would average over 700 on the SATM. But making avail- able sections devoted to workshop problem solving would be undoubtedly use- ful for those of any ethnicity who volunteered for them. We do not feel that
excluding all or most white or Asian volunteers from such groups is a good idea, particularly at private institutions. Race relations are difficult enough without keeping majority students from access to curricular methods of pre- sumed efficacy. There seems every reason to encourage, though little to require, students to attend such groups; they would appear to be especially effective for students who are highly motivated and near some threshold of advanced under-
standing. In sum, we believe there are some grounds for considering that prematricula-
tion summer sessions, as described, and the provision of group problem-solving sessions associated with calculus and perhaps other science courses, would pal- liate the effects of relatively poor preparation for science. It seems especially important that these curricula be demanding and not remedial. The white-black
gap is sufficiently large and these interventions are sufficiently small in scope and unproven in effect that we would anticipate continued large differences in
persistence, though a little smaller than what now obtains. In addition, we can
repeat a suggestion we gave in our report on science and gender (Strenta et al., 1994): Let secondary schools know quite specifically what sort of preparation typical successful science majors at these institutions have had. Black and His-
panic students in our sample took far fewer AP courses in physics, chemistry, and calculus than did whites and Asians, and they should learn early in their
high school careers what they ought to be taking if they aspire to study science in highly selective institutions.
Finally, with respect to the question of institutional or any other sort of rac- ism, it was in our sample remarkable for its absence. The only significant ethnic effect in our analyses of full-sample data was in initial interest, a measure that
preceded matriculation. On a questionnaire6 answered by 33 black and 25 His- panic science majors, and 36 black and 26 Hispanic dropouts from science, only one (a defector from science alleging a lack of support for a woman of
ETHNICITY IN CHOOSING AND LEAVING SCIENCE 707
color engineer) said anything about racism. Neither these comments nor any- thing else in the questionnaire seemed to us to constitute even a small indict- ment of these institutions as being inhospitable, much less racist. The chief
problems for non-Asian minority students aspiring to science majors would
appear to be not institutional racism, but rather a relative lack of preparation and developed ability.
Acknowledgments. We especially thank John Jalowiec, Ph.D., who was the indispens- able central figure in organizing, coding, and entering the vast quantities of data that flowed into his files; and the deft constructor of the tables and figures of this report. Many others provided essential assistance on this project: Oscar Larsen (Cornell) and Mark Gloria (Brown) formatted data files at their respective institutions; Kathleen Gem- mel (Cornell) provided feedback on early versions of the questionnaire survey instru-
ment; and George Wolford and Jay Hull (Dartmouth) gave generously of their statistical advice. This work was supported by grants from the National Science Foundation (RED 93 53 821) and from the Alfred P. Sloan Foundation.
NOTES
1. "Ethnic" includes "racial" in our discussion. We omit Native Americans as a group because there were too few of them (34, with only 9 interested in science) for analysis. Also excluded were foreign students (N = 266) and "others" (N = 333).
2. The precise mix of Mexican Americans, Cubans, Puerto Ricans, and others will usually not be known. Because of the varying subgroup composition of Hispanic samples, their place in rela-
tion to other groups will vary from study to study. 3. The same result was found when a Max/?2 stepwise regression model was employed. The vari-
able "black" entered after the six preadmission variables, was significant (p < .0001), and raised the R2 from .203 to .207. Neither "Hispanic" nor "Asian" was significant.
4. Max/?2 regression analysis produced a similar result: in the nine-variable model (six preadmis- sion variables plus the three nonwhite ethnic groups), "black" was marginally significant (p <
.10) and the other groups were not. 5. This fact does not contradict the lack of an ethnic effect on persistence, since it is based on
SATM alone, with regard neither to initial interest nor to the several other predictors employed in that analysis.
6. The analysis of the questionnaire, contained in a report of these data to NSF, is available from
the authors.
REFERENCES Astin, A. W., and Astin, H. S. (1993). Undergraduate Science Education: The Impact of
Different College Environments on the Educational Pipeline in the Sciences. Los An-
geles, CA: Higher Education Research Institute, UCLA. Barron's Profiles of American Colleges, 16th ed. (1988). New York: Barren's Educa-
tional Series.
Bonsangue, M. V. (1994). An efficacy study of the calculus workshop model. Research
in Collegiate Mathematics Education 1: 1-19.
Chipman, S. F., and Thomas, V. G. (1987). The participation ot women and minorities in
mathematical, scientific, and technical fields. Review of Research in Higher Education 14: 387-430.

708 ELLIOTT, STRENTA, ADAIR, MATIER, AND SCOTT
College Board (1988a). College-Bound Seniors: 1988. New York: College Entrance Ex- amination Board.
College Board (1988b). 1988 Advanced Placement Program: National Summary Re- ports. New York: College Entrance Examination Board.
College Board (1988c). The College Handbook, 26th ed. New York: College Entrance Examination Board.
Culotta, E. (1992). Black colleges cultivate scientists. Science 258: 1216-1218. Dunteman, G. H., Wisenbaker, J., and Taylor, M. E. (1979). Race and Sex Differences in
College Science Program Participation. Research Triangle Park, NC: Research Trian- gle Institute.
Elliott, R., and Strenta, A. C. (1988). Effects of improving the reliability of the GPA on prediction generally and on comparative predictions for gender and race particularly. Journal of Educational Measurement 25: 333-347.
Fullilove, R. E., and Treisman, P. U. (1990). Mathematics achievement among African American undergraduates at the University of California, Berkeley: An evaluation of the Mathematics Workshop Program. Journal of Negro Education 59: 463-478.
Gibbons, A. (1992). Minority programs that get high marks. Science 258: 1190-1196. Green, K. C. (1989). A profile of undergraduates in the sciences. American Scientist 77:
475-480. Hewitt, N. M., and Seymour, E. (1991). Factors Contributing to High Attrition Rates
Among Science, Mathematics, and Engineering Undergraduate Majors. Report to the Alfred P. Sloan Foundation. Boulder, CO: Bureau of Sociological Research, Univer- sity of Colorado.
Hilton, T. L., Hsia, J., Solorzano, D. G., and Benton, N. L. (1989). Persistence in Science of High Ability Minority Students. Princeton, NJ: Educational Testing Service.
Hrabowski, F. A., and Maton, K. I. (1995). Enhancing the success of African-American students in the sciences: Freshman year outcomes. School Science and Mathematics 95: 19-27.
Hume, R. (1994). The Challenge Program: A Review of Student Retention and Academic Performance. Georgia Institute of Technology Office of Minority Educational Devel- opment.
Humphreys, S., and Freeland, R. (1992). Retention in Engineering: A Study of Freshman Cohorts. Berkeley, CA: University of California, Berkeley.
Manis, J. D., Thomas, N. G., Sloat, B. E, and Davis, C. (1989). An Analysis of Factors Affecting Choices of Majors in Science, Mathematics, and Engineering at the Univer- sity of Michigan. Ann Arbor, MI: Center for Continuing Education of Women, Univer- sity of Michigan.
Massey, W. (1992). A success story and decades of disappointment. Science 258: 1200- 1201.
Mercer, J. (June 22, 1994). Guiding black prodigies. Chronicle of Higher Education, pp. A22, A24.
National Science Board (1993). Science and Engineering Indicators - 1993. Washington, DC: U.S. Government Printing Office (NSB 93-1).
National Science Foundation (1990). Future Scarcities of Scientists and Engineers: Problems and Solutions. Washington, DC: National Science Foundation.
Oakes, J. (1990). Opportunities, achievement, and choice: Women and minority stu- dents in science and mathematics. Review of Research in Higher Education 16: 153- 222.
Phillips, T. R. (1991). ABET/EXXON Minority Engineering Student Achievement Profile. New York: Accreditation Board for Engineering and Technology, Inc.

ETHNICITY IN CHOOSING AND LEAVING SCIENCE 709
Ramist, L. (1984). Predictive validity of the ATP tests. In T. F. Donlon (ed.), The College Board Technical Handbook for the Scholastic Aptitude and Achievement Tests (ch. 8, pp. 141-170). New York: College Entrance Examination Board.
Ramist, L., Lewis, C, and McCamley-Jenkins, L. (1994). Student Group Differences in Predicting College Grades: Sex, Language, and Ethnic Groups. New York: College Entrance Examination Board (Report No. 93-1).
Smothers, R. (June 29, 1994). To raise the performance of minorities, a college increased its standards. New York Times, p. A21.
Stevens, J. (1992). Applied Multivariate Statistics for the Social Sciences. Hillsdale, NJ: Lawrence Erlbaum Associates.
Strenta, A. C, Elliott, R., Matier, M., Scott, J., and Adair, R. (1993). Choosing and Leaving Science in Highly Selective Institutions. Final Report to the Alfred P. Sloan Foundation. Hanover, NH: Department of Psychology, Dartmouth College.
Strenta, A. G, Elliott, R., Adair, R., Matier, M., and Scott, J. (1994). Choosing and leaving science in highly selective institutions. Research in Higher Education 35: 513-547.
Suter, L. (ed.) (1993). Indicators of Science and Mathematics Education- -1993. Wash- ington, DC: U. S. Government Printing Office (NSF 93-95).
Thurgood, D. H., and Clarke, J. E. (1995). Summary Report 1993: Doctorate Recipients from United States Universities. Washington, DC: The National Academy Press.
Tobias, S. (1990). They're Not Dumb, They're Different: Stalking the Second Tier. Tuc- son, AZ: Research Corporation.
Treisman, U. (1992). Studying students studying calculus: A look at the lives of minority mathematics students in college. College Mathematics Journal 23: 362-372.
White, P. E. (1992). Women and Minorities in Science and Engineering: An Update. Washington, DC: National Science Foundation.
Willingham, W. W. (1985). Success in College: The Role of Personal Qualities and Academic Ability. New York: College Entrance Examination Board.
Wilson, K. M. (1980). The performance of minority students beyond the freshman year: Testing a "late-bloomer" hypothesis in one state university setting. Research in Higher Education 13: 23-47.
Wilson, K. M. (1981). Analyzing the long-term performance of minority and non- minority students: A tale of two studies. Research in Higher Education 15: 351-375.
Received July 10, 1995.