the role of a public venture capital program in state economic development… · ·...
TRANSCRIPT

The Role of A Public Venture Capital Program in State Economic Development: The Case of Kansas Venture Capital, Inc. David L. Barkley, Ferdinand DiFurio, and John Leatherman1
Abstract. State-assisted venture capital programs are a popular strategy to stimulate entrepreneurship and small business development. This study estimated the number of job-years created from 1988 to 2000 by the pub-licly-assisted program Kansas Venture Capital, Inc. (KVCI). The impact of KVCI in job-years generated was measured net of hypothetical job growth under three alternative scenarios: portfolio firms failed without KVCI fundings, firms followed their national industry employment pat-terns without KVCI funding, or firms followed the employment change patterns of a comparison set of Kansas businesses. Duration model esti-mation results indicated that KVCI portfolio firms had significantly higher survival rates than comparison Kansas firms. The number of job-years created and saved credited to KVCI investments varied from 391 to 13,576 and the cost per job year created and saved ranged from $296 to $10,281 depending on assumptions of firm employment change in the absence of KVCI investments. The findings indicate that impact assess-ment results are highly sensitive to underlying assumptions.
1. Introduction
The development of entrepreneurs and small businesses is an increas-ingly popular state economic development strategy. The promotion of small businesses is viewed as promising because the small business sector is a ma-jor source of new jobs, small businesses maintain relatively strong linkages with other area businesses, and the local ownership of small businesses is an important source of community leaders and social capital. In addition, for some of the more geographically isolated and economically depressed re-
1 David L. Barkley is Professor of Applied Economics and Statistics, Clemson University, Clem-son, SC [email protected]. Ferdinand Di Furio is an Assistant Professor, Department of Eco-nomics, Finance, and Marketing, Tennessee Tech University, Cookeville, TN. John Leatherman is Professor of Agricultural Economics and Director of Office of Local Government, Kansas State University, Manhattan, KS.
JRAP (2004)34:2

84 Barkley, DiFurio, and Leatherman
gions, entrepreneurship and small business development is the only practical employment generation strategy.
Access to venture capital (VC) is recognized as a critical component of a regional small business development strategy (Sandler 2004; Bingham, Hill and White 1990; Federal Reserve Bank of Kansas City 1999; Florida and Kenney 1988; Florida and Smith 1990; Leicht and Jenkins 1994, 1996; Parker and Parker 1998; Timmons and Bygrave 1986). Yet the supply of venture capital is concentrated geographically, and venture capital investments are focused on a relatively small number of regions and industries (Freshwater, et al. 2001). A common response to this perception of a venture capital short-age is the initiation of public programs to enhance the availability of equity capital for local entrepreneurs and small businesses. A recent survey of state departments of commerce and economic development identified 144 pub-licly assisted programs in 46 states (RUPRI 2001). These 144 state-assisted venture capital programs fell into five principal program types: publicly funded and publicly managed funds (17), public funding provided for pri-vately managed funds (30), tax credits or incentives for private venture capi-tal investments (22), state-assisted angel networks (53), and state-assisted venture capital fairs (22).
The success of state-sponsored venture capital programs has been quite mixed. In some states, no sustainable businesses were started by the pro-grams, while in other states, program proponents credited the availability of public venture capital as critical to starting and/or retaining numerous businesses and jobs (Barkley et al. 2001; Daniels and Lynch 1998). Yet meas-ures of the “contribution” of a “successful” public venture capital fund gen-erally did not go beyond counting businesses and jobs and estimating taxes paid. Program assessments rarely considered the opportunity cost of the public funding used or the counterfactual of what likely would have hap-pened to the portfolio of companies in the absence of public venture capital investments.
The purpose of this study is to provide an in-depth case study of a state-supported venture capital program – Kansas Venture Capital, Inc. (KVCI). Specifically, were KVCI investments related to firm survival and growth, and if so, was the cost per job created reasonable relative to other economic development programs? The paper is organized as follows. First, we review the rationale for public venture capital funds and summarize alternative methodologies for evaluating the impacts of these programs. Second, we provide an overview of KVCI and its investments. Third, we estimate the change in job-years attributed to KVCI investments under alternative as-sumptions regarding the behavior of the portfolio firms in the absence of KVCI assistance. Fourth, we use duration analysis to determine if the length of operation of Kansas manufacturing firms is associated with funding from KVCI. Finally, the cost of creating and saving jobs is estimated for the alter-native counterfactual situations. Our findings indicate that the program’s

Public Venture Capital 85
cost of creating jobs varied significantly depending on the assumptions re-garding firm growth in the absence of KVCI funding. We conclude, how-ever, that KVCI was a cost effective program for job and business creation based on relatively conservative assumptions of the counterfactual business environment.
2. Role of Public Venture Capital in Economic De-velopment
2.1 Traditional Venture Capital Institutions In general, traditional venture capital funds are organized as limited
partnerships with a predetermined life of ten years. The limited partners provide capitalization of the funds, and the venture capitalists serve as gen-eral or managing partners. The funds invest in portfolio companies the first one to three years, targeting investments with high expected returns. Pro-ceeds from the investments are harvested in the later years of the partnership and distributed to the limited partners. The managing partners generally receive an annual management fee of 2-3 percent of fund capital and a prede-termined percentage of the profits on the fund’s investments (for example, 20 percent). The original investment in the fund by the limited partners and the remaining gains on the portfolio investments (for example, 80 percent of the profits) are returned to the limited partners. In sum, limited partnerships incorporate the structure, incentives, and checks and balances necessary to encourage a common goal (maximize the rate of return on fund investments) for the investors, managing partner, and portfolio companies. This type of traditional venture capital institution is considered a relatively efficient means of raising funds from investors and allocating these funds among in-vestment alternatives.2
2.2 Rationale for Government Intervention
Fisher (1988, 1990) proposed that the availability of venture capital is beneficial to local economic development for three principal reasons. One, small and new firms are important generators of new jobs in the national economy. These businesses generally have stronger linkages with the local economy and small business owners take an active role in community lead-ership. Two, new and small firms need “equity financing” or “patient” capi-tal rather than debt financing during the seed, start-up, and early growth phases of the business. Florida and Kenney (1988, p. 44) added that “The availability of venture capital … also has the effect of attracting entrepre-
2 An excellent overview of the venture capital industry is provided in Zider (1998).

86 Barkley, DiFurio, and Leatherman
neurs and technical personnel to such regions creating a self-reinforcing cy-cle of innovation and economic development.” Three, local private financial institutions, such as banks, are reluctant to invest in innovative small busi-nesses because of the perceived risk and lack of expertise in the operation.
Florida and Smith (1990) argued, however, that public intervention in the provision of venture capital, at least to innovative firms, was unwar-ranted. The authors (p. 358) concluded that “ ....venture capitalists are quite proficient in locating existing high-technology investment opportunities and providing capital to them.” They (p. 358) also suggested that venture capital gaps or deficiencies in an area were likely the result of the area’s inability to establish the “social structure of innovation” and generate high technology development.
Freshwater et al. (2001) proposed that the absence of venture capital in an area may reflect gaps in the supply of venture capital. That is, the traditional venture capital model (private limited partnerships) may not be appropriate for many areas of the United States because of impediments to the venture capital investment process. Specifically, Freshwater et al. argued that tradi-tional venture capital funds may not operate in rural places, smaller metro-politan areas, and geographically isolated regions because:
• Investment opportunities are in industries that are no longer in the high-
growth phase of their product life cycle. Zider and Kenney (1998, p. 133) noted that “Regardless of the talent or charisma of individual entre-preneurs, they rarely receive backing from a venture capitalist if their businesses are in low-growth market segments.”
• Investment opportunities are in firms with profit potentials below that sought by traditional venture capital funds. Small market areas do not provide the investment environment venture capitalists prefer: a large number of firms with high-projected growth rates and the like-lihood of lucrative exits.
• Too few investments are available to provide adequate deal flow. In sparsely populated areas, few firms need and qualify for venture capital investments. As a result, the cost of identifying prospective deals is higher.
• Too great a physical distance between investment opportunities. Green and McNaughton (1989, p. 212) concluded that “Geographic space impedes venture capitalists’ access to perfect information regarding investment opportunities … (thus) … venture capitalists place spa-tial constraints on their investment activity.”
• Inadequate infrastructure exists to support venture capital investment. At-torneys, accountants, bankers, and business consultants are often needed to help put a deal together and ensure the success of the in-vestment. Such a business service infrastructure is limited outside larger urban places.

Public Venture Capital 87
• Difficulty in defining a viable exit strategy. Most businesses located in rural or small market areas are unlikely to provide rapid, lucrative exits. For example, IPOs are not a viable exit strategy for many tra-ditional manufacturing enterprises and businesses found in smaller communities.
• Difficulty in attracting venture capital staff to the region. In more iso-lated regions, venture institutions may have difficulty attracting and keeping the qualified staff needed to invest successfully. Recruiting management for portfolio companies when an injection of new lead-ership is required also may be more difficult.
The two perspectives on venture capital markets (perfect information vs.
impediments and gaps) lead to different conclusions regarding the appropri-ateness of publicly assisted venture capital funds, and Markley et al. (2001) found anecdotal evidence to support both perspectives. On the one hand, publicly sponsored venture capital institutions and their portfolio companies operated successfully in locations traditionally underserved by private VC funds (e.g., Kansas). In other locations, however, public VC funds and their investments were short-lived (e.g., rural Colorado).3
2.3 Measures of Economic Impacts
Eisinger (1991, p. 71) noted that “Evaluation of economic development programs is more akin to an art than a science. Evaluative techniques are rudimentary, data is hard to come by and those that exist are suspect, and cause and effect are extremely difficult to establish.” The evaluation of ven-ture capital programs are especially problematic because public investments may be co-mingled with private monies, program benefits may not be real-ized for years, program successes generally lag the program’s failed invest-ments, and some criteria of success (an improved entrepreneurial environ-ment or an enhanced venture capital infrastructure) are very subjective. Yet in spite of these problems, policymakers need information on the impacts and effectiveness of alternative programs. The “success” of a publicly-sponsored venture capital program may be estimated in four principal ways: rate of return on state’s contribution to venture capital fund, fiscal impact on state budget, comparison of social benefits and costs attributable to program, and jobs and businesses created or retained due to the availability of the pro-gram.
Rate of Return. The ROR on fund investments is the criterion used to measure the quality of a private, limited partnership VC fund. This measure is not used often with respect to public funds because many of the public programs are “evergreen” funds with continuously active investments that 3 The interested reader may refer to Sandler (2004) for in-depth study of publicly-assisted ven-ture capital and tax incentive programs.

88 Barkley, DiFurio, and Leatherman
are difficult to evaluate before the investments are sold or IPOs occur. In addition, some argue that publicly-sponsored VC programs should have RORs less than the typical rate for private funds. The rationale is that a re-turn similar to that of private funds indicates that the public fund is making investments in companies that private funds would find attractive. As such, the public fund may be substituting for private investments, and as a result, not increasing the availability of VC in the state. On the other hand, a pub-licly-sponsored VC fund should have a ROR greater than the market interest rate or the present value of the monies returned to the state will be less than the present value of the state’s initial contribution.
Fiscal Impact. State funding for VC funds generally comes from one of three sources: borrowing, direct appropriation, or tax credits to private in-vestors. Each source of funding has a present value cost that can be com-pared to the present value of future tax revenues to determine if the VC pro-gram resulted in a gain or loss of net revenues for the state. For example, a recent analysis of the Louisiana Certified Capital Companies program (Lou-isiana Department of Economic Development 1999, p. 63) estimated that “… a projected rate of growth of 29.1% provides a 1999 estimate of the value of the tax benefits associated with the CAPCO program of $265.5 million for the time period 1988 through 2010. The tax benefits will continue to grow after 2010 while the cost of tax credits will not exceed $405.4 million.” Fiscal im-pact analysis is important for state legislators in order to appreciate the pro-gram’s impact on the state budget; however, fiscal impact analysis provides only a partial measure of the benefits and costs associated with the program.
Social Benefit-Cost Analysis. From a public policy perspective, a publicly-assisted VC program is desirable if the benefits to society exceed the costs. An accounting of the relevant benefits and costs (including opportunity costs associated with economic activity lost) is provided by a thorough cost-benefit analysis. This type of analysis is rare for public venture capital programs because it is expensive and time-consuming. Moreover, an assessment of likely social costs and benefits is most needed at the time the legislation is being written and debated. There generally is little interest in a thorough cost-benefit analysis after a program is terminated (the best time to collect data pertaining to program impacts).
Count Jobs and New Businesses. The most popular method for assessing the impact of a publicly-sponsored VC program is to simply count the busi-nesses started (or saved) and the jobs created (or saved) as a result of invest-ments by the state fund. Businesses funded and jobs created (plus the multi-plier effects) are the most frequently reported statistics since the data are relatively easy (and inexpensive) to collect, the information is readily under-stood by politicians and the public, and the data provide for comparisons with the impacts of alternative economic development strategies. For exam-ple, in Florida (Garcia 2002), “State officials argue that since the CAPCO pro-gram is intended to be an economic development tool, it is acceptable to look

Public Venture Capital 89
at the number of jobs created. They note that the results of other economic development efforts are measured in terms of job creation.”
Examples of “counting jobs” are common in studies and press reports of public and publicly assisted VC programs. Thompson and Bayer (1992, p. 20) found that “Averaging the estimated public venture capital invested and the associated employment across just these 13 programs … yields figures of $97.05 million, and $13,183 jobs, $7,362 of public venture capital investment per job.” And Waddell (1995, p. 330) reported that “… five of the six core study organizations which keep employment figures claim a net increase of 1,575 jobs, with a total investment of $12 million or $7,600 per job.” Other studies that used employment generated as a measure of program success include the Federal Reserve Bank of Kansas City (1999) overview of commu-nity development venture capital funds and reviews of Certified Capital Companies (CAPCOs) programs in Louisiana, Colorado, Florida, and Mis-souri (Louisiana Department of Economic Development 1999; Villamil and Cruz 2001; Jarrett 2000; Adams 2003; Garcia 2002; Missouri Office of State Auditor 2004; Colorado Office of Economic Development 2004). Most stud-ies of state-assisted venture capital programs were by the state agency re-sponsible for overseeing the program, or they were provided (or funded) by the venture capital program. As such, published studies of state-assisted VC programs rarely are subjected to an external review before release.
2.4 Shortcomings with Counting Jobs
The use of jobs at the target businesses as a measure of program impact is a questionable measure for all types of economic development programs because of three inherent shortcomings. One, an accounting of new jobs at the target businesses generally does not take into consideration the sources of employees for the new jobs. For example, if workers left jobs that subse-quently were not filled, then the change in jobs at the target business will overestimate the impact on state employment. Felsenstein and Persky (1999) provided an excellent discussion of the impact of job chains on the benefits associated with a new or larger business. Two, impact studies rarely netted out the business growth and employment change that likely would have oc-curred if the economic development program had not existed. Three, em-ployment change estimates attributed to a specific program generally did not net out the opportunity cost of funding the program in terms of the jobs lost by not having an alternative state program or returning the money to tax-payers to spend as they wish.
With respect to publicly-supported VC programs, however, the use of “jobs generated or saved” is an especially problematic measure of impacts to the state for two additional reasons: timing of the study and role of co-investors. The success or failure of a state-sponsored VC program should be assessed only after sufficient time passed to allow successful investments to

90 Barkley, DiFurio, and Leatherman
mature and unsuccessful investments to fail and close. It is well-documented that a significant portion of small businesses fail, yet many of these failures will not be captured if the VC program is assessed early in its existence. For example, the Jarrett (2000) study of the Missouri CAPCO pro-gram measured job growth after only two and one-half years of program existence, and then projected direct and total jobs created for the next 20 years. Two years later, Cooper (2002) reported that a number of companies included in the Jarrett projections no longer were in business.
Publicly-sponsored VC funds often co-invested in businesses with pri-vate financial institutions and individuals (angel investors). In addition, pri-vate institutions provided significant follow-on investments to companies in the public VC program’s portfolio. The availability of a state VC program may have been critical to attracting private investors, and the leveraging of public funds with private monies is advantageous for firm growth and em-ployment generation. The issue for program evaluation is what portion of the jobs created at the portfolio company should be credited to the public VC fund versus to the private investors. At one extreme, an evaluator of the Missouri CAPCO program (Jarrett 2000) credited the CAPCOs with all future employment gains at portfolio companies regardless of the relative size or timing of the private investments. As a result, the study credited over $400 million of non-CAPCO investments (and the predicted employment changes) to $40 million of CAPCO investments. At the other extreme, a State of Illinois audit argued that state loan and equity programs could take credit for only 694 of the 5,145 jobs claimed based on the proportion of capital sup-plied by the state for the businesses (Eisinger 1991).
In summary, despite the shortcomings inherent with counting jobs and businesses, this measure of economic contribution remains popular. The re-mainder of this paper is a case study of a state-sponsored VC program (Kan-sas Venture Capital, Inc.) to determine the sensitivity of economic develop-ment impact estimates to assumptions regarding co-investments, opportu-nity costs, and counterfactual situations. Kansas Venture Capital, Inc. (KVCI) was selected because the fund has been in existence sufficient time to exit deals (initial investment was in 1988), KVCI met Eisinger’s (1991) crite-rion of program self-maintenance through returns on investments, and fund managers willingly shared information on KVCI investments and portfolio companies. The availability of information on portfolio companies is critical to the evaluation of a publicly-assisted venture capital program. In states where confidentiality considerations limit data on portfolio companies, pro-gram evaluation generally is restricted to the public agency responsible for administering the program. Thus, evaluations of state-sponsored venture capital programs by third parties (not the VC or state) are rare.

Public Venture Capital 91
3. Overview of KVCI
Kansas Venture Capital, Inc. was a licensed Small Business Investment Company (SBIC) that provided equity and mezzanine capital to Kansas-based businesses. KVCI was a for-profit entity, with capitalization in 2000 of approximately $14 million. The operating mission of KVCI was “to provide equity capital, loans, and management assistance to Kansas-based small businesses having potential for significant growth and long-term equity ap-preciation.”
KVCI was started in 1976 as a subsidiary of the Kansas Development Credit Corporation (a state program). Initial capitalization of KVCI was pro-vided through the sale of common stocks to Kansas banks. Funds raised through this initial stock offering were modest (approximately $1,000,000). KVCI also sought and received licensing from the U.S. Small Business Ad-ministration (SBA) for KVCI to operate as an SBIC, though SBA funding was not used to leverage KVCI funding raised from Kansas banks.
KVCI was relatively dormant from 1977 to 1986, with most of the KVCI’s capital invested in U.S. Government and Agency securities. In the mid-1980s, however, a downturn in the Kansas economy led to the promotion of a set of economic development initiatives before the state legislature. One of these legislative initiatives (Kansas Venture Capital Risk Credit Act) author-ized the use of state funds for the capitalization of KVCI. Another legislative initiative (Kansas Venture Capital Company Act) authorized the use of in-come tax credits for private investments in certified Kansas venture capital companies.
The Kansas Bankers Association championed the concept of revitalizing KVCI and creating a public/private partnership between state banks and state government. KVCI was lifted out of the Kansas Development Credit Corporation and operated as a stand-alone SBIC. The state did not want to be actively involved in the management of the fund in order to avoid the political fallout that would occur when investment losses would precede successes.
KVCI was recapitalized at this time (1986-87) with $6.5 million raised from Kansas banks and a $5 million match from the State of Kansas. State money came from general state funds. Kansas banks were encouraged to purchase common stock in KVCI based on a percentage of the bank’s capital. Approximately 350 banks became common shareholders with voting privi-leges regarding KVCI operations. Banks purchasing common stock in KVCI were provided tax credits (25% of state privilege tax). The State of Kansas received preferred stock for their investment of $5 million. As the holder of preferred stock, the State of Kansas had first claim among stockholders on KVCI assets, but the State had no voting rights pertaining to the manage-ment of KVCI. With the recapitalization, KVCI became independent of the

92 Barkley, DiFurio, and Leatherman
Kansas Development Credit Corporation and hired a professional manage-ment team.
State money came with the requirement that investments be made only in Kansas businesses or those with a significant percentage of their opera-tions in Kansas. KVCI’s mission was two-fold: promote economic develop-ment in Kansas and make money for the banks. Originally, these two objec-tives were given about equal weight in decision making, but more recently rate of return was emphasized more heavily.
By the late 1990s, KVCI desired to become a private venture capital com-pany in order to take advantage of fund raising and investment opportuni-ties outside of Kansas. KVCI proposed that it could better serve Kansas businesses if it had additional capitalization (private investors tended to avoid venture capital funds with public monies) and the ability to better di-versify its portfolio of companies with out-of-state investments. Legislation was passed July 10, 1998 allowing KVCI to purchase the state’s preferred stock at cost ($5 million) at a rate of $1 million/year for five years. KVCI re-paid the State of Kansas $1 million in July of 1998 and the remaining $4 mil-lion in 1999. No interest was charged on the state’s investment. As of 1999, KVCI became independent of the State of Kansas. This legislation served the interests of both the state and KVCI since the state wanted to move away from partnerships with private firms for investment purposes and KVCI was ready to position itself for future growth.
KVCI investments historically focused on manufacturing firms, though a small shift in investment activity to services and more technology-oriented businesses was planned for the future. KVCI financing was available at various stages of firm operations including early stage investments, expan-sion financing, acquisitions, ownership transitions, and turnarounds or re-capitalization opportunities. The targeted size for an initial investment was $500,000 to $1,000,000. A list of KVCI’s 30 investments through 1999 is pro-vided in Table 1, and summary information on KVCI’s portfolio is presented in Table 2.4
4. Contribution of KVCI to Business Growth and Survival
4.1 Methodological Considerations Proponents of public venture capital programs offer jobs created or
saved as evidence of the value of the programs. Bartik (2002, p. 8) argued, however, that “data on program activities or local economic conditions do not tell us the impacts of policies on outcomes.” Bartik (p. 8) proposed in-stead that “we can estimate the net impact of the program by estimating what would have happened, on average, if the program did not exist.”
4 Markley, et al. (2001) provides a more in-depth description of KVCI’s history and operations.

Public Venture Capital 93
Table 1. KVCI Portfolio Companies, 1999 Portfolio Company
Year KVCI Invested
Outside Co-Investors
1999 KVCI Status
Industry
ARE 1989 Current Aircraft Equipment Airport Systems 1991 Yes Exit/Current Cleaning Equipment Biomune 1988 Yes NLEa Biological Vaccine Birch 1998 Yes Current Telecommunications Calido Chile 1995 Yes NLE Food Products Central Fiber 1992 Yes Current Cellulous Fiber Products Crossroads 1989 NLE Sports Jacket CSU 1987 Yes Current Copier Servicing Cutler 1987 Yes Current Asphalt Repaver Eagle Westb 1998 Current Cable TV System EPI 1988 Yes Exit Computer Software Guidon 1995 NLE Fiberglass Covers Hancock 1989 NLE Electric Motors Itravel 1999 Current Travel Agency Jones & Mitchell 1995 Yes Current Apparel Kan-Build 1991 Exit Modular Homes Mac Diesel 1993 NLE Engine Repair Midwesternb 1998 Current NA Organized Living 1995 Yes Current Home Storage Products Peerless 1992 Current Windows Plains Plastic 1989 Exit Extruded Plastic Plastic Packaging 1998 Yes Current Packaging Products R.V. roducts 1991 Yes Exit AC for Rec. Vehicles TABS 1988 NLE Common Carrier Taylor 1996 Yes Current Packaging Equipment Tidestone 1999 Current Computer Services Transline 1997 Yes Exit Telecommunications Tru-Circle 1989 Yes Exit/Current Aircraft Components Visual Components 1994 Yes Exit Computer Software Webco 1987 yes Exit Steel Fabrication a NLE = No Longer in Existence b Companies located outside of Kansas
For the evaluation of public programs such as state-sponsored venture
capital institutions (programs that provide assistance only to firms selected by the program), Bartik recommended an experimental design approach. Specifically, a “comparison group” would be selected that would consist of firms that were eligible for the assistance (VC investments) but that did not receive assistance from the public program. Bartik acknowledged, however, that a simple comparison of the two groups (assisted firms vs. comparisons set) likely will provide a biased measure of program impacts on jobs created and saved. For example, in the case of a state-sponsored venture capital in-stitution, it is possible that the program selected only the most promising firms to receive equity investments. Indeed, KVCI noted that it received ap-proximately 150 inquiries per year, 90% of which were unsolicited. Of these inquiries, KVCI typically funded three to four deals per year. If the KVCI funded firms were among the more “promising” Kansas businesses, then

94 Barkley, DiFurio, and Leatherman
these firms likely would have grown more rapidly in the absence of program assistance.
Table 2. Characteristics of KVCI Investments, 1999 Sector: Manufacturing 73% Service 11 Retail 10 Construction 6 Stage: Expansion/Acquisition 49% Recapitalization/Turnaround 37 Start-up/Early Stage 14 Firm Size: Start-up under $2 Million 28% $2-$5 Million 13 $5-$10 Million 42 $10+ Million 17 High Tech: No 77% Yes 23 County Size: Nonmetro 31% Follow-On Investment: Yes 58% Co-Investors: Yes 65% Required Management Change:
Yes 23%
An alternative perspective to the selection bias is that businesses seek
funding from a venture capitalist only as a last resort. That is, all possible funding sources (e.g., family, friends, financial institution) were exhausted before the firm gave up part ownership and control in exchange for venture capital. If this was the case, Kansas businesses with the greatest growth po-tential were not represented in the KVCI portfolio, and KVCI-assisted firms should be expected to have had slower employment growth than the com-parison set.
We suspect that KVCI was funding neither the “best” nor “worst” that Kansas provided in small business prospects. A selection bias was still pos-sible, however, if businesses in the KVCI portfolio were not a cross-section of Kansas firms. To help control for selection bias, the comparison set firms selected for this study consisted only of Kansas businesses that were similar in size and ownership structure to the portfolio firms. In addition, we used the U.S. industry average employment growth rate (at the four-digit SIC level) for each portfolio firm as a second counterfactual situation for em-ployment change in the absence of KVCI funding.
4.2 Jobs Created and Saved
Employment Data. Monthly employment data on KVCI’s portfolio com-panies, plus the set of comparison companies, were from Kansas ES202 data files for the years 1988 to 2000. If a company’s employment data was not available after a particular year, we interpreted this as the result of a plant closing or a name change. KVCI and local government officials were con-tacted to confirm plant closings versus new names. A company operating

Public Venture Capital 95
under multiple names was treated as one company for the purpose of this study. Four KVCI portfolio companies changed their names during the pe-riod 1988-2000. Only portfolio firms that received funding before 1996 were included to reduce the likelihood of considering companies that failed soon after “burning through” their venture capital.
Job-Years Generated. A measure of the impact of KVCI is the change in job-years in Kansas “attributed” to investments in Kansas businesses. The measure “job-years” created (one job held for one year) was selected to ac-count for differences in the timing of KVCI investments among the portfolio companies. For example, if a firm’s employment increased by 5 after a KVCI investment in 1990, then KVCI is credited with a change of 50 job years for the period 1990-2000. Alternatively, a KVCI investment in 1998 that resulted in 5 new employees would be credited with only 10 additional job-years.
Figure 1 presents graphics of the methodology used to estimate job-years created and saved relative to the two comparison groups. For the “Industry Average” comparison set, the U.S. industry (4-digit SIC) employment growth rate was applied to the KVCI portfolio firm’s employment level at the time the firm received the initial KVCI investment. In this case, the job-years cre-ated was the sum of the annual differences between the KVCI firm employ-ment and employment projected by the industry average trend lines (Figures 1a and 1b). This difference may be positive (1a) or negative (1b) depending on the post-investment growth rate of the KVCI firm relative to the industry average. The job-years “created and saved” was simply the sum of job-years since the KVCI investment, or graphically, the area under the KVCI em-ployment trend line.
Approximately five comparison firms were selected for each KVCI port-folio company. These firms were selected randomly from Kansas businesses that met the following criteria: same 4-digit industry as portfolio firm; in existence the year of the KVCI investment; a locally owned, single estab-lished firm; and the comparison firm employment was similar to the KVCI portfolio company employment the year of KVCI investment. For each comparison set firm, employment growth rates were estimated for the period starting the year of the KVCI investment. This rate was imposed on the KVCI firm’s base year employment, and as before, differences between KVCI firms and “comparison firm” job-years were calculated (Figure 1c). Next, the job-years differences were averaged over all comparison firms for each of the KVCI portfolio companies. In the case where comparison firms failed, the job-years difference after that time would be all the job-years created and saved by the KVCI firm. Of course, the opposite would be the case if the KVCI firm failed before the comparison set firm.

96 Barkley, DiFurio, and Leatherman
Figure 1. Graphics of Estimation Procedures for Job-Years Saved and Cre-ated.

Public Venture Capital 97
Table 3 provides the estimates for job-years created and saved under the alternative scenarios. Total job-years created and saved (the number typi-cally reported by a program’s supporters) were 13,576 for the 21 KVCI firms that received investments before 1996. Of these job-years, 2,122 job-years were net new job-years (job-years created above the base year employment) and 11,454 were jobs saved under the assumption that the firm would have closed in the absence of KVCI funding.
Table 3. Jobs Created and Saved: Change in Jon-Years from Base Year Em-
ployment, KVCI Portfolio Companies, 1988-2000 KVCI Firm
Year of KVCI Invest-ment
Job-Years Created and Saved
Job-Years Created Above Base Year Emp.
Job Years Created Relative to Industry Avg.
Job-Years Created Rela-tive to Kan-sas Compari-son Set
A.R.E. Industries, Inc. 1989 220 88 77 161 Airport Systems interna-tional, Inc.
1991 990 297 171 726
Biomune, Inc. 1988 525 465 454 501 Calido Chile Traders 1995 58 -7 -6 -13 Central Fiber Corp. 1992 411 -37 -41 224 Crossroads U.S.A., Inc. 1989 58 23 23 -215 CSU, L.L.C. 1987 759 288 320 288a Cutler Repaving, Inc. 1987 353 158 136 119 Electronic Processing, Inc. 1988 609 125 19 185 Guidon, Inc. 1995 213 13 15 -111 Hancock Electric Motor, Inc.
1989 237 160 168 192
Jones & Mitchell, Inc. 1995 359 229 229 239 Kan-Build, Inc. 1991 1,143 -45 -481 -205 Mac Diesel Power of Kan-sas Inc.
1993 135 95 97 108
Peerless Products, Inc. 1992 2,193 -1,055 -1,504 -453 Plains Plastics, Inc. 1989 945 560 520 691 Recreational Vehicle Products, Inc.
1991 1,605 57 -22 1,137
Tabs, Inc. 1988 417 198 193 -203 Tru-Circle Corp. 1989 1,193 401 493 424 Visual Components, Inc. 1994 183 123 121 171 Webco MFG., Inc. 1987 970 -14 144 358
TOTAL 13,576 2,122 1,126 4,324
aAccess was not available to ES202 data in SIC 7269, thus job-years created above base year em-ployment (288) were used.
Alternatively, only 1,126 job-years were created relative to the “industry
average.” That is, 996 of the 2,122 job-years created would have resulted from portfolio firms’ employment growth at a rate similar to the national industry averages. Thus, based on national growth rates, the job-years cre-

98 Barkley, DiFurio, and Leatherman
ated estimate of 2,122 exaggerated the contribution of the KVCI program. Job-years created relative to the average for the Kansas comparison set firms was 4,036. A job-years estimate in excess of 2,122 (job-years created above base year employment) indicates that many of the comparison set firms closed prior to failure of KVCI firm or end of study period. The failure of a comparison set firm resulted in higher estimates of job-years created because after the closing date for the comparison firm, the KVCI firms were credited with the job-years saved as well as net new jobs.
In summary, the use of 13,576 job-years created and saved obviously ex-aggerates the contribution of the KVCI program if we assumed that the port-folio firms were similar to either the national average or other Kansas firms. A more “reasonable” estimate of net new job-years attributed to KVCI would be between 1000 to 4000 job-years created. The upper end estimate of 4,000 job-years resulted if the KVCI investment increased the firms survival along with the employment growth rate. The next section analyzes firm survival to determine if there was a relationship between KVCI investments (plus the managerial assistance VC firms bring with their funding) and the portfolio company’s length of operation.
4.3 Duration of Business Operations
A duration model was estimated to determine if public venture capital money increased or decreased the likelihood of survival for manufacturing firms within the state of Kansas. The duration model was selected because: (1) there existed a clear “study period” from which to observe firms (1988 to 1999), (2) the event of interest, a firm’s failure, was observable, and (3) the data set included both left-censored and right- censored data. Allison (1995) defined right-censored data as the situation whereby the occurrence for some event (in this case a plant closing) was observed after the study period. If the event takes place before the study period, the situation is referred to as left-censorship.
The Weibull duration model estimated was specified as follows: LN (DUR) = B0 + B1 STARTYEAR + B2 EMP + B3 MANUF + B4 GROWTH + B5 RURAL + B6 KVCI + ei where:
STARTYEAR = Year the firm appeared in the Kansas 1988-2000 ES202 data set. STARTYEAR = 1988 for all firms founded in or before 1988.
EMP = Firm’s employment size in 1988 or the first
year of operation.

Public Venture Capital 99
MANUF = A binary variable taking the value of “1” if the firm was in manufacturing and “0” oth-erwise.
GROWTH = National employment growth rate (1988-
2000) for the industry (4-digit SIC) to which the firm was assigned.
RURAL = A binary variable with the value of “1” for
location in a nonmetro county and”0” oth-erwise.
KVCI = A binary variable with the value of “1”if the
firm received KVCI funding and “0” other-wise.
DUR = The number of years of operation during the
period 1988-2000. The dependent variable in the duration model is the log of DUR (the
number of years the firm operated during the 1988-2000 period). The estima-tion procedures account for right-censored data (the unobserved situation whereby the firm closes after 2000) through the inclusion of a censoring vari-able (STATUS) that interacts with the duration variable.5
Based on previous research of small business survival and development we anticipated that firm duration will be positively related to firm size or Emp (Schutjens and Wever 2000) and negatively related to location in a rural area (Boden 2000) and the newness of the business or STARTYEAR (Baldwin and Gorecki 1991). In addition, the industry growth rate (4-digit SIC) and industry type (MANUF) were included to control for the influences of sec-toral trends on portfolio firm duration. We hypothesized that duration will decrease for manufacturers because of structural change in the economy. Alternatively, we predicted that duration will increase with industry na-tional growth rates.6
5 The duration model was estimated using the LIFEREG procedure in SAS. “The LIFEREG pro-cedure produces estimates of parametric regression models with censored survival data using the method of maximum likelihood” (Allison 1995, p. 61). In order to accommodate right-censored data, a censoring variable entitled STATUS was created in the data set to identify those firms that ceased operations within the study period (coded as ‘1’) from those firms with cen-sored observations (coded as ‘0’). This censoring variable was used in conjunction with DUR variable in the LIFEREG procedure to identify those observations that are censored and those that are not. Allison (1995) provides an overview of survival/duration analysis. 6 For the duration model, several distributions were analyzed to determine which provided the best fit for the data. This procedure was analogous, ideologically, to performing goodness-of-fit tests. The overall goal was to determine the shape of the hazard function. The two methods

100 Barkley, DiFurio, and Leatherman
Table 4 provides the estimation results from the duration model. Only STARTYEAR and KVCI were significant determinants of establishment du-ration, yet the remaining explanatory variables (with the exception of RU-RAL) had the anticipated signs. Of principal interest for this study is the positive relationship between KVCI and firm duration. The coefficient on KVCI (.48) was interpreted as follows: firms that received a KVCI invest-ment had an expected time to closing of e.48 or 1.61 times greater than the comparison set firms. Thus, on average, a KVCI investment extended the life of a Kansas firm by approximately 60 percent.7 This finding supports the use of a counterfactual situation where KVCI is credited with job years created and, after a period of time, both job years created and saved. This situation was best represented by the counterfactual where the comparison set con-sisted of locally owned Kansas firms.
Table 4. Duration Model Coefficient Estimates
Variable Coefficient Chi-Square INTERCEPT 306.351 27.61 STARTYEAR -0.153* 27.16 EMP 0.001 0.83 KVCI 0.481* 6.47 MAN -0.077 0.51 GROWTH 0.241 1.37 RURAL 0.069 0.47 N = 116 *Indicates significance at teh 5% level.
used to determine which distribution best fit the data were likelihood ratio tests and graphical methods. Allison (1995, p. 88) stated that “in general, likelihood-ratio statistics can be used to compare nested models. A model is said to be nested with another model if the first model is a special case of the second. There were three submodels tested in this study, the Weibull distri-bution, the log-normal distribution, and the exponential distribution. The Weibull and log-normal models were all nested within the generalized gamma model (p. 89). By imposing re-strictions on the generalized gamma model, these submodels can be obtained. Allison (p. 89) presented the restrictions of the generalized gamma that were implied by its submodels:
δ = 1 then Weibull σ = 1, δ = 1 then exponential δ = 0 then log-normal
The symbol σ represents the scale parameter and δ is the shape parameter. “The likelihood ratio test for each of these models is, in essence, a test for the null hypothesis that the particular re-striction is true” (p. 89). The results of the likelihood ratio tests indicated that the Weibull model fits the data well, and that the log-normal model is possibly a good fit also. The parameter esti-mate for the shape in the Generalized Gamma model was close to 1, providing further evidence that the Weibull model is appropriate. Finally, graphical tests were consistent with the Weibull model. 7 The median survival for the non-KVCI firms (i.e., the comparison set firms) was estimated to be 10 years. This is similar to the median survival period of 8 years noted in earlier research (Fisher 2004).
Public Venture Capital 101
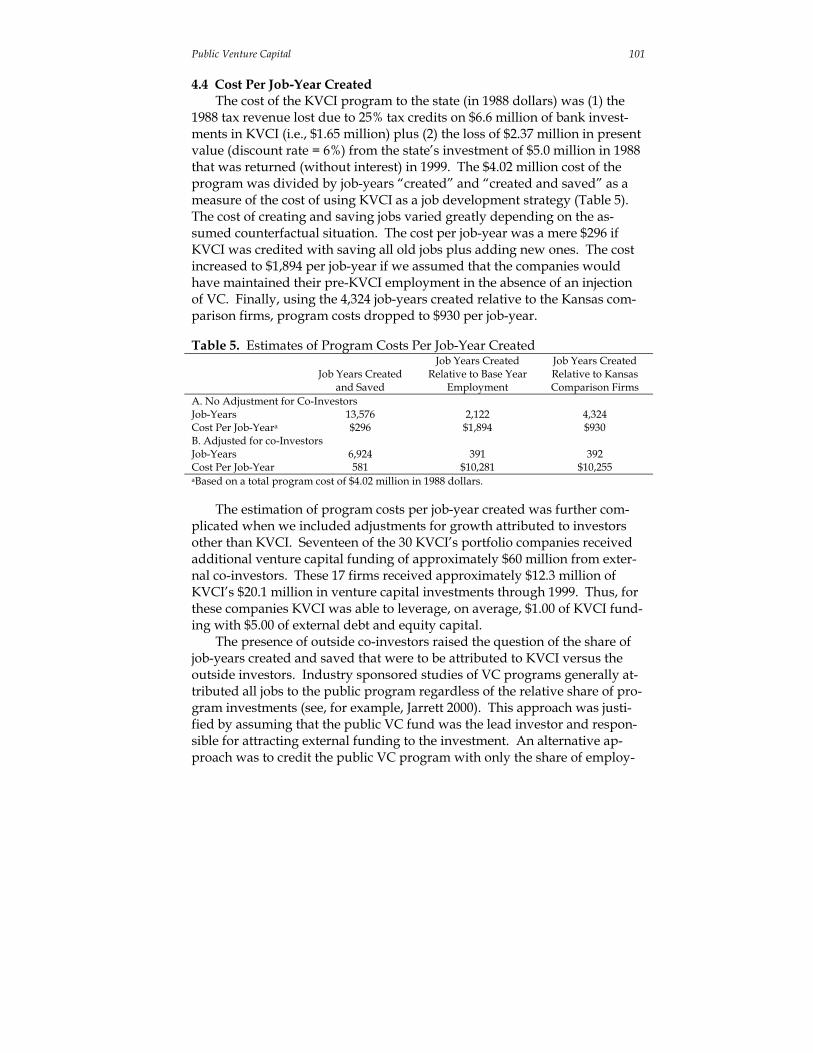
4.4 Cost Per Job-Year Created The cost of the KVCI program to the state (in 1988 dollars) was (1) the
1988 tax revenue lost due to 25% tax credits on $6.6 million of bank invest-ments in KVCI (i.e., $1.65 million) plus (2) the loss of $2.37 million in present value (discount rate = 6%) from the state’s investment of $5.0 million in 1988 that was returned (without interest) in 1999. The $4.02 million cost of the program was divided by job-years “created” and “created and saved” as a measure of the cost of using KVCI as a job development strategy (Table 5). The cost of creating and saving jobs varied greatly depending on the as-sumed counterfactual situation. The cost per job-year was a mere $296 if KVCI was credited with saving all old jobs plus adding new ones. The cost increased to $1,894 per job-year if we assumed that the companies would have maintained their pre-KVCI employment in the absence of an injection of VC. Finally, using the 4,324 job-years created relative to the Kansas com-parison firms, program costs dropped to $930 per job-year.
Table 5. Estimates of Program Costs Per Job-Year Created
Job Years Created and Saved
Job Years Created Relative to Base Year
Employment
Job Years Created Relative to Kansas Comparison Firms
A. No Adjustment for Co-Investors Job-Years 13,576 2,122 4,324 Cost Per Job-Yeara $296 $1,894 $930 B. Adjusted for co-Investors Job-Years 6,924 391 392 Cost Per Job-Year 581 $10,281 $10,255 aBased on a total program cost of $4.02 million in 1988 dollars.
The estimation of program costs per job-year created was further com-
plicated when we included adjustments for growth attributed to investors other than KVCI. Seventeen of the 30 KVCI’s portfolio companies received additional venture capital funding of approximately $60 million from exter-nal co-investors. These 17 firms received approximately $12.3 million of KVCI’s $20.1 million in venture capital investments through 1999. Thus, for these companies KVCI was able to leverage, on average, $1.00 of KVCI fund-ing with $5.00 of external debt and equity capital.
The presence of outside co-investors raised the question of the share of job-years created and saved that were to be attributed to KVCI versus the outside investors. Industry sponsored studies of VC programs generally at-tributed all jobs to the public program regardless of the relative share of pro-gram investments (see, for example, Jarrett 2000). This approach was justi-fied by assuming that the public VC fund was the lead investor and respon-sible for attracting external funding to the investment. An alternative ap-proach was to credit the public VC program with only the share of employ-

102 Barkley, DiFurio, and Leatherman
ment created or saved equal to their share of the total venture capital in-vestment.
Table 5 provides the sum of job-years created and saved attributable to KVCI’s share of investment funding. Co-investment data for each company was not available, thus, the job-year numbers were estimated by crediting KVCI with 17% ($12.3 million out of $72.3 million) of the job-years created and saved in the 17 companies where co-investment occurred. The remain-ing 13 KVCI portfolio companies were not affected by this adjustment. The accounting for co-investors significantly decreased the job-years credited to KVCI investments from 2,122 to 391 for net new job-years relative to base year employment and from 4,324 to 392 for job-years created relative to Kanas comparison set firms. 8 As a result, the cost per job-year created in-creased from $1,894 to $10,281 for net new job-years relative to base year employment and from $930 to $10,255 for new job-years relative to the com-parison set. Selection between the adjusted and non-adjusted estimates (or a value in between) will require a survey of portfolio companies to determine the role of KVCI in attracting outside co-investors.
5. Summary of the Findings
The results of this research indicate that jobs saved and created by a pub-lic venture capital program and cost per job were very sensitive to the as-sumptions regarding company growth in the absence of venture capital in-vestments. For KVCI the cost per job-year ranged from a low of $296 if all portfolio companies immediately failed without KVCI investments to a high of over $10,000 if the KVCI program was credited only with the job-years associated with their share of the investment capital used by the portfolio companies. The reader should note that the public cost per job-year created falls each year since the program costs are fixed at $4.02 million (1988 dol-lars) yet aggregate job-years created continues to increase as long as the 1996 KVCI portfolio companies survive and new Kansas companies are funded.
For discussion purposes let us credit KVCI for the job years created and saved relative to the Kansas comparison sets (as is suggested by the duration model results). Also, let us assume (1) that each job-year at a KVCI portfolio company resulted in a multiplier effect of one additional job-year in Kansas, and (2) one-half of the $60 million co-invested in KVCI firms was attributed to KVCI’s initial investments. Under this scenario, KVCI is credited with creating 5,016 job-years (4,324 x 2 x .58) at a cost of $801 per job-year.9 Is 8 The after adjustment job-years created relative to base year employment (391) and relative to comparison set employment (392) were similar because the Kansas businesses that experienced the greatest employment growth relative to their comparison firms were also the portfolio firms that received equity capital from co-investors. 9 The portfolio companies with co-investors created 4372 job-years relative to their mean com-parison set firms, thus, the remaining KVCI firms created -48 job years (4324 - 4372 = -48). Based on $5 of co-investor money for each $1 of KVCI funding, the 4372 jobs may be allocated 16.6%
Public Venture Capital 103
$800 a reasonable public cost for creating one job for one year? From a fiscal impact analysis perspective, the cost was reasonable if the average worker paid $800 more in state and local taxes than they (and their family) generated in costs to the state for public goods and services. If an $800 fiscal surplus per employee was not generated, then net social benefits must be associated with the net new jobs to justify the program.
In conclusion, KVCI is considered one of the more successful publicly-assisted venture capital programs in terms of businesses and jobs created at relatively low cost to the state. Yet even this successful program had, under relatively generous assumptions, public costs for job-years created that were not trivial. As such, publicly assisted venture capital programs should be designed to minimize costs to the state in order to increase the likelihood that the program’s fiscal benefits will exceed its costs. An alternative for re-ducing program costs to the state is to treat the state as a limited partner in the venture capital fund(s) and provide them a share (generally 70 to 80 per-cent) of the profits or earned interest from successful investments. The Oklahoma Capital Investment Board was designed to minimize the likeli-hood of a negative fiscal impact by including the state as limited partner in private venture capital funds serving the state. Finally, it would be useful if states had an estimate of the typical “budget surplus” (if any) that one net new job provides the state in terms of tax revenues gained less public expen-ditures realized. Such information would provide state policymakers with a “target” value to keep in mind when designing economic development pro-grams.
References Adams, T. 2003. The Colorado CAPCO Program: An Analysis. Colorado
Springs, Colorado, The Adams Group, Inc., December. Allison, P. D. 1995. Survival Analysis Using the SAS System, A Practical
Guide. Cary, North Carolina: SAS Institute Inc. Baldwin, J. R. & Paul K. Gorecki. 1991. Firm Entry and Exit in the Canadian
Manufacturing Sector, 1970-1982. The Canadian Journal of Economics 24(2): 300-323.
Barkley, D. L., D. M. Markley, D. Freshwater, J. S. Rubin and R. Shaffer. 2001. Establishing Nontraditional Venture Capital Institutions: Lessons Learned. Columbia, Missouri: Rural Policy Research Institute, P2001-11A, July.
(729) to KVCI and 83.4% (3643) to co-investors. If we credit KVCI with 50% of the co-investors’ share (3643/2 = 1821), then KVCI created job-years (729 - 48 + 1821) or 58% of the 4324 total job-years.

104 Barkley, DiFurio, and Leatherman
Bartik, T. J. 2002. Evaluating the Impacts of Local Economic Development Policies on Local Economic Outcomes: What Has Been Done and What is Doable? Upjohn Institute Staff Working Paper No. 63-89, W. E. Up-john Institute for Employment Research, Kalamazoo. Michigan.
Bingham, R., E. Hill, & S. White. Eds. 1990. Financing Economic Development: An Institutional Response. Newbury Park, California: Sage.
Boden, R. J., Jr. 2000. Establishment Employment Change and Survival, 1992-1996. Final Report Prepared for the Office of Advocacy of the U.S. Small Business Administration, Washington, DC.
Colorado Office of Economic Development. 2004. Office of Economic De-velopment’s Response to The Colorado CAPCO Program: An Analysis by the Adams Group, Inc. Denver, Colorado, January 21.
Cooper, C. 2002. Venturing Forth on CAPCO Program Enriches Private Pro-moters at Taxpayer Expense. Columbia Tribune. Columbia, Missouri, September 22.
Daniels, B. H. & J. Lynch. 1998. Best Practices of State Sponsored Seed and Venture Capital Programs and Alternatives to Direct State Funding. Kansas, Inc., Topeka.
Eisinger, P. 1991. The State of State Venture Capitalism. Economic Develop-ment Quarterly 5(1): 64-76.
Federal Reserve Bank of Kansas City. 1999. Equity for Rural America: From Wall Street to Main Street. Kansas City, Missouri, August.
Felsenstein, D. & J. Persky. 1999. When is a Cost Really a Benefit? Local Welfare Effects and Employment Creation in the Evaluation of Economic Development Programs. Economic Development Quarterly 13(1): 46-54.
Fisher, P. S. 2004. The Fiscal Consequences of Competition for Capital. Pa-per presented at the Raining in the Competition for Capital Conference, Humphrey Institute of Public Affairs, University of Minnesota, February.
Fisher, P. S. 1990. Product Development Corporations and State Economic Development. Economic Development Quarterly 2: 303-315.
Fisher, P. S. 1988. State Venture Capital Funds as an Economic Development Strategy. Journal of APA Spring 166-177.
Florida, R. L. & D. F. Smith, Jr. 1990. Venture Capital, Innovation, and Eco-nomic Development. Economic Development Quarterly 2: 256-269.
Florida, R. L. & M. Kenney. 1988. Venture Capital, High Technology, and Regional Development. Regional Studies 22(1): 33-48.
Freshwater, D., D. L. Barkley, D. M. Markley, J. S. Rubin & R. Shaffer. 2001. Nontraditional Venture Capital Institutions: Filling a Financial Market Gap. Columbia, Missouri: Rural Policy Research Institute, P2001-11B, July.
Garcia, B. 2002. Value of Venture Capital Program Debated. Miami Herald. September 30. (www.nasvf.org/web/allpress.nsf/pages/5398).
Green, M. B. & R. B. McNaughton. 1989. Interurban Variation in Venture Capital Investment Characteristics. Urban Studies 26: 199-213.

Public Venture Capital 105
Jarrett, J. 2000. The Certified Capital Companies Economic Development In-novation: Missouri’s Experience to Date. Prepared by IC2 Institute, the University of Texas at Austin, Austin, TX.
Leicht, K. T. & J. C. Jenkins. 1996. Direct Intervention by the Sub-National State: The Development of Public Venture Capital Programs in the American States. Social Problems 43: 306-327.
Leicht, K. T. & J. C. Jenkins. 1994. Three Strategies of State Economic Devel-opment: Entrepreneurial, Industrial Recruitment, and Deregulation Policies in the American States. Economic Development Quarterly 8: 256-269.
Louisiana Department of Economic Development. 1999. Annual Report of the Department of Economic Development on the Louisiana Capital Companies Tax Credit Program. Baton Rouge.
Markley, D. M., D. L. Barkley, J. S. Rubin, D. Freshwater & R. Shaffer. 2001. Case Studies of Nontraditional Venture Capital Institutions. Columbia, Missouri: Rural Policy Research Institute P2001-11D, July.
Missouri Office of Auditor. 2004. Review of State Tax Credits Administered by the Department of Economic Development. Report No. 2004-56, Jef-ferson City. <www.auditor.mo.gov>.
Parker, E. & P. T. Parker. 1998. Venture Capital Investment: Emerging Force in the Southeast. Economic Review. Federal Reserve Bank of At-lanta 4: 36-47.
RUPRI Rural Equity Capital Initiative Team. 2001. Directory of State-Assisted Venture Capital Programs, 2000. Columbia, Missouri: The Rural Policy Research Institute.
Sandler, D. 2004. Venture Capital and Tax Incentives: A Comparative Study of Canada and the United States. Toronto: Canadian Tax Foundation, Cana-dian Tax Paper No. 108.
Schutjens, Veronique A. J. M. & E. Wever. 2000. Determinants of New Firm Success. Papers in Regional Science 79: 135-159
Thompson, C. & K. Bayer. 1992. The Geography of a “New Entrepreneurial State” Activity: Public Venture Capital Programs in the United States. Madison: University of Wisconsin, Robert M. La Follette Institute of Public Affairs.
Timmons, J. A. & W. D. Bygrave. 1986. Venture Capital’s Role in Financing Innovation for Economic Development. Journal of Business Venturing 1: 161-176.
Villamil, J. A. & R. D. Cruz. 2001. The Economic Impact of Florida’s CAPCO Venture Capital Program. Coral Gables, Florida: The Washington Eco-nomics Group, Inc., May.
Waddell, S. J. 1995. Emerging Socio-Economic Institutions in the Venture Capital Industry. American Journal of Economics and Sociology 54(3): 323-338.

106 Barkley, DiFurio, and Leatherman
Zider, R. L. 1998. How Venture Capital Works. Harvard Business Review. No-vember-December: 131-139.