the role and importance of energy statistics - united … role and importance of energy statistics...
TRANSCRIPT

© OECD/IEA 2015 © OECD/IEA 2015
Duncan Millard
Chief Statistician
International Energy Agency
The Role and Importance of Energy Statistics

© OECD/IEA 2015
Overview
The IEA
Why collect energy stats?
Data and use
Challenges for Statistics

© OECD/IEA 2015
Founded in 1974 • Formed in wake of 1973 oil embargo with mission to promote member country energy
security – autonomous agency of the Organisation for Economic Cooperation and Development (OECD)
29 member countries
• Asia Pacific: Australia, Japan, Republic of Korea and New Zealand
• North America: United States, Canada
• Europe: Austria, Belgium, Czech Rep, Denmark, Estonia, Finland, France, Germany, Greece, Hungary, Ireland, Italy, Luxembourg, Netherlands, Norway, Poland, Portugal, Slovak Republic, Spain, Sweden, Switzerland, Turkey and United Kingdom
• European Commission also participates in the work of the IEA
• Chile and Mexico are in the process of accession to become members of the IEA
• China, Indonesia and Thailand are countries in Association
Headquarters: Paris
Decision-making body: Governing Board
• Consists of member country representatives
• Under the Governing Board, several committees are focusing on each area Secretariat:
• Staff of around 240, mainly energy experts and statisticians
The IEA

© OECD/IEA 2015
New Structure of the IEA
Executive Office
Dr. Fatih Birol (Executive Director)
Paul Simons (Deputy Executive Director)
Directorate of Global ergy Economics
Fatih Birol
Directorate of Energy Markets and Security
Keisuke Sadamori
Directorate of Sustainability, Technology and Outlooks
Kamel Bennaceur Office of Global
Energy Policy
Energy Data
Centre
Office of Legal
Counsel
Office of
Management
and
Administration
Office of
Communication
and Information
Economics and
Investment
Office
New Energy Efficiency Division in EMS Training and Capacity building now part of EDC WEO part of STO alongside ETP

© OECD/IEA 2015
IEA engagement worldwide
IEA member countries Accession countries 1 Countries in Association 2
Key Partner countries 3
Entities from countries participating in IEA Technology Collaboration Programmes (IEA TCPs) 4
1. Accession countries are OECD member countries that have begun the formal process to become a full member of the IEA. 2. Countries in Association are partner countries with which the IEA has established joint activities. 3. Key Partner countries are countries with which the IEA is seeking enhanced engagement. 4. IEA member countries (except Estonia, Luxembourg and the Slovak Republic), Accession countries, Countries in Association (except Indonesia) and key Partner countries also
participate in IEA TCPs. Entities participating in (signatories to) IEA TCPs may represent governmental or non-governmental organisations. The Economic Community of West African States (ECOWAS), the European Commission (EC), ITER, the Organisation for Petroleum Exporting Countries (OPEC), the Regional Centre for Renewable Energy and Energy Efficiency (RCREEE, located in Egypt), and the United Nations Industrial Development Organisation (UNIDO) are also participants in IEA TCPs.
This map is without prejudice to the status of sovereignty over any territory, to the delimitation of international frontiers and boundaries, and to the name of any territory, city or area.

© OECD/IEA 2015
Countries we have data for
Countries for which we
only have aggregate data
IEA’s Global energy data Collection

© OECD/IEA 2015
Head of Division Duncan Millard
Coal, Electricity and Renewables
Vladimir Kubecek
Oil and Natural Gas
Erica Robin
Balances, Prices & Taxes, Efficiency and Emissions
Roberta Quadrelli
Non-Member Countries
Celine Rouquette
Annual Coal
Short-Term Statistics (coal, electricity)
Annual Oil
Annual Electricity
Annual Renewables
Annual Natural Gas
Energy Prices and Taxes
Energy Statistics and Balances
SLT and R&D Statistics
CO2 Emissions
Energy Statistics and Balances of Non-OECD Countries
Energy Statistics and Balances of Non-OECD Countries
Energy Statistics and Balances of Non-OECD Countries
Energy Statistics and Balances of Non-OECD Countries
Desk-Top Publisher Sharon Burghgraeve
Secretariat Maike Fischmann
OECD NMC
Energy efficiency
Attachedistheannualquestionnaireforcoalwhichprovidesfor thesubmissionof1997dataandarevisionof1996datawhere applicable. Administrationsarerequestedtocompletethe questionnaireatthelatest 30October1998. However,ifdataare availableearlier,pleasedonothesitatetosendyourquestionnaire totheHeadofDivision,EnergyStatistics,CombinedEnergy Staff,whowillforwardthedatatotheUnitedNationsEconomic Commission for Europe (Geneva). In addition,Memberstatesof theEuropeanUnionarerequestedtotransmitthecompleted questionnairetoEurostat,HeadofUnit,EnergyStatistics, BâtimentJeanMonnet,PlateauduKirschberg,L-2920, Luxembourg.
COAL
ANNUAL QUESTIONNAIRE
1996 and 1997
ORGANISATION FORECONOMIC CO-OPERATIONAND DEVELOPMENT
INTERNATIONAL ENERGYAGENCY
COMMITTEE FORENERGY POLICY
UNITED NATIONSSTATISTICAL DIVISION
ECONOMIC COMMISSIONFOR EUROPE
STATISTICAL DIVISION(QUEST/OIL/1/Rev.1)
COMMISSION OF THEEUROPEANCOMMUNITIES
EUROSTAT
ENERGY UNIT
SLT
Questionnaire
Energy Statistics and Balances of Non-OECD Countries
Energy Statistics and Balances of Non-OECD Countries
Monthly Oil Statistics
Monthly Gas Statistics
Oil Emergency - Qu
Gas Trade Flow Maps
JODI

© OECD/IEA 2015
Why collect energy stats
?

© OECD/IEA 2015
Because they are needed and used
Households: mileage of cars, electricity consumption of houses, heating bills, etc.
Company managers Energy bills, consumption/tonne, use - where to save
Even truer for energy companies
Refinery: throughputs, stocks
Electricity generation: fuel input, electricity production
Analysts of the energy market: oil, gas, etc.
Traders, banks, universities, etc.
Policy makers
A few examples:
© OECD/IEA 2015
Ministers recognise need for data
“We welcome, in particular, the five key opportunities recommended to reduce GHG emissions from the energy sector. …..This must all be supported by high-quality energy statistics” IEA Ministerial Statement on Energy and Climate Change
Ministers also noted …..the vital role that high-quality energy statistics and analysis play in understanding energy markets Summary of the Chair, The Hon. Ernest J. Moniz, U.S. Secretary of Energy 2015 IEA Ministerial Meeting
Energy security Production Energy access Off grid generation Renewables RD&D Prices Investment Energy efficiency/use Monitoring Training and capacity building

© OECD/IEA 2015
Importance of energy statistics for policy makers
IEA Member countries have an obligation to hold 90 days of stocks (net imports/consumption)
Need reliable and timely data on imports, consumption and stocks
OPEC Member countries: production vs quota
Need reliable and timely data on production
EU Member countries: obligation to have a minimum share of electricity consumption coming from renewables
Need reliable data on renewables
Annex 1 countries to the Conference of Parties: respect of the engagement they have ratified when signing the Kyoto Protocol (70% to 80% of GHG come from fuel combustion)
Need reliable data on both supply and demand

© OECD/IEA 2015
The Policy Delivery Cycle – where stats can
impact
• Do we really understand what the problem or issue is?
• Are you sure there is a gap?
• What policy or evidence is already out there & what are others doing in UK/abroad?
• What outcome would indicate success
• Understand, quantify & analyse impacts, costs, risks & benefits of policy options, including on GHGs
• Address evidence gaps & identify research & analysis required
• Monitoring performance indicators and expected benefits
• Evaluation and reporting, eg GHGs
• Undertake pilots & collect good practice
• Benchmark against other schemes
• Agree and put in place delivery arrangements with delivery partners and regulators
• Put in place policy monitoring, evaluation & reporting mechanisms

© OECD/IEA 2015
Energy statistics is at the core of the IEA
Comprehensive
• Energy data for more than 140 countries
• All fuels
• Supply and demand
• Energy efficiency, Prices, RD&D
10 000 hard copies
and over 200 000
downloads a year
for Key World
Energy Statistics,
also available as an
App

© OECD/IEA 2015
Energy
Statistics
SUSTAINABLE ENERGY POLICY &
TECHNOLOGY
GLOBAL ENERGY
ECONOMICS
ENERGY MARKETS AND SECURITY
GLOBAL ENERGY POLICY
Training
IEA statistics feed all IEA studies and analyses

© OECD/IEA 2015
A few Basic Principles for Establishing an Energy Information System
Do not collect statistics for the sake of collecting statistics but collect only statistics which are needed
Establish a legal basis
Establish a proper reporting mechanism:
Questionnaires (as user friendly as possible)
A network of contacts
An agreed timetable
Establish proper dissemination mechanism
Allocate proper resources to collect/process the data
Review methodology and process, to anticipate and adapt to change in the energy situation

© OECD/IEA 2015
Some key trends in data – needed for policy making

© OECD/IEA 2015
Global picture - 2013
OthersOthers
Others
OthersOthers
0%
10%
20%
30%
40%
50%
60%
70%
80%
90%
100%
Coal* Oil Natural gas Nuclear Hydro
Other RussiaSaudi China
USA
RussiaUSACanad USA
FranceJapan
ChinaBrazilUSA
USA
China
USA Other OPEC
USA
Russian Fed.
Saudi Arabia
Qatar
USA
Russian Fed.
Rus. Fed.
France
USA
USA
Canada
China
Brazil
Country TPES
(Mtoe)
Share in world TPES
2013 1971
People’s Rep. of China 3 022 22% 7%
United States 2 188 16% 29%
India 775 6% 3%
Russian Federation 731 6% N/A
Japan 455 3% 5%
Germany 318 2% 6%
Brazil 294 2% 1%
Korea 264 2% 0.3%
France 253 2% 3%
Canada 253 2% 3%
Rest of the world 5 002 37% 44%
World 13 555 100% 100%
Production Use

© OECD/IEA 2015
Oil consumption

© OECD/IEA 2015
World electricity production by source (1971-2013)
0
2000
4000
6000
8000
10000
1971 1980 1990 2000 2013
TW
h
Coal Oil Natural Gas Nuclear Renewables Other
Source: IEA World Energy Balances, OECD/IEA, Paris, 2015.

© OECD/IEA 2015
Electricity consumption

© OECD/IEA 2015
Investing in clean energy research is key to new challenges
0
5
10
15
20
25
1974 1978 1982 1986 1990 1994 1998 2002 2006 2010 2014
Billi
on U
SD (2
014 p
rices
and
PPP)
IEA Total Public Energy RD&D Budget
Source: IEA Energy Technology Research Development and Demonstration database, 2015
IEA currently monitors public expenditure in OECD, vital for understanding Mission Innovation

© OECD/IEA 2015
Energy efficiency: the ‘first fuel’
Total Final Consumption
0
500
1 000
1 500
2 000
2 500
3 000
3 500
4 000
19…
19…
19…
19…
19…
19…
19…
19…
19…
19…
19…
19…
19…
19…
19…
19…
19…
19…
19…
19…
19…
19…
19…
19…
19…
19…
19…
20…
20…
20…
20…
20…
20…
20…
20…
20…
20…
20…
20…
Mto
e
EnergyefficiencysavingsOil
Gas
Coal
Electricity
Other
TFC
Total Final Consumption
Hypothetical energy use had there been no energy efficiency
improvements
TFC and savings within IEA countries (IEA-11*) from EE investments since 1973
*IEA-11: Australia, Denmark, Finland, France, Germany, Italy, Japan, Netherlands, Sweden, United Kingdom, United States
Source: IEA Energy Efficiency Market Report, 2014.

© OECD/IEA 2015
GHG emissions by source
CO₂ - Electricity Generation
CO₂ - Other Fuel Combustion
CO₂ - Non-Fuel Combustion
CH₄
N₂O HFCs, PFCs, SF₆
Non-OECD
CO₂ - Electricity Generation
CO₂ - Other Fuel Combustion
CO₂ - Non-Fuel Combustion
CH₄
N₂O HFCs, PFCs, SF₆
OECD
Source: Data for 2010. IEA estimates for CO2 emissions from fuel combustion data, EDGAR 4.3/4.2 FT2010 for all other sources.
Energy is at the core of climate change

© OECD/IEA 2015
0
2
4
6
8
10
12
14
16
18
20
1971 1980 1990 2000 2013
bill
ion t
onnes o
f C
O2
OECD Non-OECD
Total CO2 emissions from fuel combustion
Source: IEA CO2 Emissions from Fuel Combustion, OECD/IEA, Paris, 2015.
Global CO2 emissions
Energy data: essential to understand climate change and to meet the challenge it creates

© OECD/IEA 2015
0
1000
2000
3000
4000
5000
6000
7000
8000
9000
1971 1980 1990 2000 2014p
Mill
ion t
onnes o
f oil
equiv
ale
nt
(Mto
e)
OECD Non-OECD
Total Primary Energy Supply
Source: IEA World Energy Balances, OECD/IEA, Paris, 2015.
Emissions driven by energy use

© OECD/IEA 2015
Electricity production by fuel (2013)
Coal 32.5%
Oil 3.0%
Natural Gas
24.3%
Nuclear 18.1%
Hydro 13.6%
Other¹5.7%
Biofuels and
Wastes 2.9%
Coal 48.6%Oil
5.6%
Natural Gas
19.5%
Nuclear 4.1%
Hydro 19.1%
Other 2.0%
Biofuels and
Wastes1.2%
OECD Non - OECD
Source: IEA World Energy Balances, OECD/IEA, Paris, 2015.
1. Other includes geothermal, tide, wave, ocean, chemical heat and other non-specified (e.g. fuel cells) sources of electricity production.
The importance of electricity generation

© OECD/IEA 2015
ISSUES WITH ENERGY STATISTICS

© OECD/IEA 2015
• Liberalisation of the market: From one company to hundreds
• Confidentiality (liberalisation, “political”)
• More work passed to statistics offices:
Renewables (remote information)
Energy efficiency (including socio-economic data)
Environment (estimation of GHG emissions, ….)
Policy monitoring
• Resources do not follow work load: Statistics still have a low profile, budget cuts
• Fast turnover in staff: lack of experience, continuity
Problems encountered in energy statistics

© OECD/IEA 2015
How the IEA helps
Technical Assistance:
Barriers assessments
Data processing missions
Guidance documents
Manuals
Continuous data quality
improvement
Training and capacity building:
Regular bi-annual
Missions and hosting
Collaboration with other programmes/organisations
Data collection, processing, dissemination and use:
Maintaining country contacts
Dialogue with analysts and users
Expanding data coverage and reach
Promoting use of stats in policy
Score cards

© OECD/IEA 2015
The Manual is now available in 10 languages and widely used all around the world

© OECD/IEA 2015

© OECD/IEA 2015
Energy Use/Efficiency
Table of contents Introduction - Why a manual? What are energy efficiency indicators? How to collect the date for indicators? Collecting what and how for the Residential sector Collecting what and how for the Services sector Collecting what and how for the Industry sector Collecting what and how for the Transport sector Validating the data Disseminating the data Annexes
Great questionnaire! But how to collect the data? And what indicators to build with these data?
© OECD/IEA 2015
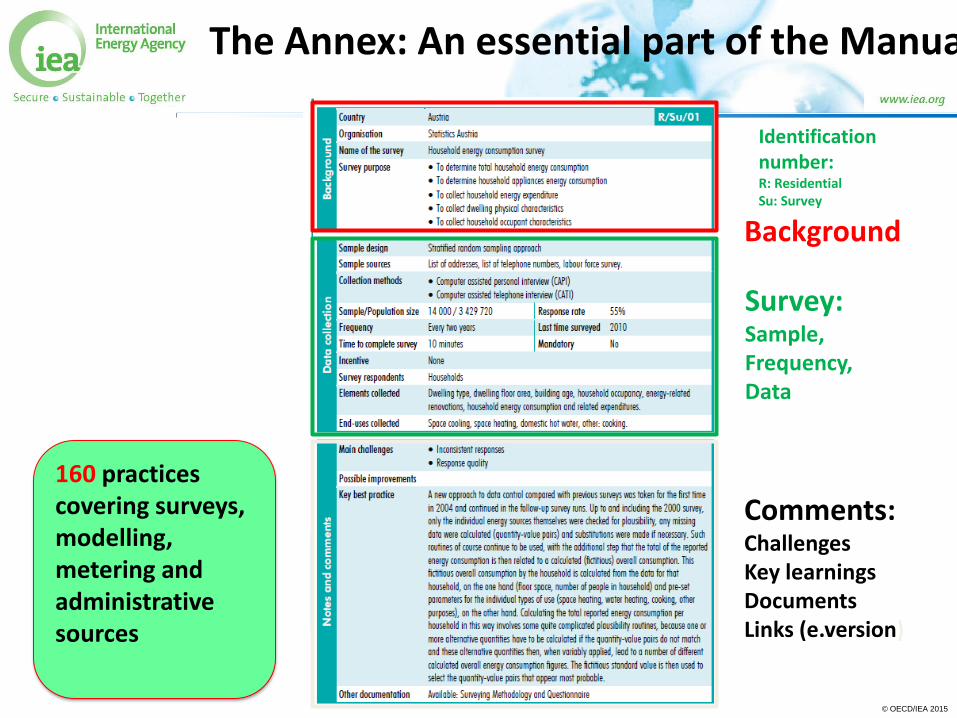
Identification number: R: Residential Su: Survey
Background
Survey: Sample, Frequency, Data
Comments: Challenges Key learnings Documents Links (e.version)
160 practices covering surveys, modelling, metering and administrative sources
The Annex: An essential part of the Manual

© OECD/IEA 2015
Questions