the rise of middle kingdoms: emerging … rise of middle kingdoms: emerging economies in ... the...
TRANSCRIPT

NBER WORKING PAPER SERIES
THE RISE OF MIDDLE KINGDOMS:EMERGING ECONOMIES IN GLOBAL TRADE
Gordon H. Hanson
Working Paper 17961http://www.nber.org/papers/w17961
NATIONAL BUREAU OF ECONOMIC RESEARCH1050 Massachusetts Avenue
Cambridge, MA 02138March 2012
I thank David Autor, Charles Jones, John List, and Timothy Taylor for helpful comments and SamBazzi and Heea Jung for excellent research assistance. The views expressed herein are those of theauthor and do not necessarily reflect the views of the National Bureau of Economic Research.
NBER working papers are circulated for discussion and comment purposes. They have not been peer-reviewed or been subject to the review by the NBER Board of Directors that accompanies officialNBER publications.
© 2012 by Gordon H. Hanson. All rights reserved. Short sections of text, not to exceed two paragraphs,may be quoted without explicit permission provided that full credit, including © notice, is given tothe source.

The Rise of Middle Kingdoms: Emerging Economies in Global TradeGordon H. HansonNBER Working Paper No. 17961March 2012JEL No. F10
ABSTRACT
In this paper, I examine changes in international trade associated with the integration of low- and middle-incomecountries into the global economy. Led by China and India, the share of developing economies in globalexports more than doubled between 1994 and 2008. One feature of new trade patterns is greater South-Southtrade. China and India have booming demand for imported raw materials, which they use to buildcities and factories. Industrialization throughout the South has deepened global production networks,contributing to greater trade in intermediate inputs. A second feature of new trade patterns is the returnof comparative advantage as a driver of global commerce. Growth in low- and middle-income nationsmakes specialization according to comparative advantage more important for the global compositionof trade, as North-South and South-South commerce overtakes North-North flows. China’s exportspecialization evolves rapidly over time, revealing a capacity to speed up product ladders. Most developingcountries hyper-specialize in handful of export products. The emergence of low- and middle-incomecountries in trade reveals significant gaps in knowledge about the deep empirical determinants of exportspecialization, the dynamics of specialization patterns, and why South-South and North-North tradediffer.
Gordon H. HansonIR/PS 0519University of California, San Diego9500 Gilman DriveLa Jolla, CA 92093-0519and [email protected]

1
In the recent global financial crisis, there was a sharp divide in the economic performance
of high-income and emerging-market nations. The United States, the countries of the European
Union, and Japan suffered most. They have been slow to recover, with heavy debt burdens and
enfeebled banks promising continued sluggishness. Many emerging economies, in contrast,
hardly paused during 2008 and 2009. Led by China and India, their robust growth is now fueling
the recovery of the global economy. The shift in economic power is palpable. Brazilian, Chinese,
and Indian multinational firms are eagerly acquiring assets abroad; U.S. and European leadership
in the World Trade Organization, once unassailable, has failed to consummate the Doha round of
global trade negotiations; and the IMF has been spending more time worrying about the balance
sheets of high-income nations than of lower-income ones.
Although events since 2007 have brought these changes in the world economy into sharp
focus, the rise of low- and middle-income countries in global trade has been decades in the
making. China’s economic transition, which accelerated in the 1990s, allowed the country to
realize a latent comparative advantage in labor-intensive products (Amiti and Freund, 2010;
Harrigan and Deng, 2010). India’s surge of growth, which began even before the reforms it
initiated in 1991 (Rodrik and Subramanian, 2004), was, like China’s, aided by industries
beginning far inside the technology frontier (Hsieh and Klenow, 2009). The result of China’s and
India’s openings has been an immense global export supply shock. Between 1992 and 2008,
average annual growth in exports was 18 percent in China and 14 percent in India. These two
are not the only significant new players in global trade. Consider the next 15 middle-income
countries, which (in order of market size) are Brazil, Korea, Mexico, Russia, Argentina, Turkey,
Indonesia, Poland, South Africa, Thailand, Egypt, Colombia, Malaysia, the Philippines, and
Chile. In 2008, they each had a GDP above $100 billion; as a group, their collective GDP is 1.4

2
times China’s and India’s combined total. From 1992 to 2008, these 15 countries had average
annual export growth of 8 percent. During this period, low- and middle-income countries overall
saw their share of global exports more than double, from 21 to 43 percent.
In this paper, I examine changes in international trade associated with the integration of
low- and middle-income nations into the global economy. From the 1950s to the 1980s, trade
was dominated by flows between high-income countries both because they accounted for most of
global GDP and because many developing countries maintained high barriers to imports. In the
international economics literature, the exchange of goods between the United States, Canada, the
nations of western Europe, and Japan is often referred to as North-North trade. However, we are
moving toward a world in which South-South commerce (trade between developing countries)
and North-South commerce (trade between developed and developing countries) are overtaking
North-North flows. Whereas high-income economies accounted for four-fifths of global trade in
1985, they will account for less than half by the middle of this decade.
I start by focusing on the growth in South-South trade. In part, this pattern has arisen
because urbanization and industrialization in China and India have contributed to strong demand
for raw materials needed to build cities and factories. Other developing economies are abundant
in these materials and have become important sources of global supply. Growth in low- and
middle-income economies has also deepened global production networks, with lengthening
production chains in the South increasing cross border flows of parts and components.
I then turn to the rise in North-South trade. During the 1980s, when North-North trade
was dominant, explanations for global trade patterns shifted away from classic theories of
comparative advantage. Models explaining trade as the result of differences in national factor
supplies, as in the Heckscher-Ohlin tradition, or in sectoral labor productivities, as in the
3
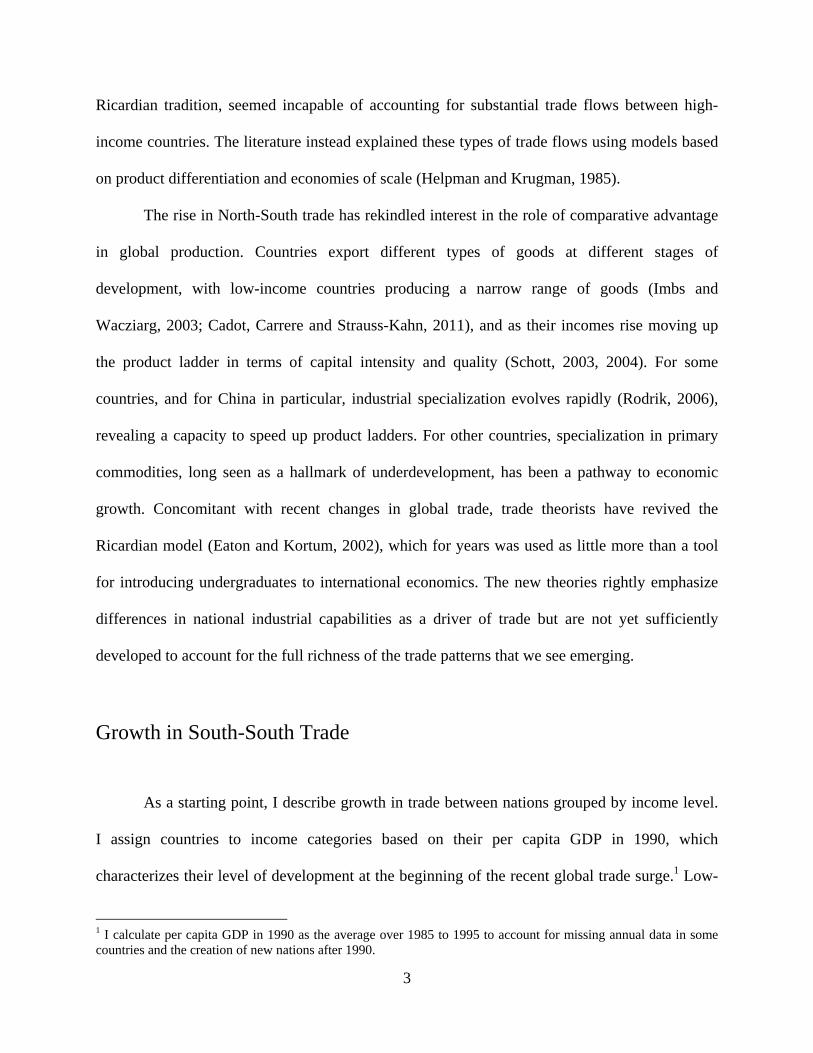
Ricardian tradition, seemed incapable of accounting for substantial trade flows between high-
income countries. The literature instead explained these types of trade flows using models based
on product differentiation and economies of scale (Helpman and Krugman, 1985).
The rise in North-South trade has rekindled interest in the role of comparative advantage
in global production. Countries export different types of goods at different stages of
development, with low-income countries producing a narrow range of goods (Imbs and
Wacziarg, 2003; Cadot, Carrere and Strauss-Kahn, 2011), and as their incomes rise moving up
the product ladder in terms of capital intensity and quality (Schott, 2003, 2004). For some
countries, and for China in particular, industrial specialization evolves rapidly (Rodrik, 2006),
revealing a capacity to speed up product ladders. For other countries, specialization in primary
commodities, long seen as a hallmark of underdevelopment, has been a pathway to economic
growth. Concomitant with recent changes in global trade, trade theorists have revived the
Ricardian model (Eaton and Kortum, 2002), which for years was used as little more than a tool
for introducing undergraduates to international economics. The new theories rightly emphasize
differences in national industrial capabilities as a driver of trade but are not yet sufficiently
developed to account for the full richness of the trade patterns that we see emerging.
Growth in South-South Trade
As a starting point, I describe growth in trade between nations grouped by income level.
I assign countries to income categories based on their per capita GDP in 1990, which
characterizes their level of development at the beginning of the recent global trade surge.1 Low-
1 I calculate per capita GDP in 1990 as the average over 1985 to 1995 to account for missing annual data in some countries and the creation of new nations after 1990.

4
income countries are those with per capita GDP of less than $800 (in 2000 U.S. dollars); middle-
income countries have per capita GDP of $800 to $10,000; and high-income countries have per
capita GDP of $10,000 to $33,000. These categories correspond closely to World Bank
definitions of country income status in 1990. China and India have their own category (whereas
by the above cutoffs they would be defined as low-income countries).
Table 1 shows trade flows, normalized by GDP, between country income groups over the
period 1994 to 2008 based on data from UN Comtrade (as are all other figures presented in the
paper). Two properties of global trade are immediately apparent. One is that for low- and
middle-income countries trade as a share of GDP has grown sharply. Exports over GDP rise
from 26 to 55 percent in low-income countries, from 25 to 55 percent in middle-income
countries, and from 25 to 44 percent in China and India. For high-income countries, the change
is much smaller, from 17 to 26 percent. Changes in imports as a share of GDP are similar.
The shifting pattern of international trade involves much larger South-South flows.
Between 1994 and 2008, the share of exports from low-income countries going to low- and
middle-income markets (including China and India) rose from 24 to 42 percent, with China and
India accounting for about half of this growth. The share of exports from middle-income
countries going to low- and middle-income markets (including China and India) rose from 33 to
46 percent, with China and India accounting for two-fifths of this growth.
Growth in trade shares for low- and middle-income countries far exceeds the increase in
their relative economic size. Between 1994 and 2008, the share of low- and middle-income
countries (including China and India) in global GDP increased from 22 to 29 percent. The
gravity model of trade, which is a workhouse for empirical research on trade flows, expresses
exports from one country to another as a function of the countries’ GDPs, bilateral trade costs,

5
and relative prices (Anderson and van Wincoop, 2004). Following the gravity logic, the share of
low- and middle-income countries in global trade should increase in rough proportion to their
share of global income. But Southern trade has grown much faster than Southern GDP.
What accounts for the surge in South-South commerce? A first possible explanation is
falling trade costs in emerging economies, resulting from unilateral trade reform, growth in
World Trade Organization membership, or reduced costs of shipping goods. But these
explanations are not well-supported by more detailed research. Hummels (2007) documents that
while the costs of air transport have fallen significantly in recent decades, the costs of ocean
transport, the mode of transport for most developing-country trade, have not. Between 1994 and
2008, policy barriers to trade have fallen, with the average applied tariff rate across all goods
(weighted by imports) declining from 12 to 4 percent in middle-income countries and from 29 to
8 percent in China. In high-income nations, already low tariffs meant further reductions were
small, with average tariffs falling from 5 to 3 percent. However, estimates by Yi (2003), using
data for an earlier period, suggest that such modest tariff changes are too small to explain the
more than doubling of trade as a share of GDP in developing economies.
The importance of the World Trade Organization appears to be over blown. Since 1995,
when the WTO was created out of the General Agreement on Trade and Tariffs, 41 new nations
have joined the organization, bringing membership to 153 countries. Yet, the literature provides
ambiguous support for the idea that WTO membership expands trade. Rose (2004a) finds that,
conditional on GDP, WTO members do not trade significantly more than non-members, which
he attributes to WTO members not having more liberal trade policies (Rose, 2004b), partly as a
result of the WTO placing weak demands on developing countries to liberalize trade.
An alternative explanation is that the growth in Southern trade is a result of expanding

6
multi-stage global production networks. Much of the recent increase in trade appears to be the
result of offshoring, in which firms fragment manufacturing across borders by locating
individual production stages in the countries in which they can be performed at least cost
(Hummels, Ishii, and Yi, 2001). A consequence may be that gross trade flows (i.e., total exports)
overstate net trade flows (i.e., exports net of imported intermediate inputs), which if true would
imply that the expansion of South-South trade is in part statistical artifact. If goods are produced
through a sequence of stages, as modeled by Costinot, Vogel, and Wang (2011), each country
will add value as a product is transformed from raw inputs into a final output along a production
chain than spans national borders. The value-added of countries participating earlier in the chain
will therefore be counted in trade flows multiple times. The Intel Corporation, for example,
produces semiconductors by first manufacturing silicon wafers in the United States, Ireland, and
Israel and then assembling and testing integrated circuits made out of these wafers at plants in
China, Costa Rica, Malaysia, and the Philippines. Silicon wafers are counted in trade twice, first
in shipments of the raw wafers from the United States to Costa Rica, and again in the shipment
of integrated circuits that embody the wafers from Costa Rica to the final destination market.
Global production networks, however, need not be based on sequential manufacturing.
Dell follows an alternative model in making computers, in which it subcontracts the production
of parts and components to suppliers in many countries and has these parts shipped to final
destination markets, where they are assembled into computers for final consumers. If production
networks tend to follow the Intel model, total exports may greatly exceed trade in value added,
whereas if they tend to follow the Dell model they may not.
What fraction of measured trade flows is subject to concerns over double-counting? In
the case of China, half of its manufacturing exports in the late 1990s and early 2000s were

7
produced by processing plants that assemble imported parts and components into final goods for
export, primarily in consumer products (Feenstra and Hanson, 2005). Within export processing
plants, value-added in China as a share of total exports is only 36 percent. However, domestic
value added in China’s exports outside of processing plants appears to be much higher.
Koopmans, Powers, Wang, and Wei (2010) estimate that for China’s overall exports, domestic
value added accounts for 65 percent of total exports. For the world as a whole, 75 percent of
exports consist of value-added in the country of export. In middle-income countries, the share of
domestic value added in total exports is relatively low in Malaysia (59 percent), Mexico (62
percent), the Philippines (58 percent), and Thailand (60 percent) and relatively high in Brazil (87
percent), Indonesia (77 percent), Russia (89 percent), and South Africa (81 percent). The latter
group of countries specializes in producing commodities, in which fragmentation of production
is less feasible, whereas the first group specializes in manufacturing, where production chains are
more common. In Mexico, for instance, half of manufacturing exports are by maquiladoras,
plants that assemble final goods in electronics, automotive goods, and machinery from parts and
components imported from the United States (Bergin, Feenstra, and Hanson, 2009).
Other evidence confirms that double counting in recorded total trade flows is more severe
for manufactured goods. Johnson and Noguera (2012) find that the ratio of export value added to
total exports is lower in manufacturing (44 percent) than in agriculture and natural resources
(109 percent, where a value of greater than 100 percent indicates that a large fraction of exports
in the sector are indirect in the form of value added embodied in the final exports of other
sectors). Many middle-income countries specialize in manufacturing exports, suggesting that
global production networks are part of the reason their trade is expanding so rapidly. But double-
counting as a result of such networks cannot be the entire story. Most low-income and some

8
middle-income nations specialize in primary products, including minerals and farm goods. For
these countries, the increase in exports to GDP is not an artifact of total exports overstating value
added in exports but is instead a reflection of increasing specialization for global markets.
Evidence on the share of value-added in total exports is based largely on cross-sectional
data, with little work providing clues on the expansion path of production chains. We do not
know whether the share of value-added in total exports is rising or falling. There is some
evidence that emerging economies are deepening their productive capacity, capturing production
of intermediate inputs that they previously imported from abroad, a phenomenon that is
pronounced in China. By the mid-2000s, exports of completed computers had become China’s
top export good. Many of these computers are assembled in export processing plants, requiring
China to import components from abroad. However, over time China’s reliance on imports in the
sector has declined markedly. Figure 1 shows exports and imports of computers, computer parts,
and computer peripheral devices (Standard International Trade Classification products 752, 7512
and 7519) in China over the period 1994 to 2008. In 1994, exports were 1.6 times imports in the
sector; by 2008, they were 4.2 times imports. While it is unclear how much one can generalize
from China’s experience, growth in trade involving middle-income manufacturers does not
necessarily go hand in hand with greater back and forth flows of intermediate inputs.
As China develops, it may continue to take over the manufacture of inputs, making
production in some sectors less fragmented globally. This experience is similar to that of Hong
Kong, Korea, Singapore, and Taiwan, which also entered global production networks by
specializing in product assembly and later expanded into input production and the design and
distribution of goods. But not all countries that begin as assemblers succeed in graduating into
other manufacturing stages. After nearly three decades of global manufacturing, most exporters

9
in Mexico and Central America remain stuck in the assembly stage.
Growth in South-South trade is a major part of the recent global trade boom. Falling trade
barriers and expanding global production networks have surely contributed to Southern trade
growth. However, they appear insufficient on their own to explain why trade to GDP ratios have
risen so much in low- and middle-income countries. What else could be behind the rapid
expansion of trade relative to GDP? One possibility, as yet unexplored in the literature, is that the
greater role of emerging economies in global trade is inducing a much finer degree of
international specialization than occurred during previous decades in which North-North trade
predominated. As I discuss next, such an explanation would require that comparative advantage
is assuming a larger role in determining global trade flows than it did in the past.
The Return of Comparative Advantage
The 1980s and 1990s were not kind to theories of trade based on comparative advantage.
The dominance of rich countries in global commerce led international economists to develop
models that explain trade as the result of increasing returns to scale and monopolistic
competition in differentiated products (Helpman and Krugman, 1985). The Heckscher-Ohlin
model, once a staple of graduate training in international trade, failed repeatedly to explain
prevailing trade patterns (Feenstra, 2004). And the Ricardian model remained little more than an
intellectual curiosity, given its tendency to predict extreme patterns of industry specialization,
seemingly at odds with the data (at least for Northern countries). Further, the robust success of
the gravity model, in which country size and trade costs are the primary determinants of trade

10
flows, seemed to defy a significant role for comparative advantage (Anderson and van Wincoop,
2003). If we can explain much of bilateral trade using the size of the importer and the size of the
exporter, why do we need comparative advantage at all?
Much has changed in the last decade. On the empirical side, China’s and India’s growth
are powerful reminders that cross-country differences in technology and resources are potent
motivations for commerce. On the theory side, Eaton and Kortum (2002) show that Ricardian
comparative advantage is consistent with the gravity model. In their formulation, an exporter
captures a share of an importer’s market according to its technological capability and its trade
costs in delivering goods. They avoid the knife-edge feature of the textbook Ricardian model, in
which a country tends to supply either the entire market for a good or none, by having
productivity vary randomly across firms within a country and the position of the country’s
productivity distribution in an industry be given by its pre-determined technological capability,
which they liken to absolute advantage. These technological capabilities (along with the
dispersion of productivity across firms) are the key primitives of the model. Other models have
comparative advantage arising from country differences in factor supplies that result in trade in
intermediate inputs associated with the formation of global production networks (Feenstra,
2010). In either set of theories, it is differences between countries, whether in terms of their
technological capabilities or their factor supplies, that cause trade.
International Specialization
A role for comparative advantage in trade is evident in the pattern of net exports by sector
across country income groups, as shown in Figures 2a-2d. I group non-oil exports into nine
categories: agriculture and food products; minerals and other raw materials; apparel, footwear,
11
and textiles; metals and metal products; chemicals; machinery; electronics and electrical
machinery; transportation equipment; and other manufactures.2 Agriculture and raw materials are
intensive in the use of land, mineral reserves, and in some cases raw labor; apparel, footwear,
textiles, some electronics, and other manufactures (which include furniture, toys, and games), are
intensive in the use of low-skilled labor; and chemicals, machinery, some electronics, and
transportation equipment are intensive in human and physical capital.
International specialization follows broadly perceived patterns of comparative advantage.
Low-income countries (Figure 2a) have positive net exports in three resource or labor-intensive
sectors – agriculture, raw materials, and apparel and shoes – and negative net exports in other
sectors. China and India (Figure 2b) have positive net exports in three labor-intensive sectors –
apparel and shoes, electronics, and other manufactures – and negative or negligible net exports in
other sectors. Middle-income countries (Figure 2c) have negative net exports in the three capital-
intensive sectors – chemicals, machinery, and transportation equipment – and export strength in
other goods. And high-income countries (Figure 2d) have positive net exports in the three
capital-intensive sectors and negative net exports elsewhere.
Underlying these specialization patterns is growing South-South trade along comparative
advantage lines, with resource-poor emerging economies purchasing raw materials from ones
that are resource rich. For low-income countries over the period 1994 to 2008, shipments to low-
and middle-income markets (including China and India) accounted for 70 percent of their export
growth in agriculture and food products and 73 percent of their export growth in raw materials.
2 The corresponding one and two digit Standard International Trade Classification (SITC) products are: agriculture and food products (SITC 0, 1, 4, 21, 22, 29, 94); raw materials, which include rubber, wood, paper, iron ore, and other minerals (SITC, 23-25, 27-28, 62-64, 66); apparel, footwear, and textiles (SITC 26, 61, 65, 83-85); metals and metal products (SITC 67-69), chemicals (SITC 5), machinery (SITC 71-74), electronics and electrical machinery (SITC 75-77), transportation equipment (SITC 78-79, 95), and other manufactures, which include toys and games, plumbing and light fixtures, furniture, professional and scientific equipment, photographic and optical equipment, watches and miscellaneous goods (SITC 81-82, 87-89). Petroleum, coal, and natural gas (SITC 3) are excluded.

12
China and India are particularly important sources of raw material demand, absorbing 40 percent
of low-income country growth in exports of these goods over the period. Not surprisingly,
emerging economies are a relatively unimportant source of demand for apparel and textiles,
absorbing only 25 percent of low-income country export growth in that sector. Low-income
countries send most of their output of clothing and shoes to high-income markets.
Middle-income countries export a diverse set of goods, owing to the heterogeneity of
countries within the group. Individual countries tend to specialize in a subset of sectors. Overall,
middle-income countries have had strong export growth in agriculture, led by Argentina and
Brazil; metals, led by Russia, Korea, South Africa, and Chile; electronics, led by Korea,
Malaysia, Thailand, and the Philippines; and transportation equipment, led by Korea, Mexico,
Poland, and Turkey. In each of these sectors, except autos, low- and middle-income markets
absorbed 50 percent or more of middle-income country export growth over the period 1994 to
2008. China and India alone accounted for more than 25 percent of absorption of the export
growth of middle-income countries in raw materials and electronics. Their raw material demand
is further evidence of China’s and India’s need for iron ore, copper, and other minerals they
require to build their economies; their electronics demand, coming primarily from China,
represents the deepening of production networks among emerging economies. China and India
are distinct among low- and middle-countries for being reliant on high-income markets to absorb
their ever-growing exports. High-income countries absorbed over 70 percent of China’s and
India’s export growth in apparel, footwear, and other manufactures and over 55 percent in
electronics (one of China’s strengths) and metals (one of India’s).
Foreign direct investment (FDI) is abetting the growth of emerging-economy trade.
North-to-South FDI flows are well known to international economists. A large literature
13
documents the importance of these flows in building global production chains (for example,
Hanson, Mataloni, and Slaughter, 2005; Harrison and MacMillan, 2011; and Becker and
Muendler, 2011). Between 1994 and 2008, inflows of foreign direct investment as a share of
GDP rose from 2.1 to 3.4 percent in low-income countries, rose from 1.3 to 4.4 percent in
middle-income countries, and held steady at 3 percent in China and India. Much less appreciated
is the growth in outward FDI by emerging economies. Outflows of FDI as a share of GDP rose
over the 1994 to 2008 period from 0.2 to 2.2 percent of GDP in middle-income countries and
from 0.2 to 1.2 percent of GDP in India and China. For comparison, outflows of foreign direct
investment from high-income countries were 3.6 percent of GDP in 2008.
Dynamics in Specialization
The cross-sectional view of trade data seen in the last section highlights what appears to
be specialization according to comparative advantage, whether Heckscher-Ohlin (resource
based) or Ricardian (technology based) in origin. A dynamic view of trade reveals that
specialization in low- and middle-income countries can change rapidly over time.
The data from Figure 2b show that for middle-income countries in 1994 apparel and
footwear was the top sector for net exports but that by 2008 electronics had displaced it. This
change is consistent with middle-income economies accumulating human and physical capital,
pushing them out of labor-intensive clothes and shoes and into more capital-intensive goods
(Schott, 2003). Low-income countries, including Bangladesh and Vietnam, are moving in to fill
the space vacated by middle-income countries in apparel. The largest changes in specialization
occur in China and India. As shown in Figure 2c, China’s and India’s net exports as a share of
GDP decline over 1994 to 2008 in apparel and footwear, the sector with their largest net exports

14
in 1994. Since the early 1990s, China has been moving into more sophisticated products,
including cellphones and computers. The sector with the largest growth in net exports is
electronics, with an increase in net exports to GDP of 6.0 percentage points, followed by metals
and machinery, each with increases of net exports to GDP of 2.8 percentage points. In the
future, China and India may acquire comparative advantage in new sectors, such as chemicals or
transportation equipment, as occurred in the last decade with machinery.
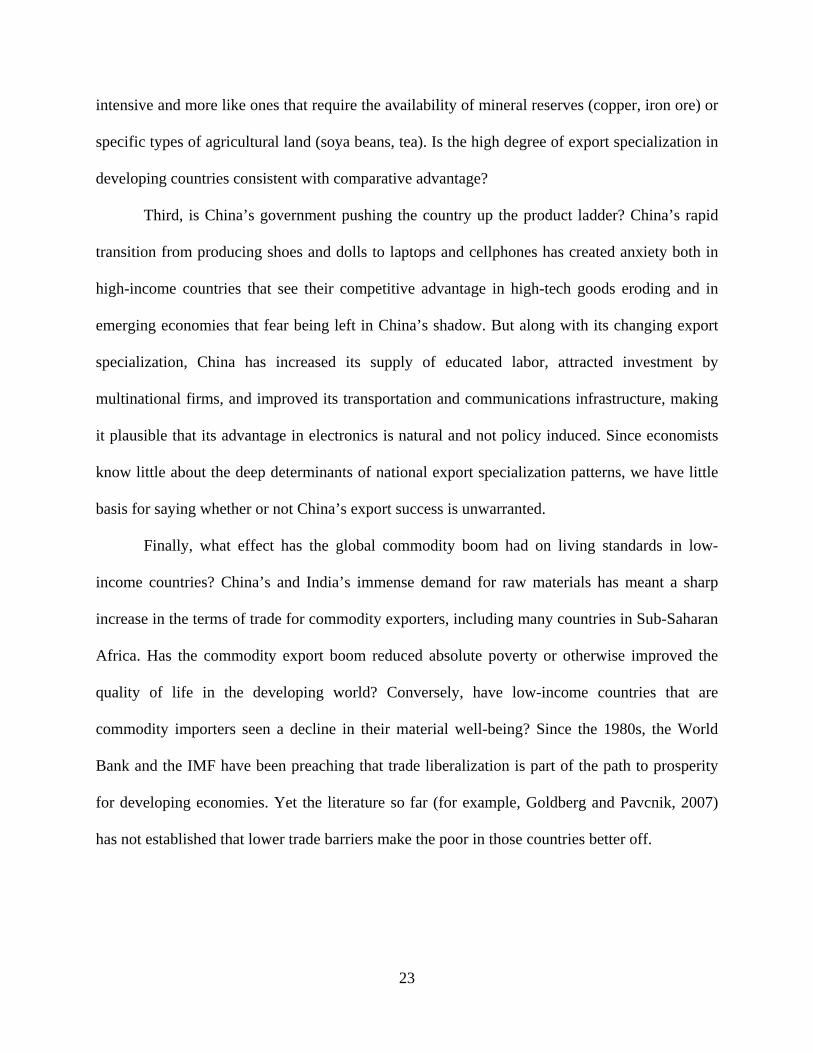
China’s recent experience is worth a closer look. Figure 3 shows the share of four
(Standard International Trade Classification four-digit) products in China’s total exports. The
first two, footwear and children’s toys, were China’s top two exports in 1994, the former
accounting for 7.3 percent of total shipments and the latter for 7.0 percent. By 2008, the export
shares of these two products had declined to 2.4 and 3.5 percent, respectively. Joining shoes and
toys among China’s top exports are completed computers, with 4.5 percent of total shipments in
2008, making it the country’s top export good, and TV and radio transmitters (for example,
mobile handsets), with 3.0 percent of total shipments in 2008, making it China’s third largest
export. China’s transition into computer production happens virtually overnight, with most of its
export growth in the product occurring between 2002 and 2005.
Of course, if China is just progressing from assembling tennis shoes to assembling
laptops, the change in its export patterns would not be all that impressive. Export processing
plants continue to account for a large share of China’s total shipments abroad. However, as
Figure 1 earlier showed, China’s exports of computers and computer parts have grown much
more rapidly than its imports of final and intermediate goods in the sector, suggesting that at
least part of China’s graduation from apparel to electronics also involves capturing more links in
global production chains. Huawei and Lenovo, which are companies based in China and

15
controlled by Chinese investors, are respectively the world’s second-largest manufacturer of
mobile telecommunications equipment and the world’s fourth-largest manufacturer of laptops
and personal computers. Over time, China is both manufacturing more technologically advanced
goods and accounting for a larger share of value added in their production.
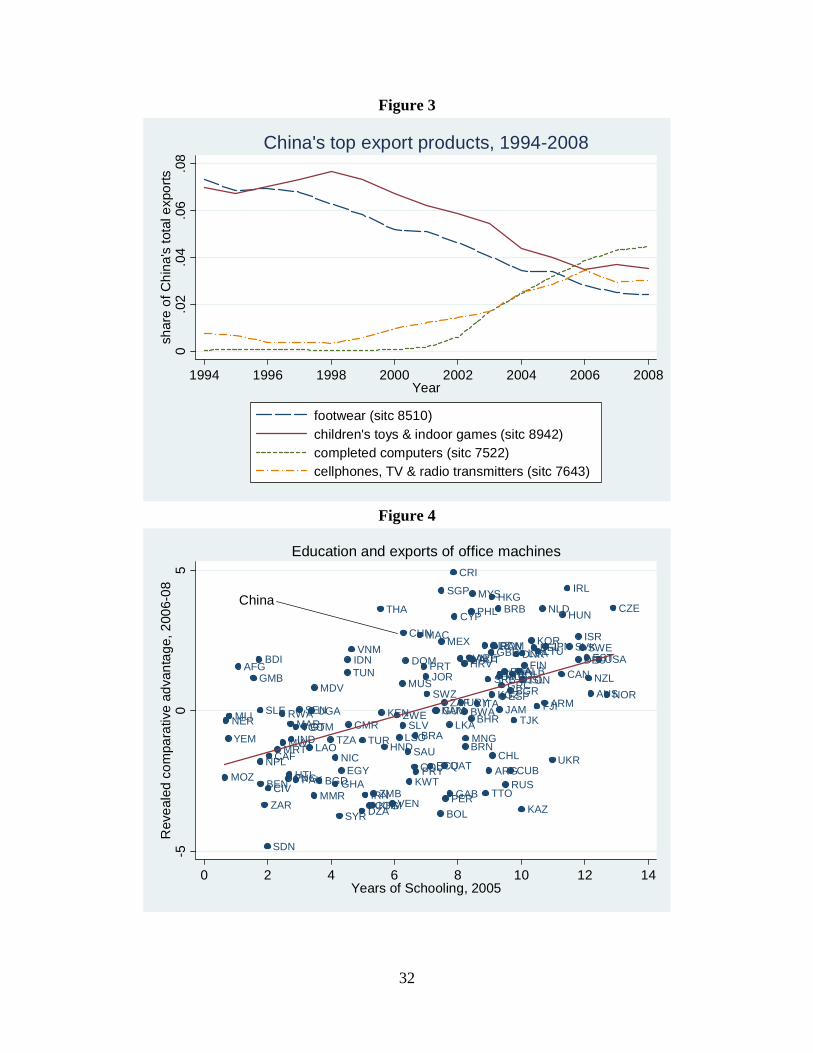
Is China’s specialization in computers unusual for a country at its level of development?
Rodrik (2006) doubts that China’s export strength in electronics is attributable to comparative
advantage, suggesting instead that the country has used industrial policy to expand high-tech
production. Figure 4 plots countries’ revealed comparative advantage in office machines—
Standard International Trade Classification (SITC) industry 75—averaged over 2006 to 2008,
against the average years of schooling of the adult population in 2005 (Barro and Lee, 2010).
Revealed comparative advantage in computers is defined as the log ratio of a country’s share of
world exports of SITC 75 to its share of world exports of all merchandise.3 China is above the
regression line, indicating that its specialization in the sector is greater than one would expect
give its level of education, but it is hardly an outlier. Other middle-income countries – including
Costa Rica, the Philippines, Malaysia, and Thailand – have larger positive residuals. While
China’s rapid export growth in electronics grabs one’s attention, its current specialization in the
sector does not seem unwarranted given its stock of human capital.
The results in Figure 4 suggest that international specialization in computers is associated
with cross-country variation in the supply of skilled labor. More generally, does the
accumulation of human and physical capital by middle-income countries explain their rapid
progression into electronics, which is visible in Figure 2? The literature has yet to address the
issue, which is surprising given that the growth of international trade in electronics is perhaps the
3 To purge the revealed comparative advantage index of the effects of country size, I use the residuals from a regression of the index on log country population.

16
single most important factor behind the expansion of global production networks.
Another perspective on China’s evolution is that although the country is shifting into
more advanced sectors, it remains locked into producing low-priced goods. Schott (2008) finds
that the overlap between the products that the U.S. imports from China and from OECD
countries is substantial. Between 1983 and 2005, the similarity of the U.S. import bundle from
China to that for the OECD jumped from rank 13 among developing countries to rank 4, behind
Korea, Mexico, and Taiwan. As of 2005, US imports from China covered 89 percent of all ten-
digit products in the Harmonized System,4 compared to 97 percent for the OECD as a whole.
Yet, despite the breadth in the goods that China exports, and the similarity of its product
categories with far richer countries, China appears to occupy a down-market niche within
narrowly defined goods. Schott (2008) finds a large price discount on Chinese imports in the
United States. He regresses the unit value (average price) of U.S. imports on product-year
dummy variables, the distance between the United States and the exporting country, the U.S.
applied tariff rate on the product, and the exporting country’s per capita GDP. In the 2000s, unit
values on Chinese imports are 48 log points lower than those of other countries.
Lower unit values for U.S. imports from China may indicate that the country produces
goods of inferior quality, leading to lower market prices. However, China’s experience isn’t all
that different from comparison countries. In the 2000s, the discount on unit values for U.S.
imports from Korea is 45 log points, from Japan is 33 log points, and from Mexico is 59 log
points (Schott, 2008). Whatever accounts for the relatively low average prices of U.S. imports
from China, its unit values are similar to its neighbors in either geographic or product space.
4 The trade data used in this paper are based on the Standard International Trade Classification system developed by the United Nations (see http://unstats.un.org/). Recently, trade data have become available based on the Harmonized System of product classification developed by the World Customs Organization (see http://www.wcoomd.org/), which provides more disaggregated product categories than are available in the SITC system.

17
Further, lower average import prices do not necessarily imply lower quality. Japan and Korea
have a strong reputation for quality. And the success of Lenovo, the Chinese manufacturer of
laptops, demonstrates that the country is capable of producing high-quality goods.
Hyper-specialized Exporters
We have now seen that (i) at any moment in time country specialization by broad sector
appears to be consistent with standard models of comparative advantage, and (ii) over time
specialization patterns evolve rapidly, perhaps in line with factor accumulation. Missing in the
discussion is information on what is going on inside the broad sectors. When we drill down we
observe a fine degree of specialization in which the exports of low- and middle-income countries
are concentrated in a relatively small number of products (Easterly and Reshef, 2009). Such
hyper-specialization is harder to explain with standard trade models.
Many developing countries have zero exports in broad swaths of product space. Using
data for 2008, Figure 5 shows the fraction of products in which countries have zero exports,
plotted against log real GDP, as a measure of country size. At the two-digit Standard
International Trade Classification level, there are 69 products (examples would include cereals,
pharmaceutical products, electrical machinery), and at the four-digit SITC level there are 786
products (for example, milled rice, antibiotics, semiconductors). Most countries with GDP of less
than $3.6 billion (an example would be Senegal) have positive exports in fewer than 60 percent
of four-digit products and in fewer than 80 percent of two-digit products. It is not until countries
reach a GDP of $72 billion (Iran) that they tend to export the full range of two-digit goods and
not until $195 billion (Sweden) that they export the full range of four-digit products.
18
Further, exports of most countries are concentrated in a small number of goods. Figure 6
shows the export-weighted average share of top products in total trade by country income
category in 2000 and 2008. I exclude petroleum exports (although graphs including them are
similar) and I aggregate up to the three-digit level (of which there are 238 products) to account
for reporting anomalies in some countries. For low-income countries in 2008, the share of
exports accounted for by the single largest three-digit good is a whopping 21 percent, in the top
four goods is 45 percent, and in the top eight goods is 58 percent. Hyper-specialization extends
beyond poor nations. In middle-income countries, the one-, four-, and eight-good export
concentration ratios are 16, 37, and 49 percent, respectively, and in high-income countries they
are 11, 26, and 36 percent. For comparison, the U.S. ratios are 5, 17, and 28 percent.
For low-income countries, the most common top four-digit Standard International Trade
Classification export products (in order of frequency) are petroleum, unwrought aluminum, tea,
coffee, edible nuts, raw cotton, diamonds, copper, and knitted apparel. For middle-income
countries, the most common export products are petroleum, semiconductors, autos, knitted
apparel, frozen fish, cane sugar, aluminum ore, diamonds, ferro-alloys, copper, and ships. The
exports from the two groups overlap, with middle-income countries adding to the list goods
intensive in human or physical capital (microchips, cars, metals, and boats), a transition that may
reflect countries investing in education and machinery as they develop.
Specialization in a small number of exports is not simply of function of developing
countries having small economies and therefore producing a relatively narrow range of goods.
Even the largest middle-income economies hyper-specialize. Taking the largest middle-income
economy in each geographic region, Brazil’s top 2008 exports are iron ore (11 percent of total
exports), petroleum (8 percent), and soya beans (6 percent); Korea’s are semiconductors (11

19
percent), autos (7 percent), and ships (7 percent); Mexico’s are petroleum (14 percent),
televisions (8 percent), and autos (8 percent); Indonesia’s are coal (9 percent), palm oil (8
percent), and petroleum (7 percent); Poland’s are autos (6 percent), auto parts (5 percent), and
televisions (3 percent); and South Africa’s are platinum (13 percent), coal (7 percent), and
diamonds (6 percent). Of this group, only Poland’s top three exports account for less than 25
percent of the country’s total foreign shipments. For comparison, the top U.S. exports are aircraft
(5 percent), petroleum products (4 percent), and microcircuits and transistors (4 percent).
What explains hyper-specialization in exporting? One account comes from the booming
literature on firm heterogeneity and trade. Following the empirical findings of Bernard and
Jensen (1999), which documents that most firms do not export, Melitz (2003) develops a model
in which firm productivity is a random variable (drawn from a Pareto distribution that is identical
across countries) and firms face fixed costs in exporting goods abroad. Helpman, Melitz, and
Rubinstein (2008) extend the Melitz model to account for the fact that the majority of bilateral
trade flows are zero (i.e., that most pairs of countries do not trade; Santos Silva and Tenreyro,
2006, Baldwin and Harrigan, 2011). Key to their explanation is the perhaps strong assumption
that the distribution of firm productivity is bounded from above, meaning that in each industry
there is a maximum level of productivity that a firm can attain. Consequently, for pairs of
countries in which the importer has high trade barriers or a small market there will be no firm in
the exporting country that is productive enough to justify the fixed cost of shipping to that
market. We will therefore observe zero trade from the exporter to the importer.
Returning to Figure 5, the striking fact is that smaller countries have positive exports of
fewer goods. In the Helpman, Melitz, and Rubinstein model, it is the size of the importer’s
market and not the size of the exporter’s market that predicts zero trade. Further, in this model

20
exports will be concentrated within industries (with more productive firms doing the lion’s share
of the trade) but not between industries (see Bernard, Redding and Schott (2007) for an extension
of the Melitz model that incorporates Heckscher-Ohlin features). The Melitz model therefore
does not offer an obvious account of the hyper-specialization that we see in Figure 6.
Can the Eaton and Kortum (2002) model explain hyper-specialization? Similar to Melitz,
the Eaton-Kortum framework allows for heterogeneous firm productivity, but in a Ricardian
setting such that country differences in technological capabilities dictate the share of import
markets captured by exporting countries. Eaton-Kortum would ascribe the patterns of sector
specialization in Figure 2 to country differences in these capabilities (Costinot, Donaldson and
Komunjer, 2011). To account for the hyper-specialization seen in Figure 6, these capabilities
would have to differ sharply across countries. The framework is silent about where technological
capabilities come from, though Chor (2009) finds that in cross-section data these capabilities are
correlated with country supplies of capital and labor and with country institutional characteristics
such as financial development and the legal environment. However, there are limits to the
applicability of Eaton-Kortum. It predicts a smoothness to bilateral trade flows that does not
allow for the preponderance zeros at the exporter-product level seen in Figure 5 (Eaton, Kortum,
and Sotelo (2011) attempts to extend Eaton-Kortum to allow for zeros in trade flows). While the
Eaton-Kortum model gives us an elegant way of linking the gravity model of trade to
comparative advantage, along the way it loses the extreme specialization of the simple Ricardian
model, which accords with trade patterns in many emerging economies.
A second explanation for hyper-specialization comes from Rodrik (2006) and Easterly
and Reshef (2008), which suggest that exports are subject to externalities in production. The
logic of external economies of scale is that when one firm expands production in an industry it

21
lowers costs for other firms through knowledge spillovers or through pecuniary externalities
associated with making inputs available at a lower cost. Externality-based explanations for the
location of production date back to Alfred Marshal’s (1920) discussion of the development of the
English textile industry, and are typically associated with understanding where and how
manufacturing gets going. However, the products that dominate exports for low- and middle-
income countries include many primary commodities. It is perhaps difficult to see why
externalities should be important in the export of soya beans, edible nuts, aluminum ore, or
copper. If they are, they have yet to be documented in the literature.
Available theories of trade are capable of explaining specific features of global
commerce, such as why trade has a gravity structure, why countries specialize, or why so few
firms export, but they do not yet appear capable of explaining the rich tableaux of trade patterns
that we observe through the growing importance of low- and middle-income countries in the
world economy. Countries at different income levels produce different types of goods, specialize
according to broad sector and within these sectors in a relatively small number of products,
export many goods not at all, and are capable of progressing rapidly up the ladder in terms of
product sophistication. A model that could explain these outcomes would need prominent roles
for comparative advantage, for extreme specialization even in larger countries, and for rapid
changes in specialization associated with factor accumulation or technological progress.
Final Discussion
The dramatic growth of China, India, and other middle-income nations is transforming
the global economy. It is changing who trades with whom, how production is organized across

22
borders, and how the global gains from trade are distributed. Research is just beginning to take
stock of the emerging-economy trade boom. An active body of work seeks to explain China’s
growth (Song, Storesletten, and Zilibotti, 2011), its implications for global welfare (Hsieh and
Ossa, 2011; Levchenko and Zhang, 2011), and its effect on economies of high-income countries
(for example, Bernard, Jensen and Schott, 2006; Bloom, Draca, and Van Reenan, 2009; Autor,
Dorn, and Hanson, 2011). Other literature examines motivations for offshoring and global
production networks (for example, Yi, 2003; Feenstra and Hanson, 2005; Hanson, Mataloni, and
Slaughter, 2005; Grossman and Ross-Hansberg, 2008; Costinot and Vogel, 2011). We know less
about the empirical determinants of export specialization, the dynamics of specialization
patterns, or why South-South trade looks so different from North-North trade.
As we look ahead to this research agenda, what are the questions that need to be
answered? I can think at least four. First, how much of the recent growth in global trade
represents real value-added? We know that for trade in manufactures, the share of national value
added in export shipments is relatively low. China’s export success is based in part on export
processing plants that import parts and components and assemble them into final goods to ship
abroad. Is the value added share in exports rising or falling over time? Is production becoming
more or less fragmented across borders? How much of the rising share of exports to GDP in
developing countries represents a true increase in specialization for foreign markets?
Second, what explains hyper-specialization in exporting? The tendency for countries to
rely on a handful of products for most of their exports makes it tempting to see non-convexities
at work, such as informational spillovers in learning about foreign markets or industry-level
distribution networks whose creation entails substantial up-front investments. But the goods that
tend to top the list of developing country exports look less like products that are information-
23
intensive and more like ones that require the availability of mineral reserves (copper, iron ore) or
specific types of agricultural land (soya beans, tea). Is the high degree of export specialization in
developing countries consistent with comparative advantage?
Third, is China’s government pushing the country up the product ladder? China’s rapid
transition from producing shoes and dolls to laptops and cellphones has created anxiety both in
high-income countries that see their competitive advantage in high-tech goods eroding and in
emerging economies that fear being left in China’s shadow. But along with its changing export
specialization, China has increased its supply of educated labor, attracted investment by
multinational firms, and improved its transportation and communications infrastructure, making
it plausible that its advantage in electronics is natural and not policy induced. Since economists
know little about the deep determinants of national export specialization patterns, we have little
basis for saying whether or not China’s export success is unwarranted.
Finally, what effect has the global commodity boom had on living standards in low-
income countries? China’s and India’s immense demand for raw materials has meant a sharp
increase in the terms of trade for commodity exporters, including many countries in Sub-Saharan
Africa. Has the commodity export boom reduced absolute poverty or otherwise improved the
quality of life in the developing world? Conversely, have low-income countries that are
commodity importers seen a decline in their material well-being? Since the 1980s, the World
Bank and the IMF have been preaching that trade liberalization is part of the path to prosperity
for developing economies. Yet the literature so far (for example, Goldberg and Pavcnik, 2007)
has not established that lower trade barriers make the poor in those countries better off.

24
References
Amiti, Mary, and Caroline Freund. 2010. “An Anatomy of China’s Export Growth.” In Robert Feenstra and Shang-Jin Wei, eds., China’s Growing Role in World Trade, Chicago: NBER and University of Chicago Press, 35-62.
Anderson, James, and Eric van Wincoop. “Trade Costs.” Journal of Economic Literature, 42(3): 691-761. Autor, David, David Dorn, and Gordon H. Hanson. 2011. “The China Syndrome: Local Labor Market Impacts of Import Competition in the United States.” Mimeo, UC San Diego. Baldwin, Richard E., and James Harrigan. 2011. “Zeroes, Quality, and Space: Trade Theory and Trade Evidence.” American Economic Journal: Microeconomics, 3: 60-88. Barro, Robert J., and Jong-Wha Lee. 2010. “A New Data Set on Educational Attainment in the World, 1950-2010.” NBER Working Paper No. 15902. Becker, Sasha, and Marc Muendler. 2010. “Margins of Multinational Substitution.” American Economic Review, 100(5): 1999-2030. Bergin, Paul, Robert C. Feenstra, and Gordon H. Hanson. 2009. “Offshoring and Volatility: Evidence from Mexico’s Maquiladora Industry.” American Economic Review, 99: 1664-1671. Bernard, Andrew B. and J. Bradford Jensen. 1999. “Exceptional Exporter Performance: Cause, Effect, or Both.” Journal of International Economics 47: 1-25. Bernard, Andrew B., J. Bradford Jensen and Peter K. Schott. 2006. “Survival of the Best Fit: Exposure to Low-Wage Countries and the (Uneven) Growth of U.S. Manufacturing Plants.” Journal of International Economics, 68(1), 219-237.
Bernard, Andrew B., Stephen Redding, and Peter K. Schott. 2007. “Comparative Advantage and Heterogeneous Firms.” Review of Economic Studies, 74(1): 31-66. Bloom, Nicholas, Mirko Draca, and John Van Reenen. 2011. “Trade Induced Technical Change? The Impact of Chinese Imports on Diffusion, Innovation, and Productivity.” NBER Working Paper No. 16717.. Cadot, Olivier, Celine Carrere, and Vanessa Strauss-Kahn. 2011. “Export Diversification: What’s Behind the Hump?” Review of Economics and Statistics, 93(2): 590-605. Costinot, Arnaud, David Donaldson, and Ivana Komunjer. 2011. “What Goods Do Countries Trade? A Quantitative Exploration of Ricardo’s Ideas.” Review of Economic Studies, forthcoming.

25
Costinot, Arnaud, and Jonathan Vogel. 2011. “An Elementary Theory of Global Supply Chains.” NBER Working Paper No. 16936. Easterly, William, and Ariell Reshef. 2009. “Big Hits in Manufacturing Exports and Development.” Mimeo, New York University. Eaton, Jonathan, and Samuel Kortum. 2002. “Technology, Geography, and Trade.” Econometrica, 70(5): 1741-1779. Eaton, Jonathan, Samuel Kortum, and Sotelo. 2012. “International Trade: Linking Micro and Macro.” NBER Working Paper 17864. Feenstra, Robert C. 2003. Advanced International Trade. Princeton: Princeton University Press. Feenstra, Robert C. 2010. Offshoring in the Global Economy: Microeconomic Structure and Macroeconomic Implications. Cambridge, MA: MIT Press. Feenstra, Robert C., and Gordon H. Hanson. 2005. “Ownership and Control in Outsourcing to China: Estimating the Property Rights Theory of the Firm.” Quarterly Journal of Economics, 120(2), 729-762. Goldberg, Penny, and Nina Pavcnik. 2007. “Distributional Effects of Globalization in Developing Countries." Journal of Economic Literature, 45(1): 39-82. Grossman, Gene M., Esteban Rossi-Hansberg. 2008. "Trading Tasks: A Simple Theory of Offshoring." American Economic Review, 98(5): 1978-1997. Hanson, Gordon H., Raymond J. Mataloni, and Matthew J. Slaughter. 2005. “Vertical Production Networks in Multinational Firms.” The Review of Economics and Statistics, 87(4): 664-678. Harrigan, James, and Haiyan Deng. 2010. “China's Local Comparative Advantage.” In Robert C. Feenstra and Shang-jin Wei, eds., China's Growing Role in World Trade, Chicago, University of Chicago Press, 109-136. Harrison, Ann and Margaret McMillan. 2011. “Offshoring Jobs? Multinationals and U.S. Manufacturing Employment.” Review of Economics and Statistics, 93(3): 857-875. Helpman, Elhanan, and Paul Krugman. 1985. Market Structure and Foreign Trade. Cambridge, MA: MIT Press. Helpman, Elhanan, Marc J. Melitz, and Yona Rubinstein. 2008. “Estimating Trade Flows: Trading Partners and Trading Volumes.” Quarterly Journal of Economics, 123(2): 441-487.

26
Hsieh, Chang-Tai, and Peter J. Klenow. 2009. “Misallocation and Manufacturing TFP in China and India.” Quarterly Journal of Economics, 124(4): 1403-1448. Hsieh, Chang-Tai and Ralph Ossa. 2011. “A Global View of Productivity Growth in China.” NBER Working Paper No. 16778. Hummels, David. 2007. “Transportation Costs and International Trade in the Second Era of Globalization.” Journal of Economic Perspectives, 21(3): 131-154. Hummels, David, June Ishii, and Kei-Mu Yi. 2001. “The Nature and Growth of Vertical Specialization in World Trade.” Journal of International Economics, 54(1): 75-96. Imbs, Jean, and Romain Wacziarg. 2003. “Stages of Diversification.” American Economic Review, 93(1): 63-86. Johnson, Robert C., and Guillermo Noguera. 2012. “Accounting for Intermediates: Production Sharing and Trade in Value Added.” Journal of International Economics, 86(2): 224-236. Koopmans, Robert, William Powers, Zhi Wang, and Shang-Jin Wei. 2010. “Giving Credit where Credit Is Due: Tracing Value Added in Global Production Chains.” NBER Working Paper No. 16426. Levchenko, Andrei and Jing Zhang. 2011. “The Evolution of Comparative Advantage: Evolution and Welfare Implications.” NBER Working Paper No. 16806. Marshal, Alfred. 1920. Principals of Economics. New York: MacMillan. Melitz, Marc J. 2003. “The Impact of Trade on Intra-industry Reallocations and Aggregate Industry Productivity,” Econometrica, 71(6): 1695-1725. Rose, Andrew K. 2004a. "Do We Really Know That The WTO Increases Trade?" American Economic Review, 2004, 94(1): 98-114. Rose, Andrew K., 2004b. "Do WTO members have more liberal trade policy?" Journal of International Economics, 63(2): 209-235. Rodrik, Dani. 2006. "What's So Special about China's Exports?" China and the World Economy, 14(5): 1-19. Rodrik, Dani and Arvind Subramanian. 2004. “From Hindu Growth to Productivity Surge: The Mystery of the Indian Growth Transition.” NBER Working Paper No. 10376. Santos Silva, J.M.C., and Silvana Tenreyro. 2006. “The Log of Gravity.” Review of Economics and Statistics, 88(4): 641-658.

27
Schott, Peter K. 2003. "One Size Fits All? Heckscher-Ohlin Specialization in Global Production." American Economic Review, 93(3): 686-708. Schott, Peter. 2004. “Across Product versus Within Product Specialization in International Trade.” Quarterly Journal of Economics, 119(2): 647-678. Schott, Peter. 2008. “The Relative Sophistication of Chinese Exports.” Economic Policy, January, 5-49. Song, Zheng, Kjetil Storesletten, and Fabrizio Zilibotti. 2011. “Growing Like China.” American Economic Review, 101(1): 196-233. Yi, Kei-Mu. 2003. “Can Vertical Specialization Explain the Growth of World Trade?” Journal of Political Economy, 111(1): 52.102.

28
Table 1: Exports and Imports as a share of GDP by trading partner
Exports to Partner/ Imports from Partner/ Regional GDP Regional GDP
Region Trade Partner 1994 2008 Change 1994 2008 Change
Low income Low income countries 0.008 0.032 0.024 0.008 0.032 0.024 countries Mid income countries 0.045 0.116 0.071 0.060 0.171 0.111
China, India 0.011 0.083 0.072 0.018 0.107 0.089 High income countries 0.200 0.318 0.118 0.151 0.230 0.079
World 0.263 0.550 0.286 0.237 0.540 0.304
Mid income Low income countries 0.007 0.021 0.014 0.005 0.014 0.009 countries Mid income countries 0.053 0.156 0.103 0.053 0.156 0.103
China, India 0.022 0.075 0.053 0.024 0.074 0.050 High income countries 0.169 0.296 0.127 0.186 0.260 0.074
World 0.251 0.548 0.298 0.268 0.504 0.236
China and Low income countries 0.008 0.027 0.019 0.005 0.021 0.016 India Mid income countries 0.095 0.152 0.057 0.086 0.154 0.068
China, India 0.001 0.012 0.011 0.001 0.012 0.011 High income countries 0.143 0.253 0.110 0.098 0.141 0.043
World 0.248 0.444 0.196 0.190 0.327 0.137
High income Low income countries 0.003 0.007 0.004 0.005 0.010 0.005 countries Mid income countries 0.037 0.066 0.029 0.034 0.075 0.041
China, India 0.005 0.017 0.012 0.007 0.031 0.024 High income countries 0.128 0.169 0.041 0.128 0.169 0.041
World 0.174 0.260 0.086 0.174 0.286 0.112
Source: UN Comtrade, http://comtrade.un.org/.

29
Figure 1
0.0
2.0
4.0
6.0
8tr
ade
flow
/GD
P
1994 1996 1998 2000 2002 2004 2006 2008Year
exports of computers, parts, & peripherals (sitc 752, 7512, 7599)imports of computers, parts, & peripherals (sitc 752, 7512, 7599)
China imports and exports of computers and parts

30
Figure 2a
0 .02 .04 .06 .08 .1 .12 .14 0 .02 .04 .06 .08 .1 .12 .14
Other Mfg
Transport Eq
Electronics
Machinery
Chemicals
Metals
Apparel, Shoes
Raw Materials
Food, Agric
Other Mfg
Transport Eq
Electronics
Machinery
Chemicals
Metals
Apparel, Shoes
Raw Materials
Food, Agric
1994 2008
exports/GDP imports/GDP
Sector trade shares of GDP, low income countries
Figure 2b
0 .02 .04 .06 .08 .1 .12 .14 0 .02 .04 .06 .08 .1 .12 .14
Other Mfg
Transport Eq
Electronics
Machinery
Chemicals
Metals
Apparel, Shoes
Raw Materials
Food, Agric
Other Mfg
Transport Eq
Electronics
Machinery
Chemicals
Metals
Apparel, Shoes
Raw Materials
Food, Agric
1994 2008
exports/GDP imports/GDP
Sector trade shares of GDP, China & India

31
Figure 2c
0 .02 .04 .06 .08 .1 .12 .14 0 .02 .04 .06 .08 .1 .12 .14
Other Mfg
Transport Eq
Electronics
Machinery
Chemicals
Metals
Apparel, Shoes
Raw Materials
Food, Agric
Other Mfg
Transport Eq
Electronics
Machinery
Chemicals
Metals
Apparel, Shoes
Raw Materials
Food, Agric
1994 2008
exports/GDP imports/GDP
Sector trade shares of GDP, middle income countries
Figure 2d
0 .02 .04 .06 .08 .1 .12 .14 0 .02 .04 .06 .08 .1 .12 .14
Other Mfg
Transport Eq
Electronics
Machinery
Chemicals
Metals
Apparel, Shoes
Raw Materials
Food, Agric
Other Mfg
Transport Eq
Electronics
Machinery
Chemicals
Metals
Apparel, Shoes
Raw Materials
Food, Agric
1994 2008
exports/GDP imports/GDP
Sector trade shares of GDP, high income countries
32
Figure 3
0.0
2.0
4.0
6.0
8sh
are
of C
hin
a's
tota
l exp
ort
s
1994 1996 1998 2000 2002 2004 2006 2008Year
footwear (sitc 8510)
children's toys & indoor games (sitc 8942)completed computers (sitc 7522)cellphones, TV & radio transmitters (sitc 7643)
China's top export products, 1994-2008
Figure 4
AFG ALBARE
ARG
ARMAUS
AUTBDIBEL
BEN BGD
BGR
BHR
BLZ
BOL
BRA
BRB
BRN
BWA
CAF
CANCHE
CHL
CHN
CIV
CMR
COG
COL
CRI
CUB
CYPCZE
DEUDNKDOM
DZA
ECUEGY
ESP
ESTFIN
FJI
FRA
GAB
GBR
GHA
GMBGRC
GTM
GUY
HKG
HND
HRV
HTI
HUN
IDN
IND
IRL
IRN
ISL
ISR
ITAJAM
JOR
JPN
KAZ
KEN
KGZ
KHM
KOR
KWT
LAO
LKALSO
LTULVA
MAC
MAR
MDV
MEX
MLI
MLT
MMR
MNG
MOZ
MRT
MUS
MWI
MYS
NAMNER
NIC
NLD
NOR
NPL
NZL
PAK
PAN
PER
PHL
PNG
POLPRT
PRY QAT
ROM
RUS
RWA
SAU
SDN
SEN
SGP
SLE
SLV
SRB
SVKSVN
SWE
SWZ
SYR
TGO
THA
TJK
TON
TTO
TUN
TURTZA
UGA
UKR
URY
USA
VEN
VNM
YEM
ZAF
ZARZMB
ZWE
China
-50
5R
eve
aled
co
mpa
rativ
e ad
van
tag
e, 2
006-
08
0 2 4 6 8 10 12 14Years of Schooling, 2005
Education and exports of office machines

33
Figure 5
.2.4
.6.8
1
20 22 24 26 28 30 20 22 24 26 28 30
2 digit SITC products 4 digit SITC productssh
are
of p
rodu
cts
with
exp
orts
>0
, 200
8
log GDP in 1990
Share of products with positive exports by country
Figure 6
0 .1 .2 .3 .4 .5 .6 0 .1 .2 .3 .4 .5 .6
2008
2000
2008
2000
2008
2000
2008
2000
Low income countries Middle income countries
China/India High income countries
share of top SITC three-digit product in non-oil exportsshare of top 4 SITC three-digit products in non-oil exportsshare of top 8 SITC three-digit products in non-oil exports
Concentration of non-oil exports in top products