the rise and fall of welfare dependency in australia · the rise and fall of welfare dependency in...
TRANSCRIPT

The rise and fall of welfare
dependency in Australia
Peter Whiteford, Crawford School of Public Policy,
Australian National University
1

2
Outline
Background
What is welfare dependency? Alternative measures of dependency and recipiency.
Trends in benefit recipiency in Australia
International comparisons of benefit recipiency
Possible explanations for the rise and fall of welfare receipt Labour market trends
Demographic factors
Policy changes
Unanswered questions

Perspectives on welfare recipiency
• ―The point is we are reaching a fiscal tipping point. The moral tipping point is even
worse. ... We could become a society where the net majority of Americans are takers
not makers. ... Twenty percent of Americans, according to the Tax Foundation, get 75
percent of their income from the federal government, they’re dependent. Another 20
percent of Americans get 40 percent of their income from the federal government so
they’re reliant. Today 70 percent of Americans get more benefits from the federal
government in dollar value than they pay back in taxes.‖ Paul Ryan, 2011
• The United States is now ―on the verge of a symbolic threshold: the point at which
more than half of all American households receive, and accept, transfer benefits from
the government.‖ Nicholas Eberstadt, “A Nation of Takers”, 2012.
• ―The Age of Entitlement is over. ... The entitlements bestowed on tens of millions of
people by successive governments, fuelled by short-term electoral cycles and the
politics of outbidding your opponents is, in essence, undermining our ability to ensure
democracy, fair representation and economic sustainability for future generations.
... The age of unlimited and unfunded entitlement to government services and income
support is over. It’s as over in Greece as it is in Italy, in Spain, and in the USA.‖ Joe
Hockey, April 2012.
• ―We have moved beyond the days of big government and big welfare, to opportunity
through education and inclusion through participation‖, Julia Gillard, April 2011
3

Defining welfare dependency and recipiency
• This discussion focuses on people of working age and on receipt of
cash payments (not services)
• Recipiency can be calculated by comparing administrative data from
FaHCSIA and DEEWR on numbers of beneficiaries with ABS data
on population of working age
– Need to ensure no double counting; take account of part-rates of receipt
• ABS household income surveys identify households/income units by
per cent of income from government transfers (e.g. 50% plus, 90%
or more)
• HILDA data also provide income shares and dynamics of receipt
over time.
• Administrative panel data also capture longer run experiences on
welfare payments.
4

Recipient numbers and trends
5

Recipients (000s) of selected social
security payments, Australia, 2011
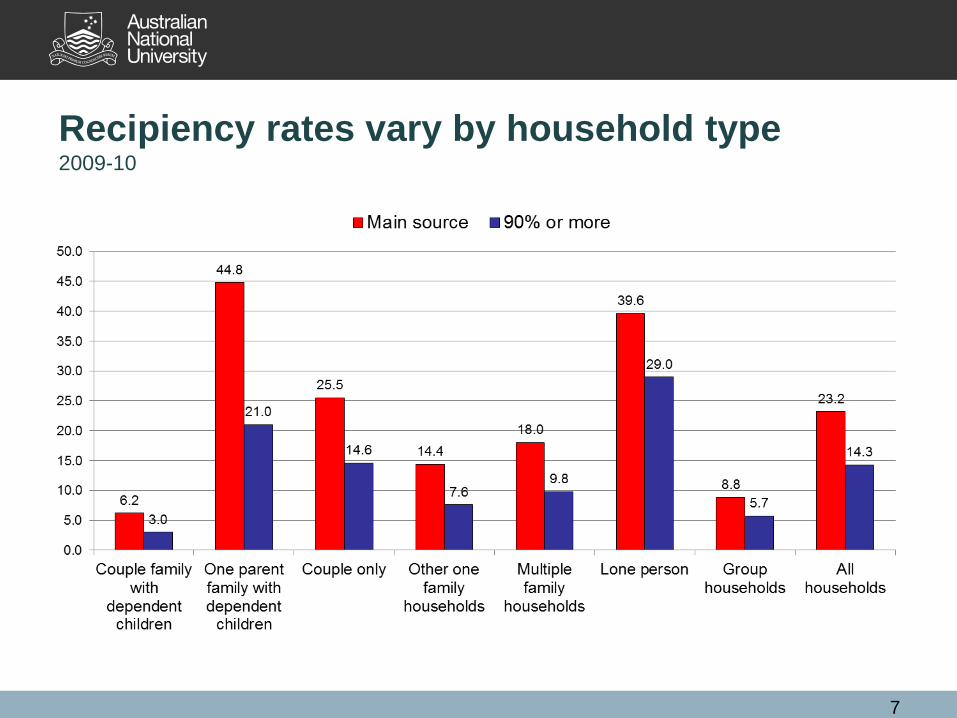
Recipiency rates vary by household type 2009-10
7

Recipiency rates vary by State 1996-97 to 2009-10
8

Per cent of working age population receiving
social security benefits, 1973 to 2011
9

Change in working age income support
recipients, 1996-97 to 2009-10 % of households with benefits as main income source by age group
20.5
17 17.6 18.2
38.1
20.9
9.5 12
9.4 10
17.4
11.8
15.5
11 13.6
10.8
22.7
14.4
0
5
10
15
20
25
30
35
40
45
15-24 25-34 35-44 45-54 55-64 Working age
1996-97 2007-08 2009-10

Welfare dynamics in Australia • The proportion of working age people receiving income support
at some time in the year fell from 37.1% in 2001 to 29.5% in
2008, rising to 32.8% in 2009.
• 65.7% of working age people lived in a household where
someone received welfare at some time between 2001 and
2009, with 11.4% receiving welfare payments for all 9 years.
• Those receiving 50% or more of their income from welfare fell
from 12.4 to 10.5% between 2001 and 2009. Around 23%
received more than half their income from welfare at some
stage, but 6.8% for 5 to 8 years and 3% for all 9 years.
• For those receiving more than 90% of their income from
welfare, annual receipt fell from 7.2 to 5.2%, with 15% of the
population being welfare reliant at some stage in the period
and 1.2% reliant for all 9 years.

International comparisons of benefit
recipiency
12

Australia relies on income-testing more
than any other OECD country % of GDP spent on income-tested benefits, mid-2000s
13

14
Australia has the most progressive benefit
system in the OECD Ratio of benefits received by poorest quintile to benefits received by
richest quintile, total population, mid 2000s
0
2
4
6
8
10
12
14

Net transfers to the poorest quintile are highest
in Ireland and Australia Transfers and taxes as per cent of market income of poorest quintile
15
-60%
-10%
40%
90%
140%
Benefits Taxes

Benefit receipt among people of working age,
selected OECD countries, 1999
All recipients as % of population of working age
16
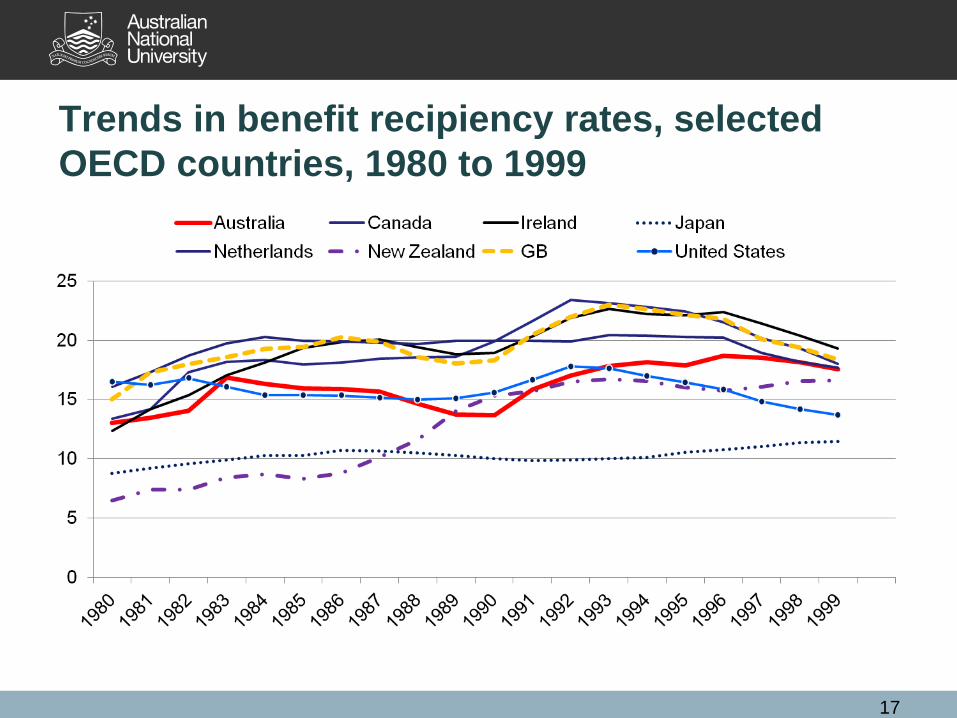
Trends in benefit recipiency rates, selected
OECD countries, 1980 to 1999
17

Australia and New Zealand – on similar paths?
% of working age population receiving
income support
% of working age population receiving
income support – 1996=100
18
50.0%
60.0%
70.0%
80.0%
90.0%
100.0%
110.0%
120.0%
NZ Australia
0%
5%
10%
15%
20%
25%
30%
New Zealand Australia

Australia and Great Britain– on
different paths? % of working age population receiving income support – 1999=100
19
50%
60%
70%
80%
90%
100%
110%
Great Britain Australia

Explanations for the rise and fall of
benefit recipiency
20

Explanations for the rise and fall of benefit
recipiency
• Labour market trends
• Demographic and family change
• Policy change
21

The role of labour market trends
• Unemployment was generally low from 1945 to the 1970s, mainly below
2% of the labour force and the average duration of unemployment was
around 6 weeks.
• Following the oil price shock of the 1970s unemployment doubled to 4.6%
between 1974 and 1975, and rose to over 6% in 1978.
• The recession of the 1980s saw a peak unemployment rate of 9.9% in
1983, followed by a decline but an increase from 5.7% to 11% between
1989 and 1993.
• Unemployment declined after 1998 so that by February 2008 it was 4% the
lowest level since 1974.
• Since the GFC, unemployment has increased – but by much less than in
the USA or Europe, and it currently remains around 5%.
• Australia now has the 6th lowest unemployment rate in the OECD.
22

How does Australia’s employment
performance compare? • In 2012 Australian employment rates overall are the 9th highest in the
OECD.
• In contrast, employment for youth (15 to 24 years), Australia is ranked 4th
highest among OECD countries.
• The level of part-time employment is the third highest in the OECD after the
Netherlands and Switzerland.
– Around 29 per cent of the workforce are employed part-time. Most part-
time workers are women — around 72 per cent. Around 46 per cent of
female employees and 15 per cent of male employees participate on a
part-time basis.
• Involuntary part-time employment – 7.2% of the labour force and 30% of
part-time workers is the highest in the OECD (2.9% is OECD average and
17% of PT workers).
• Employment rates among lone parents are among the lowest in the OECD.
• Total joblessness among families with children is among the highest in the
OECD – but may have improved in ranking terms.
23

Trends in the number (000s) of unemployed
and unemployment benefit recipients, 1978 to
2009
24
0
100
200
300
400
500
600
700
800
900
1000
Unemployed Recipients

Trends in underemployment, 1978 to 2012
25
0.0
2.0
4.0
6.0
8.0
10.0
12.0
Feb
-1978
De
c-1
978
Oct-
1979
Aug-1
980
Jun-1
981
Apr-
1982
Feb
-1983
De
c-1
983
Oct-
1984
Aug-1
985
Jun-1
986
Apr-
1987
Feb
-1988
De
c-1
988
Oct-
1989
Aug-1
990
Jun-1
991
Apr-
1992
Fe
b-1
993
De
c-1
993
Oct-
1994
Aug-1
995
Jun-1
996
Apr-
1997
Feb
-1998
De
c-1
998
Oct-
1999
Aug-2
000
Jun-2
001
Apr-
2002
Feb
-2003
De
c-2
003
Oct-
2004
Aug-2
005
Jun-2
006
Apr-
2007
Feb
-2008
De
c-2
008
Oct-
2009
Aug-2
010
Jun-2
011
Apr-
2012
Underemployment rate Males Underemployment rate Females
Underemployment rate Persons

Trends in the number (000s) of recipients of
Disability Support Pension and Unemployment
payments, 1981 to 2011
26
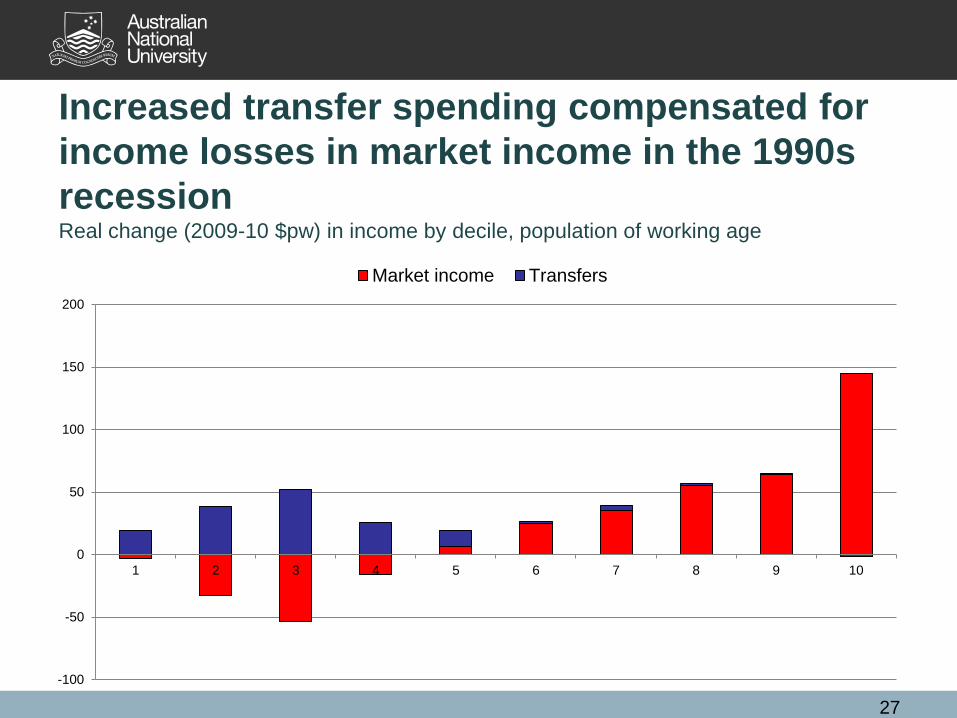
Increased transfer spending compensated for
income losses in market income in the 1990s
recession Real change (2009-10 $pw) in income by decile, population of working age
27
-100
-50
0
50
100
150
200
1 2 3 4 5 6 7 8 9 10
Market income Transfers
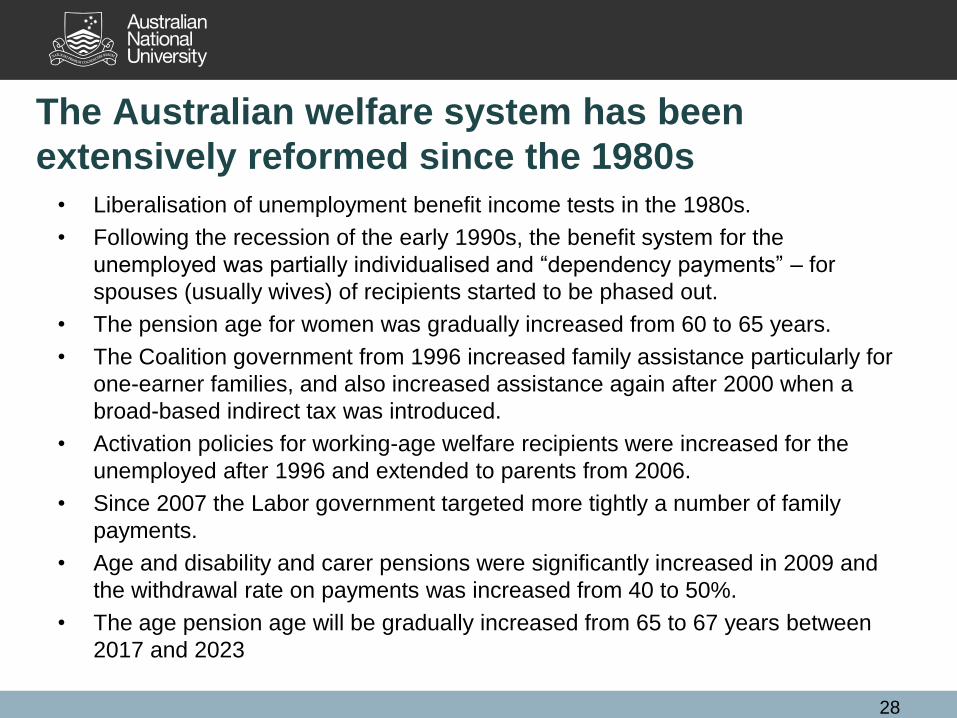
The Australian welfare system has been
extensively reformed since the 1980s • Liberalisation of unemployment benefit income tests in the 1980s.
• Following the recession of the early 1990s, the benefit system for the
unemployed was partially individualised and ―dependency payments‖ – for
spouses (usually wives) of recipients started to be phased out.
• The pension age for women was gradually increased from 60 to 65 years.
• The Coalition government from 1996 increased family assistance particularly for
one-earner families, and also increased assistance again after 2000 when a
broad-based indirect tax was introduced.
• Activation policies for working-age welfare recipients were increased for the
unemployed after 1996 and extended to parents from 2006.
• Since 2007 the Labor government targeted more tightly a number of family
payments.
• Age and disability and carer pensions were significantly increased in 2009 and
the withdrawal rate on payments was increased from 40 to 50%.
• The age pension age will be gradually increased from 65 to 67 years between
2017 and 2023
28

Changes to “dependency” payments
• Access to Widow B Pension was limited in 1987, and then closed to new
entrants in 1997.
• Wife Pension was closed to new entrants in 1995.
• Partner Allowance and Mature Age Allowance were both closed to new
claimants in 2003, and by 2008 there were no longer any recipients of
Mature Age Allowance.
• Since 2005, new grants of Widow Allowance have been limited to women
born on or before 1 July 1955.
• In combination with the partial individualisation of benefit payments, this has
significantly reduced the effect of assuming dependency within the
household.
29

Change in number of working age income
support recipients, 1996 to 2011
30
-300000
-200000
-100000
0
100000
200000
300000
400000

Which change is more important?
31

Two for the price of one?
• Work of Bob Gregory – ―Australian Welfare reform: Lessons I
have learnt? Shifting beliefs and discovery‖.
• Married men not directly affected by phasing out of
dependency payments, but their behaviour may change if
their partner cannot receive a payment.
• The ―cross gender effect‖ – gender substitution occurs when
both members of a married couple are affected by a policy
change that formally only applies to one.
• Was this reinforced by longer run changes in characteristics
of cohorts – rising educational attainment of men and women
and increasing participation of women?
32

Demographic influences – changes in cohort
size
• Since the 1970s there have been significant changes in family formation – lone parents as
a percentage of families with children have grown, while employment of partnered mothers
increased – leading to a polarisation of family economic circumstances
• Up until 1997, changes in cohort size tended to lower rates of DSP receipt; since 1997
population ageing has tended to increase numbers on DSP.
• Decomposition analysis of several other Commonwealth income support categories
identifies that population ageing up to the mid-1990s had very little effect on any payment
category other than Age Pension, and then only for females (Whiteford & Jackson 1998).
By contrast, in a manner almost identical to that for the DSP, population ageing, or more
accurately, changes in cohort size, has partially contained the demand for, or growth in,
spending on unemployment related allowances.
• Since the early 1980s changes in cohort size have had a small additive effect on the
numbers of females receiving the Supporting Parent/Sole Parent Pension, (SPP) the
reason being that the age group with the highest incidence of SPP receipt (30–39 year
olds) has also been the largest age group in the population because it contains the peak
baby boomers. In fact the age-effect is very small (in the late 1990s accounting for less
than 4 per cent of growth in numbers since 1975).
33

Rates of DSP receipt have fallen at older ages
for men and risen for women Men Women
34

Rising DSP receipt – population ageing and
policy change
• Disability and receipt of DSP are strongly age-related. In 2009, less than 2% of
people aged 16 to 29 received DSP, but this rises with age to 5% of people in their
40s, 9% of people in their 50s and over 14% of people aged 60 to 64 years.
Disability rises further with increasing age over 65 years, but after 65 most people are
entitled to an Age Pension and DSP is currently no longer relevant.
• The age structure of the Australian population has changed significantly in the last 15
years. This is an effect of the ageing of the baby boom generation, conventionally
dated to those born between 1946 and the early to middle-1960s. By definition,
people born in 1946 started to turn 50 years of age in 1996, so in contrast with the
earlier period, changes in the age structure of the population became likely to
increase levels of receipt of DSP after the middle of the 1990s.
• Between 1996 and 2009 the proportion of people of working age receiving DSP rose
from 4.3% to 5.1%. If the age-structure of the population was held constant at 1996
shares, then rather than there being 5.1% of the population receiving DSP there
would be 4.7%. This means that about half of the total increase in numbers can be
viewed as the result of population ageing and may in itself be unrelated to any
changes in the labour market, the incidence of disability or individual behaviour.
35

Rising DSP receipt – population ageing and
policy change
• For women, age-specific rates have increased at virtually all age groups (converging
towards those of men), but after the age of 50 years they have increased more
significantly, most strongly for women aged 63 years, where the increase has been
16 percentage points.
• Overall, women aged 60 to 64 years are the fastest growing group of DSP recipients
and DSP recipients are now close to 30% of all the women in this age group receiving
social security benefits, whereas in 1996 they accounted for only 1.4% of all welfare
recipients in this age group.
• But while receipt of DSP in this group has ―skyrocketed‖, total welfare receipt has
plummeted: in 1996 68% of women aged 60 to 64 years were receiving a social
welfare payment, while in 2009 this had fallen to 39%.
• So welfare recipiency for this group has actually fallen significantly – it’s just that
more of this (smaller) group are now on DSP.
36

Unanswered questions?
• This discussion has been largely descriptive – more formal research
using administrative panels and HILDA as well as demographic
methods will throw further light on welfare recipiency trends.
• We also need analysis to determine outcomes of welfare reforms –
to what extent are former recipients better-off financially and in
broader wellbeing terms and what happens to those remaining on
benefits? Do some people ―drop out‖ of the system and what does
this mean?
• What factors are important for very long-term welfare receipt? Is
receipt transmitted between parents and children?
• International comparisons may throw further light on causal factors.
• To what extent was the timing of reforms fortuitous – are these
reforms able to be replicated elsewhere or in the future?
37

Future challenges
• While reduced, a significant proportion of the working age population
continue to rely mainly on benefits for their incomes – it is desirable for
equity reasons and sustainability to reduce this, but we should also be
concerned that further reforms really do improve equity in outcomes.
• Australia – so far – seems to have escaped a major economic downturn
from the ―Great Recession‖. This is a very major advantage in facing future
challenges.
• Population ageing will soon start to have a much more significant impact on
the costs of the system.
• There are significant unmet needs – with proposed reforms to introduce
greater funding for disability services, for aged care and nursing homes, for
dental care and to improve equity in the education system.
• Indexation provisions for unemployment benefits are inadequate.
38