the review of economics and statistics - dartmouth …dcomin/files/lobbies.pdffaces when raising...
TRANSCRIPT

The Review of Economics and StatisticsVOL. XCI NUMBER 2MAY 2009
LOBBIES AND TECHNOLOGY DIFFUSION
Diego Comin and Bart Hobijn*
Abstract—This paper explores whether lobbies slow down technologydiffusion. To answer this question, we exploit the differential effect ofvarious institutional attributes that should affect the costs of erectingbarriers when the new technology has a technologically close predecessorbut not otherwise. We implement this test using a data set that covers thediffusion of twenty technologies for 23 countries over the past twocenturies. We find that each of the relevant institutional variables thataffect the costs of erecting barriers has a significantly larger effect on thediffusion of technologies with a competing predecessor technology thanwhen no such technology exists. These effects are quantitatively impor-tant. Thus, we conclude that lobbies are an important barrier to technologyadoption and to development.
I. Introduction
CROSS-COUNTRY differences in the degree of adop-tion of technologies are enormous (Comin, Hobijn, &
Rovito, 2006). They are so large that they have been pointedto as the main factor causing the large cross-country differ-ences in income per capita (Hsieh & Klenow, 2003, forexample). The fundamental question for growth theorists iswhat frictions generate these cross-country differences intechnology adoption. In this paper we assess the role of onesuch friction on the adoption of new technologies. Namely,the political barriers erected as a result of the lobbyingefforts of the producers of incumbent technologies.
Political barriers have long been believed to be an im-portant deterrent to technology diffusion.1 Until now, how-ever, this belief has only been founded in a few anecdotes.2
The lack of a systematic effort to prove this belief is theconsequence of three difficulties. First, it is very hard toobtain direct measures of political barriers. Second, indirectmeasures of barriers are problematic because they typicallyare endogenous. Third, to explore the effects of lobbies on
technology adoption, it is necessary to have a comprehen-sive data set on technology adoption, which, until recently,did not exist.
In this paper, we overcome these difficulties by using anew data set that we compiled and a new identificationstrategy. Our Historical Cross-Country Technology Adop-tion data set contains historical data on the adoption oftwenty major technologies (such as railroads, telephones,and computers) over the last 215 years for 23 of the world’sleading industrial economies.
Our identification strategy hinges on two arguments.First, as shown both theoretically (Myerson, 1993; Fere-john, 1986; Persson, Roland, & Tabellini, 2000) and empir-ically (Kunicova & Rose-Ackerman, 2002; Persson, Tabel-lini, & Trebbi, 2003; Besley & Case, 1995), certaininstitutional attributes affect the political cost the legislaturefaces when raising barriers to the diffusion of a new tech-nology. In particular, the cost lobbies must incur to inducelegislators to raise diffusion barriers are higher when legis-lators are not independent, the judicial system is effective,and the regime is democratic and nonmilitary.
Second, the benefits old technology producers enjoy fromraising barriers against the diffusion of a new technologydepend on certain attributes of the new and old technolo-gies. Some new technologies are so superior to the oldtechnology that, even with political barriers, consumersprefer the new technology to the old one, so old technologyproducers receive no benefit from lobbying for barriers. Inthese cases, the new technology will diffuse quickly regard-less of the institutional environment and the associated costsof lobbying.
In other cases, however, the productivity differentialbetween the old and new technologies is relatively small,and old technology producers may be able to use politicalbarriers to convince consumers to use their technology.Then, the old producers’ ability to raise barriers and slowthe diffusion of the new technology depends on the cost ofinducing the legislative authority to heavily regulate thenew technology’s production. When the cost of raisingbarriers is low, the legislative authority accepts the oldtechnology’s lobbying bribes and raises barriers that slowdown the diffusion of the new technology. Conversely,when the legislative authority faces a large cost of passingregulations, barriers are not raised, and new technologiesdiffuse quickly.
Received for publication May 22, 2007. Revision accepted for publica-tion December 6, 2007.
* Harvard University and NBER; Federal Reserve Bank of New York.We appreciate the superb research assistance of Erick Gong, Kristy
Mayer, and Bess Rabin. The paper has benefited from the comments oftwo anonymous referees, Daron Acemoglu (the editor), Philippe Aghion,Manuel Amador, Heski Bar-Isaac, Roland Benabou, Mark Doms, Cathe-rine Haffer, Mike Kremer, David Laibson, John Leahy, Adam Przeworski,Jim Robinson, Paul Romer, Gilles Saint-Paul, Betsy Stevenson, XavierTafunell, Romain Wacziarg, Richard Zeckhauser, and seminar participantsat Harvard, San Francisco Fed, Stanford Business School, Harvard Busi-ness School, the Richmond Fed, the NBER Summer Institute, and NYU.Comin thanks financial assistance from the NSF and the C.V. Starr Centerfor Applied Economics. The views expressed in this paper solely reflectthose of the authors and not necessarily those of the Federal Reserve Bankof New York, nor those of the Federal Reserve System as a whole.
1 For example, Olson (1984) and Parente and Prescott (2000).2 See Mokyr (1990) for examples.
The Review of Economics and Statistics, May 2009, 91(2): 229–244

It follows that, if lobbies are a relevant concern, the speedof diffusion of new technologies with technologically closepredecessors will be affected by the institutional attributesthat affect the political cost of erecting barriers. Theseinstitutional attributes should have no effect, however, onthe diffusion of technologies without technologically closepredecessors. This differential effect of institutions on thediffusion of technologies with different kinds of predeces-sors is the basis for our identification strategy of the effectof lobbies on the speed of diffusion of technologies.3
Our analysis suggests a significant negative effect oflobbying on technology diffusion. In particular, we find that,in countries where the legislative authorities have moreflexibility, the judicial system is not effective, the regime isnot very democratic, or there is a military regime, newtechnologies with technologically close predecessors dif-fuse more slowly than technologies without such predeces-sor technologies. These results are robust to controlling forhuman capital, GDP per capita, electricity production, geo-graphical variables, differential effect of controls for eachgroup, country fixed effects, and country fixed effects inter-acted with the technology classification. Further, our resultsare not only significant, but also quantitatively important tounderstanding technology diffusion. In particular, the insti-tutional variables interacted with the technology classifica-tion generate 50% of the variance in technology diffusion.
Our empirical approach avoids traditional identificationproblems. First, it focuses on the details of the mechanismby which lobbying affects technology diffusion, thus pro-viding a stronger test of causality. Second, as shown insection III C, while it may be relatively easy to think ofomitted correlates of the institutional variables that mayhave an independent effect on the diffusion of technologies,it is much less easy to find reasons why these correlatesshould have an effect on the group of technologies with apredecessor technology above and beyond the effect theyhave on the technologies without one. Similar argumentsalso apply to the reverse causality interpretation of ourresults.
Finally, by showing that institutions affect the speed ofdiffusion of technologies through their effect on lobbying,we make a contribution to the literature on development andinstitutions. Contrary to existing approaches, we do not relyon instrumental variables. Our approach consists in focus-ing on one particular mechanism by which institutions mayaffect growth (that is, technology diffusion). This allows usto use multiple left-hand-side variables and have much morevariation which allows us to identify the effect of specificinstitutional traits.
II. The Model
Production: Output (Y) is produced competitively usingone of two technologies: the old (o) and the new (n). Moreformally, output is given by
Y � max�xo�,dxn
��,
where d is the relative productivity of the new technologyand xo and xn denote the number of units of old and newtechnology intermediate good used, respectively. Each in-termediate good is produced by one producer. The marginalcost of production is equal to a� for both old and newtechnologies. At some point (made precise below), theproducer of the new technology intermediate good learnshow to produce it efficiently, and the marginal cost ofproduction for the new technology intermediate good be-comes a � a� .4 Intermediate good producers may also maketransfers to the legislative authority in exchange for regu-lations that affect the marginal cost of producing the newintermediate good.
Institutions: The legislative authority (L) determinesthe level of regulation (�) the producer of new technologygoods faces. There are two possible levels of regulation.5
Heavy regulation increases the marginal cost of producingnew intermediate goods by ��, while no regulation (that is,� � 0) leaves the marginal cost of new intermediate goodsunchanged. The per-period payoff of the legislative institu-tion is equal to the sum of three terms: a private value ofbeing in power (b), the contributions received (C) minus thecosts of bending the political constraints imposed by otherinstitutions (S). The cost of passing regulations depend onthe actions taken by L and on the institutional setting (thatis, S(�,r)). It is costless for L to set � � 0 (that is, S(0) � 0).The cost of implementing �� declines with L’s independenceand is also lower in military and/or nondemocratic regimesthan in democratic regimes.
Timing: Without loss of generality, we consider a three-period economy. The old technology intermediate good arrivesin period 1. The old technology intermediate good is producedand the producer decides whether to make a conditional con-tribution to the legislative authority. L decides whether toregulate the production of new technology intermediate goodsin period 2. At the beginning of period 2, the new technologyarrives. Period 2 is symmetric to period 1, with the onlydifference that now production and contributions can be un-dertaken by both the old and new technology producers. At thebeginning of period 3, the marginal cost of producing new
3 Rajan and Zingales (1998) use a similar strategy to identify the effectof capital markets development on economic development. One importantmethodological difference, though, is that while they have various mea-sures of capital market development (the exogenous variable in their test),we do not have any direct measure of lobbying intensity.
4 All costs are indexed in terms of output, which is taken as thenumeraire.
5 The feasibility of only two tax rates may be completely general if, asin Acemoglu and Robinson (2000a), there is an informal sector whereproducers can avoid the sales taxes but operate at lower productivity. ��would then be the rate that makes the producer indifferent betweenoperating in the two sectors.
THE REVIEW OF ECONOMICS AND STATISTICS230

technology intermediate goods declines to a. Otherwise, period3 is identical to period 2.
Analysis: Each period, the final output producer selectsthe technology that yields higher profits. Let �(x) denote theprofits of the output producer when using technology x. Therelative profit ratio is then defined as
��n
��o� �d�po
pn��� 1/�1a
,
where po and pn denote, respectively, the prices of the oldand new intermediate good. Therefore, the final output
producer uses the new technology if d �po
pn�a
� 1. If instead,
d �po
pn��
� 1, he uses the old technology. This decision
rule introduces Bertrand competition between the old andnew intermediate good producers. The result of this com-petition is that the producer that supplies the intermediategoods charges a price equal to the minimum between themonopolist price and the marginal cost of production of theother producer (when he is around).
Empirically, political barriers do not stop new technolo-gies from diffusing forever. We ensure this occurs in themodel by assuming the following throughout:
Condition 1. d� a�
a � ����
� 1.
Condition 1 implies that, if both intermediate good pro-ducers charge their marginal cost of production in period 3,the final output producer uses the new technology even inthe presence of heavy regulations on the production of newintermediate goods. Given this outcome at period 3, we canproceed solving for the political contributions each producermakes using backwards induction.
In period 3, intermediate good producers make no con-tribution to L because the game finishes in that period. Inaddition, nobody will make contributions in period 2 be-cause the outcome in the next period—that the new tech-nology is demanded—occurs regardless of the contributionsmade.
The technology demanded at time 2 depends on thetechnological distance between the new and the old tech-nology, d, and on whether, at period 1, the old technologyproducer can induce L to set � � �� for period 2. In particular,if d is sufficiently large, �(n)/�(o) is larger than 1 even inthe presence of barriers to the diffusion of the new technol-ogy. In this event, the new technology diffuses upon arrival.The following condition and proposition 1 formalize thisintuition.
Condition 2. d� a�
a� � ����
� 1
Proposition 1. If condition 2 holds, new technologiesdiffuse immediately regardless of the institutional setting.
Alternatively, if condition 2 does not hold (that is, thenew technology is not sufficiently superior to the old one),the final output producer may demand the old technology inthe presence of diffusion barriers. This alone, however, isnot sufficient to slow the diffusion of the new technology.The old technology lobby must also induce L, at t � 1, topass heavy regulations.
L’s payoff if he does not regulate is 0. Regulating heavilyyields L a payoff of C(��) S(��, r), where C(��) is theconditional contribution made by the producer of the oldtechnology intermediate good if � � ��. Therefore, L sets � ��� at time 1 if and only if
C��� � S��� ,r. (1)
Is it feasible for the old technology producer to makesuch a contribution to L? The most he is willing to contrib-ute to induce heavy regulations are the profits to be made attime 2, since at time 3 the new technology diffuses. If theold technology producer supplies intermediate goods at time2, he sets a price po2 given by the following expression:
po2 � min��a� � ��d1/�, a� /��.
The first term in po2 is the price that makes the finaloutput producer indifferent between using the new and theold technology. Whenever this constraint is not binding, theold technology producer will set the monopolistic price,a� /�.
Given this optimal pricing rule, the profits accrued by theold technology producer in period 2 are
�o2 � � po2 � a� ��/po21/�1�.
Condition 3 and proposition 2 characterize the environ-ment in which the new technology diffuses slowly.
Condition 3. �o2 � � po2 � a� ��/po21/�1� � S��� .
Proposition 2. If condition 2 does not hold and condition3 holds, new technologies diffuse slowly (that is, they diffusein period 3).
Intuitively, since only the old technology producer isaround at t � 1, it can take advantage of this incumbency tobribe L to raise barriers to the adoption of the new technol-ogy when it arrives at period 2. Condition 3 ensures thefeasibility of inducing L to regulate. Since condition 2 doesnot hold, the final output producer prefers the old technol-ogy when the new technology is regulated, and therefore theold technology producer keeps the market in period 2.6
6 One interesting issue is whether it is possible for the new technologyproducer to compensate the old technology producer in exchange for notinducing L to raise barriers against the diffusion of the new technology.This arrangement would increase social welfare, but would be hard to
LOBBIES AND TECHNOLOGY DIFFUSION 231

Identification: Propositions 1 and 2 yield exclusion re-strictions that allow us to identify the importance of lobby-ing for technology diffusion. For expositional purposes,these are plotted in figures 1 and 2. Figure 1 represents thespeed of diffusion of technology as a function of S and d.When d is large, the new technology diffuses fast regardlessof S and the institutions that determine it. When d is small,however, new technologies diffuse fast only if the institu-tions are such that the cost of raising barriers, S, is large.Otherwise, they shall diffuse slowly. Hence, we can identifythe effect of lobbying on technology diffusion by estimatingthe differential effect of the institutional attributes that affectthe cost of raising barriers on the diffusion of technologieswith technologically close predecessor technologies (low d)versus those without (high d).
This argument is done for a given �o2. Figure 2 shows that,as we increase the elasticity of demand, �, the rents that the oldtechnology producer is willing to invest in lobbying decline,and the region of the (d,S) space where there is slow diffusionshrinks. Further, as � tends to 1 this region disappears. Thisprovides us with a second identification scheme. Namely, wecan infer the effect of lobbies on technology diffusion byestimating the differential effect of the institutional attributesthat affect the cost of raising barriers on the diffusion oftechnologies with technologically close predecessor technolo-gies and high � versus the rest.
Tirole (1988) and Aghion and Howitt (1998) relate � tothe size of the sunk costs, F, necessary for a producer (in thiscase, of the old technology) to begin operating. Intuitively,a higher F reduces the number of old technology producersand, therefore, the elasticity of substitution between differ-ent intermediate goods associated with the old technology.Hence, a higher sunk cost, F, is equivalent to a smaller �.
Since it is easier to measure the size of sunk costs ofhistorical technologies than their demand elasticity, we willtake advantage of this theoretical work in our empiricalimplementation.
III. Empirical Exploration
In this section we describe the data used in the empiricalanalysis. Then we present the econometric implementationof our identification strategy. Finally, we present the esti-mates of the effect of lobbies on technology diffusion andargue in favor of the causal interpretation of the estimates.
A. Data
Technologies: The technology diffusion measures comefrom our Historical Cross-Country Technology Adoption(HCCTA) data set introduced in Comin and Hobijn (2004).This data set contains historical data on the adoption oftwenty major technologies over the last 215 years for 23 ofthe world’s leading industrial economies.7 Column 1 oftable 1 lists the technologies we use and how we measurethem. Our technologies cover seven sectors of economicactivity.8 Because of data availability constraints, we usedifferent measures for different technologies. Some technol-ogies are measured as the share of capital that embodies thenew technology (such as fraction of ring spindles). Otherproduction technologies are measured either by the numberof equipment units of the technology (such as robots) scaledby real GDP or by the output produced with the technology(such as tons of Bessemer steel) over real GDP. Finally,consumption technologies are scaled by population ratherthan by real GDP.9
Since we are interested in understanding the determinantsof the speed of diffusion of new technologies along thetransition path, for each technology we censor the data at acertain year determined by one of two criteria: the distribu-tion of the level of technologies across countries becomesstable; for technologies that become dominated by evennewer technologies, it corresponds to the year in which thelevel of technology starts declining. In either case, thetruncation of the sample for a given technology is the samefor all countries.
Classifications: We classify technologies according totwo criteria. First we classify them according to whetherthey have a previous competing technology. There are twosenses in which a new technology may be very superior tothe existing technologies, and thus not have a previous
enforce. For a discussion of some of the difficulties in enforcing this kindof contract, see Comin and Hobijn (2005).
7 Australia, Austria, Belgium, Canada, Denmark, Finland, France, Ger-many, Greece, Iceland, Ireland, Italy, Japan, Luxembourg, Netherlands,New Zealand, Norway, Portugal, Spain, Sweden, Switzerland, UnitedKingdom, United States.
8 Textiles, steel, telecommunication, mass communication, informationtechnology, transportation (rail, road, and airways), and shipping.
9 Our findings are robust to scaling all technology adoption measures bypopulation rather than scaling some by population and others by GDP.
FIGURE 1.—SPEED OF DIFFUSION
),( γτS
Fast diffusion
Slow diffusion
[ ]αα a)/a( τ+ [ ]αa)/a( τ+ d
THE REVIEW OF ECONOMICS AND STATISTICS232

competing technology. In a vertical sense, a new technologydoes not have a competing technology if it can conduct thesame tasks as the previous technology, but much moreefficiently. In a horizontal sense, a new technology does nothave a previous competing technology if it can performimportant tasks that were previously unfeasible.
Measuring these relative productivities is not trivial forvarious reasons. First, the relative productivity of newtechnologies typically varies over time. Our measurementscorrespond to the relative productivities over a relativelyshort period (always less than thirty years) after the newtechnology is invented. Second, the relative productivity ofthe new technology may vary across countries and/or acrossactivities (typing versus computing for PCs) or across routes(for transportation technologies). Of course, it is virtuallyimpossible to take all these dimensions into account. How-ever, we believe our classification is robust since the distri-bution of observed relative productivities can be approxi-mated accurately by a bimodal distribution.10 Appendix Aand Comin and Hobijn (2005) discuss the relative produc-tivities estimates for the various technologies and the refer-ences in more detail. Table 1 describes the technologypredecessors (column 2), the estimates of vertical distance(column 3), and the horizontal innovations introduced bythe technology (column 4).
Six of our technologies—Bessemer steel, electric arcsteel, telegraphs, railroads, PCs, and robots—were signifi-cantly more productive than their predecessor technologies.
Column 5 of table 1 contains the classification according toproductivity distance. For the rest of the technologies in oursample, the technological distance with their predecessors,though still significant, was relatively small. Freight trains,TVs, and radios deserve some remarks. The introduction offreight trains increased the speed of cargo transportation bya factor of 2 or 3 with respect to canal transportation. Hence,whenever canals were available, cargo trains did not con-stitute a radical improvement in transportation. However, incountries without navigable rivers their impact was verybig. Experiments have shown that advertisement recall ratesare not higher for radios or TVs than for newspapers.However, the two brought image and sound to the media,and these are important horizontal improvements overnewspapers and magazines. In our analysis, we will exper-iment by classifying radios and TVs as both revolutionaryand nonrevolutionary technologies.
The second scheme by which we classify technologiesrecognizes the difficulty of lobbying when the production ofthe old technology is dispersed. As a result, a technologyhas a competing concentrated predecessor if (i) the produc-tion of the previous technology requires large sunk costsand (ii) the productivity gap between new and old technol-ogy is small. Our research, described in appendix B, showslarge sunk costs were required to begin producing Bessemerand open hearth steel; to install telegraphs and telephonelines; to construct canals, railroads, and trains; and to beginproducing cars, trucks, and sail ships. Note that, based onour first classification, the productivity gap between theseand the subsequent technologies was not very large. There-fore, as listed in column 6 of table 1, the technologies withcompeting and concentrated predecessor technologies areopen hearth and blast oxygen steel, telephones, mobile
10 We have checked the robustness of our results in two directions. First,we have experimented with alternative classifications that are flexible withthe few technologies that are closer to the cutoff between the two groups.Second, we have eliminated one by one the technologies to make sure thatthe results were not driven by any single technology.
FIGURE 2.—SPEED OF DIFFUSION
LOBBIES AND TECHNOLOGY DIFFUSION 233

phones, trucks, cars, planes, steam and motor ships, andcargo transportation by train wherever canals were avail-able. The predecessors to all the other technologies in oursample either lag very much behind the productivity of thenew technology or their production required much smallersunk costs than the technologies just listed. Therefore, ringspindles, radios, and TVs—which, according to the firstclassification were classified as having a competing prede-cessor—are now classified as not having a concentrated,competing predecessor.11
Institutions: The political-economy literature has iden-tified four institutional traits that increase the cost of raisingpolitical barriers. These are the lack of independence oflegislators when passing laws,12 the effectiveness of thejudicial system,13 the degree of democracy,14 and the ab-
sence of a military regime. The measures of legislativeindependence and of the existence of a military regimecome from Cross-National Time-Series Data Archive (alsoknown as the Banks data set). The degree of democracycomes from Polity IV and the effectiveness of the judiciarycomes from the Business International Corporation as in LaPorta et al. (1998).15
For all the variables used in our analysis, we computefive-year averages and use nonoverlapping data in our regres-sions. Taking these five-year averages increases the signal-to-noise ratio of our variables and, a priori, does not reduce muchof the relevant variation in the data since both technologydiffusion and institutional change are relatively low-frequencyphenomena. Next we implement our identification strategy,present our estimates, and discuss their interpretation.
B. Results
Our baseline regression has the following form:
yict � �0c � �Dit � �1Xct � �2Rct � �3�Ii � Rct(2)
� εict.
11 By construction, the two classifications of technologies are correlated.Since the correlation between these classifications is less than perfect(about 75%), however, this duality provides us with a second identifica-tion scheme to estimate the effect of lobbies on the diffusion of newtechnologies.
12 Independent legislators do not have to respond to superior entities fortheir laws.
13 The probability of a judicial sentence when accepting conditionalcontributions increases with the effectiveness of the judiciary.
14 Work by Myerson (1993), Ferejohn (1986), Persson, Roland, andTabellini (2000), Adsera, Boix, and Payne (2003), Persson and Tabellini(2000, ch. 9), Lijphart (1994, 1999), Powell (2000), Kunicova andRose-Ackerman (2002), Persson, Tabellini, and Trebbi (2003), and Besleyand Case (1995) has shown that electoral pressure aligns officials’ incen-
tives with public interest, which consists of not slowing down thediffusion of new technologies.
15 See Comin and Hobijn (2005) for more information on these variablesand for more detail on the arguments about how these traits affect the costof raising barriers.
TABLE 1.—TECHNOLOGIES AND CLASSIFICATIONS
TechnologiesPredecessorTechnology
Technology DistanceCompeting
Concen.
Vertical (Factor ofIncrement) Horizontal Pred.
Comp.Pred.
1. Fraction of ring spindles Mule spindles �1 (s) Yes No2. Tons of steel produced with Bessemer over GDP Crucible steel �500,000 (p) No No3. Tons of steel produced with open hearth over GDP Bessemer �2.5 (p) Yes Yes4. Tons of steel produced with blast oxygen over GDP Open hearth 2.5 (p) Yes Yes
5. Tons of steel produced with electric arc over GDPProduces
stainless steel No No6. (Log.) Telegrams per capita Mail �3,000 (s), �100 (c) No No7. (Log.) Telephones per capita Telegrams 3 (s) Yes Yes8. (Log.) Mobile phones per capita Telephone 1.33 (p) Yes Yes9. (Log.) Newspapers per capita No No
10. (Log.) Radios per capita Newspapers �1 (r) Transmits sound Yes No11. (Log.) TVs per capita Radio 1.3 (r) Transmits image Yes No
12. (Log.) Personal computers per capita
Typewriters/calculators/mainframes
Fast complexcomputations No No
13. (Log.) Industrial robots over GDP Manual labor �6.6 (p)Flexible
manufacturing No No
14. (Log.) Freight traffic on railways (TKMs) over GDP* Canals/wagons�5 (s), 2 (p with
respect to canals) Yes/No Yes/No15. (Log.) Passenger traffic on railways (PKMs) over GDP Horse transportation 10 (s) No No
16. (Log.) Trucks per unit of real GDP Railways�1 (s), 1.2 (c in
short distances) Yes Yes17. (Log.) Passenger cars over GDP Railways �1 (s) Yes Yes18. (Log.) Aviation cargo (TKMs) over GDP Trucks/railways �4 (s) Yes Yes19. (Log.) Aviation passengers (PKMs) per capita Cars/railways �4 (s) Yes Yes20. Share of steam and motor ships in merchant fleet tonnage Sail ships 1.2 (s) Yes Yes
*Yes, where canals are available. No, otherwise.Legend of vertical measures: (s) speed, (p) productivity, (c) cost, (r) recall rates.
THE REVIEW OF ECONOMICS AND STATISTICS234

yict denotes our measure of the adoption of technology i incountry c at time t. �0c is a country-specific constant thatcaptures other country-specific attributes that may affecttechnology diffusion.16
As explained above, we measure different technologiesusing different units. Further, as shown in Comin et al.(2006), technologies follow different diffusion paths. Tocontrol for these differences in diffusion across technologieswe always include a full set of time- and technology-specific fixed effects denoted by Dit in our regressions. Thisimplies that, effectively, our dependent variable is the de-viation of the adoption level of each technology i in countryc at time t from the average adoption level in the technologyand period across countries. Xct is a set of conventionalcontrols that have been highlighted in the technology dif-fusion literature. This vector includes the level of incomeper capita, various measures of educational enrollment,17
and the adoption of complementary technologies capturedby the production of electricity over real GDP. Rct repre-
sents the set of institutional variables that affect the cost oflobbying. These are legislative flexibility, effectiveness ofthe judiciary, the democracy index, and the military regimedummy. Ii � Rct interacts the institutional variables (Rct)with either a dummy variable for the technologies that have acompeting predecessor technology or a dummy for the tech-nologies with concentrated and competing predecessors (Ii).
3 is the critical vector of coefficients for the identifica-tion of the role of lobbying activity on technology diffusion.Specifically, if lobbies slow down the diffusion of newtechnologies, we should observe that the effect of institu-tions that increase the cost of lobbying on technologydiffusion is larger for technologies with a competing incum-bent technology than for technologies without one. Thisimplies that 3 should be positive for institutional variablesthat increase the cost of lobbying—such as the degree ofdemocracy—and negative for variables that decrease thecost of lobbying—such as the independence of the legisla-ture and the military regime dummy.
Table 2 reports the first set of coefficient estimates fromregression (2) which only explore the interactions with thecompeting predecessor technology dummy. Each columncorresponds to a different regression. Column 1 correspondsto a basic regression with only the vector Xct as a regressor.There we can observe that income per capita, the primary
16 In Comin and Hobijn (2005) we do not include a country fixed effectin the baseline specification. This allows us to exploit the efficiency of thejudiciary (which only has cross-country variation) in our identificationscheme.
17 The enrollment rates in primary and secondary schooling before 1970are computed by us; for the years after 1970 they are computed by theWorld Bank.
TABLE 2.—EFFECT OF LOBBYING ON TECHNOLOGIES WITH COMPETING PREDECESSOR (DEPENDENT VARIABLE: TECHNOLOGY DIFFUSION (yict))
Variable I II III IV V
Controls (Xct)ln(GDP/pop) 1.12 1.21 1.20 1.19 1.18
(8.83) (8.88) (8.77) (8.74) (8.52)Prim. enr. before 1970 0.91 1.04 1.09 1.09 1.09
(3.84) (4.01) (4.12) (4.14) (4.13)Sec. enr. before 1970 0.29 0.09 0.08 0.09 0.10
(1.58) (0.45) (0.40) (0.45) (0.48)Prim. enr. after 1970 0.37 0.66 0.62 0.61 0.65
(0.67) (0.81) (0.88) (0.87) (0.92)Sec. enr. after 1970 0.73 0.82 0.86 0.87 0.86
(2.47) (2.65) (2.78) (2.82) (2.77)ln(electricity production) 0.18 0.16 0.17 0.17 0.16
(2.95) (2.59) (2.74) (2.68) (2.57)Institutions
Democracy 0.06 0.07 0.09 0.08(3.53) (3.73) (3.36) (2.60)
Military regime 0.16 0.11 0.24(0.92) (0.66) (1.34)
Legislative flexibility 0.04 0.12(0.47) (1.10)
Judicial effectiveness 0.11(1.54)
Institut. � incumb. tech.Democracy � incumb. tech. 0.10 0.09 0.15 0.12
(7.85) (7.54) (4.68) (3.47)Mil. reg. � incumb. tech. 0.65 0.77 1.00
(2.47) (2.86) (3.41)Legislat. flex. � incumb. tech. 0.21 0.33
(2.05) (2.68)Judicial. eff. � incumb. tech. 0.07
(2.10)No. of obs. 2,648 2,452 2,452 2,452 2,452R2 (within) 0.29 0.27 0.27 0.27 0.27
Note: t-statistics in parentheses computed using robust standard errors.All regressions include a full set of technology-year fixed effects and country fixed effects.
LOBBIES AND TECHNOLOGY DIFFUSION 235
enrollment, and the intensity of electricity production arepositively associated with the level of technology diffusion.The positive coefficient for enrollment, however, only holdsfor enrollment before 1970.
Rather than including the three institutional variables in Rct
and the associated interactions with the competing predecessortechnology dummy, Ii � Rct, at once, we find it instructive tointroduce them sequentially. Since the comparative statics thatmotivate the identification strategy are valid keeping every-thing else constant, we delay the interpretation of the resultsuntil the column that includes all four institutional traits.
Column 2 starts with democracy. Democracy is associ-ated with a lower diffusion of new technologies. Thisobservation is orthogonal to our test. The relevant findingfor our test is that democracy has a significantly larger (inother words, more positive) effect on the diffusion of thosetechnologies with a close predecessor technology.
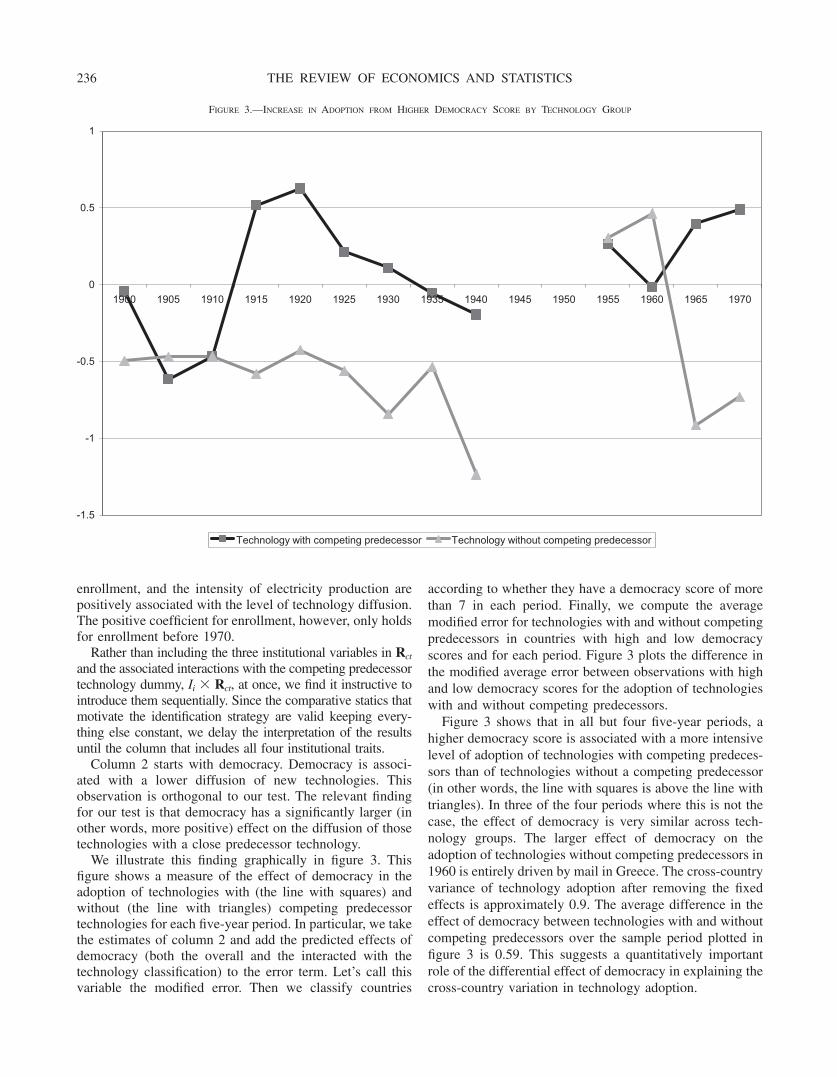
We illustrate this finding graphically in figure 3. Thisfigure shows a measure of the effect of democracy in theadoption of technologies with (the line with squares) andwithout (the line with triangles) competing predecessortechnologies for each five-year period. In particular, we takethe estimates of column 2 and add the predicted effects ofdemocracy (both the overall and the interacted with thetechnology classification) to the error term. Let’s call thisvariable the modified error. Then we classify countries
according to whether they have a democracy score of morethan 7 in each period. Finally, we compute the averagemodified error for technologies with and without competingpredecessors in countries with high and low democracyscores and for each period. Figure 3 plots the difference inthe modified average error between observations with highand low democracy scores for the adoption of technologieswith and without competing predecessors.
Figure 3 shows that in all but four five-year periods, ahigher democracy score is associated with a more intensivelevel of adoption of technologies with competing predeces-sors than of technologies without a competing predecessor(in other words, the line with squares is above the line withtriangles). In three of the four periods where this is not thecase, the effect of democracy is very similar across tech-nology groups. The larger effect of democracy on theadoption of technologies without competing predecessors in1960 is entirely driven by mail in Greece. The cross-countryvariance of technology adoption after removing the fixedeffects is approximately 0.9. The average difference in theeffect of democracy between technologies with and withoutcompeting predecessors over the sample period plotted infigure 3 is 0.59. This suggests a quantitatively importantrole of the differential effect of democracy in explaining thecross-country variation in technology adoption.
FIGURE 3.—INCREASE IN ADOPTION FROM HIGHER DEMOCRACY SCORE BY TECHNOLOGY GROUP
-1.5
-1
-0.5
0
0.5
1
1900 1905 1910 1915 1920 1925 1930 1935 1940 1945 1950 1955 1960 1965 1970
Technology with competing predecessor Technology without competing predecessor
THE REVIEW OF ECONOMICS AND STATISTICS236

In column 3 we consider the conditional effect of themilitary dummy and its interaction with the predecessortechnology dummy on technology diffusion. Having a mil-itary regime does not significantly affect the diffusion ofnew technologies in general. However, it significantly slowsdown the diffusion of new technologies that have a com-peting predecessor technology.
In column 4 we add the independence of the legislature tothe set of institutional controls Rct. The degree of flexibilityenjoyed by the legislature does not have a significant effecton technology diffusion in general. It, does, however, slowthe diffusion of new technologies with a competing prede-cessor technology.
Column 5 also adds the judicial effectiveness to Rct. Thisvariable does not have a significant effect on the diffusion ofnew technologies in general. However, judiciary effective-ness has a significantly larger effect on the diffusion oftechnologies with a competing predecessor technology thanon the diffusion of technologies without one. The otherproxy for the static political costs to the legislative authorityof raising diffusion barriers is the legislative flexibilityvariable. Consistent with the theory, we also observe that ahigh degree of legislative flexibility reduces the speed ofdiffusion of the technologies with a competing predecessorby more than that of the technologies that do not have acompeting predecessor.
Similarly, column 5 shows that the regime variables alsohave a differential effect on the diffusion of technologieswith competing predecessors consistent with the relevanceof lobbying in slowing the speed of diffusion of technolo-gies. Specifically, being in a military regime slows thediffusion of technologies with a competing predecessortechnology by more than the diffusion of technologieswithout a competing predecessor technology. Finally, ahigher degree of democracy is associated with faster diffu-sion for technologies with a competing predecessor tech-nology than for technologies without one.
Table 3 reports the estimates for regression (2) when weclassify technologies not only according to the technologicalgap with the predecessor, but also according to whether theproduction of the predecessor technology was concentrated.The differential effects of institutions in the diffusion of tech-nologies with and without concentrated predecessors are verysimilar to the effect across technologies with and withoutcompeting predecessors. We find that democracy and judicialeffectiveness have a significantly larger effect on the diffusionof technologies with concentrated predecessors. We also ob-serve that legislative effectiveness and military regime have anegative and significant differential effect on the diffusion oftechnologies with a concentrated predecessor.
Our model emphasizes the importance of the dynamiccomponent to policymaking. In particular, current institu-tions affect the political barriers next period. Hence, in ourregressions, the exogenous variables should reflect the lagged,rather than contemporaneous, institutions. In addition to being
closer to the model, this variation should mitigate the possibil-ity that our estimates are driven by reverse causality. In the firsttwo columns of table 4, we rerun the basic regression for bothclassifications of technologies, replacing the institutional vari-ables with their five-year lag. Interestingly, all the results hold,even a fortiori.
The estimated effect of lobbies on technology diffusion,in addition to being statistically significant, is quantitativelyrelevant. The variance of the diffusion level of the technol-ogies with a predecessor after removing the effect of thetechnology-time dummies is 0.9. The dispersion induced bythe estimated effect of the differential effect of institutional/policy variables on the diffusion of technologies with apredecessor is 0.46. This means that the estimated effect oflobbies on technology diffusion represents 50% of theobserved variation in technology diffusion.
The validity of the standard errors used to determine thestatistical significance of our estimates hinges on the assump-tions made about εict. Next, we show that our results arequalitatively and quantitatively robust to various assumptionsabout the error terms. We illustrate this using the specificationin the first two columns of table 4. The conclusions we reachfor this particular specification are representative of all thespecifications run in our analysis. The odd columns in table 4report the estimates of the interactions of the institutional
TABLE 3.—EFFECT OF LOBBYING ON TECHNOLOGIES WITH CONCENTRATED
COMPETING PREDECESSOR (DEPENDENT VARIABLE: TECHNOLOGY DIFFUSION (yict))
Variable I II III IV
Controls (Xct)ln(GDP/pop) 1.21 1.17 1.17 1.15
(8.83) (8.59) (8.61) (8.39)Prim. enr. before 1970 1.03 1.10 1.08 1.07
(3.95) (4.12) (4.09) (4.05)Sec. enr. before 1970 0.09 0.09 0.10 0.11
(0.45) (0.44) (0.47) (0.54)Prim. enr. after 1970 0.50 0.53 0.51 0.53
(0.71) (0.75) (0.72) (0.76)Sec. enr. after 1970 0.81 0.84 0.86 0.83
(2.63) (2.74) (2.77) (2.68)ln(electricity production) 0.16 0.16 0.16 0.15
(2.60) (2.60) (2.62) (2.39)Institutions
Democracy .055 0.06 0.08 0.064(3.10) (3.36) (3.55) (2.62)
Military regime 0.00 0.01 0.13(0.01) (0.09) (0.76)
Legislative flexibility 0.05 0.12(0.64) (1.41)
Judicial effectiveness 0.12(1.73)
Institut. � concen. pred.Democracy � concen. pred. 0.94 0.09 0.15 0.11
(7.39) (7.01) (4.99) (3.42)Mil. reg. � concen. pred. 0.49 0.63 0.91
(1.80) (2.27) (3.07)Legislat. flex. � concen. pred. 0.22 0.36
(2.35) (3.29)Judicial. eff. � concen. pred. 0.09
(2.90)No. of obs. 2,452 2,452 2,452 2,452R2 (within) 0.27 0.27 0.27 0.27
Note: t-statistics in parentheses computed using robust standard errors.All regressions include a full set of technology-year fixed effects and country fixed effects.
LOBBIES AND TECHNOLOGY DIFFUSION 237
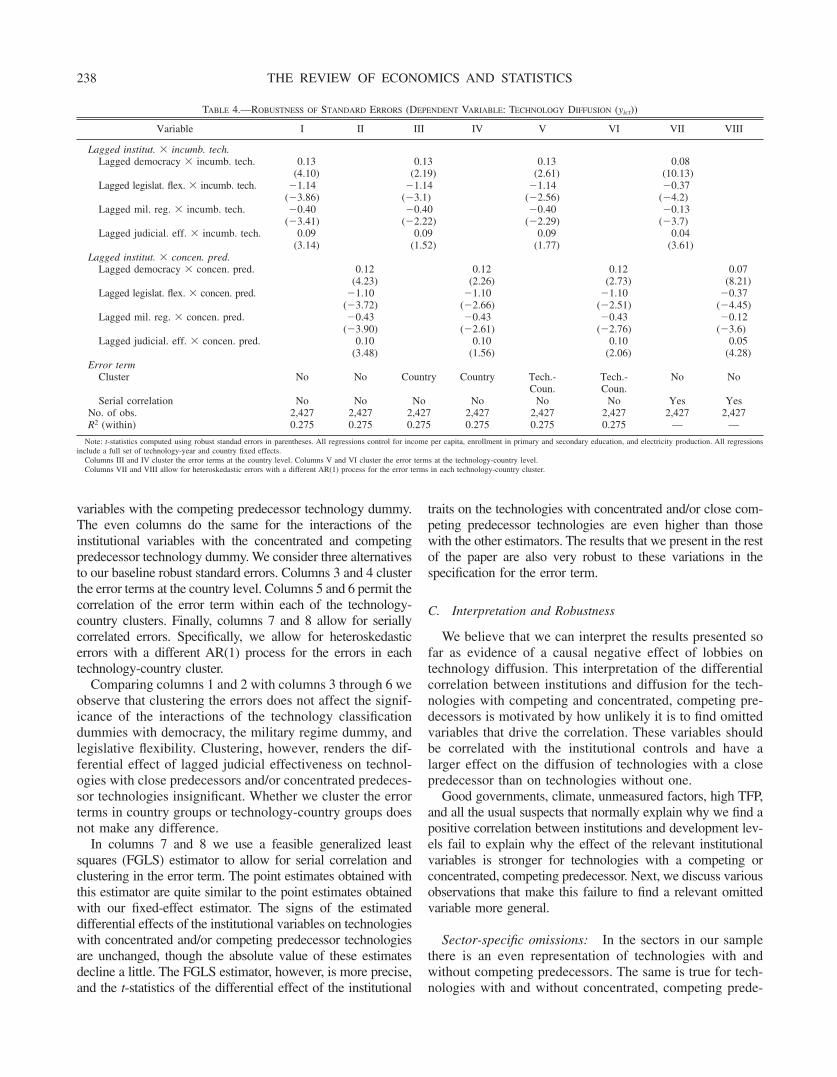
variables with the competing predecessor technology dummy.The even columns do the same for the interactions of theinstitutional variables with the concentrated and competingpredecessor technology dummy. We consider three alternativesto our baseline robust standard errors. Columns 3 and 4 clusterthe error terms at the country level. Columns 5 and 6 permit thecorrelation of the error term within each of the technology-country clusters. Finally, columns 7 and 8 allow for seriallycorrelated errors. Specifically, we allow for heteroskedasticerrors with a different AR(1) process for the errors in eachtechnology-country cluster.
Comparing columns 1 and 2 with columns 3 through 6 weobserve that clustering the errors does not affect the signif-icance of the interactions of the technology classificationdummies with democracy, the military regime dummy, andlegislative flexibility. Clustering, however, renders the dif-ferential effect of lagged judicial effectiveness on technol-ogies with close predecessors and/or concentrated predeces-sor technologies insignificant. Whether we cluster the errorterms in country groups or technology-country groups doesnot make any difference.
In columns 7 and 8 we use a feasible generalized leastsquares (FGLS) estimator to allow for serial correlation andclustering in the error term. The point estimates obtained withthis estimator are quite similar to the point estimates obtainedwith our fixed-effect estimator. The signs of the estimateddifferential effects of the institutional variables on technologieswith concentrated and/or competing predecessor technologiesare unchanged, though the absolute value of these estimatesdecline a little. The FGLS estimator, however, is more precise,and the t-statistics of the differential effect of the institutional
traits on the technologies with concentrated and/or close com-peting predecessor technologies are even higher than thosewith the other estimators. The results that we present in the restof the paper are also very robust to these variations in thespecification for the error term.
C. Interpretation and Robustness
We believe that we can interpret the results presented sofar as evidence of a causal negative effect of lobbies ontechnology diffusion. This interpretation of the differentialcorrelation between institutions and diffusion for the tech-nologies with competing and concentrated, competing pre-decessors is motivated by how unlikely it is to find omittedvariables that drive the correlation. These variables shouldbe correlated with the institutional controls and have alarger effect on the diffusion of technologies with a closepredecessor than on technologies without one.
Good governments, climate, unmeasured factors, high TFP,and all the usual suspects that normally explain why we find apositive correlation between institutions and development lev-els fail to explain why the effect of the relevant institutionalvariables is stronger for technologies with a competing orconcentrated, competing predecessor. Next, we discuss variousobservations that make this failure to find a relevant omittedvariable more general.
Sector-specific omissions: In the sectors in our samplethere is an even representation of technologies with andwithout competing predecessors. The same is true for tech-nologies with and without concentrated, competing prede-
TABLE 4.—ROBUSTNESS OF STANDARD ERRORS (DEPENDENT VARIABLE: TECHNOLOGY DIFFUSION (yict))
Variable I II III IV V VI VII VIII
Lagged institut. � incumb. tech.Lagged democracy � incumb. tech. 0.13 0.13 0.13 0.08
(4.10) (2.19) (2.61) (10.13)Lagged legislat. flex. � incumb. tech. 1.14 1.14 1.14 0.37
(3.86) (3.1) (2.56) (4.2)Lagged mil. reg. � incumb. tech. 0.40 0.40 0.40 0.13
(3.41) (2.22) (2.29) (3.7)Lagged judicial. eff. � incumb. tech. 0.09 0.09 0.09 0.04
(3.14) (1.52) (1.77) (3.61)Lagged institut. � concen. pred.
Lagged democracy � concen. pred. 0.12 0.12 0.12 0.07(4.23) (2.26) (2.73) (8.21)
Lagged legislat. flex. � concen. pred. 1.10 1.10 1.10 0.37(3.72) (2.66) (2.51) (4.45)
Lagged mil. reg. � concen. pred. 0.43 0.43 0.43 0.12(3.90) (2.61) (2.76) (3.6)
Lagged judicial. eff. � concen. pred. 0.10 0.10 0.10 0.05(3.48) (1.56) (2.06) (4.28)
Error termCluster No No Country Country Tech.-
Coun.Tech.-Coun.
No No
Serial correlation No No No No No No Yes YesNo. of obs. 2,427 2,427 2,427 2,427 2,427 2,427 2,427 2,427R2 (within) 0.275 0.275 0.275 0.275 0.275 0.275 — —
Note: t-statistics computed using robust standad errors in parentheses. All regressions control for income per capita, enrollment in primary and secondary education, and electricity production. All regressionsinclude a full set of technology-year and country fixed effects.
Columns III and IV cluster the error terms at the country level. Columns V and VI cluster the error terms at the technology-country level.Columns VII and VIII allow for heteroskedastic errors with a different AR(1) process for the error terms in each technology-country cluster.
THE REVIEW OF ECONOMICS AND STATISTICS238

cessor technologies. Thus, the omission of sector-specificvariables that symmetrically affect the technologies in thesector does not rationalize our estimates.
To show this formally, we include in our baseline regressionthe interaction between each of the four institutional variablesand each of the six sectors. In table 5, we focus on theclassification of technologies based on the presence of a com-peting predecessor, while table 6 reports the estimates of thedifferential effects of institutions on technologies with concen-trated, competing predecessors. For comparison purposes, col-umn 1 in tables 5 and 6 are taken from columns 1 and 2 in table4. As anticipated, column 2 of tables 5 and 6 show that theinclusion of sector-specific effects of the institutional traits thataffect the cost of lobbying does not reduce the size andsignificance of the differential effects of these traits on thediffusion of technologies with competing (table 5) and withconcentrated, competing predecessors (table 6).
An example can help us illustrate how much this restrictsthe set of omitted variables that could induce our estimates.One could think that the inverse of the productivity distancebetween new and old technologies is a proxy for the capitalintensity of the technology—the omitted variable. Naturally,the protection of property rights is more relevant for thediffusion of more capital-intensive technologies, since cap-
ital is easier to expropriate than labor. Then, good institu-tions that protect better property rights should have a stron-ger effect on the diffusion of technologies with a closepredecessor technology. Thus, the omission of the interac-tion between capital-intensity classification and the institu-tional variables would bias the estimates of the interactionwe introduce in regression (2).
This argument, however, rests on the premise that there isa negative correlation between the capital intensity of atechnology and its productivity advantage with respect tothe predecessor technology. This premise does not hold inour sample of technologies because the capital intensity ofour technologies depends mostly on the sector the technol-ogy belongs to (that is, transportation, steel, telecommuni-cations, and IT are capital intensive while textiles and masscommunications are not), and in most of the sectors we havean even distribution of technologies between those that haveclose predecessors and those that do not. Therefore, notcontrolling for the capital intensity of technologies or forany other attribute that is relatively homogeneous within thesector will not result in a bias of our estimates.18
18 Another variable that may affect the speed of diffusion of certaintechnologies is whether the government undertakes complementary in-
TABLE 5.—ROBUSTNESS: TECHNOLOGY DIFFUSION WITH AND WITHOUT INCUMBENT TECHNOLOGIES (DEPENDENT VARIABLE: TECHNOLOGY DIFFUSION (yict))
Variable I II III IV V VI
Controls � incumb. tech.ln(GDP/pop) � incumb. tech. 0.24
(1.43)Prim. enr. 70 � incumb. tech. 0.02
(0.04)Sec. enr. 70 � incumb. tech. 1.35
(3.24)Prim. enr. 70� � incumb. tech. 0.77
(0.49)Sec. enr. 70� � incumb. tech. 0.89
(1.41)ln(electricity) � incumb. tech. 0.00
(0.02)ln(area) � incumb. tech. 0.13
(3.51)ln(population) � incumb. tech. 0.12
(3.31)ln(GDP) � incumb. tech. 0.03
(1.10)Institut. � incumb. tech.
Lagged democracy � incumb. tech. 0.13 0.16 0.11 0.12 0.16 0.05(4.10) (4.60) (3.59) (2.94) (3.92) (1.27)
Lagged legislat. flex. � incumb. tech. 1.14 0.67 0.36 0.50 0.60 0.36(3.86) (4.54) (2.61) (2.77) (3.27) (2.39)
Lagged mil. reg. � incumb. tech. 0.40 1.39 1.10 1.48 1.58 0.49(3.41) (4.78) (3.38) (3.81) (4.05) (1.45)
Lagged judicial. eff. � incumb. tech. 0.09 0.15 0.02 0.16 0.15 0.20(3.14) (4.33) (0.59) (4.40) (4.06) (3.84)
DummiesCountry dummies No No No No No YesCountry dummies � incumb. tech. No No No No No YesSector dummies � institutional var. No Yes No No No No
No. of obs. 2,427 2,427 2,427 2,210 2,210 2,427R2 (within) 0.275 0.29 0.28 0.24 0.23 0.31
Note: t-statistics computed using robust standard errors in parentheses. All regressions include a full set of technology-year and country fixed effects.All regressions control for income per capita, enrollment in primary and secondary education, and electricity production.Regression III controls in addition for ln(area) and for ln(population). Regression IV controls in addition for ln(GDP).
LOBBIES AND TECHNOLOGY DIFFUSION 239

Omission of social value of technology: A second po-tential source of bias in our estimates of the effect of lobbieson technology diffusion might arise from the omission ofcontrols that measure the social value of new technologies.The technology gap between a technology and its predeces-sor is likely to be positively correlated with the social valueof the new technology. The quality of institutions mayreflect the sensitivity of the government to the social valueof institutions. Therefore, we should expect that countrieswith “good” institutions are going to adopt policies thataccelerate the (relative) diffusion of technologies without aclose predecessor technology. Therefore, the omission of ameasure of the social value of the new technology wouldresult in a bias in the estimate of the interaction between thetechnology classification and the institutional variables. Inparticular, it would bias the estimates toward finding lowereffects of good institutions in the diffusion of technologieswith close predecessors. However, as described above, wefind exactly the opposite. The degree of democracy, non-military regime, and the effectiveness of the judicial system
have a stronger (positive) effect on the diffusion of technol-ogies with a close predecessor than on the diffusion of thosewithout one.19
Omission of differential effect of controls in Xct: An-other source of omitted variable bias in the estimates of thedifferential effects of the institutional variables on the tech-nologies with close predecessors may be the omission of theinteraction between the technology classification and thecontrols in Xct. It could be argued that technologies with aclose predecessor are more complementary to, say, humancapital. Democratic institutions may be more effective inpromoting human capital accumulation. Omitting the inter-action between human capital measures and institutionsmight then generate a positive differential effect of institu-
vestments. These investments are particularly important in transportation(roads, railroads, airports, harbors) and telecommunications. Omitting themagnitude of these government investments does not bias our estimatesgiven the sector-specificity of the investments’ importance.
19 A similar argument could be made about the biases from the omissionof measures of the willingness to accept change. It is not obvious to ushow this variable would be correlated (if at all) with our institutionalvariables. One possibility is that, as discussed in Acemoglu and Robinson(2000b), bad institutions are more opposed to the adoption of morerevolutionary technologies because these may threaten the political powerof current leaders. If so, this omission would bias the estimates in favor ofa larger effect of democracy, judicial effectiveness, and military on thediffusion of technologies without a close predecessor, the opposite of whatwe find.
TABLE 6.—ROBUSTNESS: TECHNOLOGIES WITH COMPETING AND CONCENTRATED PREDECESSORS (DEPENDENT VARIABLE: TECHNOLOGY DIFFUSION (yict))
Variable I II III IV V VI
Controls � concen. pred.ln(GDP/pop) � concen. pred. 0.14
(.92)Prim. enr. 70 � concen. pred. 0.47
(1.37)Sec. enr. 70 � concen. pred. 0.51
(1.53)Prim. enr. 70� � concen. pred. 0.12
(0.10)Sec. enr. 70� � concen. pred. 0.22
(0.37)ln(electricity) � concen. pred. 0.01
(0.25)ln(area) � concen. pred. 0.13
(4.62)ln(population) � concen. pred. 0.14
(4.83)ln(GDP) � concen. pred. 0.05
(2.20)Institut. � concen. pred.
Lagged democracy � concen. pred. 0.12 0.16 0.11 0.11 0.15 0.06(4.23) (4.60) (3.60) (2.92) (3.97) (1.77)
Lagged legislat. flex. � concen. pred. 1.10 0.67 0.46 0.35 0.46 0.38(3.72) (4.54) (3.63) (2.25) (2.85) (2.94)
Lagged mil. reg. � concen. pred. 0.43 1.39 1.11 1.36 1.48 0.62(3.90) (4.78) (3.38) (3.38) (3.68) (1.81)
Lagged judicial. eff. � concen. pred. 0.10 0.15 0.06 0.14 0.14 0.22(3.48) (4.33) (1.61) (4.66) (4.37) (4.84)
DummiesCountry dummies No No No No No YesCountry dummies � concen. pred. No No No No No YesSector dummies � institutional var. No Yes No No No No
No. of obs. 2,210 2,427 2,427 2,210 2,210 2,210R2 (within) 0.275 0.29 0.27 0.24 0.23 0.24
Note: t-statistics computed using robust standard errors in parentheses. All regressions include a full set of technology-year and country fixed effects.All regressions control for income per capita, enrollment in primary and secondary education, and electricity production.Regression III controls in addition for ln(area) and for ln(population). Regression IV controls in addition for ln(GDP).
THE REVIEW OF ECONOMICS AND STATISTICS240

tional variables on technologies with a close predecessor forreasons other than lobbies. To explore this possibility, col-umn 3 of tables 5 and 6 allow for a differential effect of thecontrols in Xct (income per capita, enrollment rates, andelectricity production) on the diffusion of the technologieswith a predecessor (table 5) and with a concentrated, com-peting predecessor (table 6). The differential effects ofinstitutions on the diffusion of technologies with a compet-ing predecessor or with a concentrated, competing prede-cessor are largely robust to the presence of differentialcontrols. The only institutional variable that becomes insig-nificant after allowing for a differential set of controls isjudicial effectiveness. Hence, the differential effect of insti-tutions on the diffusion of technologies with competing orconcentrated, competing predecessors is not driven by theinteraction between the technology classification and any ofthe correlates in Xct, including human capital measures.
Beyond good versus bad institutions: The fact that wecan simultaneously identify the differential effect of all theinstitutional variables on the diffusion of the technologieswith a competing or concentrated, competing predecessorraises the hurdle for the potential omitted variables since, toaccount for the estimated coefficients, they must be appro-priately correlated with all the variables in Rct. This isparticularly difficult since we find that some measures ofgood institutions—democracy, judicial effectiveness, andnonmilitary regime—accelerate more the diffusion of tech-nologies with a competing predecessor, but one variable thatis usually associated with good institutions—legislativeflexibility—slows more the diffusion of this same group oftechnologies. This finding is perfectly natural, however, iflobbies constitute an important deterrent to the adoption oftechnologies with a competing predecessor.
Omission of geography variables: To increase our con-fidence in the robustness and interpretation of the estimateddifferential effect of institutions across technology groups,we explore next some further omissions. For most of them,however, it is hard to argue why they should affect differ-entially the technology groups in a way that correlates withthe differential effect that our institutional traits have.
The size of the country or its economy should have aneffect on the diffusion of some of the technologies such astransportation and communication technologies. To explorewhether they affect the estimated differential effects ofinstitutions, column 4 includes as regressors the countryarea and population, while column 5 includes real GDP. Ofcourse, we allow these variables to have a differential effecton the technologies with a competing predecessor (table 5)and with a concentrated, competing predecessor (table 6).Though these measures of size have a significant differentialeffect on the diffusion of technologies with a predecessortechnology, the differential effects of institutions on the
diffusion of technologies with competing or with concen-trated, competing predecessors are virtually unaffected.
Source of identification: In column 6 we try to under-stand the source of the identification for the interactionbetween technologies and institutions. In particular, weexplore whether we are obtaining any identification fromthe time-technology dimension or whether all the identifi-cation comes from the country-technology dimension. To dothat, we include in the regression both country fixed effectsand country fixed effects interacted with the dummy fortechnologies with previous competing technologies. Aftereliminating the country-technology dimension, the differen-tial effects of the military dummy and of democracy ontechnologies that have a competing technology decline byapproximately half and become insignificant. However, thedifferential effect of the flexibility of the legislature remainsnegative and significant at the 2% significance level. Thismeans we are identifying some of the differential effects ofinstitutions on technology diffusion by exploiting the timeseries variation of the institutions.
Column 6 in table 6 explores the source of the identifi-cation of the differential effect of institutions on the diffu-sion of technologies with concentrated, competing prede-cessors. As before, we do that by including, simultaneously,country fixed effects and country fixed effects interactedwith the dummy for technologies with concentrated, com-peting predecessors. When doing that, we find that theestimate of the differential effect of legislative flexibilitydoes not change while the estimate of the differential effectsof democracy and the military dummy declines by abouthalf. However, these differential effects of the institutionaltraits on technologies with close, concentrated predecessortechnologies are still significant: legislative flexibility issignificant at the 1% level while democracy and the militarydummy are significant at the 7% level. Hence, we areidentifying an important portion of the differential effects ofinstitutions on technology diffusion through the time seriesvariation of the institutions. This makes it even more un-likely that the estimates of the differential effects of insti-tutions on technology diffusion are driven by omitted vari-ables and reinforces the conclusion that lobbies are animportant impediment to technology diffusion.
Reverse causality: Similar arguments lead to the con-clusion that it is unlikely that reverse causality drives theobserved differential correlation between diffusion for tech-nologies with predecessor technologies and the institutionalvariables in Rct. Namely, it is hard to argue why the speed ofdiffusion in the sectors with an incumbent technology, butnot in the sectors without one, led to a democratic regime orto a legislative system where the authorities had no legis-lative independence. We believe that the previous discus-sion makes this argument very difficult to sustain. In addi-tion, it is important to note that the technologies we are
LOBBIES AND TECHNOLOGY DIFFUSION 241
studying are quite micro, and therefore the effect of theirdiffusion (or lack thereof) in aggregate macro variables,such as GDP and the labor market, may be quite limited.
IV. Concluding Remarks
Differences in the available technology across countriesare believed to be a first-order determinant of cross-countryincome per capita differentials. In this paper we exploredthe empirical relevance of one of the determinants of tech-nology diffusion. Namely, lobbying efforts by producers ofincumbent technologies. We observed that lobbies signifi-cantly slow the speed of diffusion of new technologies.
In addition, the findings of this paper also illustrate onechannel by which institutions affect development. Namely,institutions affect the parties’ incentives to engage in lob-bying activities, lobbying slows technology diffusion, andtechnology crucially affects development. The empiricalidentification of this mechanism is a contribution to theinstitutions and growth literature.
This literature has followed two routes to progress. Instandard regression analysis, it has tried to identify theeffect of institutions on income per capita by controlling forelements other than institutions that may affect income percapita differences. This route has typically been unsuccess-ful because institutions become insignificant after the inclu-sion of common controls or country fixed effects. A secondroute has argued that attenuation bias is responsible for thisinsignificance and has tried to find good instruments ofinstitutions. This approach has been more successful, but itis still not clear whether the proposed instruments are trulyvalid.20 Further, since income per capita is highly correlatedwith many indicators of “good institutions,” it is very hardto detect the specific institutional traits that drive income percapita differences with this instrumental variables approach.
This paper provides an alternative route to establishing thelink between institutions and development, which hinges ontwo pillars. First, the use of measures of diffusion for varioustechnologies as dependent variables. Second, the identificationof the effect of institutions by interacting institutions to arelevant ex ante classification of technologies.
We believe that our approach has some important advan-tages. First, as we have argued above, it is very robust toomitted variable and reverse causality biases. Second, byusing a multidimensional dependent variable with so muchvariation both over time and in the cross section as tech-nology diffusion, the test of the null that lobbies have noeffect on technology diffusion is more powerful. Indeed, wehave identified the effect of lobbies on technology diffusionthrough the differential effects of institutions on technologydiffusion even after introducing country fixed effects andthe interaction of country fixed effects with the a prioriclassification of technologies. Finally, with our approach we
have been able to pinpoint some specific institutional traitsthat strongly affect technology diffusion. This step is veryimportant for two reasons. First and foremost, it is critical todraw specific policy recommendations from this kind ofempirical analysis. Second, we have observed that not allthe institutional characteristics that are usually associatedwith advanced economies accelerate the speed of diffusionof technologies. In particular, more flexibility of the legis-lative authority makes it easier for lobbies to induce it toraise political barriers to the diffusion of new technologiesthat ultimately slow their diffusion.
The strategy used to identify the role of lobbies on technol-ogy diffusion captures the barriers raised by incumbents thatcompete with new entrants in the product market. This is justone of the possible mechanisms by which interest groups(broadly understood) slow down the diffusion of new technol-ogies. De Soto (1989), for example, claims that corrupt bu-reaucracies prevent the adoption of new technologies. Acemo-glu and Robinson (2000a, 2000b) argue that elites block theadoption of new technologies in order to preserve their politicalpower. Finally, various authors have claimed that interestgroups such as unions or elites may block the adoption oftechnologies that affect their labor market outcomes. Oneinteresting line of research that we plan on pursuing in thefuture is to evaluate the empirical relevance of these mecha-nisms. Doing so will require increasing the number of tech-nologies in our data set.21
The empirical strategy used in this paper can be appliedto identify mechanisms other than lobbies through whichinstitutions affect technology diffusion and income per cap-ita. These exercises may provide us with a better under-standing of the specific institutional traits that trigger en-gines of development such as technology adoption. If, asthis and other papers suggest, institutions are important fordevelopment, identifying the likely consequences of spe-cific institutional traits is crucial for the advancement ofpoor countries.
REFERENCES
Acemoglu, Daron, and James Robinson, “Why Did the West Extend theFranchise? Democracy, Inequality, and Growth in Historical Per-spective,” The Quarterly Journal of Economics 115:4 (2000a),1167–1199.. “Political Losers as a Barrier to Economic Development,” American
Economic Review Papers and Proceedings 90 (2000b), 126–130.Acemoglu, Daron, Simon Johnson, and James Robinson. “The Colonial
Origins of Comparative Development: An Empirical Investigation,”American Economic Review 91 (December 2001), 1369–1401.
Acemoglu, Daron, Simon Johnson, James Robinson, and Pierre Yared.“From Education to Democracy?” NBER working paper no. 11204(2005).
Adams, Walter, and Joel Dirlam, “Big Steel, Invention, and Innovation,”The Quarterly Journal of Economics 80:2 (1966), 167–189.
Adsera, Alicia, Cales Boix, and Mark Payne, “Are You Being Served?Political Accountability and Governmental Performance,” Journalof Law, Economics and Organization 19 (Fall 2003), 445–490.
20 See the debate among Acemoglu, Johnson, and Robinson (2001),Glaeser et al. (2004), and Acemoglu et al. (2005).
21 For example, our data set only contains one labor-saving technology(industrial robots).
THE REVIEW OF ECONOMICS AND STATISTICS242

Aghion, Philippe, and Peter Howitt, Endogenous Growth Theory (Cam-bridge, MA: MIT Press, 1998).
Archer, G, History of Radio to 1926 (New York: American HistoricalSociety, American Book, Stratford Press, 1938).
Ayres, Robert, and Steven Miller, “Robotic Realities: Near Term Prospectsand Problems,” Annals of the American Academy of Political andSocial Sciences 470:1 (1983), 28–55.
Besley, Timothy, and Anne Case, “Does Electoral Accountability AffectEconomic Policy Choices? Evidence from Gubernatorial TermLimits,” The Quarterly Journal of Economics 110:3 (1995), pp.769–798.
Biggs, Lindy, The Rational Factory: Architecture, Technology and Workin America’s Age of Mass Production (Baltimore: Johns HopkinsUniversity Press, 1996).
Casson, Herbert, History of the Telephone (Fairfield, IA: 1st WorldLibrary, 2004).
Coe, Lewis, The Telephone and Its Several Inventors: A History (Jeffer-son, NC: McFarland & Company, 1995).
Comin, Diego, and Bart Hobijn, “Cross-Country Technology Adoption:Making the Theories Face the Facts,” Journal of Monetary Eco-nomics 51 (2004), 38–83.
“Lobbies and Technology Diffusion,” NBER working paper no.11022 (2005).
Comin, Diego, Bart Hobijn, and Emilie Rovito, “Five Facts You Need toKnow about Technology Diffusion,” NBER working paper no.11928 (2006).
Curcio, Vincent, Chrysler: The Life and Times of an Automotive Genius(Oxford: Oxford University Press, 2000).
Curran, James, and Jean Seaton, Power without Responsibility: The Press,Broadcasting and New Media in Britain (London: Routledge, 1981).
De Soto, Hernando, The Other Path: Invisible Revolution in the ThirdWorld (New York: Harper and Row, 1989).
Dodge, Grenville, “How We Built the Union Pacific Railway and otherRailway Papers and Addresses,” presented by the author to theNew York Public Library on 24 October, 1910.
Ferejohn, John, “Incumbent Performance and Electoral Control,” PublicChoice 50 (1986), 5–25.
Fisher, Douglas Aalan, The Epic of Steel (New York: Harper and Row,1963).
Fogel, Robert, Railroads and American Economic Growth: Essays inEconometric History (Baltimore and London: Johns HopkinsPress, 1964).
French, Gilbert, The Life and Times of Samuel Crompton of Hall-in-the-Woods, Inventor of the Spinning Machine Called the Mule(Manchester: Charles Simms and Co, 1862).
Galloway, John D. The First Transcontinental Railroad: Central Pacific,Union Pacific (New York: Simmons-Boardman, 1950).
Glaeser, Edward, Rafael La Porta, Florencio Lopez-de-Silanes, and An-drei Shleifer, “Do Institutions Cause Growth?” Journal of Eco-nomic Growth 43 (2004), 271–303.
Hofman, Heinrich, General Metallurgy (New York: McGraw-Hill, 1913).Hsieh, Chang-Tai, and Peter Klenow, “Relative Prices and Relative
Prosperity,” NBER working paper no. 9701 (May 2003).Kelley, Larry, and Donald Jugenheimer, Advertising Media Planning: A
Brand Management Approach (New York: M. E. Sharpe, 2003).Kunicova, Jana, and Susan Rose-Ackerman, “Electoral Rules as Con-
straints on Corruption,” Yale University mimeograph (2002).La Porta, Rafael, Florencio Lopez-de-Silanes, Andrei Shleifer, and Robert
Vishny, “Law and Finance,” Journal of Political Economy 106:6(1998).
Liddel, Donald, The Metallurgists and Chemists’ Handbook (New York:McGraw-Hill, 1916).
Lijphart, Arend, Electoral Systems and Party Systems (New York: OxfordUniversity Press, 1994).
Patterns of Democracy: Government Forms and Performance inThirty-Size Countries (New Haven, CT: Yale University Press, 1999).
Mokyr, Joel, The Lever of Riches: Technological Creativity and EconomicProgress (New York: Oxford University Press, 1990).
Myerson, Roger, “Effectiveness of Electoral Systems for Reducing Gov-ernment Corruption: A Game Theoretic Analysis,” Games andEconomic Behavior 5 (1993), 118–132.
Oliver, John, History of American Technology (New York: Ronald Press,1956).
Olson, Mancur, The Rise and Decline of Nations: Economic Growth,Stagflation, and Social Rigidities (New Haven, CT: Yale UniversityPress, 1984).
Parente, Steven, and Edward Prescott, Barriers to Riches (Cambridge,MA: MIT Press, 2000).
Phelps, Christina, “The Persian Gulf Submarine Telegraph of 1864,” TheGeographical Journal 135:2 (1969), 169–190.
Persson, Tosten, and Guido Tabellini, Political Economics. ExplainingEconomic Policy (Cambridge and London: MIT Press, 2000).
Persson, Torsten, Gerard Roland, and Guido Tabellini, “ComparativePolitics and Public Finance,” Journal of Political Economy 108(2000), 1121–1161.
Persson, Torsten, Guido Tabellini, and Francesco Trebbi, “Electoral Rulesand Corruption,” Stockholm University mimeograph (2003).
Pollard, Sidney, and Paul Robertson, The British Shipbuilding Industry1870–1914 (Cambridge, MA: Harvard University Press, 1979).
Powell, Bingham, Elections as Instruments of Democracy (New Haven,CT: Yale University Press, 2000).
Rajan, Raghuram, and Luigi Zingales, “Financial Dependence andGrowth,” American Economic Review 88 (1998), 559–586.
Rhodes, Frederick, Beginnings of Telephony (New York and London:Harper & Brothers, 1929).
Saxonhouse, Gary, and Gavin Wright, “Technological Evolution in CottonSpinning, 1878–1933,” mimeograph (2000).
Sichel, Daniel, The Computer Revolution: An Economic Perspective(Washington DC: Brookings Institution, 1997).
Smith, Frank, Understanding Reading: A Psycholinguistic Analysis ofReading and Learning to Read (Mahwah, NJ: Lawrence ErlbaumAssociates, 2004).
Solymar, Laszlo, Getting the Message: A History of Communications(New York: Oxford University Press, 1999).
Thompson, Robert, Wiring a Continent: The History of the TelegraphIndustry in the United States, 1832–1866 (Princeton, NJ: PrincetonUniversity Press, 1947).
Tirole, Jean, The Theory of Industrial Organization (Cambridge, MA:MIT Press, 1988).
Walton, Perry, The Story of Textiles (Boston: Walton Advertising andPrinting Co, 1925).
Warner, Larkin. “Railroads Rates and the Growth of Coal Trucking inOhio,” Land Economics 38:3 (1962), 231–239.
Weiss, Eugene, Chrysler, Ford, Durant and Sloan: Founding Giants of theAmerican Automotive Industry (Jefferson, NC: McFarland & Com-pany, 2003).
APPENDIX A
Productivity Differentials
Appendix A documents the productivity differential between a giventechnology and its proceeding technology.
Ring spindles: In 1779, Crompton designed the spinning mule. Thefirst ring spindles were simultaneously invented by John Thorp andCharles Danforth in 1828. The main technical difference between the ringand mule spindles is that the ring spins continuously, while the mule spinsintermittently. Saxonhouse and Wright (2000) provide the average speedof new mule and ring spindles in a sample of fifteen countries for variousperiods up to 1920. As late as 1914, the average spinning speed of newmule spindles was 9,600 rpm, while that of ring spindles was 8,900 rpm.
Bessemer: Prior to the invention of the Bessemer process, steel wasproduced with crucibles. Wrought iron bars were broken up and heated inclay crucibles, each holding at most forty to fifty pounds of metal. Ten tofifteen days were then devoted to converting the iron into steel, whichrequired large quantities of fuel. The Bessemer converter brought anunprecedented productivity improvement over the crucible. It cast fivetons of steel in twenty to thirty minutes (Fisher, 1963, p. 117).
Open hearth and blast oxygen: Subsequent innovations in steelproduction generated much smaller productivity improvements than theBessemer furnace did. Open hearth furnaces did not significantly improvethe productivity of the Bessemer converter, while blast oxygen furnaceswere 2.5 times more productive than open hearth furnaces (Adams &Dirlam, 1966).
Electric arc: The invention of the electric arc allowed for the first timethe efficient production of the stainless steel used in cookware, cutlery,
LOBBIES AND TECHNOLOGY DIFFUSION 243
hardware, surgical instruments, major appliances, industrial equipment,and building materials for skyscrapers.
Telegraphs: Between 1840 and 1850, the telegraph cut costs by afactor of hundred and reduced elapsed time per word transmitted by afactor of three thousand, from ten days to five minutes for a one-pagemessage between New York and Chicago (Sichel, 1997, p. 127).
Telephones: The productivity increase between the telephone and thetelegraph depended on the task being completed. Solymar (1999) andSmith (2004) report that it took about six times longer to tap a messageand translate the Morse code into words than it took to read it bytelephone. Coe (1995), however, estimates that it took about the same timeto dispatch trains by phone and by telegraph. Additionally, Casson (2004)cites a United Press study that estimates it also took the same time todispatch news to ten cities by phone and by telegraph. Taking the averageof these three tasks, we estimate that the telephone increased communi-cations productivity by a factor of three.
Cell phones: In 1993, Gallup conducted a survey of cell phone usersasking how much their productivity increased by using a mobile phoneinstead of a fixed phone. Responders reported an average productivityincrease of 34%.
Newspapers: Newspapers did not have a clear predecessor, and thuscan be classified as having an arbitrarily large productivity differential.
Radios and TVs: Determining the productivity differentials betweennewspapers, radios, and TVs is difficult because though radio and TVwere not more efficient ways to transmit information based on their recallrates (Kelley & Jugenheimer, 2003, p. 38), they added an entirely newdimension to the mass communication industry.
PCs and robots: Personal computers increased enormously our com-puting capacity at a rate that doubled every eighteen months after theirinvention. Robots lead to productivity increases of up to 560% in a sampleof car manufacturing plants studied by Ayres and Miller (1983). Inaddition, robots made operation of hazardous materials in extreme envi-ronments safer, and computers greatly reduced the cost of completingcomputations, and organizing and distributing information, and revolu-tionized graphic design.
Railways: In the prerail era it took two to four days to travel the ninetymiles that separate New York from Philadelphia (Oliver, 1956), giving anaverage speed of about two miles per hour. Within a few years after theintroduction of the railroad, average passenger transportation speeds wereten times higher than that. Whether railways led to a similar revolution infreight transportation depended on the presence or absence of canals. Asearly as 1840, the Reading locomotives transported over four hundred tonsof coal at average speeds of ten mph. In contrast, the size of freightstransported by road was below ten tons. Fogel (1964) estimates thatrailways reduced the cost of transporting cargo relative to canals byslightly less than a factor of two.
Cars and trucks: Cars were first produced in Europe in the late 1800s.From their invention through the 1950s, cars were less productive thantrains, first because cars took several years to even acquire enough powerand reliability over long distances to compete with the speed of trains andthen because of the slow pace of road construction and improvements(Curcio, 2000, p. 152; Weiss, 2003). Trucks were more efficient than trainsonly in very short distances, but when transporting cargo for distancesabove eighty miles, rail transportation was cheaper than road transporta-tion, even when using twenty-ton trucks (Warner, 1962, p. 237).
Planes: The first commercial planes appeared in the late 1920s. TheStratolier, which appeared in 1938, transported 33 passengers at 250minutes per hour. These speeds, while impressive, are still less than fivetimes the speed of the fastest trains, which in 1894 traveled at an averagespeed of about 55 minutes per hour (Oliver, 1956).
Steam ships: The development and subsequent improvement of steamships were long, arduous tasks. It was not until the end of the century,however, that the fastest steam ships sailed at speeds beyond the reach ofthe clippers (Oliver, 1956).
APPENDIX B
Size of Sunk Costs of Production of Predecessor Technologies
Appendix B documents the size of the sunk costs necessary to implementor produce technologies without revolutionary subsequent technologies.
Mule spindle (predecessor to ring spindle): The first mule wasinvented in a home in 1779 by a 26-year-old boy (Walton, 1925);similarly, the second mule was erected in a loft above a schoolhouse(French, 1862). The small, unsophisticated settings for the construction ofthese first mules indicate that producing mules required small sunk costs.
Bessemer (predecessor to open hearth): Liddel (1916) reports costsof setting up various types of metallurgical plants from Hofman (1913) atthe turn of the century. The cost of building an acid Bessemer plant withcapacity to produce two thousand tons of steel per day was $900,000.
Open hearth (predecessor to blast oxygen steel furnace): Liddel(1916) also reports that the cost of building an acid open hearth plant ableto produce one thousand tons of steel per day was $1.5 million.
Telegraph (predecessor to telephone): To transit telegrams, it isnecessary to set up a complex wire network, which supposes a large sunkcost to telegrams. In 1848, the average cost of constructing the six regionsin the Atlantic, Lake, and Mississippi line—Atlantic and Ohio; Pittsburg,Cincinnati, and Louisville; Ohio and Mississippi; Ohio, Indiana, andIllinois; Lake Erie; and Illinois and Mississippi—was $240 per mile, or$150 per kilometer (Thompson, 1947). Additionally, construction of theNew York to Erie line was projected in 1848 to cost $250 per mile for thefirst wire and an additional $100 for each wire after that (Thompson,1947). In 1850, there were about four thousand miles of wire in operationin the United Kingdom. The quality of the lines in the United Kingdomwas higher than in the United States. This emphasis in quality led to higherconstruction costs. In some cases, these amounted to $600 per mile.Finally, the total cost of manufacturing, laying, and bringing into workingorder the Persian Gulf submarine telegraph line, built in 1964, was£411,751 (Phelps, 1969).
Telephone (predecessor to cell phone): Similar to telegrams, settingup the telephone lines necessary for telephonic communication was verycostly. By 1888, the American Bell Company had constructed telephonelines with 26,038 miles of wire, which covered a distance of approxi-mately twenty times less than the actual wire length. These lines costapproximately $2,200,000, or $84 per mile of wire (Rhodes, 1929).
Newspaper (predecessor to radio): The cost of purchasing a printingpress has always had a relatively low sunk cost. In the 1830s, for example,most radical, unstamped papers were printed on hand presses, which costas little as £10 to acquire. The low sunk cost of buying a printing press haspersisted even while printing presses have experienced significant tech-nological advancements. After 1836, for example, most radical pressesbegan using the technologically superior steam press. Even then, paperslike The Northern Star cost only £690 to start (Curran & Seaton, 1981).In 1912, after the industrialization of the press, newspapers still requiredonly a small sunk cost to start. For example, The Daily Citizen began in1912 with only £30,000 and The Daily Herald used only £300 to start and,with the help of public subscriptions, achieved a circulation of almost250,000 (Curran & Seaton, 1981).
Radio (predecessor to TV): The total cost of setting up a “modest”radio station was only around $50,000 (Archer, 1938).
Canal (predecessor to freight trains): Building a canal comes with avery large sunk cost, as shown by table A.1 in Comin and Hobijn (2005).
Railway (predecessor to trucks, cars, and planes): Establishing a railnetwork came at a very high sunk cost. Dodge (1910) described the costand labor required to build the Union Pacific Railroad. When the projectwas initially considered in 1836, bills were introduced in Congresssuggesting as much as $96 million for the railroad’s construction. Onceconstruction finally began, the Union Pacific was funded by governmentbonds paying $48,000 per mile for the first 150 miles west of Cheyenneand $32,000 per mile thereafter. A railroad in England that was con-structed in the 1820s and ran from Liverpool to Manchester in Englandcost $187,495 per mile (Galloway, 1950).
Cars (predecessor to planes): Cars also require a high sunk cost toproduce. In the early 1900s, Ford constructed a plant on the River Rougeat a cost of $3.5 million and a second plant in Kearny, New Jersey, whichcost $2.5 million (Biggs, 1996). By the 1950s, the cost to Ford of updatingits plants to produce its popular 1953 model car was $1 billion (Weiss,2003). In 1922, William Durant purchased a plant in Elizabeth, NewJersey, for $5,525,000.
Sailing ships (predecessor to steam and motor ships): The value ofall the shipbuilding materials in the Clydebank (Britain) yard of JohnBrown and Company was £131,220 in 1899 and £200,691 in 1910(Pollard & Robertson, 1979).
THE REVIEW OF ECONOMICS AND STATISTICS244