the review 0/ and statistics - dairy markets · the review 0/ economics and statistics vol. lix...
TRANSCRIPT

- ~
"....:.~~.-..,;..,,;..:.."1,1:~~..-....: ........ U.: '37~~
The Review 0/ Economics and Statistics VOL. LIX FEDRUARY 1977 NUMBER 1
THE COST OF THE u.s. DAIRY PRICE SUPPORT PROGRAM: 1949-74
Dale Heien·
W· ITH the passage of the Agriculture Act of 1949, Congress and the subsequent ad
ministrations undertook the task of supporting the income of dairy farmers through the purchase of various dairy prod ucts. The aCl required that milk and butterfat prices be supported at 90% of parity during 1949 and required the Secretary to support prices between 75% and 90% of parity. This requirement was in effect during the period from 1950 until 1973 when it was raised to 80%. The price support program consists mainly of purchases by the Commodity Credit Corporation (CCC) of quantities of butter, cheddar cheese, and nonfat dry milk . The support prices for t!ach of the three commodities are announced at the beginning of the marketing year (April) and generally remain in effect at the announced levels for the entire year. In addition to the purchase of these commodities, the Congress has also financed (in part) the National School LUllch Program, which requires purchases of considerable quantities of fluid milk, the Special i\1ilk Program (milk for needy children, summer camps, etc.), and more recently h8.s increased the demand for food in general through the food stamps program. Government expenditures on dairy price support programs (CCC programs) over the 1949-73 period totaled $7.048 billion (U .S. Department of Agriculture, 1974, p. 28).
In addition to the above program, the federal government further supports prices r:!ceived by farmers for dairy products through the federal milk marketing order system. These marketing orders allow dairy cooperatives to set mInimum
Received for publication Se;1tember 3, 1975. Revision accepted for publica~ion May 4, 1976 .
• The model described ill this paper was prepared under contract with the Eco:lom ic Research Service, U.5. Depart· ment of Agriculture. The aUihor acknowicGt;cs the help a:1d cooperation of the staff of Dairy Sectio:l. Commodity Economics Division, especially Richard Fallert.
prices for fluid grade (bottling) milk. Milk produced by dairy farmers is divided into two broad grades: milk eligible for the fluid market and manufacturing grade milk. The latter is used in processed dairy products such as cheese, nonfat dry milk , etc ., but cannot be used in fluid milk since it does not meet the specified sanitary standards. On the other hand, milk eligible for the fluid market can and is used for processed dairy products as well as fresh milk. The Agricultural Adjustment Act of 1937 authorized the federal order system, mainly as a result of unstable milk prices and the resulting violence of the dairy strikes. The federal order system sets prices at various markets (61 geographical areas) w!1ich are equal to the Wisconsin-Minnesota manufacturing grade price plus a differentiaL The differential reflects the greater costs required to meet sanitary standards, the monopoly power of the d:tiry coopcra tives, 1 and the relatively inelastic demand for raw fluid grade milk. Currently about 78% of U.S. milk output meets fluid market standards while about 55% of this output is actually used in fluid products.2 Dairy farmers in turn receive a "blend price" from the cooperative which is· a simple average price for all milk received for that area. Dairy farmers also receive an implicit price support through heavy import restrictions on foreign dairy products.
The purpose of this study is to estimate, in addition to the direct costs mentioned above, the costs to consumers due to the increased prices of dairy products. The methodology employed is to specify and estimate an econometric model of the U.S. dairy sector. The model is then used to measure the impacts on consumer
I The Capper-Volstcd Act exempts dairy farmer cooperatives from antitrust prose~ution.
1 For a more detailed discussion of the federal order system, sa Kessel (1967). An excenent introduction to milk pricing can be found in M3nchester (1971).
1

'".!
2 THE REVIEW OF ECONOMICS AND STATISTICS
prices over the 1949-73 period of the price support program and the federal order system. These retail price changes were then used as a cost of living index to measure the costs to consumers of these programs.
I. Specification of the Model
The model of the U.S. dairy industry presented here may be divided into three main sectors: retail demand equations; retail price formation relations; and farm output and price determination relations.
Total milk output at the farm level increased steadily from the early postwar years to 1964 when it peaked at 127 billion pounds. This level was achieved in spite of a decline in the dairy cow inventory. The apparent contradiction between falling herd levels and increasing output is reconciled by the increased yield per cow experienced over the postwar period. Yields have increased from 5,314 pounds per cow in 1950 to 11,419 pounds per cow in 1973. The increase in yields is due to several factors including improved sanitary conditions, higher feeding rates, enhanced veterinarian practices, mechanization of the milking process, and perhaps most importantly the change in the herd composition from lower yielding Guernsey breeds to the higher yielding Holsteins. Since the level and breed composition of the dairy cow inventory determine the level of milk output, the specification of the aggregate milk output relation requires a vintage capital production function analysis. In order to capture this vintage effect the following ex post production relation is employed:
TM01 = J{J/r, HFTCt , CFTCt , t} (I)
where TMO is total milk output, HFTC is hay fed to cows, CFTC is concentrates fed to cows, I is "gradual" technical change, such as better sanitary and veterinary conditions, and V is given by
5 . . ( ) v, = ~i= 1 gt-i DCA t- i 2
where DCA is the number of cows (added to the herd) of the t - i th vin tage and g? is the pro-
1 Productivity varies over the age or the cow, reaching a maximum at the rourth lactation. For this study, data on the lactation-yieltl profile were taken rrom Norman et al. (1974). The overaU lactation-yield profile was assumed to grow at 2% per year.
ductivity (yield) of that vintage animal. The relation given by (2) leads to consideration of the definition of the dairy cow inventory
DCI, = DCI,_1 + DCA, - DCS, (3)
where DCI is the dairy cow inventory, DCA is dairy cow additions, and DCS is dairy cow slaughter plus dead cows. The useful life of a dairy heifer which has been added to the inventory is about four to five years. Hence, most of the dairy cow slaughter is composed of animals which were added to the herd four to five years ago as well as animals which are slaughtered because farmers are quitting the business plus animals which die on the farm. There is also a price response which affects the time when these depreciated capital items are scrapped. If slaughter (beef) prices are high relative to milk prices, dairy farmers will slaughter more of the older animals than otherwise would be the case. Hence, the specification of the dairy cow slaughter relationship is
where PNFC is the slaughter price of dairy cows and BPM is the blend price of milk. The unemployment rate (U R) represents the employment opportunities in the nonfarm economy. The demand for dairy cow additions is a standard investment demand relation,
DCA, = J{DCI,-I, (BPM/FCD)t) (5)
where FCD is the cost variable for dairy farming. The demand for feed consists of two inputs: concentrates (mainly corn and soybean meal) and hay and harvested other roughage. Roughage is generally produced by the dairy farmer and the desired output level depends on herd size and feed requirements, and on the level of concentrates fed. Likewise the demand for concentrates depends on output, level of hay fed and prices of concentrates relative to milk prices.
Retail level demand equations are specified for the six main dairy products: fluid milk, cheese, butter, frozen products, nonfat dry milk, and evaporated and condensed milk. Quantity demanded of each product is a function of the own price, prices of substitutes (e.g., margarine in the case of butter), the overall price level and

DAIRY PRICE SUPPORT PROGRAM 3
a habit component-represented by the lagged value of consumption.4 Retail prices for these products are then specified as functions of the prices paid for milk and other dairy and distributing costs (mainly wage rates). Production and consumption are tied together via an identity for each product which says that the quantity produced equals consumption plus military purchases plus U.S . Department of Agriculture (USDA) purchases (for price support purposes) plus the change in stocks plus exports minus imports. The remaining variables to be determined in the model at this point are the prices and quantities of fluid and manufacturing grade milk. As mentioned above, the federal milk marketing order system sets the price for milk eligible for the fluid market equal to the manufacturing grade price plus an administratively determined differential. This differential is taken as exogenous for purposes of the model, or
PMEFM = PMGM + FMMOD, (6)
where PM EFM is the price of milk eligible for the fluid market, PMGM is the price of manufacturing grade milk, and FM MOD is the federal milk marketing order differential. The quantity of milk demanded for the fluid market is treated as a function of the total production of fluid milk at the retail level. Discrepancies between the two are due to measurement errors and to fluid grade milk being used for manufacturing purposes. Since the quantity of manufacturing grade milk (QMGM) is determined residually via the relation
QMGM = TMO - QMEFM, (7)
the remaining variable is the price of manufacturing grade milk (PMGM). Manufacturing grad'! milk prices are determined in the large competitive milkshed market of Minnesota and Wisconsin. The model for this competitive adjustment process used here relates the rate of change of prices to the excess demand for manufacturing grade milk. In order to allow for adjustments to equilibrium the final specification is
PMGM, = f{(LIMDPQ/QMGM)/ (8 )
4 This habit component was found to be significant for dairy pr~ucts in an independent study by Brown and Heien (1972).
where LIM DPQ is a Laspeyres index of manufactured dairy product quantities.
The model specified above was estimated by OLS using annual data from 1950-69. The estimated equations, the various identities, and variable definitions, are contained in appendix A. The years 1970-74 were used for a prediction interval test to validate the model. The results of this test are given in appendix B for selected variables. Also of interest in the construction of an econometric model are the impact effects. Appendix C gives the elasticities for selected exogenous variables with respect to the more important endogenous variables.
II. Price Support Costs
As mentioned above, the total cost over the postwar period of the CCC dairy price support program has been $7.048 billion. In order'to compute the additional costs to consumers occasioned by higher dairy product prices, the model was first run over the postwar period with all exogenous variables at their actual values.5 Next, the model was rerun over the same time period, only this time the values of government net removals of butter, cheese, evaporated milk and dry milk were set at zero,
~ -'~ - '-''''<~ ~
i.e., a "free market" solution. In each of these ' )- . . two runs the CPI item index for dairy products /-"v 0.
was computed for each year. The difference t ... _' _
between these two indexes times the relative , importance for that year of dairy products in ..Jj . ,,/ .1. J the CPI gives the amount by which the all-items CPI would decrease in the absence of price supports. CPI for all items was computed for each year from 1949 to 1974 in this manner. Next, the CPI was used as a true cost of living index enabling the computation of the welfare loss due to higher dairy prices in dollar terms. This computation involved mUltiplying the ratio of the two CPr's (with and without the price support) times disposable personal income for tha t year. The total loss over the 1949-74 period was $3.405 billion. Hence, the total cost of the program over these twenty-six years was $10.453 billion, or an average of $402 million per year. In order to measure the impact of the
S All lagged endogenous variables (such as consumption of each of the dairy products) came from the previous period's solution.
· I
4 THE REVIEW OF ECONOMICS AND STATISTICS
federal milk marketing order system, the premium (or ditTerential) for fluid market milk was set !9u~UQ~~ . .r.9.J£~ ea <:.h ye~r from 1949 to 1973. This is a somewhat extreme assumption since some (small) ditTerential would presumably remain in order to cover the costs of meeting the more stringent sanitary conditions. The same procedure as outlined above was followed for this case. The resulting costs were $4.558 billion over the en tire period, an average of $175 million per year. This figure appears somewhat low in view of other estimates. For example, Roberts (1975, p. 3) reports a conservative estimate of $500 million per year. However, traditional studies have been based on an assumption of inelastic demands for fluid milk. For our estimates here, demand is inelastic in the short-run only. The initial impacts (the first few years) found in the model of a removal of the differential were slightly greater than the
$500 million figure. However, as time passes and past price reductions work through the system, demand increases more than proportionately. Also, other studies ignored the impact on the supply side of decreased hlend prices on dairy cow additions and hence ultimately on milk output. Furthermore, decreases in fluid prices will (especially in the face of elastic demand) result in higher manufacturing grade prices and hence higher prices for those manufactured dairy products. The prices of these products in turn are an important component of the CPI for dairy products. On the other hand this study ignores other factors such as administrative costs, the effect of reconstituted milk, etc. Also no attempt is made to estimate the cost to consumers of dairy import quotas. For an interesting discussion and estimates of these costs see U.S. Department of Agriculture ( 1975).
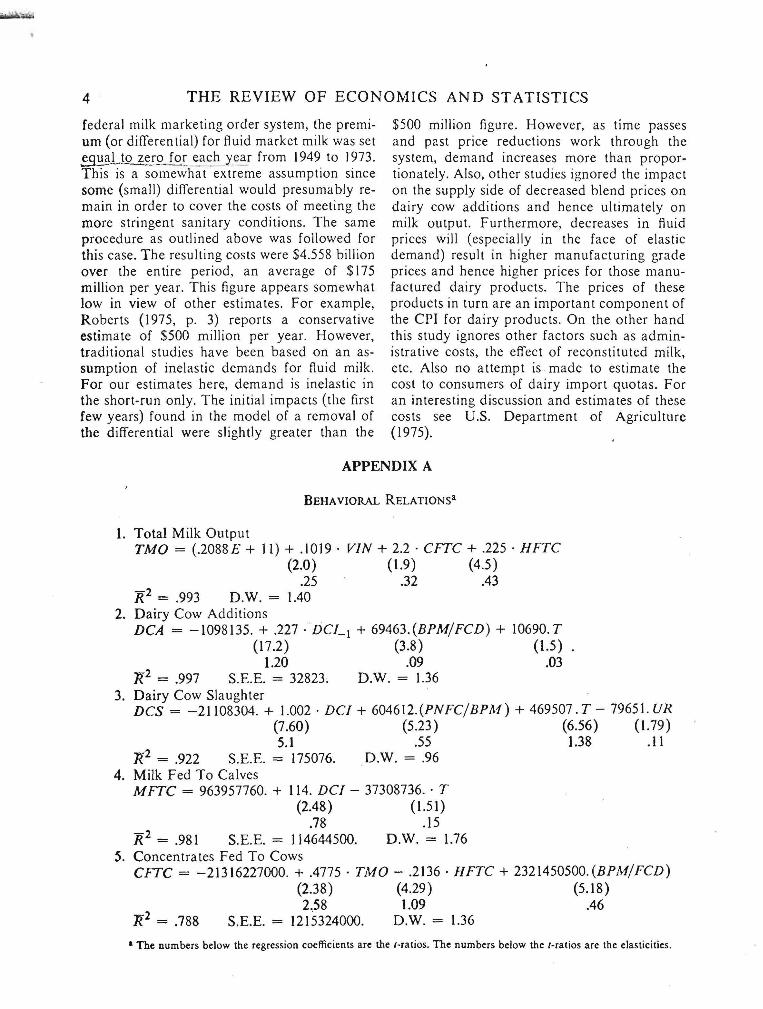
APPENDIX A
BEHAVIORAL RELATlONSa
1. Total Milk Output TMO = (.2088E + 11) + .1019· VIN + 2.2 . CFTC + .225 . HFTC
(2.0) (1.9) (4.5) .25 .32 .43
]{2 = .993 D.W. = 1.40 2. Dairy Cow Additions
DCA = -1098135. + .227 . DCL I + 69463.(BPM/FCD) + 10690.T (17.2) (3.8) (1.5)
1.20 .09 .03 J(2 = .997 S.E.E. = 32823, D.W. = 1.36
3. Dairy Cow Slaughter DCS = -21108304. + 1.002· DCI + 604612.(PNFC/BPM) + 469507. T - 79651. UR
(7.60) (5.23) (6.56) (1.79) 5.1· .55 1.38 .11
J(2 = .922 S.E.E. = 175076. D.W. = .96 4. Milk Fed To Calves
M FTC = 963957760. + 114. DCI - 37308736 .. T (2.48) (1.51)
.78 .15 ]{2 = .981 S.E.E. = 114644500. D .W. = 1.76
5. Concentrates Fed To Cows CFTC = -21316227000. + .4775· TMO - .2136· HFTC + 2321450500. (BPM/FCD)
(2.38) (4.29) (5.18) 2.58 1.09 .46
J(2 = .788 S.E.E. = 1215324000. D.W. = 1.36
• The numbers below the regression coefficients are the I·ratios. The numbers below the I· ratios are the elasticities.
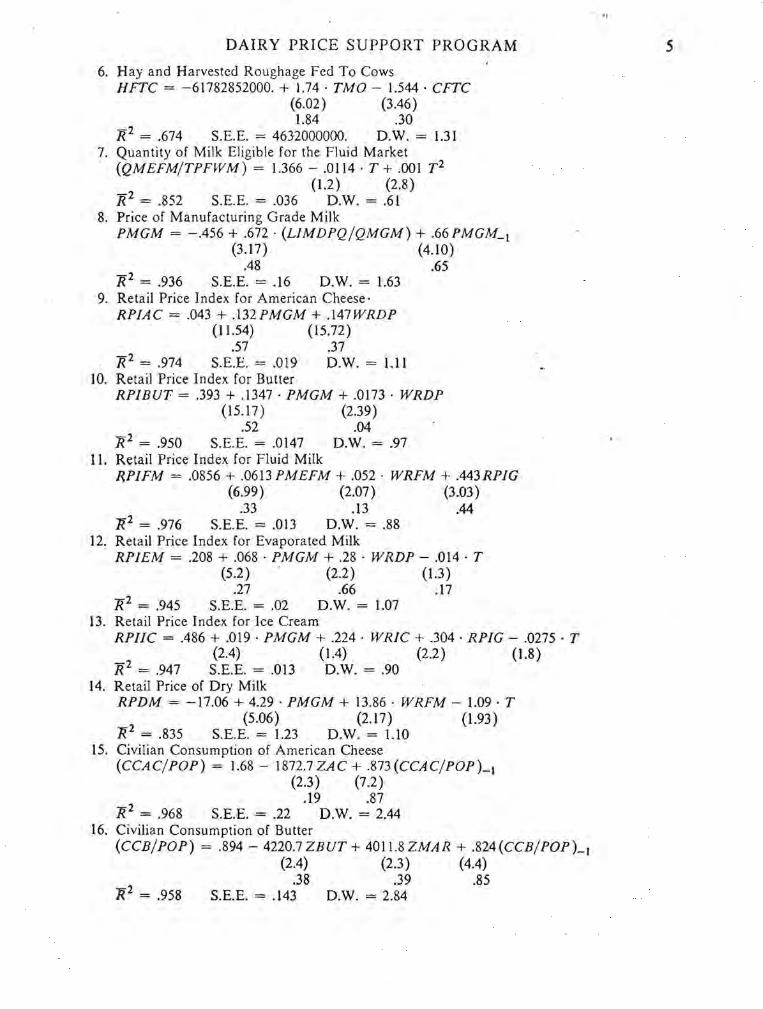
DAIRY PRICE SUPPORT PROGRAM
6. Hay and Harvested Roughage Fed To Cows HFTC = -61782852000. + 1.74· TMO - 1.544· CFTC
(6.02) (3.46) 1.84 .30
"R2 = .674 S.E.E. = 4632000000. D.W. = 1.31 7. Quantity of Milk Eligible for the Fluid Market
(QMEFM/TPFWM) = 1.366 - .0114· T + .001 T2 (1.2) (2.8)
"R2 = .852 S.E.E. = .036 D.W. = .61 8. Price of Manufacturing Grade Milk
PMGM = -.456 + .672· (LlMDPQ/QMGM) + .66PMGM_1 (3.17) (4.10)
.48 .65 "R2 = .936 S.E.E. = .16 D.W. = 1.63
9. Retail Price Index for American Cheese· RPIAC = .043 + .132PMGM + .147WRDP
(I 1.54) (15.72) .57 .37
"R2 = .974 S.E.E. = .019 D.W. = 1.11 10. Retail Price Index for Butter
RPIBUT = .393 + .1347 . PMGM + .0173· WRDP (15.17) (2.39)
.52 .04 R2 = .950 S.E.E. = .0147 D.W. = .97
11. Retail Price Index for Fluid Milk ~PIFM = .0856 + .0613 PMEFM + .052 . WRFM + .443RPIG
(6.99) (2.07) (3.03 ) .33 .13 .44
R2 = .976 S.E.E. = .013 D.W. = .88 12. Retail Price Index for Evaporated Milk
RPIEM = .208 + .068 . PMGM + .28 . WRDP - .014 . T (5.2) (2.2) (1.3)
.27 .66 .17 "R2 = .945 S.E.E. = .02 D.W. = 1.07
13. Retail Price Index for Ice Cream RPIIC = .486 + .019· PMGM + .224· WRIC + .304· RPIG - .0275· T
(2.4) (1.4) (2.2) (1.8) "R2 = .947 S.E.E. = .013 D.W. = .90
14. Retail Price of Dry Milk RPDM = -17.06 + 4.29 . PMGM + 13.86· WRFM - 1.09· T
(5.06) (2.17) (1.93) R2 = .835 S.E.E. = 1.23 D.W. = 1.10
15. Civilian Consumption of American Cheese (CCAC/POP) = 1.68 - 1872.7 ZAC + .873 (CCAC/POP)_l
(2.3) (7.2) .19 .87
"R2 = .968 S.E.E. = .22 D.W. = 2.44 16. Civilian Consumption of Butter
(CCB/POP) = .894 - 4220.7 ZBUT + 4011.8 ZMAR + .824(CCB/POP)_1 (2.4) (2.3) (4.4)
.38 .39 .85 N2 = .958 S.E.E. = .143 D.W. = 2.84
C "
5

!I )~rk1ir4'n;! ~ ~. i j;"\ ;·&·-t!b .... *ti>~'jd' "';\Z W4t4",¢;;'~ tnkiAsten i9~.·;', ,~;;.;.:J1i.~ M:it" "~"h"":. '''4(=-''=*-~;P";.k ! a-Jt ::}~' ''' ::';n ( :b·bfd;.¢!6*zjli ·;·$~\t4itkti';~z:l, t1.G4M'':i+i;,i.itfturu ~~ .
6 THE REVIEW OF ECONOMICS AND STATISTICS
17. Civilian Consumption of Fluid Whole Milk (CCFWM/POP) = -225- 42833.5ZFM + 76736.6ZAO + .982 (CCFWM/POP)_1
(.6) (1.0) (8.2) .09 .18 .99
R:2 = .997 S.E.E. = 3.60 D.W. = 1.61 18. Civilian Consumption of Dry Milk
(CCDM/POP) = 8.19 - l76.ZDM - 19973.ZAO + 19076.ZFM (1.7) (2.0) (1.9)
.37 2.6 2.2 + .l84(CCDM/POP)_1
(.8) .18
R:2 = .902 S.E.E. = .372 D.W. = 2.16 19. Civilian Consumption of Evaporated and Condensed Milk
(CCEACM/POP) = -4.01 - 9661.ZEM + 9840.9· ZFM + 8755.8· ZAO (1.3) (.8) P)
.40 .41 .42 +.817 (CCEACM/POP)_1 (4.5)
.86 J{2 = .996 S.E.E. = .29 D.W. = 2.56
20. Civilian Consumption of Frozen Products ,(CCFP/POP) = 13.92 - 8884.8ZIC + 15284.ZAO
(2.9) (2.5) .32 .56
. [(2 = .995 S.E.E. = .28 D.W. = 2.14
IDENTITIES
21. Dairy Cow lnven tory DCI = DCL I + DCA - DCS - .02DCL1
22. Quantity of Milk Processed QMP = TMO - MFTC
23. Quantity of Manufacturing Grade Milk QMGM = TMO - QMEFM
24. Blend Price of Milk . .
BP¥ = (QMGM . PMGM + PMEFM . QMEFM)/(QMGM + QMEFM) 25. Price of Milk Eligible for Fluid Market .
PMEFM = PMGM + FMMOD 26. Total Production of Butter
TPBUT = CCB + XBUT 27. Total Production of Cheese
TPC = CCAC + XC 28. Total Production of Fluid Whole Milk
TPFWM = CCFWM + XFWM . 29. Total Production of Dry Milk
1TPDM = CCDM + XDM 30. Total Production of Evaporated and Condensed Milk
TPEACM = CCEACM + XEACM 31. Total Production of Frozen Prod ucts
TPFP = TCFP 32. Consumer Price Index Dairy Products
CPIDP = .0774· RPIB + .0933RPlAC + .0275RPIEM + .1253RPlIC + .0231 . RPDM + .6537 . RPIFM

BPM CCB CCAC CCFWM DCA DCI DCS FCD FMMODb LIMDPQ
DAIRY PRICE SCPPORT PROGRAM
UST ('1' \·.~IABLES
- Blend price of I7.::~-l'SD.-\ -Civilian consurr.:-::,'~ of b:::~-L"SDA - Civilian consurr.~::,':: C'f .-\~::-::.ln cheese -Civilian consurr:~ :: ,'~ l"'f r.:.:i": \Io:-:,'!e milk-USDA - Dairy cow addi:::,':".s-CSD.-\ - Dairy cow inven:,'~ \hnu.i:Y Il-USDA -Dairy cow slau{':: .. ~-l· SD.-\ -Feed cost dairy = .~2 ' PC i.l2 .... . 18PSM/2.8! -Federal milk ~.::-~ .. :.: ::~ l'i';"~ ':':::~ren(ial-computed from 25 - Laspeyres indel; ,'i ::-:2Jn:f.>::-,::N dairy product quantities
= .I~ . TPBUT TP2CJ~.$ - -~ . TPFP,TPFP68 + .15 . TPEACM/TPEACM68 + .23TPC/TPCN - . I.tTPD.V TPD.\f68 .
MITC -Milk fed to cah·~-CSD.-\ PA Ob -Price index of 211 n-.':1Junt-!~ ~d senices less beef, pork and poultry-BLS PC -Price of corn- tSD.-\ PCEN DSb - Personal consulT.:-:::,'a e."(~::~:~~s on nondurables and services-BEA PM EFM - Price of milk eh:; :-:~ fLlr f.~.: .:: :::.:u-kel-USDA PMGM -Price of manuf:!~::.:..o-::!~ f!2'::" c ilk-USDA PN FCb - Price of non-fed ,-.::.::':>!'-l·SD.-\ POpb - Population-Cen~::s PRBFDP - Price's received h :.!.:,ne;-s f,'; ..:.tiry' products- USDA PSMb - Price of soybe3.i1 '~~.!.l-l·SD.-\ QM EFM -Quantity of milk e: : :::r~.:- f,'~ ::::.:..1 m:lrkel-Computed from 24 QMGM -Quantity of man:':':'2::l:rir:~ :::-2':'.:- milk-computed from 23 QMP -Quantity of milk rr,''D.'-.->J-l·SDA RPDM '-Retail price of dry :::ilk-l·SD.-\
.RPIAC -Retail price ind~x :,'r .-\m;?r:."..!.:1 cheese-BLS RPIBUT -Retail price inJe\ f.:-r bun.:-,-BLS RPIEM -Retail price index fl.'. e\":!F":-2:~ milk-BLS RP I FM - Retail price ind~l; f,'r nu:J r:: ::~-BLS RPIGb -Retail price indel; f,'r ps..';:::~BLS
. RPI/C -Retail price index :,'~ ice c~':'::1-BLS RPIMb -Retail price index !,'f c.u-~~-:::~BLS ]1> -Time trend; 19~() = I. 1951 = 2,0, , .. TMO - Total milk outru:-CSDA TPBUT -Total productil'n I.': l:>:.::!~-rSD.-\ TPC - Total productil'D I.':' c::~·~-l"SD.-\ TPDM - Total producli0n I.': .:.~. l7: : ~..:-:-L"SDA TPEA CM -Total productil'!1 ,,:' ~\-20-':-2:~ ':.::.1 cor;.:!ensed milk-USDA TPFP - Total production I.': [:-"'::~:1 ;':-.. --:~('tS-l·SDA TPFWM -Total productit"'TI I.' ': ::::':J ';I.:' ... ' :;'> r.:ilk-l"SDA VIN -= (I1055· DC. .. - r:i3'l, :'-\..-'LL.- 13250· DCA_2 + 13250· DCA_
3
WRDpb WRFMb WRICb XBU]1>
+ 14000· DCA-l. - 13s...\1, x., ~T.rR = DCI - DCA - DCA_I - DCA_2 - DCL: - DC.(-l.
- Wage rate in d:1::: ;':-"'~:-'f. :'::-:;t:S-try-BLS - Wage rate in flui': =.:::s: i:-."::;:;~-BLS - Wage rate in th~ ~~ ~.L-:: :::":':::S:"~'-BLS
- TP BUT - CC B: ,','~-.s::.:-.;. ,-{ 1."':..:.::;;.' in commercial stocks, imports, exports, military consum;--::.:.:: .I..::J l ·SD.-\ C~~ r:.:=-chases
7

8
xC> XDMb XEACMb XFWMb ZAC ZAO ZBUT ZDM ZEM ZFM ZIC ZMAR
THE REVIEW OF ECONOMICS AND STATISTICS
-TPC - CCC -TPDM - CCDM -TPEACM - CCEACM - TPFWM - CCFWM -RPlAC/(PCEN DS/POP) -PAO/(PCENDS/POP) -RPlBUT/(PCENDS/POP) -RPDM/(PCENDS/POP) - RPl EM /(PCEN DS/ POP) -RPlFM/(PCENDS/POP) -RPlIC/(PCENDS/POP) -RPlM/(PCENDS/POP)
Note: BEA = Bureau of Economic Analysis; BLS = Bureau of Labor Statistics;.-USDA= U.S. Department of Agriculture. a The ratios of 82% and 18% reflect the historical proportions of com and soybean meal.used in the dairy feed ration. b Denotes exogenous variable.
APPENDIX B. - Plu:D1CTlON INTERVAL TEST - PER CENT CHANGE FOR ACTUAL (A) AND Plu:D1CTED (P) SELECTED ENDOGENOUS VARlABLES: 1970-74
1970 t911 A P A r
DCA -1.7 -6.4 -.8 -6.2 DCS -12.8 -4.6 -3.0 -3.5 CPI-DP 4.7 2.2 3.1 .9 TMO .7 - .6 1.3 3.7 BPM 4.0 . 7 2.8 -2.3 CCFWM -1.5 -1.4 - .4 -1.6 QMEFM 3.0 1.4 2.9 1.5
APPENDIX C. - SHORT RUN IMPACT ELASTICITIES FOR
SELECTED ENDOGENOUS VARIABLES
FMMOD PC PPCENDS PCENDS XBUT
CPI-DP .03 .11 .03 -.01 .002 DCS - .03 -.16 -.03 .02 -.01 PMGM -.10 .40 .09 -.05 .018 PMEFM .18 .30 .07 -.04 .00 QMGM .28 -.91 - .18 .08 .00 TMO .08 -.28 .08 - .05 .00 TPBUT .02 -.07 -.02 .03 .17 DCA .03 -.01 -.03 -.02 .0 BPM .09 -.38 .09 - .05 .0 RPBUT -.06 .22 .05 - .03 .01 .
REFERENCES
Brown, Murray, and Dale Heien, "The S-Branch Utility Tree: A Generalization of the Linear Expenditure System," Econometrica 40 (July 1972), 737-747 .
Hallberg, M. c., and R. F . Fallert, Policy Simulation Model for the United States Dairy industry, Bulletin
1972 1973 19'74 A P A P A p
-2.9 -7.0 1.2 -16.9 1.8 4.1 - .7 -4.0 9.7 13.2 -9.1 ' -11.0 1.5 3.2 10.0 5.3 18.6 16.9 1.2 -2 .7 -3.8 1.6 0.0 .6 3.4 3.5 17.6 3.3 16.5 10.7 . 2.7 -.6 -7.0 -7.0 -4.0 -1.1 1.5 .7 -2.6 -1.0 1.0 1.6
805, Agricultural Experiment Station, The Pennsylvania State University (Jan . 1976).
Kessel, Reuben, "Economic Effects of Federal Regulation of Milk Markets," Journal oj Law and Econom-ics (Oct. 1967),51·78 . .
Manchester, Alden, Pricing Milk and Dairy Products, Agricultural Economics Report no. 207, U.S. Department of Agriculture (June 197 I).
Norman, H. Duane, Paul Miller, Ben McDaniel, Frank Dickinson, and Charles Henderson, "USDA-DHI Factors for Standardizing 305-Day Lactation Records for Age and Month of Calving," USDA-ARSNE 40, U.S . Department of Agriculture (Sept. 1974).
Roberts, Tanya, Review oj Economic Literature on Milk Regulation (Washington, D .C.: The Public Interest Center, Dec. J 975).
Rojko, Anthony S., The Demand and Price Structure Jor Dairy Products, U.S. Department of Agriculture Technical Bulletin no. 1168 (1957).
U.S. Department of Agriculture, The Dairy Situation, USDA-ERS (Nov. 1974).
--, The impact oj Dairy imports on the U.S. Dairy industry, Agricultural Economic Report no. 278 (Jan. 1975).