the response of lipoprotein lipase to feeding and fasting · the response of lipoprotein lipase to...
TRANSCRIPT

THE JOURNAL OF BIOLOGICAL CHEMISTRY Vol. 265, No. 6, Issue of March 15, pp. 4570-4577, 1990 Printed in U.S.A.
The Response of Lipoprotein Lipase to Feeding and Fasting EVIDENCE FOR POSTTRANSLATIONAL REGULATION*
(Received for publication, August 1, 1989)
Mark H. Doolittle$, Osnat Ben-Zeev, John Elovson, Dominique Martin, and Todd G. Kirchgessner From the Lipid Research, Veterans Administration, Wadsworth Medical Center, Los Angeles, California 90073 and the Department of Medicine, University of California, Los Angeles, California 90024
The regulation of adipose tissue lipoprotein lipase (LPL) was examined in rats fed or fasted overnight, and was found to be controlled posttranslationally. LPL catalytic activity decreased by 50% after fasting while LPL mRNA levels and rates of synthesis in- creased nearly %-fold; enzyme mass remained un- changed. The distribution of LPL within the endo- plasmic reticulum (ER) and Golgi/post-Golgi secretory pathway was assessed by differentiating between LPL high mannose and complex forms. After fasting, the majority of LPL is in the high mannose ER form (65%, 0.97 pg/g wet weight tissue), whereas the LPL complex form comprises only 35% (or 0.52 pg/g). After refeed- ing, however, the Golgi-derived LPL complex form predominates (65%, 1.03 pg/g) over the high mannose ER form (35%, 0.55 rg/g). Kinetic analysis suggests that high mannose LPL disappears with a half-life of t0.s = 40 min in both fed and fasted rats, indicating that the redistribution of LPL mass during feeding/ fasting does not arise by differential retention within ER. Instead, the fractional catabolic rate of complex LPL within the Golgi/post-Golgi secretory compart- ment can be calculated to be 3.5-fold greater in fasting. In heart, changes in LPL activity in response to feed- ing/fasting are also not due to differences in mRNA levels or rates of synthesis. Based on these findings, a model of LPL posttranslational regulation is proposed and discussed.
Lipoprotein lipase (LPL’; EC 3.1.1.34) is a N-linked gly- coprotein secreted by parenchymal cells from a variety of extrahepatic tissues, principally muscle and adipose tissue (1). The secreted enzyme, bound at the surface of capillary endo- thelium (2) and called “functional LPL,” is involved in the hydrolysis of triglycerides from circulating chylomicrons and
* This work was supported by Grant HL 28481 from the National Institutes of Health, American Heart Association Grant 492-IG15, Greater Los Angeles Affiliate, and by the Veterans Administration. The costs of publication of this article were defrayed in part by the payment of page charges. This article must therefore be hereby marked “advertisement” in accordance with 18 USC. Section 1734 solely to indicate this fact.
‘r To whom corresnondence should be addressed: Lipid Research, VA Wadsworth Medical Ctr., Bldg. 113, Rm. 312, Los Angeles, CA 90073.
I The abbreviations used are: LPL, lipoprotein lipase; ER, endo- plasmic reticulum; HEPES, N-2-hydroxyethylpiperazine-N’-2-eth- anesulfonic acid; SDS, sodium dodecyl sulfate; SSC, 0.45 M NaCl, 0.045 M trisodium citrate; Staph A, crude insoluble protein A from lyophilized Staphylococcus aureus cells (Cowan strain); Endo H, endo- @-N-acetylglucosaminidase; PBS, 0.15 M NaCl in 0.1 M sodium phos- phate buffer, pH 7.4; FTR, fractional turnover rate; FCR, fractional catabolic rate.
very low density lipoproteins. Postprandially, LPL activity is elevated in adipose tissue compared with heart and muscle, resulting in the channeling of circulating triglyceride fatty acids into lipid depots. During fasting, the inverse is true; relatively high heart and muscle LPL activities redirect tri- glyceride fatty acids appropriately into these tissues and away from adipose stores (1, 3). Obviously, the coordinated regula- tion of LPL in adipose tissue and muscle during feeding/ fasting is critical for maintaining triglyceride homeostasis. For example, in obesity, overexpression of adipose tissue LPL may contribute to increased triglyceride deposition (4).
In chicken (5) and guinea pig (6), a prolonged 48-h fasting period was observed to reduce, in parallel, adipose tissue LPL activity and mRNA levels. However, insulin, which is believed to be the major effector of LPL postprandially (l), increases LPL activity in 3T3-Ll adipocytes, whereas LPL synthetic rate decreases (7). Indeed, many possible mechanisms of regulating LPL at posttranslational levels have been reported: e.g. catalytic activity may depend on the acquisition and complete processing of LPL’s N-linked oligosaccharide chains (8-10); newly synthesized LPL is degraded rather than se- creted in the absence of heparin (11-15); and, insulin-en- hanced LPL secretion may depend on a phospholipase that releases LPL from a membrane bound glycosyl phosphatidyl- inositol anchor (16).
Thus, the role of LPL transcription and translation in regulating adipose tissue and heart LPL activity and mass levels was investigated in rats fasted or refed over a period of 12 h. This period of time was chosen since most animals undergo a natural feeding/fasting cycle of approximately l/z day. In addition, to verify posttranslational changes in the cellular distribution and kinetics of adipose tissue LPL in response to feeding and fasting, glycosidase sensitivity was used to distinguish between LPL high mannose and complex forms. These two forms represent the products of a series of N-linked oligosaccharide processing events that are known to occur within the ER and Golgi apparatus, respectively (17); thus, glycosidase sensitivity was used as a means of locating LPL to these organelles (18).
EXPERIMENTAL PROCEDURES*
RESULTS
Adipose Tissue LPL mRNA Levels and Rates of Synthesis after Feeding and Fasting-Northern blots of total adipose tissue RNA (Fig. 3) hybridized to a mouse LPL cDNA clone showed a single mRNA species at 3.6 kilobases. Scanning
* Portions of this paper (including “Experimental Procedures” and Figs. 1 and 2) are presented in miniprint at the end of this paper. Miniprint is easily ;ead with the aid of a standard magnifying glass. Full size Dhotocopies are included in the microfilm edition of the Journal &at is available from Waverly Press.
4570
by guest on August 30, 2018
http://ww
w.jbc.org/
Dow
nloaded from

Regulation of Lipoprotein Lipase 4571
LPL mRNA- - *’
FIG. 3. Northern blot analysis of LPL mRNA in heart and adipose tissue of fed and fasted rats. Ten fig of total RNA from each experimental group were electrophoresed and blotted to nylon, followed by hybridization with mouse LPL cDNA clone mL5 as described under “Experimental Procedures.” The LPL mRNA size is 3.6 kilobases.
TABLE I Response of adipose tissue LPL to 12-h feeding and fasting
Feeding and fasting experiments were performed as described under “Experimental Procedures.” All values, except mRNA, are the mean If- S.E. of six animals from each experimental group. The mRNA values are the mean + S.E. of three pools of tissue, each from three animals, for each nutritional condition. LPL activity and mass are expressed per g wet weight tissue. mRNA levels are expressed relative to cu-actin, determined on the same blot with a rat actin cDNA probe. tu-Actin did not change significantly @ > 0.05) in heart or adipose under the two nutritional conditions. The rate of synthesis is ex- pressed as a percentage of counts/min incorporated into LPL com- pared with counts/min incorporated into total acid-precipitable pro- tein following a 20-min pulse of [““Slmethionine. The specific activity is expressed as units/mg LPL protein, calculated from the activity and mass data in rows 1 and 4.
LPL Fasted Fed Fast/Fed
Activity (milliunits/g) 709 f 34.0 1630 f 104” 0.44 mRNA (arbitrary units) 95.1 + 3.53 56.0 + 6.43 1.70 Rate of synthesis (‘?A) 0.318 & 0.030 0.176 * 0.011” 1.80 Mass bg/g) 1.50 ? 0.108 1.60 + 0.074h 0.94 Specific activity 29,200 62,000 0.47
(units/mg)
” Differences between fasted and fed are significant at thep < 0.005 level.
’ Difference between fasted and fed is not significant (p > 0.05).
densitometry of Northern blots revealed that changes in mRNA levels following feeding or fasting were parallel to changes in LPL synthetic rates, measured by incorporation of [‘“Slmethionine (Table I). However, although LPL mRNA levels and synthetic rates increased nearly P-fold after fasting, activity decreased by over 50%. Similarly, enzyme mass did not accompany activity loss after fasting, resulting in a 50% decrease in specific activity (units/mg LPL protein). The nature of the changes mentioned above was very reproducible and a typical response of adipose tissue LPL to 12-h feeding and fasting is shown in Table I. Since LPL mRNA levels, synthetic rates, and enzyme mass could not account for changes in activity, LPL regulation in response to 12-h feed- ing/fasting must be controlled posttranslationally.
Characterization of Rat Adipose Tissue LPL by Endo H Digestion-Only the high mannose form of N-linked glyco- proteins is susceptible to Endo H digestion, leaving the pro- tein intact but unglycosylated (19) and resulting in a reduction in molecular mass resolvable by SDS gel electrophoresis. Endo H sensitivity was thus utilized to distinguish between the LPL high mannose form in the ER and LPL contained within the Golgi/post-Golgi secretory pathway.
Mouse LPL (20) contains two potential N-linked glycosyl-
intermediate Eat
B
I-S-RICIN CHROMATOGRAPHY
56kD -a
1 2 3 4 FRACTION
5 6 7 6 FRACTION
t IlOOmM GALACTOSE (
FIG. 4. Characterization of adipose tissue LPL after diges- tion with Endo H. Adipose tissue from fed animals was pulse- labeled for 10 min and then chased for 40 min. LPL was immunopre- cipitated and then incubated with 1.25 units of Endo H at 37 “C for 16-20 h as described under “Experimental Procedures.” The term “end point” digestion designates these conditions of Endo H digestion, since all susceptible oligomannosyl residues are cleaved (data not shown). A, treatment of LPL immunoprecipitates with both neura- minidase and Endo H. 0.45 ml of adipose tissue lysate was incubated with or without 0.25 unit of neuraminidase for 60 min at 0 “C. LPI, immunoprecipitated from these lysates was treated with Endo H as described above. Shown is the fluorogram of the SDS polyacrylamide gel. The LPL bands referred to as “intermediate” and “high mannose” are the products of Endo H cleavage; the slight decrease in molecular mass of the complex and intermediate forms is due to neuraminidase treatment. B, fractionation of high mannose and intermediate/com- plex forms of LPL by fl-ricin chromatography. The neuraminidase- treated lysate was fractionated as described under “Experimental Procedures.” Column samples comprising the flow-through (l-4) and galactose-eluted (5-8) fractions were subjected to LPL immunopre- cipitation and end point Endo H digestion as described above. Shown is the fluorogram of the SDS polyacrylamide gel. The complex form of LPL has a molecular mass of 56 kDa.
ation sites with the consensus sequence Asn-X-Ser(Thr), where X is any amino acid but proline (21, 22), and both of these sites are utilized for glycosylation.” Likewise, rat LPL contains two glycan groups/protein molecule, as ascertained by partial glycosidase digestion (18, 23) of LPL immunopre- cipitates (data not shown). However, not all high mannose chains in LPL are processed to the complex form in rat adipose tissue. For example, Fig. 4A shows that a 12-h Endo H digestion of LPL immunoprecipitated from adipose tissue pulse-labeled for 10 min and chased for 40 min results in three distinct molecular mass products: the complex, Endo H-resistant form (56 kDa); the fully Endo H-sensitive high mannose form (50 kDa); and a partially Endo H-sensitive intermediate form (53 kDa). This result suggested that the intermediate form represents a “hybrid” LPL molecule, con- taining one high mannose and one complex chain. This was found to be the case by examining the sensitivity of the intermediate form to neuraminidase, which cleaves the ter- minal sialic acid residue added in the trans-Golgi. Like the complex form, the intermediate form is sensitive to neura- minidase cleavage (Fig. 4A; note the slight decrease in molec- ular mass of both complex and intermediate forms compared
” G. Ailhaud, personal communication.
by guest on August 30, 2018
http://ww
w.jbc.org/
Dow
nloaded from

4572 Regulation of Lipoprotein Lipase
with high mannose after neuraminidase treatment). The nature of the Endo H cleavage products was confirmed
by fl-ricin affinity chromatography. /3-Ricin binds the penul- timate galactose residue of complex carbohydrate chains (24); like sialic acid, this galactose residue is added only in trans- Golgi. A sample from the adipose tissue lysate shown in Fig. 4A was passed through the column. The flow-through (frac- tions l-4) and galactose-eluted fractions 5-8 were subjected to LPL immunoprecipitation and Endo H cleavage (Fig. 4B). Clearly, the unbound LPL present in the flow-through is fully Endo-H-sensitive, representing the high mannose form. In contrast, both the intermediate and complex forms are bound and subsequently eluted with galactose. Since processing of the oligomannosyl chain to its complex form is completed in tram-Golgi, both LPL intermediate and complex forms in rat adipose tissue are present in, or have passed through, this organelle.
Pulse/chase analysis (Fig. 5) indicated that the high man- nose form is the precursor to the intermediate and complex forms. Although a minor fraction of the LPL intermediate form may serve as a precursor to the complex form (see Fig. 5), the majority appears to be secreted, since at least 50% of radiolabeled LPL in the media of rat adipocytes is partially Endo H-sensitive (data not shown).
Distribution of Adipose Tissue LPL Mass after Feeding or Fasting-LPL high mannose, intermediate, and complex forms in adipose tissue from fed and fasted animals were determined to examine changes in the cellular distribution. Although incorporation of [3’S]methionine into total adipose tissue proteins following feeding/fasting was linear for at least 120 min, incorporation of label into LPL reached steady state (i.e. when LPL radiospecific activity and mass are equivalent)
10 20 40 60 80 CHASE (min) - + - + - + - + - + END0 H
LPL I - ..L - .x -
COMPLEX
0 I I 0 20 40 60 80 100
CHASE (min)
FIG. 5. Precursor/product relationship between the com- plex, intermediate, and high mannose forms of LPL. Epididy- ma1 fat pads from fed animals were pulse-labeled for 10 min and then chased for the times indicated. LPL was immunoprecipitated and treated with (+) or without (-) Endo H as described in the legend of Fig. 4. The three forms of LPL resulting from Endo H digestion are discussed in Fig. 4 and under “Results.” The bottom part of the figure is the quantitation of the SDS polyacrylamide gel and is expressed as the counts/min of [%]methionine-labeled LPL/mg of homogenate protein as a function of chase time.
within half that time (Fig. 6A). After 80 min, Endo H cleavage of LPL immunoprecipitates (Fig. 6B) clearly shows that changes observed in LPL activity after feeding or fasting (Table I) are accompanied by changes in the distribution of lipase mass. Scanning densitometry of Fig. 6B indicates that after fasting, this distribution is 65% high mannose and 35% intermediate/complex. Following refeeding, this 65:35 distri- bution inverts in favor of the intermediate/complex form. The absolute value of LPL mass represented by these forms can be calculated by multiplying the steady-state distribution percentage by the total LPL mass determined by enzyme- linked immunosorbent assay. Thus, following 12 h of fasting, the LPL mass in the high mannose and intermediate/complex forms are 0.97 and 0.52 pg/g wet weight tissue, respectively; after refeeding, the distribution becomes 0.55 and 1.03 pg, respectively (see Fig. 8).
Turnover Rates of LPL High Mannose and Complex Forms after Feeding and Fasting-During pulse/chase experiments, total adipose tissue LPL mass remained constant. Turnover rates of the LPL high mannose form measured in adipose tissue from fed or fasted rats were identical, with a &, = 40 min or fractional turnover rate (FTR) of 0.75 (h-‘) (Fig. 7A). Thus, the larger mass of the high mannose form following fasting (0.97 versus 0.55 pg) can be attributed to the propor- tional increase in the LPL synthetic rate and is not due to selective retention within the ER (see also Fig. 8). In contrast, the kinetics of the complex form are quite different. As shown in Fig. 7B, in fed animals, LPL radioactivity (represented as a fraction of the initial IO-min chase point) peaks approxi- mately 20-30 min after initiation of the chase, after which it disappears steadily. A different kinetic pattern, however, is observed in fasted animals: maximal LPL radioactivity ap- pears to have been reached very rapidly, as evidenced by the lack of a peak prior to the disappearing phase of the curve. Attainment of peak radiospecific activity so early on in these animals suggests that the pool size of the complex form of LPL is reduced by fasting, identical to the conclusion reached above (see Fig. 6B).
The reduced pool size of the intermediate/complex form after fasting appears to arise as a result of an increased fractional catabolic rate (FCR). The FCR of the LPL inter- mediate/complex form was calculated assuming that steady- state conditions exist; i.e. the influx of LPL from the high mannose form (high mannose pool size x FTR) equals the loss of the LPL intermediate/complex form due to degrada- tion (intermediate/complex pool size X FCR). Thus, the cal- culated FCR following fasting was 1.40 (h-l) compared with 0.40 (h-l) after refeeding, a difference of 3.5-fold (see Fig. 8).
Evidence for Posttranslational Regulation of Heart LPL- Adipose tissue and heart LPL activities are reciprocally reg- ulated after feeding or fasting (1, 3). Heart LPL activity increased 2-fold after fasting while activity decreased in adi- pose tissue (Table II). As in adipose tissue, changes in heart LPL activity following feeding/fasting were not accompanied by parallel changes in LPL mRNA levels (Fig. 3, Table II) and rates of lipase synthesis (Table II). However, in contrast to adipose tissue LPL, heart LPL mass changed proportion- ally with activity, maintaining a constant specific activity.
DISCUSSION
The decrease in rat adipose tissue LPL activity following a 12-h fast and its subsequent increase after refeeding are controlled posttranslationally. Compared with the fasted state, adipose tissue LPL activity increases over 2-fold after refeeding, whereas mRNA levels and rates of synthesis de- crease almost by half; enzyme mass remains unchanged. A
by guest on August 30, 2018
http://ww
w.jbc.org/
Dow
nloaded from

FIG. 6. The relative distribution of LPL mass in ER/cis-Golgi and Golgi/post-Golgi secretory compart- ments following feeding and fast- ing. A, the incorporation of [“‘Slmethi- onine into total proteins and LPL im- munoprecipitahle protein as a function of time of pulse. The measurement of label incorporation into total protein and immunoprecipitable LPL is described in the legend to Fig. 3 and under “Experi- mental Procedures.” B, LPL was immu- noprecipitated from: “FED” lane, 0.05 mg adipose protein, in which 3200 cpm of [“‘Slmethionine were incorporated into total LPL; “FASTED” lane, 0.07 mg of adipose protein containing 5000 cpm of [“Slmethionine incorporated into the total immunoprecipitable LPL. Scan- ning densitometry was used to quanti- tate the percent distribution of label into the three bands.
Regulation of Lipoprotein Lipase
A
FED
Pulse (min)
FASTED
-25 80’ Pulse
I t0 100 200 300 Pulse (min)
B
56 kD
A High Mannose
100 200 Chase (min)
120 1 B Complex
0 100 200 300 Chase (min)
FIG. 7. The kinetics of %-labeled high mannose and complex-type adipose tissue LPL after feeding/ fasting. Adipose tissue from overnight-fasted or refed animals was pulse-labeled for 20 min and then chased for up to 240 min as described under “Experimental Procedures.” LPL was immunoprecipitated, treated with Endo H and then fractionated by SDS polyacrylamide gel electrophoresis. The resulting bands representing the high mannose and complex form of LPL were quantitated by scanning densitometry. The results were expressed as a percentage of the intensity of the high mannose form after 10 min of chase. A, turnover rates of the high mannose form of LPL. B, the appearance and disappearance of label into the complex form of LPL. The pattern of labeling of the intermediate form was very similar to the complex form and is not shown for the sake of clarity.
similar finding was reported (7) in 3T3-Ll adipocytes, where insulin was shown to increase heparin-releasable LPL activity over 2-fold when enzyme synthesis decreased by about 50%.
In our studies, the use of adipose tissue in lieu of isolated adipocytes was a deliberate step to include in the analysis the fraction of LPL secreted and bound at the endothelial surface (functional LPL). Since the LPL mass in adipose tissue remained constant during incubation in vitro, there was no resulting net loss of LPL to the medium in the absence of heparin. Thus, in these studies, the intermediate and complex forms include LPL which has passed beyond cis-Golgi, in- cluding secreted, endothelial-bound LPL; the high mannose form represents LPL located intracellularly within the ER/ cis-Golgi. Thus, the calculated pool sizes of the high mannose
and intermediate/complex forms shown in Fig. 8 are repre- sentations of the LPL mass distribution within the adipose tissue, including the fraction of LPL bound at the endothelial surface under these experimental conditions. It should be noted that the calculated intermediate/complex pool sizes do not take into account endothelial-bound LPL that might have been lost to the medium, although in the absence of heparin, this would constitute a minor fraction (14).
A significant finding in our studies is that a major cellular redistribution of adipose tissue LPL occurs in response to feeding/fasting. Although the high mannose form comprises the majority of LPL following fasting, the intermediate/ complex form predominates after refeeding (Fig. 6); this strongly suggests a shift of LPL out of ER and into the post-
by guest on August 30, 2018
http://ww
w.jbc.org/
Dow
nloaded from

4574 Regulation of Lipoprotein Lipase
KINETIC PARAMETERS
FIG. 8. Summary of the kinetic parameters and pool sizes of the high mannose and complex types of adipose tissue LPL after feeding and fasting. The LPL mass of each compartment, located within the stippled boxes, is microgram LPL/g wet weight adipose tissue. The kinetic parameters are: relative rate of synthesis, defined as the percentage of [35S]methionine incorporated into LPL relative to total protein synthesis; FTR, defined as the fraction of the pool of the high mannose form of LPL turned over each hour with the units (hours-‘); and FCR, defined as the fraction of the pool of the intermediate/complex form of LPL leaving the system by degra- dation each hour with the units (hours-‘). The relative rate of syn- thesis and FTR were determined experimentally; the FCR was cal- culated from the pool sizes of the high mannose and intermediate/ complex forms of LPL (micrograms of LPL/g of tissue), and the FTR assuming the system was at steady state. For details see “Experimen- tal Procedures” and “Results.”
TABLE II Response of heart LPL following 12-h feeding and fasting
Fasting and refeeding experiments are described in the legend to Table I and under “Experimental Procedures.”
LPL Fasted Fed Fast/Fed Activity (milliunits/g) 1330 * 92.0 580 k 30.0” 2.31 mRNA (arbitrary units) 76.6 f 4.28 80.7 f 10.8* 0.95 Rate of synthesis (% ) 0.113 rt 0.003 0.096 + 0.002” 1.18 Mass (rdd 1.36 + 0.069 0.71 f 0.040” 1.93 Specific activity 59,300 49,600 1.19
(units/mp) a Differences between fasted and fed are significant at thep < 0.005
level. * Difference between fasted and fed is not significant (p > 0.05).
Golgi secretory pathway. The larger pool size of the high mannose LPL form in fasting compared with refeeding arises as a result of a higher LPL synthetic rate and not by a slower turnover rate out of the ER/cis-Golgi compartment. In turn, an apparently slower turnover rate of the intermediate/com- plex LPL form during refeeding compared to fasting results in the increased intermediate/complex pool size, as indicated by the calculated fractional catabolic rates in Fig. 8. It will be important in the future to determine by direct measurement the fraction and turnover rate of the intermediate/complex LPL form that comprises endothelial-bound functional LPL.
A hypothetical model is depicted in Figs. 9 and 10, proposing a possible mechanism of regulating the amount of endothelial- bound functional LPL in adipose tissue during feeding and fasting, taken into account the findings of this study; i.e. a change in the activity and cellular distribution of LPL without a change in total LPL mass (Fig. 9). It is the endothelial- bound fraction of LPL that is critical in determining the rate of triglyceride fatty acid influx into adipose stores during feeding and fasting. Fig. 10 proposes that the redistribution of LPL mass could arise by diverting newly synthesized LPL into pathways leading either to secretion (during feeding) or
Endoplasmlc GOIQI FUfICtiOnill Reilculum Post-Golgl PO01
I
High Mannooe
Complex
FIG. 9. A hypothetical “sliding mass” model of LPL post- translational regulation. The cross-hatched and stippled rectan- gular areas represent the distribution of mass within the high man- nose and intermediate/complex forms of LPL, as determined in Fig. 6 and summarized in Fig. 8. Total LPL mass remains constant after feeding or fasting, as indicated in Table I. In this model, we propose that the intermediate/complex form of LPL resides within two com- partments, which are defined as Golgi/post-Golgi and functional pool. The former refers to LPL within Golgi and Golgi-derived vesicles and extracellular LPL not bound at the endothelial surface, possibly residing in the subendothelial space. The functional pool refers only to LPL bound at the lumenal face of capillary endothelium. At this time, the proportion of LPL present in these two compartments is not known, and what is shown is speculative.
ADIPOCYTE
FASTED
ADIPOCYTE ) ENDOTHELIUM
FIG. 10. Putative regulatory mechanisms based on secretion and degradation. Details of the models are in the text. The relative areas of the circles are meant to approximate LPL mass within each compartment. As in the legend to Fig. 9, the distribution of LPL mass residing in the functional pool uersus the Golgi/post-Golgi compartments is at present unknown. Heavy arrows represent accel- erated rates. The cross-hatched and open boxes refer to possible blocks within the secretory and degradation pathways of LPL in adipose tissue.
degradation (during fasting). Other investigators (11-X), using isolated adipocytes, have also shown that newly synthe- sized LPL is diverted into a lysosomal degradative pathway in the absence of a secretagogue (heparin). In an alternative model, shown by the dashed lines and question marks in Fig.
by guest on August 30, 2018
http://ww
w.jbc.org/
Dow
nloaded from

Regulation of Lipoprotein Lipase 4575
10, secretion is constitutive, and the amount of functional LPL is regulated by turnover at the endothelial surface. However, endothelium does not appear to be the major site of LPL degradation, since exogenously added LPL is degraded much slower by endothelial cells than adipocytes (25). Never- theless, it is still possible that LPL is removed from endothe- lium by triglyceride-rich lipoproteins and degraded in liver (26, 27).
The decrease in adipose tissue LPL specific activity noted after fasting (Table I) most likely arises from the presence of inactive mass. Coincidently, in fasting, the majority of LPL is within ER, which may be inactive. For example, studies utilizing tunicamycin (9-11) and glucose deprivation (28) in adipocytes indicate that LPL glycosylation is required for secretion and that lipase retained intracellularly is inactive. Carbonyl cyanide m-chlorophenylhydrazone, which blocks the energy dependent budding involved in the formation of transport vesicles from ER to Golgi, causes retention of LPL within ER and loss of activity (8, 12). Combined lipase defi- ciency in mice (29,30), a genetic defect located on a chromo- some separate from the LPL gene (31) and apparently affect- ing LPL translocation from ER to Golgi,4 again is character- ized by inactive mass. However, our laboratory has recently shown by site-directed mutagenesis5 that unglycosylated he- patic lipase, which is structurally and functionally very similar to LPL (20, 32), is catalytically active. Thus, loss of catalytic activity within ER is probably not a consequence of “imma- ture” glycoslyation. Indeed, the high mannose form of LPL in guinea pig adipocytes is active against a triolein substrate (18), although specific activity was not reported. Therefore, the precise intracellular location and nature of the inactive LPL mass arising in rat adipose tissue following fasting remains to be determined.
LPL activity in heart is also regulated posttranslationally. Although LPL activity is modulated several fold after feeding/ fasting, LPL mRNA levels and rates of synthesis are not affected proportionally. Since pulse/chase studies in perfused hearts are technically difficult, the mechanism of LPL regu- lation in this tissue has not been determined. It would seem a priori that the regulation in heart would be similar to that proposed in adipose tissue; i.e. a redistribution of LPL in response to feeding/fasting. In cells isolated from newborn rat hearts (33), an increase in heparin-releasable LPL activity in response to the P-adrenergic agent isoproterenol or dibu- tyryl-CAMP did, in fact, coincide with an apparent redistri- bution of LPL from the high mannose to complex forms. However, unlike adipose tissue, LPL mass did change in parallel with activity following feeding or fasting (Table II). Whether this indicates that LPL is regulated by a posttrans- lational mechanism different in heart than in adipose tissue is unknown.
LPL activity levels are most likely regulated during feeding and fasting by a complex array of factors, such as insulin, glucagon, and glucocorticoid levels as well as sympathetic innervation. This study examined adipose and heart LPL regulation at only one time point (12 h) after fasting and refeeding. It is certaintly possible that LPL activity levels could be regulated by different mechanisms and to different degrees at various time points after refeeding, e.g. when cir- culating insulin levels are maximal. Unquestionably under different conditions and possible in different species, LPL activity levels are also regulated at the level of transcription.
4 R. C. Davis, M. H. Doolittle, and 0. Ben-Zeev, manuscript in preparation.
5 G. Stahnke, R. C. Davis, M. H. Doolittle, H. Wong, D. Ameis, H. Will, and M. C. Schotz, manuscript in preparation.
For example, guinea pig (6) and chicken (5) adipose tissue LPL mRNA levels and rates of synthesis do respond in parallel to activity changes in a prolonged (48 h) fast, which is four times as long as the fasting period used in our studies. In addition, tumor necrosis factor (6) and insulin (34) also regulate LPL activity in adipocytes at the level of transcrip- tion and translation. Thus, LPL can be regulated by several mechanisms, most likely dependent on the time scale of the required response and the effector involved. Indeed, as evi- dence mounts, the adipocyte, myocyte, and most likely other LPL producing cell types appear to have the capacity to regulate LPL activity at a variety of levels.
Acknowledgments-We wish to acknowledge with particular grati- tude Mary Pedersen for her help in heart perfusions, and John Goers for his supply of affinity-purified LPL antibody. Special thanks to Michael C. Schotz, Richard C. Davis, and Arlene S. Garfinkel for their critical review of the manuscript.
REFERENCES
1. Cryer, A. (1981) Znt. J. Biochem. 13, 525-541 2. Cheng, C.-F., Oosta, G. M., Bensadoun, A., and Rosenberg, R. D.
(1981) J. Biol. Chem. 256, 12893-12898 3. Ni&on:Ehle, P. (1982) in -Metabolic Risk Factors in Zschemic
Cardiovascular Disease (Carlson, L. A., and Pernow, B., eds) pp. 49-57, Raven Press, New York
4. Eckel, R. H. (1987) in Lipoprotein Lipase (Borensztajn, J., ed) pp. 79-132, Evener Publishers, Inc., Chicago, IL
5. Cooper, D. A., Stein, J. C., Strieleman, P. J., and Bensadoun, A. (1989) Biochim. Biophys. Acta 1008,92-101
6. Erneback, S., Semb, H., Tavernier, J., Bjursell, G., and Olivec- rona. T. (1988) Gene (Amst.) 64.97-106
7. Semenkovich, C!: F., Wims, M., Nbe, L., Etienne, J., and Chan, L. (1989) J. Biol. Chem. 264,9030-9038
8. Vannier, C., Amri, E. Z., Etienne, J., Negrel, R., and Ailhaud, G. (1985) J. BioL Chem. 260,4424-4431
9. Amri, E., Vannier, C., Etienne, J., and Ailhaud, G. (1986) Biochim. Biophys. Acta 875. 334-343
10. Chajek-Shaul, T.: Friedman, G., Knobler, H., Stein, O., Etienne, J., and Stein, Y. (1985) Biochim. Biophys Acta 837, 123-134
11. Olivecrona. T.. Chernick. S. S.. Benz&on-Olivecrona. G.. Gar- rison, M:, and Scow, R: 0. (1987) j. Biob Chem. 26i, 16748- 10759
12. Ailhaud, G., Amri, E., Etienne, J., Negrel, R., and Vannier, C. (1986) in Enzymes of Lipid Metabolism (Freysz, L., Dreyfus, H., Massarelli, R., and Gatt, S., eds) pp. 485-492, Plenum Publishing Corp., New York
13. Semb, H., and Olivecrona, T. (1987) Biochim. Biophys. Acta 921, 104-115
14. Speake, B. K., Parkin, S. M., and Robinson, D. S. (1985) Biochim. Biophys. Acta 840,419-422
15. Cisar, L. A., Hoogewerf, A. J., Cupp, M., Rapport, C. A., and Bensadoun. A. (1989) J. Biol. Chem. 264. 1767-1774
16. Chan, B. L., Lisa& M. P., Rodriguez-Bouhm, E., and Saltiel, A. R. (1988) Science 241,1670-1672
17. Kornfeld. R.. and Kornfeld. S. (1985) Annu. Rev. Biochem. 64. 631-634
18. Semb, H., and Olivecrona, T. (1989) J. Biol. Chem. 264, 4195- 4200
19. Tarentino, A. L., Trimble, R. B., and Maley, F. (1978) Methods Enzymol. 60, 574-580
20. Kirchgessner, T. G., Svenson, K. L., Lusis, A. J., and Schotz, M. C. (1987) J. Biol. Chem. 262, 8463-8466
21. Hart, G. W., Brew, K., Grant, G. A., Bradshaw, R. A., and Lennarz, W. J. (1979) J. Biol. Chem. 254, 9747-9753
22. Hubbard, S. C., and Ivatt, R. J. (1981) Annu. Rev. Biochem. 50, 555-584
23. Doolittle, M. H., Wong, H., Davis, R. C., and Schotz, M. C. (1987) J. Lipid Res. 28, 1326-1333
24. Osawa, T., and Tsuji, T. (1987) Annu. Rev. Biochem. 56, 21-42 25. Friedman, G., Chajek-Shaul, T., Stein, O., and Stein, Y. (1982)
Biochim. Biophys. Acta 711, 114-122 26. Bagby, G. J. (1983) Biochim. Biophys. Acta 753, 47-52 27. Vilaro, S., Llobera, M., Bengtsson-Olivecrona, G., and Olivec-
rona, T. (1988) Am. Physiol. Sot. 254, G711-G722
by guest on August 30, 2018
http://ww
w.jbc.org/
Dow
nloaded from

4576 Regulation of Lipoprotein Lipase
28. Ong, J. M., and Kern, P. A. (1989) J. Biol. Chem. 264, 3177- 3182
29. Paterniti, J. R., Jr., Brown, W. V., Ginsberg, H. N., and Artzt, K. (1983) Science 221,167-169
30. Olivecrona, T., Chernick, S. S., Bengtsson-Olivecrona, G., Pater- niti, J. R., Jr., Brown, W. V., and Scow, R. 0. (1985) J. Biol. Chem. 260,2552-2557
31. Kirchgessner, T. G., LeBoeuf, R. C., Langner, C. A., Zollman, S., Chang, C. H., Taylor, B. A., Schotz, M. C., Gordon, J. I., and Lusis, A. J. (1989) J. Biol. Chem. 264, 1473-1482
32. Persson, B., Bengtsson-Olivecrona, G., Enerback, S., Olivecrona, T., and Jornvall, H. (1989) Eur. J. Biochem. 179.39-45
33. Friedman, G., Chajek-Shaul, T., Stein, O., Noe, L., Etienne, J., and Stein, Y. (1986) Biochim. Biophys. Acta 877, 112-120
34. Ong, J. M., Kirchgessner, T. G., Schotz, M. C., and Kern, P. A.
35.
36.
37.
38.
39.
40.
41. 42.
(1988) J. Biol. Chem. 263,12933-12938 Chirgwin, J. M., Przybyla, A. E., MacDonald, R. J., and Rutter,
W. J. (1979) Biochemkty l&5294-5299 Church. G. M.. and Gilbert. W. (1984) Proc. N&l. Acad. Sci. U.
S. A. iU,1991-1995 Feinberg, A. P., and Vogelstein, B. (1983) Anal. Biochem. 132,
6-13 Borensztajn, J., and Robinson, D. S. (1970) J. Lipid Res. 11,
111-117 Goers, J. W. F., Pedersen, M. E., Kern, P. A., Ong, J., and Schotz,
M. C. (1987) Anal. Biochem. 166,27-35 Nilsson-Ehle, P., and Schotz, M. C. (1976) J. Lipid Res. 17,536-
541 Bradford, M. D. (1976) Anal. Biockm. 72, 248-253 Lowry, 0. H., Rosebrough, N. J., Farr, A. L., and Randall, R. J.
(1951) J. Biol. Chem. 193,265-275
Afflnity-p”r~fled ChICken anb-LPL. its biotln con,ugate. and purlfled DOYlne rnllk LPL w*r* genero”s g,“s from J. Goers, San Luis Oblspo. CA Afhnlty-punfled rabb,, a”,~-chcken IgG and
ho,ss,ad~sh ~mxidase-Str*ptwldln w*,* purchased from S*lh*sda Research Laboratory, undo H and ne”,am,nidase from Genryme. P,of~~ol from Westchem. ENHANCE and Econ~fluor from NBW
England Nuclsa,, GF-9 glass fiber fMt*n from Whatman, L-[35S]msduon~ne and glyceml l,1[9,10(n)-
*H]oleoylgly~e,ol from ICN Rad~ochem~cAs and Amersham, ,*specbv*ly HEPES. PMSF, Tmon X- 100, N-lauroyl sar~sme, and c,ud* msolubls Pmt*,n A (Staph A, w*,* obttamed from S,gma. The ,7
subunit of Hcmrs mommunis agglutinin canygated to a TSK saI,ca gel matrix w*s a generous gtft from Dr. C. Fred Fox.
mmcds
Male Sprague-Dawley ,ds ,S,mons*n and Hilltop) “wgh~ng b*ttw*n 190-200 g w*,s u,i,,z*d. The fasted gmup was dep,,“ed of food o”*,“,ght l9PM-9AM). The f*d group was faSted for 24 h and
rebd lo, 12 h ,9P,.-9AM) w,,h P”““a Lak”~aatory Chow supplemented w,,h 15% glumse in the d,,nk,ng
water. &tier de&apM~on. h*aRs and epidtdymak adipose bss”** WBR excaad. dnsad m sahw and elthe, used ,mm*d,at*ly lo, labelling *xp*,im*“ts, 0, promptly fmzsn and lored I” l,q”,d Nz ““,I,
analyzed
RNA from hear, and ad,pos* t,ss”* was isolated by SDS-phenol *x,,ac,,o” (35). Three pools of
11ssue. each horn 3 an~mels, were exvacted lo, each coondlbon Ten pg of ,~,a, RNA from each batch were sl*d,opho,*s*d I” a 1% formaidehvde-agarose gel, 1*ns1*,,sd 10 nylon, *nd cross-llnked to th* “yion by *xposu,* 10 “lt,*“,o,*, lhgh, The blo, was pre-hybndlzed I” 0.5M sod,“m phosphate O”ff*, pH
7 0. 1 r”M EDTA, 7% SDS and 1% BSA as d*sc,,b*d by Church and G,ID*fl (36). followed by hyb,,d,z*,,on IO ,h* same buff*, contaning 2 x lO*cpmlml **ch -1 mouse LPL cDNA clone rnL5 (20)
and a ,a o-acbn cDN.4 clone, labelled wth [3*P]dCTP by mndom oligonucleobde palming (37) to a
spchc acbvoty of about 1 x lo* cpmlmg DNA H,‘b,,d,zdlO” wa* camsd o”t at 55’C for 15 h. followed by washfng to a ffnal smngency of 0.5x SSC at 55-C Th* blot was exposed 10 Ktidak XAR Mm v&h an
~ntensdymg screen lor 20 rmn to 1 h. Auto,admg,aph,c *r~nals lo, LPL and acbn mRNA* w*,* q”anbfa,*d by scanning densitometly
Adrpposs Issue The p,oc*du,e was carned out at 37’C ln a DubnoM meta~llc shake, and th*
medium was g*sseZ conbnuousfy wth a 955 02:Co2 dmosph*,*. In typcaf sxperiments. three rats
tmm each nufr,bonal gmup we,* used Afie, *XCISK,~. *pid,dymal fat pds fmm ~ndt”ld”al animals w*,* pookd each la, pad was *l,ced #no seved p,*c*s. each p,*w w*,ghl”g approri”~*ly 100 w FI”* 10 SIX fat p*d pi,,c*s we,* placeq into individual baken ~ntainlng 10 ml 0‘ KRS-“EPES m”ta,“l”g 1% SSA Af,e, p,s,“c”ba,ion for 5 mm. 2mC1 ,2bgpC,,ml) [35S]melhionme we,* *dd*d. For pulse
expnments, ,*p,*s*mQw* slices fmm *ach beaker w*,* ,*mov*d *t spedfled bm* inl*Nals. pooled and ,,ns*d ,w,c* I” cold DMEM medium mntain~ng 1% BSA and sithe, stored at -8O’C ““bl “se 0, homogen,zed ,mm*diat*,y in NC*-cold lysis b”“*, (0.15M MCI, 3% v/v Tnto” X-100, 0 1% “J,” N.
lauroyl sarcos~ne, 1 ml.4 PMSF fn 0.2M Tns. pti 7 5). Long-t*,m pulss experiments were carned out in the presence 0, 0.2 ,+A ““labelled methl0”l”e i” the medium FOI chase expW!m*“tS. fdlOWng IhB
pulse, th* bssu* sllcss we,* transferred into beakers contalmng 1% SSA m DMEM medium
*“ppl*m*n,*d with ImM “nlab*,,*d m*fhionm*, wh,ch had been pre-equilibrated at 37’C I” th* me,abo,,c shake,. At sp*c,f,*d t,m* po,n,s. 511~~s from Bach beaker v,*,* removed. ,ms*d and
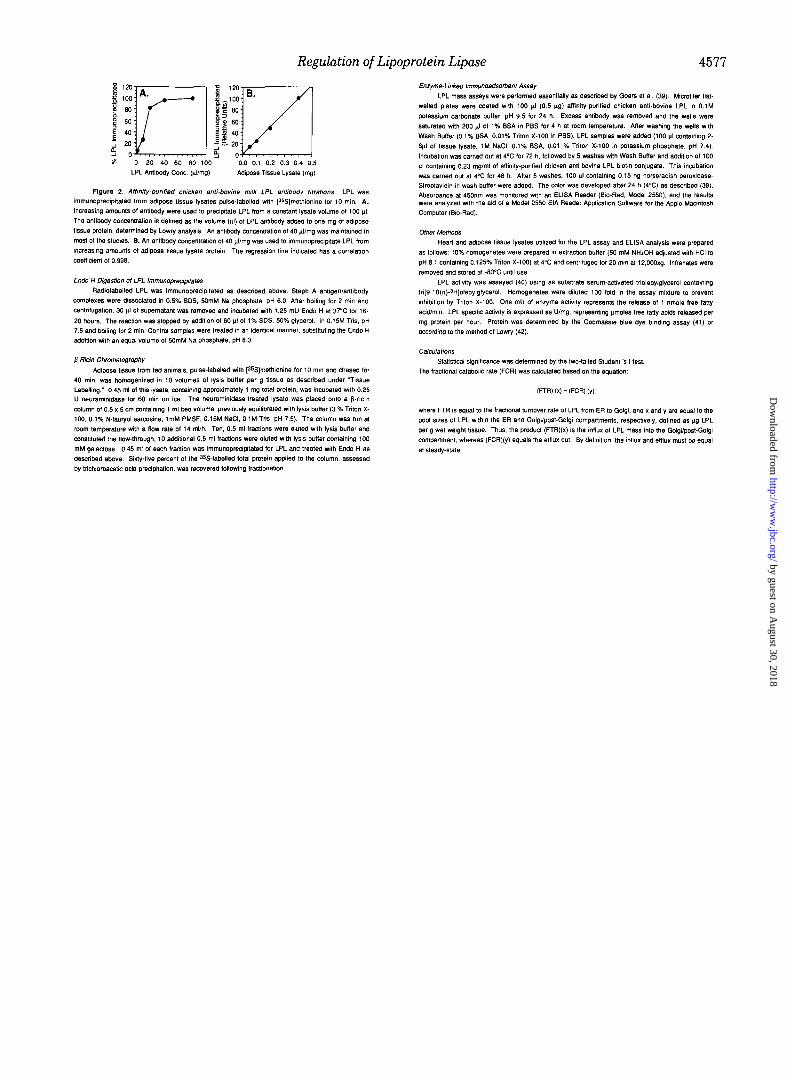
homogenized as *bo”*. The ,a,* 01 inm,po,a,,on #“to total pmtelns (Rg. ,A) and ~mm”nop,*c~p,t*bl* LPL (Fig. IS, w*J
lknear during a 30 mm pulse of [35S]m*th1onln* Since lhnea, mmrpoorat~on ,a,** we,* obsewed OYB, 30 mm. LPL synfheflc ,a,* was meas”,& as th* ,“co,po,a,,on of [~~S]m*th,o”l”* ml0 LPL *xp,*ss*d
as a p*,c*ni*g* of total p,ot*m symhws followmg a 20 min pulse (Table I).
0 10 20 30 10 Tlms (In,“)
Heert. Follow,“g decapltatlon. hemIs **I* ,*mO”*d and conn*ct*d to a retrograde am-la,
perfusion system (38). Two heans we,* pmeassed s~multansously Single pass petiwons w*,*
ntiated with KRS bun*, at 37OC lo, 5 min at a flow rate 01 8 ml/mm to *stabkh a *fable heanbeat. Re~rculam, ps”won of both h**,ts was camed out m a Iota1 KRS ,***~oi, vdums d 25 ml; 1 .O mC,
(35Sjmethionlne was added 10 th* ,*s*woi, 10 lmttile the pulse. Following a 20 mm pulse. each hean, w*,gh,“g app,ox,ma,*ly 1.0 g, was homogenized I” 10 ml 01 ,c*-Cold lysis b”“*, and pmcessed as
dssccribed
Staph A was washed *xl*“s~“*ly and uliliz*d as a 10% v,,” slwy In *om* *xp*nm*n,s. ,issu* lysatss w*,* pnt,*eatsd with 40% “h Staph A lo, 30 ml” *t 4°C LPL was imm”nop,ec,p,ta,*d fmm tissue lysates supplemented wth MCI 10 ftnal concentrations of’ 3 0 % Trim- x-100. 0.1 % N.laumyl
sarcosine, l.OM N&I, 40 piimg affmty-punded chwen ant&bovine LPL anbbcdy (see Rg. IA and IS)
I” 0.1M Tns, pH 7 5. Utlllrlng an antibody co”c*nt,at~on 01 40 pl/mg (24 pg IgG/mg), LPL was ,mm”“oP,*c,pltat*d q”*ntltatl”*ly from adnpose t,ss”* lysates in a dose-depadent manner (Fig IS).
In hea”. a” anbbcdy c~“~“traWc of 4 bllmg was found to ,mm”“op,sc,p~,*,* mo,* (ha” 90% 01 ,h* LPL avaIlaM*
A”t,bcddy,an,,gen mmplexes w*,* allowsd to form o”*,n,ght a, @C Fowlold *xc*ss 01 r&b,,
anti-chlcken IgG was then added and the m,nu,* mcubeed to, *n addibonal 2 h FlPy #I of Staph A we,* finally added, mcubabon continued for 30 min. and th* Staph A-antlbcdy/antigen complexes
p*ll*ted In som* mstanc*s, the resulting s”p*,“a,a”ts w*,* s”b,*ct*d to re-,mmunop,*c,p,,aion by
the sddillon 01 chicken am-LPL antibody (see Fig. 2)). and p,oc*ss*d I” a slmala, manner. The Staph A.a”tlbWy,antlgS” pellels were washed 0”~ with 1 ml 0.5M LlCl I” O.,M T,,s, pH 7.5, follow*d by ,wo v,ashes I” PBS contanlng 0 I% N-lauroyl s*,cosln* Dlssociabo” of th* complexes was camsd out by addition 01 35 pl 2% SDS. 25% glycerol in 0.1 M Tns. pH 6 9. *nd Lwiling 10, 2 min. MB, pelleting, 30 ,i of s”p*,“a,an, we,* ,*mo”d and 1 ,,I bmm,,ph*nOl MU* add*d. The re-,mm”“op,*C,p,,a,ed ssamples we,e prmesssed on th* followng day in the *am* manner lncubabon 01 *xc*ss (10 pg) unlabelled bvlne milk LPL with Ihs *ntlbody prlo, to ~mmunop,eap,tat~on mmpletely aboll~hd th* ab~hfy to immunoprecipite ths 56 kDa band from =‘S-labeled adipos* t,ss”* and head lysates. mnflrmlng ,h* ,den,i,y 01 th* 56 Id,* band as LPL (dam “l Shown,.
SDS poly*c,ylamide gel *I*cl,opho,*s~s and fluomgraphy we,* p*do,m*d as d*sc,ib*d
prsviously (23) ut,lizing 7 0, 10% polyacvlamfde, 0.25% bis-acvlamide en th* separabng gel. Th* amount of [3*S]m*lhmnln* p,*s*nf m LPL was detemxned by excison of a 4mm sk* I” th* 55 kDa regm 01 the dried gels usmg the fiuorogram as template. The sl,c*s w*,* mcubatsd I” 1 ml 90%
P,olo~ol 10, 2 h lo ov*m,ght a, 60-C Sant,llatlo” co”“lm9 fluid (95% Eco.o1I~o,, 4 9% P,otosoI, 0 2%
glaaal r,ce,,c md) wss added and ,adloaR,“t,y d*t*,mlned. [**S]M*thion~n* ,nco,po,a,,on I”,O total pmotel” was determined 85 lollows: 5 ,, of i&at* ,h*an 0, adipose tlswe) w*,* added to 1 ml 0 1%
9% Total pmte~n was precipitated by aWIng 1 ml 20% TCA. and heating lo 7580°C lo, 15 mln ~,*cip,tat** were collected r,n OF-9 g,a*s ,,b*, ,,ll*,s. washed wth 10% TCCA. tollow*d b, a wash wllh ab501”te *the, and then andned The dnsd tiltem w*,* tncubated o”*,“lgM I” 1 ml BOX P,OtOSOl at
60% i” smnt,llat~an vials 10 dtssoI”* p,*ap,t*f*s, and counted as d*Sc,lbed lo, gel she**
by guest on August 30, 2018
http://ww
w.jbc.org/
Dow
nloaded from
Reguhtion of Lipoprotein Lipase
by guest on August 30, 2018
http://ww
w.jbc.org/
Dow
nloaded from

M H Doolittle, O Ben-Zeev, J Elovson, D Martin and T G Kirchgessnerposttranslational regulation.
The response of lipoprotein lipase to feeding and fasting. Evidence for
1990, 265:4570-4577.J. Biol. Chem.
http://www.jbc.org/content/265/8/4570Access the most updated version of this article at
Alerts:
When a correction for this article is posted•
When this article is cited•
to choose from all of JBC's e-mail alertsClick here
http://www.jbc.org/content/265/8/4570.full.html#ref-list-1
This article cites 0 references, 0 of which can be accessed free at
by guest on August 30, 2018
http://ww
w.jbc.org/
Dow
nloaded from