the residual effects of silicon, phosphorus a thesis ... · connelly,' kandiah thiagalingam,...
TRANSCRIPT
T H E R E S ID U A L E F F E C T S O F S IL IC O N , P H O S P H O R U S
AND S O IL pH ON -Y IE L D AND N U T R IE N T U P T A K E
O F A RA TO O N SU G A R C A N E C R O P
A T H E S IS S U B M IT T E D T O T H E
G R A D U A T E DIVISION O F T H E U N IV E R S IT Y O F HAWAII
IN P A R T IA L F U L F IL L M E N T O F T H E R E Q U IR E M E N T S
F O R T H E D E G R E E O F
M ASTEF^ O F S C IE N C E
IN S O IL S C IE N C E
A U G U S T 1969
B y
Andrew Jack Rosenau
T h eais Committee:
Jam ea A . S ilv a , Chairman Duane P . Bartholomew R obert L . F o x Minoru laobe .

» '■■
f
• W -•
-_r-
I
We certify that we have read this thesie and that in our-■tj-
opiidon it is satisfactory in scope and quality a s a thesis for die
degree of M aster of S c ie n c e in So il S c ie n c e .
7 :
.-. . i ' -'*■'7- ..
yt'?- ,i*■■■ ■' ■' ■ 7
-.A /
A.?i: . , , ,
: ■■
A"' ’A ^
.o V V -V '.-
AaT'A'A .’ \A-' :■->*■i'‘A-
A.:,
, , ;- * ■ . ' ,v-■;A---M>- ..A, ■7st •■: ■' ‘vA- ■ ■ -
T H E S IS CO M M ITTEE
Chairman

.
A C K N O W L ED G M E N TS
'V ' .. .
vA; T h e author is grateful to the T en n essee Vcdley Authority lor
providing the financial support n ecessary for completion of the
M aster o f^ Solen oe,d eg ree .
T h e se rv ice s of personnel of the Statistioal and Computing' S . . .' -t
- C«nt«r of the University of Hawaii a re also muoh apprecieUed*• ?
Sp ecial thanks a re due to M e ssrs . Dennis T eran ish l, Paul
Connelly,' Kandiah Thiagalingam, Rashid Khalid and Marold Sato
for their assistan ce in field preparation, sampling and harvesting.

T A B L E O F C O N T E N T SPaga
A C K N O W L E D G M E N T S ........................................................................ i
U S T O F T A B L E S ............................................................................. v
U S T O F F I G U R E S ............................................................................. Ix•jt'
IN T R O D U C T IO N ....................................................................................... 1
U T E R A T U R E R E V I E W ....................... 4
So li S i l i c o n ....................................................................................... 4
Effaot of Silicon on Soil P h o sp h o ru s.................................. 6
EKsot of S ilicon on Other N u tr ie n ts .................................. 8
Plant S i l ic o n ....................................................................................... 9
So il P h o s p h o r u s ............................................................................. 15
Plant P h o s p h o r u s ......................................................... 16
Soil A c i d i t y ....................................................................................... 17
Soil and Plant A lu m in u m .......................................................... 17
ii
& M A T E R IA L S AND M E T H O D S ..................................................... 19
Description of S o i l ........................................................................ 19
Experim ental M ^ o d s .................................................................... 21
Cultural P r a c t i c e s ........................................................................ 21
I Plant Sam p ling . ................................................................ 23
; S o iL S a m f J i n g ................................................................................... 25
H a r v e s t ................................................ 25
Analytical M e th o d s ........................................................................ 26

Hi
P age
Plant A n a ly s is ........................................................................ 26
So il A n a l y s i s ........................................................................ 27
R E S U L T S AND D I S C U S S I O N ..................................................... 29
Y i e l d ..................................................................................................... 29
S i l i c o n ........................................................................................... . 32
- Soil S i l i c o n ......................................... 32
Plant S i l ic o n ............................................................................. 39
P h o s p h o r u s ....................................................................................... 47
S o il P h o s p h o r u s .................................................................... 47."V, ,
Plant P h o s p h o r u s ............................................................... 52
S o il p H ................................................................................................ 57
* Plant N itro g e n .................................................................................. 60
. P o ta s s iu m ............................................................................................... 60
Soil P o ta ss iu m ..............................^ ...................................... 60k;.v ■ 'V '
' Plant P o t a s s iu m ..................... 64
C a lc iu m ................................................................................................ 69
Soil C alciu m .................................................... 69
Plant C a lc iu m ........................................................................ 73
A^agnesium . . . . ^ ....................... 73
Plant M anganese.................................. 76" ■ : ''I- ’
Aluminum 80
T A B L E O F C O N T E N T S (C O N T IN U E D )

V ~ -S’ • . . . - -
" T A B L E O F C O N T E N T S (C O N T IN U E D ). ^ -■ ft ■ ■ ■ . . P age
■ --e ft ----------
> Multipda\ R eg ression A n a l y s i s ................................................. 84
Y i e l d ............................................................................................ 84
" S i l i c o n ......................................................................................... 87
Phosphorus ................................. . 90
B a s e s ........................................................................................... 92
/ V A lu m in u m .................................................................................... 93
SU M M A RY AND C O N C L U S IO N S ................................................ 95
U T E R A T U R E C IT E D .................................................................... 97
V A F P E N C a X A ..................................................................................................107
A P P E N D IX B . . . 113
. . . " '
’ .• .A / v ; ’
V f ’;"./.:'
-y-' '-• ..

U S T O F T A B L E S
TabU P ag e
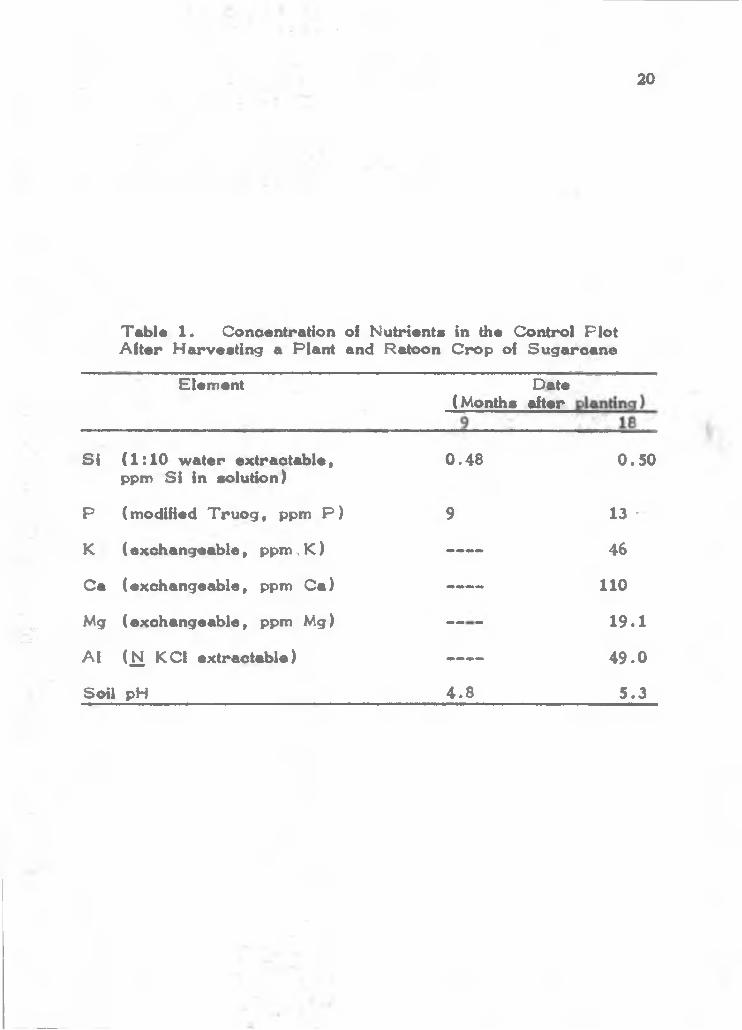
1 Concentration of Nutrients in the Control PlotA fter Harvesting a Plant and Ratoon Crop of S u g a r c a n e .................................. * ...................................... 20
2 R ates and S o u rce s of Nutrients Added to theHalii So il B efo re Planting S u g a r c a n e ........................ 22
3 Rainfall Distribution During the Growing P eriodof the Ratoon Su garcan e Crop .................................. 24
4 A nalysis of ^Variance of Ratoon Crop CaneY i e l d s ............................................................................................ 30
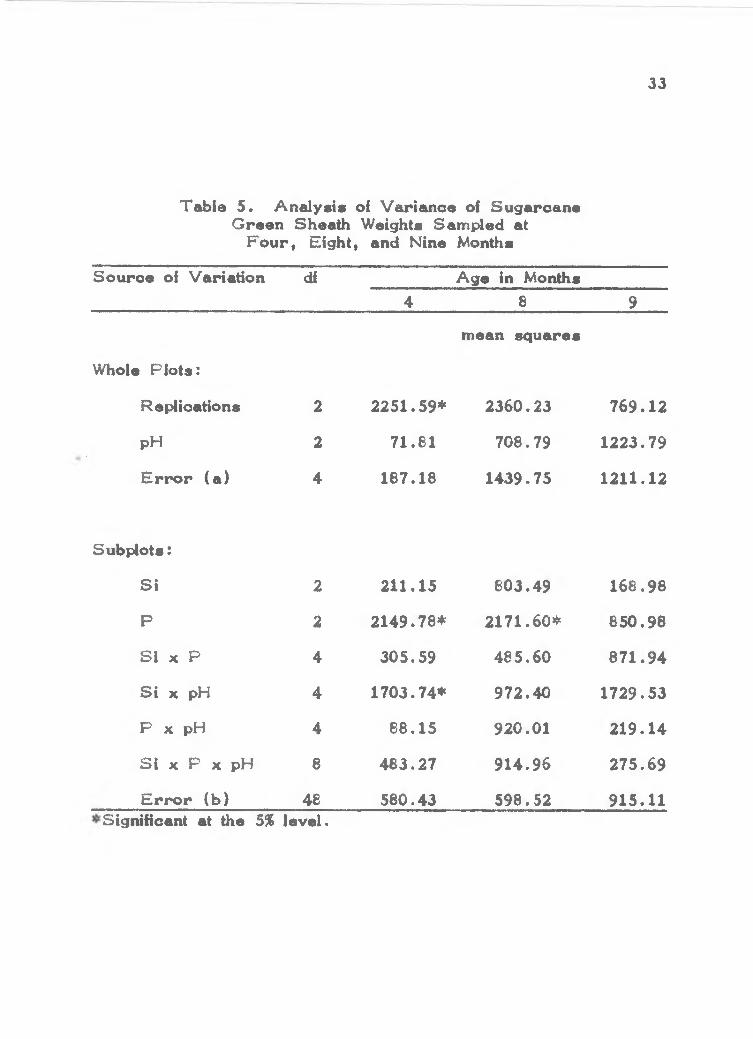
5 AnalyMs of V arian ce of Su g arcan e G reenSheath Weights Sam pled at F o u r , Eight, and Nine M o n t h s ............................................................................. 33
6 A nalysis of V arian ce of W ater-Extraotable andModiHed T ru og -E xtractab le So il S i ............................. 36
7 A nalysis of V arian ce of T C A -E xtrao tab le S i inSheaths Sampled at F o u r , Eight, and Nine Months . * . ........................................................................ 40
8 A nalysis of V arian ce of Sheath S i at F o u r ,Eight and Nine Months and Whole Plant S i atNine M o n t h s ...................................... 42
9 A nalysis of Variance of S i Uptake by the Ratoon C ^ p and of the Combine’d S i Uptakeby the Plant and Ratoon C r o p s ....................................... 48
10 A nalysis of V arian ce of Modified T ru og-Extraotable Soil P ^ ................... ; ................................ . 50
' '.i.-11 A nalysis of V arian ce of Sheath P Sampled at
F o u r , Eight, and.^Nine Monttis and Whole PlantP at Nine M d ^ s .................................................................... 53
' - V ; ' *12 A nalysis of V arian ce of P Uptake by the Ratoon
Crop and of the Combined P Uptake^ by ^ e Plantand Ratoon C ro p s ' ............................................................... 55
>•.
Table P age
13 A nalysis of V arian ce of Exchangeable B a s e s . . 61
14 A nalysis of V arian ce Sum m ary for PlantConcentrations and Plant Uptake of K , Caand Mg ................................................................................. 65
15 A nalysis of V arian ce of Plant M n ................................... 78
VI
U S T O F T A B L E S (C O N T IN U E D )
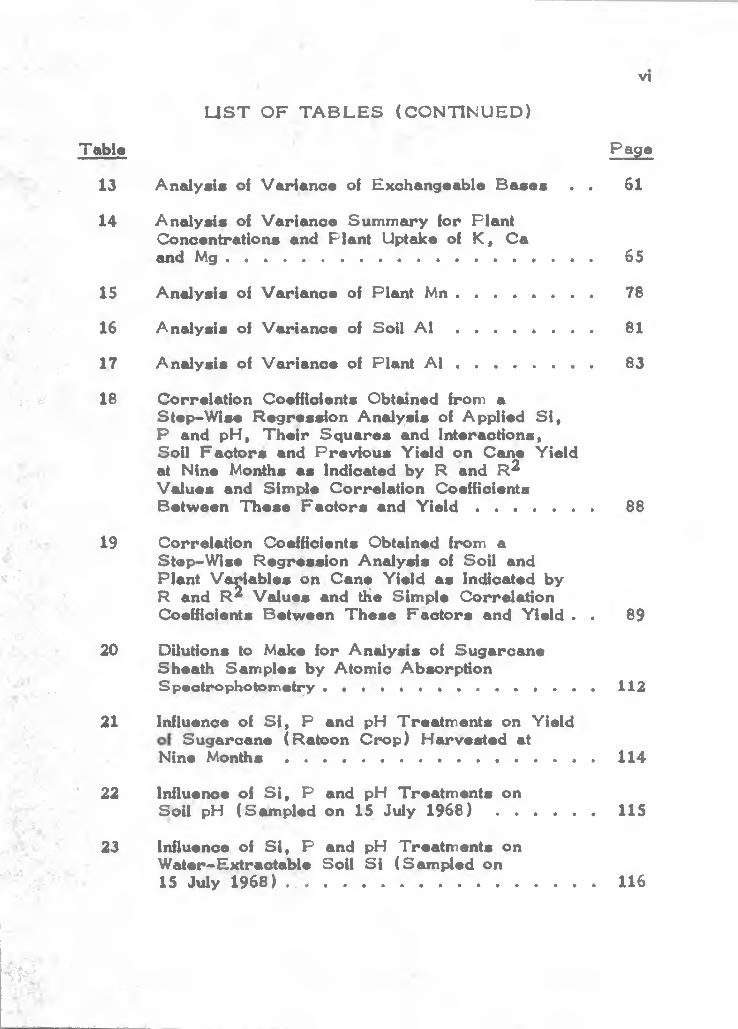
17 A nalysis of V arian ce of Plant A 1 .................................. 83
: 16 A nalysis of V arian ce of Soil A l ................................... 81
■ ;
' |i- W 18 Correlation Coefficients Obtwned from aStepoW ise R eg ression A nalysis of Applied S i ,P and pH, T h e ir S q u a re s and Interactions,Soil F a c to rs and Previou s Yield on Cane Yield at Nine Months as Indicated by R and R^V alues and Sim ple Correlation Coefficients
V Betw een T h ese F a c to rs and Y i e l d .............................. 88
: i 19 Correlation Coefficients Obtained from aStep-W ise R eg ressio n A nalysis of So il and
Plant V ariab les bn Cane Yield a s Inchoated by R and R^ V alues and tHe Sim ple Correlation
Coefficients Betw een T h ese F a c to rs and Yicdd . . 89- '"’S' .
20 Dilutions to Make for Analyms of Su garcan e Sheath Sam ples by Atomic Absorption
Sp eelrop h otom eh ^ ......................... 112
21 Influence of S i , P and pH Treatm ents on YieldSu g arcan e (Ratoon C rop) H arvested at
Nine M o n t h s ................................................................................... 114
/; ■ 22 Influence of S i , P and pH Treatm ents onSoil pH (Sam pled on 15 July 1 9 6 8 ) ........................ 115
? 23 Influence of S i , P and pH Treatm ents onW ater-E xtractable Soil S i (Sam pled on 15 July 1968) . ............................ 116
- 4 -
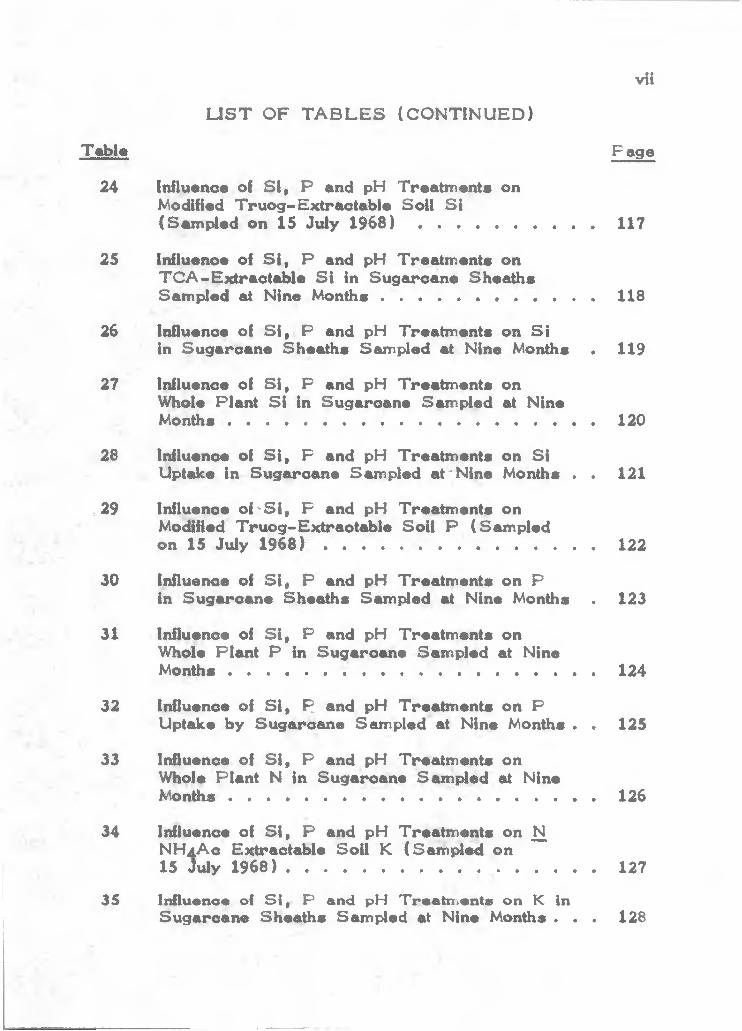
Table P ag e
24 Influence of S I , P and pH Treatm ents onModified T ru og-E xtraotable Soil S i(S am {Jed on 15 July 1 9 6 8 ) .......................................... 117
25 lidluenoe of S i , P and pH Treatm ents onT C A -E xtractab le S i in Su garcane SheedhsSampled at Nine M o n th s ................................................... 118
26 Influence of S i , P and pH Treatm ents on S iin Su g arcan e Sh eaths Sampled at Nine Months . 119
27 Influence of S I , P and pH Treatm ents onWhole Plant S i in Su garcan e Sam pled at Nine Months ........................................................................... 120
28 Influence of S i , P and pH Treatm ents on S iUptake in Su garcane Sam pled at'N ine Months . . 121
,2 9 Influence o f^ S i, P and pH Treatm ents onModified T ru og-E xtraotable So il P (Sam pledon 15 July 1 9 6 8 ) ................................................ 122
30 Influence of S i , P and pH Treatm ents on Pin Sugaroane Sheaths Sampled at Nine Months . 123
31 Influence of S i , P and pH Treatm ents onWhole Plant P in Sugaroane Sam fJed at NineM o n th s ........................................................................... 124
32 Influence of S i , P and pH Treatm ents on PUptake by Sugeu*oane Sampled at Nine Months . . 125
33 Influence of S i , P and pH Treatm ents onWhole Plant N in Sugaroane Sainpled at NineMonths . . . . . . . . 126
34 Influence of S I , P and pH Treatm ents on ^NHaA o Extraotable So il K (Samipded on15 July 1 9 6 8 ) ............................................... ... .......................... 127
35 Influence of S i , P end pH Treatm ents on K inSugaroane Sheaths SampJed at Nine Months . . . 128
vil
U S T O F T A B L E S (C O N T IN U E D )

« •• Vtll
. V,' U S T O F T A B L E S (C O N T IN U E D ). r i : . ■, • A
Table ^ P ag e
36 Influence of S i , P and pH Treatm ents on NH j A o Extraotable So il Ca (Sam pled on 15 July 1968) . ; ........................ 129
37 Influence of S i , P and pH Treatm ents on Cain Su g arcan e Sh eaths Sampled at Nine Monflis . 130
_
: Influence of S i , P and pH Treatm ents on ^ N H ^ c Extraotable So il Mg (Sam|;4ed onife. 15 July 1 9 6 8 ) ................................................................................ 131
^ . 39 Influence of S i , P and pH Treatm ents on Mg ' m ' ill Su garcan e Sheaths Sampled at Nine Months . 132
40 Influenoe of S i , P and pH Treatm ents on Mnim^Sugaroane Sh eaths Sampled at Nine Months . 133
• -t-i -■ ■ • v.41 Influenoe of S i , P and pH Treatm ents on jN
k C l Extraotable So il A1 (Sam pled on 15 July 1968) 134
42 Influence of S i , P and pH Treatm ents on A1in Su g arcan e Sh eaths Sampled ed Nine Months . 135
/ S-, .A 43 Correlation Coefficients Obtained from a
S te p -W se R eg ressio n A nalysis of AppJied S i , r- P «nd pH, T h eir S q u a re s and Interactions, Soil
and Plant F a c to rs on Cane Yield at Nine Months as Incfldated by R , x 100, and Simple C orrelation Coefficients Betw een T liose F a c to rs
- and Yield . . . / ...........................................................................136
.■■ri
f 44 Correlation Matrix of Yield and SelectedF a c to r s ............................... * ............................................................. 137
45 Coefficients of Variaflon for All F a c to rs and. Yield of the Ratoon Su garcane C r o p ................................. 138

L IS T O F F IG U R E S
Figu re P ag e
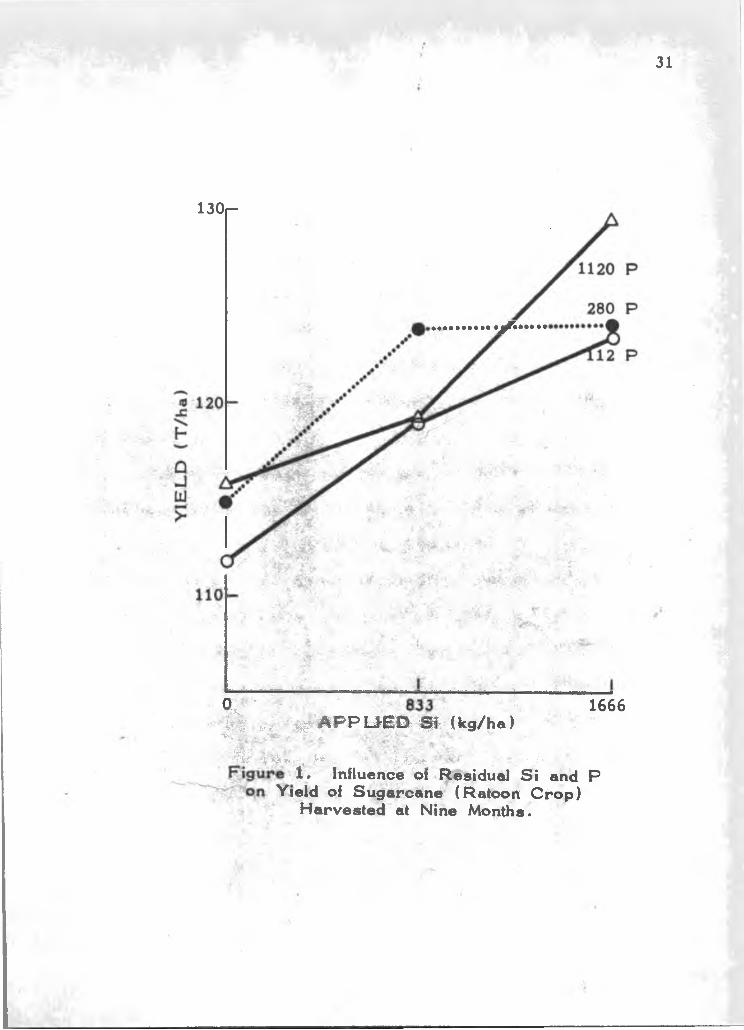
1 Influence of Residual S i and P on Yield ofSu garcan e (Ratoon C rop) H arvested atNine M o n d i s ...................................... ....................................... 31
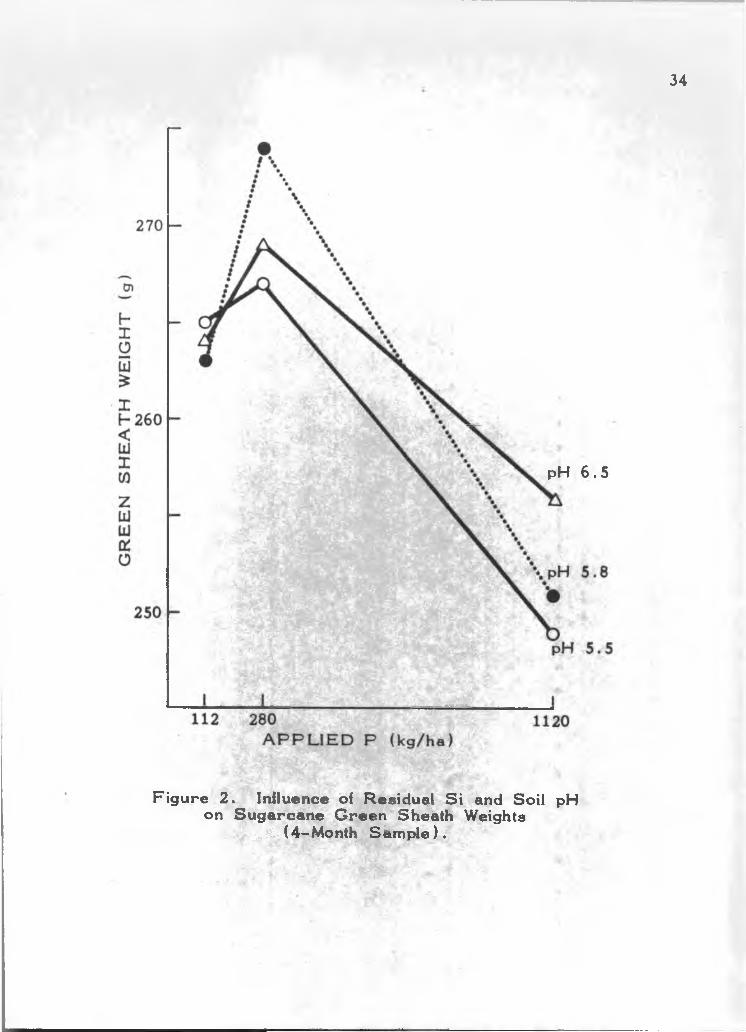
2 Influence of Residual S i and Soil pH onSu garcan e G reen Sheath Weights (4 MonthS a m p l e ) .................................................................. 34
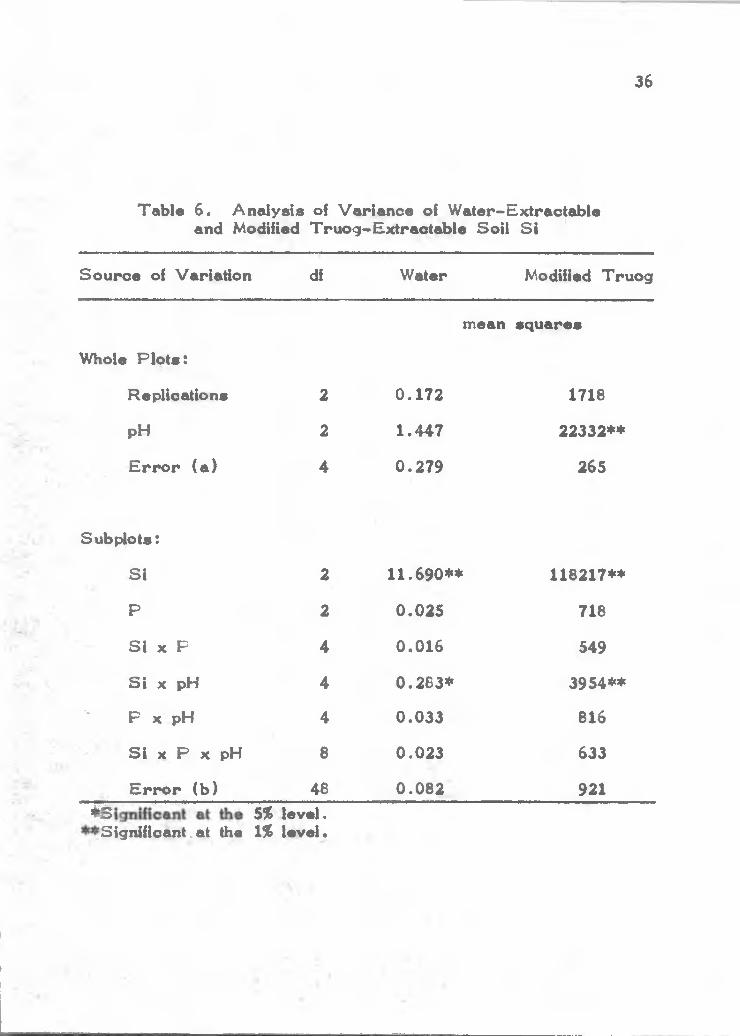
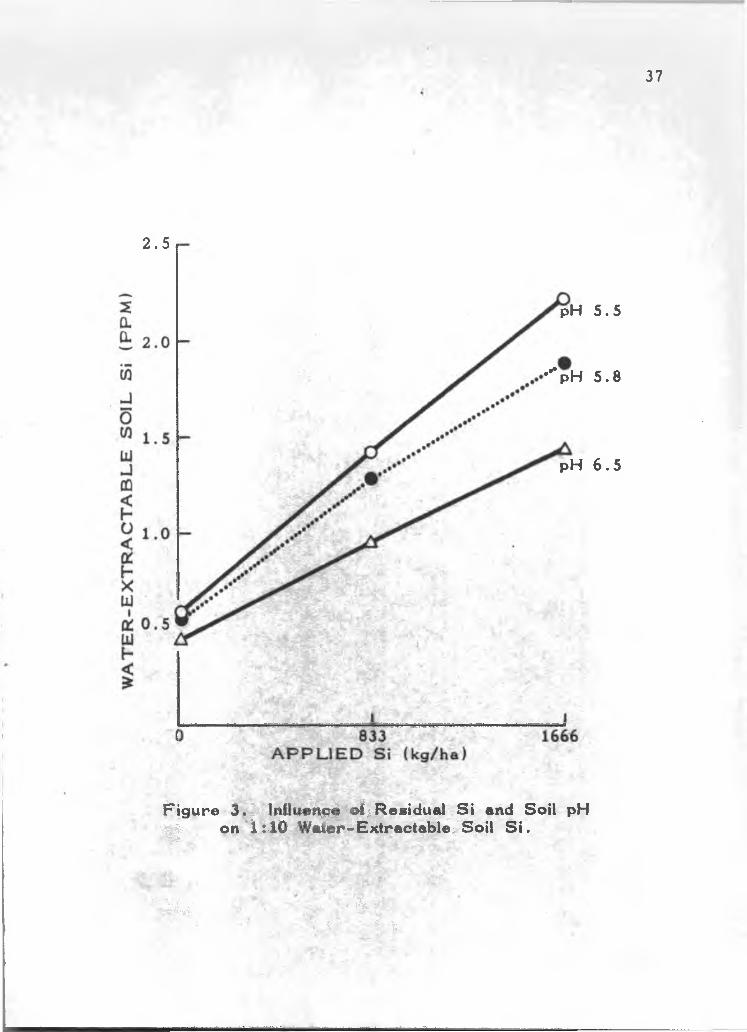
3 Influence of Residual S i and Soil pH on 1 :1 0W ater-Extraotable So il S i . . ...................................... 37
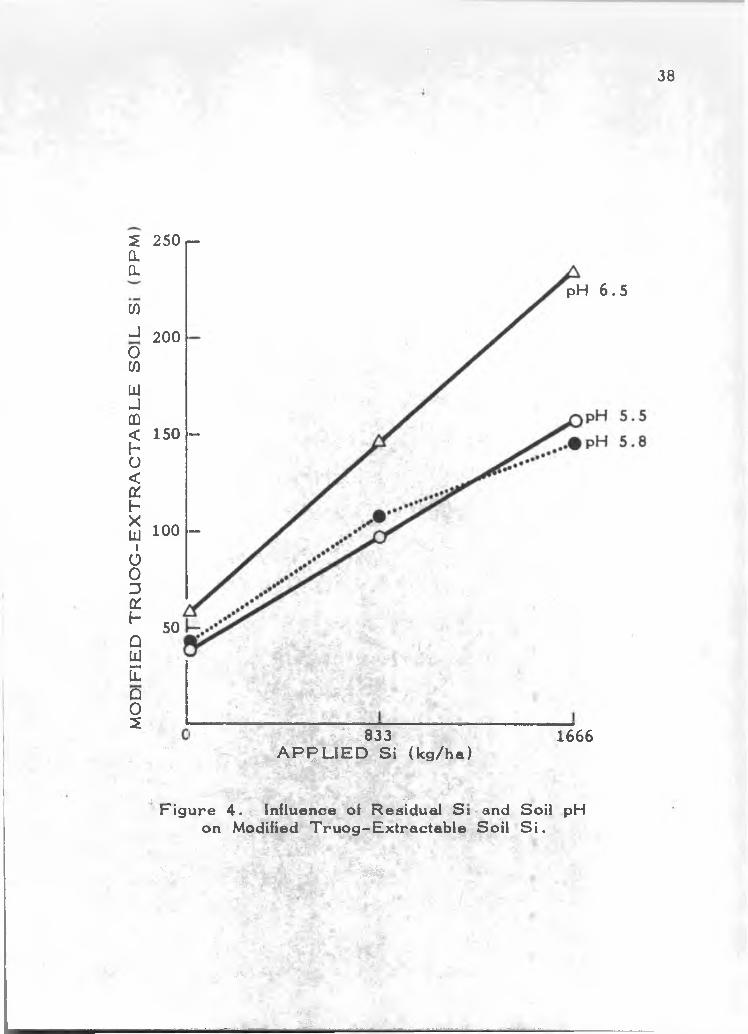
4 Influenoe of Residual S i and Soil pH onModified T ru og-E xtraotab le Soil S i ................................. 38
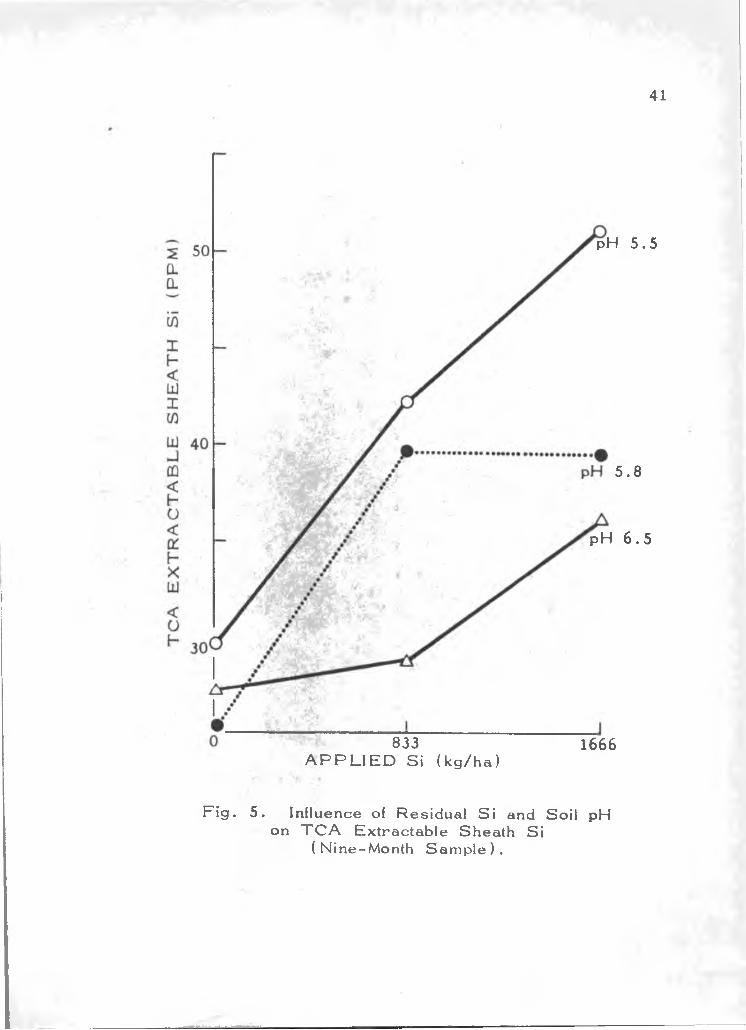
5 Influenoe of Residual S i and So il pH onT C A -E x tra cta b le Sheath S i (Nine-MonthSam ple) .................................................... 41
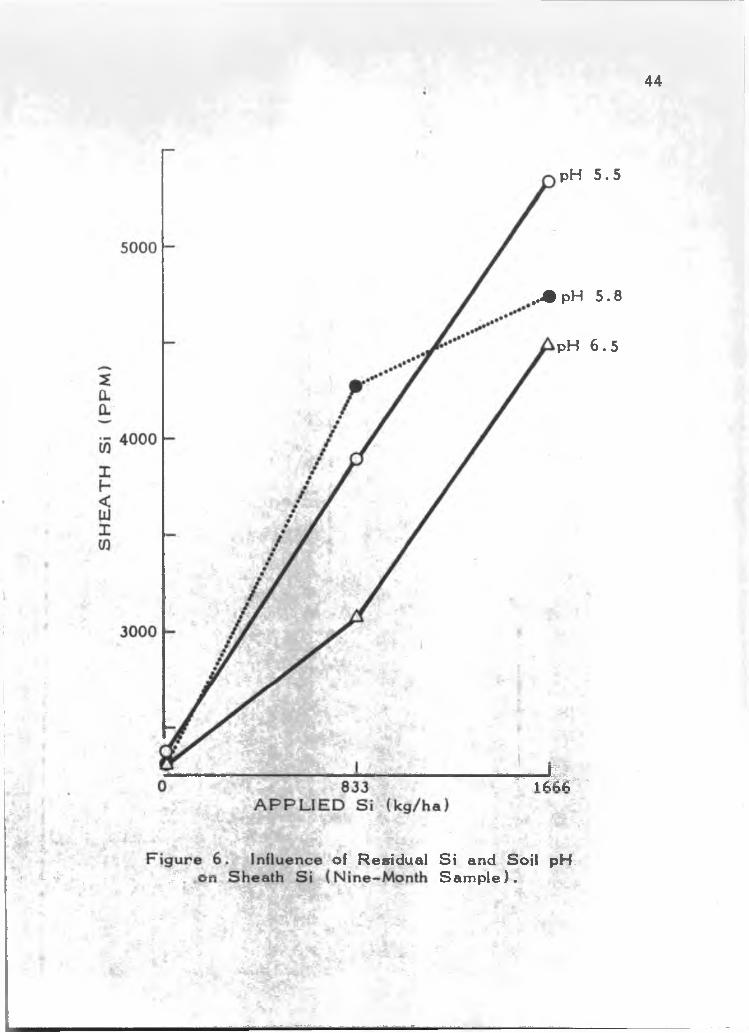
6 Influenoe of Residual S i and Soil pH onSheath S i (Nine-Month S a m p l e ) ...................................... 44
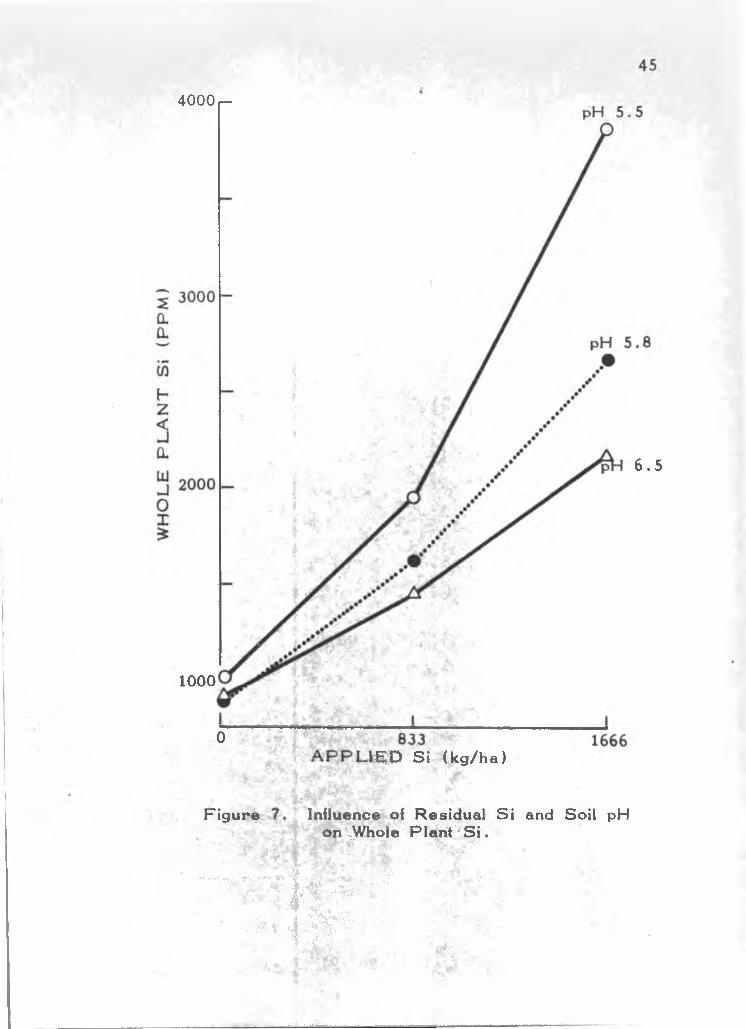
7 Influence of Residual S i and S o il pH onWhole Plant S i ............................................................................ 45
8 Relationship Betw een W ater-Extraotable Soil S iand Sheath S i in Su garcane (9 Months Sam ple) . 46
9 Influenoe of Residual S i and Soil pH onS i Uptake (Ratoon C rop) . . ...................................... 49
10 Influence of Residual S i and P on ModifiedT ru og-E xtraotab le So il P . . * ...................................... 51
11 Influenoe, of Residual S i and P on Sheath P(Nine-Month Sam ple) . . . ., « .................................... 54
ix
12 Influenoe of Residual S i and So il pH onP Uptake ...................................... 56
13 Influenoe of Residual S i ^and S o il pH of Su garcan e (Ratoon C rop) H arvested atNine Months ................................. 58

Fig u re P age
4. 14 T h e Relationship Betw een Sheath P and Yieldof Sugaroane H arvested at Nine Months as Influenced by Applied S i ................................................ 59
U S T O F F I G U R E S (C O N T IN U E D )
1-;'.
•A
15 Influence of Residual S i and P on ExchangeableSoil K . . . ........................................................................ 62
16 Influence of Residual S i and Soil pH onExchangeable Soil K ............................. ......... 63
17 Influence of Residual S i and P on Sheath K(Nine-Month S a m p l e ) .......................................................... 66
18 Influence .of Residual S i and Soil pH on Whole Plant K .................................................... ..... ............................. 68
19 Influence of Applied S i and Soil pH on Yield of Su garoane (P lant C rop) H«u*vested atNine M o n t h s ............................................................................. 70
20 Influence of Residual P and Soil pH on KU p ta k e ................................. 71
«21 Influence of Residual S i and Soil pH onExchangeable Soil C a .......................................................... 72
22 Influence of Residual P and Soil pH on SheathM CaT (Nine-Month S a m p l e ) ................................................ 74
23 Influence of Residual S i and Soil pH onExchangeable So il Mg . . 75
24 Influence of Residual S i and Soil pH on SheathMg (Nine-Month Sam ple) . . V ................................. 77
25 Influence of Residual S i and Soil pH on SheathMn (Nine-Month Sam ple) ...................... 79
26 Influence of Residual S i and. Soil pH on K C l-Extraotable Soil A1 . . . / . ^ ............................ 82
^27 Influence of Residual S i and P on Sheath A1
(Four-M onth S a m p l e ) ...................................... 85
V ;>*•"
IN TRO D U CTIO N
It has bean known for almost a century that the element
silicon affects the nutrition of sugarcane and other gramineous•a .
c ro p s . R ecently, both producers and re s e a r c h e rs have deter
mined that applications of S i slag can in crease sugarcane yields
in some so ils . In a field trial conducted at the Kauai B ranch
Station on a highly weathered Humio Ferruginous Latosol (Typio
Gibbsihumox) , F o x g i aL* (1 9 6 7 ) reported that sugar yields
in creased approximately 12 tons per h ectare with the application
of 4 .5 tons TVA slag per h ectare . Clements et a l. (1 967 )
reported that on Kilauea Su g ar Company, Kauai, application of 8
tons S i slag per a c re resulted in 34 percent more sugar in the
plant crop and 40 percent m ore sugar in the first ratoon cro p .
Clements expected the differences in yield between treated and
untreated plots to widen in the second and third ratoon c ro p s .
T h ese beneficial resu lts as well a s others have encouraged addi
tional re se a rc h on the m.echanism of the yield resp onse of su g ar-% •
cane to S i application.
T h e study of S i in Hawaii began with Maxwell's work in
1898 (quoted from Moir 1 9 3 6 ). Maxwell found that the S i content
of soils in high rainfall a re a s w as very low and speculated that
the low S i content might ^ e o t cane yields. No further work was
done on S i until MoGeorge (1 924 ) concluded that S i affected P
... 2assimilation by plants. Silicon nutrition w as not studied again in
Hawaii until 1955 when Sherm an ^ reinvestigated M oGeorge's
work and cam e to the sam e conclusion.
T h e re a re several different views regarding the mechanism
of yield gains due to S i applications. H ie three mqjor types of
S i resp onse reported a r e : (1 ) effects on soil fertility, (2 ) effects
on the normal growth of plants, and (3 ) effects on the resistan ce
of plants to d ise a se .
Monteith and Sherm an (1 963 ) reported that in a Humio■
Ferruginous Latosol ( Typio Gibbsihumox) calcium silicate in creased
sudangrass yields due to in creased availability of soil P and not to
a d ecrease in active A l,w hile in a Hydro! Humio Latosol (Typio
Hydrandept) in creased yields w ere accompanied by a reduction of
"toxic” Al by the C a in the s lag . Su ehisa. j t (1 963 ) sug-
‘ gested that S i enhanced the avatlabili^ of P in the soil by either
reducing the P fixing capacity of the soil o r by substituting for P
In the so il. Other re s e a rc h e r s interested in the effects of S i on
sugarcane and r ice nutrition have also suggested that interactions&
of S i with P , A l, Mn, and F a a re responsible for the observed
yield resp on ses following S i applications.
W orkers investigating the physiological asp ects of the S i
N. resp onse have found that S i affects iiJant growth habit and d isease
.-i ' -
resis ta n ce . Okamoto, Y . (1957) and others have observed that
>rice plants grown with S i have erect leaves while r ice plants

grown without S i have drooping leav es. Silicon is thought toJ
reduce lodging and in crease d isease resistan ce in r ice by in crea s
ing the culir strength.
Commercial use of silicates by the sugar industry appears
very profitable if reported yield in creases a re realized ; but co sts
a re high. It becom es n ecessa ry to identify a re a s which would
benefit from S i application and to determine m echanisms for the
resp onse to the applications. To accom fJish this objective it is
n e cessa ry to understand the relationships between S i and other
growth fa cto rs . The objectives of diis study w ere (1 ) to investi
gate the relationships an ong Si» P , and soil pH treatments and
their residual effects on nutrient composition and yield of a ratoon
crop of su g arcan e; (2 ) to study the influence of S i on the avail-k
ability of soil P and the internal P requirement of su g arcan e; and
(3 ) to study the effects of residual S i , P , and soil pH treatments> .V
on the availability and uptake of soil nutrients other than P .
3

; " U T E R A T U R E REV IEWi.' • .
? 9 ii §ilig9n
Her (1 9 5 5 ) , Jones^and Handreok (1 9 6 5 ) , F o x jtl £ l . (1967)
and othars agree that S i is present in an aoid soil in the iornn of
rronosilioio aoid (S i (O H )4 ) . The solubility of monosilioio acid in
the soil depends mainly on soil pH and the quantity of sesquioxtdes
present. Raupaoh (1957) noted that the amount of S i in the soil
solution d ecreased as pH in creased from 3 to 7 , fell sharply to
pH 6 and then in creased as pH in creased above 9 . Beckwith
and R eeve (1963) reported that between pH 4 .0 to 9 .0 , oxides
and hydroxides of F e and A1 sorb ironosilioic aoid. Aquave and
Tinsley (1 9 6 4 ) observed that P added to solutions d e cre a se s the
pH required for preoipation of S i from. pH 3 to 2 in the p resence
of F e and from pH 4 to 3 in the p resence of A l. Betw een pH 4
and 7 the S i w as slightly m ore soluble in the p resen ce than in the
absence of F . H iey also observed that the effect of m<olybdate on
S i solubility w as sim ilar to that of phosphates. A y re s (1966) and
Mfller (1 9 6 7 ) observed an in verse relationship between extraotable■V
soil S i and pH. On the other hand, Cheong (1 967 ) found a
highly significant positive correlation between extraotable soil S i
and pH when five great soil groups w ere considered together.
H ow ever, only the Low Humic Latosols (Tropeptic Haptustox)
showed such a positive correlation when the great soil groups

w ere studied individually.
H alais cmd P arish s (1963 ) in Mauritius found that applications
of powdered basalt ranging,up to 100 tons per a c re resulted in-f t
* I-in creased ^sheath S i conceiUrations and in creased cane yialds.
This yield in crease w as attributed to the improved physical condi
tion of the soil and not to changes in the uptake of nutrients.
Additions of colloidal S i to sand culture w ere believed to in crease
yield by increasing the w ater holding capacity of the sand acoord -
ing to Dix and R auterberg (1 9 3 4 ) .
Onikura (1 9 5 9 ) , working with volcanic ash soils of Japan,
found that S i application caused the, formation of amorphous A1
and/or F e silicates from allophane and sesqui-hydrous oxides and
caused hydrated halloysite to be tranirformed to a 16 A m ineral.
Onikura also found that the cation exchange capacity of the clay
fractions increased with S i application. The sam e affect of S i on
cation exchange capacity w as found by MahUum (1 9 6 5 ) on a Hydrol
Humio Latosol ( Typic Hydrandept). Uchfyama and Onikura
(1 9 5 6 ) applied soluble S i and calcium hydroxide to paddy soils
and allowed them to stagnate for 4 months. They found that when
S i w as added alone, the quantity of 2 :1 clays increased| however,
when S i w as added with C a , in cre a ses of ohloritio o r kaolinitio
m inerals w ere observ ed .
5
Effect of S ilicon on Soil Phosphorus
Many w orkers have attributed the beneficial effects of S i to
enhanced P assim ilation. MoGeorge (1 9 2 4 ) studied the influenoe
of S i on P availability in Humic Ferruginous L atosols (Typio
Umbriorthox) and found no difference in total soil P at any eleva
tion; how ever he found a definite relationship between available S i
and P a s m easured by resp onse of su g arcan e. Lem merman et a[.■j-
(1925) working with sand cultures concluded that S i cannot
repdaoe P in the metabolism of the plant and all yield in crea se s
from S i applications w ere due to increased P availability. F is h e r
(1 9 2 9 ) believed the main effect of S i w as to in crease the availa
bility of soil P through anion exchange reaction s.
The effects of the hydroxyl, sulfate and silicate anions on
plant yield w ere studied by Toth (1939) who concluded that the
hydroxyl and silicate anions resulted in "P complex degradation''.
He noted that yields in creased when calcium and magnesium
silioates w ere added but found no relationship between yield and.i'
available P .
Dutt (1 9 4 7 ) compared the addition of w ater soluble potassium
silicate with other cultural treatm ents and found that the highest
dry matter yields and the highest S i and P uptake occu rred in the
I^tassium silicate treatm ent. He also reported that the addition of'' a' ■'
potassium silicate induced better and m ore stable soil structure
than the. usual organic matter o r green manure p ractices .
Applied caloium, magnesium and sodium silicate w ere
reported by Dewan and Hunter (1 9 4 9 ); to have no effect on the
yield o r F uptake of so>4>e<ms. The yield and P u p t^ e of
sudangrass w ere also unaffected by applied S i 6 w eeks after
application. H ow ever, plant S i in creased significantly due to S i
application in both c ro p s .
More recen tly , Chu e l (1955) found that when sodium
silicate w as applied to a Humio Latosol (Humoxic Tropohumult)
and a Low Humic Latosol (TropeF^io Haptustox) the yields of
sudangrass w ere tripled on the Humio Latosol and w ere unaffect
ed on the Low Humio Latosol* They noted that the typical P
deficiency sym.ptoms of sudangrass w ere eliminated by the S i
addition. Ikawa (1 9 5 6 ) , extending Chu's w ork, concluded that S i
application w as beneficial on a Humio Latosol (Humio Tropohumult)
but not on a Low Humio Latosol (Tropeptio H aptustox), a Humio
Ferru ginou s Latosol (T yp ic Umbriorthox) o r a D ark Magnesium
Clay (T yp ic C hrom ustert) . He also found that P w as m ore
easily extracted from soil following application of S i .
Raupaoh and P ip e r (1 959 ) believed that S i did not change
the type of reaction which fixed soil P but rath er altered the
equilibrium constants involved. They concluded that any effect of
S I must therefore be transient.
Monteith and Sherm an (1 963 ) reported that in a Humio
Ferruginous Latosol (T yp ic Umbriorthox) calcium silicate
7

■t
in creased su d u ig rass yields due to in creased available F and not
due to a d ecrease in active A l. Su ehisa at (1 9 6 3 ) drew- » t ' *' ■
similar conclusions when they found >i^at’api^ioation of 1120 kilo
gram s of sodium metasilicate per h ectare caused 76% more P to
be absorbed by the test crop from the S i treatment than by the
control.
The effects of S i on die uptake of P w ere studied by Hunter
(1 9 6 5 ) who concluded that large amounts of S i in creased the
availability of soil P by anion exchange. Furtherm iore, he found
no evidence that S i substituted for P in the plant.
T eran ish i (1968 ) found that soil P extracted by die mocHfied
Truog method w as not in creased by application of 633 kilogram s
S i per h ectare , but w as slighUy in creased by application of 1666
kilogram s S i per h ectare .
Effect of Silicon on O ther Nutrients
Sch ollen berg er (1922 ) found no evidence that S i affects P
assimilation and suggested, on the basis of a field tr ia l, that N
may be m ore abundant in the soil when S i is applied. Maolidire
(1 927 ) observed that Mg toxicity of tobacoo, caused by the api^f-
cation of MgO, w as d ecreased by the application of an equal
amount of S i 0 2 , while a fourfold in crease in S i0 2 application
nearly eliminated Mg toxicity. The formadon of magnesium
silicates and carbonates w as thought to be responsible for the

reduction in Mg toxicity.
Maolntire and S te rg e s (1952a) conducted a ten -y ear lysim -
e ter study and found that the application of an adequate amount of
soluble S i (a s S i slag) to fallow soils in creased the amounts of
F , P and C a , but d ecreased the amounts of K and Mg in the
leachate. Maclntire and S te rg e s (1 9 5 2 b ), reporting on another
phase of their lysim eter study, found that limestone as well a s S i
slag d ecreased the amounts of K and Mg leached. They also
tobserved that the quantities of nitrate and sulfate in the leachate
w ere in creased by both the limestone and slag treatm.ents.
Exchangeable b a se s and extractable S w ere increased by
th e , application of calcium silicate slag to a Hydrol Humio Latosol
(Mahilum, 1 9 6 5 ).
Clements (1 9 6 7 ) believed that calcium, silicate and calcium
carbonate may in crease cane and sugar yields by eliminating from;
the soil solution toxic e x c e s s e s of the m icro plant nutrients as
wall as of C o , Ni, A l, H and P b . He proposed that although
many other compounds can eliminate these toxicides. S i may give
m ore permanent and m ore complete correction .
Plant Silicon
It is widely known that sp ecies absorb different amounts of
S i and that the gram inaceous sp ecies accumulate much higher■Hr
amounts of S i than the iK>n-graminaoeous sp e c ie s . R ice and
9
-
sugarcane have given the largest resp on ses to S i appdications,
how ever other gram inaceous cro p s also appear to benefit from S i
application. Among the non-gram inaceous c ro p s , sugar beets
have shown large resp on ses to S i application (R aleigh , 1 9 4 5 ).
T h e S i content of various plant sp ecies is highly dependent on the
supply of soil and fertilizer S t (T era n ish i, 1966; F o x fit ,
1967 ; A li, 1966 ; A y re s , 1966; Clem ents, 1965a, 1965b; Jo n es
and H andreck, 1 9 6 5 ).
Silicon is believed to occu r in plants in the form of plant
opal, silica gel and monosilicic aoid. Lanning fil fii,. (1958 ) using
x -r a y diffraction and petrographic teohrdques found that S i w as in
the form of plant opal in sorghum , wheat, co rn , sunflower and
tomato while in lantana it w as in the form of plant opal and a
quartz. Yoshida j|t a l. (1959 ) working with infrared spectropho
tometry reported that S t in r ice is in the form of S i gel. Studies
of the xylum sap of several sp ecies have revealed that S I in the
roots is transported to the top in the form of monosilicic acid
(H andreck and Jo n e s , 1967; Okuda and Takaheuithi, 1 9 6 4 ).
S e v era l w ork ers have reported that S i is not distributed
uniformly in plants. Mitsui and Takatoh (1963b) found toat most
of the Si^^ absorbed by r ice roots w as rapidly transported up
w ard and accumulated in localized spots and along the margins of
leav es . Silicon in oats w as reported to accumulate in the leaves
and in florescences (H andreck and Jo n e s , 1 9 6 2 ). F o x fit fii*
10

«-
' t '(1 9 6 9 ) studied T C A (triohioro-aoetic aoid) soluble S i and total
S i in sugarcane and found that T C A soluble S i w as highest in
the young leav es , sheaths and st«dk internodes and generally
d ecreased with the age of the plant part, while total S I in the
leaves and sheaths in creased with age until the leaves w ere ma
tu re , after which there w as little o r no in cre a se . On the otoer
hand, total S i in the internodes first in creased and then d ecreased
with ag e .
Jo n es and Handreok (1 967 ) oancluded that the S i distribu
tion data available support the thesis that S i moves passively in
the transpiration stream and is deposited in regions w here tran
spiration is highest. H ow ever, Takahashi gf.. (1 9 5 8 ) observed
diat S i w as absorbed by die r ice at a high rate against a concen
tration gradient and they found no correlation between transpiration
and absorption of S i . T h e data of F o x (1 969 ) suggest that
the deposition of opal in plant tissues is associated with grow th.
T h e re has been much speculation on the effect of S i on plaid
grow th. Hall and Moriwin (1 9 0 5 ) and Lemmerman (1925 )
observed that S i , like P , in crea ses grain yield. H ow ever, they
found no evidence that S i cau ses better utilization of P in the
plant. Akhromeiko (1 934 ) concluded that S i 0 2 in cre a se s plant
growth through direct stimulation of vital p ro c e ss e s . He also
observed that N nutrition w as not aiieoted by S i application.
A y re s (1 9 6 6 ) studied the effects of all the nutrients present in S i
■ . l A - ' - i - . . J -.. '■■■ • ■ '
11

slag on the growth of sugarcane and concluded that only S t could
account for the pronounced yield in creases observ ed . F o x s i
(1 9 6 7 ) observed that silicate response did not result from
improved P nutrition b ecau se , in a situation w here S i greatly
in creased sugarcane production, a fourfold in crease of applied P
had little effect on yield.
S ilica w as reported to be indispensable for the growth of
sugar beets by Raleigh (1 9 3 9 ) . He also observed the following
effects when S I w as deficient in sugar b ee ts ! the growtii of pri
m ary roots is retarded and some secondary roots a re produced,
the outer leaves tend to wilt (especially in an atm osphere with a
high evapotranspiration potential), leaves develop anthooyanin
color along the v ein s, in young plants the cotyledons yellow and
die, and the frequency of damping-off in c re a se s .
Som e insight into the role of S i in plant nutrition is being
gained by several r e s e a r c h e r s Umemura ^ (1 9 6 1 ) reported-li
that aoid phosphotases of Irish potato and rioa i^ants w ere
inhibited by both ioiUo silicate and colloidal S i ; how ever, the'4
activity of sw eet potato phosphotase w as not affected by the S i
treatm ents. Ityuries to r ice and barley by e x c e s s e s of F e , Mn
and A s w ere reduced by S i application according to Okuda and
Takahashi (1 962 ) while iqjury from Cu, Al and Co w ere not
affected. They also concluded that S i absorbed by the plant
in creased the oxidative power of the ro o ts . In armther paper.
12

■: - : 13
these sem e authors (1963) reported that the metabotio pathways
of S i and P a re oomF4etely sep arate . Mitsui and T a k ^ h (1963o)
observed that aerobic respiration inhibitors and 2,4-dinitrophenol
inhibit S i uptake T h e effects of fertilization and S I content on
several forage g r a s s e s in Canada w ere studied by B ezeau ^
(1 9 6 7 ) who reported a significant inverse correlation between
percent protein and percent S i in the forage.
Rothbuhr and Scott (1957 ) studied the uptake of S i and P
by wheat plants grown in solution culture and found that added P
d epressed the uptake of S i slightly, and added S i increased the
absorption of P . They also reported that considerable amouirts of
S i w ere taken up by the plant within one-half hour after S i w as
added. They concluded that the metabolism of S I and P a re
closely related .
T h e relationship between S i and Mn in barley w as studied
by Williams and Vlam is (1 9 5 7 a ) who found that S i altered the
distribution of Mn in the leal but did not prevent its uptake by the
plant. T h ese re s e a r c h e r s reported in another paper (1957b)
that S i rep ressed Mn toxicity symptoms, but had no effect on the
Mn content of the leaf tissu e; how ever B toxicity symptoms w ere
only slighdy suppressed by S i application.
H alais and’‘P a rish (1963 ) found an inverse relationshipu . '.or
between S i and Mn concentration in sugarcane sheaths. Clements
(1 967 ) reported that S i applications resulted In a marked in crease

in plant S i and C a and a marked d ecrease in i:4ant Mn and in the
M n/Si02 ratio in sugarcane sheaths. He observed that the effects
14
}of S i slag a re generally sim ilar to those of lime except when plant
S i is very low and suggested that S i is possibly irrep laceable and,
th erefo re , perhaps essential in su garcan e. Calcium silicate was
found to have no significant effect on the levels of Z n , K, Mo, S ,
A l o r Cu in sugarcane sheaths, but did significantly in crease the
sheath S i and C a levels (C lem ents, 1 9 6 5 a ). Clements also
reported that levels of P , Mg, Mn, B , leaf N and tissue moisture
w ere significantly reduced by calcium silicate applications. He
concluded that the increased sheath S i and d ecreased sheath B ,
Mn and M n/Si02 ratio w ere largely responsible for the yield
in crea ses following S i applications and that die freckling and
bronzing of cane leaves w as probably related to an imbalance of
the m ioronutrients.
Many Japanese w orkers have found that S i application
red u ces "A kiochi” d isease (r ic e blast d is e a s e ) . They have con
cluded that S i is deposited n ear the epiderm is of the leaves and
stem s and thus acts a s a protective shield agdlnst fungal d iseases
and insect p ests . Ota (1 957 ) studied the influence of dif-t;.
ferent N and S i levels on the growth and composition of r ice «md
reported that in the p resence of high N , slag applications reduced
early growth and accelerated later growth while with low er N
lev els , slag applications had no effect on grow th. They postulated

that die observed efleots of N and S i applications w ere due to S i
causing the plants to becom e rigid and re s is t attack by blast dis
ea se o r stem b o r e r . They also postulated that at high N levels
the high asparagine content of the leaves w as causing the r ice
plants to be m ore susceptible to d isea ses , and S i application
increased the ammonium absorption capacity of the so il.
Soil Phosi:diorus
One of the ma^or problems in Hawaiian agriculture is P
deficiency in plants. T h is problem is largely due to high fixation
of P by F e and Ai oxides in Hawaiian so ils . Chu and Sherm an
(1 9 5 2 ) found that in soils dominated by these oxides m ore than
90 percent of the added P w as fixed in 24 hours while only 30
percent of the applied P w as fixed when the oxides w ere
rem oved. Phosphorus fixation also depends on soil pH as indi
cated by S c a rse th (1 935 ) who reported that at low pH, P is
fixed by F e and Al oxides while at high pH, P is fixed as
calcium phosphate. He also emphasized the fact that soil P sol
ubility w as related to anion exchange and observed that in certain-■=3'
soils the supply of P can be enhanced by replacing P from die
soil with other anions, especially silicate.
Low and B lack (1950) accounted for P fixation by kaolinite
with the hypothesis that the clay dissociates into S i and Al ions in' , V iv. ?
accordance to the solubility product principle so that when S i is
15

applied soil Al re a c ts with the e x c e s s S i leaving P free to be
taken up by plants.
T erm an and Stanford (1 960 ) postulated that P fertilizer
added to soil first dissolves and form s a localized concentration of
P , which in turn cau ses other soil constituents to be solubilized.
T h e soluble constituents, especially F e , Al and C a , then combine
with P to form relatively insoluble p^osp^ates. Teranishi (1 9 6 8 )
found that application of P fertilizers resu lts in in creased S i"c
up>take by su g arcan e.
Plant Phosphorus
Phosphorus is present in the plant a s orthophosphate and is
an essential part of many enzym es and nucleic acids (R u sse ll,
1 9 6 1 ) . It is well documented that P is translocated from older
p>ortions of the plant to a re a s with high metabolic activity (R u sse ll,
1949 ; Stout and Hoagland, 1940 ; A rnon, 1 9 5 2 ). Clements (1 968 )
recommended that P fertilizer should be applied to sugaroane if
the amplified P index of the cane plant falls below 2400 .
T eran ish i (1 9 6 8 ) found that P of the sugaroane p^ant
in creased with increasing P application. At low P levels S i
application caused increased sheath P while high levels of applied
^ 7 S i caused decreased sheath P and P uptake. He suggested that
oomp>etition between S i and P at the soil-root interface o r within
the pJant w as m ore impx>rtant than the S i - P anion exchange effect.
16
V ' — .

Soil Acidity-% -
In general soil reaction plays an important part in die avails' ‘ i "■ ■■
ability of soil nutrients and optimum soil pH is a compromise
between availability of some elements and toxicity of other ele
ments (Buckm an and B rad y , 1 9 6 5 ) . In Hawaii, a s in most of
the w orld, a soil pH of 6 -7 is usually optimum for growth of the
common crop p4ants. Clements (1968) reported that if possible,
a flRdil should be limed to pH 5 .8 to prevent problems with ferrou s
iron and Mn toxicities.'■ ~
D ias (1 9 6 5 ) found that Al and Mn toxicities rath er than Ca
deficiency w ere the mqjor problems in soils with pH levels near
5 .0 .
Soil and Plant Aluminum
T h e amount of Al present in the soil is highly dependeiU on
soil reaction . Magistad (1925 ) found that between pH 5 and 7
soluble soil Al w as practically absent while below pH 5 and above
pH 7 Al solubilities in creased rapidly. He concluded that between
pH 5 and 7 the only benefit from liming w as due to a d ecrease in
acidity and not a d ecrease of soluble Al p resent. Aluminum,
how ever, does not have to be present in the bulk soil solution toJ
be toxic. The environment of the plant root is usually an acid
one. Ligon and P ie r r e (1 932 ) found that Al present in nutrient
solution at concentrations higher than 1 ppm caused iryury to
oorn , sorghum and bemlsy and concluded that plants grown in
soils of le ss than pH 5 .0 may be seriously iixjured by A l.
Although Teranishi (1968) found no statistically significant differ
en ces in K C l-extractable soil Al due to S i , P o r pH treatm ents
he did find that Al solubility, generally, w as g rea ter under the
more aoid conditions. He also found that S i applications
d ecreased extractable soil Al
T ay lor g i aL. (1 965 ) found that the addition of gibbsite to
ammonium phosphate solutions with low pH caused ammonium
taranakite to precipitate out while iron oxides reacted only slightly
with ammonium phosfdiate at any pH.
Lipman (1 9 3 8 ) found that yields of sunflower and corn in
solution culture benefit by the presence of some A l. Reuidali and
V o se (1 96 3 ) and Medappa and Dana (1 9 6 8 ) found increasing P
uptake a s Al in creased to about 1 .2 ppm in culture solutions and
then d ecreased after about 12 ppm. Randall and V o se (1963)
studied this effect end observed that metabolic inhibitors reduced
the Al-induoed P uptake and concluded that die Al-induced P up
take is a metabolic p ro ce ss , how ever, they could not rule out
precipitation effects on root su rfa ces .
18

M A T E R IA L S AND M E T H O D S
Description of Soil
T h e experiment w as installed on Halii soil classified by Ikawa
and Sato (unpublished, 1969) a s a gibbsihumox. They described
the upper horizon of the Halii se r ie s a s follows:--r'
Ap — 0?-32 cm — D ark brown (1 0 Y R 3/3) gravelly silt loam ; strong medium, fine and very fine granular stru ctu re ; friable, slightly sticky, slightly i^astic; no ro o ts ; many fine p o res ; many fine and medium iron concretio n s; few saprolyte fragments from low er horizons; abrupt wavy boundary.
Halii soils a re characterized by many sm all, smooth
su rfaced , concretions which contain up to 65% F s 2 0 3 and 10-20%
AI2O3 (S h erm a n , 1 9 6 8 ) . The parent material is basalt. Domi
nant vegetation of the a re a includes Ohia lehua ( M etrosideros
s p . ) , koa (A cacia koa. G r a y ) , guava ( Psidlum guqjava, L , ) ,
and false staghorn fern ( S icran op teris s p . ) . Where these
sp ecies have been c leared , H ilograss ( Paspalum coniugatum.
B e r g iu s ) , yellow foxtail ( S e ta r ia geniculata (L a m .) B e a u v .) ,a n d
rice g ra s s ( Paspalum o rb icu lare . F o r s t ) a re common a s well as
kikuyu g ra s s ( Pennisetum olandestinum. H ochst) which is one of
the best introduced sp ecies .£
The concentrations of various nutrients in tiiis soil w ere
determined in the control plot which received only the blanketif'
application of N , K , Z n, Mg, B and Mo (T ab le 1 ) . Sam ples
w ere taken at 4 , 9 and 18 months after die cane w as rJanted.
f
■ '' ''
20
Table 1 . Concentration of Nutrients in the Control Plot A fter Harvesting a Plant and Ratoon Crop of Su garcan e
Element
“Vr-'•-.:a ■
Date(Months after
S I (1 :1 0 w ater extraotable, ppm S i in solution)
0 .4 8 0 .5 0
p (modified T ru o g , ppm P ) 9 13 '
K ( exchangeable, ppm. K ) -------- 46
Ca (exchangeable, ppm C a) -------- 110
Mg (exchangeable, ppm Mg) ee — — 1 9 .1
Al ( ^ KCI extractable) -------- 4 9 .0
Soil pH 4 .8 5 .3

Experimental Methods
T h re e replications of a 3^ factorial experiment in a spiit-plot
design w ere laid out on a 0 .6 ha field at the Kauai B ran ch S ta
tion (H A E S ) by Dennis Y . Teranishi in November 1966 . Whole
plots w ere three pH treatm ents (pH 5 .5 , 6 .0 and 7 .0 ) and the
subplots w ere factorial combinations of 3 P treatments (1 1 2 , 280
and ,1120 kg P/ha) and 3 S i treatm ents (0 , 8 3 3 , 1666 kg Si/ h a).
A blanket application of N , K , Mg, Z n, B and Mo w as applied
ov er the field. Nutrient so u rces and application ra tes a re shown
in Table 2 . Titration cu rv es for both S i slag (T V A slag) and
lime w ere used to determine amounts of lime o r elemental S
required to adjust the soil pH to 5 .5 , 6 .0 and 7 .0 .
Supplementary plots w ere included in the experiment to study
the effects of increasing S i (0 , 8 3 3 , 1666 kg Si/ha) at zero P
(pH 6 .0 ) and increasing P (1 1 2 , 280 , 1120 kg P/ha) at the
original field pH (pH 5 .0 ) . A no treatment plot w as also includ
ed In the experim ent. T h ese plots w ere adjacent to the m^n
factorial experiment and w ere not included in the analysis of
variance for the split-plot experiment.
Cultural P ra c tic e s
T h e subplots w ere 6 .1 x 9 .1 m eters and the whole plots*■
w ere 1 6 .3 x 2 7 .4 m eters. A fter the field w as plowed the blanket
fertilizer w as applied and the differential fertilizer treatments w ere
21

1 ■.. ?
22
Table 2 . R ates and S o u rc e s of Nutrients Added to the Halil Soil B efo re Planting Su garcan e
Elem ent Rate of Apfitcation (kg/ha)
S o u rce
N 1 1 2 * U rea (46% N)
P 112 T re b le S u p er PhosF^ate280 (20% P )
1120
K 224 Potassium Chloride (61% K )
Ca A s Required Agricultural Lim e (31% C a)
Mg 2 1 .5 Magnesium Sulfate (9.6% Mg)
Zn 56 Zinc Sulfate (36% Zn)
S A s Required Elemental Sulfur
B 2 .3 7 Sodium B orate (10.6% B )
Mo 0 .4 4 Sodium Molybdate (39% Mo)
S i 0 TV A Calcium Silicate Slag833 (18.6% S i )
1666*2 sim ilar applications of N w ere made in March and Ju n e . A
third api^ication of N w as made when & e crop w as ratooned.
J).].

. .V-3-
7 7 * broadcast by hand. T h e Held w as disc with a disc harrow to
mix the soil and fertilizers .
S u g a rca n e , variety H5 3 -2 6 3 , w as planted on November 21 ,
1 9 6 6 . T en ro w s, each 0 .9 1 m eters ap art, w ere planted in each
plot. This spacing w as used since the cane w as to be harvested
after 9 months. Irrigation w as not n ecessary a s the local annual
rainfall of 210-240 cm w as well distributed throughout the y e a r .
Weeds w ere controlled by use of a contact herbicide until the cane
closed in. Nitrogen w as reapplied in March and June at the rate
of 112 kg per h ectare .
On August 10 , 1967, the sugarcane w as harvested and
ratooned. The ratoon crop received 112 kg N/ha; weeds w ere
23
V-*. •'iv. ■ , •'r;
yTV '-again controlled by use of a contact herbicide. Monthly rainfall
during the 9-month growing period of the ratoon crop is shown in
T able 3 .
Plant Sampling
Sheath sam ples w ere collected according to the method of
Clements (1957 ) when the ratoon crop w as 6 , 8 and 9 months
old. Tw o stalks w ere collected from the third and eighth row s
of ev ery plot and the sheaths of leaves 3 , 4 , 5 and 6 , countingV . , !■ . s
. -1
; 3 He spindle as leaf number on e, w ere rem oved. T h e fresh
weight of the 16 sheaths w as recorded and the sheaths w ere
chopped into centim eter-long sections, thoroughly mixed and 10
■y-

24
-"A. A
T able 3 . Rainfall Distribution During the Growing Period of the Ratoon Su garcan e Crop
Month Rainfall (cm )
August (1 0 -3 0 ) 9 .8 3*
Septem ber 1 3 .0 6
■'v' i‘- : O ctober 1 5 .1 6
, ' v r A - -
' - - a A -
.rv* •:
November
D ecem ber "
Jan uary
2 7 .9 4
4 1 .5 0
1 9 .0 2
F eb ru a ry 9 .0 9
March 2 6 .9 2
.. - -■ i' •- - - ■A.-.
April 2 6 .0 9- ■ : a - . - - ,
May 5 .3 1
June (1 -1 7 ) 3 .7 8.. ' A ,7 . ’ -A ' -■
■ • ; / • . ,' ' -
Tot«d 1 9 9 .7 0
% v

f -■
. ...
and 100 g subsamplaa taken for analysis, of T C A soluble sheath
S i and for moisture determination and subsequent ohemioal analy
s is . T h e sam ples w ere dried at 7 0 *C , weighed for moisture
determinations and ground in a Wiley mill to p ass a 20 mesh
s ie v e .
Soil Sampling
Soil sam ples w are collected by T eranishi when the plant
crop w as 4 months old and immediately after harvest (9 m onths).
So il sam ples w ere also collected after harvest of the ratoon cro p .-t
Sam i:4es consisted of four c o re s of surface soil (0 -1 5 cm ) from
each plot. T h ese c o re s w ere mixed thoroughly and a subsample
stored in a polyethylene plastic bag for analysis. B efo re analysis
the sam ples w ere passed through a 9 mesh sieve to break up
clods and rem ove rooks and d ebris.
H arvest
T h e ratoon crop of sugarcane w as harvested at 10 months
of age (17 June 1 9 6 8 ) . T o minimize b ord er effects plants w ere
discarded from the four outside row s and 1 .5 2 m eters on either
end of the plot. T h is left a harvest a re a of 3 .0 5 x 5 .4 9 m eters
(0 .0 0 1 6 7 4 ha) per plot.
P lants w ere hand cut at ground level and weighed. T enf -fU “ • •-
stalks w ere selected at. random, weighed, chopped with a
mechanical chopper and a 200 g subsamfiJe w as taken for
.. .. 25
,■ .--"'I -

■ ’ V ■ 26
moisture determination and subsequent ohemioal analysis. Sam ples
w ere dried at 7 0 *C in a forced a ir oven, moisture content deter
mined, and ground to le s s than 20 mesh in a Wiley mill.
Analytical Methods
Plant A nalysis
T h e concentrations of S i , N, P , K , C a , Mg, Mn and Al
w ere determined in the plant m aterials. F o r detailed methods of
extraction and analysis see Appendix A .
T C A Extraotable S ilico n ; T C A soluble S i in cane sheaths
w as extracted by the method of F o x fit fil. (1967) immediately
after collection of the sheath sam ples. Silicon w as determined
by the Silioo-M olybdate method described by Kilm er (1 9 6 5 ) .
Total S ilico n : Total S i w as determined on a solution
prepared by fusion of an ashed sample with lithium tetraborate
according to the method of S u h r and Ingamells (1 9 6 6 ) . S ilicon
w as determined by the Silico-M olybdate Blue method of Kilmer
(1 9 6 5 ) .
Wet A shing: A second portion of the ground plant material
w as digested in a 2 :1 n itric : perchloric acid m ixture. T h is digest
w as used for the determination of P , K , C a , Mg, Mn and A l.
Plant P h osp h oru s: An aliquot of the perchloric digest w as
analyzed for P by the Vandate-Molybdate Yellow method of B arton" . * . s',..
(1 9 4 8 ) .

Plant Calcium and Magnesium; An aliquot of the nitric-
perohlorio digest w as combined with lanthanum oxide solution and
diluted tenfold so that the digest contained 0 .3 percent lanthanum.
T h e lanthanum w as added to eliminate in terferences from alumi
num, phosphate and sulfate ion s. Plant Ca and Mg w ere deter
mined with a P e rk in -E lm e r atomic absorption spectrophotom eter.
Plant Potassium : The solution used for Ca determination
w as used for K analysis on the Beckm.an DU flame photometer.
Flant Manganese and Aluminum; Plant Mn and Al w eref
determined directly on a portion of the n itric-perch loric digestI
solution with a P e rk in -E lm er atomic absorption spectrophotom eter.
Total Plant N itrogen: Total plant N of the whole plant
sample w as determ.ined by the Kjeldahl method.
Soil A nalysis
Soil pH, extraotable S i , P , Al and exchangeable K , Ca
and Mg w ere determined on the soil samples collected after the
ratoon crop of sugarcane w as harvested . The complete methods
of extraction and analysis a re given in Appendix A .
Soil pH ; Soil pH was determined on a 1 :2 .5 so il:w ater
suspension using a 10 g sample of field-moist soil. The pH w as
read on a Beckm an Model N g lass electrode pH m eter following
a 30 minute equilibration period.
27

Soil S ilicp n r Soil S i w as extraotad with w ater and also
with die modified Truog extracting solution (0 .0 2 N sulfuric a c id ).
Silicon in both extractants w as determined by the Silioo-Molybdate
Blue method.
So il P h osp h oru s: Soil P was extracted by the modified
Truog method of A y res and Hagihara (1952) and determined by
the Molybdate Blue method of Dickman and B ra y (1 9 4 0 ) .
Soil Potassium and Soil Magnesium! Soil K and Mg w ere
extracted with ^ ammonium acetate, pH 7 0 , and determinedI
directly on a P e rk in -E lm e r atomic absorption spectropJiotom eter.%
Soil Calcium : Exchangeable ^ i l Ca was determined on the
sam e extract used for soil K analysts. B efo re determining C a on
the atomic absorption spectrophotometer an aliquot of the solution
w as combined with lanthanum oxide solution and diluted 1 6 .7 times
so that the extract contained 0 .5 percent lanthanum.
Soil Aluminum: Exchangeable soil Al was extracted with 1
potassium chloride solution and determined by the Aluminon method
of Chenery (1 9 4 8 ) .
26
R E S U L T S AND D ISC U SSIO N
Yield resu lts and plant and soil data a re discussed in the
following o rd er - yield, S i , P , pH, N, K , C a , Mg, Mn and A l.
In each of these sections first soil and then plant factors a re p re
sented in detail. A general discussion of the various in terre
lationships is presented with reg ressio n analysts in the last
section .
Yield
Yields of the ratoon sugarcane crop w ere not significantly
affected by the S i , P o r pH treatments according to an analysis
of variance (T ab le 4 ) . H ow ever, yields tended to in crease as
the amount of residual S i increased (F ig u re 1) and the mean
yields for the 1666 kg S i per h ectare j;Jots and 0 S i plots w ere
shown to be significantly different by die Duncan's multiple range
test. The Duncan's multiple range test determines significant dif
feren ces between m.eans while the F test determines the average
treatment effects. Effects of residual P w ere not statistically
significant, but inspection of F igu re 1 shows that the high (1120
kg) P treatment out-yielded the low (112 kg) P treatment by 4
tons (m etric) per h ectare at the zero S i level and 6 .4 tons
(m etric) per h ectare of the high (1666 kg) S i level. The marked
d ecrease in yield of the high (1120 kg) P treatment which
o ccu rred at the medium (833 kg) S i level is difficult to explain

30
Table 4 . A nalysis of V arian ce of Ratoon Crop Cane Yields
S o u rce of Variation df Mean S q u a res
Whole P lo ts :
Replications 2 2041 .98
pH 2 775 .71
E r r o r (a )s
4 7 2 8 .7 5
Subplots:
S i 2 1360 .62
P 2 1 4 5 .6 2
S i X P 4 8 6 .4 9
S i X pH 4 1054 .38
P X pH 4 2 2 6 .6 2
S i X P X pH 8 4 1 9 .7 4
E r r o r (b ) 48 5 0 4 .1 0
'"'A" y.k, .-"f '
130r-
\ > 31
0' v .
►
-X« . . .
4 'J, Vw
1666(-V ... v r A P P L i e i ^ ^ (kg/ha)
u 1 ■ /.1 . Influence ol Residual S i and P
Yield of Su garcan e (Ratoon C rop) H arvested at Nine Months.
! *
‘ If', ; ; ■''W
\

especially since the yields of the medium (280 kg) P treatments
exceeded those of the low (112 kg) P treatment by 4 .8 tons per
h ectare at this S i level. One possible reason for this d ecreased
yield of the high P treatment is that the plant crop depleted one
o r more essential nutrients in this treatment so growth was
limited. This P and S i combination produced the highest yields
in the plant cro p . Certain plots of the experiment w ere damaged
by rats but no correlation with treatment w as ob serv ed . More on
this subject will be presented a s the individual elements a re
d iscussed.
G reen sheath weight w as found to be significantly affected by
residual P at four and eight months but not at nine months (T ab le
5 ) . The fact that P normally has its greatest effect on growth
early in the crop may explain the observed resu lts . At four
months, the green sheath weight first increased and then
d ecreased sharply with increasing P ra tes ( F ig u re 2 ) . This
pattern may be the result of nutrient deficiencies brought about by
the large quantities harvested in the plant cro p . This effect may
intensify with increasing age, thus accounting for the diminishing
resp onse to residual P at eight and nine months.
Silicon
So il S ilioon . A nalysis of variance of w ater extraotable S i
showed a highly significant effect of S i on yield and a significant
32
33
Tabid 5 . A nalysis of V arlanoa of Su garcan e G reen Sheath Weights Sam fJed at
F o u r , Eight, and Nine Months
S o u rce of Variation df A ge in Months4 8 9
mean squ ares
Whole P lo ts ;
Replications 2 2 2 5 1 .5 9 * 236 0 .2 3 7 6 9 .1 2
pH 2 7 1 .61 7 08 .79 1 2 2 3 .7 9
E r r o r (a ) 4 1 87 .18 1 4 3 9 .7 5 1 2 1 1 .1 2
Subplots:
S i 2 2 1 1 .1 5 6 0 3 .4 9 1 6 8 .9 8
P 2 2 1 4 9 .7 8 * 2 1 7 1 .6 0 * 6 5 0 .9 8
S i X p 4 3 0 5 .5 9 4 8 5 .6 0 8 7 1 .9 4
S i X pH 4 1 7 0 3 .7 4 * 9 7 2 .4 0 172 9 .5 3
P X pH 4 8 8 .1 5 9 2 0 .0 1 2 1 9 .1 4
S i X P X pH 8 4 8 3 .2 7 9 1 4 .9 6 2 7 5 .6 9
E r r o r (b ) 48 5 80 .43 59 8 .5 2 9 1 5 .1 1Significant at the 5% level.
34
pH 6 .5
Figu re 2 . Influence b{ ResidusJ S i and Soil pH on Su g arcan e Green'^Shelath Weights
•j^i(4-Month^jSimFrfe).
-5*.
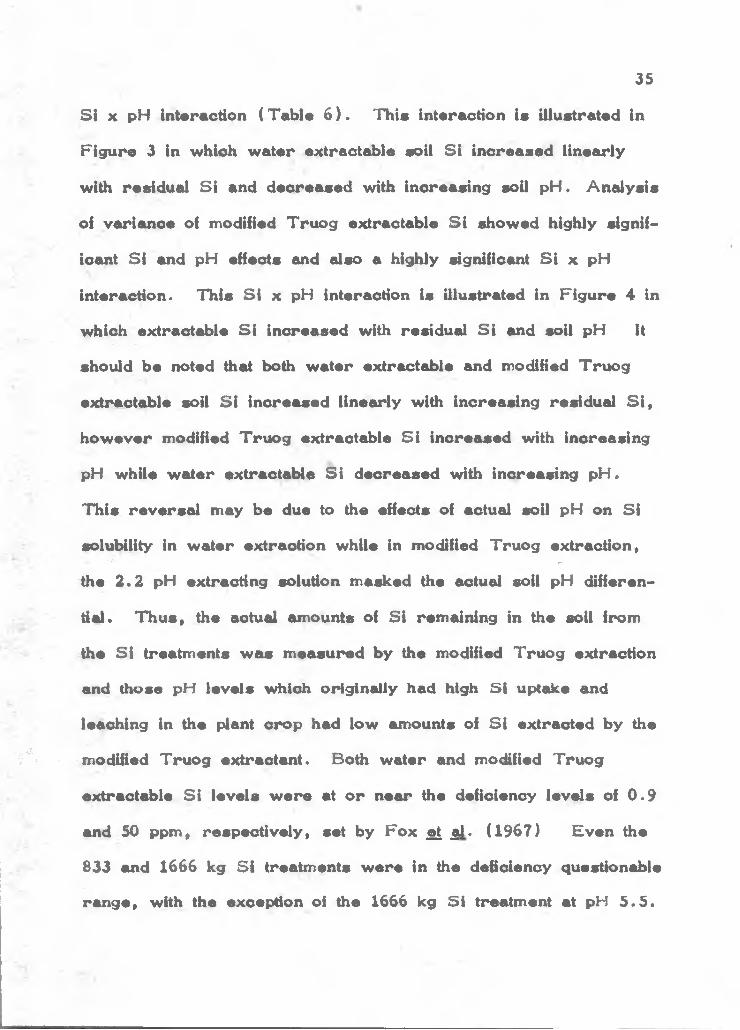
S i X pH interaction (T ab le 6 ) . This interaction is illustrated in
F igu re 3 in which w ater extractable soil S i in creased linearly
with residual S i and d ecreased with increasing soil pH. A nalysis
of variance of modified Truog extractable S i showed highly signif
icant S i and pH effects and also a highly dignificant S i x pH
interaction. This S i x pH interaction is illustrated in F ig u re 4 in
which extractable S i increased with residual S i and soil pH It
should be noted that bodi w ater extractable and modified Truog
extractable soil S i in creased linearly with increasing residual S i ,
how ever modified Truog extractable S i in creased with increasing
pH while w ater extraotal^e S i d ecreased with increasing pH.
This rev ersa l may be due to the effects of actual soil pH on S i
solubility in w ater extraodon while in modified Truog extraodon,'4 ...
the 2 .2 pH extracdng solution masked the actual soil pH differen
tial. T h u s, the actual amounts of S i remaining in the soil from
the S i treatm ents w as m easured by the modified Truog extraction
and those pH levels which originally had high S i uptake and
leaching in the plant crop had low amounts of S i extracted by the
modified Truog extractant. Both w ater and modified Truog
extractable S i levels w ere at o r near tiie deficiency levels of 0 .9
and 50 ppm, resp ectively , set by F o x ^ jgi. (1 967 ) Even the
833 and 1666 kg S i treatm ents w ere in the deficiency questionable
ran g e, with the exception of the 1666 kg S i treatment at pH 5 .5 .
35
36
T able 6 , A nalysis of V arian ce of W ater-Extractetole and Modified T ru og-E xtraotab le Soil S i
..
S o u rc e of Variation df Water Modified Truog
Whole P lo ts ;
mean squ ares
Replications 2 0 .1 7 2 1718
pH 2 1 .4 4 7 2 2 3 3 2 **
E r r o r (a ) 4 0 .2 7 9 265
Subplots;
S i 2 11.690*® 1 18217**
P 2 0 .0 2 5 718
S i X P 4 0 .0 1 6 549
S i X pH 4 0 .2 6 3 * 3 9 5 4 **
" P X pH 4 0 .0 3 3 816
S i X P X pH 8 0 .0 2 3 633
E r r o r (b ) 48 0 .0 8 2 921 ................
; ^ 5% level.Significant .at the X% level*
37
2 .5
pH 5 . 5
•* pH 5 .8
pH 6 .5
F ig u re 3.^ InUuen^g^ol.iResidual S i and Soil pH ^ on *i :1 0 .^ id e< *-E x tra cta b l^ S o il S i .
7; :%yy . S »i,t
11?*,> i * k.
■ ■ :
38
5Q.Q-
WJOwUJJGQ<hO<o:hXLUIOoDa:hoUJEQo2
250 r-
200
150 -
100 -
50
pH 6 .5
* "1^833 1666A P P L IE D S i (kg/ha)
^ . - a i -
" F ig u re 4 . |. Influence *of Residual Sr^and Soil pH on Modified T ru og-E xtractab le So il S i .
■ t: " ■■ W■ ', "pa
- A ..
*r -V-"a

.■■•''"‘I ,
Increasing soil P did not in crease extractable soil 51 a s was
reported for the sam e plots eaH ier by Teranishi (1 9 6 8 ) . Thus
P effects must be a short-term m ass action effect on S i and p e r-
sist only as long as P additions continue to in crease P in solution
significantly.
Plant S ilico n . Residual S i had a sigrafioant effect on TC A
extractable sheath S i at all three ages while the S i x pH and
P X pH interactions w ere significant at nine months only (T ab le'V<.
7 ) . T h e S i X pH interaction is illustrated in F ig u re 5 In which
TC A extractable S i increased with residual S i and d ecreased
with soil pH. T C A extraotable S i appears to be b e tter . related
to w ater extractable soil S i than to modified Truog extraotable S i .
Sheath S i at eight and nine months and al«> whole pdant S t
' d ecreased significantly as pH in creased while sheath S i at ail■ ,,
. three^ ages and total plant S i increased significantly a s residual S i
■■■ r 3 9
in creased . T h e S i x pH and P x pH interactions w ere also
significant at most sampling ages (T ab le 8 ) . T h e low S i treat
ments and the medium S i treatments at pH 6 .5 w ere at deficiency
levels while the other medium and high S i treatments w ere in the•i ••
deficiency questionable range except at pH 5 .5 . T h e effects of• -
various factors on sheath S i increased with age a s indicated by• .y.’ y- ■. -
the increasing levels of significance for pH as well a s for the S i
and P interactions with pH. T h ese effects of S i with age a re
sim ilar to those reported by Adlan (1 9 6 9 ) . The S I x pH

V ,• ''uC- •
' .4-
.V I
T a b le '7 . A nalysis of V arian ce of T C A -E x tra cta b le S t in Sheaths Sampled at F o u r , Eight, and Nine Mordhs
40
.i
•• V • •
. » i - ,
'V. . \
S o u rce of Variation• df A ge in Months4 8 9
mean squ ares
Whole P lo ts :'■- .f ^
Replications 2 2 9 8 .0 1 3 .7 1 1 4 0 .6
pH 2 6 6 .9 3 2 6 .1 7 2 7 .4
E r r o r (a ) 4 4 6 .2 8 6 .4 1 7 7 .0
Subplots:
S i 2 2 2 3 7 .2 * * 2 9 2 5 .8 *» 1 5 0 7 .8 * *
p 2 1 6 .2 5 8 .8 7 .9
S I X P 4 4 0 .3 1 1 8 .7 4 0 .0
S I X pH 4 3 5 .7 3 2 .7 1 6 6 .2 * *
P X pH’ . ' s' -
4 2 0 .6 6 2 .1 1 4 7 .4 *
S I X P X pH 8 2 1 .0 7 0 .1 1 9 .5
^ E r r o r (b ) 46 3 1 .6 6 8 .1 4 2 .0^ll@ i^tfioant at die 5% tM ^ ^ lflo itn t at the 1%
level.Ibvel.
41
pH 5 . 5
5 . 8
pH 6 . 5
833A P P L I E D S i (kg/ha)
1666
F ig . 5 . Influence of Residual S i and Soil pH on T C A Extractable Sheath S i
(Nine-Month S a m p le ) .

3: . : . y - v ■ 7*1: /3''';yy.'.:;3’ 7 ''y-y :7 ; •; ";yy ,y"--y :y ' -y,.*; :■ : " y ■ : iyy'- '■yyy'.y.y-y-.. ,y.yvi. ‘ ‘ .y '.T.y'V-y ,yy.y' ■■■'
T able 8 . A nalysts of V arian ce of Sheath S i at F o u r , Eight and Nine Mondisand Whole Plant S i at Nine Months
S o u rce of Variation df4 8 9 Plant S i
mean squ ares
Whole P lo ts :
Replications 2 583680 183258 612 124173pH 2 1725838 3056997* 2 7 12052** 4 2 0 3 3 1 2 **E r r o r (a ) 4 264370 388598 109706 88927
SubpJots:
S i 2 94573508’i‘* 7 46 2 2 4 3 8 ** 4 39 7 4 9 6 6 ** 2 6 5 3 1 6 7 0 **P 2 260388 1033624 191560 425623S i X P 4 1002340 1100113 166399 281279S i X pH 4 1560109 1844012* 1252947** 1 6 0 6 3 3 1 **P X pH 4 1356004 410350 838460* 5 0 3723*S i X P X pH 8 202205 887805 272449 193981E r r o r (b ) 48 815462 679974 306691 186713
■,y:
^Significant at the 5% level. ’(‘ Significant at the 1% level.
to

interactions in the sheath (nine-mondi sam ple) and the whole plant
samF^es a re illustrated in . F ig u res 6 . and 7 , resF>«otively. T h e se
cu rv es follow essentially the scune pattern, i . e . , increasing F^ant
S i with increasing residual S i and decreasing pH, witfi theJ ^
excsF>tion of sheath S I in the 833 kg S i level at pH 5 .8 (F ig u re
6 ) Duncan's mtdtiF^e range test indicated diet the sheath S i
means for pH 5 .5 and 5 .8 w ere not significantly different from
each o th er, but w ere significantly higher than the pH 6 .5 m ean.
Whole F^ant S i and sheath S i w ere found to be highly correlated
( r “ 0 .7 1 1 , 0 .7 5 5 , w d 0 .7 8 7 for four, eight and nine months,
resF>ectively). The sheath S i levels at nine months w ere all
below the tentatively established critical levels of 5000 ppm exceF>t
for the high S i treatment which w as in the deficiency questionable
ran g e. T h is does not agree with tiie other m easurem ents of S i
and reaso n s for the discreF>anoy are not apparent.
A s in the c a se of w ater extraotable soil S i , sheath and
whole plant S i in crease with increasing apF^ied S i and d ecrease
with increasing soil pH. F ig u re 8 illustrates the relationship
between w ater extraotable soil S i and sheath S i (nine months) in
which sheath S I is the deF>endent variable and soil S i tiie indepen->
dent variable ( r 0 .6 2 ) . T h ese data confirm the observations of•?
F o x at a l. (1 9 6 7 ) , Teranishi (1968) and many others who found
that plant S i in cre a se s directly witii soil S i .
43
44
..J# pH 5 . 8
pH 6 . 5
pH 5 . 5
' i k i - '
of Residual S i and Soil pH.r ^ 4 ^ S a m p le ). -
4000 r-
6 . 5
1000
0i:i®P S i (kg/ha)
Figu re Influence of Residual S i and Soil pH "onT^yniple’PlantTfSi .
■'A-'-A'-iN.VA.'. - Ws ■■ 7'*"A I ' t ? .‘V TA::;
a’ V'vS, J ' i B ' i ' ' ■,’ ■ v r i V " A:
. A , .vau

<y>

Silioon uptake followed essentially the sam e pattern as whole
plant S i (T ab le 9 , F igu re 9 ) . The effects of yield on S i uptake
a re quite small becau se S i applications had a relatively small
effect on yield, but a relatively large effect on p4ant S i concentra
tions. When the combined S i uptake of the plant and ratoon cro p s
a re considered (T ab le 9 ) the effects of applied S i w ere highly
significfltnt. F ig u re 9 illustrates the S i x pH interaction in S i up-
y--: take by the ratoon cro p . Silioon uptake at pH 5 .5 w as found to
be signifioandy higher than that at pH 5 .6 o r 6 .5 by Duncan's
multiple range test. It should be, noted that the average S i uptake
of the ratoon crop w as 4 8 .8 percent of the combined uptake of the
two cro p s which seem s to indicate that S i availability remained
constant during these two crop cy c le s . The relatively small yield
in crease from residual S i application in the ratoon crop w as
probably due to some other limiting factor, possibly N , K o r Mg.
47
;
Phosphorus
Soil Ph osp horu s. The in crease in modified Truog e x tra cts-
bie soil P with residual P apiidieation w as large and highly signifi
cant (T a b le 10 , F ig u re 1 0 ) . The effect of S i application on the
amount of extractable P w as relatively sm all, but analysis by
Duncan's multiple range test showed that significantly m ore P was
extracted from soil receiving high S i than from soil receiving no
S i . Teranishi (1 9 6 6 ) found a g rea ter effect of applied S i on soil
• ■ ■‘V... V.r V- • V , . .

i '■
48
Table 9 . A nalysis of V arian ce of S i Uptake by the R atoon,C rop and of die Combined S i Uptake
by the Plant and Ratoon C rops
-1 -
••••'I
■- -
S o u rce of Variation df S i Uptake Combined S i Uptime
mean squ ares
Whole P lo ts :
Replicationsr
2 32 260
pH 2 3 7 0 3 ** 4134*
E r r o r ( a ) 4 91 445
Subp4ots:
S i 2 3 0 563** 102981* *
P 2 363 2347*
S i X P 4 215 122
S i X pH 4 2 2 1 5 ** 2527*
P X pH 4 200 659
S i X P X pH 8 129 137
E r r o r (b ) 48 231 702' ^Sfgntfieant at the 5% lev el. **Stgnifioaet at the 1% level.
- a ■'
V ?' ; V :

49

50
T able 10 . A nalysts of V ariance of Modified T ru og-E xtraotab le So il P
AV ■
S o u rce of Variation df Mean S q u a res
Whole P lo ts :
Replioations 2 5594
pH 2 992
E r r o r (a ) 4 1205
Subplots:
S I 2 2832
P 2 246197**
S i X P 4 863
S i X pH 4 1057
P X pH 4 109
S i X P X pH 8 2021
E r r o r (b ) 48 la s oMftigidHeaet at the 1% level.
» < v

51
250 r -
I y. . •- • •
1120 P
833 ' ■' 'T- ,r»«B^LIED S i (kg/ha)
¥ - a S : ^ ^ - ■ ■ -.y ■ ■
F ig u re 10^'*; Influence of Residual S i and P ' on'Modified T ru o g -E x tr a c ta b le Soil P .
. . . .
' . - '':7V'C
■ i : ••,-
7 7 -
*7> .
P in tiie plant crop than w as found in tha ratoon cro p . This
a g rsa s with Australian data of Raupaoh and P ip er (1959) whoi %
found that the effect of silicate on phosphate solubility w as tempo
ra ry and lasted no longei*^ than one yeat^/
T eranishi (1 9 6 8 ) reported that at higher soil P levels
increasing pH d ecreased extractable soil P . H ow ever, in this
study, and in a study by Ibrahim (1 9 6 8 ) , there w as a trend for
extraotable P to in crease with increasing soil pH. This trend,
although non-significant, is at least reasonable in the light of the
effect of F e and Al solubilities on F fixation.
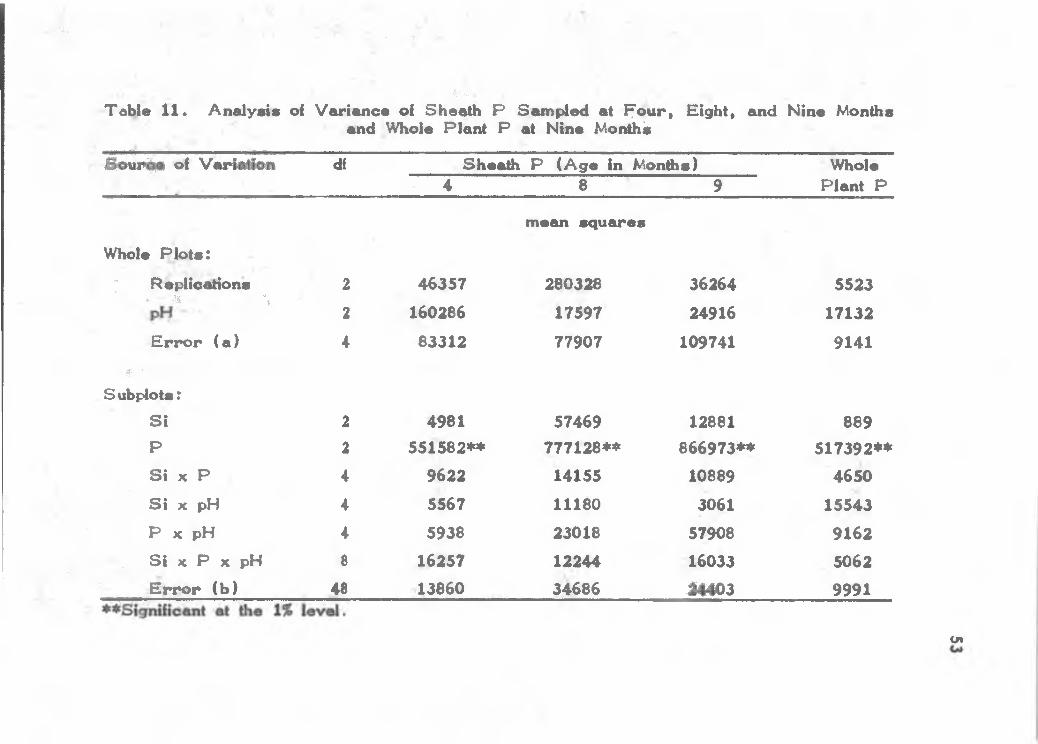
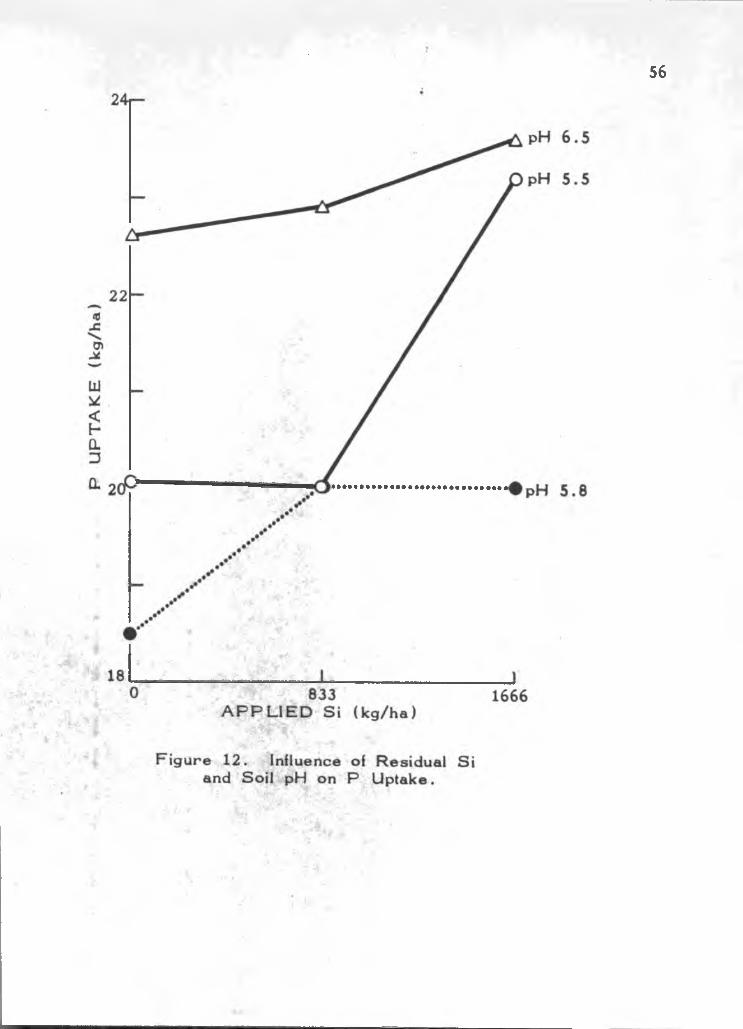
Plant P h osp horu s. Sheath P and whole p4ant P w ere sig
nificantly increased by residual P but w ere not affected by
, residual S I o r soil pH (T ab le 11 , F igu re 1 1 ) . The effects of
residual P and soil pH on P uptake w ere highly significant but
that of residued S i w as not significant (P * 7%) (T ab le 1 2 ) .\ ■A nalysis by Duncan's multiple range test indicated that P uptake
from the high S i plots was significantly higher than that in plots
not treated with S i . Sheath P levels of the low P treatm^ents
w ere slightly below critical levels (H um bert, 1 9 6 4 ). Apparently,
52
P w as not limiting plant growth since even when there was an
in crease in yield the concentration of P in the plant remained un
changed; conv ersely , when yield w as in creased o r d ecreased by
residual S i o r soil pH treatm ent, the changes w ere reflected in
P uptake (T ab le 12 , F igure 1 2 ) . T h ese resu lts a re apparent
■ '-A,- - 'r - ;
-V -.;
Table 1 1 . A nalysis of V ariance of Sheethand Whole Plant
P Sam pled at F o u r , Eight, and Nine Months P at Nine M oi^ ii
S o u r ip of V ariailM di Sheadi4
P (A ge in Monttis)8 9
Whole Plant P
mean sq u ares
Whole P lo ts :
7 Replications 2 46357 280328 36264 5523- ^ "t -
2 160286 17597 24916 17132
E r r o r (a ) 4 83312 77907 109741 9141
■ • ■ ■ Subplots:
S i 2 4981 57469 12881 889P 2 5 5 1 5 8 2 ** 7 7 7 1 2 8 ** 8 6 6 9 7 3 ** 5 1 7 3 9 2 **S i X P 4 9622 14155 10889 4650
S i X pH 4 5567 11180 3061* 15543P X pH 4 5938 23018 57908 9162S i X P X pH 8 16257 12244 16033 5062E r r o r (b ) 48 13860 34686 J I 4 0 3 9991
cn

54
^ I ' r 4 ■
600 ■ 7 - " | - 1 ? 1 - 1 as?.a^3' ■■;'7,' - '*.. A:7 ■;.' -166(
(kg/ha) :/>7'I , .
F ig u re 11 . ilillllN r!fj*i«if; Residual S i i and, P on S h e a t h - M o n t h S a m p l e ) .

p c ; . ; .55
Table 12 . A nalysis of Varianoe of P Uptake by the Ratoon Crop and of the Combined P Uptake
by die Plant and Ratoon C rops
■; .J '
\
l i t" • ,v . ^ . ■ ■?
S o u rce of Variation df P Uptake Combined P Uptake
mean squ ares
Whole P lo ts :
Replications 2 0 .1 6 7 2 2 .7
pH 2 0 .8 0 4 * * 3 0 5 .6 *
E r r o r (a ) 4 0 .0 4 0 3 8 .0
SubF^ots:
S i 2 0 .2 3 5 1 2 3 .0
“P 2 5 .4 9 0 * * 1 5 1 0 .1 * *
S i X P 4 0 .0 3 7 6 . 2
S i X pH 4 0 .0 6 8 8 .7
. P X pH 4 0 .0 6 9 2 3 .8
S i X P X pH■f8 0 .1 5 1 3 8 .7
\ E r r o r (b ) 48 0 .0 7 7 1 9 .4at die S% level, at the 1# level.
; - - / V ,
56

■
when yield is plotted in the sam e manner as P ui^ake. .When
F ig u res 12 and 13 a re compared it is obvious that P.. uptake is
largely influenced by yield, how ever plant, P concenti^ations caused
additional modification of the trends. The cu rv es in F ig u re 12
support the findings of Teranishi (1 9 6 8 ) that S i application
in creased P uptake. The apparent irregularity of pH 5 .8 is
probably the result of deficiencies of other nutrients which limited
yield.
IThe effect of residual S i on the internal P requirement of
sugarcane is illustrated in F ig u re 14 which indicates that a partic
ular ooncentration of sheath P is associated with higher yields
with S i than without. When P uptake data by the plant and ratoon
cro p s a re combined to obtain total P uptcdce it w as found that S i ,
P and pH treatments significantly affected P uptake.
So il pH . H ie effects.o f S i auid soil pH treatments on actual
soil pH w ere found to be highly significant and positive, while in-
oreaslng P also tended to in crease soil pM. O bserved soil pH
values w ere generally low er than originally planned; how ever,
they w ere approximately as expected in light of the data obtained
from the (4ant c ro p . The average values for the three soil pH
treatm ents w ere 5 .5 , 5 .8 and 6 .5 . T h e variation in pH values
observed may have been due to differences in mixing after appli-
oation of soil amendments o r to field variation which w as not
accounted for in the original lime applications which w ere based
57

58
* ■
fA .V-: *■■■ A
140 r -
130 -
10X
QJUJ
A P P L I E D S i (kg/ha)
pH 5 .5
pH 6 .5
pH 5 .8
1666
F ig u re 13.- Influence of Residual S i and Soil pH on Yield of S u g a r c a n e (Ratoon Crop)
Harvested at Nine Months.
A AJ? : A,- A ■A
'iA--A'-
•'I

59
100
10X
Q • J UJ>
95
85
600
1666 kg S i
" > a 8 3 3 kg S ihy}sp-f
a-» .
■' tr-,M
/ i j ' ^ .
1 -L f 1 - J800 * ,1000
S H E A T H P ( P P M ) , ^
■ ’ ■* '^% " '\F ig u r e 14 . T h e Relationship ^Between Sheath P
and Yield of S u g a r c a n e Harvested at Nine” Monthsa s Influenced by Applied SiT
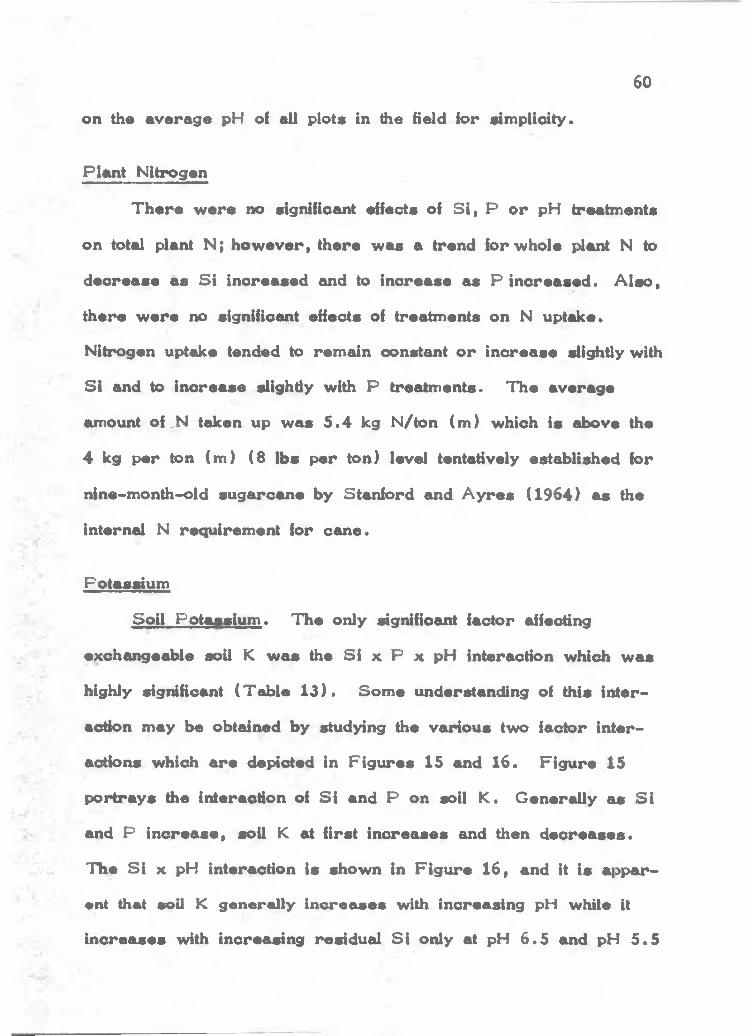
#v'
on the average pH of all plots in tfie field for simplicity.
Plant Nitrogen
T h e re w ere no significant effects of S i , P o r pH treatments
on total plant N; how ever, there was a trend for whole p imt N to
d ecrease a s S i in creased and to in crease a s P in creased . A lso ,u*
there w ere no significant effects of treatments on N uptake.
Nitrogen uptake tended to rem ain oonstant o r in crease slightly with
S I and to in crease slightly with P treatm ents. The average
amount of «N taken up was 5 .4 kg N/ton (m ) which is above the
4 kg per ton (m ) (8 lbs per ton) level tentatively established for
nine-month-old sugaroane by Stanford emd A y res (1 964 ) a s the
internal N requirem ent for can e .
60
Potassium
Soil Potassium . The only sigidfioant factor affecting
exchangeable soil K w as the S i x P x pH interaction which w as
highly significant ( Table 1 3 ) . Som e understanding of this inter
action may be obtained by studying the various two factor inter
actions which a re depicted in F ig u res 15 cmd 16 . F ig u re 15
portrays flie interaction of S i and P on soil K . G enerally as S i
and P in cre a se , soil K at first in crea ses and then d e c re a se s .f- .7 ;. The S i X pH interaction is shown in F ig u re 1 6 , and it is iM>par-
•nt that soil K generally in cre a se s with increasing pH while it
in cre a se s with increasing residual S i only at pH 6 .5 and pH 5 .5
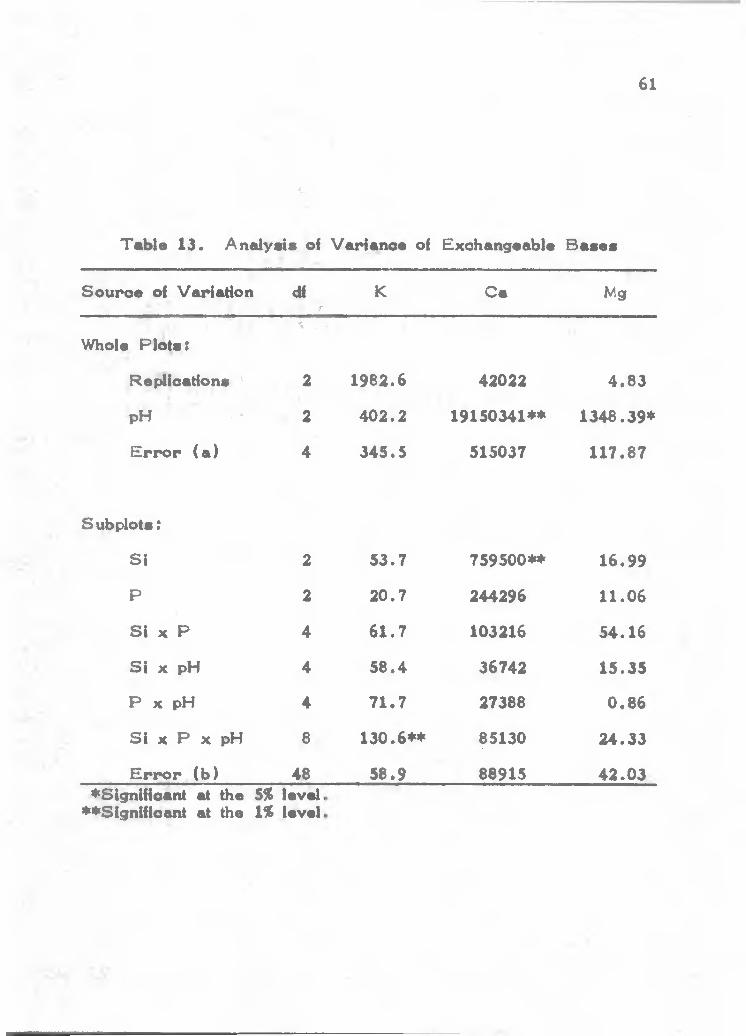
61
■i..
T able 13 . A nalysis of V arian ce of Exchangeable B a s e s
S o u rce of Variation df■ ■ ■ J"
K Ca Mg
Whole P lots t■ % . -
R erJications ' 2 1982 .6 42022 4 .8 3
pH - 2 4 0 2 .2 19150341** 1 3 4 8 .3 9 *
E r r o r (a ) 4 3 4 5 .5 515037 1 1 7 .8 7
Subplots!
S i 2 5 3 .7 7 59500** 1 6 .9 9
P 2 2 0 .7 244296 1 1 .0 6
S i X P 4 6 1 .7 103216 5 4 .1 6
S I X pH 4 5 8 .4 36742 1 5 .3 5
P X pH 4 7 1 .7 27388 0 . 8 6
S I X P X pH 6 1 3 0 .6 * * 85130 2 4 .3 3
E r r o r (b ) 48 5 8 .9 88915 4 2 .0 3^Significant at the 5% level.
^^Significant at the 1% level.

62

63
F ig u re 16. Influence of Residual S i andv Soil pH on Exchangeable Soil K . 5,- s"?' :■
v'- ■■'7.' *'-' 7'
-:g

(833 kg S i o n ly ). The cause of this interaction is not completely
c le a r ; how ever, three important mechanisms appear possible:
( 1 ) K uptake by the previous crop as well a s the present crop
(assum ing that highest K uptake occu rred at the highest S i , P
and pH le v e ls ) , (2 ) the complimentary ion prinoiple w hereby C a ,
which is supplied in the S i , P and pH treatm ents, is m ore easily
displaced by K than is A l, and (3 ) an in crease in net negative
charge with increasing pH.
i Plant Potassium . Sheath K at nine months w as d ecreased
, _ significantly by increasing residual P levels (T ab le 1 4 ) . A teat
of the m eans with Duncan's m.ultipJe range test showed that sig
nificantly low er sheath K values occu rred in the high P treatment
than in the low P treatment at all three sampling a g e s . In the
nine-month sam ples significantly le ss sheath K w as found in plots
limed to pH 5 .5 than in plots limed to pH 6 .5 . S im ilarly , K
uptime w as found to be.significantly low er in the 1120 kg P level.
T h e sheath K data portrayed In F ig u re 17 offer strong
evidence that a K differential w as established by the plant cro p .
vThose plots which received high S i and/or P applications in the
plant crop must have removed m ore K from the soil so that le ss
K w as carried ov er for the ratoon cro p . S in ce treatm ents did
not have significant effects on yield of the ratoon cro p , these
differences may not be explained by a dilution effect.
64
: r'

■■I-
. .... ,. .. .., .,. , s-r ..> , . „ . . -. . . . . , .,-
" '■ ■ ■ ' >' :'■ ' ' . ' . .i ■■ ' ■* “ . ■Table 1 4 . A nalysis of V arian ce Sum m ary for Plant Concentrations
and Plant Uptake of K , C a and Mg
Plant Concentration S o u rc e of Variation tand Uptake of K , Ca and Mg S i P pH S i x P S i x pH P x pH S i x P x pH
KSh eath , 4 m o. + + :t
i-y. • f'\;: ■ Sh eath , 8 mo. +■ Sheath,. 9 m o. * + + . I..
Whole Plant + *■ Uptake of + + 'I i ■
. - -a"'-
CaSh eath , 4 m o. ♦ * +Sh eath , 8 mo. ♦ + ♦Sh eath , 9 m o. *Whole PlantUptake of ♦ +
"MgSh ead i, 4 m o.Sh eath , 8 mo.Sh eath , 9 mo.Whole Plant
V- ^'-IfaMEe of.________________________________________________ + ___________t r S lilftta a P t at die 29% level.* - SfflidBooat at the ^ level.
* * Significant at the 1% level.o>cn

66
1 .6 , - 112 P
1 . 5 -
1 h<UJIw
*44- ■
^ “I.*. ’
• -M:'^ v'k

T h e sheath K levels in F ig u re 17 a re generally low and are
below the 2 .2 5 percent K level, oven dry b a s is , which Humbert
(1964 ) reported to be critical for su garcan e. T h e average sheath
K values for four, eight and nine months w ere 2 .2 6 , 1 .6 2 and
1 .4 1 percent K , resp ectively , which indicate that the experiment
suffered from K defloienoy in the eight- and nine-month period
and possibly e a r lie r . T h e application of K (224 kg/hectare)
which w as made before the (dant crop gave high sheath K values
in the four months sam ples of the plant c ro p . S in ce this applica
tion is adequate for a t ^ - y e a r sugarcane crop in some a r e a s , it
w as assumed to be adequate for two itine-month sugarcane c ro p s .
H ow ever, high rainfall at the test site a s well a s high K uptctice oft.
the plant crop apparently depleted the supply of soil K to critical
levels in tiie ratoon c ro p . A lso , in a tw o-year crop K would
have been recycled but in this cropping system it w as rem oved.
F ig u re 16 depicts the S i x pH interaction which had a sig
nificant effect on whole plant K . This interaction may be
explained by the fact tiiat K w as retained by. the soil against
leaching in treatm ents having higher soil C a lev els , i . e . , high pH
and S i treatm ents, since C a rath er than Al w as the complimen-
tax*y ion, and also in treatm ents witii higher pH which produced a
net in crease in tiie negative ch arg e . Sim ultaneously, K w as
being removed differentially by high and low yielding treatments in
the plcmt cro p , such as.* high pH, S I and P treatm ents; and
67

68
0 . 7 r -
ha),,.
'• fy:--'"
■ -^r-' -,.V
i and Soil pH
2^;
5^/ • -5 ■'yiM
; '■ '•‘V
•* < - " •.
. ;. ; v,-r> ' Uji
^i,' V:4Ap:'::v. V;v .

t.-
low pH, S i and P traatm ants, respaotlvely (F ig u re 1 9 Varying
inten;dtie8 of these d iree fo rces may be used to explain the
general trends shown in F ig u re 16 . At^pH ^ 5 .8 , K retention w as•’i '
relatively low becau se of low er soil C a while K uptake was
relatively high becau se of. higher yields in the F^ant cro p ; there
fo re , total K available to the ratoon crop w as relatively low . At
pH 5 .5 , how ever, K retention w as low , but K uptake by die
plant crop w as low er than that at pH 5 .8 due to low plant crop
yields; th erefore , K available to the ratoon crop would be higher
than at pH 5 .8 . A t pH 6 .5 K retention and K uptake w ere
higher than at pH 5 .8 due to the high levels of C a and to die high
|4ant crop yields in this treatm ent, resp ectively . S in ce whole
plant K in the ratoon crop, (F ig u re 18) is much higher at pH 6 .5
than at pH 5 .8 o r 5 .5 , the logical conclusion is that the effect ofi.
soil K retention w as g rea ter than the effect of depledon by thefe "
previous cro p . The total K uptake cu rv es in F ig u re 20 show the
effects of these two opposing fo rces quite clearly and confirm the
"explanation offered above.
Calcium
So il Calcium . Silicon and soil pH treatm ents resulted in
itignifioant in cre a se s in soil C a (T ab le 1 3 , F ig u re 2 1 ) . A nalysis
of the soil C a data by Duncan's multiple range test indicated that
exchangeable C a in creased significantly a s residual S i , P and
69
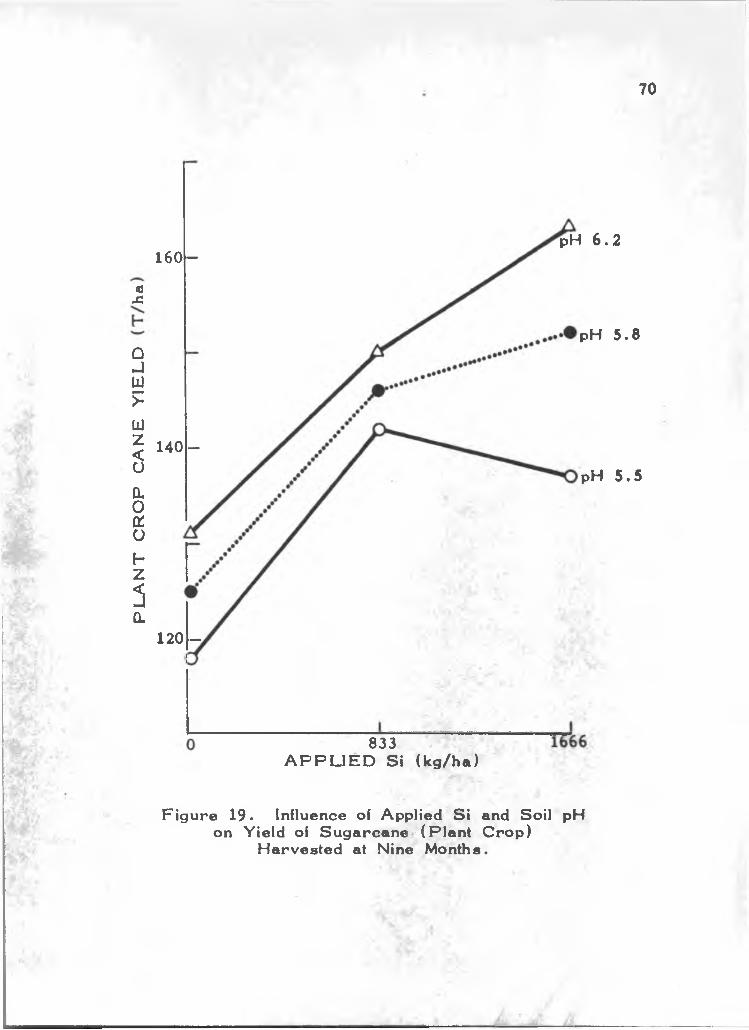
70
1 6 0 -
«X
QJUJ?UJzgQ.Oa:ohzgQ.
1 4 0 -
pH 6 .2
120 -
pH 5 .8
pH 5 .5
833 .A P P L I E D S i (kg/ha)
F ig u re 19 . Influence of Applied S i and Soil pH on Yield of Sugarcane^ ( Plant Crop)
Harvested at Nine Months.

71

72
A P P L IE D SI (kg/ha)
F ig u re 2 1 . Influence of Residual S i and Soi l pH on Exchangeable Soil C a .

•oil pH increased to the highest lev els .V ■ . • j
It is interesting to note dist the differences in soil Ca due to
7 ) ‘ P application w ere still discernible after 16 months of intensive' - Sx
cropping and moderately heavy-rainfall (dcda not show n). ( S e e
"Appendix B , Table 3 6 .)
' P lant Calcium . Sheath C a , at four and eight months, w as
significantly ^affected by residual P application; at eight and nine
months sheath Ca w as significantly affected by the S i x P in ter-
1 7 action and soil pH treatm ent, respectively (T ab le 1 4 ) . Sheath C a ,■•J '- is
7 ' which is represented by the four-month samples in F ig u re 22 ,
w as in every c a se higher than the critical levels described in the
7 : ; literature and often tw o -'to four-fold h igher. Thus Ca should not
^7 : / ’ ^have limited growth in any w ay. Whole plant Ca w as not affected'Ac - ‘ 7
7 by any treatm ents, but Ca.uptodce w as significantiy increased by
residual S i and by residual P . The S i x P interaction w as also
significant; Calcium uptake increased with residual S i and P andkwas apparently a direot function of yield.
7 ■ 73
■■ ■- :■.I'. %. 77 ' . s'- .
^7 - k
7
Magnesium
v;
Soil Mg w as significantly increased by pH treatmients (T ab le
13 , F igu re 23) and analysis by EXincan's multiple range test indi-?■ i'. ‘ '
"cated that soil M g.at pH 6 .5 w as significantly higher than soil MgiS.
at.pH 5 .5 o r 5 .8 . T h is in crease with increasing pH was
expected since soil Mg availability in crea ses with pH (Buckm an

O.SOr-
toO
0 . 4 5
X h <Ui
TjA,
10
At/:' 7,0 . 4 0.V -
' '77
pH 6 .5
■ r ': '5'. :"-• -'BTaAB74-A./:, 1 J1120
A P P L I E D P (kg/ha)
■■■ ■ A'A'"' '" ' "■ 'r-B'tS'A-'*. .•■ ■F igure 22 . ’“Jnfluence of Residual P and Soil pH
on Sheath Ca (Nine-Month S a m p le ) .-'-t - A ,S
A. - ' : ' Bv#■■/••■A'/■
A-7'■< - ■* .. 'f
,,i. V .A •'■ /■
74

75
3 8 r -

and B ra d y , 1965 . A lso , Mg w as added in the S i apii^ications
and the pH treatm ents. The average exchangeable Mg value w as
27 ppm , and since sugarcane usually responds to Mg application*
when exchangeable.Mg falls below 30 ppm> (H um bert, 1 9 6 4 ), Mg
may have limited growth in some pJots. Sheath Mg w as not sig
nificantly affected by treatment (T ab le 1 4 ) ; how ever, sheath Mg
of the nine-month sampde (F ig u re 24) tended to d ecrease strongly
with increasing S i . Apparently Mg w as generally affected by
complimentary ion, pH dependent ch a rg e , and uptake effects as
w as K , but, in the c a se of Mg, the effect of uptake by the previ
ous crop w as g rea ter than that of the complimentary ion.
Plant Manganese
Sheath Mn w as affected by re«du al S i treatmsent at the 1
percent level in all three sampling ages (T ab le 1 5 ) . At the four
and eight months sam ples the S i x pH interaction w as also signifi
cant. The only significant factor in the analysis of variance of
whole plant Mn w as the S i x pH interaction. Applied S i had no
effect on sheath Mn in the plant crop and no explanation for this is
apparent. The S i x pH interaction of the nine-month sample in
F igu re 25 rep resen ts the general patterns followed at all three
sam (4ing a g e s . Sheath Mn levels at pH 6 .5 a re low er than at
either pH 5 .8 o r 5 .5 and they a re also lowest at the high S i
level. A t each sampling ag e , the highest sheath level is at pH
76

77
A P P L I E D S i (kg/ha)
Figure 24 . Influence of Residual S i and Soil pH on Sheath Mg (Nine-Month Sam p le).
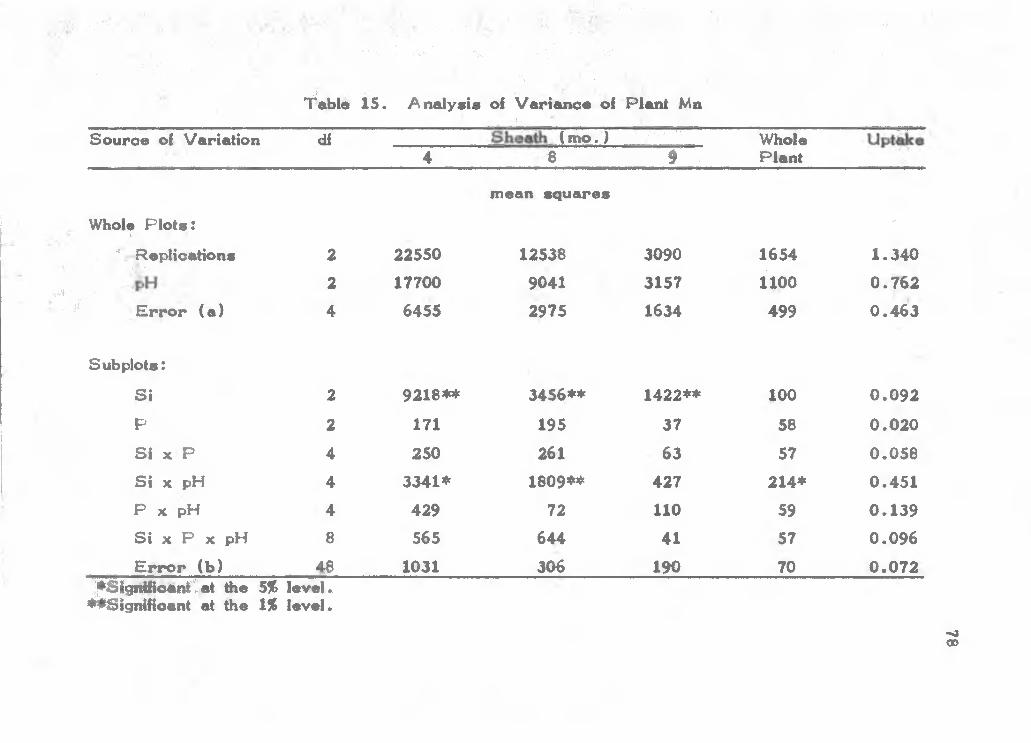
■.■A ■
? ..-' if'
.4'"-
■. -v'- ■ .
■■■ , " ■*". ,,4.;■' -4;,, •■>. 'V A. ■ ■ . 7;.,: ■ - :,,V, :.v;'
''Z -i
' ' ' • : ■ ■ V ..7. ■
fa b le 1 5 . A nalysis of V arian ce of Plant Mni'.;
So u rce of Variation df (m o .) •' ' .-,y ' ' '■ Whole4 8 9' . Plant
mean sq u ares
Whole P lo ts :*-
Replicationsi • ' 2 22550 12538 3090 1654 1 .3 4 0
2 17700 9041 3157 1100 0 .7 6 2
E r r o r (a ) 4 6455 2975 1634 499 0 .4 6 3
Subplots:
S i 2 9 2 1 8 ** 3 4 5 6 ** 1 4 2 2 ** 100 0 .0 9 2
P 2 171 195 37 58 0 .0 2 0
S I X P 4 250 261 63 57 0 .0 5 8
S i X pH 4 33 4 1 * 1 809** 427 2 1 4 * 0 .4 5 1
P X pH 4 429 72 110 59 0 .1 3 9S i X P X pH 8 565 644 41 57 0 .0 9 6
E r r o r (b ) 48 1031 306 190 70 0 .0 7 2l^iSPiEWoaiiitat tite 5% leval.
^ii^ignifioant at the 1% level.-405
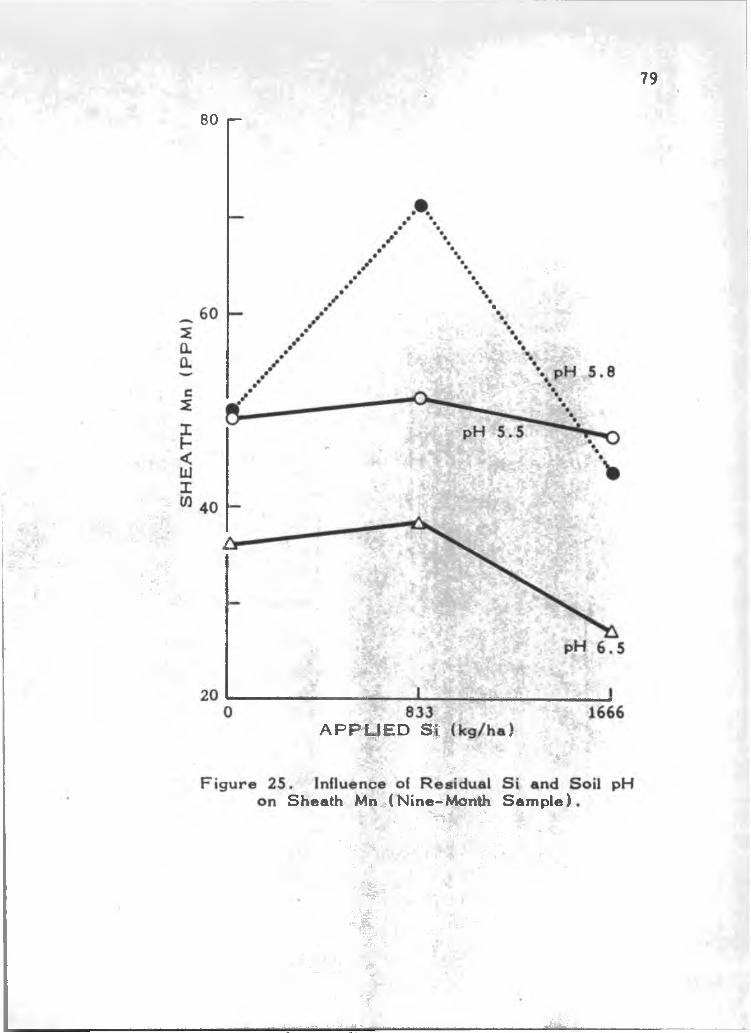
79
80 r -
•yi*'
y , V ytr;. .
,7'*'
■ y--
• - ' --.-S' '
A P P -iy E D S i
-. « vy,*f:
'%
Sheath Mn«( Nine-Month Sam ple). ■ 7i„ yj:,. .
. ' 7 V'7..y,.. V; ;'■'‘ ■■;: "’i .
■. ■ iSS;^ i:
. ■ ' ■ , ' 7 ' 7 7 -'
- :■ *» ,
- * f
% ,,",yfcy' - ■
. , y -■ - ■ >
r - • • ^
• ■ 7 '■■-yiii.vniaii.ii7iiiji,i' .JM .
n.:
5 .8 with 833 kg S i ; the reason for this is not apparent. A nalysis
by Duncan's multiple range test indicates that while the differences
due to residual S i a re highly significant, the differences due to pH
a re non-significant.
Aluminum
Highly significant d ecrea ses in KCl extractable soil Al w ere. V. '■ " ■ '
found with increasing residual S i and soil pH. A lso , significant
S i X pH and S i x P x pH interactions w ere found (T a b le 1 6 ) .
A nalysis by Duncan's multiple range test indicated that the no S i
treatment was significantly different from the medium and high S i
treatm ents (F ig u re 2 6 ) . T eranishi (1968) found these same
trends but diey w ere not significant for the plant c ro p . It is wellr. ,
known that extraotable Al d e crea ses with increasing pH (Magistad,
1 9 2 5 ). The trend of decreasing Al with increasing residual S i
must be a function of the amounts of Ai precipitated from< soil
tK>lutk>n as aluminum silicate and aluminum hydi?oxide with the
resulting d ecrease in activity of the Al ion. This in turn readily
explains the S i x pH interaction observed , i . e . , when there is no
soluble A l, S i has no effect.f
, Sheath A 1 at,fou r months w as significantly affected (1% level)
by residual S I treatmients, and a significant (5% level) S i x P
interaction w as also observ ed . Residual P had a significant effect
at the nine-month sampling (T ab le 1 7 ) . A nalysis by Duncan's
80
■ • v ', ■
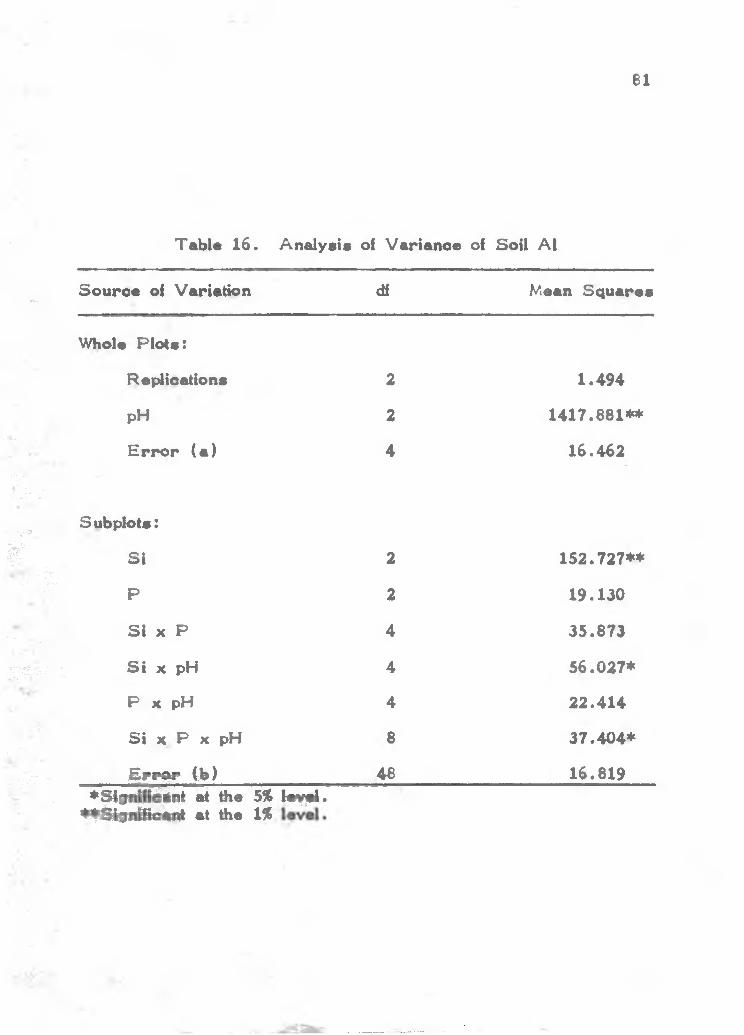
81
' Table 1 6 . A nalysis of V arian ce of Soil Al
'm.-S o u rce of Variation df Mean S q u a res
Whole P lo ts :
Replications 2 1 .4 9 4
pH 2 1 4 1 7 .8 8 1 **■ -'-' . '
.■7 B - ’
• ■'• ■'-
E r r o r (a ) 4 1 6 .4 6 2
T - : ; ■ -• ■- -1-. V.
- v ->Subplots:
t ■ ., 7 ■ ■■
S i 2 1 5 2 .7 2 7 **- ' -J -I •
-•• • P 2 1 9 .1 3 0
■ * ^ S i X P 4 3 5 .8 7 3
7?7;::r'7 S i X pH 4 5 6 .0 2 7 *
P X pH 4 2 2 .4 1 4
_• - ■ •S i X P X pH 8 3 7 .4 0 4 *
••■ . .;•'■■ r-' E rrM * Cb) 46 1 6 .819/ ■ ■
; ♦ S ig i j i i in t at the 5% 1 ^ . 4<FEttgeiBB*Ha|t at the 1%
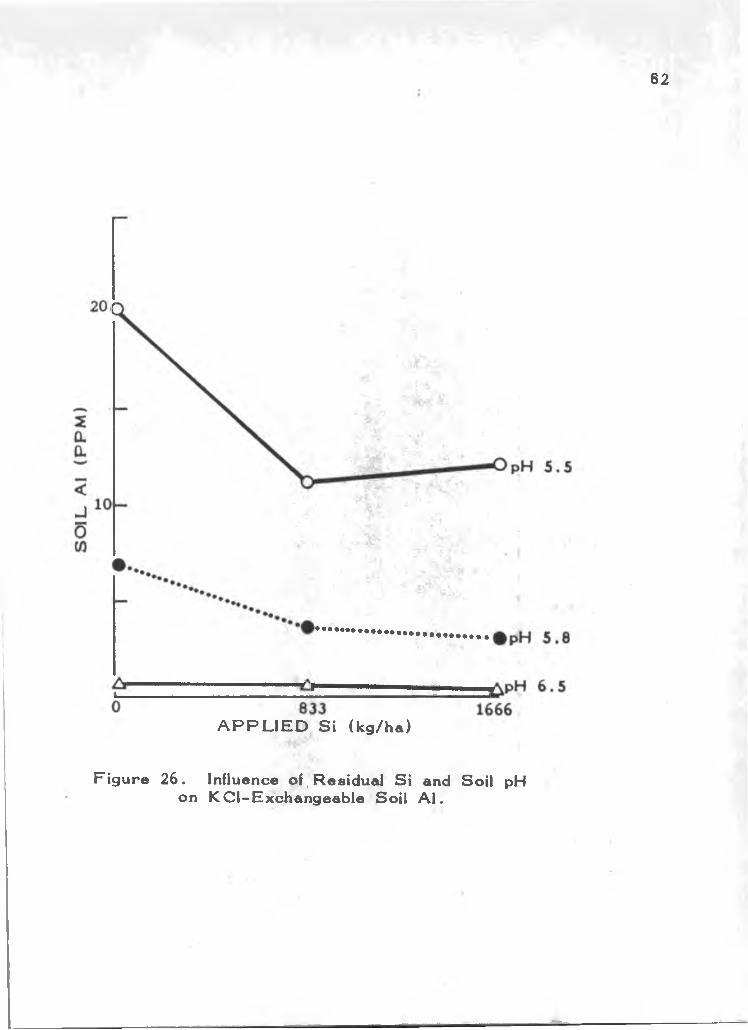
82
A P P L I E D S i (kg/ha)
Figure 26 . Influence of . Residual S i and Soil pH on KCI-Exchangeable Soil A l .

J!--.'
83
T ab le 1 7 . A nalysts oi V arianoe of Plant Al
S o u rce of VariatkMi Shead) (mo .) Whole Uptake4 8 9 Plant
mean squ ares
Whole P lo ts !
Replications 2 372 1938 330 990 0 .7 6 3
pH 2 8 72 1 512 1 .1 5 9
E r r o r (a ) 4 327 1007 66 1229 1 .0 9 8
Su bp lots:
S i. 2 66 7 ** 1234 1 1001 1 .9 9 4
2 96 638 7 2 * 1667 0 .6 5 8
■ S i X P
S i X pH
4 3 5 4 * 723 16 1824 1 .6 5 6
4 35 669 33 669 0 .5 6 8
: P X pH 4 221 671 16 372 0 .7 6 8
S i X P X pH 8 - 112 837 15 1274 0 .9 1 3
. V JE w W (b ) 46 114 673 19 1284 1 .0 0 8at the S$i level,
e ^ at *die 15 lev el.
■ ! -■
■ ;v ;- ' N
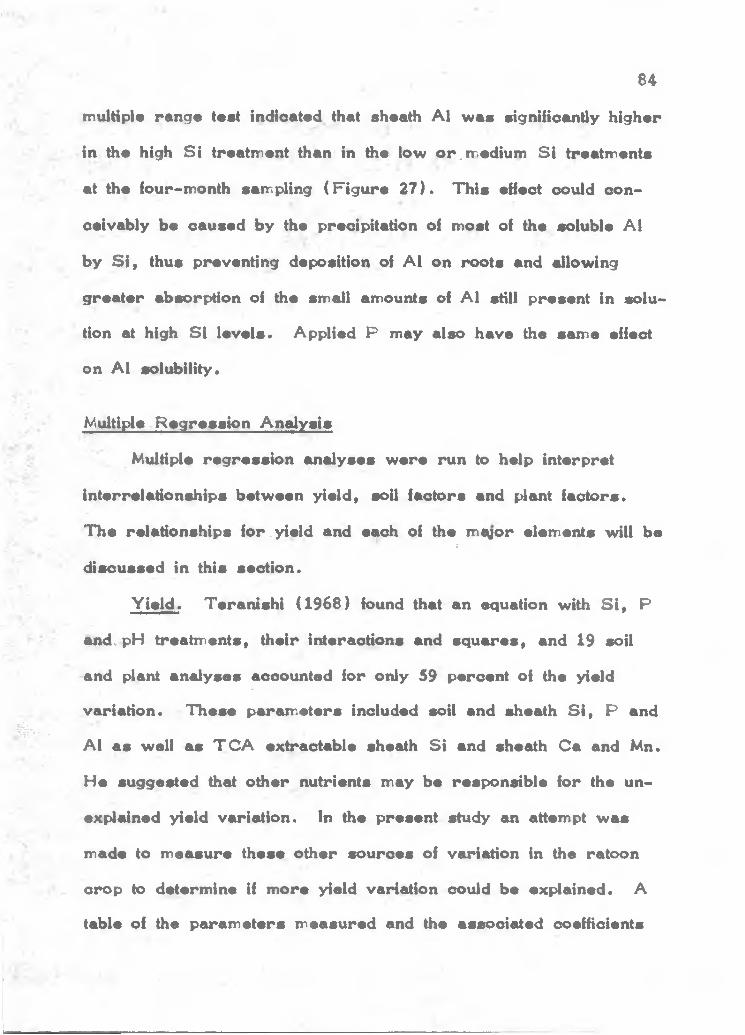
■tnulHple range test indicated that sheadi Al w as significantly higher
in the high S i treatment than in file low or,m.edium S i treatm ents
at the four-month sampling (F ig u re 2 7 ) . Th is effect could con-
ceivably be caused by the precipitation of most of the soluble Al
by S i , thus preventing deposition of Al on roots and allowing
grea ter absorption of the small amounts of Al still present in solu-
tion at high S I lev e ls . Applied P may also have the sam e effect
on Al solubility.
84
Multiple R eg ression A nalysis
Multiple reg ressio n analyses w ere run to help interpret
interrelationships between yield, soil factors and plant facto rs.
T h e relationships for . yield and each of the mayor elements will bes
discussed in this section.
Y ield . T eranishi (1 9 6 8 ) found that an equation with S i , P
and, pH treatm ents, their irfieraotions and sq u a res , and 19 soil
and plant analyses accounted for only 59 percent of the yieldi
variation. T h ese param.eters included soil and sheath S i , P andf e ; ; ’ '
Al a s well a s T C A extraotable sheath S i and sheath C a and Mn.r’'
He suggested that other nutrients may be responsible for the un-
explained yield variation. In the present study an attempt w as
made to m easure these other so u rces of variation in the ratoon
> crop to determine if m ore yield variation could be explained. A
table of the param eters m easured and the associated coefficients
' s.
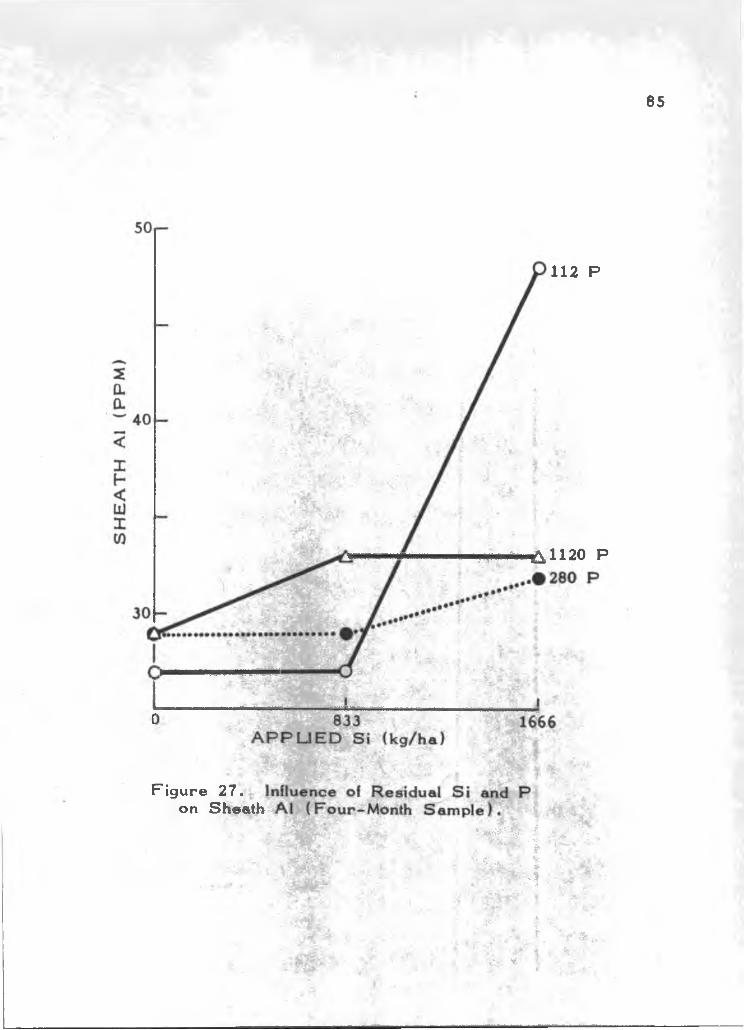
7 .7
V 7y >
'f-K '.'vc^-. * I I ' \c^ . . . . . .
^ '*■- ' <1-. . -. ? -■A'‘7 7 ' . - ’ • ■ \-, -..r--.'i ‘ ■'■■■'■ z44'l^^^"::r- -... '- r .'
85
112 P
■pMinii^ 1120 P
Figure 27. on Sheath
' 4S-7 7 f. -»?.. • t
‘ y >r < . I-!
'V;: ■ '. , '.'. ■\
V i,• ^ *
f ^-h-

of deternJnatton (R ^ x 100) for the yield equation calculated by a
etep-w iee reg ressio n analysis is presented in Appendix B , Table
4 3 * T h e 46 variables accounted for 73 percent of the yield v ari
ation. When all 55 variables w ere included 77 percent of the
variation w as explained. Other so u rces of variation which w ere
iwt m easured a re field variation, differential ratooning, rat
damage, soil and plant nutrients not m easured, and measurenr^ent
of yield. The coefficients of variation for soil and plant analyses
presented in Appendix B , Titiile 45 indicate the relative amounts
of variation in these m easurem ents. The highest values w ere■i..
found for plant and soil Al (47% and 64%, respectively) cmd the
lowest values w ere found for sheath moisture (1% ).
T h e large number of variables required to explain tiie v a r i-
^ation in yield for the ratoon crop is reflected in the fact tiiat no
single param eter accounted for m ore than seven peroeiti of the
total variation. Most of tiie variation in the plant crop was
acoounted for by the treatm ents while in tiie ratoon cro p , treat
ments accounted for a relatively small part of the variation. T h is
difference may be due to removal of applied nutrients by leaching,■f! '
uptake by the r4ant crop o r by fixation. Whole (4ant S i , C a , Mg
and Al and TC A S i w ere the most important plant variables
affecting yield in the ratoon crop and w ere second only to the
effect of applied S i . Of the soil fa cto rs , soil C a amd soil S i
w ere the only variables that ex^ained m ore than one percent of
86

87
the yield variation. T h is is further illustrated by die data in
Table 18 which show s the effect on ratoon crop yield of soil and
applied factors and plant crop yield. T h ese param eters account•i.
for only 13 percent of die total variation in yield which indicatesr. - . • V
the relatively small influence of soil and applied factors on yield of
the ratoon cro p .
. A prediction equation which included all variables explaining
one percent o r m ore of the yield variation w as derived. The
twenty v ariab les, listed in Table 19 , explained 63 percent of the
yield variation in the ratoon crop as compared to eleven variables
which explained 44 percent of the yield variation in the plant cro p .
' 7-pactors included in the equation for the ratoon c ro p , but not for
the pJant cro p , a re green sheath weight, sheath m oisture, plant
N and Mg, and (Jant and soil K .
A yield prediction equation based on sheath values of the‘ : A - . ■-
four-month sam ples indicated that Mg, Mn and S i concentrations
< w ere important. A sim ilar equation based on sheath values for
the eight-month sam ples indicated tiiat green sheath weight. S i ,
Mg, K and sheath moisture w ere important. T h ese equations,
/ how ever, accounted for only 18 and 12 percent of the yield v a ria -
' tion, resp ectively . Sheath S i and Mg w ere apparently the most*
important param eters as they w ere included in both equations.
S ilico n . V ariab les which affected w ater-extractable soil S ie i-
levels w ere identified by use of reg ressio n analysis ( Equation 1 ) .
' ' V '-.r:- .'r .
*
• ; • V-CA . 'J-.. .

86
T able 18 . Correlation Coefficients Obtained from a Step-W ise R eg ression A nalysis of Applied S i , P and pH,
T h e ir S q u a re s and Interactions, Soil F a c to rs and P rev iou s Yield on Cane Yield at Nine Months as Indicated by R and R^ V alues and Sim ple Correlation Coefficients
Betw een T h ese F a c to rs and Yield
A 74 "''
VaH able r1 T “......r T ....... Sim ple Correlation
Coefficients ( r )
Applied S i 0 .2 4 6 0 .0 6 1 .2 4 6 *
P rev iou s Yield 0 .2 6 4 0 .0 7 0 .156
So il P 0 .2 6 9 0 .0 8 4 .100
Soil S i (modified T ru og) 0 .3 0 0 0 .0 9 0 .2 4 1 *
Soil S i (w ater extraotable) 0 .3 0 7 0 .0 9 4 .171
p h 2 0 .3 1 6 0 .1 0 0 .067
Soil C a 0 .3 4 5 0 .1 1 9 .116
Si^ 0 .3 5 9 0 .1 2 9 - .1 0 6Y T h e R value applies to the relationship between the variable .. opposite it a s well a s all those above it and yield in a multiple
reg ressio n an alysis.^Significant at tiie 5% lev el.
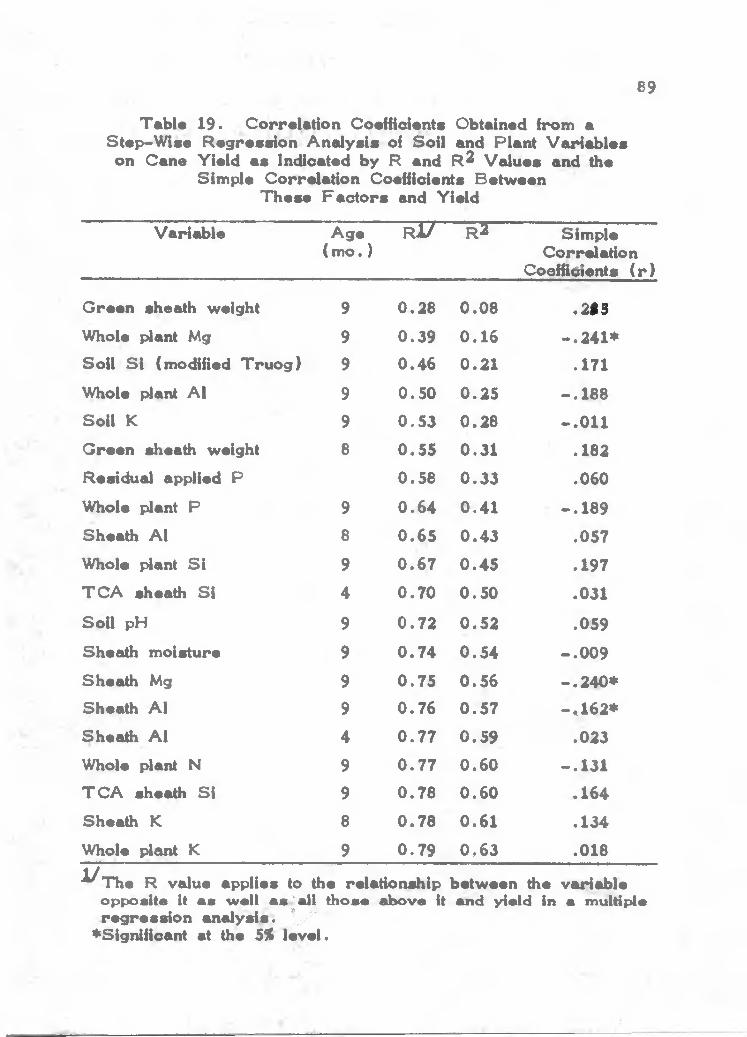
89
Table 19 . C orrelation CoeHioieitia Obtained from a Step-W ise R eg ression A nalysis of So il and Plant V ariab les
on Cane Yield a s Indicated by R and R^ V alues and the Sim ple Correlation Coefficients Betw een
T h ese F a c to rs and Yield
VaH able Age ( m o .)
r IT — ^ Sim ple Correlation
Coofficfents ( r )
G reen sheath weight 9 0 .2 8 0 .0 8
Whole plant Mg 9 0 .3 9 0 .1 6
So il S i (modified T ru o g ) 9 0 .4 6 0 .2 1
Whole plant Al 9 0 .5 0 0 .2 5
Soil K 9 0 .5 3 0 .2 8
G reen sheath weight 8 0 .5 5 0 .3 1
Residual applied P 0 .5 6 0 .3 3
Whole plant P 9 0 .6 4 0 .4 1
Sheath Al 8 0 .6 5 0 .4 3
Whole plant S i 9 0 .6 7 0 .4 5
T C A sheath S i 4 0 .7 0 0 .5 0
So il pH 9 0 .7 2 0 .5 2
Sheath moisture 9 0 .7 4 0 .5 4
Sheath Mg 9 0 .7 5 0 .5 6
Sheath Al 9 0 .7 6 0 .5 7
Sheath Al 4 0 .7 7 0 .5 9
Whole plant N 9 0 .7 7 0 .6 0
T C A sheath S I 9 0 .7 8 0 .6 0
Sheath K 8 0 .7 8 0 .6 1
Whole plant K 9 0 .7 9 0 ,6 3
.2 8 3
- .2 4 1 *.171
- .1 8 8
-.011.1 8 2
.060
- .1 8 9
.057
.197
.031
.059
- .0 0 9
- .2 4 0 *
- ,1 6 2 *
.023
- .1 3 1
.1 6 4
.1 3 4
.0181/ The R value applies to the relationship
opposite it a s well a s 'a ll those above it reg ressio n analysis. IC'
*Significant at the 5% level.
between the and yield in
variable a multiple
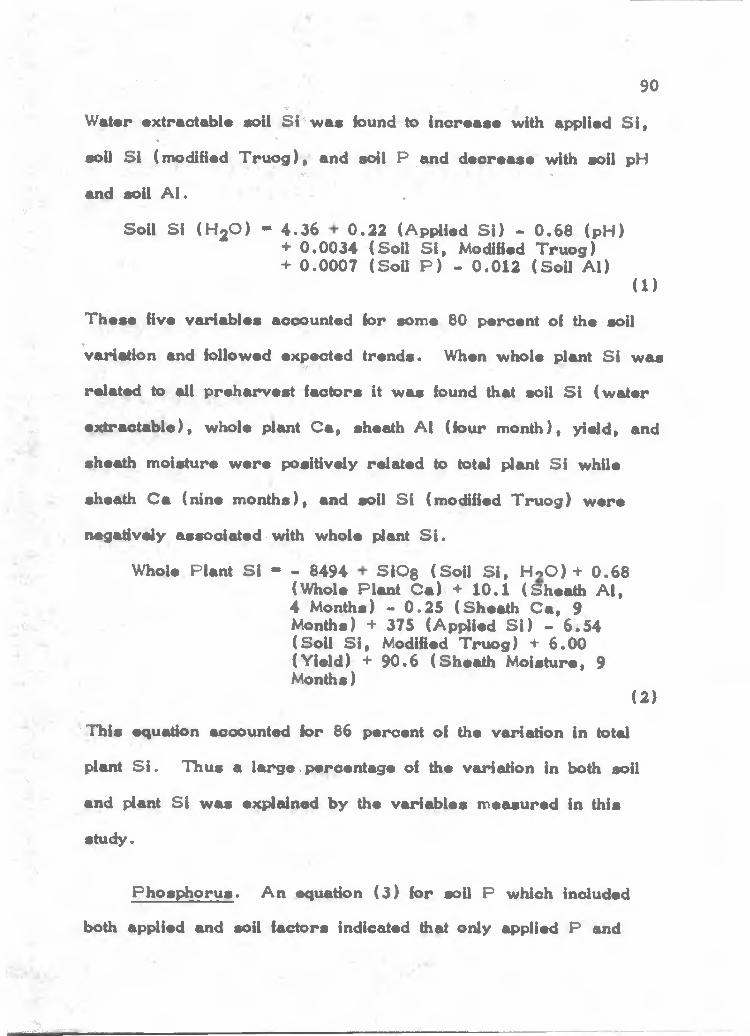
•V'
r?;;
"V:■
J . . .
■ ■ . - . ■ . :. ■■• 90-i”
W ater extraotable soil S i^ w as found to in crea se with applied S i ,^ t
soil S I (nx>dified T ru p g) , and soil P and d ecrease with soil pH'■r'.. •=
and soil A l. ,
Soil 51 (H 2O ) - 4 .3 6 0 .2 2 (Applied S i ) - 0 .6 8 (pH )>»- 0 .0 0 3 4 (S o il S i , Modified T ru og)+ 0 .0 0 0 7 (SoU P ) - 0 .0 1 2 (S o il A l)
( 1 )
T h ese five variables accounted for some 80 percent of the soil■i-
variation and followed expected trends. When whole plant S i w as■t
related to all preharvest factors it w as found that soil S i (w ater
ex tractab le ), whole p4ant C a , sheath Al (four m onth), yield, and
sheath moisture w ere positively related to total plant S i while
sheath C a (nine m onths), and soil S I (modified T ru o g ) w ere
nagativ^y associated with whole plant S i .
Whole Plant S i - - 8494 SlO g (SoU S i , H oO) + 0 .6 8(Whole Plant C a ) + 1 0 .1 (Sh eath A l,4 Months) - 0 .2 5 (Sh eath C a , 9
s O Months) + 375 (Applied S i ) - 6 .5 4(S o il S I , Modified Tru og) + 6 . 0 0 (Y ield ) + 9 0 .6 (Sh eath M oisture, 9 Months)
( 2)
'T h is equation accounted for 86 percent of the variation in total
plant S i . Thus a la r g e .percentage of the variation In both soil
and plant S i w as explained by the variables m easured in this
study.
P h osp horu s. An equation (3 ) for soil P which included
both applied and soil factors indicated that only applied P and
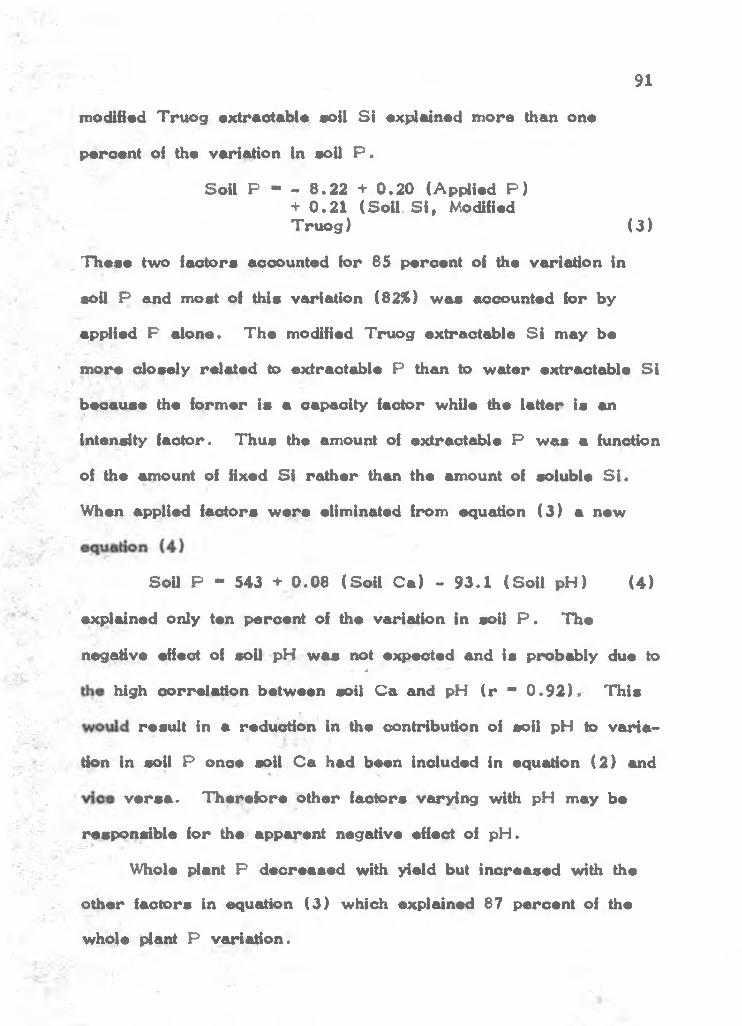
' ■ - A ;
■- -i' - -■ ■ .7 '■■' 91
modified Truog extreoteble soil S i exF^eined m ore than one
percent of the variation in soil P .. r. . ■■■
Soil P - - 8 .2 2 + 0 .2 0 (Applied P )F F + 0 .2 1 (S o il, S i , Modified
i"; , ' K T ru o g ) (3 )
, TTieee two factors accounted for 85 percent of the variation in
soil P and most of this v<u*iation (82%) w as accounted for by
applied P alone. T h e modified Truog extraotable S i may be
’ m ore closely related to extraotable P than to w ater extraotable S i
bimause the form er is a capacity factor while the latter Is an
V .;v intensity factor. Thus the amount of extraotable P w as a function
S of the amount of fixed S i ra th er than the amount of soluble S i .■
. 7 When applied factors w ere eliminated from equation (3 ) a newa.
. J . . . ■ ■ •.V Soil P - 543 + 0 .0 8 (S o il C a) - 9 3 .1 (S o il pH) (4 )
‘ exi^ained only ten percent of the variation in soil P . The
: negative effect of soil pH w as not expected and is probably due to^ --W
tiigh correlation between soil C a and pH ( r " 0 .9 2 ) . Th is. . A ‘ ^
^vF resu lt in a red «;^ on in the contribution of soil pH to v a ria -
V tion in soil P once soil C a had been included in equation (2 ) andpy-' y-- ’ » - >j7 v e r s a . T h erefo re other factors .varying with pH may be
... -F - F' •7 7 7 responsible for the apparent negative effect of pH.
777^F F/ Whole F4ant P d ecreased with yield but in creased with the
7 other factors in equation (3 ) which explained 87 percent of the
whole plant P variation.
= 7 . ''■■ ■ ■ ■ --.7'A.-

Whole Plaiit P - 5 4 .4 + 0 .2 0 8 (Applied P )+ 0 .1 0 8 (Whole Plant C a)
V + 0 .2 1 6 (Sh eath P , 8 Month*)+ 0 .3 2 4 (Whole Plant K )
0 .8 8 7 (Y ield ) (3 )
T bis d ecrease with yield and in crease with applied P a re
expected due to the effects of dilution and P addition, resp ectively .
T h e other three variables a re probably associated with whole
plant P rather fiian being causal facto rs.
B a s e s . So il K w as found to in crease with soil C a , Mg,
and w ater extraotable S I and d ecrease with soil pH, P and
modified Truog extraotabfo S i . Equation ( 4 ) , which included all
soiL factors accounting for one percent o r m ore of the variation,
ex;4alned 31 percent of the total soil K variation.
Son K - 163 + 0 .0 2 4 (S o il C a) - 2 8 .0 5 (S o il pH)- 0 .0 6 2 (S o il S i , Modified T ru og)+ 0 .2 5 (S o il Mg) + 4 .1 1 (S o il S I , W ater)- 0 .0 1 6 (S o il F ) (4 )
S in ce pH and soiL K a re positively correlated (Appendix B ,
Table 4 4 ) , fiie reladonshlp between soU C a and pH discussed
above Is probably applicable h e re , a lso . Equation (4 ) incfioates
that the assumptions originally made in this thesis concerning the
factors affecting soil K a re basically c o rr e c t . The factors
associated with plant and soil K may affect other b a ses simUarly.
F o r example soil Mg wcui found to be related to C a by fiie
equation:
Soil Mg - 1 4 .8 5 + 0 .0 0 9 (SoU C a) (5 )
92

•, <!•
T h is rslstionship s;q?isinsd 69 psrosnt ol the variation in soil Mg,
and no otiier soil factor accounted for m ore than one percent of
the variation. When soil Mg w as compared witit all preharvest
factors 83 percent of the variation w as accounted for by soil Ca
emd K and sheath Mg and C a (8 m onths). All plant Mg variables
w ere found to closely reflect the soil values.
Sheath Mn w as found to be inversely related to sheath mois
tu re , T C A S i , sheath P , K and Mg, whole plant C a and Mg,K'soil pH , and modified Truog extraotable S i .b y sim(4e correlation
'analysis. T h ese in verse relationships a re apparently due to the
effect of pH as related to the otiier factors as Mn is known to=>'
precipitate from solution with increasing pH.
Aluminum. So il Al w as found to be negatively associated
with soil pH, S i (modified T ru o g ), K , C a , emd Mg a s well as
sheath P and C a . T h ese relationships a re reasonable since
calcium oembonate and calcium silioate w ere added to attain sp eci-fi ••
lied levels of soil pH . T h is pH in crease resulted in a d ecrease
93
in Al activity in tiie soil solution which in turn allowed increasing
amounts of P , K and Mg to becom e available.- i . i r. J T s.-
Plant Al w as not correlated with soil Al o r with any other
soil o r plant variab les except percent dry matter at h arv est.
Sheath A l, how ever, w as signifloandy in creased by S i and P
treatments and in creased slightly by pH treatm ents. T h ese data

94
support the oonoluslon that Al w as the actual causal agent
mentioned above.
77,. -■•‘ A-

SU M M A RY A N D 'C O N C L U SIO N S
A ratoon orop^of sugaroane, variety H 53-263 , w as grownT * ■ *
for 9 months in the field on a ’ Typio. Gibbsihumox to study the
effects of residual S i and P treatm ents and soil pH on cane yield
and nutrient uptake. The experiment w as a complete factorial
installed in a split-plot design. No additional nutrients w ere
applied except 112 kg per ha N . So il and p4ant analyses w ere
perform ed to study the effect of mineral composition on cane yield.
Cane yield w as significantly increased by residual S I emd
tended to in crease with residual P treatm ents. Although soil pH
had no direct influence on yield, it affected other nutrients which
in tui*n influenced yield. Som e of the m ore important nutrients
affected w ere C a , S i , A l, K , Mg, and P .
Both plant and soil S i increased sigidlioantly with increasing
residual S i treatment* H ow ever, TC A extraotable sheath S i w as
m ore closely related to yield than w as total sheath S i o r ^ i l S i
and w ater extraotable soil S i w as m ore d osely associated with
yield than w as modified Truog extraotable S i . H ie re w as a
linear relationship between sheath S i (nine m o i^ s ) and w ater
extraotable soil S i ( r “ 0 .8 2 ) .
Residual P treatm ents significantly in creased soil and plant
P levels and also had a tendency to in crease yields. Phosphorus
uptake w as found to in crease with residual S i treatm ent; also at
■ '
a particular sheath P level increased yields w ere associated with* •.
increasing residual S i treatm ent. Soil and plant K levels w ere
found to be a function of soil C a , through the complimentary ion
eHeot - of soil pH, due to the pH dependent ch a rg e , and of the
previous crop .yield, through K uptake. Sheath Mg levels w ere
also related to the sam e factors and w ere near deficiency levels.
H ow ever, Mg apparently did not limit grow th.
' ; Soil^Al w as d ecreased by increasing pH as expected, but
w as further d ecreased by increasing S i application at a given pH.- ' ^ •"
Sheath Al w as found to in cre a se with increasing S i levels.
96
^ > Multiple reg ressio n analyses w ere run to help interpret
‘ f.' ■ interrelationships between yield, soil fa cto rs , and plant facto rs.
The 25 factors m easured in fiie (4ant crop accounted for, only 59
percent of the yield variation while the 48 factors m easured in the
ratoon crop accounted for 73 percent of the yield v«unation. In
file plant cro p , applied factors acooui^ed for most of fiie yield
7^ variation while in the ratoon c ro p , plant factors accounted for the■ •' —
ik .it mejority of the variation and residual S i , which exF^ained only 6
percent of the variation; 'was the only significant applied factor.
. -i:r
•X' >-“■ ■*

U T E R A T U R E C IT E D
Adlan, H . A . 1969 . Effaota of pH, 'aflicKin and phosphorus on the growtii and ylald of papaya (C o rica papaya L . )» P h .D .
■7- . T h e s is , Univeridty of Hawaii.
Alchromeiko, A . I . 1934 . Utilisation by P lants of P 2 ^ 5VaH ous S o u ro e s . Z . P flansen ernah r, Dungung Bodenk. 3 4 A :3 4 0 -3 5 9 .•'f: .
■■ " :7.
. •<
A lexander, G , B . , W. H eston, and R . K . H er. 1 9 54 . Thesolubility of amorphous silica In w ater. J . P h y s . Chem . 5 6 : 4 5 3 *4 5 5 .
A ll, M. Y . 1966 . Effect of phosF^torus, illioon , and diMsapplications on the" yield and mineral composition of sugarca n e . M. S . T h e s is , University of Hawaii.
A quave, D . and J . H n sley . 1964 . SoluU e silica In so ils . ■V. P r o o . l l t i i E a s te r School In A g r . S d . , Umverslty of
Nottingham . . ExF>*rimental Pedology 1 9 6 5 :1 2 6 -1 4 8 .
. A m o n , D , I . 1952 . In E . Truog ( e d .) Mineral nutrition ofd a itis . Univ. of Wisconsin P r e s s , W isoondn. pp. 3 1 3 - 3 4 1 .
vwy A y re s , A . S . 1959 . The growth of sugarcane a s influencedphosjA orus. The oritleal range of soil phosphorus.
7 P r o c . Int. S o c . S u g a r T e c h . , 10th Cong. 4 6 2 -4 6 7 .
1966 . Calcium silicate slag a s a growth stlmulaidf 7 V ' fo r sugarcane on low silicon so ils . So il S o l . 1 0 1 :2 1 6 -2 2 7 .
and H . H . H agihara. 1952. A vdlable iihosphorusin Hawaiian so ils . Haw. P lan ters ' R e c . 5 4 :8 1 -9 9 .
B arto n , C . J . 1948 . Photometerio analyd s of phosF>hate ro o k . A nnal. Chem . 2 0 :1 0 6 6 -1 0 7 3 .
Beseau^ L . M ., L . £ . Lutwiok, A . D . Sm ith, and A . Johnson.1967 . Effect of fertilisation on chem ical oon position, nutritive value, and sllioa cx>ntent of Rough F e s c u e , F estu ea sca b re lla . C an . J . Plant S c i . 4 7 :2 6 9 -2 7 2 .
. J . - ,,
5. •.
- 7 ^ 7 . . - v . ,

iT;;
- 1
• -".i; '
98
Beckw ith, R . S « and R . R aav a . 1963 . Stucfiaa on aolul^e ailioa in aoila. D. A ustralian J . SoU S c i . 2 :3 3 - 4 5 .
B lan ck , E . R . and B . 'R . ThamUts* 1939 . Tha fartUlzing a c tion of na^raUy occu rring calcium and magnesium silicates and carbon izes and'of silicic a d d . J . Landw . 8 6 :1 6 5 -1 8 0 .
Buckm an, H. O . and N . C . B rad y . 1965. The Nature and P ro p erties of SoU s. MacMUlan Company, N . Y . 567 pp.
Chan, P . Y . , L . R o s s , and C . F igon . 1968. Effect ofoaldum d licate on d®nt growth. Maudtius S u g a r Ind. R e s . Inst. 1967 A nnl. R ep . pp. 8 1 -8 5 .
C henery , E . M. 1948. ThioglyooUio ad d a s an Inhibitor foriron in the oolbrim eterio determination of alumimam by means of "Aluminon". A nalyst. 7 3 :5 0 1 -5 0 2 .
4 Cheong, Y . W. Y . , L , R o ss , and C . Covalot. 1967 . SUIconstd u s of MauriHus soU s. Mauritius S u g ar Ind. R e s . Inst. Annual R ep . 1 9 6 8 :7 8 -8 1 .
Chu, A . C . 1955 . Differential fixation of diosphate by Hawaiian so ils . M. S . T h e d s , U d v erd ty of Hawaii.
.. . 1,
____________ and G . D . Sh erm an . 1952 . Differential fixation of' phosdiate by typical soUs of the H aw dian great soU groups.
H aw. A g r . E xp . S ta . T e c h . B u i. #16. 20
Clem ents, H. F . 1957 . Crop-logging of su g arcan e: Thedandard nitrogen index and the norm d nitrogen index. Haw. A g r . E xp . S ta . T e c h . B u i. #35. 56 pp.
1965a. Effects of silicate on the growth and leaffreck le of sugarcane in H aw di. P r o c . Int. S e e . S u g ar T e c h . , llfih Cong. Puerto R ic o :1 9 7 -2 1 5 .
1965b. The ro le of oaldum dlicate d a g s In sugarcane grow th. H aw . S u g a r T e c h . R e p ., 1 9 6 5 :1 0 3 -1 2 6 .
., G . Sh igeu ra , and £ . K . Akam ine. 1952 . F a c to rsaffecting fiie growth of su g arcan e. H aw . A g r . E xp . S ta .
fc: ' T e c h . B ui. #18. 90 pp.
1 :■ is-'.
., E» W. Putman, and J . R . Wilson. 1967 . Eliminating soil toxidties with calcium m etadlicate. H aw. Su g ar T e c h . R ep . pp. 4 3 -5 4 .

■ V ■- *'•
■7k-..
■ Zr- JA-
y=*;.y=.v j-yyj i
■ . r’ v ; - •,
A - 7 , V
Clem ents, H . F . , E . W. Putm an, and G . L . Y e e . 1968.T issu e an alysis--th e b asis of crop logging and crop oordrol. P r o o . 2nd AnnutU H aw. F e r tilise r C oiderenoe. Univerirfty of Hawaii, Cooperadve E ;d . S e r v . M isc. Publleation #51. pp. 1 3 -3 2 . , . ■
Dei Datta, N . P . * 1963 . AvailablUty of |:^sphtorua and utilisation of i:^osphate fertilisers in some great soil groups of Hawaii. P h .D . T h e s is , University of Hawaii.
Denny, J . J . , t W . D . R obson , and D . A . Irw in. 1939 . C an. Med. A sso o . J . 4 0 :2 1 3 -2 2 8 .
Dewan, M. and A . S . H unter. 1949. Absorpdon of i^ s p h o - ru s by soybean and sudan g r a s s . II. Effect of sU icates.
Sott S d . 6 8 :4 7 9 -4 8 2 .
99
D ias, I . P . 1965 . Efieot of the use of lime and other soil amendments on iimorphous. and cflfferentially crystallised sub
soil of the Akaka s e r ie s . . P h .D ; T h e d s , University ofH aw d i.
Dlckman, S . R . and R . H . B r a y . 1940 . C olorim d erlc determination of d iosphate. Ind. E n g r. Chem . A nal. E d . 1 2 :
v ! ' 665—6 6 8 .
' r D ix, W. and E . R au terb erg . 1934* Experim ents on die recip rocal action of colloidal d licie a d d , p h o sF ^ ric a d d , and potash upon plant grow th. Z . P flan seM rh ah r, Dungung
M Bodenk. 1 3 8 :2 3 3 -2 4 6 .■'
Duehon, F . 1925 . Action of silioa in increasing die yidd ofd*>^s in sand cultures with insuffident dtosphoric a d d . Z . P flansenernahr Dungung Bodenk. 4 A : 3 1 6 -3 2 5 .
Dutt, A . K . 1 9 47 . The effect of w d er-so lu b le K d lio d e and variousTOther treatm ents on soil structure and crop grow th.
7 y So il S d . S o c . A m er. P r o c . 1 2 :4 9 7 -5 0 1 .
F is h e r , R . A . 1929 . A prdim inary note on the effect ofsodium siUode in in cread n g the yield of b arley . J . A g r . S d . 1 9 :1 3 2 -1 3 9 .
' .F le td ie r , H . F . and L . T . K u rts. 1964 . D iffereid d effects of
phosphorus fertilizer on soybean v arie ties . S d i S d . S o c . A m er. P r o c . 2 8 :2 2 5 -2 2 8 .
I ■■ : ■
y 7 - 7 7 ■
100
F o x , R . L . , J . A . S ilv a , O . R . Younga, D . L . Pluoknatt, and G . D . Sh erm an . 1967 . So il and plaid silicon and silioate resp on se by su g arcan e. S o il S o i . S o o . A m er. P r o c . 3 1 :7 7 5 -7 7 9 .
., D . L . Pluoknett, and D . Y . T eran ish i.1969 . Soluble and total silioon in sugar ca n e . Plaid and SoU 3 0 :8 1 -9 2 .
H alais, P . and D . H . P a r is h . 1963. S ilica and manganese ooident of cane leaf sheaths in relation to soil and mdrition. Mauritius S u g a r Industry R e s . Inst, Annual R ep . pp. 7 4 - 7 6 .
Hall, A . G . and C . G . T . M orison. 1905 . On the function of silloa in the nutrition of c e r e a ls . P r o c . R o y . S o c . ( B ) . 7 7 :4 5 5 -4 7 7 .
H andreck, K . A . and L . H . P . Jo n e s . 1967 . Uptake of monosilicic acid by Trifolium inoarnatum. A u st. J . B io l. S o i . 2 0 :4 8 3 -4 8 5 .
Humbert, R . F . and W. R , Sdbm ehl. 1964 . Nutrientdeficiencies in sugar c ro p s . In H . B . Sprague (e d .) Hunger S ign s in C ro p s, David M cKay C o . , N . Y . pp. 4 1 5 -4 5 0 .
Hunter, A . S . 1965 . E ffects of idlicate on uptaJce of phosphoru s from soils by four c ro p s . So il S d . 1 0 0 :3 9 1 -3 9 6 .
Ibrahim, A . A . B . 1967 . Effect of nitrogen and silioon on growth and yield of r ic e . M. S . T h e s is , University of H awaii.
Ikaw a, H . 1956 . The ro le of soluble s ilic^ e on tiie fixation and re le a se of phosphorus of trop icd so ils . M. S . T h e s is , University of Hawaii.
____________ and H . S a to . 1 9 69 . P erso n a l oommunieation.
Her, R . K . 1955 . T h e colloidal d iem istry of silioa and s ilica tes . Cornell Univ. P r e s s , N . Y . 324 pid.
Jo n e s , L . H . P . and K . A . H andreck. 1963 . E ffects of iron and aluminum oxid es'on sUida in solution in soils. Nature 1 9 8 :8 5 2 -8 5 3 .

101
•• :
■ ■, h ‘ -
J* .-' ' e'
■\. :• - V ; r
,-r
• s
Jo n e s , L . H . P . end K . A . H endreck. 1965* SU iea in the oet plant. III. Uptake ol silica from the soil by die plant. Plant and SoU 2 3 :7 9 -9 6 .
And . 1967 . S ilioa in so ils , plaids, andanim als. Advanoes in A gron . 1 9 :1 0 7 -1 4 9 .
, A . A , K^lne, and S . M. Wadham. 1 9 6 3 * . Studiesof silioa in die oat pdant. I . Chemical and phy^oal p rop er- ties of the s ilica . Plant and SoU 1 6 :2 0 7 -2 2 0 .
f . and 1963b. Studies ofsilioa in the oat plant. 11. OistrUHition of die sUica in the
; plAnt. Plant and So il 1 8 :3 5 8 -3 7 1 .
K ilm er, V . J . 1965 . SUloon. C . A . B lack ( e d .) in Methods of soU an alysis. P a r t 2 .
L a i^ n g , F . C . , B . W, Fonnaiya, and C . F . Crumpton. 1958 . T h e chem ical nature of sUica in plants. Plaid P h ysio l, 3 3 :
• 3 3 9 -3 4 3 .
Lem m erm an, O . , H . Wlessm«ui, and K . Sam m et. 1925 . Action of silioa In increairing die yield of plants. Z .
P flansenernahr Dungung Bodenk. 5 :2 6 3 -3 1 5 .
Ligon, W. S . and W. P ie r r e . 1932 . Soluble aluminumI studies. II. Miidrhum eoncentrations of aluminum found to be
toxic to co rn , sorghum , and barley in culture solutions.S o il S d . 3 4 :3 0 7 -3 1 7 .
Lipman, C . B . 1938.^ Importaime of S i , A l, and Cl for higher plants. SoU S c i . 4 5 :1 8 9 -1 9 6 .
L ow , P . F . and C . A . B la c k . 1950 . Reactions of phosphate with keolinite. SoU S c i . 7 0 :2 7 3 -2 9 0 .
M adndre, W. H . 1927 . Role of siiioa in oouideraodng magnesia — induced toxicity. SoU S d . 1 9 :3 3 1 -3 4 1 .
____________ and A . J , S te r g e s . 1952a . Role of solvated sUioain promoting migrations of F , P , and C a in 10 y ea r r d n w ater drainage from slagged and wollastodted so ils . S d l S c l . 7 4 :2 3 3 -2 4 7 .
.. ' ■

M adntire, W. H . and A . J . S ta rg a s . 1952b. Quanohad calcium ailicata alag and limaatona incorporationa in two T an n as- saa so ils . Soil S d . S o o . A m or. P r o c . 1 6 :3 1 0 .
Magistad, O . C . 1925. The aluminum oontant oi the soil colum n and its relation to soil reaction and plant grow th. Soil S d . 2 0 :1 8 1 -2 2 5 .
Mahilum, B . C . 1965. The effects of silicates and carbonates on the status of mineral nutrients in a hydrol humic latosol. M. S . T h e s is , U dveraity of Hawaii.
Manuelpilld, R . G . 1967. Influence of silicon and d^osphorus and their interaction on yield and ohemioal oomposition of
V d *n ts . M. S . T h e s is , University of Hawaii.
M oGeorge, W. T . 1924. T h e influence of s ilica , lim e, and diosd^orus upon the availability of phosphorus in humio ferruginous latosols. Soil S d . 1 7 :4 6 3 -4 6 8 .
M oKeague, J . A . and M. G . Cline. 1963 . S ilica in so ils .A dv. in A gron . 1 5 :3 3 9 -3 9 6 .
Medappa, K . C . and M. N. D ana. 1956. influence of pH, oal- dum , iron , end alum>inum on the uptake of radiophosphorus by cra n b erry plants. Soil S o i. S o o . A m er. P r o c . 3 2 : 3 8 1 -3 8 3 .
M iller, R . W. 1967. Soluble S I in so il. So il S o i . S o o .A m er. P r o c . 3 1 :4 6 -5 0 .
Mitsui, S . and H . Takatoh. 1963a. Nutritional study of d licon in gram inaceous cro p s (P a r t 1 ) . 5 d l S d . and Plant Nutr. 9 ( 2 ) : 7 - l l .
and 1963b. Nutritional study of d licon
102
in graninaoeous cro p s (P a r t 2 ) . S d l S d . and Plant Nutr. 9 ( 2 ) :1 2 - 1 6 .
_______ and . 1963o . Nutritiond dudy of dlioonin graminaoeous c ro p s . 3 . The effed of metabolic inhibitors on the silicon uptake of the r ice plant. S d l S d . and Plant N utr. 9 ( 2 ) :3 7 - 3 8 .
M o ir,'W . W. G . 1936 . A handbook on Hawdian so ils . Haw. S u g a r P lan ters' A s s n . , Honolulu, H aw di. 266 pp.
Monteith, N . H . and G . D . Sh erm an . 1963. T h e comparative effects of calcium carbonate and of qaioium silicate on the yield of sudangrass grown in a ferruginous latoiK>i and a hydrol.humio latosol. Haw. A g r . E xp . S ta . T e c h . B u i. #53k m pp.
Okamoto,, G .| T . O kura, and K . Goto. 1957 . P ro p erties ofsilica in w ater. Geoohimioa et Cosmoohimioa A cta . 1 2 :1 2 3 - 132 .
Okamoto, Y . 1957 . Physiological studies on the effect of silicic acid on r io e . 3 . Effect of silica supplied various stages of growth. P r o o . Crop S c i . S o c . , Japan 2 5 :2 1 9 -2 2 1 . (Absfoaoted in S o ils and F e r t . (1 9 5 7 ) 2 0 :3 5 9 .)
Okuda, A . and £ . TsUcahashi. 1962 . The F^iysiologioal ro le of silioon in crop j4 a n ts . 6 . Examination of the specific behaviour of Jow land rioe a s reg ard s silioon uptake. Soil S c i . and Plant Nutr. 8 ( 5 ) :3 9 .
«nd . 1963. The F^ysiologioal role of
103
silioon in crop plants. 1 0 . Effects of some su g ars andorganic acids on tfie silioon uptake of H oe. F a o . of A g r i . , Kyoto U niversity, p. 114 . (A bstracted in Soil S c i . and P lsn t Nutr. (1 9 6 3 ) 9 (5 ) :3 7 r 3 8 V )
•nd . 1964 . The role of silioon. |a Themineral nutHtion of rioe plant* Iifi'l. R ioe R e s . Inst.pp* 1 2 3 -1 4 6 .
O nikura, Y . 1959. Effects of artifioial silioation on volcanic ash 7 y : so ils . 1. Silioation of subiKtUs. J . S c i . Soil and Manure
3 0 :2 5 3 -3 2 7 . (A bstracted in Soil and Plant Food (1959) 5 :1 5 1 . )
1959. Effects of artifioial silioation on w>lcanio ash so ils . 11. Silicadon on clay fractions of su bsoils. J . S c i .S o il M anure, Japan 3 0 (8 ) :3 8 5 -3 8 7 . (A bstracted in Soil and Plant Food (1 9 5 9 ) 5 ( 4 ) : 1 9 4 .)
O ta, M ., H . Kobayashi, and Y . Kawaguchi. 1957 . Effect of slag on paddy H ee. P a r t 2 . Influence ,,of different nitrogen and slag levels on growth and oomposition of H ee plaH.So il and Plant Food 3 :1 0 4 -1 0 7 *
Raleigh, G . T . 1939 . Evidence for the esseiH ality of silica for growth of the beet plant. Plant P hysiol. ,,1 4 :8 2 3 -8 2 8 .
A.:
Raleigh, G . T . 1945 . S ilioa in dant grow th. So il S o i . 6 0 : 13 3 -1 3 5 .
Randall, P . J . and P . B . V o e e . 1963 . Eifeot oi aluminum onuptake and translooation of P by perennial ry e g r a s s . Plant P h ysio l. 3 8 :4 0 3 -4 0 9 .
Raupaoh, M. 1957 . T h e nature of soil pH. C . S . I . R . O . A ustralia . So il Publ. #9. 35 pp.
. 104
and C . S . P ip e r . 1959. Interaction of silioate and phosphate in a lateritio so il. A’u str . J . A g r . R e s . 1 0 :8 1 8 - 8 3 1 .
Reifenberg, A . and S . J . Buckwold. 1954 . The re le a se of silica from soils by the orthodiosphate anion. J . So il S o i . 5 :1 0 6 -1 1 6 .
Rothbuhr, L . and F . S co tt. 1957. A study of tits uptake of silioon and phosphorus by wheat plants with radio-chem ical m.ethods. Bloohem . J . 6 5 :2 4 1 -2 4 5 .
R u sse ll, E . W. 1961 . S o il Conditions and Plant Growth.WUey P u bl. C o . . N . Y . 688 pp.
R u ssell, R . S . and R . P . Martin. 1949 . Use of radloaotivaphosdtorus in plant nutritional studies. Nature 1 6 3 :7 1 .
■?
S o a rs e th , G . D . 1935. The meohadsm of phosphate retention by natural alumino-silioate colloids. J . A m er. S o o . A gron . 2 7 :5 9 6 -6 1 6 .
So h o llsn b arg sr, C . T . 1922 . Silioa and silicates in rdation to dant growth and composition. So il S d . 1 4 :3 4 7 -3 6 2 .
Sh erm an , G . D . , J . L . W alker, and H . Ikaw a. 1968 . Som e mineral re so u rc e s of the Hawdian id an d s. H aw . A g r . E xp . S ta . Bui* #138. 34 pp. "
., A . C . Chu, and C . M. Sakam oto. 1955 . Theinfluence of applioation. of soluble silicates on phosphorus availability in oertd n Hawdian so ils . P r o c . H aw . A cad . S d . 30th annud m<eeting. p. 16 .
>
Stanford, G . and A . S . A y r e s . 1964. The iiUernd nitrogen reqd rem en t of su g arcan e. S o i l ,S d . 9 8 :3 3 8 -3 4 4 .

Stout, P . R . and D . R . Hoaglamd. 1940 . Upward and lateral movement of aalt in c e rtd n d®nta as indioded by radioaotive isotopes of potassium, sodum and phosphorus absorbed by ro o ts . A m er. J . B o t. 2 6 :3 2 0 -3 3 4 .
S u eh isa , R . H . , O . R . Younge, and G . O . Sh erm an . 1963. E ffects of silicates on phosphorus availability to sudan g ra s s grown on Hawaiian so ils . Haw. A g r . E xp . S ta . T eoh t B u i. #51. 40 pp.
S u h r , N . H . and C . O . Ingam ells. 1966. Solution teohmques for analysis of silica tes. A nal. Chem . 3 8 :7 3 0 -7 3 4 .
Takahashi, T . 1963 . Influenoe of exchangeable aluminum on calcium absorption by barley in volcanic ash so ils . So il S o i.rb n d Plant Nutr. 9 (5 ) :3 6 .
Ta>Hlor, A . W ., E . L . G urney, and A . W. F r a z ie r . 1965 . Preoidtation^of phosphate from ammoidum d^osphate solutions by iron oxide and aluminum hydroxide. So il S o l .S o c . A m er. P r o c . 2 9 :3 1 7 -3 2 0 .
T eran ish i, D . Y . 1968.° Tha effects of silicon, phosdiorus and soil pH and ttieir interactions on yield and nutrieiZ ud®ke of sugar can e . M. S . T h e s is , University of Hawaii.
T erm an , G . L . and G . Stanford. I9 6 0 . P r o g r e s s through cooperative re se a rc h on fertilizer evaluation. A report of T V A soils and fertilizer branch for the period July 1957 through June 1960. T en n essee V alley Authority, Oiv. A g rio . R e s . , Wilson Dam , .A labam a.
T oth , S . J . 1939* T h e stimulating effects of silica on dant yields in relation to anion disdacem ent. So il S d . 4 7 :1 2 3 -1 4 1 .
Uohiyama, N . and Y . Onikura. 1956. Studies on clay form.a- tion in paddy so ils . P a r t V . Influence of apdiad soil silica and lime on clay m inerals. J . S d . So il Manure 2 7 ( 7 ) : 2 7 5 -2 7 8 . (A bstrad ed in Plant and Soil Food (1 957 ) 3 ( l ) : 2 - 3 . )
Umemura, Y . 1961 . Effect of silicon compounds on d a d enzym es involved in phosphorus metabolism. A rc h .B io o h e m B io p h y s io . 9 2 :3 9 2 -3 9 8 .
V lam is, J . and D . E . Williams. 1967. Manganese and silicon interaction in the gram inae. Plant and Soil 2 7 :1 3 1 -1 3 9 .
105

W hittenberger, R . T . 1945. Silicon «b«>rption by ry e and sunflow er. A m er. J . B o t. 3 2 :5 3 9 -5 4 9 *
Williams, D . £ . and J . V lam is. 1957a. The effect of sUioon on yield and Mn 54 uptake and dstribution in the leaves of barley plards grown in culture soluflon. Plant P hysiol. 3 2 : 4 0 4 -4 0 9 .
106
■A;
and ■ 1957b. Manganese and borontoxicities In standard culture solutions. Soil S c i . S e c . A m er. P r o c . 2 1 :^ ^ 5 -2 0 9 .
y- ■*
Y oshida, S . , Y . Ohnishi, and K . Kitagashi. 1959 . The chemical nature of^^silicon In the Hee Hant. So il and Plant N utr., Tokyo 5 ( l ) : 2 3 - 2 7 .
., and - 1962 . Chemicalform s, mobility and depodtion of d lioa in H ee plants. SoQ arid Plant N u tr ., Tokyo 8 ( 3 ) : 1 5 -2 1 .
7-'. '?tV " ■ .
Fs*. 7-'-’V:- V ■ V'■ .
% , 7 , - ■ ■"■ ,.■ 7: ■- A P P E N D IX A
■-77- 7”A N A L Y T IC A L M E T H O D S
J; ■ ■
■» •
Plant Analytical Methods
•7^- F ' ‘"'7. 7 - ^ '^F-Extraction and Digestion' P ro ced u res
TC A Extractable S ilico n . Soluble S i w as extracted iroir.
fresh sheaths by the TC A (tH ohloro-acetic acid) metiiod of F o x
a t fil* (1 9 6 7 ) :
A 10 g sam do of freshly chopped sheath m derial (1 cm length) and 100 ml 2% TC A solution a re homog-
7 f7 j 7 enised at high speed for 10 minutes in a Waringblender. F ilte r the extract through Whatman No. 42 filter paper and collect in a piasHc vial. E xtract the
7 " ' sheaths between 1 .5 - 2 .0 hours after sampling. S to rethe filtrate in a refrig erato r until analysing it by a nodification of the Silico-M olybdate Blue method of Kilm er (1 9 6 5 ) .
■ € 7Lithium T e tra -B o ra te F u d o n . A modification of the lithium
7;7 p : te tra-b orate method of S u h r and Ingamells (1 966 ) w as used for
the fudon of ashed plant materia) for S i determination:
P la ce a 0 .5 g sample of ground plant m aterid in a F ' platinum crucible and ash overm ght.at 5 5 0 * 0 in a muffle
fu rn ace. A fter booling, thoroughly mix 0 .5 g lifltium tetraborate with die ash and quantitdively tra n d e r the mixture
7 to a b arto n cru cib le . F u se the sample in a muffle furnace7 7 7 at 95 0 *C for 15 minutes. Remove«the cru cible from the
fu rnace, sw irl it to gather unooalesbbd beads of m^olten 7 7 : m aterid , and pour the hot m eitjn to 100 ml 0 .5 ^ nitric
acid . S t ir the nitric acid solution with a magnetic s t ir re r until the m.alt is oom-pietdy dissolved. Determine S i in the solution udng" the"Si)ioo-M olybdde Blue method (K ilm er 1 9 6 5 ).
• '■
■ ■■ 7
.?■
■ ->-7-

- ;-:F
.1 N itr ie -P T c h lo r ic Acid D igest. F'Isnt P , K , C « , Mg, Mn
and Al w ere deterrnined on the nitric-perchloH c acid digest of the
plant m aterid (Ja c k s o n , 1 9 5 8 ) :
108
P la ce 1*0 g dried plant rraterid in a 100 ml Kjddahl digestion flask . Add 15 ml 2 :1 n itric :p erch lo ric acid solution mdcing su re that all pled m d e rid is contained in
A the ad d solution. C over the flask* with an inverted beake r and allow mixture to p red gest ov erd gh t. Digest in a microkjeldahl rack udil the white fuming stage is reached and continue the digestion at low h ad for 15 minutes to complete dehydraHbn of tiie S i . Cool the mixture to room tem perature, tran sfer to a 50 ml. volumetric flask and
#7 make to volume.■Fa# ,
Chem iod Methods
Flant S ilico n . P la n t .S i w as determined by the S iiico -
Molybdate Blue method of Kilm er (1 9 6 5 ) :■ A . : * ; ■
7 ^ 7?# 7 T r a n d e r an aliquot of sample sdution to a 50 mlvolumetHo flask . 'D ilute to about 35 ml. Add 1 ml ammonium molybdate solutibn, mix and let stand for 30
. aF minutes. Add 3 mP 10% o x d ic ad d solution and mix.F i 7 F Within 2 minutes add 1 ml redudng solution, mix and
7 make to volum.e* Allow 30 irimttes for co lor devdop-: ment and dderm ine opHcd dendty d 660 m on a
spedrophotom e te r .
T C A extraotable S i w as determined in the sam.e m anner; how -7 - '■
e v e r 5 ml of 10 percent ammodum persulfde solution w as added
■■ p rior to the molybdde addition to prevent prem ature reduction of
the molybdde yellow com>plex to the blue complex.
Plant P h o scJib ru s. , Plant P w as determined by the Vandate-
Molybdate Yellow ir>ethod of Barton (1 9 4 8 ) :
■■ ■
„ ■ . . . _ . ..
109
T ra n sfe r a S. ml aliquot of sam d e solution to a 50 ml volumetrio flask . .Dilute to'’about 30 ml. Add 5 m.l B arto n 's reagent, mix, cfilute to volume end mix again. A fter 30 minutes read optical density at 430 m. on a spectrophotom eter.
Plant N itrogen. Plant N w as determined by die Kjeldahl
m.ethod;
Weigh out 3 g dry tissue and place in an 600 ml Kjeldahl Qask; add 30 ml concentrated sulfuric acid , 5 g sodum sulfate, 5 drops selenium oxyohloride and sev era l glass b ead s. D iged until the solution c le a rs and then continue digestion tor 30 n.inutes. Cool, dilute digest with about 300 ml w ater and cool to 3 5 *C . C arefully pour 90 -1 0 0 ml 50 percent so<fium hydroxide down the side of the flasic to avoid mixing. Add a few pieces of m ossy zinc and attach to distillation unit immediately.
,T u rn on heat and mix contents by shaking rapicfly.Distill about 200 ml into SO ml boHc aoid solution.T itrate with standard a d d .
So il Analytioal Metiiods
Extragtjon Metl o<j{
Water Extraotable S ilic a . Soil S i w as extracted by shaking
10 g soil (oven dry b a sis ) with 100 ml w ater for 4 hours and
filtering through Whatman No. 42 filter pap er. Soil S I w as alsof
e^ raoted with the modfied Truog extractant a s described below
tor soil P . In botii o ases S i w as determined by the S ilioo-
Molybdate method of Kilm er (1 9 6 5 ) .
ictabU SoU P was
sxtrsotsd by ths n odifisd Truog msthod of A y rss and Hagihara
(1 9 5 2 ) :•y.' •
T o a 1 .5 g soil sample (ovan dry b a d s ) in a 200 ml flask , add 150 ml O.oil ^ sulfuric acid (containing 3 g/1 ammonium sulfate) and shake for 30 minutes. The extract is filtered through Whatman No. 42 filter paper.
' Determine P by the Molybdenum Blue method of D ick- man and B ra y (1 9 4 0 ) .
Exchangeable B a s e s . Exchangeable K , Ca and Mg w ere
extracted with 1 ammonium acetate (pH 7 . 0 ) .
Combine 10 g soil (oven dry b a sis ) with 100 ml ^ ammonium acetate J pH 7 .0 ) and shake for 15 minutes.Allow the suspension to equilibrate overnight and again shake 15 minutes. F ilte r the suspension through Whatman No. 42 filter paper. T ran sfer all the soil to*the filter paper and wash it 3 times with 30 ml ammonium acetate solution. Make the resulting filtrate to 200 ml volume with am.m.onium acetate solution. Determine b a ses on an atomic absorption spectrophotom eter.
Extraotable So il Aluiriinum. Soil Al w as extracted by
shaking 10 g soil (oven dry b a sis ) with 100 ml ^ potassium chlo
ride for 30 minutes and centrifuging the suspension to obtain a
c le a r ex tract. Aluminum.was then determined by the Aiuminon
method of Chenery (1 9 4 8 ) .
. Mf.fao4t
So il Phosp horu s. Soil P was determined by the
Molybdenum Blue method of Dtokman and B ra y (1 9 4 0 ) :
110

7
. . ' , - A' -T ra n sfe r a 10 ml aliquot of soil extract to a 50 ml
volumetric flask . Dilute to about 30 ml and add 10 ml 7 7 dilute stannous chloride solution. Dilute to volume and
m ix. A fter 10 minutes read optical density at 660 m on a spectrophotom eter.
So il S ilico n . So il S i w as determ.ined by the S ilio o -
Molybdate Blue method of Kilm er (1965 ) a s described previously.
So il Aluminum. Soil AI w as determined by the Aluminon'S.y.
method of Chenery (1 9 4 8 ) :
T ra n sfe r a 10 ml aliquot of soil extract to a 50 ml volumetric flask . Dilute to about 20 ml and add?2 ml 1 percent thioglycollie acid . Mix.and add 10 ml alum.inon reagent and mix again. T ran sfer the solution to a 100 ml b eak er, acUust die pH of the solution to 4 .2 with 1 :1 ammonium hydroxide o r 1 :1 . hydrochloric acid and
! 7 return the solution to the 50 ml. flask with 2 o r 3 small47 distilled w ater w ash es. Heat in a steam bath for 16yA " y ? minutes, cool 2 hours and dilute to volume. Mix and
read optical density at 537 ; 5 m on a speotroHiotom- e te r . _ ’
7 y .
111
,-'-v‘•■y ' Vs • •
.. ; ;
'.y- . ■
:■
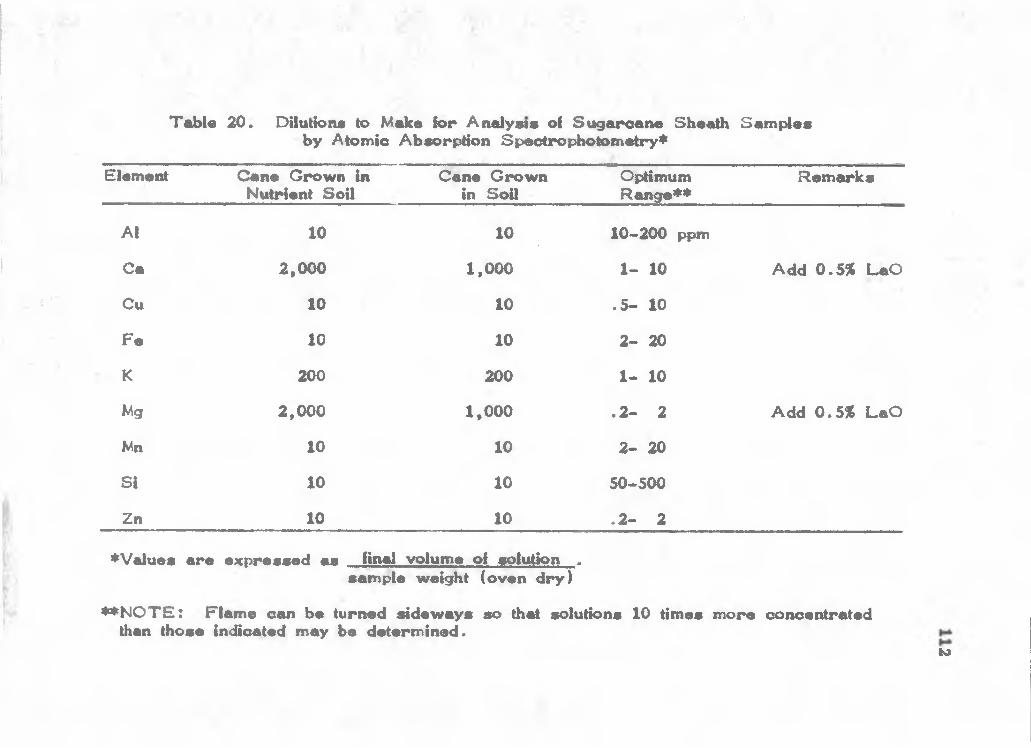
, s - ■
J '•
T able 2 0 . Dilutione to Make for Analyms of Su g arcan e S h ed h Sam ples by Atomic Absorption Spectrophotom etry*
Elem ed Cane Grown in Nutrient Soil
Cane Grown in SoU
OptimumR an g e**
R em arks
Al 10 10 10-200 ppm
Ca 2 ,0 0 0 1 .0 0 0 1 - 10 Add 0 .5 ^ LaO
Cu 10 10 .5 - 10
F e 10 10 2 - 20
K 200 200 1 - 10
Mg 2 ,0 0 0 1 ,0 0 0 .2 - 2 Add 0.5% L aO
Mn 10 10 2 - 20
S i 10 10 50-500
Zn 10 10 .2 - 2
*V alues a re exp ressed as final volume of solution .sem ple weight (oven dry)
* * N O T £ : Flam e can be turned sidew ays so that solutions 10 times m ore concerZratedthan those indicated may be determined.
K>

1.. • r ■
'■-a;- .: - A.'-:'''."■:■ v. 7 '-7» , ;V . ■ •■ , , ■ •> ■ r ■ . ' -■A'. " ■ ' ■ .
■r'—.' - i^-X
' .5 « i ,■ ;7 ,p » , ■■;.:• . ^
5 a S i S 5 > ^ " -, ; , A : : A : r p . 4 ' . ■:
7. .
« p > -
-P;"A
; A,..-.,.> , ; - - ; 1 - J .- .S i j 's
‘'-£- - Av"
113
A P P E N D IX B
v'A p - .
■, - -
;U » =P->--kiaP
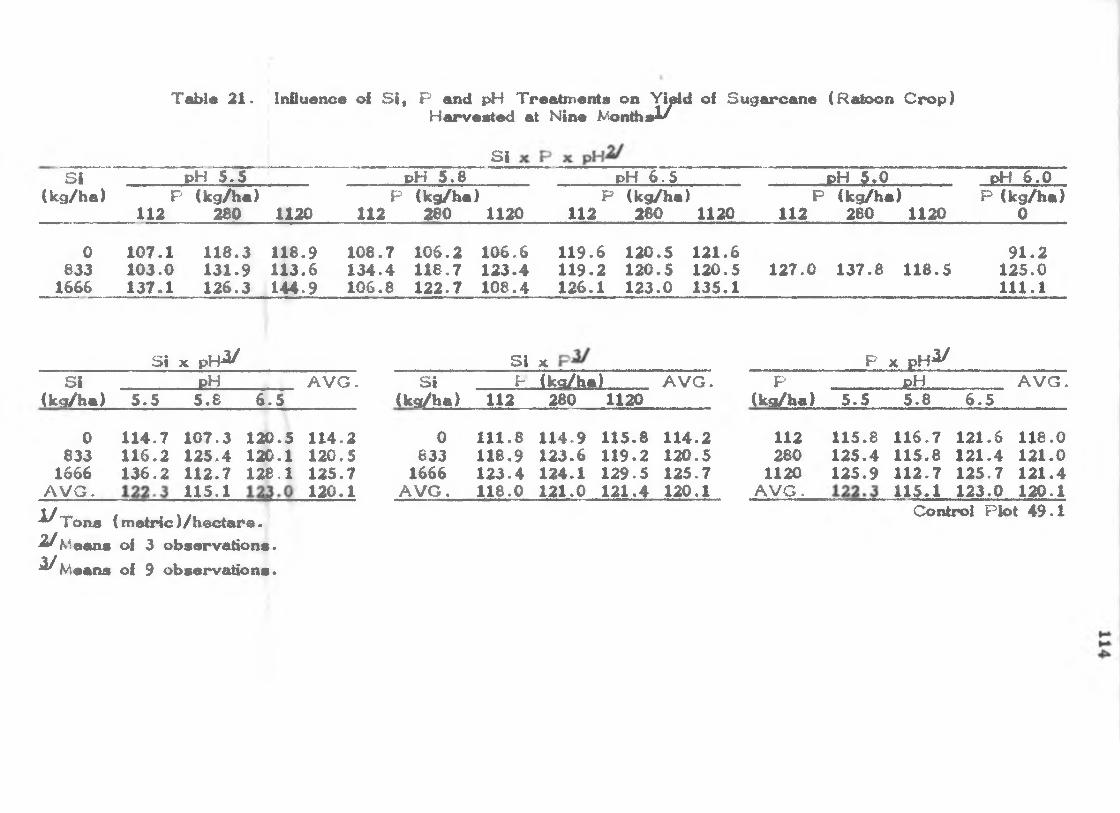
T able 2 1 . Influence of S i , P and pH Treatm ents on YiHd of Su garcan e (Raloon C rop )H arvested at Nine M onths^
S iS i pH 5 .5 p H 5 .8 p H 6 .5 pH 5 .0 pH 6 .0
(kg/ha) F112
(kg/ha) 280 1120
P (kg/ba 112 280
)111^
P (kg/ba 112 280
)1120
P112
(kg/ba)280 1120
P (kg/ba) 0
0833
1666
1 0 7 .11 0 3 .01 3 7 .1
1 1 8 .3 1 3 1 .91 2 6 .3
1 1 8 .9 1 1 3 .61 4 4 .9
1 0 8 .7 1 0 6 .2 1 3 4 .4 1 1 8 .71 0 6 .8 1 2 2 .7
1 0 6 .61 2 3 .41 0 8 .4
1 1 9 .6 1 2 0 .5 1 1 9 .2 1 2 0 .5 1 2 6 .1 1 2 3 .0
1 2 1 .61 2 0 .51 3 5 .1
1 2 7 .0 1 3 7 .8 1 1 8 .59 1 .2
1 2 5 .01 1 1 .1
S I X p H ^ S I X P X p H ^S i pH A V G . S i P (kg/ha) A V G . P pH A V G .
(kg/ha) 5 .5 5 .8 6 .5 (ks^hn) 112 280 1120 (kg/ba) 5 .5 5 .8 6 .5
0 1 1 4 .7 1 0 7 .3 i ;f l) .5 1 1 4 .2 0 1 1 1 .8 1 1 4 .9 1 1 5 .8 1 1 4 .2 112 1 1 5 .8 1 1 6 .7 1 2 1 .6 1 1 8 .0833
1666A V G .
1 1 6 .21 3 5 .2
1 2 5 .41 1 2 .71 1 5 .1
120.11 2 8 .1
1 2 0 .51 2 5 .7120.1
•^Tons (m otH c)/heH are. ^ M e a n s of 3 observations. ^ M e a n s of 9 observations.
8331666
A V G .
1 1 8 ,91 2 3 .41 1 8 .0
1 2 3 .61 2 4 .1121.0
1 1 9 .21 2 9 .51 2 1 .4
1 2 0 .51 2 5 .7120.1
2801120
A V G .
1 2 5 .41 2 5 .9
1 1 5 .81 1 2 .71 1 5 .1
1 2 1 .41 2 5 .71 2 3 .0
121.01 2 1 .4120.1
Control Plot 4 9 .1
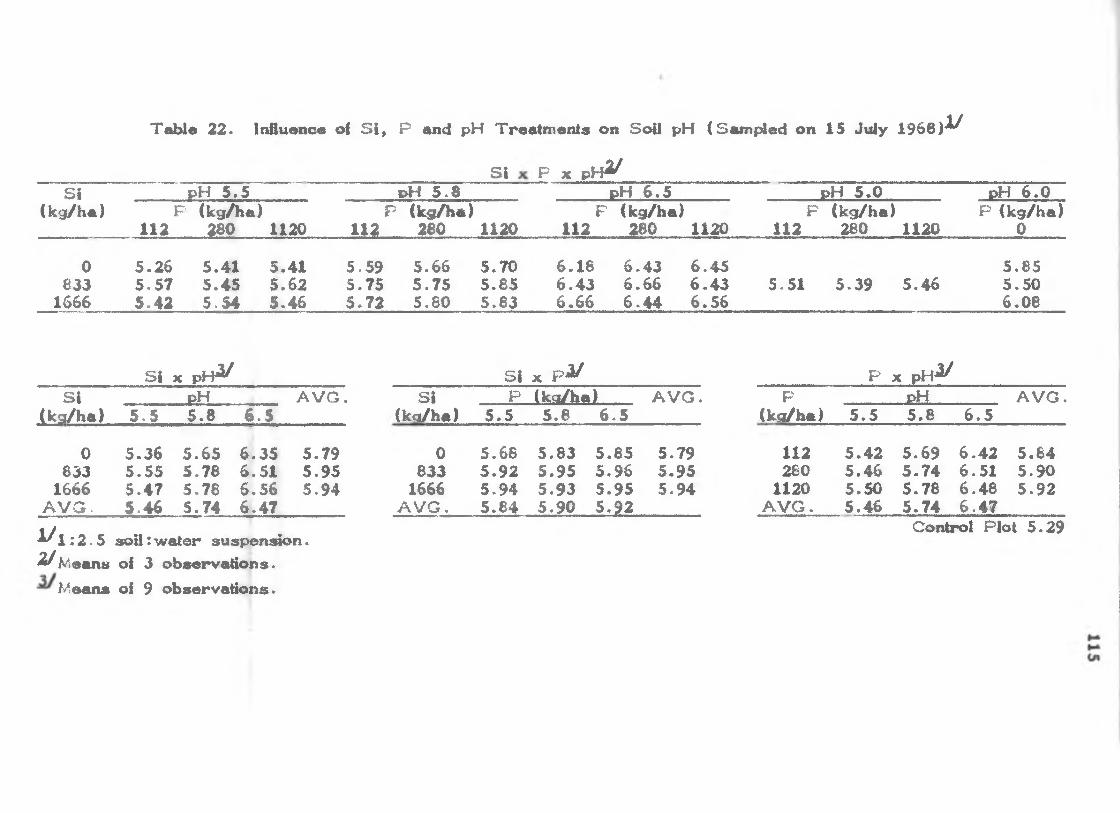
Tid>i« 2 2 . Ir^uence of S i , P and pH Traatm eids on Soil pH (Sam i^ed on I S July 1 9 6 8 ) '^
P X p H ^S iS i pH 5 .5 p H 5 .8 p H 6 .5 pH 5 .0 pH 6 .0
(kg/ha) r (kg/ha)112 280 1120
P (kg/ha) 112 280 1120
F (kg/ha)112 280 1120
p112
(kg/ha280
)1120
P (kg/ha) 0
0833
1666
5 .2 6 5 .4 1 5 .4 1 5 .5 7 5 .4 5 5 .6 2 5 .4 2 5 .5 4 5 .4 6
5 .5 95 .7 55 .7 2
5 .6 65 .7 55 .8 0
5 .7 05 .8 55 .8 3
6 .1 8 6 .4 3 6 .4 5 6 .4 3 6 .6 6 6 .4 3 6 .6 6 6 .4 4 6 .5 6
5 .5 1 5 .3 9 5 .4 65 .8 55 .5 06 .0 8
S i X p H ^ S i X v H P x p H ^S i dH A V G • S i P (ko/ha) A V G . P p H A V G .
(kg/ha) 5 .5 5 .8 6 .5 (kg/ha) 5 .5 5 .8 6 .5 (kg/ha) 5 .5 5 .8 6 .5
0833
1666A V G .
5 .3 6 5 .6 5 6 .3 5 5 .7 9 5 .5 5 5 .7 8 6 .5 1 5 .9 5 5 .4 7 5 .7 8 6 .5 6 5 .9 4 5 .4 6 5 .7 4 6 .4 7
0833
1666A V G .
5 .6 65 .9 25 .9 45 .8 4
5 .8 3 5 .8 5 5 .7 9 5 .9 5 5 .9 6 5 .9 5 5 .9 3 5 .9 5 5 -9 4 5 .9 0 5 .9 2
112280
1120A V G .
5 .4 25 .4 6 5 .5 05 .4 6
5 .6 95 .7 4 5 .7 85 .7 4
6 .4 2 5 .8 4 6 .5 1 5 .9 0 6 .4 8 5 .9 2 6 .4 7
^ 1 ; 2 . 5 so il:w ater suspenston.Control Plot 5 .2 9
^ M ea n a of 3 observations.Means of 9 observation *.

Table 2 3 . Influence of S i , P and pH Treatm ents on W d er-E xtractab le So il S i (Sam pled on 15 July 1 9 5 8 } ^
W T . ' s ‘i F T T TS i X P X p H ^
pU 6 . 5 “ pH 6 . 0(kg/ha) ]
112P (kg/ha)
280 1120F (kg/ha)
112 2B0 1120P (kg/ha)
112 280 1120p
112(kg/ha)
280 1120P (kg/ha)
0
0 0 .4 9 0 .6 2 0 .5 6 0 .5 0 0 .4 6 0 .6 6 0 .4 1 0 .4 3 0 .5 7 0 .4 9633 1 .3 1 1 .5 1 1 .5 1 1 .3 4 1 .1 8 1 .2 9 0 .9 7 0 .9 7 0 .9 0 1 .2 6 1 .1 2 1 .1 2 1 .1 2
1666 2 .3 1 2 .2 1 2 .1 5 1 .9 5 1 .7 8 1 .8 8 1 .3 2 1 .4 4 1 .5 3 1 .1 2
S i x p H ^ S i X P X p H ^S i dH A V G « S i P (kci/ha) A V G . P pH A V G .
(kg/ha) 5 .5 5 .8 6 .5 (kg/ha) 112 260 1 1 ^ (kg/ba) 5 .5 5 .6 6 .5
0 0 .5 6 0 .5 5 0 .4 7 0 .5 3 0 0 .4 7 0 .5 0 0 .6 1 0 .5 3 112 1 .3 7 1 .2 7 0 .9 0 1 .1 8833 1 .4 4 1 .2 7 0 .9 5 1 .2 2 833 1 .2 1 1 .2 2 1 .2 3 1 .2 2 280 1 .4 5 1 .1 4 0 .9 5 1 ,1 8
1666 2 .2 2 1 .8 7 1 .4 3 1 .8 4 1666 1 .8 6 1 .8 1 1 .8 5 1 .8 4 1120 1 .4 1 1 .2 8 1 .0 0 1 .2 3A V G . 1 .4 1 1 .2 3 0 .9 5 A V G . 1 .1 8 1 .1 8 1 -2 3 A V G . 1 .4 1 1 .2 3 0 .9 5
■ ^ E xp ressed as ppm S i in 1 :1 0 s o ll:w d e r extraust.^ M e a n s of 3 observations.
Means of 9 observations.
Control Plot 0 .5 0
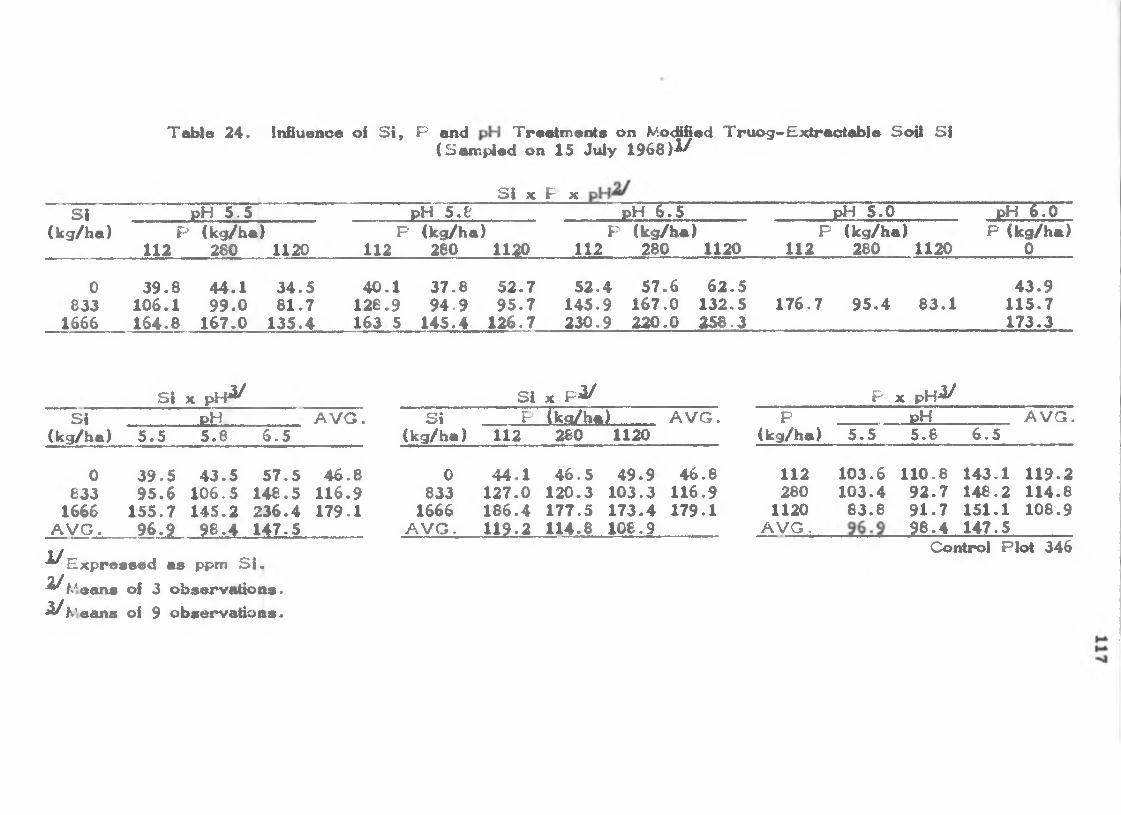
Td>ls 2 4 . Influence of S i , P and Treatm ents on Mo<fified T ru og -£xtractd > ie So il S i(Sam pled on 15 July 1968)2/
S i X F XS i pH 5 .5 1 pH 5 .8 pH 6 .5 pH 5 .0 pH 6 . 0
(kg/ha) F112
(kg/ha) F (kg/ha)280 1120 112 280 1120
F (kg/ha)112 280 1120
P112
(kg/h«280
:)1120
F (kg/ha) 0
0833
1666
3 9 .81 0 6 .11 6 4 .8
4 4 .19 9 .0
1 6 7 .0
3 4 .5 4 0 .1 3 7 .8 8 1 .7 1 2 8 .9 9 4 .9
1 3 5 .4 163 5 1 4 5 .4
5 2 .79 5 .7
1 2 6 .7
5 2 .4 5 7 .6 6 2 .51 4 5 .9 1 6 7 .0 1 3 2 .52 3 0 .9 2 ^ . 0 2 5 8 .3
1 7 6 .7 9 5 .4 8 3 .14 3 .9
1 1 5 .71 7 3 .3
S i X p H ^ S i X p2/ F ;X p H ^S i dH A V G . S i F (kc/ha) A V G . P pH A V G .
(kg/ha) 5 .5 5 .8 6 .5 (kg/ha) 112 280 1120 (kg/ha) 5 .5 5 .8 6 .5
0633
1666A V G .
3 9 .59 5 .6
1 5 5 .79 6 .9
4 3 .51 0 6 .51 4 5 .2
9 8 .4
5 7 .5 4 6 .8 0 1 4 8 .5 1 1 6 .9 8332 3 6 .4 1 7 9 .1 16661 4 7 .5 A V G .
4 4 .11 2 7 .01 8 6 .41 1 9 .2
4 6 .5 4 9 .9 4 6 .8 1 2 0 .3 1 0 3 .3 1 1 6 .91 7 7 .5 1 7 3 .4 1 7 9 .11 1 4 .6 1 0 8 .9
112280
1120A V G ,
1 0 3 .61 0 3 .4
8 3 .8.....
1 1 0 .89 2 .79 1 .7 ? 8 .4
1 4 3 .1 1 1 9 .21 4 8 .2 1 1 4 .8 1 5 1 .1 1 0 8 .9 1 4 7 .5
2/ E xp ressed as ppm S i .2//.<®ans of 3 o b serv d io n s.^ K'eans of 9 observation s.
Control Plot 346
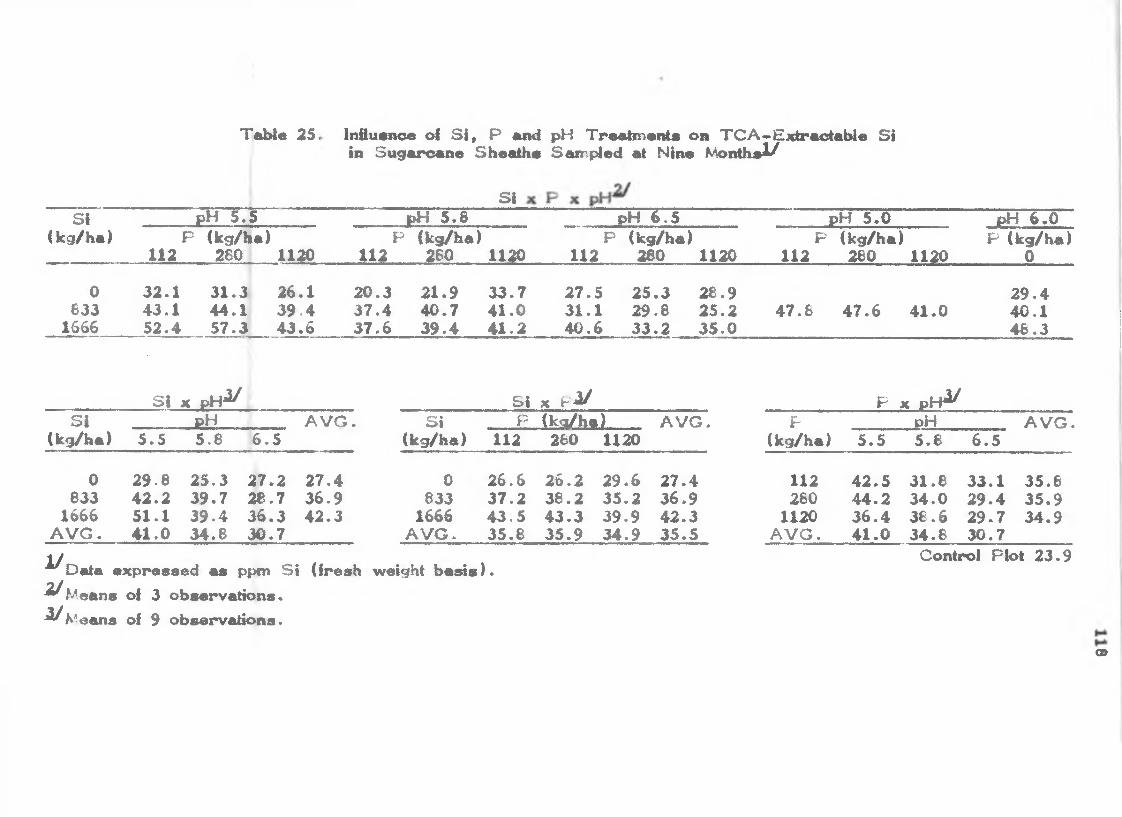
Table 25. Influence of S I , P and pH Treabnenta on T C A -E xtrao tab le S i in Su garcane Sheathe Sam pled at Nine M onths^
S IS i pH 5 .5 pH 5 .8 pH 6 .5 pH 5 .0 pH 6 .0
(kg/ha) P (kg/ha)112 280 1120
P (kg/ha)l i a 260 1120
P (kg/ha)112 280 1120
P112
(kg/ha)280 1120
P (kg/ha) 0
0833
1666
3 2 .1 3 1 .3 2 6 .14 3 .1 4 4 .1 3 9 .4 5 2 .4 5 7 .3 4 3 .6
2 0 .33 7 .4 3 7 .6
2 1 .94 0 .73 9 .4
3 3 .74 1 .04 1 .2
2 7 .5 2 5 .3 2 8 .9 3 1 .1 29 -8 2 5 .24 0 .6 3 3 .2 3 5 .0
4 7 .8 4 7 .6 4 1 .02 9 .44 0 .14 8 .3
S I X p H ^ S i X p i/ P X p H ^S I pH A V G • S i P (k<^ha) A V G . P p H A V G .
(kg/ha) 5 .5 5 .8 6 .5 (kg/ha) 112 280 1120 (kg/ha) 5 .5 5 .8 6 .5
0833
1666A V G .
2 9 .8 2 5 .3 2 7 .2 2 7 .4 4 2 .2 3 9 .7 ^ . 7 3 6 .9 5 1 .1 3 9 .4 3 6 .3 4 2 .3 4 1 .0 3 4 .8 3 0 .7
0833
1666A V G .
2 6 .63 7 .24 3 .53 5 .8
2 6 .2 2 9 .6 2 7 .43 8 .2 3 5 .2 3 6 .94 3 .3 3 9 .9 4 2 .3 3 5 .9 3 4 .9 3 5 .5
112280
1120A V G .
4 2 .54 4 .23 6 .44 1 .0
3 1 .8 3 4 .0 3 8 .63 4 .8
3 3 .1 3 5 .6 2 9 .4 3 5 .92 9 .7 3 4 .93 0 .7
'^ D a ta exp ressed as ppm S i (fresh weight b a s is ) .^ Means of 3 observations.^ M e a n s of 9 observations.
Control Plot 2 3 .9
CD

Table 2 6 . Influence of S i , P and pH Treatm ents on S i in Su garcan e Sheidhs Sam H ed at Nine M onths^
S i pH 5 .5 pH 5 .8 pH 6 .5 pH 5 . 0 p H 6 .0(kg/ha) 1
112P (kg/ha)
280 11201
112(kg/ha)
280 1120P (kg/ha)
112 280 1120P
112(kg/ha)
280 1120P (kg/ha)
0
0833
1666
227840705417
2444 24133976 3656 5846 4829
197539864377
190743054835
302545465030
2146 2418 2302 3150 3150 2928 4636 4044 4820
4325 4131 3728215138495270
S i :« p H ^ S i X P X p H ^S i dH A VG S i F (kc/ha) A V G . P dH A V G .
(kg/ha) 5 .5 5 .8 6 .5 (kg/ha) 112 280 1120 (kg/ha) 5 .5 5 .6 6 .5
0833
1666A V G .
2362390153643882
2303 2289 2324 4279 3075 3752 4747 4500 4871 3777 3288
0833
1666A V G .
2136373548103560
2257 2580 2324 3811 3710 3752 4909 4893 4671 3659 3726
112280
1120A V G .
3925408936333882
3446368342003777
3310 3560 3204 3659 3350 3728 3288
-^ E x p re sse d as ppm S i .^ M e a n s of 3 observations.^ M o a n s of 9 observ ation s.
VO
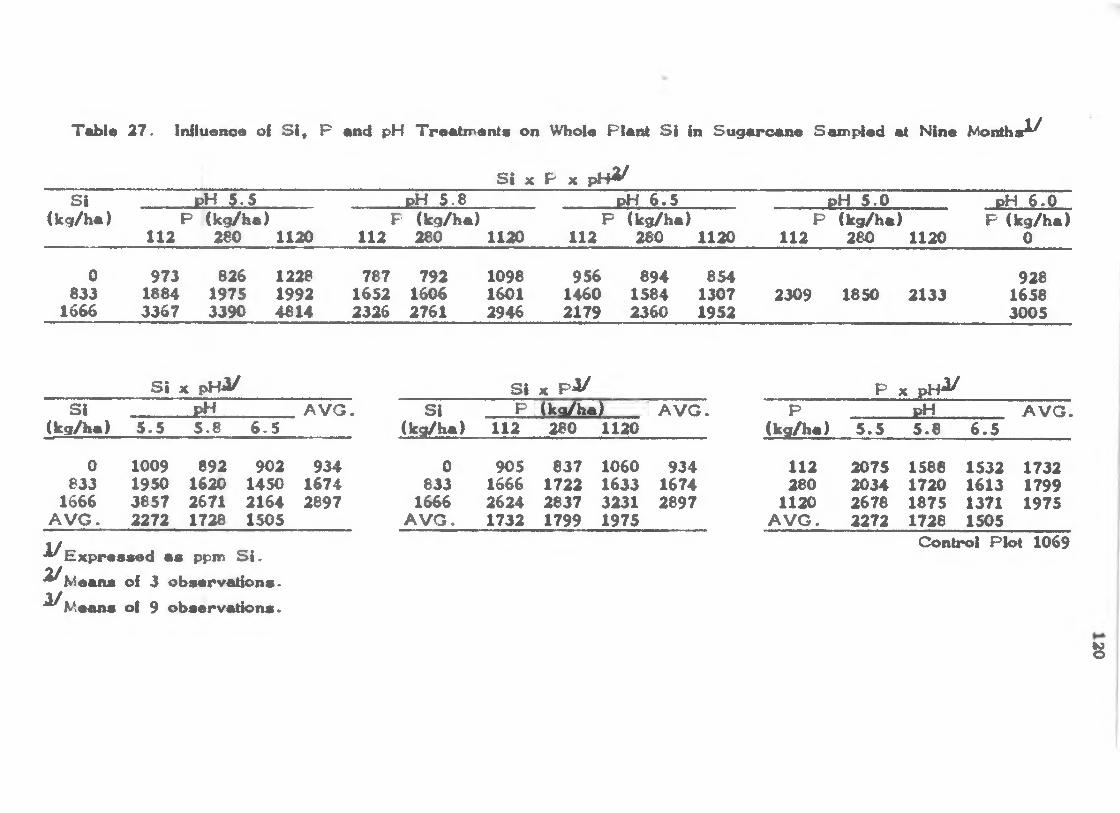
Table 2 7 . Influence of S i , F and pH Treatm eids on Whole Plaid S i in Su garoane Sem H ad at Nine M oidhs^
S i X P X p H ^S i
(fcg/ha)pH 5 .5 dH 5 .8 dH 6 .5 p H 5 .0 oH 6 .0
P (kg/ha) 112 280 1120
F112
(kg/ha)280 1120
P112
(kg/ha)280 1120
P (kg/ha)112 280 1120
P (kg/ha) 0
0 973 826 1228 787 792 1098 956 894 854 928833 1884 1975 1992 1652 1606 1601 1460 1584 1307 2309 1850 2133 1658
1666 3367 3390 4814 2326 2761 2946 2179 2360 1952 3005
S i X pHi/ S i X P ’ / P X p H ^S i -J>H A V G . S i P I C 5 M Q E 8 H A V G . P p H A V G .
(kg/ha) 5 .5 5 .8 6 .5 (ks^ha) 112 280 1120 (kg/ha) 5 .5 5 .8 6 .5
0833
1666A V G .
1009195038572272
892162026711728
902145021641505
93416742897
0833
1666A V G .
905166626241732
837172228371799
1060163332311975
93416742897
112280
1120A V G .
2075203426782272
1586172018751728
1532161313711505
173217991975
1 /Vy
E xp ressed a s ppm S i .Means of 3 observations.Means of 9 observation s.
Control Plot 1069
8

Table 2 8 . Influence of S i , F and pH Treidm ents on S i U|4ake in Su garcan e Sam pled at Nine M onths^
S i X F X p H ^S i pH a .a ...— w n r r - ' - -.......... ............. ypr 1 3 - - ■ W T J T -------- .........pl=( O
(kg/ha) P (kg/ha) 112 280 1120
P (kg/ha) P (kg/ha)112 280 1120 112 280 1120
P112
(kg/ha)280 1120
P (kg/ha) 0
0833
1666
2 4 .6 2 5 .14 6 .7 6 3 .8
1 2 1 .0 1 2 3 .1
3 8 .85 9 .1
140 .7
2 3 .2 2 1 .65 7 .2 5 0 .1 5 9 .4 8 8 .1
2 9 .5 3 0 .6 2 9 .2 2 9 .25 4 .0 4 6 .8 6 2 .4 3 9 .38 5 .1 7 5 .5 7 9 .5 7 6 .1
8 1 .2 6 2 .2 6 4 .12 0 .95 4 .38 3 .6
S i X p H ^ S i X P i/ P X p H ^S i dH A V G . S i P (ko/ha) A V G . P dH A V G
(kg/ha) 5 .5 5 .8 6 .5 (kg/ha) 112 280 1120 (kg/ha) 5 .5 5 .8 6 .5
0833
1666A V G .
2 9 .5 2 4 .8 2 9 .7 5 7 .2 5 3 .8 4 9 .5
1 2 8 .3 7 7 .5 7 7 .0 7 1 .7 5 2 .0 5 2 .1
2 8 .0 5 3 .5 9 4 .3
0833
1666A V G .
2 6 .1 2 5 .3 3 2 .5 2 8 .0 5 0 .9 5 8 .8 5 0 .8 5 3 .5 8 5 .3 9 6 .9 1 0 0 .6 9 4 .35 4 .1 6 0 .3 6 1 .3
112280
1120A V G .
6 4 .8 4 6 .67 0 .7 5 3 .3 7 9 .5 5 6 .27 1 .7 5 2 .0
5 1 .05 7 .0 4 8 .25 2 .1
5 4 .16 0 .36 1 .3
Ex|»*esaed a s kg/ha S i .2/^ Means of 3 observ ation s.'^ M ean s of 9 observation s.
Control Plot 1 3 .0
K>
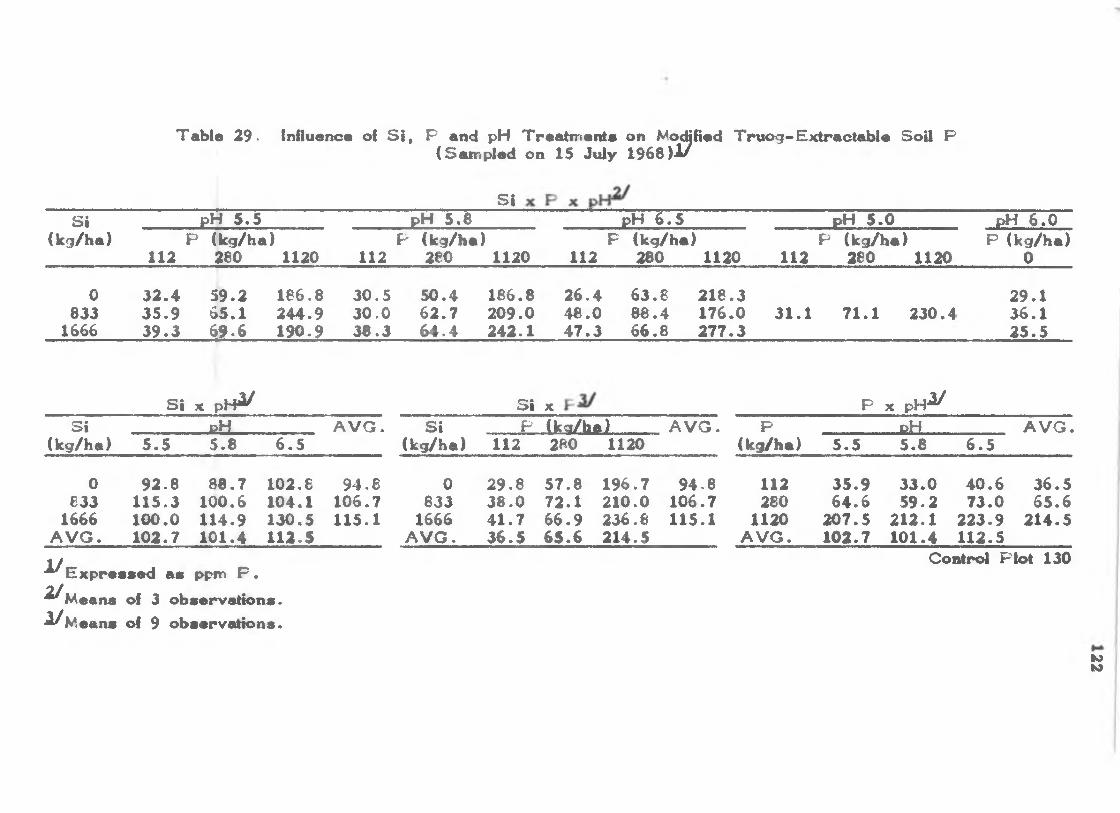
T able 2 9 . influence of S i , P and pH Treatm ente on MocBfled T ru og -E xtractab le Soil P(Sam pled on IS July 1968)1/
S IS i pH 5 .5 pH 5 .8 pH 6 .5 pH 5 .0 pH 6 .0
(kg/ha)112
P (kg/h« 280
i)1120 112
P (kg/ha)280 1120
F (kg/ha)112 280 1120 112
P (kg/ha)280 1120
P (kg/ha) 0
0833
1666
3 2 .43 5 .93 9 .3
5 9 .26 5 .16 9 .6
166-82 4 4 .91 9 0 .9
3 0 .53 0 .03 8 .3
5 0 .4 6 2 .76 4 .4
1 6 6 .82 0 9 .02 4 2 .1
2 6 .4 6 3 .S 2 1 8 .3 4 8 .0 8 8 .4 1 7 6 .0 3 1 .1 4 7 .3 6 6 .8 2 7 7 .3
7 1 .1 2 3 0 .42 9 .13 6 .1 2 5 .5
S i X p H ^ S i X P X p H ^S i dH A V G . S i P (ka/ha) A V G . P p H A V G .
(kg/ha) 5 .5 5 .8 6 .5 (kg/ha) 112 280 1120 (kg/ha) 5 .5 5 .8 6 .5
0833
1666A V G .
9 2 .81 1 5 .31 0 0 .01 0 2 .7
8 8 .71 0 0 .61 1 4 .91 0 1 .4
1 0 2 .81 0 4 .11 3 0 .51 1 2 .5
9 4 .81 0 6 .71 1 5 .1
0833
1666A V G .
2 9 .83 8 .04 1 .73 6 .5
5 7 .8 1 9 6 .7 9 4 .8 112 7 2 .1 2 1 0 .0 1 0 6 .7 2806 6 .9 2 3 6 .8 1 1 5 .1 1120 6 5 .6 2 1 4 .5 A V G .
3 5 .96 4 .6
2 0 7 .51 0 2 .7
3 3 .05 9 .2
2 1 2 .11 0 1 .4
4 0 .6 3 6 .5 7 3 .0 6 5 .6
2 2 3 .9 2 1 4 .5 1 1 2 .5
'^ E x p re s s e d a s ppm P .2/^ Means of 3 observations.■l^Means of 9 observations.
Control P lot 130
loK>

S i X P X p H ^
Table 3 0 . Influenoe of S i , P and pH Treatm ents on P in Su garoan e Sh eath sSam pled at Nine M onths^
S i dH 5 .5 dH 5 .8 pH 6 .5 pH 5 .0 dH 6 .0(kg/ha) P (kg/ha)
112 280 1120P (kg/h<
112 280i )1120
P (kg/ha) 112 280 U 2 0
P (kg/ha) 112 280 1120
P (kg/ha) 0
0833
1666
636 855 909 672 M l 994 M l M l
624 7 S t 666 149 g
727 872 1091 752 764 958
721 1066654 685 806
1224686600
S i x o H ^ S i X P3/ P X p H ^S i pH A V G S i p (ko/ha) A V G . P, pH A V G .
(kg/ha) 5 .5 5 .8 6 .5 (kg/ha) 112 280 1120 (kg/ha) 5 .5 5 .8 6 .5
0833
1666A V G .
800 640 897 786 < 820 825 832 838 879 806 833 867
646810850
0833
1666A V G .
662697711690
826 1046 846 732 1002 610 780 1058 850 780 1069
112 666 280 810
1120 941 A V G . 806
628744
1127833
776 690 786 780
1038 1069 867
■^Dala exp ressed a s ppm P ..'2/ ^
. Means of 3 observations. -V^M eans of 9 observations.
Control P lot 400
I -'3 '
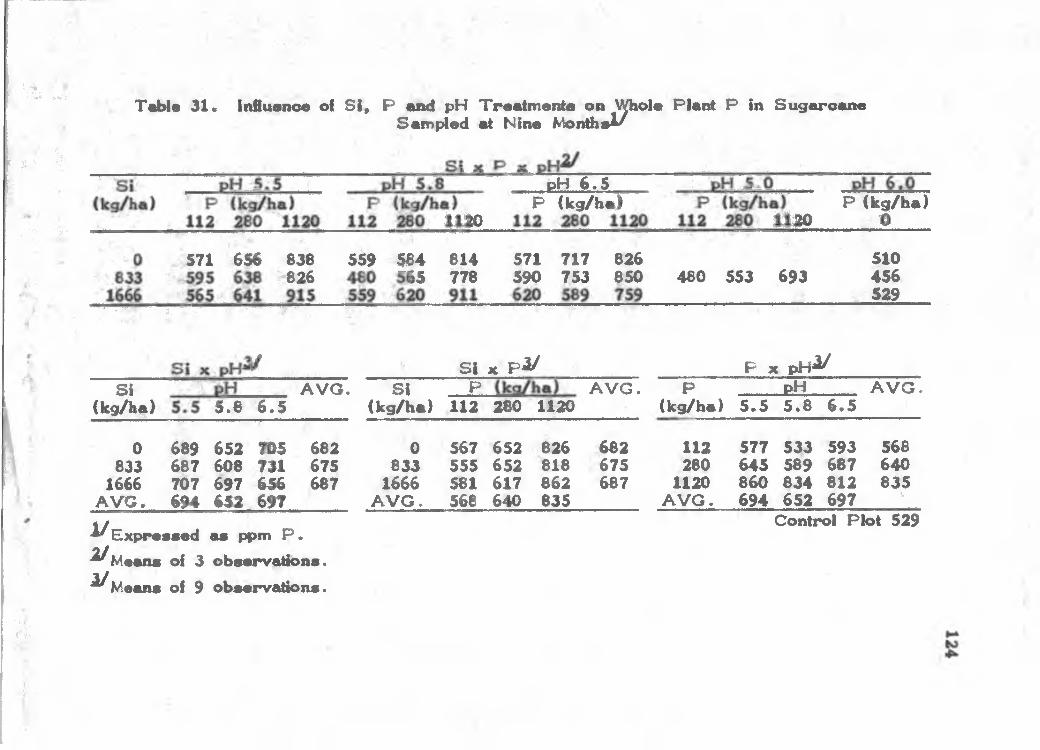
: ■ V - •• ••
Xf.r ■'‘ U-v ■j.Af'r'
"1,, |i: .}l ’’ X'
"•■•■ ■ ■ ' i,-■ X.v4,. .
Table 31* Influenoe of S i , P tuuf pH Treatm ente on \^ole Plant P in S u g arcan el e ^Sam pled ®t Nine Mo nth i
pH 6 .5 P ikg/hmS
i H 9 - ......
571 656 838 559 584 814 571 717 826
P (kg/ha)i t e L «
826 15 778 590 753 850 480 553 693510456529
■■ -
'
•3. -■ ■'
/ I.,- S i X P ^ P X p H ^S i A V O . S I P A V G . P pH A V G -
(kg/ha) 5 .8 6 .5 (kg/he) 112 280 1120 (kg/ha) 5 .5 5 .8 6 .5
0 689 652 l i s 682 0 567 652 826 682 112 577 533 593 566833 687 608 731 675 833 555 652 818 675 280 645 589 687 640
1666 707 697 656 687 1666 581 617 862 667 1120 860 834 812 835A V G . 694 6£1 697 A V G . 568 640 835 A V G . 694 652 697 'V
■^Expreeeed ae ppm P . ^ M ean a of 3 observ ation s.
Control P lot 529
1 / Means of 9 ob serv ation s.
■"v■'SXf!
'r- ■'
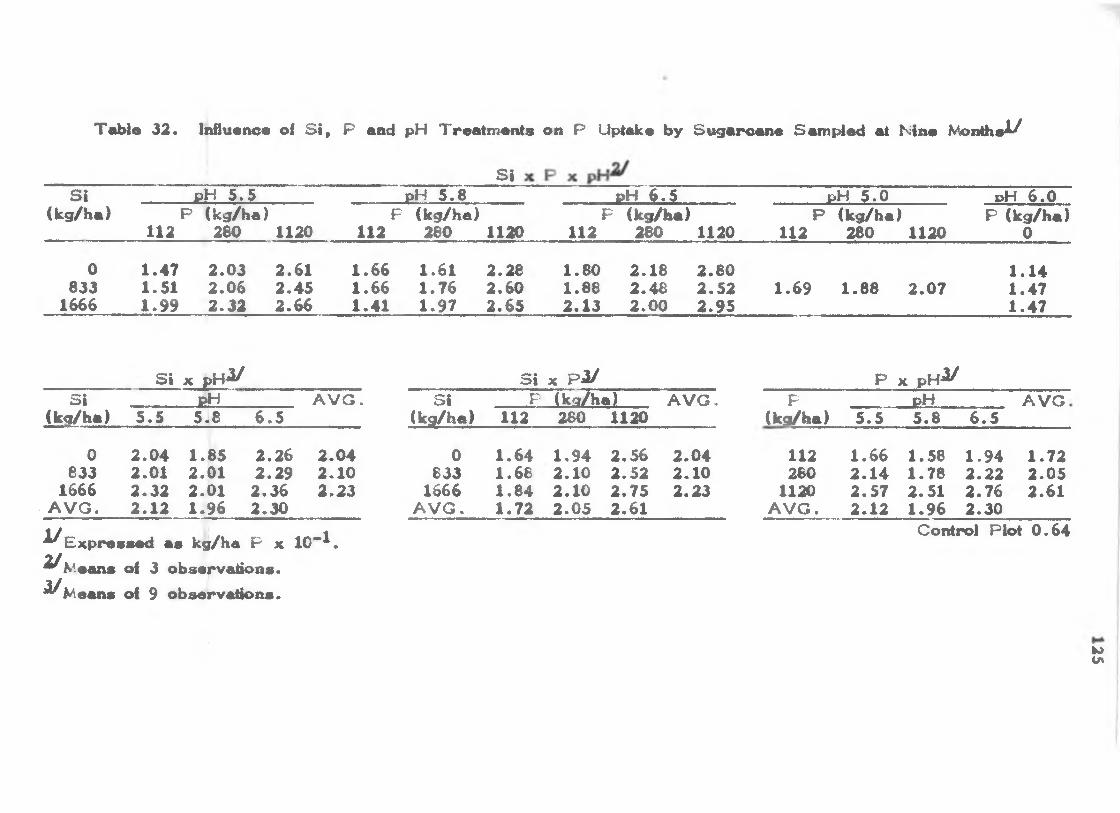
Table 3 2 . Influence of S i , P and pH Treatm eftis on P Uptake by Su g arcan e Sam pled at Nine Monihe<^
S iS i
(kg/ha)p H 5 .5 p H 5 .8 pH 6 .5 pH 5 .0 pH 6 .0
112P (kg/ha) P
280 1120 112(kg/ha)280 1120
P (kg/ba)112 280 1120
P112
(kg/ha280
)1120
P (kg/ha) 0
0 1 .4 7 2 .0 3 2 .6 1 1 .6 6 1 .6 1 2 .2 8 1 .8 0 2 .1 8 2 .8 0 1 .1 4833 1 .5 1 2 .0 6 2 .4 5 1 .6 6 1 .7 6 2 .6 0 1 .8 8 2 .4 8 2 .5 2 1 .6 9 1 .8 8 2 .0 7 1 .4 7
1666 1 .9 9 2 .3 2 2 .6 6 1 .4 1 1 .9 7 2 .6 5 2 .1 3 2 .0 0 2 .9 5 1 .4 7
S i X p H ^ S i X p i/ P X pHi/S i pH A V G . S i F (kg/ha) A V G , P pH A V G
(kg/ha) 5 .5 5 .8 6 .5 (kg/ha) 112 260 1120 (kg/ba) 5 .5 5 .8 6 .5
0 2 .0 4 1 .8 5 2 .2 6 2 .0 4 0 1 .6 4 1 .9 4 2 .5 6 2 .0 4 112 1 .6 6 1 .5 8 1 .9 4 1 .7 2833 2 .0 1 2 .0 1 2 .2 9 2 .1 0 833 1 .6 8 2 .1 0 2 .5 2 2 .1 0 260 2 .1 4 1 .7 8 2 .2 2 2 .0 5
1666 2 .3 2 2 .0 1 2 .3 6 2 .2 3 1666 1 .8 4 2 .1 0 2 .7 5 2 .2 3 1120 2 .5 7 2 .5 1 2 .7 6 2 .6 1A V G . 2 .1 2 1 .9 6 2 .3 0 A V G . 1 .7 2 2 .0 5 2 .6 1 A V G . 2 .1 2 1 .9 6 2 .3 0
^ E x p r e e a e d ae kg/ha P x 1 0 *1 . 2/^ Means of 3 observations.^ M e a n s of 9 observations.
Control Plot 0 .6 4
»oOf
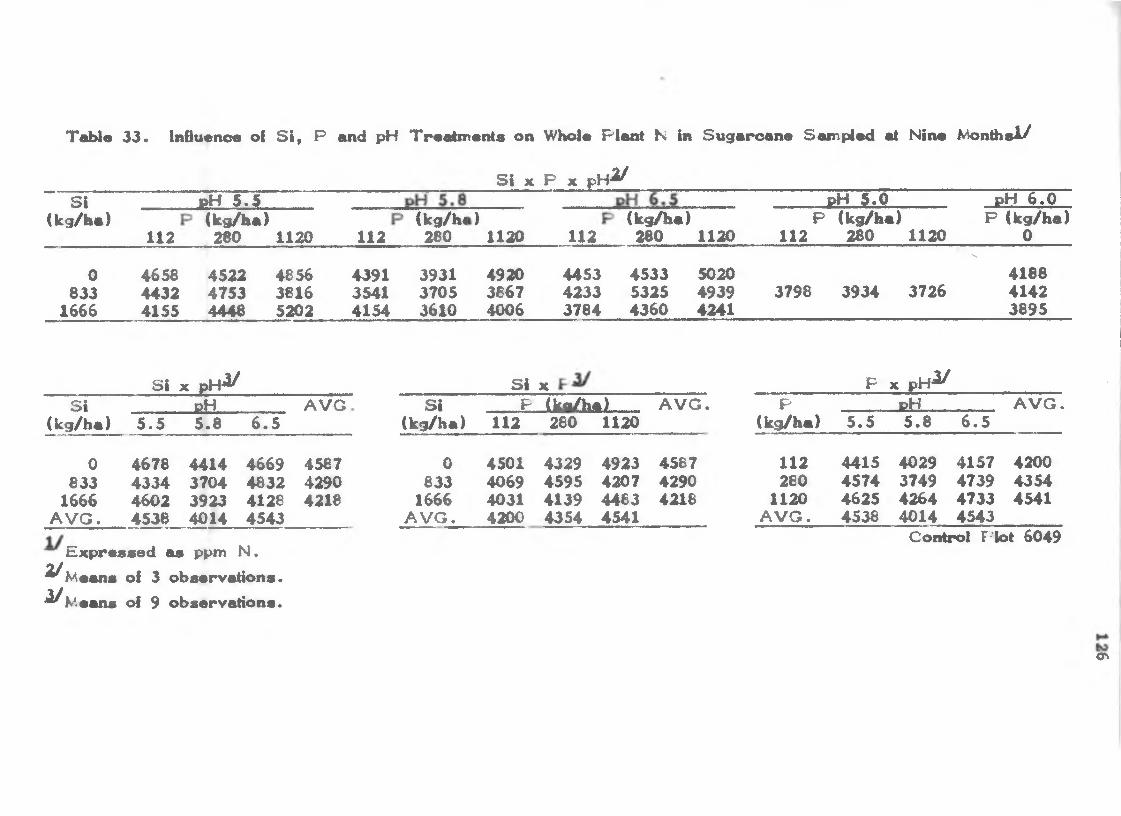
Table 3 3 . Influence of S i , P and pH Treatm ei^s on Whole Plant N in Su g arcan e Sampled at Nine Months!/
S i X P X pH2 Jp H 6 .0
P (kg/ha) 0
S I(kg/ha)
-EH -5x1
112(kg/ha)
280 1120 112(kg/hi
280)
1120(k ^ h a )
112 280 1120
j± m LP (kg/ha)
112 280 1120
0833
1666
465844324155
4522 4856 4753 3816 4448 5202
439135414154
393137053610
492036674006
4453 4533 5020 4233 5325 4939 3784 4360 4241
3798 3934 3726
N.
418841423895
S i X p H ^ S i X F X p H ^S i dH A VG S i P (ko/ha) A V G . F p H A V G .
(kg/ha) 5 .5 5 .8 6 .5 (kg/ha) 112 280 1120 (kg/ha) 5 .5 5 .8 6 .5
0 4678 4414 4669 4587 0 4501 4329 4923 4587 112 4415 4029 4157 4200833 4334 3704 4832 4290 833 4069 4595 4207 4290 280 4574 3749 4739 4354
1666 4602 3923 4128 4218 1666 4031 4139 4483 4218 1120 4625 4264 4733 4541A V G . 4536 4014 4543 A V G . 4200 4354 4541 A V G . 4538 4014 4543
E xp ressed as ppm N.2/^ Means of 3 observations.^ M e a n s of 9 observations.
Control Plot 6049
cn
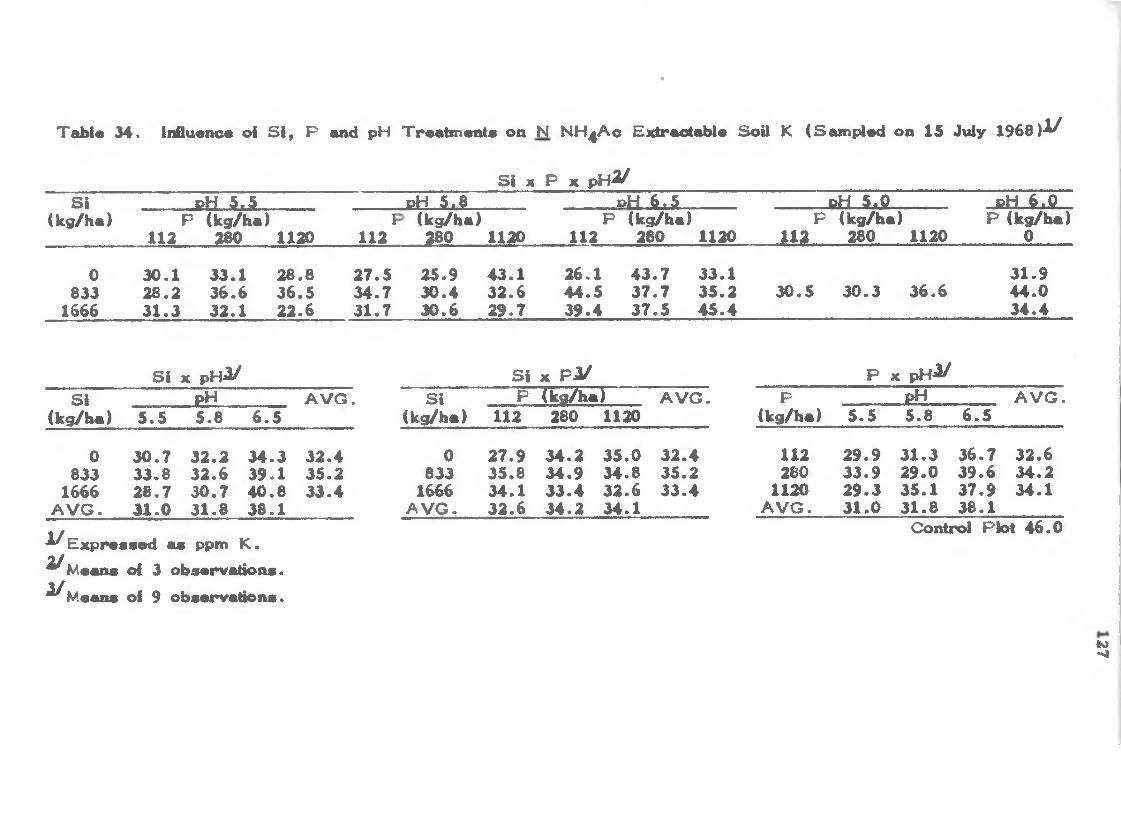
T ab le 34 . IHluence of S i , P and pH Treatm etds on
S i X
•
N NH4A 0 Eidraotable SoU K (Sam pled
P X p H ^
on 15 July 1 9 6 8 ) ^
S i(kg/ha)
dH 5 .5 dH 5 .8 dH 6 .5 oH 5 .0 dH 6 .0P (kg/ha)
112 280 1120J
112(kg^ha)
280 1120P (kg/ha)
112 280 1120P
112(kg/ha)
280 1120P (kg/ha)
0
0 3 0 .1 3 3 .1 2 8 .8 2 7 .5 2 5 .9 4 3 .1 2 6 .1 4 3 .7 3 3 .1 3 1 .9833 2 8 .2 3 6 .6 3 6 .5 3 4 .7 3 0 .4 3 2 .6 4 4 .5 3 7 .7 3 5 .2 3 0 .5 3 0 .3 3 6 .6 4 4 .0
1666 3 1 .3 3 2 .1 2 2 .6 3 1 .7 3 0 .6 2 9 .7 3 9 .4 3 7 .5 4 5 .4 3 4 .4
S i X p H ^ S i X p y P X p H ^S i pH A V G • S i P (kg/ha) A V G . P pH A V G .
(kg/ha) 5 .5 5 .8 6 .5 (kg/ha) 112 280 1120 (kg/ha) 5 .5 5 .8 6 .5
0 3 0 .7 3 2 .2 3 4 .3 3 2 .4 0 2 7 .9 3 4 .2 3 5 .0 3 2 .4 112 2 9 .9 3 1 .3 3 6 .7 3 2 .6833 3 3 .8 3 2 .6 3 9 .1 3 5 .2 833 3 5 .8 3 4 .9 3 4 .8 3 5 .2 280 3 3 .9 2 9 .0 3 9 .6 3 4 .2
1666 2 8 .7 3 0 .7 4 0 .8 3 3 .4 1666 3 4 .1 3 3 .4 3 2 .6 3 3 .4 1120 2 9 .3 3 5 .1 3 7 .9 3 4 .1A V G . 3 1 .0 3 1 .8 3 8 .1 A V G . 3 2 .6 3 4 .2 3 4 .1 A V G . 3 1 .0 3 1 .8 3 8 .1
-^ E x p re sse d a s ppm K .2/^ Maans of 3 observations.
Coidrol Pk>t 4 6 .0
y Means of 9 observation s.
K>-a

T aU e 3 5 . Influanoe of S i , P and pH Traatm ents on K in Su g arcan e Sheathe Samfided at Nine Montite^/
p H ^S i X P XS i
(kg/ha)pH 5 .5 pH 5 .8 pH 6 .5 pH 5 .0 pH 6 .0
1112
(kg/ha)280 1120
I112
(kg/ha)280 1120
P (kg/ha)112 280 1120
P112
(kg/ha)280 1120
P (kg/ha) 0
0 1.45 1 .24 1.18 1 .14 1.54 1.34 1 .55 1 .49 1 .44 1 .8 8833 1.20 1.21 1.21 1.52 1.38 1.21 2 .02 1 .64 1.50 1 .42 1.67 1 .35 1.61
1666 1.68 1.15 1 .54 1.51 1.40 1.29 1.61 1 .43 1 .33 1.46
S i X p h I/ S i X P J« pH ^S i p H A V G * S i P (ko/ha) A V G . P pH A V G .
(kg/ha) 5 .5 5 .8 6 .5 (kg/ha) 112 280 1120 (kg/ha) 5 .5 5.8 6 .5
0 1.29 1.34 1.49 1.37 0 1.38 1.42 1 .32 1.37 112 1.44 1.39 1.73 1.52833 1.21 1.37 1 .72 1.43 833 1.58 1.41 1.31 1.43 280 1.20 1.44 1.52 1 .39
1666 1.46 1.40 1 .46 1 .44 1666 1.60 1 .33 1 .39 1 .44 1120 1.31 1.28 1 .42 1 .34A V G . 1 .32 1.37 1 .56 A V G . 1.52 1 .39 1 .34 1 .42 A V G . 1.32 1.37 1.56
‘ E x p r e s s e d ae % K .2/^ Means of 3 observations. ^ M e a n s of 9 observations.
Control Plot 1 .1 7
to
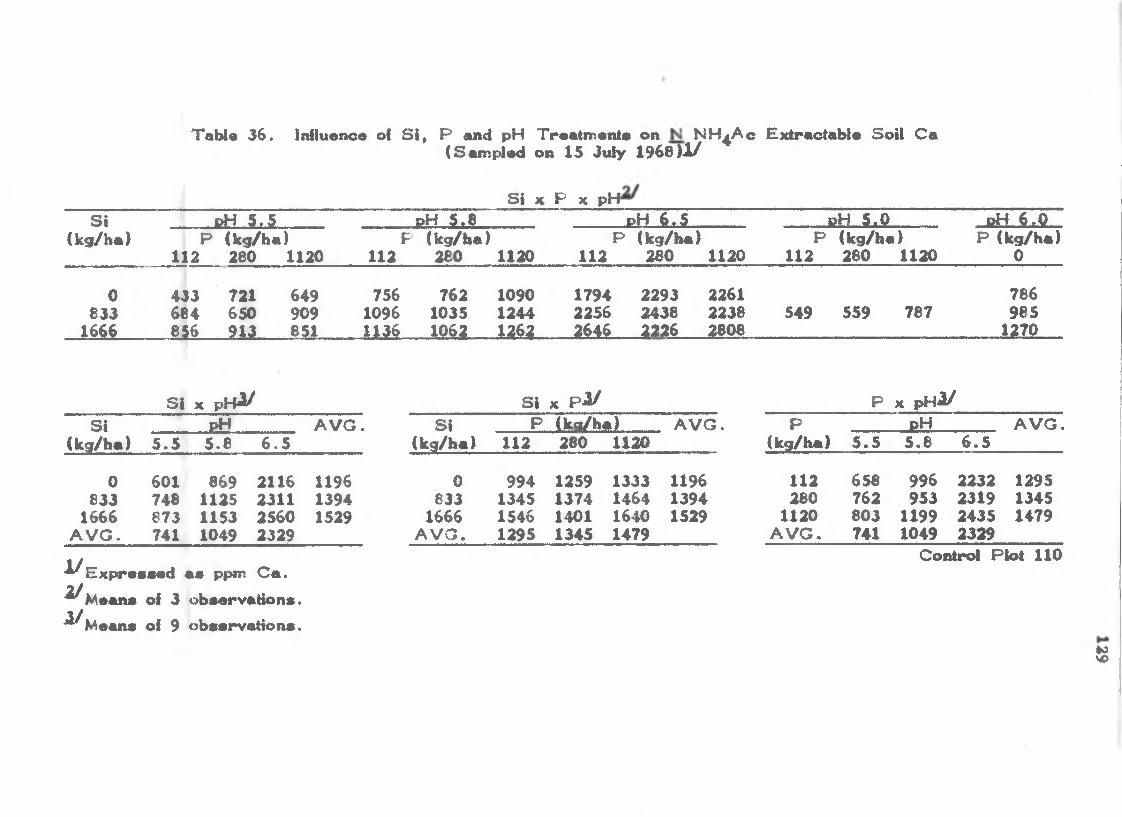
Table 36 . Influence of S i , P and pH Treatm ente on NH^Ac E xtractaU e So il C a(Sam pled on 15 July 1968)1/
S i X P X pHS i dH 5 .5 pH 5 .8 p H 6 .5 p H 5 .0 p H 6 . 0
(kg/ha)112
P (kg/ha)280 1120
P (kg/ha) 112 280 1120
P (kg/ha)112 280 1120
P112
(kg/ha280
)1120
P (kg/ha) 0
0833
1666
433684856
721 649650 909 913 851
75610961136
76210351062
109012441262
1794 2293 2261 2256 2438 2238 2646 2226 2808
549 559 787786985
1270
S I X pHl/ S i X P ^ P X pHi/S i p H A VG • S i P (kg/ha) A V G . P pH A V G .
(kg/ha) 5 .5 5 .8 6 .5 (kg/ha) 112 280 1120 (kg/ha) 5 .5 5 .8 6 .5
0833
1666A V G .
601748873741
869 2116 1125 2311 1153 2560 1049 2329
119613941529
0833
1666A V G .
994134515461295
1259 1333 1374 1464 1401 1640 1345 1479
119613941529
112280
1120A V G .
658762803741
996953
11991049
2232231924352329
129513451479
Vyy
E xp ressed a s ppm C a .Means of 3 observation s.Means of 9 observations.
Control Plot 110
loVO

Table 37 . Influence of S i , P and pH Treatm ents on C a in Su garcan e Sheaths Sam pled at Nine M onths^
S i X P X pH^/S i pH 5 .5 pH 5 .8 pH 6 .5 pH 5 .0 pH 6 .0
(kg/ha) !112
F (kg/ha)280 1120 112
P (kg/ha 280
)1120
P (kg/ha)112 280 1120
P112
(kg/ha) P (kg/ha) 280 1120 0
0633
1666
.3 1 2
.345
.283
.3 2 4 .334
.328 .317
.3 7 2 .312
.356
.3 2 4
.325
.308
.346
.313
.359
.339
.342
.399
.352
.369
.388 .366
.366 .395
.3 6 9 .4 0 7.316 .2 6 0 .2 9 3 .304
.310
S i X pHi/ S i X p i/ P X pHi/S i pH A V G . S i P (kci/ha) A V G . P p H A V G .
(kg/ha) 5 .5 5 .8 6 .5 (kg/ha) 112 280 1120 (kg/ha) 5 .5 5 .8 6 .5
0833
1666A V G .
.3233
.3297
.3224
.3251
.3411 .3840 .
.3365 .3710 .
.3268 .3818 .
. 3348 .3789
349534573437
0833
1666A V G .
.3556
.3402
.3258
.3405
.3398
.3467
.3512
.3459
.3531 .3495
.3503 .3457
.3539 .3437
.3524
112280
1120A V G .
.3 133 .3350 .3733
.3411 .3225 .3741
.3210 .3468 .3895
.3251 .3348 .3789
.3 405
.3459
.3 524
1/2 J
1 /
E xp ressed as % C a.
Means of 3 observations.
Means of 9 observations.
Control Plot .118
o
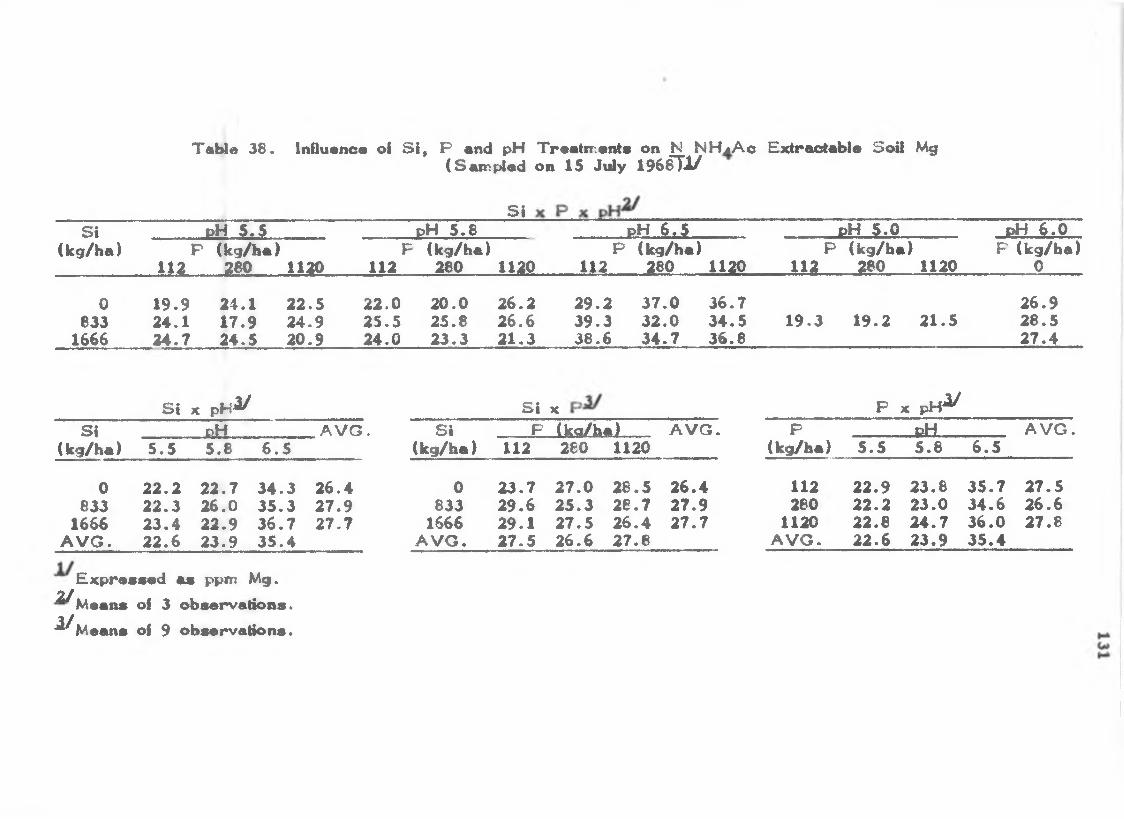
Table 3 8 . Influence of S i , P and pH Treatm eitie on N N H jA c E xtra^ ab le Soil Mg(Sam pled on 15 July 1 9 6 ^ !/
S IS i p H 5 .5 dH 5 .8 pH 6 . 5 oH 5 .0 pH 6 . 0
(kg/ha) 1112
P (kg/ha)280 1120
P (kg/ha) 112 280 U 2 0
P (kg/ha)112 280 1120
Pi i a
(kg/ha)280 1120
F (kg/ha) 0
0833
1666
1 9 .92 4 .12 4 .7
2 4 .1 2 2 .5 1 7 .9 2 4 .9 2 4 .5 2 0 .9
2 2 .02 5 .52 4 .0
2 0 .02 5 .82 3 .3
2 6 .22 6 .62 1 .3
2 9 .2 3 7 .0 3 6 .73 9 .3 3 2 .0 3 4 .5 3 8 .6 3 4 .7 3 6 .8
1 9 .3 1 9 .2 2 1 .52 6 .92 8 .52 7 .4
S i ;« p H ^ S i X P ;c p H ^S i dH A V G . S i P (ka/ha) A V G . P pH A V G .
(kg/ha) 5 .5 5 .8 6 . 5 (kg/ha) 112 280 1120 (kg/ha) 5 .5 5 .8 6 .5
0833
1666A V G .
2 2 .22 2 .32 3 .4 2 2 .6
2 2 .7 3 4 .3 2 6 .0 3 5 .32 2 .9 3 6 .72 3 .9 3 5 .4
2 6 .42 7 .92 7 -7
0833
1666A V G .
2 3 .72 9 .62 9 .12 7 .5
2 7 .0 2 8 .5 2 6 .4 2 5 .3 2 8 .7 2 7 .92 7 .5 2 6 .4 2 7 .72 6 .6 2 7 .8
112280
1120A V G .
2 2 .92 2 .22 2 .82 2 .6
2 3 .8 2 3 .0 2 4 .72 3 .9
3 5 .73 4 .63 6 .03 5 .4
2 7 .52 6 .6 2 7 .8
E xp reeeed a s ppm Mg.2/Means of 3 observations. '^ M ean s of 9 observations.
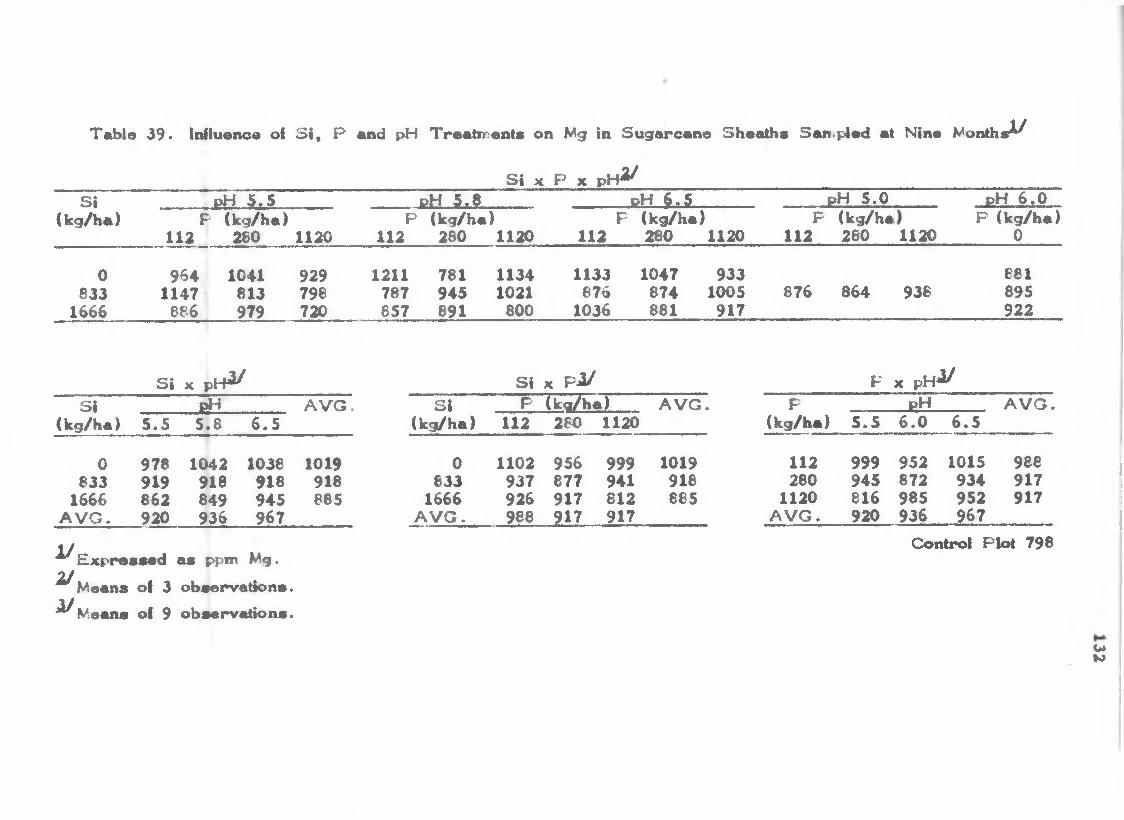
T able 39- lidluence of S i , P and pH Treatm ents on Mg in Su garcan e Sh eath s San^pied at Nine Moirfhs^
S i X P X p H ^S i dH 5 .5 pH 5 ,8 p H 6 ,5 pH 5 .0 dH 6 .0
(kg/ha) P (kg/ha) 112 280 1120
P (kg/ha 112 280
)1120
F112
(kg/ha)^ 0
1
1120F
112(kg/hs280 1120
P (kg/ha) 0
0833
1666
964 1041 1147 813
686 979
929798720
1211 781 787 945 857 891
11341021
800
1133876
1036
1047874881
9331005
917876 864 938
881895922
S i X p H ^ S i X p i/ F X p H ^S i dH A V G . S i P (ka/ha) A V G • F pH A V G .
(kg/ha) 5 .5 5 .8 6 .5 (kg/ha) 112 280 1120 (kg/ha) 5 .5 6 .0 6 .5
0833
1666A V G .
978 1042 1038919 918 918 862 849 945920 936 967
1019918885
0833
1666A V G .
1102937926988
956 999 877 941 917 812 917 917
1019918865
112280
1120A V G .
999945816920
952872985936
1015934952967
988917917
1/
2 /2 J
E xp ressed a s ppm Mg.
Means of 3 observations.Means of 9 observations.
Control Plot 798
Cjto
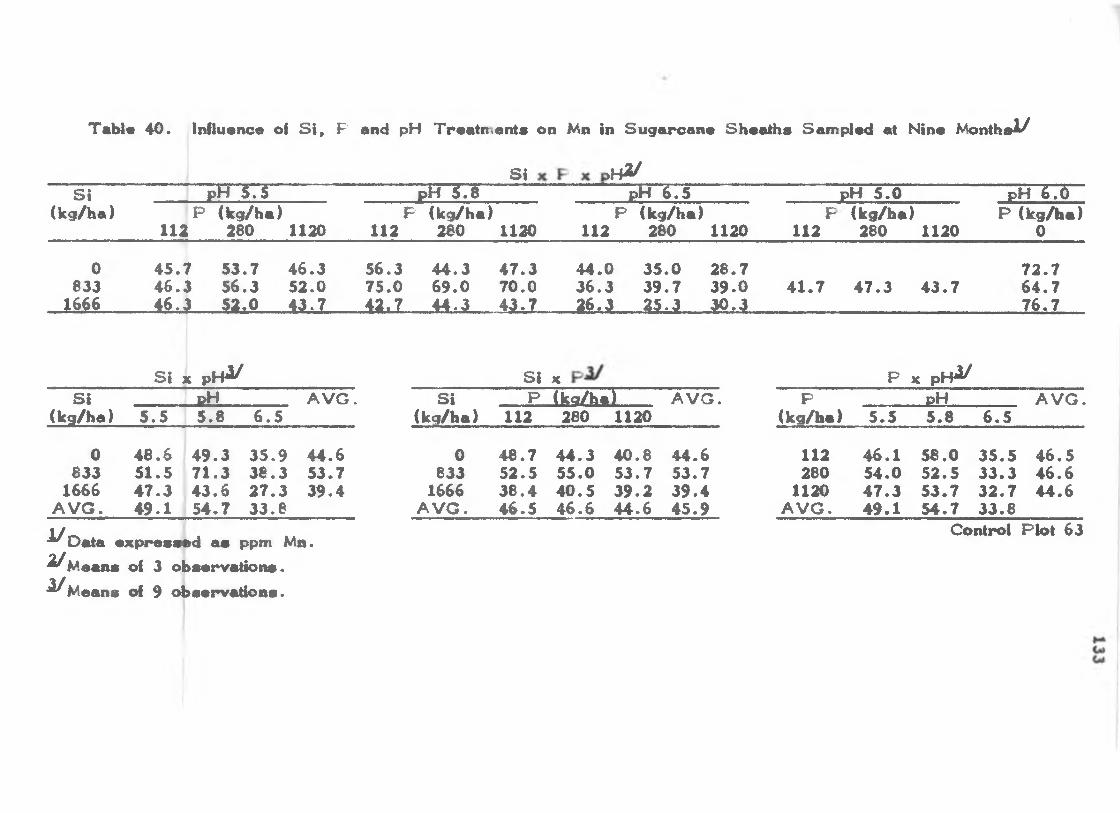
Table 4 0 . Influence of S i , F and pH Treatn .ents on Mn in Su garoane Sh eath s Sam pled at Nine M onths^
S i >h 3/S i pH 5 .5 p h t ;8 pH 6 .5 pH 5 .0 pH 6 .0
(kg/ha) P (kg/ha)112 280 1120
P (kg/ha) 112 280 1120
P (kg/ha)112 280 1120
F112
(kg/ha)280 1120
P (kg/ha) 0
0833
1666
4 5 .7 5 3 .7 4 6 .34 6 .3 5 6 .3 5 2 .04 6 .3 5 2 .0 4 3 .7
5 6 .37 5 .04 2 i7
4 4 .3 6 9 .04 4 .3
4 7 .37 0 .04 3 .7
4 4 .0 3 5 .0 2 8 .73 6 .3 3 9 .7 3 9 .02 6 .3 2 5 .3 3 0 .3
4 1 .7 4 7 .3 4 3 .77 2 .76 4 .77 6 .7
S i X p H ^ S i X P *t p H ^S i p H A V G . S i P (ko/ha) A V G . P pH A V G .
(kg/ha) 5 .5 5 .8 6 .5 (kg/ha) 112 280 1120 (kg/ha) 5 .5 5 .8 6 .5
0633
1666A V G .
4 6 .6 4 9 .3 3 5 .9 4 4 .6 5 1 .5 7 1 .3 3 8 .3 5 3 .7 4 7 .3 4 3 .6 2 7 .3 3 9 .4 4 9 .1 5 4 .7 3 3 .8
0833
1666A V G .
4 8 .75 2 .53 8 .44 6 .5
4 4 .3 4 0 .8 4 4 .6 5 5 .0 5 3 .7 5 3 .74 0 .5 3 9 .2 3 9 .44 6 .6 4 4 .6 4 5 .9
112280
1120A V G .
4 6 .15 4 .0 4 7 .34 9 .1
5 8 .05 2 .55 3 .75 4 .7
3 5 .5 4 6 .5 3 3 .3 4 6 .63 2 .7 4 4 .63 3 .8
*^D ata ex|»*esaed a s ppm Mn.^ M e a n s of 3 observations.•^Means of 9 <4>servations.
Control Plot 63
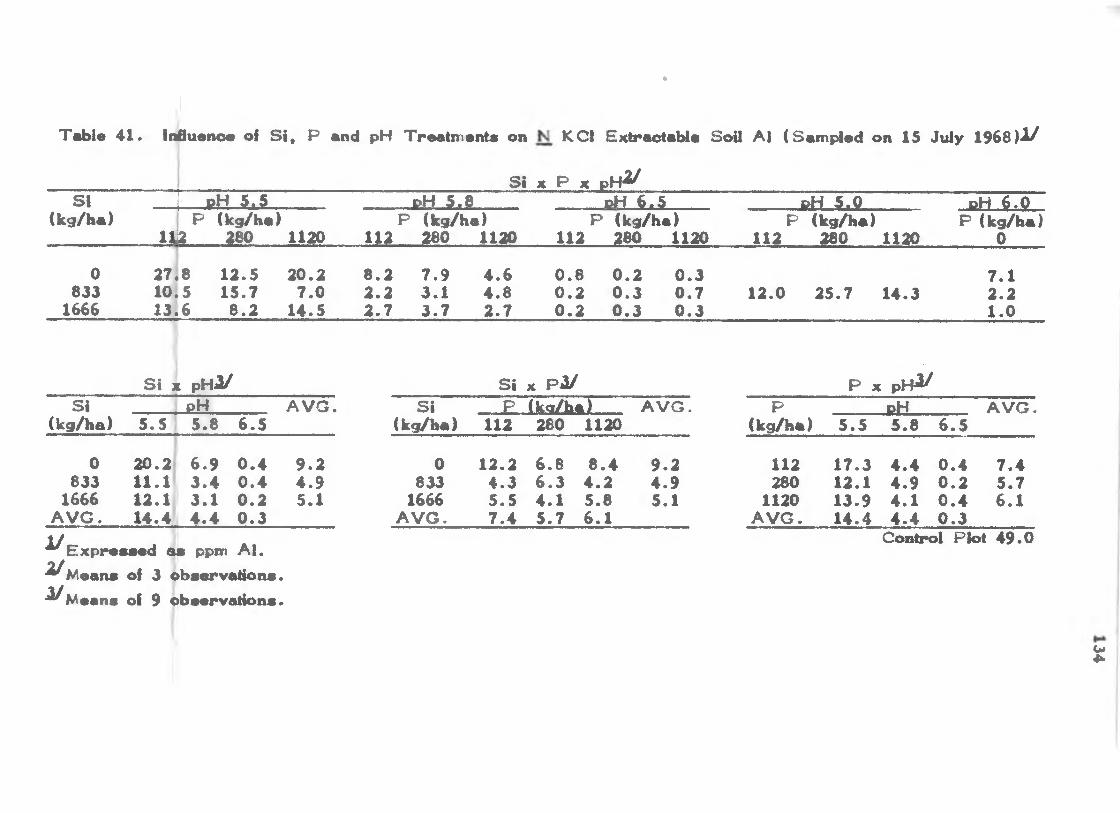
Table 4 1 . Influence of S i , P and pH Treatm ents on
S i
•
1 KCI ExtraetaU e Soil Al (Sam pled on 15 July 1 9 6 8 )i/
X P X p H ^S I
(kg/ha); oH 5 .5 pH 5 .8 pH 6 .5 p H 5 .0 dH 6 .0
P (kg/hem 380
)1120
P (kg/h« 112 280
i)1120
P (kg/ha)112 280 1120
P112
(kg/ha)280
P (kg/ha) 1120 0
0 2 7 .8 1 2 .5 2 0 .2 8 .2 7 .9 4 .6 0 .8 0 .2 0 .3 7 .1833 1 0 .5 1 5 .7 7 .0 2 .2 3 .1 4 .8 0 .2 0 .3 0 .7 1 2 .0 2 5 .7 1 4 .3 2 .2
1666 1 3 .6 8 .2 1 4 .5 2 .7 3 .7 2 .7 0 .2 0 .3 0 .3 1 .0
S i X pH2/ S i X p i/ P X: pHi/S i p H A V G . S i P (ka/ha) A V G . P dH A V G .
(kg/ha) 5 .5 5 .8 6 .5 (kg/ba) 112 280 1120 (kg/ha) 5 .5 5 .8 6 .5
0 2 0 .2 6 .9 0 .4 9 .2 0 1 2 .2 6 .8 8 .4 9 .2 112 1 7 .3 4 .4 0 .4 7 .4833 1 1 .1 3 .4 0 .4 4 .9 833 4 .3 6 .3 4 .2 4 .9 280 1 2 .1 4 .9 0 .2 5 .7
1666 1 2 .1 3 .1 0 .2 5 .1 1666 5 .5 4 .1 5 .8 5 .1 1120 1 3 .9 4 .1 0 .4 6 .1A V G . 1 4 .4 4 .4 0 .3 A V G . 7 .4 5 .7 6 .1 A V G . 1 4 .4 4 .4 0 .3
“ E x p r e s s e d a s ppm A l.^ M s a n s of 3 observations.-^M eans of 9 observations.
Control Plot 4 9 .0
uO.
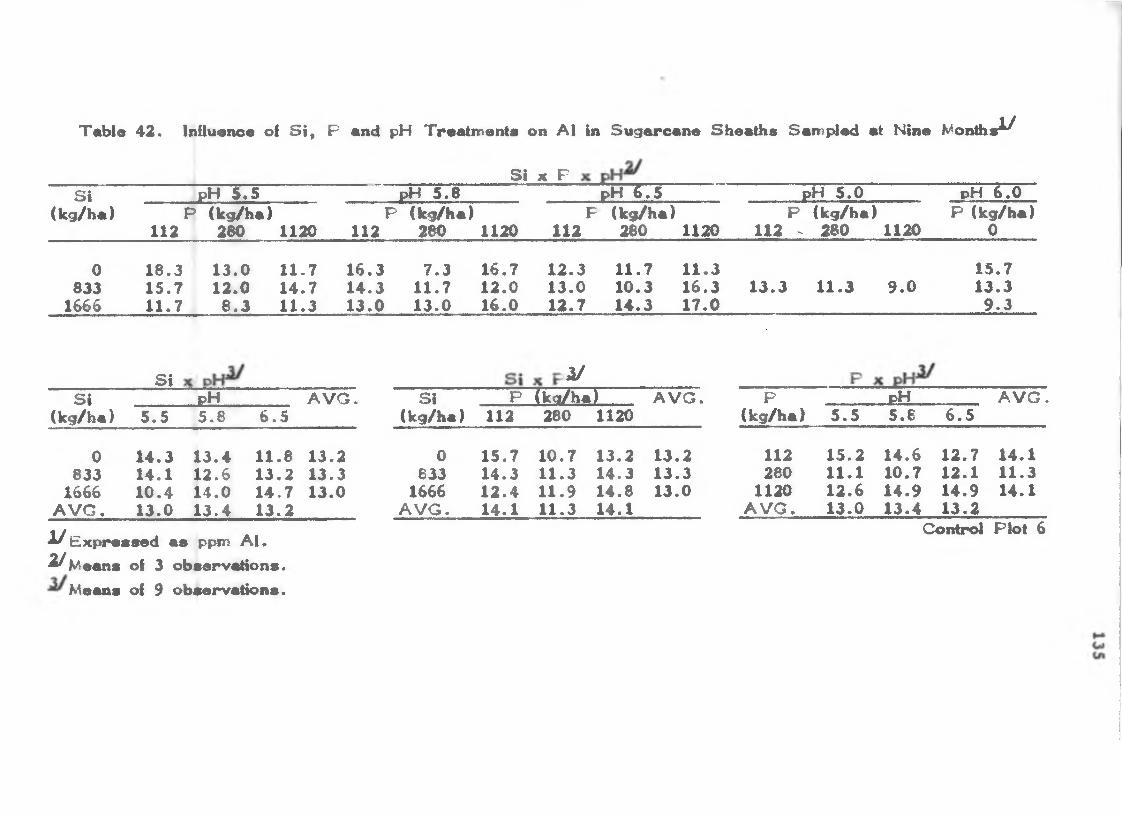
T«d>le 4 2 . Influemse of S i , P and |3H Traatm enta on Al in Su garcan a Sh eath s Samprfed at Nine M ondis^
S i X PS i pH 5 .5 pH 5 .8 pH 6 .5 pH 5 .0 pH 6 .0
(kg/ha) P (kg/ha) 112 260 1120
P (kg/ha) 112 2 ^ 1120
F (kg/ha) 112 280 1120
P (kg/ha)112 280 1120
P (kg/ha) 0
0833
1666
1 8 .31 5 .71 1 .7
1 3 .01 2 .0
8 .3
1 1 .71 4 .7 1 1 .3
1 6 .3 7 .31 4 .3 1 1 .7 1 3 .0 1 3 .0
1 6 .71 2 .01 6 .0
1 2 .3 1 1 .7 1 3 .0 1 0 .3 1 2 .7 1 4 .3
1 1 .31 6 .3 1 7 .0
1 3 .3 1 1 .3 9 .01 5 .71 3 .3
9 .3
S i i/S i
(kg/ha)pH A V G . S i
(kg/ha)P (kg/ha) A V G . P
(kg/ha)pH A V G .
5 .5 5 .8 6 .5 112 280 1120 5 .5 5 .8 6 .5
0 1 4 .3 1 3 .4 1 1 .8 1 3 .2 0 1 5 .7 1 0 .7 1 3 .2 1 3 .2 112 1 5 .2 1 4 .6 1 2 .7 1 4 .1833 1 4 .1 1 2 .6 1 3 .2 1 3 .3 633 1 4 .3 1 1 .3 1 4 .3 1 3 .3 280 1 1 .1 1 0 .7 1 2 .1 1 1 .3
1666 1 0 .4 1 4 .0 1 4 .7 1 3 .0 1666 1 2 .4 1 1 .9 1 4 .8 1 3 .0 1120 1 2 .6 1 4 .9 1 4 .9 1 4 .1A V G . 1 3 .0 1 3 .4 1 3 .2 A V G . 1 4 .1 1 1 .3 1 4 .1 A V G . 1 3 .0 1 3 .4 1 3 .2
i/ E xp ressed a s ppm A l.Control Plot 6
i/M eans of 3 o b serv d io n s. Means of 9 observations.
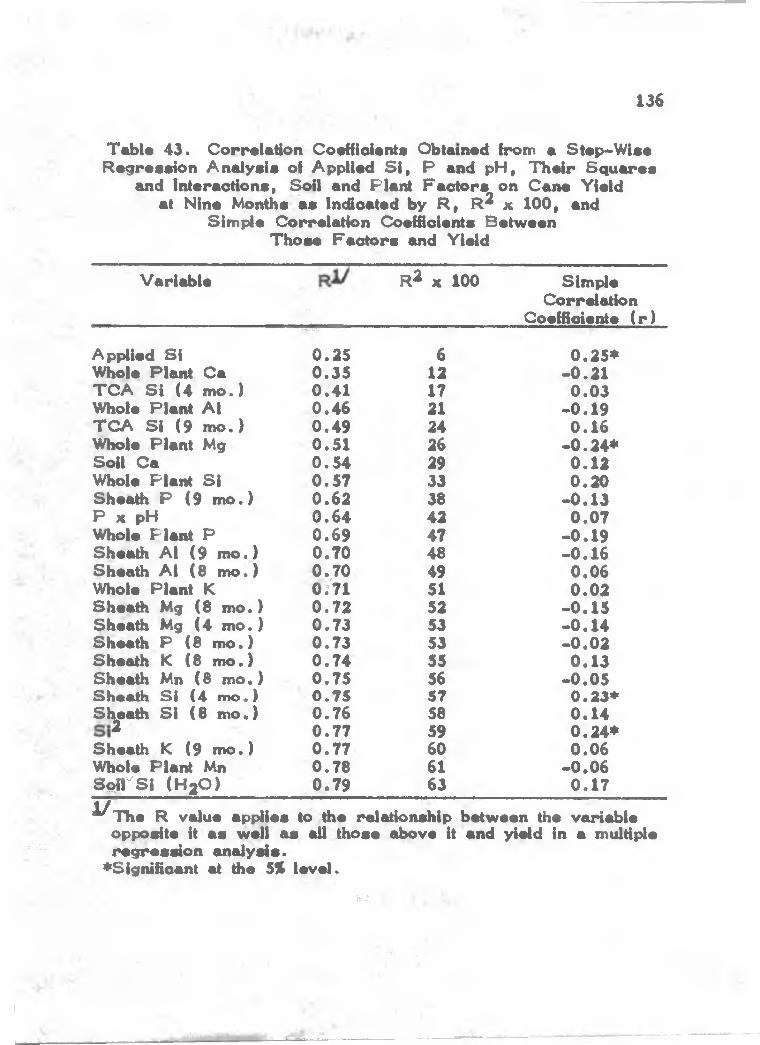
'A
■ ',- :/'4 .;
136
Table 4 3 . Correlation Coeffioiente ObtMned from a Step-W ise R eg ression A nalysis of Applied S i , P and pH, T h eir S q u a res
and Interactions, Soil and Flaid F a c to rs on Cane Yield at Nine Months a s Incfioated by R , R^ x 100 , and
Sim ple Correlation Coefficients Betw een T h ose F a c to rs and Yield
V ariable r 2 X 100
•‘wim
Simple Correlation
Coeffioiente ( r )
Ap(4ied S i Whole Plant Ca TC A S i (4 m o .) Whole Plant Al T C A S i (9 m o .) Whole Plant Mg Soil Ca Whole Plant S i Sheath P (9 m o .) P X pH Whole P lant P Sheath Al (9 m o .) Sheath Al (8 m o .) Whole Plant K Sheath Mg (8 m o .) Sheath Mg (4 m o .)
P (8 m o .) K (8 m o .) Mn (6 mo. ) S i (4 m o .) S I (8 m o .)
SheathSheathSheathSheathS l^ ath
Sheath K (9 m o .)Whole Plant Mn Sq ll^ Si (H 2O )
0 .2 50 .3 50 .4 10 .4 60 .4 90 .5 10 .5 40 .5 70 .6 20 .6 40 .6 90 .7 00 .7 00/710 .7 20 .7 30 .7 30 .7 40 .7 50 .7 50 .7 60 .7 70 .7 70 .7 80 .7 9
6121721242629333842474849515253 53555657585960 61 63
0 .2 5 * - 0.21
0 .0 3 - 0 .1 9
0 .1 6 - 0 .2 4 * 0.12 0.20
- 0 .1 3 0 .0 7
- 0 .1 9 —0 .1 6
0 .0 6 0.02
- 0 .1 5 - 0 .1 4 - 0.02
0 .1 3 - 0 .0 5
0 .2 3 * 0 .1 4 0 .2 4 * 0 .0 6
- 0 .0 6 0 .1 7
1/ The R value applies to fiie relationship opposite it a s well a s all those above it reg ressio n analyids.
*Signifioant at tiie 5% lev el.
b^w een the vaHable and yield in a multiple
fe.
' fe. \ •

T able 4 4 . Correlation Matrix ol Yield and Selected F a c to r*
tfi ar0. 0^
0. w 5*£2 . 0. 20 r CO< I c — > a 0a to0 0<0 mee* w T (/>
0
o e o
Yield 1 .0 0 .1 7 .2 4 .1 6 .2 0 .10 .2 0 - .0 1 .0 2Soil S i (H 2O ) 1 .0 0 .6 5 .5 9 .BO .1 3 .0 8 .0 0 - .0 8Soil S i
(Mod. T ru og) 1 .0 0 , 37 . 50 .1 0 - . 0 5 .16 - . 0 4TC A Sheath S i 1 .0 0 .53 .08 .0 6 - .3 8 - .0 7N 'hole Plant S i 1 .0 0 .1 0 .2 4 - .0 9 - .0 2Soil P 1 .0 0 .6 7 .08 —.2 3V/hole Plant P 1 .0 0 .0 6 .0 3Soil K 1 .0 0 - . 0 3V.liole Plant K 1 .0 0Soil CaWhole Flent CaSoil 1 .0 0 .3 6 - .5 7 - . 1 4 .78Whole Plant Mg 1 0 0 - .0 1 .0 7 .1 6Soil Al 1*00 - .0 8 - .7 1Whole Plant A| 1 .0 0 .0 4Soil pH l-yOO
010.
00
25TS.00
CO0
IQ
2oTasto
Ui0
>
25*a>
(00
VX
.12 - .2 1 .06 - .2 4 - .0 2 - .1 9 - .0 6- .0 7 .1 3 - .1 0 - .0 1 - .0 6 .13 - .1 4
.5 5 .2 0 .41 .0 6 - .4 0 .1 4 .46- .2 1 .1 4 - .1 1 .2 6 .11 .21 - .1 5- .1 1 .3 5 - .1 3 .20 .0 5 .10 - .1 6
.2 4 .1 5 .18 - .0 1 - .1 2 - .0 7 .1 5
.1 6 .5 0 .07 .2 3 - .0 4 ,0 7 .11
.41 - .0 6 .40 - .2 7 - .2 6 - .0 7 .2 4
.06 .0 0 .0 4 .0 9 .0 4 .1 0 .1 01 .0 0 .18 .8 3 .0 9 - .6 8 .0 2 .9 2
1 .0 0 .1 4 .5 7 - .0 8 .13 .1 6

f ’
G reen G reenG reen Sheetli Sheidh Moisture Sheath Moisture' (6 ) Sheath Moisture (9 ) TC A Sheath S i (4 ) TC A Sheath S i (8 ) TC A Sheath S i (9 ) Sheath S i (4 ) Sheath S i (8 ) Sheath S i (9 )
P (4 )SheathSheathSheathSheathSheathSheath
PPKK1C
( 8 )(9 )(4 )(8)(9 )
Sheath C a (4 ) Sheath C a (8 ) Sheath C a (9 ) Sheath Mg (4 ) Sheath Mg (8 ) Sheath Mg (9 ) Sheath Mn (4 ) Sheath Mn (8 ) Sheath Mn (9 ) Sheath Al (4 ) Sheath Al (8 ) Sheath Al (9 )
m7 .5 8
1 0 .3 81.220 .7 91 .2 7
1 4 .8 21 8 .3 21 8 .2 5 1 4 .5 71 4 :9 31 5 .1 71 1 .6 52 0 .7 91 8 .7 01 5 .6 81 5 .9 3 1 7 .5 2
9 .5 41 1 .2 51 2 .6 9 2 8 .9 9 2 9 .2 1 2 9 .9 5 2 7 .0 1 2 4 .6 1 2 9 .9 8 3 3 .4 67 7 .9 3 3 3 .3 7
W h o le 'lM lI ' S i Whole P Sm N Whole Plant P Whole P lant K Whole Plant C a Whole Plant Mg Whole Plant,M n Whole Plant Al SoU pH SoU S I (H 2O )SoU S i (M od. Truog)SoU PSoU KSoU C aSoU MgSoU AlYieldP e rc e n t D ry Weight S i Uptake N Uptake P Uptake K Uptake C a Uptake Mg Uptake Mn Uptake Al Uptake Sum S i . Uptake Sum P Uptake
1 5 .2 31 4 .6 71 8 .9 71 8 .1 92 4 .3 02 9 .1 95 6 .3 0
3 .2 92 3 .8 82 6 .5 63 3 .1 0 2 2 .8 1 2 1 .7 1 2 3 .7 4 6 4 .0 0 1 5 .1 2
5 .0 92 6 .1 81 9 .5 51 3 .0 71 8 .7 61 6 .2 622.103 0 .0 9 5 1 .1 4 2 2 .5 211.10
■■ '.i ■■■ .'3-:
Ji ,■,
.. If ■
U)09