the republic of uganda - national planning...
TRANSCRIPT

THE REPUBLIC OF UGANDA
Ministry of Agriculture, Animal Industry and Fisheries
Agriculture Sector Strategic Plan
2015/16-2019/20
“Draft”
April 2016

ASSP 2015/16 to 2019/20 Draft i
Table of Contents
Table of Contents .................................................................................................................................. i
List of Tables ........................................................................................................................................ v
List of Figures ...................................................................................................................................... vi
Acronyms and Abbreviations ..............................................................................................................vii
Executive Summary ............................................................................................................................... i
1 INTRODUCTION ............................................................................................................................ 1
1.1 Background ............................................................................................................................ 1
1.2 Structure of the agriculture sector........................................................................................ 1
1.3 Purpose of the ASSP .............................................................................................................. 1
1.4 Context of the ASSP ............................................................................................................... 2
1.4.1 United Nations’ Sustainable Development Goals ........................................................ 2
1.4.2 Comprehensive Africa Agriculture Development Programme .................................... 3
1.4.3 Uganda Vision 2040 ....................................................................................................... 4
1.4.4 National Development Plan II ....................................................................................... 4
1.4.5 Operation Wealth Creation .......................................................................................... 6
1.4.6 The National Agriculture Policy .................................................................................... 6
1.5 Process of developing the ASSP ............................................................................................ 6
1.6 Principles underpinning the ASSP ......................................................................................... 7
1.7 Structure of the ASSP ............................................................................................................ 8
2 SECTOR SITUATIONAL ANALYSIS .................................................................................................. 9
2.1 Agricultural sector contribution to the national economy ................................................... 9
2.1.1 Growth and contribution to GDP ................................................................................. 9
2.1.2 Contribution towards poverty reduction ................................................................... 10
2.1.3 Contribution to exports .............................................................................................. 11
2.1.4 Budget allocations to the sector ................................................................................. 13
2.2 Agricultural sector performance under DSIP ...................................................................... 13
2.2.1 Production and productivity ....................................................................................... 14
2.2.2 Markets and value addition ........................................................................................ 19
ASSP 2015/16 to 2019/20 Draft ii
2.2.3 Enabling environment ................................................................................................. 20
2.2.4 Institutional strengthening ......................................................................................... 20
2.3 Challenges faced during the DSIP period ............................................................................ 22
2.3.1 Crop related challenges............................................................................................... 22
2.3.2 Livestock and fisheries related challenges ................................................................. 23
2.3.3 Lessons learnt and opportunities from DSIP .............................................................. 23
3 THE STRATEGIC DIRECTION OF THE SECTOR .............................................................................. 25
3.1 ASSP’s vision, mission, objectives and outcome indicators ................................................ 25
3.2 Sector growth priorities and interventions ......................................................................... 25
3.2.1 Priority 1: Increasing agricultural production and productivity ................................ 26
3.2.2 Priority 2: Increasing access to critical farm inputs ................................................... 31
3.2.3 Priority 3: Improving access to agricultural markets and value addition ................. 38
3.2.4 Priority 4: Institutional and enabling environment strengthening ........................... 42
3.3 Strategic interventions for priority and strategic commodities ......................................... 51
3.3.1 Commodity 1: Bananas ............................................................................................... 51
3.3.2 Commodity 2: Beans ................................................................................................... 51
3.3.3 Commodity 3: Maize ................................................................................................... 52
3.3.4 Commodity 4: Rice ...................................................................................................... 52
3.3.5 Commodity 5: Cassava ................................................................................................ 53
3.3.6 Commodity 6: Irish Potatoes ...................................................................................... 53
3.3.7 Commodity 7: Tea ....................................................................................................... 53
3.3.8 Commodity 8: Coffee .................................................................................................. 54
3.3.9 Commodity 9: Fruits and vegetables .......................................................................... 55
3.3.10 Commodity 10: Dairy .................................................................................................. 56
3.3.11 Commodity 11: Fish ..................................................................................................... 56
3.3.12 Commodity 12: Meat and animal/ insect based products ........................................ 57
3.3.13 Commodity S1: Cocoa ................................................................................................. 59
3.3.14 Commodity S2: Cotton ................................................................................................ 60
3.3.15 Commodity S3: Oil seeds ............................................................................................ 60

ASSP 2015/16 to 2019/20 Draft iii
3.3.16 Commodity S4: Oil palm ............................................................................................. 61
3.4 Cross-cutting issues .................................................................................................................. 62
3.4.1 Rationale and outline of the strategy......................................................................... 62
3.4.2 Strategic interventions ................................................................................................ 62
4 INSTITUTIONAL ARRANGEMENTS FOR IMPLEMENTING ASSP ................................................... 66
4.1 The role and mandate of MAAIF ......................................................................................... 66
4.2 Implementation institutional arrangements ...................................................................... 67
4.2.1 Direct implementation ................................................................................................ 67
4.2.3 Collaboration with MDAs ............................................................................................ 67
4.2.4 Sector wide approach framework .............................................................................. 67
4.3 Agricultural ecological zones in ASSP implementation ....................................................... 69
4.4 Sector coordination ............................................................................................................. 71
5 ASSP COST AND FINANCIAL PLAN .............................................................................................. 73
5.1 Context of financial plan ..................................................................................................... 73
5.2 Budgeting approach and methodology .............................................................................. 73
5.3 Provisions of the constrained budget ................................................................................. 73
5.4 Provisions of unconstrained budget ................................................................................... 75
5.6 Resource mobilisation ......................................................................................................... 76
5.6.1 Support from development partners ......................................................................... 76
5.6.2 Support from the private sector ................................................................................. 77
5.7 Financial management arrangements ................................................................................ 77
5.7.1 Absorption capacity .................................................................................................... 77
5.7.2 Return on investment ................................................................................................. 77
6 MONITORING AND EVALUATION FRAMEWORK ........................................................................ 78
6.1 M&E framework and process .............................................................................................. 78
6.2 M&E coordination and outcomes ....................................................................................... 78
6.3 Monitoring of ASSP Implementation .................................................................................... 1
6.4 Evaluation of ASSP Implementation..................................................................................... 1
6.5 ASSP Logical Framework ....................................................................................................... 2

ASSP 2015/16 to 2019/20 Draft iv
ANNEXES .............................................................................................................................................. 5
Annex A: Summary of activities along value chains of priority/ strategic commodities ................. 5
Annex B: Crop, livestock and fisheries production targets for 2015 - 2019 in metric tons. ............ 8
Annex C: Agricultural commodity export targets for 2015/16– 2019/20 in US$ millions ............... 9
Explanatory notes to Annexes B and C .......................................................................................... 10
Annex D: Indicative budget (UGX billions), constrained by the NDPII budget .............................. 13
Annex E: Indicative ideal budget (UGX Billions) ............................................................................. 40
Annex F: Indicative ideal budget (UGX billions), by commodity and thematic area ..................... 70

ASSP 2015/16 to 2019/20 Draft v
List of Tables
Table 1: Baseline Status and Vision Targets for Selected Indicators in Vision 2040 ........................................ 4
Table 2: NDP-II Key Development Results and Targets ................................................................................... 5
Table 3: Agricultural sector growth rates 2010-2014 ....................................................................................... 9
Table 4: Agriculture sector contribution to GDP 2010-2014 .......................................................................... 10
Table 5: Uganda’s agricultural exports 2010-2014 (US$,000) ....................................................................... 11
Table 6: Budgetary allocation to the agriculture sector, 2012/13-2015/16 .................................................... 13
Table 7: Percentage change in area planted, production and yields of main food crops ............................... 15
Table 8: Production of main cash crops (000 tonnes) ..................................................................................... 16
Table 9: Distribution of fish catches by lake (thousand tonnes)-2010-2014 ................................................... 18
Table 10: Matrix of sector player and their roles ............................................................................................ 67
Table 11: Mapping of priority and strategic commodities in Uganda’s agricultural zones ........................... 70
Table 12: Constrained ASSP budget 2015/16-2019/20 ................................................................................... 74
Table 13: Unconstrained (or Ideal) ASSP budget 2015/16-2019/20 ............................................................... 75
Table 14: Monitoring and Evaluation Schedule ................................................................................................ 1
Table 15: Logical Framework Matrix for M&E ................................................................................................ 3

ASSP 2015/16 to 2019/20 Draft vi
List of Figures
Figure 1: Composition of the agriculture sector ............................................................................................... 2
Figure 2: The ASSP planning and formulation process .................................................................................... 7
Figure 3: Uganda's agricultural exports (US$000) 2009-2014 ...................................................................... 11
Figure 4: Livestock numbers (000 animals) 2010-2014 .................................................................................. 17
Figure 5: Map showing agricultural production zones of Uganda ................................................................. 69

ASSP 2015/16 to 2019/20 Draft vii
Acronyms and Abbreviations
AASPs Agricultural Advisory Service Providers
AEZ Agricultural Ecological Zones
AIT Artificial Insemination Technicians
AOP Annual Operational Plan
ARM Agriculture Risk Management
ARSP Agricultural Rural Service Providers
ASCS Agricultural Sector Communication Strategy
ASSP Agriculture Sector Strategic Plan
ASWG Agriculture Sector Working Group
ATAAS Agricultural Technology And Agribusiness Advisory Services
ATI Agricultural Training Institutions
AU African Union
AWM Agricultural Water Management
BAC Bukalasa Agricultural College
BBW Banana Bacterial Wilt
BDS Business Development Services
BFP Budget Framework Paper
CAADP Comprehensive Africa Agriculture Development Programme
CBMS Community Based Management System
CCI Cross Cutting Issues
CDO Cotton Development Organization
COCTU Coordinating Office For Control Of Trypanosomiasis In Uganda
COMESA Common Market For Eastern And Southern Africa
CoPS Code Of Practices
CRGS Competitive Research Grants Scheme
CSA Climate Smart Agriculture
CSOs Civil Society Organisation
CWD Coffee Wilt Disease
DAP Draft Animal Power
DARST District Adaptive Research Support Teams
DATICS District Agriculture Training And Information Centres
DDA Dairy Development Authority
DLG District Local Governments
DoAES Directorate of Agricultural Extension Services
DOC Day Old Chicks
DoCIC Department Of Crop Inspection And Certification
DP Development Partners
DSIP Agriculture Sector Development Strategy And Investment Plan
DUS Distinctness, Uniformity, Stability
EAC East African Community
EU European Union
FFSA Farmer Field School Approach
FID Farmer Institutional Development

ASSP 2015/16 to 2019/20 Draft viii
FIP Framework Implementation Plan
FMDC Fertiliser Market Development Council
FRM Fisheries Resources Management
FTI Fisheries Training Institute
FY Financial Year
GAPs Good Agricultural Practices
GDP Gross Domestic Product
GMO Genetically Modified Organisms
GoU Government Of Uganda
Ha Hectare
HAACP Hazard Analysis And Critical Control Points
HIV/ AIDS Human Immuno Virus/ Acquired Immuno Deficiency Syndrome
HQ Head Quarters
ICT Information, Communications And Technology
IGF Internally Generated Funds
ISTA International Seed Testing Association
JASAR Joint Agricultural Sector Assessment Review
KCCA Kampala Capital City Authority
Km Kilometres
LG Local Governments
M&E Monitoring & Evaluation
MAAIF Ministry Of Agriculture, Animal Industry And Fisheries
MDA Ministries, Departments And Agencies
MDGs Millennium Development Goals
MoFPED Ministry Of Finance, Planning And Economic Development
MoLG Ministry Of Local Government
MoLHUD Ministry Of Lands, Housing And Urban Development
MoTIC Ministry Of Trade, Industry And Cooperatives
MoU Memorandum Of Understanding
MoWE Ministry Of Water And Environment
MPS Ministerial Policy Statement
MSIP Multi-Stakeholder Innovation Platforms
mt Metric Tonne
MTEF Medium Term Expenditure Framework
NAADS National Agricultural Advisory Services
NaCORI National Coffee Research Institute
NAGRC&DB National Genetic Resource Centre And Data Bank
NAP National Agriculture Policy
NARI National Agricultural Research Institutes
NARO National Agricultural Research Organization
NARS National Agricultural Research System
NDP II National Development Plan II
NEC National Enterprise Corporation
NEMA National Environment Management Authority
NEPAD New Partnership For African Development
NEWS National Early Warning System

ASSP 2015/16 to 2019/20 Draft ix
NFAS National Food and Agricultural Statistics
NFLC National Farmer’s Leadership Centre
NGOs Non-Governmental Organisations
NM&E National Monitoring And Evaluation
NPA National Planning Authority
OECD Organization For Economic Cooperation And Development
OPM Office Of The Prime Minister
OWC Operation Wealth Creation
PARIs Public Agriculture Research Institution
PFMA Public Financial Management Act
PPDA Public Procurement And Disposal Act
PPP Public Private Partnerships
PQS Phytosanitary And Quarantine Service
PSR Poverty Status Report
PVP Plant And Varieties Protection
QDS Quality Declared Seeds
RMF Risk Management Fund
SDGs Sustainable Development Goals
SLM Sustainable Land Management
SME Small And Medium Enterprises
SMS Short Message Service
SOP Standard Operating Procedures
SPDG Sector Plan Development Guidelines
SPS Sanitary And Phytosanitary
SSC Sector Statistics Committee
TIMPS Agricultural Technologies, Innovations And Management Practices
TPM Top Policy Management
TTA Technology Transfer Agents
UBOS Uganda Bureau Of Statistics
UCDA Uganda Coffee Development Authority
UGX Ugandan Shilling
UNADA Uganda National Agro-Inputs Dealers’ Association
UNFFE Uganda National Farmers Federation
UNHS Uganda National Household Survey
URA Uganda Revenue Authority
US$ United States Dollars
UVB Uganda Veterinary Board
VCU Value For Cultivation And Use
VODP Vegetable Oil Development Project
VTI Vocational Training Institutions
WfAP Water For Agricultural Production
WRS Warehouse Receipt System
WTO World Trade Organization
WUA Water User Associations
ZARDI Zonal Agricultural Research And Development Institute

ASSP 2015/16 to 2019/20 Draft i
Executive Summary
1. Introduction
The Agriculture Sector Strategic Plan (ASSP) for the period 2015/16 to 2019/20 was developed
following a comprehensive review of the Agriculture Sector Development Strategy and Investment
Plan (DSIP) for the period 2010/11 to 2014/15 that was conducted in 2015. The review identified
some implementation challenges, lessons learnt, opportunities, emerging issues and generated key
recommendations to guide future action. The ASSP also takes into account the development priorities
in the National Development Plan (NDP) II and is structured in six chapters as follows: the
background to the agriculture sector; situational analysis; the strategic interventions of the sector
during the plan period; institutional arrangements for implementation of the ASSP; the financing
strategy; and monitoring and evaluation (M&E) arrangements.
2. Performance of agriculture sector during the DSIP period
During the DSIP period, the agricultural sector average annual growth rate was 2.2%. The growth in
agricultural sector declined from 2.6% in 2010 to -0.2% in 2012, before recovering to 3.6% in 2013
and 2.9% in 2014. It was lower than the average annual GDP growth rate of 5.2% and the average
annual population growth rate of 3% over the same period. The contribution of the agricultural sector
to GDP declined from 25.4% in 2010 to 23% in 2014. Of the agricultural sub-sectors GDP, the
average contribution for the different sub-sectors was 1.7% of GDP for cash crops, 12.7% of GDP
for food crops, 4.2% of GDP for livestock, 0.03% of GDP for Agriculture Support Services, 4.0% of
GDP for Forestry and 1.2% of GDP for fisheries.
2.1 DSIP Programme 1: Production and productivity Gains were made in production and productivity which saw an increase in the production of five
major commodities (coffee, tea, cotton, cocoa and milk) during the review period; in research where
the Competitive Research Grants Scheme (CRGS) was established and supported over 180 projects;
in control of pests, vectors and diseases where standard operating procedures (SOPs) were reviewed,
updated and disseminated amongst extension workers and continuous countrywide forecasting of
crop pest and diseases was undertaken; in water for agriculture production (WfAP) where eight
schemes were supported (i.e. three schemes were rehabilitated, one scheme is still undergoing
rehabilitation while five schemes have had a pre-feasibility study conducted and 17 feasibility studies
were carried out on community based irrigations schemes): and in aquaculture where three
commercial aquaculture sites, 17 fishponds, two aquaculture parks and eight landing sites were
established, constructed or developed. There was also an increase in the use of labour saving
technologies because of tractor donations by GoU to identified model farmer groups and for
neighbourhood contracting.
Over the DSIP period 2010-2014, all food crops registered an increase in the area planted except
bananas that registered a 0.41% decline in area planted. The average increase in area planted was
8.5% for cereals (millet, maize, sorghum, rice and wheat), 6.12% for root crops (sweet potatoes, Irish
potatoes, and cassava), 4.34% for pulses (beans, field peas, cow peas and pigeon peas), and 8.25%
for oil seeds (ground nuts, soya beans, sesame seeds and sunflower). On the other hand, bananas and
root crops production declined by 2.47% and 2.3% respectively, while production of cereals, pulses
and oil crops increase on average by 0.81%, 3.72% and 10.3% respectively of over the same period.
Considering 16 food crops analysed, only five crops registered any increase in yields during the five-

ASSP 2015/16 to 2019/20 Draft ii
year period. These were maize (13.03%), Irish potatoes (0.05%), beans (0.05%), cow peas (4%) and
sesame seeds (16.55%). Overall, decline in yields over the five years was 2.07% for bananas, 7.26%
for cereals, 8% for root crops and 0.61% for pulses while only oil crops registered a 3.85% increase
in yields.
The main cash crops registered increase in production except Tobacco that registered a 6.2% decline.
Coffee production expanded by 26.9%, while tea, cotton and Cocoa production is estimated to have
increased by 24.8%, 3.7% and 56.1% respectively. Uganda has experienced a steady increase in the
number of livestock for all the main animals over the period 2010-2014. The number of cattle
increased by 12.5% from 12.1m to 13.6m herd of cattle, of which about 93.6% of Uganda’s cattle
herds are indigenous whereas 0.8% are beef exotic/cross breeds and 5.6% are dairy exotic/cross
breeds. The number of goats increased from 13.2m to 14m representing a 6.1% increase. Equally, the
number of sheep and pigs increased by 6.1% from 3.6m to 3.8m sheep, and 3.4m to 3.5m pigs
respectively. Fish catch increased by 16.6% over the five years, 2010-2014 indicating recovery of
fish stocks. The biggest increase in fish catch was recorded on Lake Victoria (50.4%) but three lakes
(Albert, Kyoga and Wamala) reported declines in fish catch.
2.2 DSIP Programme 2: Markets and value addition achievements The Agricultural sector exports have grown progressively over the years, from $868.1m in 2010
peaking at $1.32b in 2013 before reducing to $1.29b in 2014. Over the period, the agricultural exports
increased by 49%, which was better that the 29.1% growth registered for the non-agricultural exports,
while the total exports increased by 39.7%. Accordingly, the agricultural exports share in total exports
has increased from 53.6% in 2010 to 57.2% in 2014. Considering the 2014 agricultural exports, top
five export commodities were: Coffee ($410.1m), fish and fish products ($134.8), vegetable oils
($102.3m), tea ($84.7m) and hides and skins ($73.7m). In order to enhance private sector participation
in value addition activities and investment, information material for enterprise selection and markets
was generated and disseminated and farmer groups and fora were strengthened to enhance farmer
participation in market development activities.
2.3 DSIP Programme 3: Enabling environment achievements There was improved public education and communication on agriculture and natural resource issues
during the period under review. For instance, annual agricultural trade shows, World Food Day
celebrations, BBW sensitisation, pre-JASAR visits, national agro awards and regional agro-trade fairs
were conducted. Intra and inter sector coordination was strengthened. A number of sector surveys
were undertaken in connection with the development of a national food and agricultural statistics
system and a national agricultural statistics bank was initiated in the Department of Planning while a
National Early Warning System (NEWS) Unit was also established.
2.4 DSIP Programme 4: Institutional strengthening achievements MAAIF was restructured with new departments being established (namely Department of Crop
Inspection and Certification; Department of Entomology; Fisheries Resources Management and
Development; Department of fisheries Regulation, Department of Aquaculture, the Agribusiness
Department and the Statistics Division. recruitment for the 45 priority positions was conducted
including Commissioners, Assistant Commissioners, Principal Officers, Senior Officers; and
Statisticians. There was also an improvement in linkages and collaboration between MAAIF and local
governments (LGs). A comprehensive capacity building needs assessment was undertaken for

ASSP 2015/16 to 2019/20 Draft iii
MAAIF HQ and a sector capacity building programme was also developed. However, the local
government level is still constrained with human resources. At the district local government level, the
approved structure provides for a minimum of six personnel in each district, equivalent to a total of
672 staff for the 112 districts. In 2015, only 77 out of the 672 positions were filled (11.5%). At sub-
county level, the approved structure provides for a staff establishment of 7,248 personnel, of which
only 1000 were filled as of June 2015 (13.8%). A total of 3236 critical positions are required at sub-
county level for implementation of single spine extension system, of which only 389 positions are
filled (12%).
3. Challenges The review noted that there were some inconsistencies in the designs of DSIP, ATAAS and non-
ATAAS components. For instance, ATAAS only addressed the first two components under
Programme Area 1 on production and productivity. The targets set in the DSIP for the national priority
commodities were not the same as those in ATAAS and FIPs. There was also lack of coherence
between the DSIP and the FIPs. There was also a mismatch in resource allocations between DSIP,
ATAAS and non-ATAAS.
3.1 Crop related challenges The identified challenges included poor agronomic practices that affected production; poor markets
and marketing infrastructure for many crop enterprises; funding constraints resulting in many FIPs
not to be implemented; limited access to credit facilities; climate change; poor regulatory framework
and weak enforcement; inadequate engagement of women and youth; limited extension services due
to very low extension staff to farmer ratio; and weak monitoring and evaluation framework and vague
indicators.
3.2 Livestock and fisheries related challenges The identified challenges included weak policy and regulatory framework; production constraints e.g.
limited availability of quality feeds; land tenure and water rights issues affected water for agricultural
production; weak M&E System and statistics e.g. data management. Others included poor post-
harvest handling and processing constraints; poor stakeholder coordination – including PPP; human
resource challenges including inadequate staff, lack of training and poor equipment; poor markets
and marketing infrastructure; and, funding constraints.
4. Lessons learnt and opportunities from the DSIP review Among the lessons learnt was the importance of involving community based seed producers in
planting material and seed production in promoting ownership and access to improved seeds and
planting materials; the need for commitment, good will and support from national and grassroots
political leaders in promotion of technology uptake; that development of physical infrastructure is
frequently easier than the development of effective farmer-led management structures; and that
establishment of national and district level platforms enhance commodity promotion.
The opportunities and emerging issues identified included increasing use of urban agricultural
residues/ waste and up-coming residues/ by-products from the oil industry, as opposed to fertiliser
production; increasing availability of processing plants, local and international markets; elevation of
statistics unit to Division level and the establishment of the single spine extension system that will
create a pool of staff to facilitate data collection in the local governments.

ASSP 2015/16 to 2019/20 Draft iv
5. Rationale for development of the ASSP
Agriculture is the backbone of Uganda’s economy and will be critical to the achievement of the
National Development Plan II goal of propelling the country towards middle-income status with a per
capita income of US$1,033 by 2020. The sector is expected to contribute to wealth creation and
employment through implementation of actions for the value chain development of twelve priority
and four strategic commodities. The ASSP describes the priorities, strategies and interventions
required to achieve these results.
6. Strategic direction of the agriculture sector
Sector investment over the medium term will be channelled to the specified priority and strategic
commodities across their entire value chains focusing on: research; extension; pest, vector and disease
control; provision of inputs; promoting sustainable land use and soil management; post-harvest
handling; improving markets access and value addition. The investment strategy will target to achieve
four objectives namely:
i. Increasing agricultural production and productivity;
ii. Increasing access to critical farm inputs;
iii. Improving agricultural markets and value addition; and
iv. Improving service delivery through strengthening the institutional capacity of MAAIF and its
agencies.
These interventions will mainly be focused on 12 priority commodities, namely: bananas, beans,
maize, rice, cassava, tea, coffee, fruits and vegetables, dairy, fish, livestock (meat), and four strategic
commodities, namely, cocoa, cotton, oil seeds, and oil palm. The interventions to be implemented for
each of these commodities are summarised below.
Banana
Banana production in 2014 amounted to 4,6 million mt, of which 3,070 mt were exported. Banana
exports generated US$587,000 for the country in 2014. The sector targets to produce 13 million mt
by 2020. To achieve these targets, the sector intends to increase production and productivity of
bananas through: control of pests and diseases especially the Banana Bacterial Wilt (BBW) disease;
generation and distribution of clean planting materials to farmers for example tissue culture;
promoting the use of organic and inorganic fertilisers and soil moisture conservation techniques;
strengthening extension services and training in good agricultural practices (GAPs); and support to
value addition through PPPs. The funds required to implement these interventions are UGX109,2
billion.
Beans
Beans production in 2014 amounted to 1,011 million mt, of which 31,796 mt were exported. This
generated US$26,19 million for the country. The sector targets to produce 10 million mt by 2020.
Annual exports are projected to increase to US$63 million. In order to achieve the above targets, the
sector intends to increase production and productivity of beans through: increasing access to high
quality seed inputs like Rhizobia; support to pest & disease control; strengthening mechanisation and
extension services. The total funds required to implement these interventions are UGX171,05 billion.

ASSP 2015/16 to 2019/20 Draft v
Maize
Maize production in 2014 amounted to 2,9 million mt, of which 134,903 mt were exported. This
generated US$43.567 million for the country. The sector targets to annually produce 10 million mt
by 2020. Exports are projected to increase to US$105 million annually. To achieve these targets, the
sector intends to increase production and productivity of maize through: producing and distributing
60 mt of improved maize seed; multiplication and distribution of foundation seed, improving access
and use of fertilisers; increasing pest and disease control measures; promoting mechanisation;
improving extension services; supporting post-harvest handling through training traders and farmers
on quality standards and post-harvest handling technologies; supporting processing and value
addition including household cottage industries; The total funds required to achieve these
interventions is UGX381,83 billion.
Rice
Rice production in 2014 amounted to 237,000 mt, of which 57,053 mt were exported. This generated
US$28,7 million for the country. The sector targets to produce 680,000 mt by 2020 and generate at
least US$73 million worth of exports. This will be achieved through: multiplication and distribution
of improved foundation seed; mechanisation of rice production; investment in irrigation infrastructure
starting with Eastern Uganda; and provision of extension services. In order to reduce post harvest
losses in rice, the sector intends to promote and distribute appropriate post-harvest technologies,
increase access to credit by rice farmers, traders and processors and promote marketing of rice by
promotion of collective marketing for high quality rice. The funds required to implement these
interventions are UGX49,84 billion.
Cassava
Cassava production in 2014 amounted to 2,8million mt. The sector targets to increase production of
Cassava to 3,5 million mt by 2020. Cassava is also a strong agent for import substitution and is
targeted to contribute about US$30 million per year in import-substitution during the plan period. The
following interventions will be undertaken: establish production and distribution of clean planting
material resistant to crop pests and diseases; develop monitoring and diagnosis systems for pest and
diseases; provide established support for marketing and establishment of adequate storage utilities for
fresh cassava roots; support cassava farmers and SMEs to engage in processing of quality flour and
chips, as well as agribusiness enterprises. The total funds required to achieve these interventions are
UGX135,12 billion.
Irish Potatoes;
The demand for Irish potatoes is estimated to be over 850,000 mt per annum with urban demand
outpacing rural demand. With the increasing urbanization, changing eating habits by the majority
youth and high population growth, chips consumption is set to rise by 50% over the plan period
offering the potato industry huge opportunities for enterprise development and economic growth. The
Irish potatoes development interventions aims at: i) supporting production and distribution of seed
potato of improved varieties with preferred end user characteristics; ii) supporting production and
marketing of ware potato for rural and urban consumption; iii) supporting farmers and Small and
medium enterprises to engage in organized production, marketing and processing of potato; and iv)
providing an enabling policy framework for a competitive and profitable commercial potato industry.
Tea

ASSP 2015/16 to 2019/20 Draft vi
Tea production in 2014 amounted to 61,376 mt, of which 60,504 mt were exported. This generated
US$84.7 million for the country. The sector targets to produce 112,000 mt by 2020, with exports
valued at approximately US$155 million. The following actions and activities will be pursued to
increase tea production: formulation of a tea policy favourable to investors and other actors in the
industry; mobilisation of small holder tea growers into independent legal farmer groups/associations
with a critical mass of shareholders owning processing facilities through Government loan
guarantees; increased funding for tea research; providing extension services for tea; production and
distribution of 34,965 million quality tea plantlets per annum; and building tea factories (at least 25
single line in Kisoro, Kabale, Kanungu, Zombo and Mityana) with a capacity to produce 800,000-
1,000,000 mt of tea per annum. These interventions will be carried out with the support of the Uganda
Tea Association and Uganda National Farmers Federation. The total amount of funds required to
achieve these interventions is UGX532,42 billion.
Coffee
Coffee is the principal export for Uganda and production in 2014 amounted to 211,872 mt, of which
206,831 mt were exported. This generated US$410,06 million for the country. The sector targets to
produce 595,890 mt valued at approximately US$1,153 billion by 2020. Activities to boost the coffee
sub sector will include: promoting improved varieties (seven elite varieties resistant to wilt) through
increased financing to coffee research; support for the production and distribution of 100 million
coffee seedlings per annum in order to expand area under production by 5% in traditional areas and
25% in new areas; carrying out demonstrations and training farmers on good agricultural practices;
controlling pests and diseases in coffee; promoting fertiliser use through support to demonstrations
and training farmers on soil and water conservation; promoting and supporting value addition and
marketing of coffee; providing technical extension, demonstrations, enforcement of compliance with
coffee regulations: improving standards and capacity through PPPs and supporting production and
certification schemes for sustainable fine and specialty coffee; and supporting acquisition and use of
mechanisation and irrigation technologies through PPPs. The total amount of funds required to
achieve these interventions is UGX402,87 billion.
Fruits and vegetables
Planned interventions to boost production and exports of fruits and vegetables will include: provision
of quality seedlings; improving grading standards, packaging and handling of fruits and vegetables;
registration of exporters; support to quality assurance; plant quarantine restrictions; pests and disease
control; and support to processing of fresh fruits through PPP arrangements. The funds required to
achieve these interventions are UGX417,18 billion.
Dairy
Total milk production amounted to 1,55 billion litres in 2014. Exports from milk and its products
earned Uganda US$28,684 million in 2014. Thirty three per cent (33%) of the marketed milk in
Uganda is processed whereas sixty seven per cent (67%) is marketed raw. The processing capacity of
milk was 1,304 million litres in 2014.The sector targets to produce 3.35 billion litres annually by
2020, and targets annual exports from milk and related products worth approximately US$92 million.
To achieve these targets, the following interventions are planned: implementation of the Presidential
directive to provide one heifer per household; support to dairy extension services; establishment of a
dairy herd information system; support to increased dairy regulation and inspection; establishment of
mobile and regional laboratories; building capacity in conserved feed production, marketing, on-farm

ASSP 2015/16 to 2019/20 Draft vii
water harvesting infrastructure and pasture and rangeland improvement in the national milk sheds
establishment; and increased efforts to improve dairy market access and value addition. The total
value of funds required to achieve these interventions is UGX199,72 billion.
Fish
Total fish production in 2014 amounted to 461,726 mt, of which 17,597 mt were exported. This
generated US$134,791 million for the country in 2014. The sector targets to increase annual fish
production to 674,028 mt by 2020. Earnings from annual fish exports are projected to increase to US$
238,80 million. In order to achieve the set targets, the following activities will be undertaken:
increased support to aquaculture through construction of fish ponds; support to restocking of major
water bodies; undertaking research in area fish breeding and production technologies for fast growing
and early maturing fish species; control of water weeds; increased regulation, inspection and
certification; increased value addition to fisheries. The total funds required to implement these
interventions are UGX 292,95 billion.
Meat and other livestock products
The sector has set the following production targets for 2020 for the main livestock products: beef
production, 360,000 (valued at US$ 1.636 billion); pork, 139,185 mt (valued at US$421 million);
mutton and goat meat, 39,775 mt (valued at US$421 million); poultry, 63,647. There are also plans
to increase production of honey and silk to increase exports of hides and skins. In order to achieve
the targets, the following activities will be undertaken: control of vectors and diseases through
vaccinations, disease surveillance and construction of infrastructure for disease control; pasture
development; provision of adequate water for livestock production through the construction of valley
dams; provision of high genetic materials; promotion of labour saving technologies; creating a buffer
stock/animal handling grounds to support beef processing. The total funds required to achieve these
interventions are UGX793.82 billion.
Cocoa
Production and export earnings from of cocoa have steadily increased from 16,478 mt worth US$35,1
million in 2010 to 25,720 mt worth US$59,4 million in 2014. Increased production and productivity
will be enhanced through strengthening cocoa research and technology development, improving
cocoa extension services delivery, provision of cocoa seedlings, and increased marketing and value
addition. The total amount of funds required to achieve these interventions are UGX40,48 billion.
Cotton
Cotton lint production in 2014/15 amounted to 17,275 mt, of which 12,674 mt were exported. This
generated US$21,918million for the country. The sector targets to produce 64,750 mt by 2020. In
order to achieve these targets, the following activities need to be undertaken: completion of the seed
processing plant in Pader district; provision of cotton inputs to farmers; support to value addition
through implementation of the revolving lint buffer stock fund to ensure all year round supply of lint;
strengthening cotton research; strengthening cotton farmers support programmes through extension
and training in good agronomic practices; support to mechanisation in cotton. The total amount of
funds required to implement these interventions are UGX95,82 billion.
Oil seeds
Oil seeds production in 2014 was 758,500 mt and this is projected to more than double to 2,027

ASSP 2015/16 to 2019/20 Draft viii
million mt by 2020. Exports from vegetable oils are projected to increase from US$ 102million
registered in 2014 to US$281 million by 2020. Increased production and productivity of oilseeds is
aimed at increasing household food and nutrition security and income and the specific interventions
to be undertaken will include: improved distribution and access to improved quality seed, fertilisers
and mechanisation; strengthening and increasing access to extension services by oil seed farmers;
building and strengthening farmer organisations to sustainably provide services to their members, and
strengthening the oilseeds sub-sector platform to oversee and coordinate relevant policies in the
oilseeds sub-sector.
Oil palm
Nucleus estates currently dominate production of oil palm, however there is significant potential for
improvement of house hold incomes by integrating smallholders into the schemes. This will require
capacity building of farmers’ groups in order to facilitate knowledge building, skills transfer, input
distribution and bulking of produce. Investments to promote better productivity and production
improvement will include identifying additional land for both nucleus estate and integration of
smallholders targeting large-scale production in Buvuma and potential new districts (Masaka,
Kalungu, Lwengo, Mukono, Buikwe, Mayuge, West Nile region and Middle North region). The
existing Vegetable Oil Development Project (VODP) is also in the process of identifying suitable
land for additional trials.
Agricultural extension
The sector will carry out the following activities to strengthen extension services in the country: filling
vacant staff positions in MAAIF and DLGs - district and sub county levels; farmer group formation
into co-operatives, associations and federations, with support from the Uganda National Farmers
Federation (UNFFE); carrying out farmer training needs assessment in the areas of agricultural
production, business, agro-processing, post harvest handling, value chain upgrading and nutrition;
conducting residential and non-residential farmer training to address identified needs; profiling
farmers according to farm sizes and enterprises; development of a curriculum for a professional
certificate course in extension skills for extension service providers; initiatives to increase youth
participation in agriculture; development and implementation of the extension policy and other
statutory instruments; developing PPP projects such as investments in silos, warehousing, storage and
bulking centres; operationalisation of the commercialisation challenge fund; establishment of
demonstration and incubation centres; and implementing the sector communication strategy. The total
amount of funds required to achieve these interventions are UGX887.99 billion.
Agricultural research
To accelerate production and productivity at national and household level, the ASSP will focus on
generating and up scaling the use of sound agricultural research and climate change resilient
technologies across the priority and strategic commodities. The function of the National Agricultural
Research System will be strengthened through identification and building of key human resource
capacity; a policy and regulatory framework for biotechnology will be developed and implemented;
and technologies and protocols for value addition will be developed and promoted. The total amount
of funds required to achieve these interventions are UGX327,65 billion.
Water for agricultural production
Farmers have continued to grapple under the effects of climate change due to over reliance on rain-

ASSP 2015/16 to 2019/20 Draft ix
fed agricultural though there is great potential to harness the available water in order to increase
agricultural production and productivity. The following activities will be undertaken to increase water
for agricultural production: purchase of five sets of additional equipment to increase water coverage;
recruitment and training of operators; assessment of designs and construction of 250 valley tanks and
valley dams; review guidelines and create awareness on the use of equipment; construction and
rehabilitation of irrigation schemes; and training of farmers through irrigation and water harvesting
demonstrations sites. The total funds required to implement these interventions are UGX 387,85
billion.
Agricultural mechanisation
The level of agricultural mechanisation in the country is still minimal, compared to other sub-Saharan
African countries. The following activities will be undertaken to redress this imbalance: develop
incentive schemes for acquisition and maintenance of mechanisation equipment; purchase of 450
tractors; rehabilitation and refurbishment of the Namalere Agricultural Mechanisation Resource
Centre; building capacity for technical training operators, mechanics, technicians and farmers;
collaboration with the National Bureau of Standards to eliminate importation and trade of substandard
agricultural mechanisation equipment; and completion of the national agricultural mechanisation
policy and implementation framework. The total amount of funds required to achieve these
interventions are UGX159,84 billion.
Administrative infrastructure development
MAAIF is currently located in Entebbe, whereas its partner MDAs and other sector stakeholders are
situated in Kampala. This strategy will focus on constructing new MAAIF headquarters in Kampala,
to increase sector efficiency through improving linkages between MAAIF and its partner MDAs
located in Kampala. It will also involve the construction of administrative infrastructure for a selected
number of district production offices with inadequate and poor office buildings. The total amount of
funds required to achieve these interventions are UGX100,70 billion.
Human resource development, training and capacity building
This intervention will focus on addressing the current shortage of personnel in MAAIF by developing
and implementing an integrated and phased recruitment process. It will also involve: developing a
comprehensive sector capacity building programme that will capture not only the knowledge and
skills gaps but also career development needs; identifying the institutions in the sector with the most
urgent capacity building needs; identifying partners (service providers) to assist with the capacity
building; and implementing the capacity building plans including periodic reviews of achievement.
The total amount of funds required to implement these interventions are UGX11 billion.
Agriculture sector training institutes and centres
This intervention aims at transforming Bukalasa Agricultural College (BAC), Fisheries Training
Institute (FTI), the National Farmers Leadership Centre (NFLC) and District Agricultural Training
and Information Centres (DATICs), into institutions that are responsive to knowledge and skill needs
of the market in extension services. This will be attained through curriculum review, human resources
strengthening and infrastructural rehabilitation/ development. In the case of the NFLC, it is further
planned to acquire additional land for farming operations as well as put in place a reviewed legal
regime to replace the Memorandum of Understanding that the centre is currently operating under.
The total amount of funds required to achieve these interventions are UGX43,56 billion.

ASSP 2015/16 to 2019/20 Draft x
Agriculture sector policy and planning
This intervention aims at providing support to sector policy and planning in the implementation of
the ASSP. It will focus on producing bankable project proposals to support ASSP implementation;
undertaking budget execution assessment exercises; linking ASSP implementation with regional
agriculture policy undertakings (in the EAC, COMESA, CAADP, etc.); and coordinating the
production of agriculture sector mandatory policy/planning/budget papers. The total amount of funds
required to achieve these interventions are UGX14,5 billion.
Agricultural statistics, ICT and risk management
The Agriculture sector is characterized by a weak agricultural statistical system. The objective of this
intervention is to establish an efficient National Food and Agricultural Statistics (NFAS) system to
provide data that will underpin major government policy programmes. In addition, farm risk
management will be improved through: establishing awareness of the holistic approach of Agriculture
Risk Management (ARM) across all thematic areas; developing a national coordination mechanism
for ARM to advise relevant MDAs; identifying and prioritising agricultural risks through a
participatory approach involving local, national, and international stakeholders; developing,
analysing and implementing innovative and integrated tools to manage the identified agriculture risks;
prioritising ARM processes and tools and integrating them into the strategic investment plans;
increasing investments and initiatives on ARM led by the GoU and partners at national and regional
level; identifying and mainstreaming ARM data and its timely collection, analysis, management and
integration within the agricultural statistics system. The total funds required for these interventions
are UGX19,43 billion.
Agricultural monitoring and evaluation systems
Agricultural Sector MDAs will strengthen agricultural Sector M&E systems through the production
of quality monitoring and evaluation data and information on ASSP implementation and through
strengthening institutional and organisational capacity for M&E development and dissemination of
standardized tools, guidelines and formats for collation and reporting by key stakeholders involved
in M&E of ASSP implementation. Support will also be provided for revamping routine monitoring,
support supervision and data quality audits within MDAs and LGs. A joint annual sector review will
be held bringing together development partners, private sector, CSOs and other MDAs. The total
amount of funds required for these interventions are UGX16,92 billion.
Cross-cutting issues
The Agricultural sector has identified five cross cutting issues in the population that impact on its
performance and these. These are: gender, youth, environment and climate change, HIV/AIDS as well
as food and nutrition security. During the plan period, it is intended to ensure that these issues are
adequately mainstreamed in all activities implemented in the sector. The total funds required for these
interventions are UGX11 billion.
7. ASSP institutional, budget and M&E frameworks
The ASSP shall be implemented through a multi-sector wide approach involving GoU, MDAs,
district local governments (DLGs), development partners (DPs), civil society organisations (CSOs)
and the private sector. MAAIF shall spearhead the implementation, coordination, monitoring,
evaluation and review of the ASSP including publicizing and putting in place and periodically

ASSP 2015/16 to 2019/20 Draft xi
reviewing enabling frameworks for its implementation. To address implementation bottlenecks,
existing institutional arrangements will be strengthened and a dedicated framework developed and
operationalised. Implementation will also be guided by the commodity-zoning concept adopted in FY
2010/11.
The required ASSP budget has been computed at UGX 6.969 trillion over the 5-year period.
Interventions will be funded through prudent resource allocation utilising approaches that will ensure
appropriate provision of financial resources and agricultural inputs for each commodity. However,
the ASSP also provides for a constrained budget, in line with the agriculture sector public costing
provided for under the National Development Plan II. This constrained budget amounts to UGX4.626
trillion. Sources of funding for the ASSP will include direct Government and development partner
funding to the ministry and its agencies, programmes and projects, while the private sector will
provide the necessary investments and funding for interventions of a commercial nature mainly
through public private partnerships.
MAAIF departments and agencies will adapt the national M&E policy in order to align them with the
higher level M&E framework and to facilitate national level monitoring of the agriculture component
of the NDP II.

ASSP 2015/16 to 2019/20 Draft 1
1 INTRODUCTION
1.1 Background The Agriculture Sector Strategic Plan (ASSP) for the period 2015/16 to 2019/20 is a successor of
the agriculture sector Development Strategy and Investment Plan (DSIP) for the period 2010/11 to
2014/15. It was consultatively developed following a comprehensive review of the DSIP that was
conducted in 2015. The review involved analysis of identified implementation challenges, lessons
learnt, opportunities and emerging issues leading to a set of key recommendations on future
development actions for the Uganda’s agricultural sector. The ASSP defines the priorities and
interventions that will guide its implementation over the 5-year period. It articulates the national
agricultural development priorities documented in the National Development Plan (NDP) II and the
National Agriculture Policy (NAP) 2013.
1.2 Structure of the agriculture sector The agriculture sector is composed of three sub-sectors which are constituted as directorates, namely
crop, animal and fisheries resources. An additional Directorate for Agriculture Extension was
established in the Financial Year (FY) 2014/15. These core directorates are supported by the Policy
Planning and Support Services Department and other units falling directly under the Permanent
Secretary which include: Finance and Administration; Procurement and Disposal Unit; and Internal
Audit.
The Ministry of Agriculture, Animal Industry and Fisheries (MAAIF) also has semi-autonomous
agencies that implement specialised and intensive technical and advisory aspects of its broad
mandate under her line of supervision. The composition of the agricultural sector is illustrated in
Figure 1 and highlights the fact that there are different actors in the sector who play complementary
roles along the agricultural value chain.
Government, through MAAIF, is responsible for policy formulation, regulation and quality control;
private sector and farmers engage in farm production, agro-processing and marketing of agricultural
output; the civil society organisations (CSOs) complement Government in delivering of agricultural
services to farmers; the academia and research institutions undertake research and disseminate
information that may guide policy formulation, promotion of innovation, product development and
technology advancement for commercialisation of agriculture; financial institutions provide finance
and credit to the farmers, cooperatives and agro-processors; while the development partners provide
financial and technical assistance.
1.3 Purpose of the ASSP The development of the agriculture sector is expected to contribute to national wealth creation and
increased employment along the agricultural value chains in a sustainable manner. This will enhance
poverty reduction while supporting economic growth and transformation of the country to a middle-
income status. The rationale underpinning the ASSP is that there is need for a guidance framework
for identifying sector investments that will target increased production and productivity in selected
priority commodities. Implementation of the ASSP will spur growth in the agriculture sector through
the establishment of effective linkages to and exploitation of existing and potential local, regional
and international markets. In the background, the plan implementation will improve the institutional
and policy environment for overall guidance of the agriculture sector in line with national and

ASSP 2015/16 to 2019/20 Draft 2
relevant regional and international laws, policies, protocols and standards. Lastly and as a successor
to the DSIP, the ASSP implementation is also expected to build on the achievements and lessons
learnt over the last five years, while addressing or mitigating identified shortcomings.
Figure 1: Composition of the agriculture sector
1.4 Context of the ASSP The ASSP is inspired by and aligned to a number of international, regional and national conventions,
objectives and policies as described hereunder.
1.4.1 United Nations’ Sustainable Development Goals
The ASSP will build on Uganda’s success in achieving, well ahead of the 2015 deadline, the
Millennium Development Goals (MDGs) target to halve the proportion of people whose income is
International &Regional
Organisations
Ministry of Agriculture, Animal
Industry and Fisheries
&the MAAIF Semi-Autonomous
Agencies
Coordinating Office for the
Control of Trypanosomiasis in
Uganda
Cotton Development
Organization
Dairy Development Authority
National Agriculture Advisory
Services
National Agriculture Research
Organization
National Genetic Resource
Information Centre and Data
Bank
Uganda Coffee Development
Authority
Ministries
Energy and Mineral
Development
Education and Sports
Finance Planning &
Economic Development
Gender Labor and Social
Development
Health
Local Government
Lands Housing and Urban
Development
Public Service
Tourism, Wildlife and
Antiquities
Trade Industry and
Cooperatives
Water & Environment
Works and Transport
Development Partners
Bilateral
Multilateral
Private Sector and Civil
Society
Agriculture Services and
Goods Providers
Civil Society Organizations
Non-Government
Organizations
Farmer Organizations
LGs
Districts
Sub Counties
Farmers
Commercial, Medium & Small
Academia
Universities
Agricultural Training
Institutions
Agriculture
Sector
Working
Group

ASSP 2015/16 to 2019/20 Draft 3
less than US$ 1.25 dollars a day. The country has also progressed well towards meeting another key
MDG target of halving the proportion of people suffering from hunger with significant progress
achieved in improving nutrition, particularly among children in whom nourishment is critical during
early childhood. The ASSP will support Uganda’s efforts to attain the following Sustainable
Development Goals (SDG) (which have succeeded the MDGs):
Goal 1- End poverty in all its forms everywhere;
Goal 2- End hunger, achieve food security and improved nutrition, and promote sustainable
agriculture;
Goal 6- Ensure availability and sustainable management of water and sanitation for all; and
Goal 12- Ensure sustainable consumption and production patterns
Goal 13- Take urgent action to combat climate change and its impacts.
1.4.2 Comprehensive Africa Agriculture Development Programme
The ASSP is Uganda’s principle instrument for implementing the Comprehensive Africa
Agriculture Development Programme (CAADP), a growth oriented agricultural development
agenda of the African Union (AU) and the New Partnership for African Development (NEPAD). It
is aimed at increasing agriculture growth rates to 6% per year to create the wealth needed for rural
communities and households in Africa to prosper. CAADP focuses on four key pillars to achieve
measurable outcomes, namely:
1. Extending the area under sustainable land management and reliable water control systems;
2. Improving rural infrastructure and trade related capacities for market access;
3. Increasing food supply, reducing hunger, improving responses to food emergency crises;
and
4. Improving agriculture research, technology dissemination and adoption.
All the four pillars of CAADP are key components of this strategic plan. CAADP Pillars 1 and 3 on
the extension of area under sustainable land management and food supply and security will be
addressed in the context of increasing production and productivity and though various interventions
under sustainable land management and increasing water for production. Pillar 2 on improving
market access will be addressed through prioritisation of specified value chains including value
addition. To address Pillar 4, the ASSP prioritises agricultural research and technology
dissemination and adoption.

ASSP 2015/16 to 2019/20 Draft 4
1.4.3 Uganda Vision 2040
The ASSP is inspired by Uganda’s Vision 2040 that aims at transforming Uganda from a
predominantly peasant and low-income country to a competitive upper middle-income country by
2040. As shown in Table 1, the Vision 2040 policy identifies agriculture as: (a) a major contributor
to gross domestic product (GDP); (b) a key source of employment for the labour force in the country;
and (c) as a sector whose labour productivity will have to increase. Agriculture is also among the
strategic opportunities that need to be strengthened to accelerate the growth of the economy.
The ASSP articulates how investments in agriculture will be guided in order to support efforts
towards the national goal of transformation, including the development of major irrigation schemes
in the country; continued investment in technology improvement through research for improved
seeds, breeds and stocking materials; operationalisation of the extension system reform in the
country to improve information access as well as knowledge, skills and technology transfer to the
farmers; and intensifying environmental control measures to halt the decline in soil fertility.
Table 1: Baseline Status and Vision Targets for Selected Indicators in Vision 2040
Indicators Baseline Status: 2010 Target 2040
Per capita income (US$) 506 9,500
Percentage of population below the poverty line 24.5 5
Sectoral composition of GDP
(%)
Agriculture 22.4 10.4
Industry 26.4 31.4
Services 51.2 58.2
Labour force distribution in
line with sectoral contribution
(%)
Agriculture 65.6 31
Industry 7.6 2.6
Services 26.8 43
Labour Productivity (GDP per
Worker - US$)
Agriculture 390 6,790
Industry 3,550 24,820
Services 1,830 25,513
TOTAL 1,017 19,770
Life expectancy at birth (years) 51.5 85
Child stunting as a % of under 5s 33 0 Source: Vision 2040 Document
1.4.4 National Development Plan II
The National Development Plan (NDP) II 2015/16 - 2019/20 is the successor to the NDP I. Its goal
is to attain middle-income status by 2020. This is to be realized through strengthening the country’s
competitiveness for sustainable wealth creation, employment and inclusive growth by pursuing a
private sector-led, export oriented and quasi-market approach. The plan has four objectives, namely:
a) Increasing sustainable production, productivity and value addition in key growth
opportunities;
b) Increasing the stock and quality of strategic infrastructure to accelerate the country’s
competitiveness;
c) Enhancing human capital development; and
d) Strengthening mechanisms for quality, effective and efficient service delivery
Over the NDP-II period the Government of Uganda (GoU) is targeting to increase agricultural
exports to US$4 billion by 2020 from the current USD1.3 billion and halving the labour force

ASSP 2015/16 to 2019/20 Draft 5
engaged in subsistence production from six to three million. In the ASSP, the key focus areas
include: increasing production and productivity; addressing challenges in the selected thematic
technical areas including access to critical farm inputs, increased and more efficient mechanisation
and increased access to and availability of water for agricultural production; improving agricultural
markets and value addition in the 12 prioritised commodities and institutional strengthening for
agricultural development. Table 2 summarises the key development results and targets during NDP
II implementation.
Table 2: NDP-II Key Development Results and Targets
NDPII Goal and Objectives Development Indicator Baseline Targets
2012/13 2019/20 V2040
Overall Goal:
Achieve middle income status
by 2020
1. Income per Capita (US$) 743 1,033 9,500
2. Average economic growth rate* 5.2 6.3 8.2
3. Percentage of people living on less
than US$ 1 a day
19.7 14.2 5.0
4. Percentage of national labour force
employed
75.4 79 94
Objective 1: Increase
sustainable production,
productivity and value
addition in key growth
opportunities
1. Manufactured exports as a
percentage of total exports
5.8 19.0 50
2. Labour
Productivity
(GDP per
Worker - US$)
Agriculture 581 977.77 6,790
Industry 5,106 7,871.35 24,820
Services 2,441 5,217.65 25,513
3. Nominal GDP (UGX Billions) 55, 602 132,249 1,451,250
4. Real GDP (UGX Billions) 25,203 40,760 128,200
5. Forest Cover (per cent Land Area) 14 18 24
Objective 2: Increase the stock
and quality of strategic
infrastructure to accelerate
the country’s competitiveness
1. Gross capital formation as a
percentage of GDP
25.5 27.7 30
2. Total national paved road network
(Km)
3,795 5,295 119,840
3. Percentage of cargo freight on rail
to total freight
12 25.5 80
4. Percentage of the population with
access to electricity
14 30 80
5. Consumption of electricity (Kwh
Per capita)
80 578 3,668
Objective 3: Enhance human
capital development
1. Life Expectancy at birth 54.5 60 85
2. Infant mortality rate per 1,000 live
births
54 44 4
3. Maternal mortality rate per 100,000
live births
438 320 15
4. Child Stunting as a per cent of
under-5s
31 25 0
5. Total Fertility Rate 6.2 4.5 3.0
6. Primary to secondary school
transition rate
73 80
7. Net Secondary completion rates 35.5 50
8. Average years of schooling 4.7 11
9. Safe water
coverage
Rural 65 79 100
Urban 77 100 100

ASSP 2015/16 to 2019/20 Draft 6
NDPII Goal and Objectives Development Indicator Baseline Targets
2012/13 2019/20 V2040
Objective 4: Strengthen
mechanisms for quality,
effective and efficient service
delivery
1. Government Effectiveness Index
(2.5 weak; 2.5 strong)
-0.57 0.01
2. Public Resources Allocated to Local
Governments Level (per cent)
19 30
3. Corruption Perception Index (CPI) 2.9 3.7 7.1
Note: *This is an average for the Plan period ending that year
1.4.5 Operation Wealth Creation
The GoU and stakeholders all acknowledge that agriculture has, for a long time, been a core sector
of the economy providing the basis for growth in other sectors and significantly contributing to GDP
and employment. Under Operation Wealth Creation (OWC), it is the objective of GoU that national
policies, interventions and programmes aim at transforming agriculture from subsistence to
commercial agriculture with a target of raising household incomes to a minimum UGX20 million
per household per year. Significant attention will be given to generating and disseminating improved
research through the National Agriculture Research Organisation (NARO) and the revamped
National Agriculture Advisory Services (NAADS) that is now responsible for procurement and
distribution of improved agro inputs and technologies. This strategic plan will therefore provide the
platform for the OWC initiative that will complement efforts to achieve the NDP II and ASSP
objectives.
1.4.6 The National Agriculture Policy
The ASSP operationalises the National Agriculture Policy (NAP). The overall objective of the
agriculture policy is to achieve food and nutrition security and improve household incomes through
coordinated interventions that focus on enhancing sustainable agricultural productivity and value
addition; providing employment opportunities, and promoting domestic and international trade. The
NAP is pursued through six inter-related strategic objectives as follows:
1. Ensure household and national food and nutrition security for all Ugandans;
2. Increase incomes of farming households from crops, livestock, fisheries and all other agricultural
related activities;
3. Promote specialisation in strategic, profitable and viable enterprises and value addition through
agro-zoning;
4. Promote domestic, regional and international trade in agricultural products;
5. Ensure sustainable use and management of agricultural resources; and
6. Develop human resources for agricultural development.
1.5 Process of developing the ASSP A consultative approach, conducted in two phases, was adopted in preparation of this ASSP. Phase
1 entailed a review of the predecessor plan, the DSIP. This culminated in the production of the DSIP
review report that was discussed in the sector wide consultative workshop i.e. special Agriculture
Sector Working Group (ASWG) meeting. Phase 2 entailed the development of the Agriculture
Sector Strategic Plan, informed by the findings, conclusions and recommendations arising from the
review and the medium term priorities provided by the national development-planning framework.
These processes were informed by a comprehensive review of literature at global, continental,
regional, national and sector levels and consultative engagement of key stakeholders.

ASSP 2015/16 to 2019/20 Draft 7
Figure 2: The ASSP planning and formulation process
To facilitate the process, 26 thematic teams were constituted each of which conducted several
consultative meetings. The membership of each team was drawn from MAAIF and its agencies,
private sector producers and processors representatives where applicable; relevant MDAs; academia
representatives; researchers; development partners; local governments representatives; and subject
matter specialists. These stakeholders’ expectations, views and aspirations were collated and used
to inform the preparation of the ASSP in line with the Sector Plan Development Guidelines (SPDG)
provided by the National Planning Authority (NPA).
Underpinning the design of the ASSP are detailed working papers and framework implementation
plans (FIPs). The thematic teams developed 26 FIPs. These provide detailed calculations of
production projections and targets and clarifications of the implementation modalities of the ASSP
through its 5-year duration. These FIPs will provide detailed guidance for the ASSP
operationalisation by respective programme and project managers.
1.6 Principles underpinning the ASSP A number of guiding principles have been adopted to guide the ASSP development process. These
include:
1. Drawing guidance on agriculture sector delivery priorities of the medium term from the
National Development Plan II;
2. Building on past achievements, learning lessons and drawing experiences from the
implementation of the preceding plan, the DSIP 2010/11-2014/15;
3. Relating the architecture, implementation modalities and performance indicators of the
MAAIF’s priority strategic actions with the sector planning guidelines and the monitoring and
evaluation framework of the NDP II;
4. Fostering implementation synergies and linkages among various priority and strategic
commodities development actions, the agriculture technical and advisory services action, the
critical farm inputs actions and the institutional and enabling environment strengthening
interventions;
5. Building interfacing actions and modalities in the ASSP with the development plans of other
sectors for example; local government; works and transport; trade, industry and cooperatives;
and plans of other private, civil society and development partner actors;
STEP 1
Review of the DSIP 2010/11-
2014/15
STEP 2
Discussion of DSIP review
report by ASWG
STEP 3
Consultative planning
meetings held by 26
thematic team
members
STEP 4
Draft ASSP presented to MAAIF / NPA
STEP 5
Revised ASSP presented to stakeholder
meeting
STEP 6
Revised ASSP submitted to
Cabinet

ASSP 2015/16 to 2019/20 Draft 8
6. Rolling over un-completed actions from the DSIP to the ASSP;
7. Taking into account emerging priority sector issues in the development of priority actions for
medium term.
1.7 Structure of the ASSP The ASSP is presented in 6 chapters with additional information in annexes to the main document
as follows:
Chapter 1 presents the background of the ASSP and highlights of the agriculture sector. It also
presents the rationale for development of the ASSP, the process adopted for the preparation and the
structure of the plan.
Chapter 2 presents a situational analysis. It presents the agriculture sector trends and progression
towards the National Development Plan-II indicators, the performance and the institutional capacity
status of the agriculture sector.
Chapter 3 outlines the strategic direction of the agriculture sector for the medium term. The vision,
mission, outcome indicators and objectives are provided as part of this chapter. It also provides an
alignment of the ASSP to the NDP-II and other national and international commitments and
priorities that cut across all sectors. An analysis of sector priorities, strategies and interventions is
also presented.
Chapter 4 presents the institutional arrangements for the implementation of the plan. Under this
chapter, the implementation framework and actions to be conducted to effectively implement the
plan, the actors, their roles and responsibilities and proposed institutional coordination arrangements
for implementing the ASSP are outlined.
Chapter 5 provides the ASSP financing strategy that defines MAAIF’s indicative financial plan and
presents estimates of required resources to implement the planned activities. The guiding principles
and strategies underlying the ASSP revenue and cost estimation and the strategic financial resource
indicative budget are also provided.
Chapter 6 presents the monitoring and evaluation framework which include a logical framework
defining the key programme-specific inputs, outputs, outcome and impact indicators as well as the
monitoring and evaluation activities to be undertaken at the various supervisory levels of the sector
in general and the MAAIF in particular.

ASSP 2015/16 to 2019/20 Draft 9
2 SECTOR SITUATIONAL ANALYSIS
2.1 Agricultural sector contribution to the national economy
2.1.1 Growth and contribution to GDP
The growth of the agricultural sector for the period 2010 to 2014 was sluggish but there has been
some indication of recovery since 2013. The agricultural sector growth declined from 2,6% in 2010
to -0,2% in 2012, before recovering to 3,6% in 2013 and 2,9% in 2014. As shown in table 3, the
agricultural sector average annual growth rate was 2,2%, which is lower than the average annual
GDP growth rate of 5,2% and the average annual population growth rate of 3% over the same period.
This implies that per capita agricultural GDP has been declining. It is also far short of the 6% growth
target for the agricultural sector set by African governments under CAADP, as well as the 5,2%
targeted for the period 2012-2015 under the Vision 2040.
Table 3: Agricultural sector growth rates 2010-2014
The cash crop and food crop sub-sectors registered average annual growth rates of 1,1%, compared
to 2,5% for the livestock sub-sector, -0,7% for agricultural support services, 6,6% for forestry and
0,9% for fisheries. It is only the livestock and forestry sub-sectors that registered a consistently
positive growth rates over the period 2010-2014 and this may be an indication of systematic
challenges across the sector.
The Agricultural sector GDP at the 2009 constant prices increased from 10,932 billion shillings in
2010 to 11,862 billion shillings representing an 8.5% increase, which is lower than the 19,8%
increase in the total GDP over the same period. As shown in Table 4, the contribution of the
agricultural sector to GDP declined from 25,4% in 2010 to 23% in 2014. Of the agricultural sub-
sectors GDP, the average contribution for the different sub-sectors was 1,7% of GDP for cash crops,
12,7% for food crops, 4,2% for livestock, 0,03% for Agriculture Support Services, 4,0% for Forestry
and 1,2% for fisheries.
2010 2011 2012 2013 2014 Average
Agriculture, forestry and fishing 2.6 2.0 -0.2 3.6 2.9 2.2
Cash crops -10.7 11.7 -5.0 10.5 -0.9 1.1
Food crops 3.1 0.0 -2.5 2.0 3.0 1.1
Livestock 2.3 2.4 2.3 2.6 2.8 2.5
Agriculture Support Services 4.2 0.0 -7.7 0.0 0.0 -0.7
Forestry 8.9 5.0 6.1 9.7 3.5 6.6
Fisheries 2.1 0.5 3.7 -6.7 5.1 0.9
Source: UBOS Statistical abstract 2015

ASSP 2015/16 to 2019/20 Draft 10
Table 4: Agriculture sector contribution to GDP 2010-2014
2.1.2 Contribution towards poverty reduction
Uganda has continued to reduce the number of people living in absolute poverty. The national
household surveys 2012 revealed that the national poverty rate fell to 19.7% in 2012/13, from
24.5%in 2009/10. Although agriculture has grown significantly slower than the economy as a whole,
the sector continues to employ the majority of the workforce with 72% of the workforce and 87%
of the working poor being primarily engaged in agricultural activities. Therefore, increasing the
productivity and commercialisation of the sector are critical drivers of poverty reduction.
The Poverty Status Report (PSR) 2014 revealed that between 2009/10 and 2012/13, rural areas
registered larger reductions in both the incidence and intensity of poverty. The population depending
on agricultural income (subsistence and commercial) experienced the largest reduction in
multidimensional poverty. Multidimensional headcount ratio among those engaged in subsistence
agriculture declined from 75.7% in 2009/10 to 61.9% in 2012/13, (-13.8 percentage points), while
those engaged in commercial agriculture declined from 61.0% in 2009/10 to 41.6% in 2012/13 (-
19.5 percentage points). The report also revealed that unreliable rainfall had large negative effects
in rural areas with household consumption reducing by around 14% if the main rainy season begins
a month or more later or earlier than usual. This results in lower rural incomes, and increases in rural
poverty. This signifies the need to increase access to water for production as dependence on rain fed
agriculture by most smallholder farmers increases their vulnerability to poverty.
According to the PSR, the considerable reduction in poverty over the years is attributed to Uganda’s
better-integrated agricultural value chains, which have been particularly important in ensuring
agricultural households share the benefits of economic growth. The report notes that growth without
improvements for the poorest households will be self-limiting, mainly due to the smaller domestic
market. On the other hand, broad-based growth driven by the agricultural sector allows for a larger
pool of domestic savings to finance an expansion in private investment, while stronger domestic
demand and relatively cheap agricultural commodities ensure high investment returns and strong
employment growth. Therefore, productivity growth and improved market integration in the
agricultural sector are critical for both poverty reduction and structural transformation of the
2010 2011 2012 2013 2014 Average
GDP at market prices (Bil. UGX) 43,085 46,024 47,233 49,305 51,632
Agriculture, forestry and fishing
(Bil. UGX)
10,932 11,153 11,135 11,532 11,862
%age share of GDP 25.4 24.2 23.6 23.4 23.0 23.9
Cash crops 1.7 1.8 1.7 1.8 1.7 1.7
Food crops 14.0 13.1 12.4 12.2 12.0 12.7
Livestock 4.4 4.2 4.2 4.1 4.0 4.2
Agriculture Support Services 0.03 0.03 0.03 0.02 0.02 0.03
Forestry 3.9 3.8 4.0 4.2 4.1 4.0
Fisheries 1.4 1.3 1.3 1.2 1.2 1.2 Source: UBOS Statistical abstract 2015

ASSP 2015/16 to 2019/20 Draft 11
economy.
One of the main barriers to agricultural productivity growth at the smallholder level remains limited
use of intermediate inputs, such as improved seeds and fertilisers. The majority of smallholder
farmers remain subsistence-orientated, using few intermediary inputs and rudimentary technology
to produce low-value crops. Government plans to strengthen farmer organisations and increase its
partnerships with private actors to promote the integration of smallholder farmers into larger value
chains and thereby achieve agricultural transformation.
2.1.3 Contribution to exports
The Agricultural sector exports have grown progressively over the years, from US$868.1m in 2010
peaking at US$1.32b in 2013 before reducing to US$1.29b in 2014. Over the period, the agricultural
exports increased by 49%, which was better that the 29.1% growth registered for the non-agricultural
exports, while the total exports increased by 39.7%. Accordingly, the agricultural exports share in
total exports has increased from 53.6% in 2010 to 57.2% in 2014 as summarized in figure 3 below.
Figure 3: Uganda's agricultural exports (US$000) 2009-2014
Source: Statistical abstract 2015
Considering the 2014 agricultural exports, Coffee is the main agricultural export commodity for
Uganda that generated $410,1m (31,7%) of the agricultural export revenues. The second biggest
agricultural export commodity is fish and fish products that generated $134,8 (10,4%) of the
agricultural export revenue during the period. Table 5 below summarizes Uganda’s agricultural
exports during the period 2010-2014.
Table 5: Uganda’s agricultural exports 2010-2014 (US$,000)
2010 2011 2012 2013 2014
Agricultural Exports 868,161 1,210,574 1,225,117 1,325,769 1,293,288
Non-Agricultural Exports 750,443 948,503 1,132,376 1,081,967 968,680
Total Exports 1,618,603.7 2,159,077.3 2,357,493.2 2,407,735.6 2,261,968.0
0
500,000
1,000,000
1,500,000
2,000,000
2,500,000
3,000,000
Val
ue
($
,00
0)

ASSP 2015/16 to 2019/20 Draft 12
Commodity 2010 2011 2012 2013 2014 %age
Change
%age
share
Coffee 283,891 466,659 372,166 425,407 410,064 44.4 31.7
Fish & Fish Products 127,651 136,218 128,322 126,727 134,791 5.6 10.4
Animal/Veg Fats & Oils 55,181 101,111 110,427 100,050 102,321 85.4 7.9
Tea 68,263 72,126 73,902 85,589 84,739 24.1 6.6
Hides and Skins 17,061 33,067 41,632 64,352 73,758 332.3 5.7
Sugar & Sugar Confectionary 60,169 81,872 122,672 85,304 68,937 14.6 5.3
Tobacco 68,662 53,981 69,746 120,201 66,018 -3.9 5.1
Cocoa Beans 35,121 44,546 38,434 54,833 59,429 69.2 4.6
Sesame Seeds 12,882 17,318 11,714 28,468 55,165 328.2 4.3
Maize 38,206 26,752 56,916 42,254 43,567 14 3.4
Sorghum 1,404 346 3,793 25,565 35,165 2404.6 2.7
Dairy products & bird's eggs 16,266 18,191 20,719 25,685 29,528 81.5 2.3
Flowers 22,474 21,457 26,802 28,725 28,732 27.8 2.2
Rice 16,456 18,442 38,886 36,966 28,688 74.3 2.2
Beans &Other Legumes 10,200 20,428 14,237 20,577 26,191 156.8 2.0
Cotton 19,919 86,011 74,898 31,686 21,918 10 1.7
Vegetables 4,290 3,484 8,306 11,730 14,655 241.6 1.1
Vanilla 4,352 2,957 2,362 2,731 2,651 -39.1 0.2
Fruits 722 1,443 1,190 1,502 2,077 187.7 0.2
Live Animals 3,985 1,654 1,748 2,797 2,006 -49.7 0.2
Soya beans 294 875 1,230 887 912 210.2 0.1
Ground-nuts 88 163 2,496 1,750 816 827.3 0.1
Bananas 128 255 466 239 587 358.6 0.0
Pepper 496 1,218 2,053 1,744 573 15.5 0.0
Total 868,161 1,210,574 1,225,117 1,325,769 1,293,288
Source: Statistical abstract 2015
Over that same period, five agricultural export commodities suffered declines in exported quantities
and these were fish and fish products (24.7%), tobacco (21.4%), maize (18.9%), vanilla (80.4%) and
fruits (14.5%). Tobacco and vanilla also experienced declines in export revenues of 3.1% and 39.1%
respectively.
Uganda’s agricultural exports are mainly destined to the European Union (EU) and the regional
markets, especially the neighbouring countries. Several major issues undermine the agricultural
export performance and they are as follows:
1) Inadequate capacity by both the public and private sector to regulate/ enforce and comply
with sanitary and phytosanitary standards (SPS) that guarantees the health and safety of
consumers, especially for commodities destined to the EU market. The capacity of the
private sector to meet market quality standards and public sectors to effectively regulate and
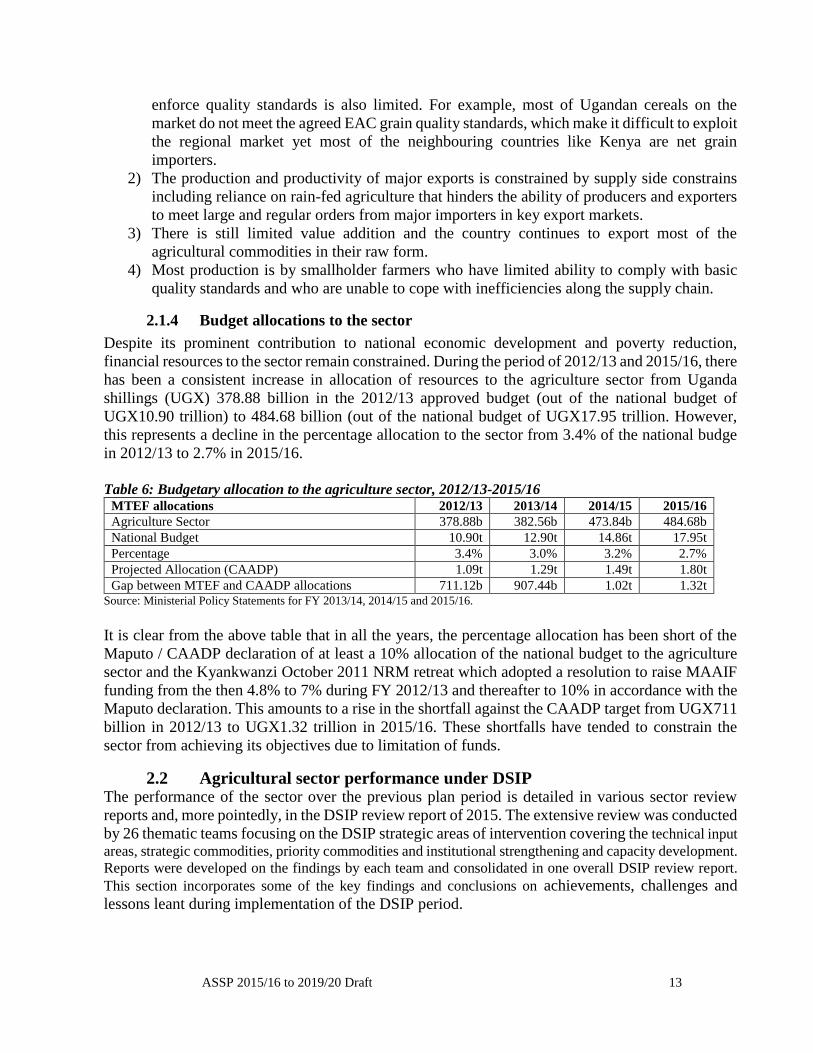
ASSP 2015/16 to 2019/20 Draft 13
enforce quality standards is also limited. For example, most of Ugandan cereals on the
market do not meet the agreed EAC grain quality standards, which make it difficult to exploit
the regional market yet most of the neighbouring countries like Kenya are net grain
importers.
2) The production and productivity of major exports is constrained by supply side constrains
including reliance on rain-fed agriculture that hinders the ability of producers and exporters
to meet large and regular orders from major importers in key export markets.
3) There is still limited value addition and the country continues to export most of the
agricultural commodities in their raw form.
4) Most production is by smallholder farmers who have limited ability to comply with basic
quality standards and who are unable to cope with inefficiencies along the supply chain.
2.1.4 Budget allocations to the sector
Despite its prominent contribution to national economic development and poverty reduction,
financial resources to the sector remain constrained. During the period of 2012/13 and 2015/16, there
has been a consistent increase in allocation of resources to the agriculture sector from Uganda
shillings (UGX) 378.88 billion in the 2012/13 approved budget (out of the national budget of
UGX10.90 trillion) to 484.68 billion (out of the national budget of UGX17.95 trillion. However,
this represents a decline in the percentage allocation to the sector from 3.4% of the national budge
in 2012/13 to 2.7% in 2015/16.
Table 6: Budgetary allocation to the agriculture sector, 2012/13-2015/16
MTEF allocations 2012/13 2013/14 2014/15 2015/16
Agriculture Sector 378.88b 382.56b 473.84b 484.68b
National Budget 10.90t 12.90t 14.86t 17.95t
Percentage 3.4% 3.0% 3.2% 2.7%
Projected Allocation (CAADP) 1.09t 1.29t 1.49t 1.80t
Gap between MTEF and CAADP allocations 711.12b 907.44b 1.02t 1.32t Source: Ministerial Policy Statements for FY 2013/14, 2014/15 and 2015/16.
It is clear from the above table that in all the years, the percentage allocation has been short of the
Maputo / CAADP declaration of at least a 10% allocation of the national budget to the agriculture
sector and the Kyankwanzi October 2011 NRM retreat which adopted a resolution to raise MAAIF
funding from the then 4.8% to 7% during FY 2012/13 and thereafter to 10% in accordance with the
Maputo declaration. This amounts to a rise in the shortfall against the CAADP target from UGX711
billion in 2012/13 to UGX1.32 trillion in 2015/16. These shortfalls have tended to constrain the
sector from achieving its objectives due to limitation of funds.
2.2 Agricultural sector performance under DSIP The performance of the sector over the previous plan period is detailed in various sector review
reports and, more pointedly, in the DSIP review report of 2015. The extensive review was conducted
by 26 thematic teams focusing on the DSIP strategic areas of intervention covering the technical input
areas, strategic commodities, priority commodities and institutional strengthening and capacity development.
Reports were developed on the findings by each team and consolidated in one overall DSIP review report.
This section incorporates some of the key findings and conclusions on achievements, challenges and
lessons leant during implementation of the DSIP period.

ASSP 2015/16 to 2019/20 Draft 14
2.2.1 Production and productivity
2.2.1.1 Agriculture research and extension
Regarding research, NARO and NAADS developed joint priority setting guidelines to ensure the
facilitation and development of closer linkages and collaboration between key players in
determining the research and advisory agenda and a Competitive Research Grants (CRG) Scheme
for research was established and supported over 180 projects. In order to promote functional
partnership between research and other stakeholders, District Adaptive Research Support Teams
(DARST) were established in each district with the level of DARST functionality increasing from
74% to 100% by 2012. Multi-stakeholder Innovation Platforms (MSIPs) were also established as
the main drivers of knowledge sharing, learning, joint demand-driven needs assessments and
implementation. NARO supported staff for long-term training, short-term training, professional
courses, workshops, seminars and conferences. NARO also re-configured the PARIs from research
and/ or commodity units or centres into programmes and carried out major and minor infrastructure
development activities at various zonal and national institutes.
There was also increased farmer access to information, knowledge and technology. Farmer Group
Development Training Manual and Farmer Fora Development Reference Manual were developed,
printed and disseminated for use by the FID implementers at the district and sub county levels. By
2012/13 a total of 3,499,193 beneficiaries directly (and 2,471,968 indirectly) benefited from
agricultural extension advisory services provided under ATAAS.
2.2.1.2 Pests and disease control
Considerable progress has been made in developing policies on pests and disease control resulting
in improved control of pests, vectors and diseases. Animal sub-sector outbreak communication
standard operating procedures (SOPs) were reviewed, updated and popularised amongst extension
workers; continuous countrywide forecasting of crop pest and diseases was undertaken; capacity of
the MAAIF laboratory technicians was strengthened for diagnosis of pests and diseases; a robust
post-entry quarantine regime to handle dangerous pests, diseases and weeds was established at
various border posts; tsetse and tick-borne diseases were controlled using various methods including
acaricides/ insecticides, pyramidal tsetse traps and live bait. A statutory instrument for identification
and traceability as well as identification and traceability guidelines have been drafted pending the
approval process.
2.2.1.3 Water for production
Regarding water for production, a total of eight schemes were developed, i.e. three schemes were
rehabilitated, one scheme is still undergoing rehabilitation while five schemes have had a pre-
feasibility study conducted and 17 feasibility studies were carried out on community based
irrigations schemes. In addition, district-based demonstrations on small-scale irrigation
technologies and rainwater harvesting and management were established in 23 districts.
Furthermore, various interventions were carried out on rehabilitation/ expansion of existing valley
tanks/ dams; construction of new valley tanks/ dams; and increasing water storage through surface
water reservoirs, gravity flow or ground water exploitation watershed management. With respect to
aquaculture, three new commercial aquaculture sites were established; 17 fishponds were
established; two aquaculture parks were established; eight landing sites were constructed/
developed; and, four regional fish hatcheries were constructed.

ASSP 2015/16 to 2019/20 Draft 15
2.2.1.4 Mechanisation
There was also an increased use of labour saving technologies. NEC has spearheaded an in-house
financing scheme while tractor donations by GoU to identified model farmer groups and for
neighbourhood contracting has been initiated; MAAIF also provided some tractors to farmers.
Through PPP, 30 heavy equipment and tractor operators and local suppliers/dealers were trained in
machinery operations. Various achievements were also attained in the promotion of mechanisation
for increased rice production. MAAIF also approved the positions of agricultural and mechanical
engineers while MoPS has also approved the positions of agricultural engineers in the local
governments.
2.2.1.5 Production and productivity of food crops
Area Planted: Over the period 2010-2014, all food crops registered an increase in the area planted
except banana that registered a small and insignificant decline of 0.41%. The average increase in
area planted over the five-year period was 8.5% for cereals (millet, maize, sorghum, rice and wheat),
6.12% for root crops (sweet potatoes, Irish potatoes, and cassava), 4.34% for pulses (beans, field
peas, cow peas and pigeon peas), and 8.25% for oil seeds (ground nuts, soya beans, sesame seeds
and sunflower).
Production: Over the same period, bananas registered a decline of 2.47% in the quantity produced.
Cereals production was static registering an insignificant average increase in production of 0.81%
(with millet and sorghum experiencing a decrease while maize, rice and wheat increased). The
average percentage decrease in production of root crops of 2.3% (with only Irish potatoes
experiencing an increase) and 3.72% for pulses were also significantly small. It is only oil crops that
registered a significant average percentage increase of 10.3% over the same period.
Yields: Of the 16 food crops analysed, only five crops registered any increase in yields during the
five-year period. Of the five crops, only maize (13.03%) and sesame seeds (16.55%) registered
significant increases, while the increases for the other three were either small or insignificant and
these are Irish potatoes (0.05%), beans (0.05%) and cow peas (4%). Overall, decline in yields over
the five years was significant for cereals (7.26%) and root crops (8%) but insignificant for bananas
(2.07%) pulses (0.61%) while oil crops registered a small increase of 3.85%. On a related note, the
yields of almost all the food crops are significantly below the on research station yields. For example,
the yield of maize was 2.6mt/ha compared to 5-8mt/ha. The yields for beans were estimated at
1.5mt/ha compared to the 2-4mt/ha. The table 6 summarizes food crops productions. Table 7: Percentage change in area planted, production and yields of main food crops
Commodity Percentage change
Area planted Production Yields
Plantain Bananas -0.41 -2.47 -2.07
Cereals 8.52 0.81 -7.26
Root Crops 6.12 -2.30 -8.00
Pulses 4.34 3.72 -0.61
Oil crops 8.25 10.43 3.85
Source: Computed based on statistics in the statistical abstract 2015

ASSP 2015/16 to 2019/20 Draft 16
Whereas area planted for most of the food crops has increased, the production has not increased at
the same rate and yields have, in most cases, declined. This suggests that any increases in production/
outputs of food crops are a result of increase in areas planted rather than increase in productivity
(yields). The poor yields may be due to limited access to water for agricultural production (WfAP);
limited use of fertilisers amidst declining soil fertility; limited use of certified seeds; limited
mechanisation; inadequate access to appropriate agricultural technologies; and inadequate access to
extension services leading to limited knowledge and adoption of good agronomy practices.
2.2.1.6 Cash crops
Over the five years (2010 – 2014), the main cash crops registered increase in production except
tobacco that registered a 6.2% decline. Coffee production expanded by 26.9%, while tea, cotton and
cocoa production is estimated to have increased by 24.8%, 3.7% and 56.1% respectively. As shown
in table 7, cotton production registered a positive trend, peaking in 2012 before starting a down ward
trend, while tobacco production has fluctuated on a downward trend. Cocoa production increase is
the highest although it started at a lower base. Increased production is attributed to increased
investment into some of the respective cash crops over the five years during the five years, as briefly
presented below.
Table 8: Production of main cash crops (000 tonnes)
Commodity 2010 2011 2012 2013 2014 %age Change
Coffee 166,968 191,379 186,126 232,561 211,872 26.9
Tea 49,182 54,178 57,939 59,934 61,376 24.8
Cotton 12,223 25,586 43,258 18,671 12,674 3.7
Tobacco 27,138 28,444 20,993 33,719 25,461 -6.2
Cocoa 16,478 17,936 19,664 26,352 25,720 56.1
Source: Statistical Abstract 2015
Coffee: 5% of coffee is produced by plantations, 10% by commercial farmers and 85% by
smallholder producers. Between 2010 and 2014, a total of 116,333,572 coffee seedlings were
planted benefiting over 570,000 households. The use of improved and certified inputs has been
promoted increasing Robusta coffee productivity from 600kg/ha in 2010/11 to 700kg/ha in 2013/14,
while Arabica coffee productivity has increased from 500kg/ha to 600kg/ha in 2013/14. UCDA
registers and licenses industrial players at post-harvest level, sets quality control standards under
which coffee is sold to the various markets, and inspects, certifies and documents all coffee exports.
Currently UCDA has 38 extension workers serving all the coffee growing districts with a ratio of
1:45,000 extension worker to farmers, compared to 1:50,000 in 2010. Coffee pests and diseases
surveillance has improved with 90% of pest and disease incidences being reported. A total of 1,000
stockists have been trained across the coffee growing districts compared to only 250 in 2010, and
4,197 million shade trees were distributed and planted by farmers mainly in Northern Uganda. A
total of 200,000 coffee farmers have been trained in business management and development skills
at coffee production and marketing levels.
The National Coffee Research Institute (NaCORI) was launched in 2014 with the mandate to
manage and carry out basic and applied research of a strategic nature and national importance in all
fields pertaining to coffee. UCDA has established the National Coffee Steering Committee and 30
district coffee platforms to strengthen linkages in coffee research, development and extension. In

ASSP 2015/16 to 2019/20 Draft 17
addition, three centres of excellence have been established in Kampala, Iganga and Bushenyi fully
equipped with laboratories and staff and 25 micro centres.
Tea: A total of 146,629,506 plantlets were distributed in the last 5 years giving acreage of 13,210ha.
This has increased acreage under tea to 41,210ha. However, the sector is constrained with inadequate
sources of planting materials; limited number of tea factories especially in areas especially in new
tea areas like Zombo and Nebbi; inadequate extension services; and inadequate funding for tea
research.
Cocoa: The number of districts where cocoa was growing in 2010/11 was 17 and the area under
cocoa was 17,380 hectares, grown by 10,200 farmers. During the period 2010-2014, 7.62 million
cocoa seedlings were procured and distributed to the farmers for planting bringing the total area
under the crop to 25,000 hectares grown by 13,000 farmers in 22 districts. However, none of the
cocoa growing districts has extension staff that are dedicated to cocoa production. Currently, there
are seven cocoa warehouses in the country used for sorting, bagging, storage, fumigation and
preparation of the cocoa beans for export. This includes validation of the quality of the beans, before
export, through inspection by MAAIF officials.
2.2.1.7 Livestock
Uganda experienced a steady increase in the number of livestock for all the main animals over the
period 2010-2014. The number of cattle increased by 12.5% from 12.1m to 13.6m animals, of which
about 93.6% of are indigenous breeds whereas 0.8% are beef exotic/ cross breeds and 5.6% are dairy
exotic/ cross breeds. The number of goats increased from 13.2m to 14m representing a 6.1%
increase. The number of sheep and pigs increased by 6.1% from 3.6m to 3.8m sheep, and 3.4m to
3.5m pigs respectively as summarized in the 4 below.
Figure 4: Livestock numbers (000 animals) 2010-2014
In line with the increases in the number of livestock, meat production has also increased over the
five years. The amount of beef produced increased from 180,300mt in 2010 to 202,929mt in 2014,
representing a 12.6% increase. Goat/ mutton produced increased from 33,619mt to 37,838mt
equivalent to a 12.5% increase, while the amount of pork produced increased from 19,669mt to
22,138mt equivalent to 12.6%. Similarly, milk production has increased from 1.38billion litres in
2010 to 1.55billion litres in 2014, representing a 12.6% increase over the period. The number of
0
5,000
10,000
15,000
20,000
25,000
30,000
35,000
40,000
45,000
50,000
2010 2011 2012 2013 2014
Cattle
Sheep
Goats
Pigs
Poultry

ASSP 2015/16 to 2019/20 Draft 18
poultry registered a 3.5% increase from 43.2m birds in 2010 to 44.7m birds in 2014. The poultry
sub-sector generated an estimated 856m eggs in 2014 compared to 761m eggs in 2010.
Despite the large livestock numbers, the output per animal in terms of meat production is very low.
The livestock sub-sector is challenged with inadequate supply of quality pastures; unavailability of
water for livestock, inadequate sources of high yielding breeding stock; weak capacity to provide
effective veterinary services and to control livestock diseases; inadequate capacity for sanitary and
phytosanitary control measures; and lack of appropriate meat marketing infrastructure.
2.2.1.8 Fisheries
Fisheries continue to be an important sub-sector contributing 1.2% to national GDP and 5% to
agricultural GDP of Uganda. It employs up to 1.3 million people. In 2014, fish and fish products
accounted for 10% of agricultural export value, second only to coffee.
Over the period 2010-2014, Government directed efforts towards promoting recovery of depleted
stocks of the large commercial fishes. Catch assessment surveys carried out revealed that in Lake
Victoria, the catches of Nile perch increased from 85,000mt in 2010 to 91,000MTs in 2014 and
tilapia increased from 17,000mt to 42,000mt in the same period. In Lake Albert, Nile perch
decreased from 8,600mt in 2012 to 3,800mt in 2014. Overall, fish catch increased by 16.6% over
the five years, 2010-2014 indicating recovery of fish stocks. The biggest increase in fish catch was
recorded on Lake Victoria (50.4%) but three lakes reported declines in fish catch. Table 8 presents
the distribution of fish catch by lake.
Table 9: Distribution of fish catches by lake (thousand tonnes)-2010-2014
Water Body 2010 2011 2012 2013 2014 %age change
Lake Victoria 162,929 175,817 185,000 193,000 245,000 50.4
Lake Albert 155,811 163,949 152,560 160,000 152,000 -2.4
Lake Kyoga 51,707 61,586 44,049 40,000 38,000 -26.5
Lake Edward, George &
Kazinga Channel
4,500 5,300 5,208 6,248 6,246 38.8
Albert Nile 5,200 5,000 5,043 5,500 5,390 3.7
Lake Wamala 5,600 75,112 5,712 4,500 4,590 -18.0
Other Waters 10,300 7,075 9,547 10,000 10,500 1.9
Fish catch 396,047 493,839 407,119 419,248 461,726 16.6
Source: Uganda Bureau of Statistics
In an effort to control illegal fishing, 14% of the boats were licensed in 2011 but reduced to 6.3% in
2014. In addition, over 60,000 nets were impounded and destroyed and over 100 trucks with
immature fish impounded, 150 boats were destroyed; over 2,000 suspects were arrested and
prosecuted. By 2014, compliance level by factories had increased with a reduction of undersized
fish processed by 90% mainly through self-policing schemes. Regular monitoring and enforcing fish
quality and safety standards has been implemented and to-date all fish export consignments from
the three main lakes are issued with fish health certificates.

ASSP 2015/16 to 2019/20 Draft 19
In an effort to develop the fishery of Small Pelagic Fishes, suitable fishing crafts, gears and methods
including catamaran boats, fishing equipment, large scale mechanized fishing rigs were adopted and
promoted resulting in the number of bigger motorized boats targeting small pelagic fishes to increase
on all water bodies. In addition to this, 106 mukene fishing grounds were mapped in three districts
on Lake Victoria and 40 community demonstration mukene handling infrastructure (drying racks)
at lading sites in nine local government districts riparian to Lakes Kyoga, Albert and Victoria were
established. Other achievements include promotion of suitable packaging methods; promotion of
five new mukene products (sweet mukene, powder mukene, sesame seeds mukene, chilled mukene
and chips mukene) to artisan women processors; standards were developed for the two products
namely ground or powdered and sundried mukene products. As a result of the above, during the
period under review, the number of products in local supermarkets and in the regional fish trade has
increased from three in 2009 to now over 10 and there has also been an increase in percentages of
mukene going for human and animal consumption to 15% and 85% respectively now compared to
10% and 90% in 2010.
In an effort to promote commercial aquaculture, an aquaculture parks investment policy was
developed and a national task force was constituted to develop a comprehensive aquaculture policy
for creating an enabling environment to spur commercial aquaculture investments. In order to
improve operation of aquaculture production systems, processes and input supplies, guidelines for
cage fish establishments were developed and cage enterprises have increased from 50 in 2009 to
1,300 cages on L. Victoria by 2014. One land-based and one water-based aqua parks in Apac and
Kalangala districts were mapped. On the other hand, to support small scale production to commercial
aquaculture, enhance production and supply of quality seed and to promote production of improved
feeds, (a) three dams in Rubirizi, Sembabule and Kole districts were stocked with a total of 78,000
fingerings of Chinese carp (b) four regional fry centres were constructed at Kajjansi, Mbale, Gulu
and Bushenyi and (c) one feed mill was established in Kibuku district by government and a private
major feed mill established in Jinja district.
2.2.2 Markets and value addition
MAAIF has tracked the outcome of improved markets and increase in value addition by monitoring
the export values of four major commodities (coffee, tea, cotton and cocoa) as well as GDP growth,
growth of commercial agriculture and the share of agriculture in the total GDP. Thus, between 2010
and 2013, there has been an increase in earnings of 9%, 31% and 7% from the export of coffee, tea
and cocoa respectively between 2010 and 2013. However, for cotton, there has been a decline of
74% over the same period. Regarding the contribution of agriculture to the economy, the share of
the sector to GDP growth and share of monetary contribution increased by 0.1% and 0.8%
respectively between 2010 and 2013. There was however, a decline in the share of agriculture in the
GDP from 22.7% to 22.5% in the same period of time.
Regarding improvement of policy and regulatory environment, MAAIF continued to prepare and/or
pursue approval of several policies and bills and the regulatory framework for input businesses was
strengthened. A Department of CIC was created to regulate seed, planting materials and agro-
chemicals. Accordingly, farmers were supported to access high quality inputs, planting and stocking
materials.

ASSP 2015/16 to 2019/20 Draft 20
In order to enhance private sector participation in value addition activities and investment, various
profitability information for enterprise selection and market information materials were generated
and disseminated. On the other hand, regarding capacity of farmer organisations in management,
entrepreneurship and group dynamics, (a) guidelines for farmer institutional capacity development
were produced and farmer groups and fora were strengthened. Farmer groups were accordingly
mobilised for delivery of advisory services while higher-level farmer organisations were
strengthened to enhance farmer participation in market development activities.
2.2.3 Enabling environment
Regarding policy analysis, implementation and monitoring, a joint agriculture sector review
workshop is held every year and projects that are developed are presented to the Agriculture Sector
Working Group and the Development Committee of MFPED for clearance. The target for
percentage agriculture to total (domestic) budget was projected to increase from 4.7% in 2011/12 to
5.2% in 2013/14. However, the target was not achieved as, instead, the percentage decreased from
5.1% to 3.3% between the same period implying a widening gap between the NDP MTEF and
approved share for agriculture.
There was also improved public education and communication on agriculture and natural resource
issues during the period under review. For instance, annual agricultural trade shows, World Food
Day celebrations, BBW sensitisation, pre-JASAR visits, national agro awards and regional agro-
trade fairs were conducted. In addition, intra and inter sector coordination was strengthened.
Furthermore, a National Statistics Technical Committee (NASTC) and the Sector Statistics
Committee (SSC) were established. Regarding development of a national food and agricultural
statistics system, a number of sector surveys have been undertaken in many areas. A national
agricultural statistics bank is also being created in the Department of Planning while a National Early
Warning System (NEWS) Unit has been established.
2.2.4 Institutional strengthening
2.2.4.1 Institutional reforms and human resources capacity
MAAIF is implementing its new structure in accordance with the restructuring report of 2010. New
departments have been established and these are the Department of Crop Inspection and
Certification (CIC); Department of Entomology; Department of Fisheries Resources Management
(FRM) and Development; Department of Fisheries Regulation; Department of Aquaculture;
Department of Agribusiness; and the Statistical Division. In 2010, MAAIF had 411 staff out of the
approved 641 staff. Since 2012, clearance was granted to fill 239 vacant posts on the revised MAAIF
structure, while clearance for an additional 175 staff is pending as per the Recruitment Plan. 156
posts have been filled through new appointments and promotions. Recruitment for the 45 priority
positions was conducted and the following personnel appointed: three commissioners for FRM, CIC
and entomology; 10 assistant commissioners; 14 principal officers; six senior officers; and 12
statisticians. There has also been an improvement in linkages and collaboration between MAAIF
and district local governments (DLGs).
At the DLG level, the approved structure provides for a minimum of six personnel in each district,
equivalent to a total of 672 staff for the 112 districts. In 2015, only 77 out of the 672 positions were
filled (11.5%). At sub-county level, the approved structure provides for a staff establishment of
7,248 personnel, of which only 1000 (13.8%) were filled as of June 2015. A total of 3236 critical

ASSP 2015/16 to 2019/20 Draft 21
positions are required at sub-county level for implementation of single spine extension system, of
which only 389 positions are filled (12%). Over the ASSP implementation period, the sector will
prioritise recruitment of staff especially at the district and sub-county level to support the
implementation of the single spine extension system.
In addition, the zonal and district sub structures have been established at MAAIF HQ and at zonal/
district levels and veterinary inspectors and fisheries inspectors recruited and deployed to staff the
positions. However, the expanded structures of agricultural training institutions (ATIs) have not been
integrated into the MAAIF HQ structure. Staff capacity development plan was formulated and is in
place for the ATIs following approval by the MAAIF Training Committee. However, recruitment of
105 critical positions to enable the proper operation of the expanded college structure is still
outstanding. The curricula of ATIs are yet to be reviewed and the teaching and physical infrastructure
remains in poor state. While student enrolment has increased, the credibility of the ATIs has remained
poor.
2.2.4.2 Construction of MAAIF HQ and district agricultural offices
MAAIF commenced activities that will lead to construction of new office space following the
restructuring of the Ministry. The Ministry plans to develop permanent premises to relocate the
MAAIF Headquarters from Entebbe to Kampala. The proposed offices are expected to be
constructed in Bugolobi Suburb. So far architectural and structural designs have been developed and
approved by Kampala Capital City Authority (KCCA). NEMA has also given a clearance (no
objection) to the proposed construction. The works and services will be procured as provided for in
the public private partnership (PPP) model to be adopted. On a related note, whereas support has
been extended to district local governments to enhance their capacity to deliver services, a number
of districts lack appropriate office and basic facilities. Over the ASSP implementation period,
structured support will continue to be extended to district local governments to deliver the sector
mandate at the grassroots.
2.2.4.3 National agricultural statistics
The Agricultural Sector Statistics Committee was established and the terms of reference to guide its
operations were also developed. This structure has been active throughout the five years of the DSIP
implementation, providing timely and appropriate agricultural statistics service to sector stakeholders.
Additionally, subsector working groups (livestock, fisheries, crop and environment) were established
to guide the technical implementation of the sector activities. Besides, the Statistics unit was elevated
to a department level and staff increased from 2 to 15 staff currently. Statisticians have also been
attached to different subsectors that include crop, livestock (where dairy lies) and fisheries.
A statistical methodology for estimating production was established through the inclusion of an
agriculture module in the National Population and Housing Census 2014 for construction of a master
frame. Secondly, the crop cutting method, a proposed methodology for estimating production was
piloted in 2015 in eastern Uganda on maize and rice production. Results will be used to determine its
appropriateness for use in estimating production. Furthermore, the statistics division has adopted the
use of global positioning system in its data collection activities. Three statisticians have been trained
in use of geographical information system software and use of ICT systems in statistics. Additionally,
an ICT unit has been formed within the statistics division headed by a senior statistician. A national
agricultural statistic databank has been established. Tools for collecting data for the system have been
developed and a database established. To-date, the agricultural reporting system is functional and

ASSP 2015/16 to 2019/20 Draft 22
administrative data is collected from at least 26 districts every quarter to estimate production figures
for the country and any other related statistical information.
Overall, the agricultural statistical capacity has been strengthened with the setting up of the statistics
division from a unit of two staff to now 18 staff team headed by an assistant commissioner. The
statistics division has also been equipped with machinery and equipment including two vehicles to
facilitate their work. Training of the statisticians in various areas has been conducted namely;
geographical information system (3 statisticians), industrial statistics (11 statisticians), data
processing (4 statisticians), food balance sheet development (4 statisticians) and producer price index
calculation (3 statisticians).
2.2.4.3 Monitoring and evaluation
The sector has progressed in operationalising the M&E framework. The M&E division was created
and is currently staffed with three permanent staff, which is still inadequate for effective
implementation of the M&E mandate. The sector M&E technical working group has been formed
and constitutes M&E focal points from the entire sector MDAs. The M&E Division together with
the technical working group produces annual M&E reports on the activities implemented by the
sector agencies, departments and projects and organises annual sector reviews. However, there are
inadequacies in the harmonisation of roles and activities undertaken by the M&E units of agencies
such as NARO and NAADS with those of the main M&E division in the MAAIF Planning
Department. Equally, the sector was not able to prepare a timely comprehensive baseline, mid-term
and final evaluation of the DSIP implementation to inform decision-making.
2.3 Challenges faced during the DSIP period There were some mismatches between designs of DSIP, ATAAS and non-ATAAS components. For
instance, ATAAS only addressed the first two components under Programme Area 1 on production
and productivity. The targets set in the DSIP for the national priority commodities were not the same
as those in ATAAS and FIPs. There was also lack of coherence between the DSIP and the FIPs.
While the FIPs were developed as an implementation guide to the DSIP, they were developed two
years into the implementation of the DSIP. Similarly, there was also a mismatch in resource
allocations between DSIP, ATAAS and non-ATAAS.
2.3.1 Crop related challenges
Many of the challenges identified under the DSIP continued to manifest in the sector. These included
poor agronomic practices that affected production; poor markets and marketing infrastructure for
many crop enterprises; funding constraints resulting in many FIPs not being implemented; limited
access to credit facilities hence many farmers were unable to acquire the necessary inputs; poor
standards, weak regulatory framework and poor enforcement due to limited capacity; limited
extension services due to very low extension staff to farmer ratio, laying-off of NAADS staff and
AASPs.
Other challenges were climate change effects resulting in unreliable weather affected many crops;
poor coordination among various stakeholders e.g. weak coordination among MAAIF, NAADS, the
districts and NGOs; human resource constraints with limited personnel to run all the strategic DSIP
activities; value addition constraints as knowledge on post harvest handling and value addition was
limited; food insecurity issues e.g. competition between the priority crops and other crops for food
security. There was also in-adequate engagement of women and youth; research and development

ASSP 2015/16 to 2019/20 Draft 23
issues e.g. production of foundation seed; weak monitoring and evaluation framework; and high
prevalence of pests and diseases e.g. CWD, banana xanthomonas wilt disease, cassava brown streak
virus disease, fruit flies and citrus canker.
2.3.2 Livestock and fisheries related challenges
These included weak policy and regulatory framework; production constraints e.g. limited
availability of quality feeds; land tenure and water rights issues affected water for agricultural
production; weak M&E System and statistics. Others included poor post-harvest handling and
processing constraints; poor stakeholder coordination – including PPP; human resource challenges
including number of staff, lack of training and poorly equipped staff; poor markets and marketing
infrastructure; and, funding constraints.
2.3.3 Lessons learnt and opportunities from DSIP
The DSIP review documented a number of lessons learnt that will inform the implementation of the
ASSP. These included:
a) Involvement of community based seed producers in planting material and seed production
of quality declared seeds (QDS) expedites multiplication, ownership and access to improved
seeds and planting materials;
b) Commitment, good will and support from national and grassroots political leaders are critical
in promotion of technology uptake;
c) Market availability can trigger enormous supplier response;
d) Smallholder farmers can utilise bank facilities for agricultural development and with
technical support and appropriate loan product, they have the capacity to repay their loans.
e) Another lesson has been that while the development of physical infrastructure is challenging,
it is frequently easier than the development of effective farmer lead management structures;
f) Establishment of national and district level platforms enhances commodity promotion;
motivation of staff in the agricultural sector is critical in enhancing their work;
g) Proactive engagement with key stakeholders is important in resolving issues of concern in
implementation; and,
h) Use of appropriate agricultural mechanisation technologies is greatly hindered by poor
extension services, lack of financial capacity, inadequate skills development and poor
marketing system.
The opportunities and emerging issues identified included:
a) Increasing use of urban agricultural residues/ waste and up-coming residues/ by-products
from the oil industry, as opposed to fertiliser production;
b) Increasing availability of processing plants on local and international markets;
c) Elevation of statistics unit to division level and the establishment of the single spine
extension system will create a pool of staff to facilitate data collection in the local
governments;
d) Current government’s good will and commitment of providing infrastructure for
development.
e) There are also positive attitude change towards irrigation, conservation agriculture and use
of production enhancing inputs such as fertilisers resulting in increased demand for irrigation
services and WfAP infrastructure;
f) Good relationships with development partners, which is an important instrument for
facilitating sourcing and provision of significant support;

ASSP 2015/16 to 2019/20 Draft 24
g) New pests and diseases that are emerging as serious impediments to crop and livestock
production;
h) High population pressure on land for residential use as opposed to food production;
i) Declining soil fertility and water stress issues due to climatic change; and,
j) Declining agricultural labour force and rapid land fragmentation affecting mechanisation.

ASSP 2015/16 to 2019/20 Draft 25
3 THE STRATEGIC DIRECTION OF THE SECTOR
3.1 ASSP’s vision, mission, objectives and outcome indicators
Under the ASSP, the sector’s vision is: ‘A competitive, profitable and sustainable sector’. Its mission
is: ‘Transforming the sector from subsistence farming to commercial agriculture’. The envisaged
transformation will help create employment opportunities, especially for the young and for women,
and increase household incomes, while ensuring household food security along the entire
commodity value chain.
The overall goal of the sector is: ‘To achieve an average growth rate of 6% per year over the next 5
years’. The overall development and growth of the sector is anchored on four strategic objectives or
priorities:
1. To increase production and productivity of agricultural commodities and enterprises;
2. To increase access to critical farm inputs;
3. To improve access to markets and value addition and strengthen the quality of agricultural
commodities; and
4. To strengthen the agricultural services institutions and the enabling environment.
Attainment of these objectives will require critical inputs and support from enabling sectors and
factors such as a conducive macro-economic environment, security, infrastructure, education and
social development. To deliver the vision of the agricultural sector, institutional reforms and better
coordination within sector institutions and enabling sectors will be critical.
Assuming a conducive external environment and support from enabling sectors, the agricultural
sector has set the following key outcome targets to be achieved over the plan period:
1. Increase productivity by farmers to at least 50% of the yields at research stations for the 12
priority commodities;
2. Transform subsistence farmers (growing for consumption) into enterprise farmers (growing
for consumption and responding to market needs) and transforming smallholders farmers into
commercial farmers;
3. Increase food security and food availability in all parts of the country;
4. Increase agriculture exports to at least $4 billion per year;
5. Reform and strengthen agricultural service institutions such as research, extension and
regulatory bodies to make them effective and efficient.
3.2 Sector growth priorities and interventions The ASSP identifies four priorities for enhancing the Agricultural sectors growth and contribution
to Uganda’s economic growth, poverty reduction, wealth creation, employment generation and
export growth. These strategic priorities and the interventions for delivering them are described
below. The strategies are presented at two levels: first, at a general level outlining the four strategic
priorities and detailed interventions and activities that will be implemented for and across all the
identified priority and strategic commodities; and, second, at the commodity level detailing the
specific or tailored interventions to be implemented for each priority and strategic commodity.

ASSP 2015/16 to 2019/20 Draft 26
3.2.1 Priority 1: Increasing agricultural production and productivity
3.2.1.1 Strategy rationale and outline
Under section 2.2, it was shown that increases in production had resulted from increase in acreage
as productivity of commodities continued to decline over the last five years. This is attributed to
farmers’ slow uptake of technological innovations, use of poor agronomic practices and high
prevalence of pests and diseases. In order to realise increased agricultural production and
productivity in the next five years, agriculture sector investments will be directed at strengthening:
1. Generation and adoption of research technologies;
2. Provision of extension services: enhancing access to extension services through
operationalisation of the single spine agricultural extension system;
3. Control of pests, diseases and vectors among crops and animals by strengthening the
institutional and regulatory framework; strengthening the capacity of laboratories and
disease control infrastructure; and conducting market surveillance to rid the market of
counterfeit agro-chemicals.
3.2.1.2 Strategic interventions
3.2.1.2.1 Strengthening ecologically sound agricultural research and climate change resilient
technologies and practices
In spite of the fact that the National Agricultural Research System (NARS) has generated a
significant number of technologies under its 10-year Strategic Plan (2008-2018), the majority of the
smallholder farmers have not accessed or adopted these technologies. This situation is manifested
in significantly wide yield gaps between the on-station and on-farm outputs. In addition, farmers
continue to grapple with the effects of climate change, characterized by erratic weather patterns,
which impact on agricultural production and productivity.
To accelerate production and productivity at national and household level, the ASSP will focus on
generation and up-scaling use of ecologically sound agricultural research and climate change
resilient technologies and practices across the identified priority and strategic commodities. The
specific undertakings that will be pursued under generation of technologies are:
1. Generating appropriate, safe, climatic change resilient and cost-effective agricultural
technologies, innovations and management practices (TIMPS), including nutrient dense crops
and innovative farming systems for improved household food security and nutrition. MAAIF
through NARO will undertake adaptive and strategic research interventions to:
a) Breed climate smart nutrient enriched farmer preferred varieties and breeds;
b) Develop improved high yielding crop varieties and livestock breeds;
c) Develop nutrient fortified and transgenic crops (bananas, maize, Irish potatoes);
d) Characterise plant and animal disease strains and agents;
e) Develop and release disease, pest and drought resistant varieties/ breeds;
f) Develop non-conventional animal feeds;
g) Conduct on-station and multi-location evaluation of generated lines;
h) Conduct on-farm trials and national variety evaluation trials for Value for Cultivation and
Use (VCU) and Distinctness, Uniformity, Stability (DUS).

ASSP 2015/16 to 2019/20 Draft 27
2. Strengthening the functioning of the NARS by identifying and building key human resource
capacity to support the sector. The specific interventions to be undertaken under this strategy
are:
a) Conduct routine capacity needs assessments and implement soft-skills capacity building
to change the mind-set of all actors;
b) Develop and implement a staff recruitment and retention strategy with incentives for high
performance and commitment;
c) Develop and implement a mentoring programme for junior scientists;
d) Conduct short and long term training on adaptive research support teams for technical
staff under the NARS
e) Establish an effective staff performance appraisal system;
f) Provide logistical support to NARO scientists
3. Developing and implementing a policy and regulatory framework for biotechnology in
agriculture. The activities under this intervention are:
a) Fast track the laws and standards of genetically modified organisms (GMOs) production
and utilisation;
b) Develop and enhance capacity for implementing research guidelines and procedures on
biotechnology use and bio-safety.
4. Developing and promoting technologies and protocols for value addition in agriculture and
agro processing to agricultural produce to increase value to producers and shelf life of
produce. The activities under this intervention are:
a) Conduct product development and end user marketability tests to enhance utilisation
options for a range of strategic and priority commodities;
b) Develop and validate technologies and protocols for agro-processing including protocols
for enhancing shelf life, uniform ripening and stability;
c) Test and ascertain thresholds on a range of parameters for food safety, quality assurance
and validate capacity for compliance;
d) Develop processing/packaging tools and equipment appropriate for local conditions.
5. Up-scaling uptake of existing and new TIMPS. Delivery and uptake of suitable TIMPS has
always been met by a range of barriers including: low purchasing power; limited physical access
to the inputs of intensification; inappropriate land tenure systems; limited derived demand for
the increased output; limited access to production inputs; and limited information, knowledge
and skills. This intervention will address the barriers through the following interventions:
a) Undertake technology promotion (production and agro-processing) and enhance farmer
access to information/ knowledge about existing and new technologies; and
b) Provide technology uptake grants for farmers, farmer groups and agro-processors.
3.2.1.2.2 Implement a single spine agricultural extension system while promoting gendered
innovation in agricultural research centres and extension services
Access to advisory services is a key determinant of technology adoption and uptake by farmers and
other stakeholders. The single spine extension service delivery system includes the following
reforms: i) Mainstreaming the NAADS programme into DLG structures and eliminate the existing
parallel extension systems, ii) Establishing a Directorate of Agricultural Extension Services

ASSP 2015/16 to 2019/20 Draft 28
(DoAES) in MAAIF to coordinate extension service delivery countrywide both in public and private
sectors and, iii) Supporting establishment of an independent input distribution system so that the
extension system deals with inputs for demonstration only. The specific activities to be implemented
under this strategy are described below.
1. Recruitment of extension workers at the district and sub-county levels. The DoAES will be
responsible for guiding recruitment by DLGs of extension workers at the district and sub county
levels. Recruitment will be carried out in a phased manner over the ASSP period, and prioritised
to districts with high production potential of the 12 priority and 4 strategic commodities. MAAIF
will also periodically review the single spine agriculture extension system with a view to
enhancing extension service provision and strengthening the linkages between DLG extension
service and MAAIF, as well as its Agencies.
2. Farmer education and refresher trainings of extension staff. This will involve equipping
extension staff with the basic knowledge and skills needed to provide extension services. The
knowledge and skills to be provided will include; basics of agronomy, livestock management,
poultry, soil management, nutrition and agribusiness among others. The DoAES will develop
and institutionalise a professional certificate course aimed at equipping extension workers (both
public and private) with requisite knowledge and practical skills for effective extension services
delivery in Uganda. This intervention will also involve transfer of knowledge using a package
of information materials and cost effective mass media communication channels to educate
farmers and disseminate the information.
3. Institutional strengthening of extension systems. The DoAES will develop an agricultural
extension policy and legal framework as well as strategic plans to guide and regulate public and
private sector extension services provision. Ethics and standards for agricultural extension
delivery will be developed and a framework for supervision and enforcement of the standards
will be established. An advisory committee consisting of eminent experienced stakeholders will
be established to advise the directorate on strategy and other matters.
4. Promote strategic partnership between research, technology development and extension
services at all levels. Under this intervention, MAAIF will establish functional multi-stakeholder
innovation platforms (MSIPs) to carry out joint implementation of adaptive research activities
and strengthen linkages between agricultural research, extension services, M&E and data
systems.
5. Provide farmers with timely quality extension services using available technologies and
modern agronomic practices. The intervention will include the following actions; review and
strengthen current dissemination pathways including MSIPs, District ARSTs, mass, print and
online media; plant clinics, demonstration sites, trade shows and exhibitions; and the farmer
Field School Approach (FSA). The intervention will also strengthen linkages and
technology/information exchange between ZARDIs and the DARSTs and between providers of
agricultural advisory services and those providing research services in each zone.
6. Farmer institutional development (FID): MAAIF will develop and rollout business oriented

ASSP 2015/16 to 2019/20 Draft 29
FID approach/model that will involve training and dissemination of guidelines to local
government extension staff on how to use the FID model. Inventory and capacity assessment of
existing farmer organisations will be conducted in each district to identify needs, gaps and
opportunities. MAAIF will facilitate DLG extension staff to conduct FID to address gaps and
opportunities identified in the FID capacity assessments.
7. Agribusiness development services and market linkages: This intervention aims at developing
agribusiness skills of extension workers and high level/downstream value chain development
actors using a market-oriented approach. This intervention will facilitate establishment of
business oriented multipurpose self-reliant sustainable farmer institutions; farmer capacity
development; market and agribusiness linkages; information and advisory services all aimed at
increasing incomes and food security. The specific actions under this intervention include:
a) Recruiting sufficient specialised service providers/ subject matter specialists to support the
priority and strategic commodity value chains;
b) Conducting inventory and profiling of agribusiness development service providers;
c) Linking farmers to agribusiness development service providers and other actors in the value
chains (e.g. through innovation platforms);
d) Developing capacity of farmers and farmer institutions in agribusiness, collective marketing,
negotiating contracts and engaging with other actors in value chains
e) Conducting regular market surveys and develop farmer capacity to benefit from identified
markets that are comparatively more profitable;
f) Conducting value chain mapping and analysis for priority and strategic commodities.
8. Establish and support at least ten commodity platforms for periodic information sharing and
discussion of issues pertaining to particular commodity value chains. The commodity
platforms will provide a forum for sharing of information and engagement among stakeholders
for identifying and addressing challenges along the value chain of the specific commodities.
3.2.1.2.3 Control diseases, pests and vectors
The control of diseases, pests and vectors interventions are aimed at reducing the prevalence of
production and trade sensitive diseases, creating orderly livestock, crop and fisheries marketing
protocols and improving the public sanitary and phytosanitary control systems to ensure that value-
added products do not transmit pests and diseases. The strategy will be guided by the following
actions.
1. Control of crops and livestock pests and diseases. This action will encompass the following
interventions.
a) Crop and livestock pests and disease control regulatory strengthening through formulating,
reviewing and operationalisation of supportive policies, legislation, standards and guidelines for
pests, vectors and disease control including data collection for informed policy analysis and
planning. This will be complemented with creation of awareness among the public on the new
regulations to enhance control and compliance. The target audience will include crop and
livestock farmers, traders, transporters, abattoir managers, law enforcement agencies, security
personnel, DLG officials, Uganda Revenue Authority (URA) personnel, consumers and the
general public.
b) Conducting early detection of crop and livestock pests, vectors, weeds and diseases outbreaks
and timely reporting of crop pests, weeds and disease outbreaks is essential for rapid field

ASSP 2015/16 to 2019/20 Draft 30
investigations, laboratory confirmation and prompt interventions to control them. Investments
will target the establishment of a functioning early warning and detection system for all
outbreaks. This will involve upgrading the surveillance systems using communities and modern
technology, timely reporting of diseases, vectors and pest outbreaks and conducting routine
surveillance in addition to procurement of appropriate agro-chemicals and equipment to address
the outbreaks;
c) Establishing and maintaining functional crop and livestock pests and disease control
infrastructure through investments that will target establishment of functioning regulatory
infrastructure needed for effective pests and disease surveillance and control. This will include
laboratories, as well as other appropriate infrastructure for enforcement e.g. that required at
border posts;
d) Controlling crop and livestock pests, diseases and vectors to ensure that communicable diseases
are effectively managed in order to promote crop and livestock health as a means to higher
production, productivity and market penetration. Over the plan period, surveillance, prevention
and control measures will be implemented for each of the priority commodities and for the seven
major livestock diseases, namely: tsetse and Trypanosomiasis; east coast fever; foot and mouth
disease; rift valley fever; African swine fever; rabies; and animal brucellosis.
3.2.1.2.4 Other production and productivity enhancing measures
1. Promoting Sustainable Land Management (SLM) and adaptation of climate change resilient
agricultural production systems, technologies and practices. MAAIF undertakes to promote
adaptation of climate change resilient agricultural production systems, technologies and
practices especially in areas of increasing climate change stress. The activities to be
implemented under this intervention include: targeting and implementing specific climate-
smart adaptation actions that include promotion and bulking of drought tolerant varieties;
water harvesting; index-based weather insurance; conservation agriculture; agro-forestry; and
integrated soil fertility management; set up climate smart villages for demonstrating CSA
options in areas whose agriculture is more susceptible to climate change using vulnerability
indicators, such as access to water, markets or gender equity in economic activities;
2. Increasing access to agricultural finance services by designing and implementing agricultural
commodity based development credit facilities with specific focus on the 12 priority and four
strategic commodities;
3. Promoting commercialisation of agriculture particularly amongst smallholder farmers.
MAAIF will establish and operationalise a commercialisation fund through which support will
be extended to smallholder farmers with potential to commercialise by helping them to
overcome binding constraints that will be identified on a case by case basis;
4. Promoting time and labour saving technologies targeting women farmers;
5. Strengthen linkages between farmers and production support services (including financial
services, capacity development and marketing) in partnership with the MoFPED and other
stakeholders.

ASSP 2015/16 to 2019/20 Draft 31
3.2.2 Priority 2: Increasing access to critical farm inputs
3.2.2.1 Strategy rationale and outline
Uganda’s agriculture is predominantly small-scale farming mainly in the high-potential areas. In
Uganda, farmers that are categorised as subsistence are estimated to deliver between 75–80% of the
total agricultural output and marketed agricultural produce. Smallholder enterprises deliver 12–15%
of marketed agricultural produce, being farmers having between 2–200 acres or greater (managing
it as business). Commercial farmers (comprised of 0.5% of farmers) account for 2–3% of agricultural
produce running large tea, sugarcane, coffee, rice and other estate farms. However, use of certified
inputs such as hybrid seed, concentrate feeds, fertilizer, safe use of pesticides and machinery by
subsistence and small-scale farmers is very low. There is huge potential for increasing productivity
for these farmers with increased access to inputs.
To realise increased access to critical farm inputs, sector investments over the next five years will
focus on four broad categories of farm inputs: agricultural machinery; quality seeds and planting
materials; water for agricultural production (WfAP); and fertilisers.
To promote access to agricultural machinery, investments will target: increased affordability of
agricultural machinery; acquisition and utilisation of agricultural mechanisation technologies
through public private partnerships (PPPs); supporting sustainable local manufacturing and
maintenance of suitable agricultural machinery for farm production and postharvest processing; and,
establishing appropriate incentive frameworks for the acquisition and financing of labour saving
technologies among others.
To improve access to high quality seeds and planting materials, the sector will invest in: formulation
and reviewing policies, laws and regulations for agricultural inputs including seeds and planting
materials supply and use; strengthen the national certification and regulation system and regulatory
institutions to guarantee the quality of seeds and planting materials on the market; enhancing the
capacity of the private sector seed industry to test and produce pre-basic seed; up-scaling use of
improved seeds and planting material by extending the inputs dealer network and supporting seed
companies to promote new varieties and cultivars; improving farmer knowledge of new varieties
and cultivars; and increasing availability and access to quality seeds/planting materials for priority
commodities by supporting their distribution to farmers for all the twelve priority and four strategic
commodities.
To promote access to WfAP, public investments will be directed towards increasing farmers’ access
to water for crop irrigation, livestock and aquaculture. Interventions will focus on: strengthening the
legal and institutional framework and enhancing sector capacity for developing water for agricultural
production; investing in modern irrigation technologies through construction of large as well as
promotion of small scale irrigation technologies in line with the zoning strategy; development of
large and medium water reservoirs and promoting rainwater harvesting and storage technologies for
agriculture at household and farm levels.
To enhance access and use of fertilisers by all categories of farmers, investments will target the
creation of an enabling environment for: fertiliser production, importation and distribution;
strengthening soil fertility knowledge management; increasing fertiliser awareness in the farming

ASSP 2015/16 to 2019/20 Draft 32
community; supporting development of physical infrastructure like warehouses for fertiliser
production, importation and distribution; and increasing availability of fertilisers for priority
commodities by supporting distribution to relevant farmers.
3.2.2.2 Strategic interventions
3.2.2.2.1 Promote agriculture mechanisation
Mechanized agriculture in primary production and postharvest handling is still low mainly because
of the limited awareness, costs of mechanisation in rural areas and limited awareness of the scope
of mechanized agriculture among the rural populations. An estimated 10% of the farmers employ
some form of mechanisation with about 8% using draft animal power (DAP) and another 2% using
tractors. This is a major factor contributing to low levels of production, productivity,
commercialisation and value addition. Along with other inputs and support to improve agricultural
production and productivity, agricultural mechanisation has proven to have the potential to:
a) Enhance labour use and efficiency;
b) Provide greater precision in farm operations;
c) Reduce agricultural losses; and
d) Contribute to value addition to products through processing and packaging.
The interventions proposed in this five-year plan, target increment of the existing pool by 3,500
additional tractors that are fully equipped with requisite accessories for primary and secondary
tillage. Farmers will acquire 15,000 ox-ploughs with accessories for use with DAP. Additionally,
specialised equipment will be acquired for postharvest and mechanised value addition of strategic
cereals, legumes, roots and tuber crops. These interventions will contribute to a steady increase in
the total annual acreage cultivated with projections of extra 116,000 acres cultivated in Year 1, rising
to an extra 164,000 acres by Year 5. In total, mechanisation is projected to add a potential 710,000
acres of cultivated land over the five-year period. Mechanisation for both the dairy and beef sub-
sectors including increased access to milking machines, coolers, refrigerated trucks, milk cans, meat
power saws, will be promoted and supported.
The planned investments include providing infrastructure for development and responding to the
increasing demand for agricultural machinery operators and mechanics. This offers an opportunity
for promoting mechanisation at various levels including training, infrastructure development and
utilisation of machinery for improved quality of agriculture products, which will translate into
creation of employment opportunities for the youth. The specific interventions to be prioritised under
this strategy are described below.
1. Promoting acquisition and utilisation of agricultural mechanisation technologies. Using a
series of PPP mechanisms, this intervention will stimulate the ownership and use of agricultural
machinery; thus motivating farmers to venture into mechanised agriculture for productivity
improvement and processing. The interventions will include:
a) Developing a framework to facilitate the operationalisation of the developed PPP models;
b) Supporting the developed linkages/partnerships that encourage and promote access, use and
uptake of appropriate agricultural mechanisation packages for increased farm productivity at
various levels including agro-processing. These actions will target; in-house financing
spearheaded by NEC, tractor hire service by MAAIF and OPM, commodity-based tractor hire
service and mechanisation input donations by GoU;

ASSP 2015/16 to 2019/20 Draft 33
c) Facilitating access to financial products including credit, leasing and hire services through
PPPs to adopt new labour saving and product quality improvement ideas and agricultural
mechanisation technologies;
d) Building and strengthening the capacity of public and private extension workers to provide
quality extension services in agricultural mechanisation.
2. Promote sustainable local manufacture and maintenance of suitable agricultural machinery
for farm production and postharvest processing. This intervention will be implemented through
the following priority actions in the different strategic commodities; establish a comprehensive
agricultural mechanisation policy and strategy with special consideration for taxation and consumer
protection; support skills development for manufacturers, artisans, technicians and mechanics;
access to credit under PPP models; identify mechanisation technologies through the entire value-
chain, that can be locally manufactured for different farming, postharvest and other agricultural
needs; identify local private engineering fabrication enterprises/ artisan groups with adequate
capacity and skills to handle fabrication of selected equipment prototypes; through appropriate PPP
type arrangements, provide support and encouragement to successful local manufacturers and artisan
groups to enable them popularise their products through demonstrations, field and open-days,
participation in shows/ exhibitions; train a critical mass of rural youth in fabrication, operation and
maintenance of agricultural machinery and tools.
3. Formulate and implement incentive frameworks for acquisition and financing of labour saving
technologies. This intervention will be implemented through: increased access to labour saving
technologies for land opening, planting, weeding, harvesting and threshing; develop incentive
packages to aid farmers boost production of agricultural commodities with mechanisation
technologies; sensitise and train farmers and agro-processors on strategies to access mechanisation
loan funds and address challenges of collateral; link relevant ministries, institutions and farmer
organisations to ensure implementation of the selected incentive packages for agricultural
mechanisation; identify key intervention areas for GoU input to catalyse mechanisation uptake.
4. Strengthening capacity for technical information acquisition, equipment evaluation and
sustainable operation of agricultural machinery. The breakdown or failure of agricultural
machinery is a common challenge to ensuring continuous routine farm operations. Part of the
challenge is limited capacity of farmers and service providers to use, maintain and manage
agricultural machinery. The intervention will involve; developing, packaging and disseminating
easy to use manuals for agricultural machinery and tools; conducting skills acquisition training and
demonstration events on use and maintenance of agricultural machinery and tools for farmer groups
and service providers. To achieve these interventions investments will target; provision of technical
guidance to MDAs, carrying out proficiency tests on new makes of tractors, equipment and
implements imported in the country and recruiting staff to maintain the heavy equipment at MAAIF.

ASSP 2015/16 to 2019/20 Draft 34
5. Establish an agricultural mechanisation resource centre for training machinery operators,
generating technical information and provision of referral workshop services for testing/
evaluating agricultural machinery. MAAIF will achieve the objectives of this intervention through;
refurbishing the agricultural mechanisation resource centre in Namalere for training machinery
operators, generating technical information and provision of referral workshop services for testing
and evaluating agricultural machinery; developing and publicising in user-friendly formats,
guidelines to enable farmers draw up mechanisation strategies; providing information and guidelines
for farmers wishing to select machinery for specific tasks and reviewing these with the farmers
wishing to acquire machinery.
6. Strengthen the capacity of technical and vocational institutions for training agricultural
mechanics and technicians. It is intended to achieve the objectives of this intervention through:
assessing and reviewing existing facilities at Vocational Training Institutions (VTI); assessing
existing capacity of staff and curriculum to train operators, mechanics and others; selecting suitable
vocational training schools for upgrading of facilities and human resources to undertake practical
machinery training; training to upgrade staff skills in training machinery operators, mechanics and
farmers; initiating means for review, evaluation of training programmes within vocational training
institutions; forming linkages with commercial farms and dealers where trainees can gain practical
real life experience.
7. Strengthen collaboration with the national bureau of standards to eliminate importation and
trade of substandard agricultural mechanisation equipment. The primary objective of this
intervention is to establish a code of practice that deters importers and dealers from importation and
trade of substandard agricultural mechanisation equipment. The main action under this intervention
is to develop and enforce standards for agricultural machinery and equipment.
3.2.2.2.2 Improve access to high quality seeds and planting materials
About 15% of crop area in Uganda was planted with improved seed in 2014 and it is proposed to
target an additional 20% of planted area by 2019/20 which should contribute an estimated 4%
increment in crop production. MAAIF intends to promote seed industry growth and development by
building capacity in all aspects of the seed value chain from production through processing to seed
marketing, distribution, strengthening accreditation and licensing of seed certification by private
seed companies. Focus will be placed on the following actions:
1. Strengthening and rationalising the department of regulation and certification for seed services
through: firming up controls at entry points, reinforcing the PQS scientific capacity to identify all
relevant pests and diseases and to participate in international research on relevant issues, improving
data and other information on the seed industry, improve seed quality assurance by maintaining
standards and practices for certified seed, training seed company staff, DLG extension staff and
accrediting extension staff. The interventions will include the following specific actions:
a) Improve phytosanitary control at entry points;
b) Strengthen Namelere laboratory;
c) Improve data and other information on the seed industry to support better policy and
programme plans, both by government and by the private sector;
d) Promote seed quality insurance across the country by conducting regular market surveillance
to rid the market of substandard/ counterfeit seeds;
e) Achieve ISTA accreditation and maintaining OECD Seed Schemes accreditation;

ASSP 2015/16 to 2019/20 Draft 35
f) Implementing PVP.
2. Enhancing the capacity of the private seed industry by: building up of a critical mass of plant
breeders and seed specialists who are trained and available for the industry; conducting training of
seed companies and local seed businesses in certified/ foundation seed production, variety/ breeders
seed maintenance, testing, marketing and quality control; providing support to private sector led
promotion of varieties through technology parks for demonstrations and independent evaluations
and seed variety fairs/ farmer field days at adaptation zone level; training and certifying rural agro-
dealers and seed stockists and enhancing access to buy-back financing. The outcomes will include
strengthened capacity of NARI institutes involved in input supply, enhanced breeder/foundation
seed production and supply as well as establishing and/ or strengthening agribusiness incubation
service centres.
3. Strengthen policies, laws and regulations for agricultural inputs including seeds and planting
materials supply and use by: setting standards and benchmarks for the private sector as well as
punitive measures for non-compliant market actors. MAAIF will undertake the following actions:-
a) Operationalise the plant and varieties protection (PVP) Act;
b) Establish a national seed sector database;
c) Conduct regular market surveillance of input dealers (wholesale and retails);
d) Engage input dealers to establish self-regulation standards among a network of professional
dealers and stockists as well as designing and implementing training courses for input dealers.
4. Up-scaling use of improved and climate change resilient seeds and planting materials by:
establishing climate smart villages in climate change vulnerability hotspots and mobilise farmers
into farmer groups to foster collective action; establish PPPs with seed companies, local seed
businesses and rural agro-dealer networks to bulk and market climate change resilient seeds and
planting materials; strengthen the climate change resilient seeds and planting materials marketing
and distributing system through training and awareness/ promotional activities for actors; establish
MSIPs to link farmers to climate change experts and business service providers, agricultural rural
service providers (ARSP) and agricultural advisory service providers (AASP)s; set up demonstration
sites to promote the CSA technologies; enhancing the enabling environment for scaling up climate
smart options. The above interventions will result in extended dealer network, through support to
UNADA; improvement in farmer knowledge of new varieties; and increased seed companies’
capacities to test and promote new varieties and cultivars.
5. Strengthen the national certification and regulation system to guarantee the quality of seeds
and other agro-inputs. This intervention aims at improving the capacity of certification and
regulation systems and linking them to international certification institutions. This will ensure
standards are enforced and regular inspection of seeds and agro-chemicals undertaken at all stages
of the marketing chain by officials of MAAIF with the objective of guaranteeing quality of seeds
and agrochemicals on the market.
6. Increase availability and access to quality seeds/ planting materials for priority commodities
by: raising farmers’ awareness of the value of adopting high quality and climate change resilient
inputs, technologies and agricultural practices. Training courses for farmers will be designed and
implemented, materials will be disseminated and demonstration plots established for promoting

ASSP 2015/16 to 2019/20 Draft 36
improved inputs. GoU commits to procure and distribute adequate high quality seeds and planting
materials for all the priority and strategic commodities.
3.2.2.2.3 Increase access to water for agricultural production
Research and various studies have highlighted the existence of significant potential in Uganda to
harness available water for increased agricultural production and productivity. For instance, only
40% of the irrigable area and 1/3 of the 66 km of total renewable water resources in Uganda is
utilised. In addition, the aggregate WfAP storage capacity meets only 2.32% of the total demand
(499 million m3) for livestock, irrigation, fish farming and rural industry. Therefore, this strategic
action is set to: promote positive attitudinal change towards irrigation and conservation agriculture;
increase demand for irrigation services and WfAP infrastructure such as water reservoirs; put in
place improved policy environment following development of the National Irrigation Policy;
develop and implement strategies to increase access to available natural water resources; and support
increased access to available water use improvement projects running in different parts of the
country. The following actions will be prioritised under this strategy.
1. Strengthen the legal and institutional framework and capacity for developing WfAP to create
an enabling environment for WfAP through policy support. The actions will involve:-
a) Developing an irrigation master plan, guidelines, action plans, framework and principles for
dissemination;
b) Preparing guidelines for appraisal and design of small-scale farmer-based irrigation schemes;
c) Developing of appropriate mechanisms for cost sharing and funding of WfAP-based
interventions;
d) Developing guidelines for a community based management system (CBMS) for operation
and maintenance of WfAP facilities and for water user associations (WUA);
e) Establishing and institutionalising Water User Associations (WUAs), cooperative societies
and other farmer groups in regulation and management of irrigated agriculture;
f) Establishing technical support units in LGs for agricultural water management (AWM); and
g) Promoting the uptake and use of the adapted small-scale irrigation technologies/options.
2. Investing in modern irrigation technologies through construction and promotion of large and
small-scale irrigation technologies respectively and development of large and medium water
reservoirs in line with the agricultural zoning strategy. Investments in modern irrigation technologies
will target the following actions:
a) Evaluation and rehabilitation of five existing public irrigation schemes of Atera, Kiige,
Labori, Ongom, Olweny and Odina;
b) Construction of Rhino Camp in Arua District, Labwor in Moroto District,Katete in Kanungu
District, Biiso in Bullisa District, Pabbo in Amuru District, Namalu, Kibimba-Gomba,
Musamya, Torchi in Oyam District among others;
c) Conducting feasibility studies and designing of three additional irrigation schemes covering
an area of 6,900ha namely Acomai irrigation Scheme, Atari Irrigation scheme and Namatala
Irrigation Scheme;
d) Establishing 11,000ha of community-based/strategic medium to large scale schemes at
Naigomwa in Iganga District and Igogero in Bugiri District;
e) Promoting small scale irrigation technologies by establishing at least a demonstration unit per
district per year across the country;

ASSP 2015/16 to 2019/20 Draft 37
f) Adapting and making affordable, small-scale irrigation technologies/ options including
garden hose, drip systems, travelling gun systems and hand line systems to meet smallholder
farmers’ needs.
3. Promote rainwater harvesting and storage at household and farm levels for agriculture The main objective of this action is to support equitable and sustainable water harvesting for crop,
livestock and aquaculture production and productivity. MAAIF will promote sustainable
multipurpose development and use of water resources including:-
a) Rehabilitating/expanding 102 public valley dams;
b) Rehabilitating/expanding 195 valley tanks;
c) Constructing 1,200 new valley tanks;
d) Establishing four commercial aquaculture sites of minimum 10 ponds;
e) Establishing two aquaculture parks in Mpologoma catchment and Olweny catchment;
f) Establishing three fish farms with four ponds in each of the districts of Mbarara, Gulu and
Sironko;
g) Developing two landing sites in Kaliro and Amolatar districts;
h) Developing and promoting rainwater harvesting technologies and disseminating best
practices for smallholder farmers.
3.2.2.2.4 Increase access to and use of fertilisers by all categories of farmers
In addition to limited farmers’ capacity to derive full benefits from a competitive fertiliser market,
access to and availability of fertilisers for smallholder farmers is still a major challenge. For instance,
average fertiliser use is estimated at 1 kg ha-1 yr-1 of applied nutrients compared to estimated nutrient
depletion of over 80 kg ha-1 yr-1. Also, fertiliser demand and use in Uganda is negatively influenced
by knowledge gaps. These include: erroneous perceptions about the ‘fertility’ of soils; limited
information on soil fertility management and the potential yield increment from fertilisers use on
crop production; out-dated and ¨blanket fertiliser recommendations that do not correspond to
changes in soil fertility; inadequate information about fertiliser types and their use and access to soil
analysis tools by farmers and agro-dealers. The following actions will be prioritised under this
strategy.
1. Create an enabling environment for fertiliser production, importation and distribution. This
intervention will be implemented through the following actions of the Fertiliser Market
Development Project (2015-2020):
a) Providing support to the Fertiliser Market Development Council (FMDC) operations
including; strengthening coordination of fertiliser sector activities, collection and
dissemination of fertiliser information, promotion of public-private sector linkages,
development and strengthening input-output market linkages;
b) Reviewing the National Fertiliser Policy and implementing regulations;
c) Encouraging investments in the production and marketing of soil fertility remedies such as:
fertilisers and bio-fertilisers in the strategic commodities.
d) Facilitating access to credit support for bulk purchasing as well as establishing and
operationalising the Risk Management Fund (RMF). This intervention targets increasing
access to finance for importers and agro-dealers, strengthening business linkages to promote
suppliers’ credit, piloting use of warehouse collaterals at import and retail levels by banks,
sensitizing bankers on risk management and collateral warehousing for fertiliser importers
and dealers, conducting training of trainers for AASPs, agro-dealers, stockists and organised

ASSP 2015/16 to 2019/20 Draft 38
farmer groups on fertiliser use and benefits; supporting private sector operators to gain
capacity to produce fertilisers and bio-fertilisers at competitive costs.
2. Strengthen soil fertility knowledge management and awareness creation. This intervention will
involve:
a) Updating soil fertility management and fertiliser use recommendations;
b) Developing soil fertility management and fertiliser use extension materials;
c) Increasing number of agro-dealers trained about fertiliser and with enhanced business skills;
d) Increasing number of Technology Transfer Agents (TTA) and farmers with fertiliser
knowledge and matching inputs.
3. Capacity building and physical infrastructure for fertilisers
a) Crop production risk management. This will involve piloting weather index insurance to
mitigate crop production risks and promote use of indigenous knowledge and soil and water
conservation technologies to mitigate crop production risks;
b) Capacity building project. This will involve strengthening quality assurance infrastructure
and establishing a distribution network for wholesalers as well as stockists and establishing a
pool of adequately trained personnel to manage a vibrant fertiliser subsector to achieve
sustainable use of fertilisers in the country;
c) Support physical infrastructure. This will involve strengthening the physical infrastructure
for transportation, distribution, storage and handling (fertiliser and produce) needed to
achieve sustainable use of fertilisers in the right quantities and quality, right time and at
affordable prices;
d) Development of domestic resources for soil productivity enhancement. This will be done in
partnership with the private sector and will involve facilitating resettlement of households in
areas with mineral deposits to pave way for exploitation of lime, phosphates and vermiculite
deposits in Tororo and Hima/Kasese.
3.2.3 Priority 3: Improving access to agricultural markets and value addition
3.2.3.1 Strategy rationale and outline
One of the ASSP aspirations is transforming subsistence farmers into enterprise farmers, and
enterprise farmers into commercial farmers. This requires ready market for the agricultural
commodities if this transformation is to succeed. Over the ASSP implementation period, investments
will target the improvement of agricultural markets and marketing using a four-pronged approach.
Firstly, interventions will promote private sector investment in physical agricultural markets,
improvement in the stock and quality of commodity storage facilities including cold chain storage
facilities, and commodity quality preserving transport systems along the value chains through PPP.
Secondly, the sector will build capacities of farmers, traders and processors in ensuring compliance
to quality standards and market requirements of the priority commodities. This will be realised
through; strengthening higher level farmer organisations for collective marketing; bulking; quality
and standards improvement; promoting appropriate technologies and practices for minimizing
postharvest losses along the entire commodity value chain; promoting commodity/farm based
storage and agro processing, and supporting measures to enhance access to formal domestic and
regional markets including intensifying enforcement of standards to ensure high quality of local
agricultural produce and improved market information flow.

ASSP 2015/16 to 2019/20 Draft 39
Thirdly, to increase value addition to agricultural products, the Government will focus on: promoting
contract farming or out-grower schemes for high-value produce in order to enhance large scale agro-
processing and ensure a steady supply of quality produce. In addition, government will promote and
support private investment in agro-processing of the prioritised agricultural products; support farmer
associations including women and youth associations to engagein agro-processing; facilitate equal
access to appropriate agro-processing machinery and equipment through favourable credit facilities.
Lastly, the Commercialisation Fund will be operationalised targeting priority commodities and will
involve the extension of support to all farmer categories. These will include small holder farmers
who will be encouraged to transition from subsistence farmers to enterprise farmers, while market
oriented farmers will be supported to become commercial farmers.
3.2.3.2 Strategic interventions
To enhance the sector’s contribution to wealth/ job creation and exports, the sector undertakes to
promote value addition and increased access to markets for agricultural produce, with a focus on the
specified priority and strategic commodities. The following interventions will be implemented.
3.2.3.2.1 Promote private sector investment in value addition through PPP
The ASSP emphasises the PPP approach as the preferred modality for interventions to promote value
addition. For all priority commodities, value addition investment proposals will be prepared and
shared with the Uganda Investment Authority and will include identified projects for promotion, the
required level of investment, land and other requirements necessary for realization of the commercial
ventures and will also identify areas where the Government can support private investors.
3.2.3.2.2 Build capacities of farmers, traders and processors in quality standards and market
requirements of the priority commodities
1. Strengthen higher level farmer organisations for collective marketing, bulking, quality and
standards improvement
The farmer groups’ model has been found to be an efficient methodology for driving agro-enterprise
development and will be utilised to promote value addition as well as increase and strengthen
linkages to functional markets for the prioritised commodities. Interventions will be designed to
support farmer groups in formulating and implementing technical, managerial and marketing
strategies as well as developing feasibility and business plans for new investments and financing
opportunities.
In addition, whereas the capacity of existing farmer groups and cooperative societies will be
strengthened, more farmers will be mobilized to join or form new cooperative societies in order to
enjoy benefits of collective marketing. Similarly, farmers’ or their organisations’ will be mobilised
and supported to participate in the Warehouse Receipt System (WRS) to access assembling,
cleaning, grading and storage facilities. To facilitate trade, MAAIF, MoTIC, Development Partners
(DP) and private market information service providers will provide market information to farmers
and traders under PPP type arrangements. Farmers will be trained by MAAIF in collaboration with
other organisations and entities on cooperatives and agribusiness, quality standards and improved
postharvest handling practices and technologies, such as triple bagging for dry beans. Overall, the
following interventions will be undertaken:

ASSP 2015/16 to 2019/20 Draft 40
This strategy will be implemented through strengthening high-level farmer organisations to enhance
participation in market development activities. This intervention will focus on the following
activities;
a) Enhancing awareness and capacity for implementing quality standards.
b) Promoting collective marketing at all levels of the value chain of all the priority
commodities;
c) Promoting use of contract farming between processors/big buyers and farmers;
d) Strengthening agro-based organisations to provide market information to farmers;
e) Supporting farmer groups and entrepreneurs to acquire value addition/processing
facilities in all the main production areas for each product;
f) Strengthen producer-buyer/ aggregator contractual relationships for the strategic/ priority
commodities;
g) Identifying and strengthen producer groups involved in adding value to agricultural
commodities through training and exposure to technologies befitting their activities;
h) Promoting structured trading systems by linking organized collective marketing farmer
groups to large buyers and storage handlers/warehouse operators.
i) Conducting market intelligence studies to ease market penetration and inform public
sector led efforts to link private sector to lucrative markets;
2. Promote appropriate technologies and practices for minimizing postharvest losses along
the entire commodity value chain. This intervention will be implemented through the
following actions:
a) Developing and adapting appropriate technologies and practices for postharvest handling
along the value chain of all priority commodities;
b) Building capacity of value chain actors on best postharvest handling practices for each
priority commodity;
c) Developing and improving food handling, marketing and distribution systems and linkages
to local and export markets.
3. Promote commodity/ farm based storage and agro processing, as a means to increasing
access to domestic and regional market, through demonstrations and PPPs. This
intervention will be implemented through the following actions:-
a) Innovating and adapting affordable on-farm storage solutions for the priority and strategic
commodities;
b) Facilitating private sector uptake, development, marketing and distribution of on farm storage
solutions to smallholder farmers including developing a cost effective sales distribution
system
c) Enhancing efficiency (higher output at reduced cost) at all value chain nodes through
trainings; and demonstration sites of appropriate improved TIMPS;
d) Developing products to meet end-user market requirements e.g. quality and safety standards,
traceability, packaging, certification for niche markets, bar coding for supermarket outlets,
etc.;
e) Developing and transferring knowledge and skills to enhance capacity for engaging in high
quality export markets e.g. for horticulture;

ASSP 2015/16 to 2019/20 Draft 41
f) Promoting cottage processing industries through incubation of new processing technologies
for both food and non-food products.
3.2.3.2.3 Marketing and value addition for specific priority and strategic commodities
Over the plan period, investments will include support to implementation of commodity specific
marketing and value addition initiatives for increased production and productivity by developing
various mechanisms for facilitating the delivery of produce to target markets. Commodity value
chains for which specific marketing and value addition strategies will be implemented as part of the
commodity approach are:
a) Develop national and regional markets for Ugandan bananas and banana products;
b) Support beans marketing;
c) Support maize marketing and value addition;
d) Support rice marketing and value addition;
e) Support cocoa value addition and marketing;
f) Support cassava farmers and SME to engage in profitable processing and marketing of quality
cassava flour and chips as an agribusiness enterprise;
g) Establish new tea processing facilities for value addition and undertaking initiatives to better
market Uganda tea including exploring establishment of a tea auction market in Kampala in
partnership with the Ministry of Trade, Industry and Cooperatives (MoTIC);
h) Support coffee value addition and generic promotion;
i) Support marketing of adequate quantities of fresh citrus fruits, pineapples and apples for local
and regional markets and support fruit processors to engage in the product development of
fresh juice from the three fruits as a product for local market;
j) Promote local consumption and export of milk and dairy products,
k) Rehabilitate existing and developing new milk cold chain and processing infrastructure;
l) Creating a buffer stock / animal handling grounds to support beef processing / abattoirs.
m) Promote domestic value addition to lint;
n) Facilitate domestic, regional and international trade in vegetable oil products.
3.4.3.2.4 Operationalise the commercialisation fund for value addition and agro-processing
A major objective of the ASSP is to integrate smallholder farmers into the value chain, however,
most lack the financial capacity, equipment, processing facilities and technical skills to effectively
add value to the commodities they produce. Over the plan period, a commercialisation fund will be
established to enable individual farmers or farmer groups to acquire necessary equipment/facilities
and technical skills on a competitive basis. Enterprises to be supported will have to be commercially
viable with potential to attract private funding with the provision that the support/ grant shall be
refundable over a specified period. The enterprises that will be supported will include those that
catalyse technology up scaling, promote institutional development for joint marketing (the priority
for this shall be on increasing the effectiveness of farmers’ organisations) and enhance the
development of market infrastructure and agro-processing. Detailed guidelines will be developed to
operationalise the fund on a sustainable basis.
3.4.3.2.5 Ensure the development, maintenance and improvement of physical agricultural
marketing infrastructure
The sector investments over the plan period include construction of key physical marketing
infrastructures in selected areas with high production potential for priority commodities in

ASSP 2015/16 to 2019/20 Draft 42
partnership with the private sector. This is intended to address challenges of access to proper storage
facilities. With better postharvest handling, it is expected that farmer groups or associations will
bulk, clean, grade and store their produce more effectively and benefit from higher prices. In
addition, specific interventions to address the challenge of the significant losses that farmers and
traders of perishable commodities experience because of the absence of cold storage facilities that
prolong shelf life and limit opportunities for value addition opportunities will include constructing:
10 cold chain storage facilities in selected districts; 10 physical agricultural commodity markets in
selected districts; and 28 community based grain storage facilities in selected districts.
3.2.4 Priority 4: Institutional and enabling environment strengthening
3.2.4.1 Strategy rationale and outline
To effectively supervise, coordinate and implement the sector interventions, the institutional
capacity of MAAIF and public agricultural agencies will be strengthened. The interventions for
institutional strengthening will include; construction of MAAIF headquarters building; construction
of administrative infrastructure for selected district production departments, human resource
development through training/ capacity building; strengthening institutional linkages and
networking and improving access to working facilities; procuring tools and equipment for MAAIF,
its agencies and DLGs.
Two agricultural training institutions (ATI), Bukalasa Agricultural College and the Fisheries
Training Institute, will be transformed into entities that are effectively responsive to agricultural
knowledge and skills demanded by the labour market through interventions that include reviewing
the curriculum, strengthening human resources, procuring modern equipment as well as tools and
rehabilitating both teaching and physical infrastructure. The third ATI, the National Farmer’s
Leadership Centre (NFLC) will be supported to provide training, in addition to construction and
rehabilitation of infrastructure, acquisition of additional land and reviewing its legal and regulatory
status currently resident in a Memorandum of Understanding (MoU) to facilitate its operations. In
addition, support will be provided to the District Agriculture Training and Information Centres
(DATICS) in the area of curriculum review and development as well as rehabilitation or construction
of training infrastructure.
To ensure effective implementation of the ASSP, support will be provided towards capacity building
for MAAIF staff responsible for agriculture sector policy and planning. This is intended to ensure
existing capacity for: the production of bankable project proposals to support ASSP implementation;
undertaking budget execution assessment exercises; linking ASSP implementation with regional
agriculture policy undertakings (EAC, COMESA, CAADP, etc.) and coordinating the timely
production of agricultural sector mandatory policy, planning and budget papers.

ASSP 2015/16 to 2019/20 Draft 43
Over the ASSP implementation period, the MAAIF will develop and implement an efficient Food
Agricultural Statistics (FAS) system that will provide statistics to inform development of key
government policy initiatives targeting poverty eradication. This will involve; strengthening the
coordination and management of the agriculture sector statistical system; risk management and ICT;
improving usability and dissemination of agriculture statistics; mainstreaming quality assurance in
agriculture statistical production. Concurrent efforts will also be directed towards strengthening and
improving the agricultural sector M&E systems by reviewing, refining or developing effective
mechanisms for the production of quality monitoring and evaluation data and information on ASSP
implementation. These interventions will be complimented by strengthening institutional and
organisational capacity for M&E. The Government will also implement the Agricultural Sector
Communication Strategy (ASCS). Government efforts will also be directed towards improving the
capacity for quality assurance, regulation, food and safety standards for outputs and products across
crops, livestock and fisheries sub-sectors.
3.2.4.2 Strategic interventions
3.2.4.2.1 Strengthen institutional capacity of MAAIF, Agencies and local government
production departments
This strategy is intended to achieve an optimally configured MAAIF and DLG production
departments that provide a conducive and enabling environment to meet ASSP objectives and is
envisaged to achieve four objectives; i) a fully staffed, functioning and responsive MAAIF HQ,
reviewed agencies, DLG production departments and ATIs; ii) improved organisational
performance through enhanced human resource capacities and iii) strengthened agricultural sector
institutional intra and inter linkages and networking capacity. It is planned to implement this strategy
under the following interventions.
1. Construction of MAAIF headquarters and administrative infrastructure for selected district
production departments. MAAIF plans to construct new headquarters in Kampala over the plan
period. In addition, it is also planned to undertake the construction of administrative infrastructure
for a selected number of district production offices with inadequate and poor office buildings.
2. Human resource development and management/ training/ capacity building
Intervention 1: Human resource management
This intervention will focus on addressing the current shortage of personnel in MAAIF by
developing and implementing an integrated and phased recruitment process.
Intervention 2: Human resource development/ capacity building of sector personnel
Key activities will include:
a) Developing a comprehensive sector capacity building programme that will capture not only
the knowledge and skills gaps but also career development needs;
b) Identifying the institutions in the sector with the most urgent capacity building needs;
c) Identifying partners (service providers) to assist with the capacity building; and
d) Implementing the capacity building plans including periodic reviews of achievement.
3. Strengthening institutional linkages and networking capacity
The main rationale for operationalisation of this plan is to establish synergies among MAAIF

ASSP 2015/16 to 2019/20 Draft 44
institutions, sector agencies and other non-state actors. It is expected that these synergies will
improve efficiency in utilisation of available resources by avoiding overlap and duplication.
This intervention will help to ensure that MAAIF institutional linkages and its networking capacity
are strengthened. In this regard, a strategy will be developed and implemented for rationalising the
utilisation of resources, creating synergies as well as collaboration and partnership in
implementation, information and knowledge management (especially in performing the functions of
regulation and inspection) with local governments, MAAIF agencies, farmer organisations, NGOs;
CSOs; and the private sector.
4. Retooling MAAIF and district offices aimed at improving access to working facilities, tools
and equipment for MAAIF, its agencies and local governments. The thrust of this intervention is to
enable the staff to fulfil their functions. Activities will include:
a) Preparing a comprehensive inventory of existing sector assets, at the centre including,
infrastructure, tools and equipment;
b) Undertaking a comprehensive and harmonized assessment of sector requirements, paying
particular attention to the proposed new institutional structures;
c) Preparing a systematic plan for retooling while taking into account the financial implications
and MAAIF’s annual plans for procurement and disposal of assets;
d) Implementing the retooling plan; and
e) Undertaking periodic re-assessments of sector needs.
3.2.4.2.2 Support to agricultural training institutions (ATIs)
This intervention aims at transforming ATIs (BAC, FTI and NFLC), into institutions that are
responsive to knowledge and skill market in the extension service. This will be attained through:
a) Intervention 1: Curriculum review: The aim of this intervention is to develop demand driven
curricula for various stakeholders. This intervention will include review of existing curricula for
short courses, certificate and diplomas, regular, in-service and long distances courses and where
necessary develop new ones. This process will take into account labour market requirements and
will be done with various stakeholders who demand specific types of training to improve
agricultural production and productivity. The curriculum review or development will be demand
driven so as to respond to public/ private labour market requirements for adequately skilled
agricultural technicians for agricultural production.
b) Intervention 2: Human resources strengthening: This aims at building a vibrant human resource
capacity with competency based knowledge and skills. The programme plan is to cater for
retooling, hiring of new staff and development of long-term training leading to higher degrees
to meet new type of staff to handle new courses/ programmes that will be aligned with the ASSP
objectives. The increased demand in enrolment is likely to trigger a proportional increase in the
numbers of teaching staff and technicians.
c) Intervention 3: Infrastructural rehabilitation/ development: Most of the ATI infrastructure is
dilapidated and some of the buildings and laboratories lack equipment and requisite inputs and
teaching materials. Achievement of ASSP objectives will require tailored infrastructure and
support systems to handle new training needs including properly equipped labs or even building
with new infrastructure such as green houses, aquariums, and cages for fishing. Rehabilitation

ASSP 2015/16 to 2019/20 Draft 45
of the training infrastructure and facilities is expected to result in better quality graduates.
d) Intervention 4: In the case of the NFLC, it is planned to acquire additional land for farming
operations as well as put in place a reviewed legal regime to replace the Memorandum of
Understanding that the centre is currently operating under.
3.2.4.2.3 Support to district agriculture training and information centres (DATICS)
The DATICS provide crucial training and information to the farmers and other stakeholders at the
grassroots where production takes place. There is need to strengthen their capacity in order to
accelerate the implementation and attainment of ASSP objectives as most of the interventions will
be at the district level. Support to DATICS will focus on two areas, namely:
a) Intervention 1: Review and development of curriculum. The aim of this intervention is to
produce demand driven curricula for various stakeholders. This intervention will handle a
number of activities including review of existing curricula and will be done with various
stakeholders who demand the specific types of training for improved agricultural production and
productivity. The curriculum review or development will be demand driven so as to respond to
public/ private requirements for adequately skilled agricultural technicians for increased
agricultural production.
b) Intervention 2: Infrastructural Rehabilitation/ Development: This intervention will involve
provision of physical infrastructure like classrooms as well as teaching infrastructure like labs
and equipment. Most of the infrastructure is dilapidated and some of the buildings and labs lack
equipment and requisite inputs and materials like chemicals. Achievement of ASSP will require
tailored infrastructure and support systems to handle new training needs and these will require
equipping the labs or even building new teaching infrastructure.
3.2.4.2.4 Support to agriculture sector policy and planning
The activities under this strategy will include:
a) Capacity building for MAAIF staff in the area of policy and planning;
b) Producing bankable project proposals to support ASSP implementation;
c) Undertaking budget execution assessment exercises;
d) Linking ASSP implementation with regional agriculture policy undertakings (in the EAC,
COMESA, CAADP, etc.);
e) Coordinating production of agricultural sector mandatory policy/planning/budget papers.
3.2.4.2.5 Agriculture statistics
Available agricultural statistics in the country is mostly data from the past surveys and censuses and
from agricultural sector agencies like UCDA and CDO among others that collect specific data for
their own needs. As such, data gaps in the sector include the very basic current data on crops,
livestock and fisheries. Present data are also mainly department based, not often harmonized and
collection systems are scattered among various institutions. In addition, the sector statistical system
suffers from weaknesses in organisational development and management, limited human resource
capacity as well as inadequate statistical production and dissemination of standards in the institutions
producing this statistics. The estimation of agricultural production continues to be a challenge since
it is difficult to get accurate production estimates of smallholder agriculture given the absence of a
culture of farm-record keeping as well as the complexity of cropping systems.

ASSP 2015/16 to 2019/20 Draft 46
Over the plan period, specific interventions for statistics will be implemented. the objective is to
establish an efficient food agricultural statistics system to provide data that will underpin major
government policy initiatives, poverty eradication, transformation, modernization and climate
change adaptation. Interventions of the statistical framework will include improved data
management; conducting an agriculture census; annual agriculture surveys; other household
surveys; reinstating the agriculture reporting service; a functional national early warning system;
and fisheries statistics (aquaculture census and surveys) among others. The Agriculture Sector
Strategic Plan implementation will focus on five areas, namely:
1) Strengthening the coordination and management of agriculture sector statistical system;
2) Improving usability and dissemination of agriculture statistics;
3) Mainstreaming quality assurance in agriculture statistical production;
4) Strengthening human resource and management;
5) Strengthening production and management of agriculture statistics.
Activities will include:
a) Maintain functionality of the National Agricultural Statistics Coordination Committee;
b) Review structure and operations of the Sector Statistics Committee (SSC);
c) Establish a statistical methodology for estimating production, especially for perennial,
continuously planted/ harvested and mixed crops;
d) Developing an agricultural sector data management system;
e) Developing a MAAIF ICT strategy that can exploit the use of ICT for improvement of extension
service delivery and data capture, processing and dissemination on new husbandry and farm
practices and agronomic technologies, input and farm out prices, climate change, soil and water
management and;
f) Establishing an administrative system for collecting data on crop production and productivity,
utilisation on the farm and sales, livestock trade and slaughter, aquaculture, apiary production
and pest and disease outbreaks.
g) Developing capacity for enhanced data collection, analysis and dissemination.
h) Developing an agricultural statistics dissemination strategy.
3.2.4.2.6 Agriculture risk management
During this plan period, ICT and agricultural risk management (ARM) were identified as critical
areas for creating an enabling environment for increased sector production and productivity. With
regard to risk management, interventions will include:-
a) Establishing awareness of the holistic approach of ARM across all thematic areas;
b) Developing a national coordination mechanism for ARM to advise relevant MDAs;
c) Identifying and prioritising agricultural risks through a participatory approach involving local,
national, and international stakeholders;
d) Developing, analysing and implementing innovative and integrated tools to manage the
identified agriculture risks;
e) Prioritising ARM processes and tools and integrated them into the strategic investment plans;
f) Increasing investments and initiatives on ARM led by the GoU and partners at national and
regional level;
g) Identifying and mainstreaming ARM data and its timely collection, analysis, management and
integration within the agricultural statistics system.

ASSP 2015/16 to 2019/20 Draft 47
3.2.4.2.7 Strengthening and improving the agricultural sector M&E systems
Within the national monitoring and evaluation (NM&E) policy framework, MAAIF has two
important roles in relation to monitoring and evaluation (M&E) in the agriculture sector. These are
(a) the establishment of sustainable systems to collect, process, maintain and disseminate
agricultural statistics and information (b) monitoring, inspecting, evaluating and harmonizing the
activities in the agricultural sector including local governments. Like the parent ministry, each of
the seven MAAIF agencies has the responsibility to establish a sustainable system to collect, process,
maintain and disseminate agricultural statistics. To fulfil these mandates over the plan period, the
Agricultural Sector M&E systems will be strengthened by implementing measures in two action
areas, namely:
a) Production of quality monitoring and evaluation data and information on ASSP
implementation. This will involve development and dissemination of standardized tools,
guidelines and formats for quality data collection, collation and reporting by key stakeholders
involved in M&E of ASSP implementation. Support will also be provided for revamping routine
monitoring, support supervision and data quality audits within MDAs and LGs. All departments
and Agencies in the sector will be required to undertake and report on M&E activities in their
respective areas of operation. This will ease consolidation and coordination of sector M&E
interventions. To disseminate findings and inform decision making, Agricultural sector
performance reviews will be held twice a year, involving all MDAs in the sector and at the end
of each year. Furthermore, a joint annual sector review will be held bringing together
development partners, private sector, CSOs and other MDAs.
b) Strengthening institutional and organisational capacity for M&E by agricultural sector
MDAs. This intervention aims at: (i) improving the enabling environment for M&E of ASSP; ii)
strengthening partnership in M&E of ASSP), iii) managing and enhancing data and information
use for decision making, iv) ensuring that the necessary human resources are available for M&E,
and v) promoting the use of ICT in M&E of ASSP.
3.2.4.2.8 Implementing the agricultural sector communication strategy
The overall objective of the communications programme is to create an effective and efficient
communications system that facilitates harmonised and regular information flow within the sector
and its stakeholders. Specific objectives and interventions over the plan period include:
a) Establishing a national agricultural information and communication system
This intervention is aimed at introducing an effective and efficient mechanism, for gathering,
processing, disseminating and archiving agricultural information across the institutions in the
country. It will also provide regularized and harmonized channels through which agricultural
information is shared between MAAIF, its agencies, NLGs and other institutions and players, to
enable them get more empowered, more enlightened on better practices, more knowledgeable of
and about farming as a business, so that they improve production and engage in value-addition to
the priority commodities. This intervention will be linked to M&E and knowledge management
so that the sector is able to communicate effectively.

ASSP 2015/16 to 2019/20 Draft 48
b) Strengthening the ASCS framework
MAAIF has an agricultural resource centre and other information units within the agencies that
are responsible for enhancing access to agricultural information, research and dissemination for
the sector and communicating results to the different stakeholders. Currently these units are
providing library services, producing limited types and numbers of publications and providing
press releases to mass media. However, they have limited numbers of staff, require training, have
inadequate facilities and yet they are required to meet increasing information needs of
agricultural stakeholders and various beneficiaries. Implementation will thus include the
appointment of communications focal persons in all MAAIF agencies and departments to ensure
regular flow of information from those entities to the Agriculture Information and
Communication Unit that is responsible for dissemination. A capacity building programme will
also be developed and implemented for these officers to ensure quality of information and
sustainability of the programme. These activities are intended to ensure that there are specific
communication responsibility centres in each and every institution in the sector that in turn will
ease coordination and enable smooth flow of information within and outside the sector.
c) Create an effective and efficient platform for information and knowledge management
This strategy is intended to introduce an effective and efficient mechanism, through which
agricultural information across the value chain is gathered, processed, disseminated, shared, used
and archived. In addition it will also provide regularised and harmonised channels through which
agricultural information is delivered by MAAIF to other institutions and key stakeholders like
smallholder farmers, to enable them get more empowered, more enlightened about better
practices so as to appreciate farming as a business. Timely flow of critical information will
enable the sector to achieve its objectives of ASSP 2015/16-19/20.
A knowledge and information hub will be created under the MAAIF agricultural resource centre.
This hub will hold a repository of all publications and information packages about the sector.
The hub will also create linkages between MAAIF and its agencies, the latter will be required to
catalogue information and knowledge products that cannot be physically shared or moved to the
hub. This will ensure that all stakeholders’ access information required about the sector
regardless of where it’s physically located. The creation of the hub will involve acquisition and
deployment of modern technologies as well as capacity building to ensure sustainability and
maintenance of the facility.
d) Creating an enabling environment for communication
The Government made a decision that requires all media houses to avail free airtime during a
day’s programme to Government officials for them to inform the public on activities being
implemented in the various sectors. However, this opportunity has not been fully utilised as yet.
With stronger management commitment towards communication, this strategy intends to create
an environment where the sector’s top management avail themselves and participate in these
discussions.
This strategy also seeks to identify the gaps existing in policy and legal instruments within the
communications area. This is mainly to ensure that there is proper coordination between the
different communications and technical functions of the sector; elimination of the many sources
of agricultural information to the public and avoiding contradictory information passed on to the

ASSP 2015/16 to 2019/20 Draft 49
public. The implementation of this intervention will include finding ways of bridging the
identified gaps and acting accordingly.
e) Support innovation in agro-communication across the agro value chain
The main objective of this intervention is to exercise innovation in agricultural message
packaging and delivery so as to widen the range of information products and delivery
mechanisms used in the sector. This is mainly to ensure that the entire spectrum of end users and
consumers of agricultural information are provided with the right information and knowledge
using the appropriate technologies. This will include use of music, dance, drama and ICTs
platforms (including social networks) to communicate sector policies, strategies, and agricultural
extension information.
The intervention will particularly target the youth with innovative approaches, to attract and
interest them in agricultural value-chains (production, processing, value-addition and marketing)
via social media platforms like Facebook; Twitter, blogs on the internet; short message services
(SMS) on mobile phones and any other technology related channels.
The intervention also targets developing institutional support for AICU staff in MAAIF and its
agencies through training in ICT-based agro-communication systems/platforms and in modern
digital-based film unit operations, television and radio documentary/feature productions and
dissemination.
3.2.4.2.9 Improve the capacity for quality assurance, regulation, food and safety standards for
outputs and products across crops, livestock and fisheries sub-sectors.
1) Enact new laws and or review existing laws, regulations and policies to be consistent with
changes in technology, regional integration commitments and other global/regional
commitments in the crops, livestock and fisheries sub-sectors.
International customers’ requirements increasingly determine export standards for agricultural,
livestock and fish products, so these same standards influence and impact on domestic standards.
The international rules are becoming tougher all the time especially as regards chemical and
pharmaceutical residues but also on quality, appearance and packaging: e.g. hazard analysis and
critical control points (HAACP), East African Standards etc. MAAIF needs to clarify and
simplify the policy and regulatory environment to make it more agri-business friendly. The
ministry will therefore undertake the following activities under this investment area:
a) Reviewing and harmonizing all obsolete laws, rules and legislation to cover, inter alia seed,
phytosanitary issues, agricultural chemicals, diagnostics and control of epidemics, veterinary
public health, animal movement control, animal trade, veterinary professional ethics, animal
welfare services, codes of practice for artisanal fishing, trans-boundary fishing among others;
b) Defining clear roles among public institutions involved in quality assurance, laying out
clearly who does what and at what stage;
c) Providing technical backup and support to LGs to formulate and implement bye-laws;
d) Play its mandated role in the international dialogue around the policy issues, bringing
specialist agricultural knowledge into the discussions. MAAIF will also assist with the
preparation and adoption of appropriate domestic food safety legislation and standards

ASSP 2015/16 to 2019/20 Draft 50
consistent with local conditions and preferences, with World Trade Organisation (WTO)
rules and other trade obligations;
e) Pursue the enactment of pending legislation and the revision of secondary legislation to
provide a solid legal foundation for enforcement actions. In addition activities will include
the promotion of good hygienic practices among street vendors, HACCP for food processing
and general public awareness campaigns to assist reduction of the incidence of food-borne
illness.
2) Undertake market surveillance and strengthen enforcement capacity for all existing laws,
regulations, standards and guidelines along the value chains. Activities in respect of this
intervention shall be developed and implemented in a number of sub-sectors. Standards will be
set and operationalised with respect to quality of inputs (seeds and planting materials, fertilisers,
agricultural machinery, agro-chemicals, etc.) in addition to compliance with Sanitary and
Phytosanitary (SPS) requirements (for fresh food on the market).
3) Create awareness among farmers, traders, processors and agro exporters about food safety,
quality standards and market requirements. Most of the tradable agriculture products have set
minimum quality standards and SPS requirements that have to be observed to guarantee the
health and safety of consumers. This includes maximum levels of chemical residuals in
agricultural produce and contamination of produce due to poor postharvest handling among
others. Equally, quality issues for cereals and grains involve grading and sorting that require
prior action at the farmer’s level. Over the plan period, MAAIF and its agencies undertake to
promote awareness creation about quality, standards and SPS requirements to all stakeholders
along the value chains with a focus on the priority as well as strategic commodities and especially
the export led value chains. The causes and consequences of producing and trading in poor
quality and unsafe food products will be explained to the masses with the aim of increasing
compliance to food safety requirements in both the local and export markets.
4) Train and increase awareness of food inspectors on legislation, policy, modern inspection
systems and quality management systems. MAAIF will develop awareness and training
materials on quality assurance and food safety standards for actors along the value chains with
specific emphasis on outputs and products across crops, livestock and fisheries sub-sectors in
general and commodity value chains of meat, dairy and Fisheries in particular. Accordingly,
food inspectors at district and national level will be trained to conduct regular market
surveillance and guide producers/traders on basic food safety requirements and quality
standards.
5) Strengthen national quality assurance and safety standards infrastructure. This will involve
establishment and renovation of laboratory infrastructure to support health and food safety
inspections. Specifically, the capacity of SPS laboratories will be enhanced to ensure that health
and SPS certificates issued guarantees adequate safety of the traded goods. This intervention will
also provide for capacity building of the staff and acquisition of all basic facilities necessary for
strengthening the food safety quality assurance system in Uganda.

ASSP 2015/16 to 2019/20 Draft 51
3.3 Strategic interventions for priority and strategic commodities
The Government has prioritized 12 commodities and four strategic commodities based on their
contribution to household income and food security among others. The priority commodities are:
bananas, beans, maize, rice, cassava, Irish potatoes, tea, coffee, fruits and vegetables, dairy, fish,
livestock (meat), and four strategic commodities, namely, cocoa, cotton, oil seeds, and oil palm.
Sector investment over the medium term will focusing on: research; extension; pest, vector and
disease control; provision of quality inputs; post-harvest handling; improving markets access and
value addition. Annex A presents a summary of minimum value chain activities for the priority
strategic commodities.
To accelerate the development and commercialisation of the prioritized agricultural commodities,
the interventions below will be implemented to increase production and productivity:
3.3.1 Commodity 1: Bananas
Banana production in 2014 amounted to 4.6 million mt, of which 3,070 mt were exported. Banana
exports generated US$ 587,000 for the country in 2014. The sector targets to produce 13 million mt
by 2020. The key activity will be addressing the productivity of the three major banana types
(cooking, juice and dessert bananas). Banana production challenges in Uganda include declining
soil fertility, pressure from pests and moisture stress. Interventions to address these challenges will
include:
1. Promoting the use of organic and inorganic fertilisers and soil-moisture conservation
techniques,
2. Disseminating knowledge and information on improved agronomic practices such as soil
fertility and moisture conservation, supplementary irrigation, tissue culture and traceability;
3. Enforcing good agricultural practice, product quality and food safety standards.
4. Strengthen efforts to control the banana wilt and others pests and diseases
5. Promote adoption of high yielding and drought resistant banana varieties released by the
NARO.
3.3.2 Commodity 2: Beans
Beans are widely grown in Uganda on a subsistence level, with limited use of certified inputs. Beans
are a cheaper source of protein, making it highly demanded and important to dietary regimes of the
poor. As a legume, it also contributes to improving and sustaining soil fertility through atmospheric
nitrogen fixation.
Beans production in 2014 amounted to 1.011 million mt, of which 31,796 mt were exported. This
generated US$ 26.19million for the country. The sector targets to produce 10 million mt by 2020.
Annual exports are projected to increase to US$ 63 million.
In order to achieve the above set targets, the sector intends to increase production and productivity
of beans through: increasing access to high quality seed inputs like Rhizobia; support to pest &
disease control; strengthening mechanisation and extension services.

ASSP 2015/16 to 2019/20 Draft 52
3.3.3 Commodity 3: Maize
Small-scale farmers all over Uganda grow maize for household, food and income security. It has
also become an increasingly important non-traditional export crop. It is also an industrial crop for
the animal feeds industry and it has high potential for value addition to support the agro-processing
industry.
Maize production in 2014 amounted to 2.9 million mt, of which 134,903 mt were exported. This
generated US$ 43.567 million for the country. The sector targets to annually produce 10 million mt
by 2020. Exports are projected to increase to US$ 105 million annually.
The main challenges in the maize sub sector are the generally low yields (2.2-2.5 mt/ha, compared
to the potential of 5 mt/ha) and high post harvest losses (up to 15%), which often lead to low farm
gate prices due to poor quality. The prevalence of pests and diseases has also affected production in
maize.
In order to achieve the above set targets, the sector intends to increase production and productivity
of maize through: producing and distributing 60 mt of improved maize seed (30 mt hybrid, 30 mt
OPV); multiplication and distribution of foundation seed, improving access and use of fertilisers;
increasing pest and disease control measures; promoting mechanisation; improving extension
services; support to post-harvest handling through training traders and farmers on quality standards
and post-harvest handling technologies practices; support to processing and value addition including
the use of household cottage industries;
3.3.4 Commodity 4: Rice
In Uganda rice has become important in the last one and a half decades, as a strategic cereal staple
and cash crop. It is mainly grown by small-scale farmers with about two hectares in most parts of
the country. Since the introduction of upland rice in 2002, the number of farmers deriving their
livelihood from rice increased from 4,000 to over 96,000 farmers. Increased rice production has a
big potential for creating wealth in many Ugandan households.
Rice production in 2014 amounted to 237,000 mt, of which 57,053 mt were exported. This generated
USD28.7 million for the country. The sector targets to produce 680,000 mt by 2020 and generate at
least USD73 million worth of exports.
In order to achieve this target, the sector intends to increase production and productivity of rice
through: multiplication and distribution of improved foundation seed, mechanisation of rice
production, investment in irrigation infrastructure starting with Eastern Uganda and provision of
extension services. In order to reduce post harvest losses in rice, the sector intends to promote and
distribute appropriate post-harvest technologies, increase access to credit by rice farmers, traders
and processors and promote marketing of rice by promotion of collective marketing for high quality
rice.

ASSP 2015/16 to 2019/20 Draft 53
3.3.5 Commodity 5: Cassava
Cassava is recognised as a major crop for poverty alleviation, increasing food and nutrition security,
animal feed manufacturing and bio-fuel ethanol industries. Cassava production in 2014 amounted
to 2.813million mt. The sector targets to increase production of Cassava to 3.5 million mt by 2020.
The interventions will involve:
1) Developing and implementing a sustainable system for production and distribution of disease
free cassava planting material;
2) Promoting integrated management of pests and diseases;
3) Strengthening institutional support to extension services;
4) Establishing monitoring and diagnosis systems for pest and diseases;
5) Identifying, disseminating and promoting the adoption of labour saving technologies for
planting, weeding and harvesting;
6) Supporting cassava farmers and SMEs to engage in processing of quality flour and chips, as
well as agribusiness enterprises.
3.3.6 Commodity 6: Irish Potatoes
The demand for Irish potatoes is estimated to be over 850,000 mt per annum with urban demand
outpacing rural demand. With the increasing urbanization, changing eating habits by the majority
youth and high population growth, chips consumption is set to rise by 50% over the plan period
offering the potato industry huge opportunities for enterprise development and economic growth.
The irish potatoes development interventions aims at:
i). Supporting production and distribution of seed potato of improved varieties with preferred
end user characteristics;
ii). Supporting production and marketing of ware potato for rural and urban consumption;
iii). Supporting farmers and Small and Medium Enterprises (SMEs) to engage in organized
production, marketing and processing of potato; and
iv). Providing an enabling policy framework for a competitive and profitable commercial potato
industry.
3.3.7 Commodity 7: Tea
The tea industry has made tremendous progress in the last 10 years in increasing production and
productivity through attracting inflow of foreign direct investment in the sub sector. Tea production
in 2014 amounted to 61,376 mt, of which 60,504 mt were exported. This generated US$ 84.7 million
for the country. The sector targets to produce 112,000 mt by 2020, with exports valued at
approximately US$ 155 million. The interventions will involve:
1. Tea Research and Extension services. MAAIF through NARO will support development of
new tea clones that are high yielding, disease and drought resistant leading to superior quality
tea planting materials. This will be attained by establishing a fully fledged tea research activity
under ZARDIs, establishing nurseries in all tea growing areas and allowing both small farmers
and the private sector to multiply and distribute foundation/basic planting materials on a
commercial scale. Tea research will include an examination of the impact of the use of
fertilisers, herbicides and the effect of mechanical harvesting on tea bushes. MAAIF will also
provide special training to extension workers in tea growing areas to provide appropriate
extension support to the tea farming community.
2. Tea Farmer Associations and Credit Cooperatives. Promoting the establishment of strong tea

ASSP 2015/16 to 2019/20 Draft 54
farmers associations and cooperatives will be complimented by provision of support for
capacity building for modern and effective management of tea processing facilities.
Government will also promote increased access to credit by tea farmers given that it takes over
32 months or slightly over one and a half years from planting to first harvest. The length of the
period requires farmers to have adequate capital to meet costs for labour and agro inputs.
3. Expanding the area under tea and gap filling in existing tea plantations. About 35 million tea
plantlets will be provided each year for expansion of the area under tea by opening new fields
as well as gap filling in the existing tea plantations. Accordingly, Government will establish
tea mother gardens as sources of tea cuttings and tea nurseries as a source of tea plantlets in all
the targeted tea-growing districts.
4. Establishment of at least 25 single line tea factories in Kisoro, Kabale, Kanungu, Zombo and
Mityana with a capacity to produce 800,000 - 1,000,000 mt of tea per annum.
3.3.8 Commodity 8: Coffee
Coffee is the principal export for Uganda and its production in 2014 amounted to 211,872 mt, of
which 206,831 mt were exported. This generated US$410.064 million for the country. The sector
targets to produce 595,890 mt by 2020, valued at approximately US$1.153 billion. This will be
achieved through the following:
1. Promoting and supporting adoption of good agronomic practice and use of good genetic
materials at farm level. This will involve providing advice and demonstrations to farmer
households on best agronomic practices including; water management, proper spacing, pruning,
and mulching, intercropping, use of shade trees, fertiliser, manure, improved seeds, pesticides
and herbicides. Extension advice and demonstrations will be provided to farmer households on
the benefits of reaching the optimum tree density with existing varieties and rejuvenating older
trees through stumping and pruning and complementing this with the application of chemical
fertiliser and manure, aimed at the rejuvenation of older trees;
2. Promoting coffee growing in new areas and expansion in traditional coffee growing areas. This will be achieved by supporting the production and distribution of 100 million coffee
seedlings per annum, to expand area under production by 5% in traditional areas and 25% in
new areas. Also, improved varieties that can be planted more densely in intercropped systems
will be promoted; feasibility and needs assessments will be undertaken in northern Uganda and
traditional coffee growing districts to determine the potential for and means of expansion;
characterisation of coffee in new areas will be carried out so as to improve on knowledge and
dissemination of relevant technologies; national soil testing and leaf analysis will be conducted
to map nutrient deficiencies and provide location specific recommendations for appropriate
fertiliser use for different zones;
3. Coffee agro extensions and business development services. This will involve building capacity
for coffee extension services along the value chain by training and supporting extension staff at
the sub-county level to deliver coffee specific advice, establish demonstration plots and
engaging with lead farmers; developing guidelines and standards for coffee extension service
delivery; and identifying location specific extension methodologies for application in various
settings and which may include; demonstration plots, farmer field schools, lead farmers, farmer
led extension systems, dissemination of technologies among others;
4. Promoting of coffee farming as a business. Developing and disseminating a farmers’ guide/

ASSP 2015/16 to 2019/20 Draft 55
manual that will include information on entrepreneurship skills, product standards, financial
services access as well as markets and value addition will achieve this. It will also involve
identifying and promoting farmer groups to engage in commercial production and providing
incentives to farmers engaged in medium and large scale production.
5. Supporting and strengthening farmer organisations. This will involve supporting famers and
farmers’ organisations institutional development, especially in the area of promotion and
support to bulking, processing, marketing and export grading among farmers and farmers’
organisations.
3.3.9 Commodity 9: Fruits and vegetables
1. Citrus fruits On the basis of an assessment of the citrus growing sub-regions, 10 districts have been selected
for strategic interventions in the citrus sector as follows: Teso sub region; Soroti, Kumi,
Bukedea, Amuria, Katakwi, Serere and Kaberamaido and in Busoga region; Kamuli, Kaliro and
Iganga.
The intervention will promote production and distribution of quality citrus seedlings tolerant to
pests and diseases and with desirable fresh and processing characteristics. This will involve
selection of suitable citrus materials with both fresh and industrial characteristics from the
present materials at the research stations in the country. The materials selected will undergo virus
indexing to produce disease-free tissue culture plantlets of tolerant varieties. The target for this
programme is to raise 6,000,000 virus free plantlets so as to establish at least 60,000 acres of
citrus fields.
2. Pineapples
The overall objective of the intervention is to commercialise the pineapple sector by supporting
increased production through the distribution of quality clean pineapple seedlings that are
tolerant to pests and diseases. This will involve selection of suitable pineapple materials with
both fresh and processing characteristics from the present materials and importation of MD2
pineapple plantlets. The target for this intervention is to raise 120 million virus free plantlets so
as to establish at least 10,000 acres of pineapple fields. The plantlets will undergo several tissue
culture stages until they are transferred to private greenhouse operators for weaning.
These nurseries will be located in each of the 10 pilot districts that have been selected for
strategic interventions in the pineapple sector, based on an assessment of the pineapple growing
sub-regions. The districts are Kayunga, Luwero, Masaka, Bushenyi, Ntungamo, Kasese, Iganga,
Nebbi, Lira and Gulu. In addition, technical assistance will be provided to pineapple farmers,
business development service providers (BDS) and partners. The preferred approach and
principle to guide investments will be establishment of PPPs with the GoU providing
institutional and technical support and the private sector supporting and involved in production
and value addition. The use of organized groups is expected to increase farmers’ access to service
providers such as agro-input dealers and financial institutions for goods, services and credit.
3. Apple
The overall objective of this intervention is to commercialise apple production involving

ASSP 2015/16 to 2019/20 Draft 56
provision of support to the production and distribution of quality clean, grafted pest and disease
tolerant apple seedlings. This will involve multiplication of suitable apple varieties with fresh
market characteristics. The target for this programme is to raise 82,500 virus free plantlets to
establish at least 250 acres of apple fields. Based on agro-climatic conditions suitable for apple
production, the project will initially target production in five districts namely; Kabale, Kisoro,
Bushenyi, Kabarole and Kapchorwa.
3.3.10 Commodity 10: Dairy
Total milk production amounted to 1.55 billion litres in 2014. Exports from milk and its products
earned Uganda US$ 28.684 million in 2014. Thirty three per cent (33%) of the marketed milk in
Uganda is processed whereas sixty seven per cent (67%) is marketed raw. The processing capacity
of milk was 1.304 million litres in 2014.The sector targets to produce 3.35 billion litres annually by
2020, and targets annual exports from milk and related products worth approximately US$ 92
million.
This production and productivity increase will be achieved through improved feeding, breeding and
selection for genetics improvement, improved access to veterinary services and management
capacity of farmers to prevent exposure to diseases and pests. The specific interventions to be
implemented over the ASSP implementation period are:
1. Building local capacity in conserved feed production, marketing and on-farm water harvesting
infrastructure; and establishing a national animal feed quality analysis laboratory.
2. Developing capacity for pasture and rangeland improvement in the national milk sheds. This
will be attained through: capacity building and support of Artificial Insemination Technicians
(AITs), enhancing capacity in breeding technologies; Implement restocking with high quality
dairy breeds; capacity building of dairy breeders and expanding the national capacity for
production and multiplication of quality dairy genetics;
3. Developing the National Dairy Herd Information Management System. This will involve
registering all dairy farmers, breeders and associations, establishing a dairy herd recording
system, mobilizing dairy breeders to form associations and establishing dairy farmer resource
centres.
4. Provision of heifers
Expected outcomes or impact is adequate milk supply for improved nutrition and increased
household income. This programme incorporates strong PPP arrangements. The targets are to: 1)
increase mean herd size to five improved cow breeds per household 2) increase the national average
milk production per day from current 5 litres to 8 litres per cow over the plan period and; 3) increase
in the proportion of households keeping exotic/ crossed dairy breeds from the current 1% to 10% in
Northern Uganda and from 10% to 15% in Eastern Uganda over the plan period.
3.3.11 Commodity 11: Fish
Total fish production in 2014 amounted to 461,726 mt, of which 17,597 mt were exported. This
generated US$ 134,791million for the country in 2014. The sector targets to increase annual
production to 674,028 mt by 2020. Earnings from annual fish exports are projected to increase to
US$ 238.80 million. The interventions will involve:
1. Promoting recovery of depleted stocks of the large commercial fishes;

ASSP 2015/16 to 2019/20 Draft 57
2. Developing the fishery of small pelagic (mukene) fishes;
3. Promoting commercial aquaculture;
4. Developing infrastructure along the value chain;
5. Strengthening monitoring on all water bodies;
6. Controlling the new breed of weed and water hyacinth.
3.3.12 Commodity 12: Meat and animal/ insect based products
1. Provision of an enabling environment for the meat sector. The objective is to create an enabling
environment for the meat sector to facilitate private sector investments, increased production and
productivity and streamline meat marketing. The specific actions are:
a) Reviewing out-dated legislation including the Animal Diseases Control Act (2000), Hides
and Skins Act (2000) and the Cattle Traders’ Act (2000);
b) Fast tracking enactment of outstanding draft Bills. They include: Draft Meat Industry
Development Bill, Draft National Animal Feeds Bill, Draft Animal Grazing Bill, Draft
Animal Diseases Bill, Draft Animal Trade Bill, The Animals (Prevention of Cruelty) Bill,
Draft Animals (Straying) Bill, Draft Hide, Skin & Leather Trade Bill, Draft Rabies Bill and
Draft Veterinary and Para-veterinary Bill;
c) Fast tracking approval of draft Standards and guidelines. These include Draft Sausage –
specification DUS 739:2012, Draft Dressed Poultry – Specification DUS 917:2012, Draft
Minced Meat – Specification DUS 931:2012 and Draft Bovine (beef) Carcass and Cuts –
Specification DUS 932:2012. The draft guidelines include Guidelines for prequalifying
sources of Day Old Chicks, Guidelines for hatchery management and inspection, Pastoral
code for Rangeland Management and Monitoring guidelines;
d) Fast tracking approval of draft policies which include: Draft Pastoralism and Rangeland
Development and Management Policy1, Draft National Policy on the Control of Ticks and
Tick-borne Diseases, Draft Policy on Control of Tsetse Flies and Trypanosomiasis and Draft
Hides, Skins and Leather Development Policy;
e) Operationalising the Meat Policy 2003 and the Animal Feeds Policy; and
f) Popularising laws and standards and enforce their use.
2. Animal feeds, forage and water security enhancement. This will involve increasing the quantity
and quality of pastures and improving the availability of water and as well as their utilisation in
56 selected districts, through activities including:
a) Promoting appropriate technologies in feeds and feeding planning and utilisation;
b) Pasture and water resources development and improved management;
c) Strengthening supply systems for pasture/ fodder seeds, animal feeds (including conserved
feeds) and inputs in 56 district local governments;
d) Popularising appropriate technology and modern husbandry practices; and
e) Developing appropriate feedlot systems for the respective agro-ecological zones
3. Animal feeds production and quality assurance enhancement. This aims at addressing animal
feed development options along the meat value chain so as to contribute to enhanced productivity
and therefore, increased incomes of value chain players as well as improved food and nutritional
1 To cater for the dairy and meat sectors

ASSP 2015/16 to 2019/20 Draft 58
security in 46 selected districts, through activities including:
a) Enhancing animal feeds production and quality assurance frameworks in the area of
planning, management and utilisation along the value chain for poultry and commercial
meat industry;
b) Supporting farm and district level capacity strengthening to plan and budget for animal
feeds and feeding in intensive and semi-intensive production systems including capacity
building for farmers in ration feed formulation, budgeting, feed handling and animal
nutrition;
c) Supporting the development and modernisation of the commercial animal feed industry;
d) Supporting animal feeds regulatory systems development ;
e) Strategic stratifying and intensifying of poultry and ruminant production system, including
piloting and promotion of beef feedlots; and
f) Developing and establishing stakeholder groups and platform for the animal feed value
chain.
4. National beef genetics resource development Beef production in 2014 stood at 202,929 mt and
is projected to increase to 360,000 mt in 2020, valued at US$ 1.636 billion. The sector will carry
out the following to achieve the projections:
a) Implementing a national beef cattle breeding programme;
b) Promoting countrywide crossbreeding programmes through the use of artificial
insemination (beef and dual purpose cattle semen) and improved beef bulls; and
c) Establishing a national beef cattle improvement scheme to enhance production and
multiplication of quality beef breeds using the open nucleus-breeding scheme;
d) Re-establishing Lusenke Stock Farm as a national cattle-testing centre for pedigree beef
bulls.
5. Goat breed improvement schemes Mutton and goat production in 2014 stood at 34,289 mt and
is projected to increase to 39,775 mt in 2020, valued at US$ 421 million. The sector will carry
out the following to achieve the projections:
a) Selectively screening local breeds (Mubende, Savannah and Small East African) for large
body size and multiple births and develop an elite performing indigenous breed for increased
meat production;
b) Importing improved Boer and Savannah goats for cross breeding with indigenous Small East
African goats and supply the products to goat farmers; and
c) Developing nucleus breeding schemes cooperatives to generate superior bucks for
distribution to farmers on a sustainable basis.
6. Support investments in the poultry sector Poultry production in 2014 stood at 54,868 mt and is
projected to increase to 63,647 mt in 2020. The sector will carry out the following to increase
the production and productivity of commercial poultry establishments:
a) Establishing of exotic layer and broiler grandparent stock farms and provide seed stock to
increase local availability of good quality layer and broiler parent stock for commercial
hatchery operators;
b) Conducting commercial layer and broiler breeding;
c) Improving capacity utilisation of the local commercial hatcheries to produce and increase
availability of day-old-chicks (DOC) through provision of seed stock;

ASSP 2015/16 to 2019/20 Draft 59
d) Providing technical support, training, monitoring and supervision to hatchery operators of
exotic layer and broiler grandparent and parent stock and commercial producers of layers
and broilers; and
e) Initiating the establishment of modern poultry slaughtering infrastructures and processing
facilities to improve the safety and confidence of consumers.
7. Kuroiler and indigenous chicken resource development. This is aimed at ensuring indigenous
chicken genetics conservation, development, multiplication and utilisation through:
a) Supporting the sustainable rearing of quality and healthy Kuroiler and indigenous chicken
parent stock on the government poultry breeding farms for production of hatching eggs, to
achieve increased availability of Kuroiler and indigenous chicken through improved
production capacity of government and private sector farmers;
b) Supporting the establishment and strengthening of functional poultry breeding societies and
associations;
c) Establishing and equipping national poultry registry centres with herd recording hardware
and software; and
8. Develop the sericulture and silk production value chain. Silk production in 2014 stood at a
meagre 3.2 mt. This intervention is aimed at strengthening the institutional sericulture extension
service delivery system, various farmer organisations/ associations and each segment of the
value chain in the context of improving silk production and productivity both qualitatively and
quantitatively in 20 selected districts. The specific interventions to be implemented are:
a) Increasing production of mulberry forage;
b) Enhancing production and productivity of silk worms;
c) Developing national processing capacity of silk and silk products;
d) Supporting the export of Uganda silk to regional and international markets.
9. Support to apiculture Honey production in 2014 stood at 24,000 mt. In order to boost production
of honey, the following will be undertaken:
a) Supporting formation and strengthening of beekeeper’s groups;
b) Establish demonstration centres for honey and beeswax production;
c) Translating the National Beekeeping Training Manual into seven major local languages;
d) Training staff in improved apiculture practices and honey inspection;
e) Reviewing, printing and disseminating standard operating procedures (SOPs) and code of
practices (CoPs) for apiary management and beehive products processing;
f) Equipping Namalere honey analytical laboratory and refurbish Nakasongola Apiculture
Training Centre.
g) Establishing and supporting bee-reserves;
h) Identifying and supporting mother bee colonies;
i) Establishing and supporting honey collection and value addition centres;
j) Establishing sites bee forage and watering.
Strategic commodities
3.3.13 Commodity S1: Cocoa
Cocoa is ranked among the high value export commodities that offer great economic opportunities
for increasing farmers’ incomes and foreign exchange earnings for the country. Statistics show that

ASSP 2015/16 to 2019/20 Draft 60
production of cocoa and export earnings from the commodity have steadily increased from 16,478
mt worth US$ 35,121 million in 2010 to 25,720 mt worth US$59,429 million in 2014; making cocoa
Uganda’s fourth highest foreign exchange earner after coffee, fish and tea. Production and
productivity of cocoa will be enhanced through:
1. Strengthening cocoa research and technology development: The funding of cocoa research
activities has been ad hoc making it difficult to undertake effective research for improving the
cocoa industry. Over the plan period, Government will commit adequate human and financial
resources for cocoa research with a focus on: 1) developing high yielding cocoa varieties, 2)
raising awareness on good cocoa husbandry practices for various agro-ecological zones of
Uganda and 3) developing appropriate technologies to address existing and emerging pests and
diseases which reduce the yields of the cocoa crop and the quality of the cocoa beans.
2. Enhance cocoa extension services delivery: The major objective is to improve delivery of
extension services to cocoa growers in order to enhance uptake of improved technologies. This
will be realised through: developing the capacity of extension staff to advise cocoa growers;
supporting effective delivery of extension services to cocoa farmers; and, promoting
technologies for enhancing cocoa production, productivity and quality.
3.3.14 Commodity S2: Cotton
Cotton lint production in 2014/15 amounted to 17,275 mt, of which 12,674 mt were exported. This
generated US$21.918 million for the country. The sector targets to produce 64,750 mt by 2020. The
interventions carried out will include:
1. Strengthening cotton research in collaboration with NARO. This is to strengthen cotton
research and refocusing research priorities for provision of specialised facilities and production
technology in order to achieve high productivity and incomes at farm levels. This intervention
will be implemented by NARO.
2. Formation of farmer’s associations and capacity building. This intervention is intended to
increase bargaining and lobbying power of farmers for production input and output prices, credit
facilities and specialised extension services. CDO will pilot the formation of cotton farmers’
associations in 2-3 districts per production zone for three years. The programme will operate at
the sub-county level, embracing informal groups operating at the grass-roots level.
3.3.15 Commodity S3: Oil seeds
Increased production and productivity of oilseeds is aimed at increasing household food and
nutrition security and income. Oil seeds production in 2014 was 758,500 mt and this is projected to
more than double to 2,027,800 mt by 2020. Exports from vegetable oils are projected to increase
from US$102 million registered in 2014 to US$281 million by 2020. The specific interventions to
be undertaken are:
1. Increasing oilseeds productivity and production through improved distribution and access to
improved quality seed, fertilisers, mechanisation and extension services;
2. Strengthening and increasing access to extension services by oil seed farmers;
3. Building and strengthening farmer organisations to sustainably provide services to their

ASSP 2015/16 to 2019/20 Draft 61
members.
4. Increasing access to credit by farmers and processors through the provision of agricultural
finance;
5. Reducing oilseed post-harvest losses by promotion, capacity building and distribution of
appropriate post-harvest technologies;
6. Enhancing the marketing of oilseed by promotion of collective marketing of high quality
oilseeds;
7. Strengthening the oilseeds sub-sector platform to oversee and coordinate relevant policies in
the oilseeds sub-sector.
3.3.16 Commodity S4: Oil palm
Production of oil palm requires economies of scale and is currently dominated by nucleus estates,
however due to the interest shown by the smallholder farmers; there is significant potential for
improvement of household incomes by integrating smallholders into the scheme. However, to
achieve increased production through reliance on smallholders will require capacity building of
farmers’ groups in order to facilitate knowledge building, skills transfer, input distribution and
bulking of produce. Despite its considerable potential, oil palm production faces production,
productivity processing and marketing challenges. Interventions are therefore required to encourage
both production and productivity strengthening. Investments to promote better productivity and
production improvement will cover the following.
1. Land identification and acquisition: Over the coming five years the process of identifying
additional land for both nucleus estate and integration of smallholders will continue. This will
target large scale production in Buvuma and study the potential in the new districts (Masaka,
Kalungu, Lwengo, Mukono, Buikwe, Mayuge, West Nile region and Middle North region,)
where trial plots will continue to be monitored to confirm the suitability of these areas for oil
palm plantation development. The existing VODP Project is also in the process of identifying
suitable land for 4 new trials in Western Uganda (2 trials) and Northern Uganda (2 trials).
2. Plantation establishment and development: a total of 40,000 ha of land is targeted for
identification in the 14 trial districts and for possible plantation establishment and development.
The approach to be undertaken will include identifying owners of large tracts of land that are
willing to enter into partnerships with private players such as OPUL. Government will assure
the partners (private investing companies, implementing agencies and small holder farmers) of
the availability of required infrastructure (water, electricity, roads, ferries, storage facilities and
milling facilities) through policy interventions in the industry.
3. Strengthen research and technological innovation: Recently, oil palm research has placed
emphasis on the identification of areas for suitability of growing the oil palms in Uganda. While
awaiting definitive inference, research findings suggest that a number of areas are suitable for
the oil palm plantation establishment. Accordingly, among the key elements of research interests
in the next five years will be the following:
a) Breeding resistant varieties suitable for Uganda conditions;
b) Pests and Diseases surveillances given the mono-cropping nature of oil palm plantation
practices;
c) Improved agronomic practices based on optimal use of fertilisers (types and quantities,
soil mapping).

ASSP 2015/16 to 2019/20 Draft 62
4. Extension services: The oil palm industry requires a structured approach in the provision of
extension services to farmers, farmer groups and institutions engaged in oil palm plantation
establishment and development. Due to the fact that oil palm is relatively new in Uganda, farmers
need to access the latest information on all aspects of plantation establishment and maintenance
while taking into account the environmental considerations and concerns in order to maximise
yields and make profit. It is estimated that at least fourteen districts in Uganda will introduce oil
palm growing in addition to existing value chain implying need to recruit at least 14 additional
extension workers within the mainstream extension service delivery system. For the agricultural
officers to be able to deliver to their mandate, they will need to have trained in oil palm agronomy
and commercial plantation development in a higher institution of learning. This calls for
development of a curriculum tailor made for the industry.
5. Institutional strengthening: This intervention will cover capacity building for sector actors
together with development of sector policy to guide consolidation and expansion in the country.
The development of this policy will be championed by the existing sectoral platform. In addition
it is important to create accessible information base/ repository on oil palm agronomy and other
value chain practices
3.4 Cross-cutting issues
3.4.1 Rationale and outline of the strategy
Agriculture sector investments over the ASSP implementation period will also include
mainstreaming five cross cutting issues (CCI) namely gender, youth, HIV/AIDS, environment and
climate change and food and nutritional security into the sector programmes and projects. The use
of gender analysis and gender-based budgeting in all community-based development programmes
will be promoted. Equally, youth engagement in agriculture and adaptation of agricultural
technologies and practices to climate change will be mainstreamed in all sector programmes.
The Government also commits to mainstreaming implementation of HIV/AIDS policies, plans and
strategies in the agriculture sector including DLGs and farming communities with the aim of
reducing and mitigating the impact on sector production and productivity. Sector investments will
target enhancement of consumption of varied diets at household level including promoting increased
awareness on food availability across the 10 agricultural zones. Others will focus on developing and
implementing early warning systems to prevent and mitigate shocks affecting nutrition and food
security and promoting awareness of and access to nutrient bio-fortified food varieties across the
priority commodities. This is aimed at improving food and nutrition security among households.
3.4.2 Strategic interventions
3.4.2.1. Gender
Although women provide over 70% of the labour force that is engaged in agricultural production,
they control less than 20% of the outputs. The women continue to experience challenges in accessing
the factors of production (land, credit and extension services) and produce 17% less per acre on
average than plots managed by men or jointly by other family members. Over the plan period, it is
intended to identify and institute the necessary affirmative actions that will ensure that women, men,

ASSP 2015/16 to 2019/20 Draft 63
girls and boys participate and benefit equally from development initiatives across all sub-sectors.
MAAIF, agencies and DLG production departments will mainstream gender analysis and gender-
based budgeting in all community-based development programmes. The activities will include:
1) Facilitating training in joint decision making and planning of the household agro-
enterprise(s); promoting gender equity in ownership, access and control over production
resources such as: land, livestock, agricultural equipment, labour and capital/credit;
2) Encouraging women to take up leadership positions in farmer groups and cooperatives
formed under agriculture sector initiatives or participating in sector activities,
3) Developing appropriate labour saving technologies to reduce drudgery and free women’s
time for other productive community roles.
4) Furthermore, the sector will support institutionalisation of gender mainstreaming in all
interventions of the agriculture sector, building the sector staff’s capacity in gender analysis
and gender responsive budgeting and supporting the district Local Governments on gender
mainstreaming in their planning, budgeting and implementation.
5) Promoting utilisation of the women fund and other funds targeting women by profiling and
supporting women undertake agricultural enterprises. MAAIF and her agencies will offer
technical support to interested persons in preparing agricultural sector projects to benefit
from these funds.
3.4.2.2. Youth in agriculture
Uganda has the world’s youngest population with over 78% of its people being below the age of 302
and about half are below 24 years of age3. The participation of youth in the agricultural sector is
minimal and is partially attributed to the migration of youth from rural to urban areas, to engage in
small urban based income generating activities like riding ‘bodaboda’ (motorcycles for hire), petty
trade and service sector work. The youth prefer to participate in activities that offer quick and regular
income with less risk and yet opportunities for them to cause change in rural communities with their
increased involvement exist especially if they can perceive agriculture as a business while adopting
commercially viable practices.
During this plan period, MAAIF aims at contributing towards changing the attitudes among rural
youth and communities in general so that they perceive agriculture as a business and adopt practices
that will make chosen enterprises commercially viable. MAAIF will develop and implement, in
collaboration with the private sector, a strategy on ‘Decent Employment for Youth in Agriculture’
to promote youth inclusion in on-going agriculture activities, creation of job opportunities and
improvement of youth working conditions in the sector. Specific activities under this strategy will
include:
1) Training youth in agro-enterprise development;
2) Identifying youth champions and targeting them to serve as role models;
3) Training youth in farming as a business and identifying linkages to agribusiness incubators
and financing; and
4) Promoting youth participation in small-scale value addition processing.
5) Promoting utilisation of the youth livelihood fund and other funds targeting youth by
profiling and supporting the youth to develop agricultural enterprises. MAAIF and her
2IYF, 2011 Youth Map Uganda. Navigating Challenges, Charting Hope. A Cross-sector Situation Analysis on
Youth in Uganda 3MoFPED, 2011 Uganda’s Population Stabilisation Report. Population Secretariat

ASSP 2015/16 to 2019/20 Draft 64
agencies will offer technical support to interested persons in preparing agricultural sector
projects to benefit from these funds.
Furthermore, other actions targeting increased youth involvement in agriculture will include
advocating and supporting the development and review of curriculum at the ATIs (BAC, FTI and
NFLC) that offer opportunities for youth to become technical specialists in food processing,
agricultural machinery maintenance and management and other areas that require practical
agricultural technical expertise.
3.4.2.3 Environment and climate change adaptation
The sector’s productivity is negatively affected by increasing frequency of drought, low water levels
in the lakes, silting of dams, flooding, increased pollution from chemicals, declining biodiversity,
reduction in soil fertility and soil erosion. To address these challenges environment and climate
change adaptation and mitigation will be mainstreamed in all technologies and practices across all
the Agricultural Ecological Zones. MAAIF has an established Climate Change Unit that will work
very closely with Ministry of Water and Environment (MWE) in implementing the activities within
the Uganda Climate Smart Agriculture (CSA) initiative. CSA has six core activities, namely,
1) Increasing agricultural productivity through climate smart agriculture practices and
approaches that consider gender
2) Increasing the resilience of agricultural landscapes and communities to the impacts of climate
change
3) Increasing the contribution of the agricultural sector to low carbon development pathways
through transformation of agricultural practices
4) Strengthening the enabling environment4 for efficient and effective scaling up of climate
smart agriculture and
5) Increase partnerships and resource mobilization initiatives to support implementation of
climate smart agriculture through collaborations with available initiatives including funds
targeting the promotion of climate conservation activities..
6) Provide technical support to farmers and other stakeholders including civil society
organisations designing and or implementing climate related interventions at all levels in the
agriculture sector.
3.4.2.4 HIV/AIDS
The impact of HIV/AIDS epidemic on Uganda’s agricultural sector has been manifested in; forced
selling of produce and stock before the most opportune time to meet medical costs; diverted
household expenditure towards medical bills; and reduced labour availability and household income
due to falling productivity. In response, MAAIF developed an Agricultural Sector HIV/AIDS Policy
and Guidelines for Mainstreaming HIV/AIDS in Sector Programmes. During this plan period,
MAAIF will strengthen the implementation of the HIV/AIDS policy and guidelines including in local
governments and farming communities partly through the integration of preventive measures and
partly by advising on and promoting agricultural practices, techniques and technologies that mitigate
against the wider impact of the HIV/AIDS epidemic.
4Institutional, policy, legal frameworks

ASSP 2015/16 to 2019/20 Draft 65
3.4.2.5 Food and nutrition security
Food insecurity and malnourishment are common in Uganda’s rural areas and are a significant
challenge to human welfare and economic growth in the country. An estimated 66% of households
in Uganda are net buyers of food and rely on the market for more than 25% of the value of the food
they consume. MAAIF aims at improving food and nutrition security by enhancing consumption of
diverse diets at household level. The policies and actions under this strategy will be critical to
enabling individuals and households achieve better food and nutrition security. During this plan
period, interventions will include:
a) Operationalising and implementing the MAAIF intervention(s) under the National Food and
Nutrition Strategy and enhance collaboration with other stakeholders to address the food and
nutrition security challenge in Uganda;
b) Promoting appropriate agricultural technologies and crops that provide significant nutritional
advantages with a focus on food stressed areas. This might include, for example, promoting
the production and consumption of nutrient-dense foods including bio-fortified crops;
encouraging dietary diversity and; promoting household-level food processing technologies.
c) Promoting awareness on food availability across agricultural zones by providing timely early
warning broadcasts and information on food shortages and surpluses. This would include (i)
preparing and disseminating, at the beginning of every rainy season, rainfall forecasts and
messages advising farmers on the appropriate activities to undertake during the season; (ii)
monitoring crop and livestock performance in order to assess the likely food security situation
and to help determine the availability of water and pasture for livestock and project the outputs
of livestock and livestock products; (iii) carrying out a postharvest assessment to identify areas
of food surplus and deficit;
d) Developing and utilising early warning systems to prevent and/or mitigate shocks affecting
nutrition and food security;
e) Preparing and disseminating bi-annual early warning bulletins on the food and nutrition
security status in the country;
f) Assisting LGs to prioritise food and nutrition security in their district development plans and
budgets.
g) Improving food storage, value addition, marketing and distribution by the private sector so as
to facilitate access to food during times of scarcity.

ASSP 2015/16 to 2019/20 Draft 66
4 INSTITUTIONAL ARRANGEMENTS FOR IMPLEMENTING ASSP
4.1 The role and mandate of MAAIF
The ASSP will be implemented under the aegis and supervision of the MAAIF whose mandate is,
‘To promote and support sustainable and market oriented agricultural production, food security
and household incomes’. Implementation of this mandate is guided by the sector vision that is ‘A
competitive, profitable and sustainable agricultural sector’ while the sector mission is: ‘To
transform subsistence farming to commercial agriculture’. The detailed functions underlying the
mandate are outlined in Textbox 1 below.
Textbox 1: Functions of MAAIF
4.1.1 Top Policy Management
MAAIF will act as the lead institution with the Top Policy Management (TPM) providing the overall
oversight role with respect to the implementation of the ASSP while the Agriculture Sector Working
Group (ASWG) will be a platform for planning, coordinating, monitoring and reviewing the
performance of MAAIF. Information on planning and performance of the sector will be shared
among members both on the internet and during periodic meetings to reinforce resource allocation
efficiency, foster complementarity of efforts and avoid duplication of resource allocation and efforts.
a) Formulate, review and implement national policies, plans, strategies, regulations and standards and
enforce laws, regulations and standards along the value chain of crops, livestock and fisheries;
b) Control and manage epidemics and disasters and support the control of sporadic and endemic diseases,
pests and vectors;
c) Regulate the use of agricultural chemicals, veterinary drugs, biological, planting and stocking materials
as well as other inputs;
d) Support the development of infrastructure and use of water for agricultural production along livestock,
crop and fisheries value chains;
e) Establish sustainable systems to collect, process, maintain and disseminate agricultural statistics and
information;
f) Support provision of planting and stocking materials and other inputs to increase production and
commercialisation of agriculture for food security and household income;
g) Develop public infrastructure to support production, quality / safety assurance and value-addition
along the livestock, crop and fisheries commodity chains;
h) Monitor, inspect, evaluate and harmonize activities in the agricultural sector including local
governments;
i) Strengthen human and institutional capacity and mobilize financial and technical resources for delivery
of agricultural services;
j) Develop and promote collaborative mechanisms nationally, regionally and internationally on issues
pertaining to the sector.

ASSP 2015/16 to 2019/20 Draft 67
4.2 Implementation institutional arrangements
4.2.1 Direct implementation
MAAIF will directly implement the following aspects and components of the ASSP: formulation,
review and implementation of national policies, plans, strategies, regulations and standards and
enforcement of laws, regulations and standards along the crops, livestock and fisheries value chains.
Policy formulation, supervision, regulation and enforcement of standards will be undertaken directly
by the Ministry while intensive technical and advisory services will be provided through its seven
semi-autonomous agencies. DLG Production Departments will be responsible for implementation
of national programs at the grassroots level through provision of extension, regulatory as well as
enforcement services.
4.2.3 Collaboration with MDAs
MAAIF will work in liaison with other Government MDAs to ensure implementations of
complementary interventions necessary for achieving impact on the core mandates of MAAIF. For
examples, it will work with (a) Ministry of Finance, Planning and Economic Development
(MoFPED) with respect to access to financial resources; (b) Ministry of Local Government (MoLG)
with respect to development of agriculture market infrastructure; (c) Ministry of Water and
Environment (MoWE) with respect to adaptation of agriculture to climate change and water for
production; (d) Ministry of Lands, Housing and Urban Development (MoLHUD) with respect to
land policy and land management issues; and (e) Office of the Prime Minister (OPM) with respect
to specific agricultural development initiatives focusing on special areas such as the role of other
actors in ASSP. Table 10 below summarizes the roles of the key actors in the implementation of the
ASSP.
4.2.4 Sector wide approach framework
In addition, MAAIF will adopt sector wide approaches (SWAP) in implementing the ASSP by
periodically bringing together development partners, private sector, academia and civil society
organisations to plan and review the implementation of interventions in the sector in a consultative
and participatory manner. In specific instances, it will collaborate with the private sector to
implement interventions through PPPs. This involvement of various sector institutions will be
critical to effective implementation of the ASSP.
Table 10: Matrix of sector player and their roles Institutions
Responsibilities
MAAIF
a) Act as the lead agency in the implementation of the ASSP.
b) Policy formulation, regulation and quality control;
c) Establish the structure for coordinating, monitoring and evaluating ASSP;
d) Develop and disseminate guidelines to operationalise the ASSP;
e) Build the capacity and collaborate with other stakeholders to ensure mainstreaming of
ASSP interventions in their respective programmes and plans;
f) Strengthen collaboration and networking with the stakeholders to promote mutual
appreciation/ understanding, guidance, involvement and community support for ASSP
interventions;
g) Develop the ASSP operational plans;
h) Reviewing and strengthening linkages between MAAIF HQ, Agencies, ATIs and DLG
production departments;

ASSP 2015/16 to 2019/20 Draft 68
Institutions
Responsibilities
i) Periodically review and restructure MAAIF to ensure adequate alignment with the
implementation requirements of the ASSP
j) Provide for the establishment of requisite approved structures and employment of personnel
and ensure their effectiveness by equipping them as required
Sector Agencies a) Strengthen the structures of the sector Agencies to enable them carry out their mandate to
extend to services in line with increasing agricultural production and commercialisation.
Sector Ministries
a) Translate the ASSP into sector-specific strategies and activities;
b) Collaborate with the MAAIF on matters of mainstreaming ASSP priority concerns in their
respective sector interventions.
Local
Governments
(Production
Departments)
a) Ensure that the local government development programmes are in line with objectives of
increasing production and commercialisation of agriculture;
b) Strengthen the structures of the LGs to enable them to effectively execute country-wide
mandate to extend quality service delivery in the agricultural sector;
c) Delivery of field-level agricultural services to the population.
d) Monitor mainstreaming of ASSP interventions in local governments to ensure services
benefit them;
e) Collaborate with MAAIF on matters of increasing production and commercialisation of
agriculture;
Development
Partners
a) Support the implementation of the ASSP;
b) Ensure consideration and alignment of ASSP priorities in development of cooperation
partnerships;
c) Establish appropriate institutional/ donor coordination mechanisms for ensuring
responsiveness of development cooperation towards the achievement of the ASSP
objectives;
Civil Society and
private sector
a) Participate in Sector Working Groups and local government planning and budgeting
processes to advance farm productivity
b) Develop and implement programmes that address key ASSP intervention areas;
c) Farm production, agro-processing and marketing of agricultural output;
d) Collaborate with MAAIF and other appropriate institutions on matters of mainstreaming of
increasing production and commercialisation of agriculture;
e) Complement Government in delivering of agricultural services to farmers;
f) Strengthen good agricultural practices (GAPs), agribusiness and market development
services and governance
g) Establish PPP initiatives aimed at increasing production and commercialisation of
agriculture;
Academia a) Establish collaborative partnerships with MAAIF, agencies and LGs
b) Contribute to agricultural research
c) Review curricula to respond to labour market needs
d) Provide high quality relevant practical training
Private Sector a) Jointly form PPPs
b) Provide complimentary interventions for ASSP implementation
Farmers a) Form farmer groups and other institutions
b) Implement production and productivity enhancing interventions
c) Define and articulate needs

ASSP 2015/16 to 2019/20 Draft 69
4.3 Agricultural ecological zones in ASSP implementation
In order to realise the vision and mission of the ASSP, it will be necessary to attain the requisite
production volumes and values for each of the priority and strategic commodities set out in this plan.
In this regard, the country has been divided into 10 Agricultural Ecological Zones5, namely, North
Eastern Dry lands (I), North Eastern Savannah Grasslands (II), North Western Savannah Grasslands
(III), Para Savannahs (IV), Kyoga Plains (V), Lake Victoria Crescent (VI), Western Savannah
Grasslands (VII), Pastoral Rangelands (VIII), South Western Farmlands (IX) and Highland Ranges
(X) shown in the map below.
Figure 5: Map showing agricultural production zones of Uganda
The commodities that were designated to each production zone and mapped out in the DSIP have
been adopted as shown in Table 11. Within each zone, it is expected that the responsibility for
operationalising the ASSP will rest with the respective the districts and MDAs. In this regard, the
various MDAs and districts within a given zone will develop an Annual Operational Plan (AOP).
The AOP will articulate, unpack and prioritize the interventions covered under each strategic action
in the ASSP for implementation by the respective key partners or stakeholders for each of the
strategic actions, clearly defining the outputs and medium term outcomes as well as the timeframe
for implementation. The national AOP will take into consideration the sector’s production and
export targets so as to meet national food security and commodity exports requirements for this plan
period. Details are included in Annexes B and C.
5Ministry of Agriculture, Animal Industries and Fisheries (2004). Increasing Incomes through Exports. A Plan for Zonal Agricultural
Production, Agro-processing and Marketing. Kampala

ASSP 2015/16 to 2019/20 Draft 70
The development of the AOP will be guided by (a) the comparative advantage of each location as
articulated by the individual districts in the agricultural zones, (b) overall and disaggregated output
targets in the ASSP and (c) the commodity Framework Implementation Plan6 (FIP) that was used in
developing this ASSP. To the extent possible, the cascading of planning will flow from national/
sector/ MDA level to zones, district and sub-county levels. Resource allocation will also be done
up-front based on the output expected from each level of planning and implementation. This
performance based planning mechanism will be reviewed at the annual sector performance review
meetings. In this way, the iteration of planning, resource allocation and implementation will be
conducted annually in order to ensure that the country is constantly assessing its potential of
achieving the goals envisaged in the ASSP.
Table 11: Mapping of priority and strategic commodities in Uganda’s agricultural zones Commodity Agricultural Zones
I II III IV V VI VII VIII IX X
Banana √
Beans √
Cassava √ √ √
Cocoa
Coffee √ √ √ √ √ √
Cotton
Irish Potatoes* √ √
Sweet Potatoes* √ √ √ √
Fruits
&
Veg.
Apples √
Citrus √
Mango
Pineapples √ √
Vegetables √ √ √ √ √ √
Maize √ √
Rice
Sorghum* √ √ √ √ √
Tea √ √ √
Beef Cattle √ √ √
Dairy Cattle √ √ √
Fish Aquaculture √ √
Capture
Goats √ √ √
Poultry √ √ √ √ √
Piggery* √ √ √ √ √ √
Oil Palm √
Oil Seeds √ √ √ √ √
* Commodities that were not chosen among the priority strategic commodities but are very important for food and nutrition security
of the population.
In addition to the above, FIPs were developed for each of the non-commodity areas that included:
(a) Strategic intervention such as; (a) research, extension and pests and disease control; (b)
transformative areas: monitoring and evaluation, institutional strengthening and communication;
and, (c) technical input areas; seeds, fertiliser, agricultural mechanisation and water for agricultural
6There framework implementation plans include those for Cash crops (Coffee, Cotton, Tea and Cocoa); grain staples (Maize, Rice,
Beans); non-grain staples (Cassava, Irish potatoes); banana and fruits (Citrus, Pineapples, Apples, Banana and Vegetables); meat
(Beef Cattle, Poultry and Goats); dairy; fisheries (Capture and Aquaculture) and oil crops (Oil Seeds and Oil Palm).

ASSP 2015/16 to 2019/20 Draft 71
production. The respective MDAs responsible for these together with the LGs will also develop their
AOPs that will be integrated into the National Agricultural Annual Operational Plan. The various
AOPs will be aligned/ harmonised to facilitate the delivery of all the requisite technical, physical
and financial inputs to those areas to ensure the attainment of the outputs defined against each of the
strategic and priority commodities.
4.4 Sector coordination During ASSP implementation, MAAIF will seek to strengthen both intra-sectoral and multi-sectoral
coordination and linkages through the use of existing coordination mechanisms and platforms and
other institutional innovations. Given the centrality of the sector in the achievement of national
development objectives, functional and collaborative linkages between the sector agencies and with
other government MDAs, LGs and other stakeholder institutions (such as the civil society, private
sector and development partners) will be strengthened.
The approach to be taken will be guided by the important principle and understanding that many of
the outcomes and successes of the ASSP implementation will lie outside the agricultural sector itself
and, hence, the policies and strategies of other sectors and institutions will need to be taken into
account in the implementation process. In this regard, the provisions of the NDP II will provide the
overall strategic framework within which the ASSP will be implemented.
In practical terms, MAAIF will continue to take a SWAP approach to the sector development
working, mostly, through the Agriculture Sector Working Group (AgSWG), a multi-stakeholder
platform, which will meet at least once every quarter to transact, among other matters, the following:
Coordinate and harmonize ASSP implementation to ensure that it is in line with the NDP II
goals and objectives;
Ensure ASSP investment programmes are aligned with sector priorities;
Pursue solutions to structural, institutional and other constraints to effective ASSP
implementation at national, zonal, and local levels;
Review mechanisms for enhancing stakeholder participation in implementing the ASSP;
Review the Agriculture BFP as a basis on which the annual budget for the sector is compiled;
Provide the main forum for the sector-wide approach to planning and budgeting for the
agriculture sector; and
Identify, on the basis of sector expenditure and investment plans and the BFP, policy issues
for consideration and action by the TPM;
Provide information for the Joint GoU/DP Reviews; and
Monitor budget implementation vis-a-vis the aims and objectives set out in the BFP.
The AgSWG is composed of MAAIF TPM and includes heads of all MAAIF sector agencies,
AgDPs, MOFPED, and representation from private sector, NGOs, civil society, ULGA and the
Agricultural Council of Uganda. In addition, the sector will have fully-established and robust
coordination mechanisms at central, zonal, district and sub-county levels. These will include:
At national/ multi-sector level: Parliamentary Committee on Agriculture; AgSWG;
Conditional Grant Utilisation Agreement – Joint Technical Committee; Joint Annual Review
on Decentralisation; Joint Sector Annual Review; and National Farmers’ Forum;
At Sector management level: TPM – Technical Committee; Planning and Budgeting

ASSP 2015/16 to 2019/20 Draft 72
Committee; ATAAS; and strategic partnership framework agreements (agency to agency);
Inter-Agency Coordination Committee; and
At Local level: District Farmers Forum; Regional/ Zonal Coordination Committees; Sub-
County Farmers’ Fora; ZARDIS; Cooperatives; Production and Marketing Committees;
Technical Planning Committees; and Parish Coordination Committees.

ASSP 2015/16 to 2019/20 Draft 73
5 ASSP COST AND FINANCIAL PLAN
5.1 Context of financial plan The provision of adequate financial resources will be absolutely crucial for the success of the
programmes set out in this ASSP. The financial plan of the ASSP must, first and foremost, be
considered within the context of GoU’s 2003 commitment to the Maputo Declaration for
Comprehensive Africa Agriculture Development Programme (CAADP) and, more specifically, to
the undertaking to allocate 10% of the national budget to the agricultural sector. During the
implementation of the DSIP, resource allocation by GoU registered an increase in allocation of
resources to the agriculture sector from the UGX378.88 billion in the 2012/13 approved budget (out
of the national budget of UGX10.90 trillion) to 484.68 billion (out of the national budget of
UGX17.95 trillion). However, in terms of share to the national budget, the allocation declined from
3.4% to 3.2% between 2012/13 and 2014/15 respectively (see Section 2.3.3 and Table 7).
This means that there is scope to significantly scale up funding to the sector and this financial plan
proposes two funding scenarios. The first links the sector and individual agencies’ annual action
plans to the NDP II Cost Implementation Matrix as well as MFPED MTEFs. This gave rise to the
constrained budget shown in Annex D. The second the unconstrained budget that links the sector
and individual agencies’ annual action plans and costs to the sector undertakings in the NDP II. The
unconstrained budget is shown in Annex E. The unconstrained budget has further been
disaggregated to produce a commodity and thematic budget that is shown in Annex F.
5.2 Budgeting approach and methodology In developing the budgets of the ASSP, consideration has been given to the need to remain within
reasonable limits for funding paying particular regard to the financial ceiling set by the MTEF. It is
also necessary to take into account the equitable distribution of the budgets among the various
priorities and commodities so that allocation to one will not be at the expense of other priorities. The
budget also takes into account the need for efficiency, effectiveness and transparency in the use and
allocation of resources and the need for the cooperation of all stakeholders to achieve this.
Activity based budgeting was adopted in developing the estimates which were guided by indicative
costs of implementing the necessary strategic actions under each thematic area. In totality, this
constituted the four thematic categories to be interactively implemented to achieve the desired
outcomes from the ASSP.
5.3 Provisions of the constrained budget The budget estimates in Table 12 (for details, refer to Annex D), presents a summary of the selected
priorities and strategies described in previous sections, attendant individual budgets and the totality
of all the budgets. The total cost of the five-year constrained ASSP budget, as provided in the NDPII,
is estimated at UGX4,626.4 billion. First year costs start at UGX479.9 billion, increasing to
UGX782.5 billion in the second year, UGX875.7 billion in the third year, UGX1,080.1 billion in the
fourth year and UGX1,408.3 billion in the fifth year. The bulk of the funds of UGX2,062.4 billion
(44.6%) will be allocated towards the first priority targeting to increase agricultural production and
productivity. This is followed by UGX1,639.1 billion (35.4%) targeting to increase access to critical
farm inputs, UGX589.7 billion (12.7%) targeting to improve agricultural markets and value addition
and UGX335.3 billion (7.2%) targeting to improve service delivery through strengthening the
sector’s institutional and enabling environment.

ASSP 2015/16 to 2019/20 Draft 74
Table 12: Constrained ASSP budget 2015/16-2019/20
ASSP Priorities and Strategies Yr. 1 Yr. 2 Yr. 3 Yr. 4 Yr. 5 Total %
Priority 1: Increase Agricultural Production And
Productivity
231.7 392.1 394.0 472.7 571.8 2,062.4 44.6
Strategy 1: Strengthening ecologically sound
agricultural research and climate change resilient
technologies and practices
86.7 103.8 109.4 116.9 128.7 545.5 11.8
Strategy 2: Implement a single spine agricultural
extension system while promoting gendered
innovation in agricultural research centres and
extension services.
32.4 100.0 105.0 115.0 141.2 493.5 10.7
Strategy 3: Strengthen farmer group formation and
cohesion including commodity associations,
platforms, federations and co-operatives
2.5 6.5 6.5 9.0 12.6 37.0 0.8
Strategy 4: Accelerate the development and
commercialisation of the prioritised agricultural
commodities
56.3 79.3 72.6 112.0 136.9 457.2 9.9
Strategy 5: Control pests, vectors and diseases 51.5 76.1 74.1 78.8 100.8 381.4 8.2
Strategy 6: Other production and productivity
enhancing measures
2.3 26.4 26.4 41.0 51.6 147.7 3.2
Priority 2: Increase access to critical farm inputs: 195.9 265.1 306.1 350.5 521.5 1639.1 35.4
Strategy 1: Promote agriculture mechanisation 7.8 30.1 37.1 38.8 46.1 159.8 3.5
Strategy 2: Improve access to high quality seeds,
planting and stocking materials
171.4 180.5 181.9 184.6 207.5 159.4 3.4
Strategy 3: Increase access to water for agricultural
production (irrigation, water for livestock,
aquaculture).
6.1 40.3 69.5 85.2 159.1 360.3 7.8
Strategy 4: Enhance access and use of fertilisers by
all categories of farmers.
10.6 14.3 17.6 41.9 108.8 193.1 4.2
Priority 3: Improve agricultural markets and
value addition for the 12 prioritised commodities
24.7 77.4 110.8 178.4 198.3 589.7 12.7
Strategy 1: Promote private sector investment in
value addition of the 12 prioritised commodities
through PPP
1.0 5.0 10.0 15.0 15.0 46.0 1.0
Strategy 2: Build capacities of farmers, traders and
processors in quality standards and market
requirements of the 12 priority commodities
19.5 35.4 60.8 78.4 98.3 292.5 6.3
Strategy 3: Operationalise the commercialisation
fund
3.0 7.0 10.0 10.0 10.0 40.0 0.9
Strategy 4: Ensure the development, maintenance
and improvement of physical agricultural marketing
infrastructure
1.2 30.0 30.0 75.0 75.0 211.2 4.6
Priority 4: Institutional and Enabling
Environment Strengthening
27.6 47.8 64.8 78.5 116.6 335.3 7.2
Strategy 1: Strengthen institutional capacity of
MAAIF and public agricultural agencies
16.2 31.4 43.3 52.3 79.2 222.4 4.8
Strategy 2: Improve the capacity for quality
assurance, regulation, food and safety standards for
outputs and products across crops, livestock and
fisheries sub-sectors.
5.2 6.9 8.5 14.32 20.1 55.02 1.2
Strategy 3: Mainstream cross-cutting issues of
gender, youth, HIV/AIDS, environment and climate
change, food and nutritional security
6.2 9.5 13.0 11.9 17.3 57.9 1.3

ASSP 2015/16 to 2019/20 Draft 75
ASSP Priorities and Strategies Yr. 1 Yr. 2 Yr. 3 Yr. 4 Yr. 5 Total %
Total budget for the ASSP 479.9 782.5 875.6 1,080.1 1,408.3 4,626.4
5.4 Provisions of unconstrained budget Table 13 presents a summary of the priorities and strategies in the ideal case scenario, whose
allocation trend is different from that in the constrained budget. The ideal budget for the ASSP is
estimated at UGX 6,969 billion. First year costs start at UGX488.9 billion, increasing to
UGX1,284.2 billion in the second year, UGX1,479.9 billion in the third year, UGX1,693.1 billion
in the fourth year and UGX2,022.9 billion in the fifth year. The bulk of the funds amounting to
UGX2,712.7 billion (38.93%) are allocated towards increasing access to critical farm inputs. This is
closely followed by UGX2,707.3 billion (38.85%) targeting to increase agricultural production and
productivity, UGX1,012.9 billion (14.53%) targeting to improve agricultural markets and value
addition and UGX536.1 billion (7.69%) targeting to improve service delivery through strengthening
the sector’s institutional and enabling environment.
Table 13: Unconstrained (or Ideal) ASSP budget 2015/16-2019/20
Outcomes and Strategies Y1 Y2 Y3 Y4 Y5 Total %
Outcome 1: Increase agricultural production and productivity 239.0 496.6 560.3 654.0 757.5 2707.3 38.85
Strategy 1: Strengthening ecologically sound agricultural research and climate change resilient technologies and practices 75.5 106.6 112.2 119.7 131.5 545.5 7.83
Strategy 2: Implement a Single Spine Agricultural Extension system while promoting gendered innovation in agricultural research centres and extension services. 31.4 101.0 166.0 195.0 228.8 722.2 10.36
Strategy 3: Strengthen Farmer Group formation and cohesion including commodity associations, platforms, federations and co-operatives 1.0 11.5 11.5 13.5 15.9 53.4 0.77
Strategy 4: Accelerate the development and commercialisation of the prioritised agricultural commodities 67.6 136.5 131.8 166.8 188.6 691.3 9.92
Strategy 5: Control Pests, Vectors and Diseases 61.2 114.5 112.4 118.0 141.1 547.2 7.85
Strategy 6: Other production and productivity enhancing measures 2.3 26.4 26.4 41.0 51.6 147.7 2.12
Outcome 2: Increase access to critical farm inputs: 194.9 494.0 589.4 631.7 802.8 2712.7 38.93
Strategy 1: Promote Agriculture mechanisation 7.8 30.1 37.1 38.8 46.1 159.8 2.29
Strategy 2: Improve access to high quality seeds, planting and stocking materials 173.6 384.9 468.3 469.0 491.9 1987.6 28.52
Strategy 3: Increase access to water for agricultural production (irrigation, water for livestock, aquaculture). 6.1 67.9 69.5 85.2 159.1 387.9 5.57
Strategy 4: Enhance access and use of fertilizers by all categories of farmers. 7.4 11.1 14.5 38.8 105.6 177.4 2.55
Outcome 3: Improve agricultural markets and value addition for the 12 prioritised commodities 25.9 192.9 217.2 279.9 297.0 1012.9 14.53
Strategy 1: Promote private sector investment in value addition of the 12 prioritised commodities through PPP 1.0 5.0 10.0 15.0 15.0 46.0 0.66

ASSP 2015/16 to 2019/20 Draft 76
Outcomes and Strategies Y1 Y2 Y3 Y4 Y5 Total %
Strategy 2:Build capacities of farmers, trades and processors in quality standards and market requirements of the 12 priority commodities 20.7 150.9 167.2 179.9 197.0 715.7 10.27
Strategy 3: Operationalize the commercialisation fund 3.0 7.0 10.0 10.0 10.0 40.0 0.57
Strategy 4: Ensure the development, maintenance and improvement of physical agricultural marketing infrastructure 1.2 30.0 30.0 75.0 75.0 211.2 3.03
Outcome 4: Institutional and enabling environment strengthening 29.1 100.8 113.1 127.4 165.6 536.1 7.69
Strategy 1: Strengthen institutional capacity of MAAIF and public agricultural agencies 17.1 68.7 75.9 84.5 111.5 357.6 5.13
Strategy 2: Improve the capacity for quality assurance, regulation, food and safety standards for outputs and products across crops, livestock and fisheries sub-sectors.
6.79 19.9 21.5 28.32 34.1 110.61
1.59
Strategy 3: Mainstream Cross-cutting Issues of Gender, Youth, HIV/AIDS, Environment and Climate Change, food and nutritional security 5.2 12.3 15.8 14.7 20.1 67.9 0.97
Total Budget for the ASSP 488.9 1284.2 1479.9 1693.1 2022.9 6969.0
5.6 Resource mobilisation The GoU will seek to provide much of the funding required for implementing the ASSP. This will
be done within the national budget framework or MTEF that stipulates the available resource
envelope and sector ceilings for each year. However given the limited funding available, additional
resources will mobilised from development partners and the private sector. The resource
mobilisation and expenditure strategies to be adopted will include:
a) Computation of short and medium term financial estimates of budget and off budget internally
generated funds (IGFs), projected GoU in-flows and resources from development partners;
b) Determination of resource gaps and identification of appropriate strategies for mobilisation of
additional resources to fill the financial shortfalls;
c) Computation of annual cost estimates (capital and recurrent) of priority programmes and the
overall cost of the plan (recurrent and capital);
d) Negotiation with potential donors on funding contribution through direct budget support or
through specific project or programme funding.
5.6.1 Support from development partners
It is clear that projects and programmes to be implemented will require substantial allocations from
the national budget. To this end and in the spirit of continuing and reinforcing past and present
collaboration, development partners active in supporting current initiatives will also be part of the
funding sources over the plan period. These include the World Bank, Africa Development Bank,
European Union, People’s Republic of China, United States Aid for International Development,
Japan International Cooperation Agency, Danida, The Royal Dutch Embassy, United Nations
Organisations (United Nations Development Programme, Food & Agriculture Organisation and
World Food Programme), IFAD, the French Development Agency and the Korean International
Agency among others,. Tapping into this existing source will further increase the available budget
provision together with technical and financial support from international communities, development

ASSP 2015/16 to 2019/20 Draft 77
partners, NGOs and CSOs.
5.6.2 Support from the private sector
The ASSP explicitly takes into account the important contribution of the private sector through, for
example, financing of agricultural activities by banks and other micro-lenders. These contributions
are captured through the BoU statistics. The ASSP presents various opportunities for the private
financial institutions to fund innovative private sector activities or get involved in PPPs that promote
market-driven production, processing and marketing initiatives. The objective of providing
opportunities for this type of support and involvement in the ASSP, is to expedite commercialisation
of agriculture by catalysing increased private sector participation in market-oriented production and
service delivery, promoting productivity and profitability or commercial viability of sector activities
at all levels of the wider agricultural sector value chains.
5.7 Financial management arrangements The GoU has well established and elaborate laws and financial management regulations and these
include the Public Financial Management Act (PFMA) and the Public Procurement and Disposal
Act (PPDA). The provisions of these laws will be followed in the implementation of the ASSP.
Under the provision of PFMA, disbursements for the sector are implemented through eleven vote
functions that are administered by eight sector and local government institutions or agencies. For
example directly MAAIF administers the vote functions of policy, planning and support services;
crops production regulation; animals (including fisheries); and extension services (incorporating
agribusiness). The research function vote is controlled by NARO, while coffee development vote is
controlled by CDA. The specific allocations are approved by parliament annually upon submission
of the ministerial policy statement (MPS) for the sector. It is planned that during the course of the
ASSP, resources will mainly be directed at the specified priorities.
5.7.1 Absorption capacity
The sustainability of the ASSP and the achievement of its key objectives rely heavily on the ability
of the MAAIF to maintain and execute its role as the lead ministry in the provision of key support
and advisory services to the sector. The relatively high amounts of financial resources to be
mobilised for funding the ASSP will require the review and reconciliation of funding arrangements
with development partners so that conditionalities for loans and grants are aligned with GoU laws.
A further complication is the seasonality of agriculture funding and procurements that require
calibration of procurement cycles with agricultural seasons.
5.7.2 Return on investment
For the private sector and farmers to increase production and productivity of the identified
commodities through the various strategies laid out in the ASSP, there will be need for incentives to
be put in place to encourage them to use their own equity capital and/or borrowed funds to develop
commercial type operations integrating production, agro processing and value adding as well as
marketing of agricultural products specifically targeting either export markets or import substitution
or both. Incentives may also target private sector commercial investment in agriculture located in
previously disadvantaged rural communities such as in Northern Uganda. Such investments will
only materialise if there is a good return on investment.

ASSP 2015/16 to 2019/20 Draft 78
6 MONITORING AND EVALUATION FRAMEWORK
6.1 M&E framework and process
Over the ASSP implementation period, the national M&E policy and M&E standards from OPM
will be implemented in all MAAIF departments and agencies. Monitoring will be routinely
conducted so as to track progress on the implementation of the ASSP. The existing framework will
be reviewed and further strengthened to ensure availability of an efficient and effective M&E
framework structured at national and district levels. At the national level, a schedule of ministerial
level strategic monitoring committee meetings will be established and used for monitoring the
progress being made by MDAs involved in the implementation of the ASSP. In addition
consolidated quarterly, semi-annual and annual progress reports will be produced and disseminated
by MAAIF based on inputs from the key departments, agencies and local governments involved in
the implementation of the ASSP.
6.2 M&E coordination and outcomes
To coordinate the inputs from different data sources, the M&E division within the MAAIF will lead
all the M&E initiatives in the sector, guided by the FIP that provides the framework for
operationalising the National Policy on Public Sector Monitoring and Evaluation (NM&E) in the
agricultural sector. First, Agricultural sector results framework with outcome indicators and targets
will be established at the start of the ASSP implementation. In addition, MDA intermediate outcome
indicators and departmental output indicators and targets for every financial year over the ASPP
implementation will be defined. The M&E strategy is anchored on two intermediate outcomes.
These are:
1) Availability of timely and reliable M&E information on all ASSP performance indicators.
This will be achieved through: a) proper coordination and oversight of M&E activities in the
agricultural sector, b) recruitment and or assigning focal points in all sector Agencies,
departments and local governments responsibility for statistical production, monitoring and
evaluation, c) establishment of a computerized web-based agricultural sector M&E system,
and d) promoting and enforcing M&E standards.
2) Increased use of M&E information to inform programme, policy, and resource allocation
decisions in the sector. This will be achieved through: a) generation of data and explanatory
information on progress against performance indicators in the sector, b) planning and
budgeting for M&E activities by all projects under the ASSP implementation by MAAIF
departments and agencies, including complying with policy recommendations of allocating
3% of the recurrent non-wage budget and 2% of the project budgets to M&E activities, c)
tracking monitoring, review and evaluation recommendations for all projects and
programmes, d) availing M&E reports to the public and policy makers and programme
managers in a timely manner

ASSP 2015/16 to 2019/20 Draft 1
6.3 Monitoring of ASSP Implementation
Monitoring will be routinely conducted so as to track progress on the implementation of the ASSP.
The existing framework will be reviewed and further strengthened to ensure availability of an
efficient and effective monitoring and evaluation framework structured at national and DLG levels.
At the national level, a schedule of M&E technical working group meetings will be established and
used for monitoring the progress being made by MDAs involved in the implementation of the ASSP.
In addition, consolidated quarterly, semi-annual and annual progress reports will be produced and
disseminated by MAAIF based on inputs from the key departments, agencies and local governments
involved in the implementation of the ASSP.
6.4 Evaluation of ASSP Implementation
MAAIF annually, organizes a joint agricultural sector performance review during which respective
heads of sub sectors and technical support units present reports on progress of operationalisation of
respective development plans of the previous financial year. This strategic plan requires that such
reviews will take place at district, regional and national level prior to the overall joint sector review.
This is to enable key stakeholders to be brought together to review, learn and devise strategies for
overcoming barriers and improving performance in implementation of ASSP at their respective
level. In this regard, local level annual feedback and reflection sessions will be timed to take place
prior to the Joint Agricultural Sector Annual Review so that the issues arising are shared and
consolidated for national level deliberations. In addition, scheduled reviews and evaluation will be
periodically conducted to assess the impact of the interventions on the sector, so as to support the
overall NDP monitoring and evaluation. These include the Mid Term Review and the Final
Evaluation of the ASSP. The schedule of the monitoring activities is shown in the Table 14 below.
Table 14: Monitoring and Evaluation Schedule
Objective
Level
Year 1 Year 2 Year 3 Year 4 Year 5
Qtr
. 1
Qtr
. 2
Qtr
. 3
Qtr
. 4
Qtr
. 1
Qtr
. 2
Qtr
. 3
Qtr
. 4
Qtr
. 1
Qtr
. 2
Qtr
. 3
Qtr
. 4
Qtr
. 1
Qtr
. 2
Qtr
. 3
Qtr
. 4
Qtr
. 1
Qtr
. 2
Qtr
. 3
Qtr
. 4
MONITORING
Goals
Outcomes
Outputs
Activities
Inputs
Monitorin
g Visits
Support
Supervisi
on
Quarterly
Reports
Semi-
Annual
Reports
Annual
Report
EVALUATION

ASSP 2015/16 to 2019/20 Draft 2
Objective
Level
Year 1 Year 2 Year 3 Year 4 Year 5
Qtr
. 1
Qtr
. 2
Qtr
. 3
Qtr
. 4
Qtr
. 1
Qtr
. 2
Qtr
. 3
Qtr
. 4
Qtr
. 1
Qtr
. 2
Qtr
. 3
Qtr
. 4
Qtr
. 1
Qtr
. 2
Qtr
. 3
Qtr
. 4
Qtr
. 1
Qtr
. 2
Qtr
. 3
Qtr
. 4
Baseline
Survey
Annual
reviews
Mid-term
review
Impact
Assessme
nt
End of
Plan
Review
6.5 ASSP Logical Framework
Indicators for supporting the M&E of the ASSP have been developed at the output, outcome and
impact levels. The impact indicators that address medium to long-term results include poverty
reduction, economic growth and rural transformation. In the medium term, the outcome indicators
include: increased household incomes, increased agricultural production, increased food security/
improved household nutrition, percentage annual growth in agricultural value addition and increased
foreign earnings and/ or import substitutions. These are summarized in the Table 15 below.

ASSP 2015/16 to 2019/20 Draft 3
Table 15: Logical Framework Matrix for M&E Programme Description Indicators/Targets Source of
verification
Assumptions
Overall Objective/ Goal
Poverty reduction, increased
food security and availability
of quality food to Ugandans.
%age change in proportion of rural
population below the poverty line,
target=50% reduction.
UNHS Adequate budget allocation
Continued GoU commitment
Agriculture GDP growth rate;
target=6%
Share of agriculture GDP in total GDP
UBOS
Labour Productivity (GDP per Worker
- US$)
UBOS
% of children under five years of age
who are undernourished’
UNHS/UDHS Adequate budget allocation
Continued GoU commitment
Purpose/Development
Outcome
a) Increase productivity by
farmers to at least 50% of the
yields at research stations for
the 12 priority commodities
Level of household agricultural income
UNHS Adequate budget allocation
Continued GOU commitment
Percentage of labour force in
agriculture
UNHS
%age change in agricultural
contribution to total GDP
UBOS Adequate budget allocation
Continued GOU commitment
b) Transform subsistence
farmers into enterprise
farmers and transform
smallholders farmers into
commercial farmers;
%age change in the labour force in
subsistence production.
Target: Reduction from 6 million in
2012/13 to 3 million in 2019/20.
UNHS Continued GOU commitment
Adequate budget allocation
% annual growth in agricultural value
added
UNHS Adequate budget allocation
Increase agriculture exports
to at least US$4 billion per
year;
Value of agricultural exports UBOS statistical
abstract Adequate budget allocation
Percentage change in ratio of
agricultural exports to total exports
UBOS statistical
abstract
Percentage change in ratio of
agricultural exports to agriculture GDP
UBOS statistical
abstract
Results/Outputs/Immediate
Result Increasing agriculture
production and productivity,
% change in average agricultural yields
of priority commodities and
agricultural products.
Annual Sector
Review Reports
from MAAIF
Continued GOU commitment
Adequate budget allocation
Percentage change in targeted
beneficiaries using improved
technologies and practices (by
commodity): crop, livestock, fisheries,
SLM technologies
Annual Sector
Review Reports
from MAAIF
Adequate budget allocation
Continued GOU commitment
% change in production from
aquaculture farms
Annual Sector
Review Reports
from MAAIF
Continued GOU commitment
Adequate budget allocation
Percentage change in targeted
beneficiaries satisfied with
extension/advisory services
Annual Sector
Review Reports
from MAAIF
Adequate budget allocation
Continued GOU commitment
Percentage change in registered fishers
and fish traders complying with fishing
standards and regulations
Annual Sector
Review Reports Continued GOU commitment
Adequate budget allocation
Increasing access to critical
farm inputs
% of farmers using labour saving
technologies
Annual Sector
Review Reports Adequate budget allocation
Continued GOU commitment
% of farmers applying recommended
package of inputs
Annual Sector
Review Reports Continued GOU commitment
Adequate budget allocation

ASSP 2015/16 to 2019/20 Draft 4
Programme Description Indicators/Targets Source of
verification
Assumptions
Change in area under irrigation as a
percentage of total area of agricultural
land with irrigation potential
Annual Sector
Review Reports Adequate budget allocation
Continued GOU commitment
% change in the proportion of farmers
with access to a functional irrigation
and drainage network
Annual Sector
Review Reports Continued GOU commitment
Adequate budget allocation
Improving agricultural
markets and value addition
for the 12 prioritised
commodities
Agricultural exports as a % of total
value added in agricultural sector.
Trade statistics
Adequate budget allocation
Continued GOU commitment
Value of agricultural exports as a
percentage of total exports
Trade statistics
Continued GOU commitment
Adequate budget allocation
% change in number of functioning and
certified agricultural marketing
infrastructure
Percentage of strategic commodities
production that is marketed
Trade statistics
Adequate budget allocation
Continued GOU commitment
Strengthening institutional
capacity of MAAIF and
public agricultural agencies. Percentage of positions in the approved
structure of MAAIF headquarters and
her agencies that are filled
Annual Sector
Review Reports
Continued GOU commitment
Adequate budget allocation
No of MDAs and LGs that have an
operational and functional agricultural
M&E system.
Annual Sector
Review Reports Adequate budget allocation
No of MDA and DLG that have an
operational and functional agricultural
statistical data management system
Annual Sector
Review Reports Continued GOU commitment
Adequate budget allocation

ASSP 2015/16 to 2019/20 Draft 5
ANNEXES
Annex A: Summary of activities along value chains of priority/ strategic
commodities Commodity Actions
Banana a) Increase banana production and productivity by 30% through better seed systems and agronomic
practices.
b) Mainstream gender, youth, environment and climate change, HIV/AIDS, food and nutrition security
issues in the banana sub-sector.
c) Increase access and utilisation of high quality production inputs such as: transgenic plants, fertilisers,
mechanisation and herbicides, among others.
d) Facilitate domestic, regional and international trade in bananas, plantains and banana-and-plantain based
products by the public sector.
e) Accelerate the development and value addition of bananas and plantains as an industry.
f) Control diseases, pests and vectors in the banana industry.
g) Improve the capacity for quality assurance, regulation, food and safety standards for outputs and products
across the banana industry.
Beans a) Increase seed production, multiplication and distribution
b) Facilitate information and knowledge provision through extension
c) Promote mechanisation of beans production
d) Promote fertiliser use and sustainable soil management
e) Support irrigation technologies in beans production
f) Facilitate marketing, postharvest handling and value addition
g) Strengthen the institutions and enabling environment
Maize a) Increase seed production, multiplication and distribution
b) Facilitate information and knowledge provision through extension
c) Promote mechanisation of maize production
d) Promote fertiliser use and sustainable soil management
e) Support irrigation technologies in maize production
f) Facilitate marketing of maize,
g) Promote postharvest handling and value addition
h) Increase access to agricultural finance and credit;
i) Support policy and institutional development
Rice a) Increase seed production, multiplication and distribution
b) Facilitate information and knowledge provision through extension
c) Promote mechanisation of rice production
d) Promote fertiliser use and sustainable soil management
e) Support irrigation infrastructure in rice production
f) Facilitate marketing, postharvest handling and value addition of rice
g) Strengthen the institutions and enabling environment.
Tea a) Expansion of tea growing areas.
b) Tea gap−filling in the already planted areas.
c) Improved extension service.
d) Build processing facilities (tea factories).
e) Strengthen tea research.
f) Develop and access domestic, regional and international markets.
g) Strengthen institutional and the enabling environment.
Coffee a) Improve the quality of Ugandan coffee by ensuring best practices with respect to SPS and food safety
principles and application of standards
b) Promote the production of coffee through introduction of technology, carrying out research and
development and deliberate promotion of coffee growing
c) Strengthen promotion and marketing of Ugandan coffee through information sharing and exchange, education
and training as well as communication so as to market the available coffee varieties.
Cassava a) Scale up cassava production in the districts
b) Provide clean planting material and value addition interventions,

ASSP 2015/16 to 2019/20 Draft 6
c) Finalize on the cassava policy
d) Sensitize farmers on cassava possessing machinery and equipment
e) Promote post-harvest and value addition equipment
f) Enforce of the quality standards
g) Strengthen extension service delivery and Market information dissemination to farmers.
Fruits &
Vegetables
a) Production and distribution of quality clean fruits and vegetable seedling materials tolerant to pests and
diseases with desirable fresh and processing characteristics.
b) Increase production of fresh fruits and vegetables in the country
c) Establishment of marketing structures to support value addition activities along the different fruits and
vegetables value chain
d) Support and evaluate cottage fruits and vegetables processors engaged in product development
Dairy a) Strengthen the dairy sector regulatory frame-work
b) Promote local consumption and export of milk and dairy products
c) Rehabilitate existing and develop new milk cold chain and processing infrastructure
d) Strengthen milk quality assurance system (laboratories, lab technologists, training in hygienic milk
handling along the whole dairy value chain).
e) Build local capacity in feed production and marketing (conserved feed, pasture and rangeland
improvement)
f) Enhance availability for improved dairy germplasm
g) Develop of a national breeding programme and breeding guidelines
h) Develop the national dairy herd information management system
i) Build local and National capacity for on-farm animal disease and vector control and management.
Meat a) Provide an enabling environment and data collection for the meat Sector.
b) Enhance beef cattle, goat, poultry, pork and productive entomology production and productivity
c) Improve meat hygiene services and development of meat industry marketing infrastructure
Fisheries d) Promote recovery of depleted stocks of the large commercial fishes
e) Develop the fishery of small pelagic fishes
f) Promote aquaculture to a commercial level.
Cocoa a) Strengthen cocoa research and technology development focusing on high yielding varieties, appropriate
technologies for improving quality of the beans and, controlling cocoa pests and diseases.
b) Improve delivery of extension services to cocoa growers in order to enhance uptake of improved
technologies.
c) Promote access to mechanisation and high quality planting materials.
d) Strengthen the policy, standards enforcement so as to improve the capacity for cocoa quality assurance.
e) Establish platforms for championing the development of the cocoa commodity.
Irish Potato a) Production and distribution of formal seed potato of improved varieties with preferred end-user
characteristics
b) Production and marketing of ware potato for rural and urban consumption
c) Facilitate the setting up of an out-growers ware potato scheme and nucleus farm to support small and
medium enterprises (SMEs) engaged in processing of potato under a PPP mode
Oil Palm a) Seed multiplication and distribution
b) Information and knowledge
c) Mechanisation of oil seed production
d) Fertilisers and sustainable soil management
e) Irrigation (supplemental)
f) Access to agricultural finance and credit
g) Postharvest handling and value addition
h) Marketing
i) Policy and institutional development
Oil Seed a) Breed for improved OPV and hybrid parent lines.
b) Evaluate introduced new varieties
c) Multiply foundation seed
d) Monitor distribution of certified oilseeds seeds to farmers
e) Provide technical back up support and harmonise extension service
f) Training all oilseeds farmers on quality standards and postharvest handling technologies and practices

ASSP 2015/16 to 2019/20 Draft 7
g) Mobilize all farmers/FOs for collective marketing
h) Develop and implement Oilseeds policies and standards

ASSP 2015/16 to 2019/20 Draft 8
Annex B: Crop, livestock and fisheries production targets for 2015 - 2019 in
metric tons.
Commodity Baseline
2014 2015 2016 2017 2018 2019
Maize 2,868,000 3,513,300 4,567,290 5,937,477 7,718,720 10,000,000
Beans 1,011,000 1,526,610 2,442,576 3,908,122 6,252,995 10,000,000
Bananas 4,578,000 5,493,600 6,592,320 7,910,784 10,204,911 13,000,000
Rice 237,000 243,653 280,201 322,231 456,000 734,160
Coffee 211,872 254,246 305,096 381,370 476,712 595,890
Tea 61,376 73,600 83,200 92,800 102,400 112,000
Beef 202,929 332,640 339,293 346,079 353,000 360,000
Mutton/Goat 37,838 37,032 37,773 38,528 39,299 39,775
Pork 22,138 129,586 132,178 134,821 137,518 139,775
Poultry 54,868 59,257 60,443 61,651 62,884 63,647
Eggs 856,819 891,092 962,379 1,039,369 1,122,519 1,212,321
Dairy 1,550,000 2,089,243 2,256,382 2,482,020 2,978,424 3,350,000
Cotton 12,674 22,458 29,195 37,953 49,339 64,750
Oil Seed 758,500 1,176,600 1,341,300 1,534,300 1,761,000 2,027,800
Oil Palm 75,861 106,000 171,720 198,760 206,060 206,060
Cocoa 25,720 24,968 32,459 42,196 54,855 71,000
Fish Catch 461,726 584,480 607,859 632,174 657,461 674,028
Cassava 2,812,700 2,925,208 3,071,468 3,225,042 3,402,419 3,579,800

ASSP 2015/16 to 2019/20 Draft 9
Annex C: Agricultural commodity export targets for 2015/16– 2019/20 in US$
millions Commodity Baseline
2014
2015/16 2016/17 2017/18 2018/19 2019/20
Coffee (beans and value added coffee) 410.06 577.70 644.90 735.40 921.90 1,153.50
Cotton (Lint and value added cotton) 21.92 84.00 114.10 160.23 245.87 355.51
Tea 84.74 92.30 99.80 115.60 134.00 155.30
Cocoa (Beans and value added cocoa) 59.40 78.30 92.80 117.80 149.30 192.30
Maize Grain 29.00 35.70 42.20 50.00 59.30 70.20
Value Added Maize 14.57 20.20 22.20 24.50 29.40 35.20
Beans and legumes 26.20 51.82 54.41 57.13 59.99 62.98
Rice 28.70 40.80 45.20 57.20 64.80 73.40
Sesame 55.20 65.40 70.70 89.40 99.00 109.70
Tobacco 66.00 70.30 72.30 74.30 76.30 78.40
Fish & Fish Products 134.80 163.10 179.40 197.30 217.10 238.80
Flowers 28.70 37.97 47.43 59.29 74.14 92.63
Fruits and Vegetables 16.10 32.70 43.50 57.90 77.00 102.40
Hides & Skins 73.80 82.30 75.10 49.70 36.50 33.60
Leather & Leather Products - 34.10 100.10 175.18 306.56 536.47
Livestock Products 29.50 44.40 53.20 63.90 76.70 92.00
Sugar 68.90 92.00 108.60 128.20 153.80 192.20
Animal/Veg Fats & Oils 102.32 135.60 162.72 195.26 234.29 281.14
Sorghum 35.165 40.44 46.51 53.48 61.50 70.73
Vanilla 2.651 3.05 3.50 4.03 4.63 5.33
Soya beans 0.912 1.27 1.78 2.50 3.50 4.89
Ground-nuts 0.816 1.15 1.61 2.25 3.15 4.41
Bananas 0.587 0.83 1.16 1.62 2.27 3.17
Pepper 0.573 0.80 1.12 1.56 2.19 3.07
Total 1,290.61 1,788.20 2,092.33 2,490.50 3,164.50 4,039.85

ASSP 2015/16 to 2019/20 Draft 10
Explanatory notes to Annexes B and C
Maize and Beans
Maize and beans production was estimated at 2.87 and 1.01 million mt respectively in 2014. Annual
national average yields was 2.6MT/HA for maize and 1.5 mt/HA for beans and, and formal export
earnings stood at US$ 43.57 million and US$ 26.2 million in 2014 for maize and beans respectively.
Productivity, production and export targets for the medium term are:
Maize productivity doubles from 2.50 – 5.00 mt/HA for maize, 1.5 – 2.5 mt/HA for beans by
2019. This will increase maize and beans production to about 10 million mt each by 2019 on
account of increased access to certified seeds and agro-inputs; increase in area planted and
increased access to extension services.
Maize formal exports are projected to increase from US$ 43.57 million – US$ 105.4 million in
2019, while export of beans is projected to increase to62.98 million US$ in 2019. The key drivers
for maize and beans exports are: 1) increased observation and compliance to EAC grain quality
standards (in line with the national grain policy) that will ease access to the regional market, 2)
expanded regional market with the admission of South Sudan into the EAC, and 3)intensified
efforts to formalise trade in grains through the warehouse receipt system and the regional
commodity exchange, 4)Government will also promote efforts for value addition in cereal
preparation and milling floor for the regional market.
Bananas
Production is currently estimated at 4.578 million MTs per year (UBOS, 2015). Production is
expected to almost triple by 2019 to approximately 13 million mt on account of enhanced control of
the banana wilt disease, increased access to extension services for proper management of banana
plantations and increased access to banana research technologies including high yielding varieties.
Banana exports are expected to increase from US$ 0.587 to 3.17 million by 2019 on account of
increasing regional demand with the increased mobility of Ugandans into the regional markets and
value addition to bananas targeted at increasing the shelf life.
Rice
Production of rice in 2014 was 237,000 mt, fetching Uganda a total export earnings of 28.7 million
US dollars. The current rice productivity stands at about 2.49 metric tonnes per hectare which is still
low. Productivity and production targets for medium term
Rice productivity almost double from 2.49 in 2014 to 4.0 mt/HA by 2020.
Rice production increase from 237,000 in 2014 to 680,000 mt in 2019.
Rice as a commodity to become a Net export earner by 2020.
Rice export earnings to increase from the current US$28.7 million to US$73.40 million
Tobacco
Tobacco has been one of the top five export earners, earning the country US$66 million in 2014.
Export earnings of tobacco estimated to grow marginally to approximately 78.4 million dollars on
account of the recent closure of BAT Uganda operations and the tobacco control act 2015, that is
expected to have a negative impact on the total amount of tobacco produced and exported from
Uganda.
Coffee

ASSP 2015/16 to 2019/20 Draft 11
Under the Commodity Approach the Government set has target of planting 100 million coffee
seedlings per annum. Exports expected to reach at least US$1.153 billion in 2019
Tea
The major objective of tea expansion is to:- To increase tea acreage from the current estimated
20,000 hectares by planting at least 3,000 Ha per year to be able to achieve a target of 15,000Ha
planned to have been planted by end of five (5) years (2015/16 – 2019/20) and bring total acreage
to 35,000 harvestable Hectares by 2020.
Parameters Baseline
2014 2015 2016 2017 2018 2019
Total Planted Area (Ha) 23,000 26,000 29,000 32,000 35,000 38,000
Total Harvestable Area (Ha) 20,000 23,000 26,000 29,000 32,000 35,000
Production Estimates (mt) 66,000 73,600 83,200 92,800 102,400 112,000
Processed tea Export in mt 61,395 68,465 77,395 86,326 95,256 104,186
Estimated Export Value in US$ Millions 84.70 92.30 99.80 115.60 134.00 155.30
Livestock Products- Meat and Milk
The overall objective of the meat sector programme is “to increase incomes of small and large scale
beef cattle, goat and poultry farmers through acceleration of meat production and attainment of up
to 13% per year growth rate by the end of five year period”. To achieve this, the sub-sector
interventions will broadly focus on the following specific objectives:
Provision of an enabling environment and data collection system for the meat sector.
Enhance beef cattle, meat goat, sheep, pig and poultry production and productivity
Improving meat hygiene services and developing meat industry marketing infrastructure
Enhancing productivity and export potential of commodities from productive insects
To increase production and productivity, Government will invest in improving access to water and
pastures, control of livestock disease, importation of breeds with high productivity, improving the
marketing infrastructure for livestock and strengthening the regulatory capacity the MDAs including
for compliance to SPS requirements.
Dairy
Priority interventions were selected and synthesized and will continue to be implemented as a
programme (The Dairy Sector Enhancement Programme) which commenced in FY 2015/16 and
implemented until FY 2019/20. The programme has three components, namely:-
a) Enabling environment;
b) Dairy marketing and value addition;
c) Improving dairy production and productivity;
d) Improving dairy production and productivity component; addresses development of improved
feeds, stocking improved breeds to foster milk productivity, management of livestock pests and
diseases and building the capacity of farmers to improve dairy management practices.

ASSP 2015/16 to 2019/20 Draft 12
The targeted performance indicators to be pursued during the implementation period are summarised
in the matrix below:
. Item 2015/16 2016/17 2017/18 2018/19 2019/20
Milk production 1.94 Bn 2.08 Bn 2.22 Bn 2.36 Bn 2.5 Bn
Milk marketable (70%) 1.26 Bn 1.36 Bn 1.46 Bn 1.55 Bn 1.65 Bn
Milk export (Tons) 63,400 74,100 84,800 95,500 1,062,000
Milk processed 676,000 792,000 908,000 1,024,000 1,140,000
Milk traded through formal channels (%) 20% 26% 32% 38% 44%
Milk traded through formal channels (Quantity) 690,410 968,767 1,280,000 1,613,699 1,989,041
Cotton
The Government together with other EAC countries have agreed top progressively bun importation
of second hand clothes into the EAC. This will reduce competition and create new export markets
for cotton and cotton value added products into the EAC countries. According production is expected
to increase from the baseline value of 12,674MT of lint to 64,750MT of link by 2019/20. Equally
exports of link and value added cotton products are projected to increase from 21.92 million dollars
in 2014 to 355.51 million dollars by 2019/20.
Oil Seed
Area planted, total production and productivity of oil seeds have been increasing over the years. The
total production is expected to continue increasing on account of the planned expansion of acreage
under palm oil and other oil seeds, from 758,500 mt in 2014 to an estimated 2,027,800MT by
2019/20. Equally, export earnings of vegetable fats and oils are projected to more than double from
the current 102.32 million dollars to 281.14million dollars by 2019/20.
Cocoa
Production was estimated at 25,720 MTs in 2014 and it’s expected to increase to approximately
71,000 mt by 2019. The area under cocoa production is projected to increase, while cocoa farmers
will get targeted support including seeds, extension services and fertilizers. The current good prices
on the international market are also expected to continue in the medium term. Targeted support will
be directed towards value addition on cocoa to take advantage of the regional market. Accordingly,
cocoa exports (Beans and value added cocoa) are expected to increase from US$ 59.40in 2014 to
192.30 million dollars by 2020.
Fisheries
The recovery of the fisheries sub-sector was experienced during the DSIP period with fish catch
increasing 16%. The recovery is projected to continue and aquaculture productions will continue to
be promoted across the country. The ASSP targets to increase capture fish and aquaculture
production by 45.9% from 461,726tons in 2014 to 674,028 metric tons by 2020, which is well within
the known existing Ugandan potential. Annual export earnings to grow from US$134.80 million in
2014 to US$238.8 million by 2020.

ASSP 2015/16 to 2019/20 Draft 13
Annex D: Indicative budget (UGX billions), constrained by the NDPII budget
ASSP IMPLEMENTATION MATRIX AND CONSTRAINED BUDGET IN LINE WITH THE NDP II
ASSP undertakings Y1 Y2 Y3 Y4 Y5
Year
1
Year
2
Year
3 Year 4 Year 5 Total
Lead
Implement
er
Total budget
479.96
782.41
875.72
1,080.03
1,408.30
4,626.42
Outcome 1: Increase agricultural production and productivity X X X X X
232.62
391.14
393.99
472.66
571.85
2,062.26
Strategy 1: Strengthening ecologically sound agricultural
research and climate change resilient technologies and
practices X X X X X
86.73
103.80
109.35
116.88
128.69
545.46 NARO
Agricultural technologies, innovations and management
practices (TIMPS) generation X X X X X
34.06
34.80
35.60
36.40
37.60
178.46 NARO
Breeding of climate smart – nutrient enriched farmer preferred
varieties and breeds X X X X X
4.49
4.54
4.66
4.77
4.94
23.40 NARO
Develop improved higher yielding crop varieties and livestock
breeds X X X X X
4.71
4.85
4.98
5.13
5.34
25.01 NARO
Nutrient fortified and transgenic crops (Bananas, Maize, Irish
potatoes) X X X X X
4.14
4.23
4.33
4.42
4.55
21.68 NARO
Characterizing plant and animal disease strains and agents X X X X X
3.57
3.62
3.64
3.71
3.79
18.33 NARO
Develop and release disease, pest and drought resistant
varieties/breeds X X X X X
4.71
4.85
4.98
5.13
5.34
25.01 NARO
Develop non-conventional animal feed X X X X X
4.14
4.23
4.33
4.42
4.55
21.68 NARO
Conduct on-station and multi-location evaluation of generated
lines X X X X X
4.14
4.23
4.33
4.42
4.55
21.68 NARO
On-farm trials and national variety evaluation trials for VCU and
DUS X X X X X
4.14
4.23
4.33
4.42
4.55
21.68 NARO
Strengthening the functioning of the National Agricultural
Research System (NARS) by identifying and building key
human resource capacity to support the sector X X X X X
3.36
9.00
10.00
10.20
10.60
43.16 NARO
Conduct an HR capacity needs assessment X
0.50
0.50 NARO

ASSP 2015/16 to 2019/20 Draft 14
ASSP IMPLEMENTATION MATRIX AND CONSTRAINED BUDGET IN LINE WITH THE NDP II
ASSP undertakings Y1 Y2 Y3 Y4 Y5
Year
1
Year
2
Year
3 Year 4 Year 5 Total
Lead
Implement
er
Develop and implement a staff recruitment and retention strategy X
0.25
0.25
0.50 NARO
Develop and implement a mentoring programme for junior
scientists X X X X X
1.00
1.00
1.00
1.00
1.00
5.00 NARO
Conduct short and long term training on Adaptive Research for
staff X X X X X
1.41
3.00
4.00
4.20
4.35
16.96 NARO
Establish an effective staff performance appraisal system X
0.20
0.20 NARO
Support to NARO scientists X X X X
5.00
5.00
5.00
5.00
20.00
Develop and implement a policy and regulatory framework
for biotechnology in agriculture. X X X X X
0.40
0.90
0.90
0.90
0.90
4.00 NARO
Fast tracking the laws and standards of GMOs production and
utilization X X X X X
0.20
0.40
0.40
0.40
0.40
1.80 NARO
develop and enhance capacity for implementing research
guidelines and procedures on biotechnology use and biosafety X X X X X
0.20
0.50
0.50
0.50
0.50
2.20 NARO
Develop and promote technologies and protocols for value
addition in agriculture and agro processing X X X X X
9.80
14.20
14.40
14.43
14.64
67.47 NARO
Conducting product development and end user marketability tests
to enhance utilization options for a range of strategic and priority
commodities X X X X X
3.60
3.60
3.60
3.85
3.80
18.44 NARO
Developing and validating technologies and protocols for agro-
processing including protocols for enhancing shelf life,uniform
ripening, stability X X X X X
3.00
3.00
3.00
3.00
3.00
15.00 NARO
Testing and ascertain thresholds on a range of parameters for
food safety and quality assurance and validate capacity for
compliance X X X X X
1.80
1.80
1.80
1.58
1.84
8.83 NARO
Development of processing/packaging tools and equipment X X X X X
1.40
5.80
6.00
6.00
6.00
25.20 NARO

ASSP 2015/16 to 2019/20 Draft 15
ASSP IMPLEMENTATION MATRIX AND CONSTRAINED BUDGET IN LINE WITH THE NDP II
ASSP undertakings Y1 Y2 Y3 Y4 Y5
Year
1
Year
2
Year
3 Year 4 Year 5 Total
Lead
Implement
er
Up-scaling uptake of existing and new appropriate
technologies, innovations and management practices (TIMPS). X X X X X
9.03
14.00
17.55
23.66
33.12
97.37
DAES/NA
RO
Technology promotion (production and agro-processing) and
farmer access to information/ knowledge X X X X X
5.46
9.00
11.05
15.21
21.29
62.01
DAES/NA
RO
Technology uptake grants for farmers, farmer groups and agro-
processors X X X X X
3.57
5.00
6.50
8.45
11.83
35.35 DAES
Accelerate Research and Technology Development of the
selected priority/ strategic commodities
X X X X X
30.08
30.90
30.90
31.29
31.83
155.00 NARO
Banana research and technology development X X X X X
1.85
2.35
2.35
2.35
2.35
11.25 NARO
Beans Research and technology development X X X X X
1.65
2.15
2.15
2.15
2.21
10.31 NARO
Fruits Research support programme X X X X X
2.00
2.50
2.50
2.50
2.50
12.00 NARO
Maize Research Programme X X X X X
1.82
2.36
2.36
2.32
2.44
11.29 NARO
Cassava Research Programme X X X X X
1.70
1.18
1.18
1.16
1.22
6.43 NARO
Rice Research Programme X X X X X
1.88
2.37
2.37
2.37
2.51
11.49 NARO
Oil seed Research Programme X X X X X
2.08
2.59
2.59
2.59
2.82
12.65 NARO
Tea Research X X X X X
4.16
2.86
2.86
3.34
3.37
16.60 NARO
Improvement of Coffee Research Systems X X X X X
5.08
5.18
5.18
5.18
5.06
25.67 NARO
Strengthening cocoa research and technology development X X X X X
1.96
2.20
2.20
2.20
2.20
10.78 NARO
Strengthening cotton production research X X X X X
3.40
2.17
2.17
2.14
2.14
12.02 NARO
Oil Palm research and technology development X X X X X
2.50
3.00
3.00
3.00
3.00
14.50 NARO

ASSP 2015/16 to 2019/20 Draft 16
ASSP IMPLEMENTATION MATRIX AND CONSTRAINED BUDGET IN LINE WITH THE NDP II
ASSP undertakings Y1 Y2 Y3 Y4 Y5
Year
1
Year
2
Year
3 Year 4 Year 5 Total
Lead
Implement
er
Strategy 2: Implement a Single Spine Agricultural Extension
system while promoting gendered innovation in agricultural
research centres and extension services. X X X X X
32.42
99.98
104.98
114.98
141.18
493.54 DAES
Wage costs of extension staff X X X X X
16.28
49.98
49.98
49.98
49.98
216.20 LG
Non-wage/operational costs at districtlevel X X X X X
14.14
45.00
50.00
60.00
85.00
254.14 LG
Farmer education and refresher trainings of extension staff X X X X X
1.00
1.00
1.00
1.40
4.40 DAES
Institutional strengthening of extension systems X X X X X
2.00
2.00
2.00
2.00
2.00
10.00 DAES
Strengthening Joint M&E and data systems between agricultural
research and extension services X X X X X
1.00
1.00
1.00
1.40
4.40 DAES
Promote strategic partnerships between research and technology
development and extension services at all levels X X X X X
1.00
1.00
1.00
1.40
4.40 DAES
Strategy 3: Strengthen Farmer Group formation and cohesion
including commodity associations, platforms, federations and
co-operatives
X X X X X
2.48
6.48
6.48
9.00
12.60
37.04 MAAIF
Farmer Institutional Development X X X X X
1.00
2.00
2.00
2.00
2.80
9.80 MAAIF
Establish & run atleast ten commodity platforms to constantly
discuss issues pertaining to particular commodity value chains X X X X X
0.48
0.48
0.48
1.00
1.40
3.84 MAAIF
Agribusiness development services and market linkages X X X X X
1.00
4.00
4.00
6.00
8.40
23.40
DAI & ED
/ NAADS
Strategy 4: Accelerate the development and commercialisation
of the prioritised agricultural commodities
X X X X X
56.30
79.34
72.63
112.04
136.91
457.23 MAAIF

ASSP 2015/16 to 2019/20 Draft 17
ASSP IMPLEMENTATION MATRIX AND CONSTRAINED BUDGET IN LINE WITH THE NDP II
ASSP undertakings Y1 Y2 Y3 Y4 Y5
Year
1
Year
2
Year
3 Year 4 Year 5 Total
Lead
Implement
er
Increasing Banana Production and Productivity X X X X X
0.80
1.15
1.15
1.65
2.25
7.00 MAAIF
Increasing Beans Production and Productivity X X X X X
0.80
1.35
1.35
1.85
2.39
7.74 MAAIF
Increasing Maize Production and Productivity X X X X X
1.00
1.42
1.28
1.76
2.27
7.73
Increasing Cassava Production and Productivity X X X X X
1.29
1.42
1.28
1.76
2.27
8.02
Rice X X X X X
1.62
1.93
1.93
3.93
4.71
14.12 MAAIF
Information and Knowledge X X X X X
0.32
0.63
0.63
1.13
1.39
4.10 MAAIF
Mechanisation X X X X X
0.60
0.60
0.60
1.10
1.34
4.24 MAAIF
Fertilization and sustainable soil management X X X X X
0.40
0.40
0.40
0.90
1.06
3.16 MAAIF
Institutions and enabling environment strengthening X X X X X
0.30
0.30
0.30
0.80
0.92
2.62 MAAIF
Tea X X X X X
1.01
3.24
3.52
4.91
6.27
18.95 MAAIF
Tea Extension Service X X X X X
0.45
0.74
1.22
2.18
2.85
7.43 MAAIF
Tea Area Expansion X X X X X
-
2.00
1.50
2.00
2.60
8.10 MAAIF
Tea Policy X X X X X
0.56
0.50
0.80
0.73
0.82
3.42 MAAIF
Coffee X X X X X
7.31
7.51
8.41
23.26
30.97
77.45 UCDA
Promote and support adoption of good agronomic practice at
farm level X X X X X
1.62
1.62
1.62
3.62
4.27
12.74 UCDA
Promote coffee growing in new areas and expansion in traditional
coffee growing areas X X X X X
1.00
1.10
2.00
10.85
16.00
30.95 UCDA
Coffee Agro Extensions and Business Development Services X X X X X
2.47
2.47
2.47
4.47
5.46
17.35 UCDA

ASSP 2015/16 to 2019/20 Draft 18
ASSP IMPLEMENTATION MATRIX AND CONSTRAINED BUDGET IN LINE WITH THE NDP II
ASSP undertakings Y1 Y2 Y3 Y4 Y5
Year
1
Year
2
Year
3 Year 4 Year 5 Total
Lead
Implement
er
Support and Strengthen Farmer Organizations X X X X X
2.22
2.32
2.32
4.32
5.24
16.41 UCDA
Fruits and Vegetables X X X X X
1.50
1.50
1.50
2.50
2.50
9.50 MAAIF
Dairy X X X X X
5.49
6.40
4.59
7.09
9.68
33.26 DDA
Institutional strengthening and creation of enabling environment X X X X X
0.60
0.60
0.60
1.60
2.20
5.60 MAAIF/D
DA
Enhancing availability of improved dairy cattle germplasm X X X X X
2.00
2.00
2.00
2.00
2.00
10.00 NAGRC&
DB
Strengthening milk quality assurance system X X X X X
0.09
0.09
0.09
0.59
0.68
1.54 DDA
Building local capacity in feed production and marketing X X X X X
2.50
3.41
1.60
2.10
3.71
13.32 DDA
Developing the national dairy herd information management
system X X X X X
0.30
0.30
0.30
0.80
1.10
2.80 DDA
Fisheries X X X X X
7.48
8.78
8.68
11.58
15.01
51.51
MAAIF/D
FR
Promoting recovery of depleted stocks of the large commercial
fishes X X X X X
0.80
0.90
0.90
1.40
1.76
5.76
MAAIF/D
FR
Developing the Fishery of Small Pelagic Fishes X X X X X
1.38
1.38
1.38
1.88
2.43
8.43
MAAIF/D
FR
Promoting commercial aquaculture X X X X X
2.10
2.10
2.00
2.60
3.44
12.24
MAAIF/D
FR
Infrastructure development along the value chain X X X X X
1.20
1.20
1.20
1.70
2.18
7.48
MAAIF/D
FR
Strengthen monitoring on all water bodies X X X X X
2.00
2.00
2.00
2.50
3.30
11.80
MAAIF/D
FR
Control of the new breed of weed and water hyacinth X X X X X -
1.20
1.20
1.50
1.90
5.80
MAAIF/D
FR
Meat X X X X X
8.93
8.69
8.16
7.08
9.91
42.77
MAAIF/D
AR

ASSP 2015/16 to 2019/20 Draft 19
ASSP IMPLEMENTATION MATRIX AND CONSTRAINED BUDGET IN LINE WITH THE NDP II
ASSP undertakings Y1 Y2 Y3 Y4 Y5
Year
1
Year
2
Year
3 Year 4 Year 5 Total
Lead
Implement
er
Provision of an Enabling Environment for the Meat X X X X X
0.50
0.50
0.50
0.50
0.70
2.70 MAAIF/D
AR
Animal Feeds, Forage and Water Security Enhancement X X X X X
0.80
0.80
0.80
0.80
1.12
4.32 MAAIF/D
AR
Animal Feeds Production and Quality Assurance Enhancement X X X X X
1.98
2.09
1.00
1.08
1.51
7.66 MAAIF/D
AR
National Beef Genetics Resource Development X X X X X
2.00
2.00
2.00
2.00
2.80
10.80 NAGRC&
DB
Goat Breed Improvement Schemes X X X X X
1.00
0.65
0.65
0.67
0.94
3.90 MAAIF/D
AR
Support Investments in the Poultry Sector X X X X X
1.00
1.00
1.00
0.41
0.57
3.98 MAAIF/D
AR
Kuroiler and Indigenous Chicken Resource Development X X X X X
0.55
0.55
1.11
0.53
0.74
3.47 MAAIF/D
AR
Develop the sericulture and silk production value chain X X X X X
0.50
0.50
0.50
0.50
0.70
2.70 MAAIF/D
AR
Support to Apiculture X X X X X
0.60
0.60
0.60
0.60
0.84
3.24 MAAIF/D
AR
Cocoa X X X X X
1.10
0.89
0.89
1.34
2.01
6.25 MAAIF
Cocoa Extension Services X X X X X
1.10
0.89
0.89
1.34
2.01
6.25 MAAIF
Cotton X X X X X
2.78
2.78
2.78
4.16
6.24
18.73 CDO
formation of farmers’ associations and capacity building X X X X X
0.78
0.78
0.78
1.16
1.74
5.23 CDO
reduction of cotton contamination X X X X X
2.00
2.00
2.00
3.00
4.50
13.50 CDO
Oil Seed X X X X X
1.70
1.79
1.82
2.86
3.61
11.79 MAAIF
enhance oilseed production and productivity X X X X X
1.48
1.52
1.58
2.12
2.77
9.46 MAAIF

ASSP 2015/16 to 2019/20 Draft 20
ASSP IMPLEMENTATION MATRIX AND CONSTRAINED BUDGET IN LINE WITH THE NDP II
ASSP undertakings Y1 Y2 Y3 Y4 Y5
Year
1
Year
2
Year
3 Year 4 Year 5 Total
Lead
Implement
er
institutional and enabling environment strengthening X X X X X
0.22
0.27
0.25
0.75
0.85
2.33 MAAIF
Oil Palm X X X X X
13.50
30.50
25.30
36.30
36.82
142.42 MAAIF
Land identification and acquisition X X X X X
10.00
20.00
15.00
25.00
25.00
95.00 MAAIF
Plantation establishment and development X X X X X
2.00
9.00
9.00
10.00
10.00
40.00 MAAIF
Reform and strengthen agricultural extension X X X X X
1.00
1.00
1.00
1.00
1.40
5.40 MAAIF
Strengthen the institutional capacity of MAAIF X X X X X
0.30
0.30
0.30
0.30
0.42
1.62 MAAIF
Strengthen the capacity for quality assurance, regulation and food
safety standards X X X X X
0.20
0.20
-
-
-
0.40 MAAIF
Strategy 5: Control Pests, Vectors and Diseases X X X X X
51.18
75.14
74.15
78.76
100.85
380.07 MAAIF
Control of pests and diseases for crops X X X X X
14.83
15.73
16.17
16.65
21.15
84.52
Crop pests and disease control regulatory strengthening X X X X X
1.50
1.50
1.50
1.50
1.50
7.50 MAAIF
Conduct early detection and control of crop pests, weeds and
diseases X X X X X
4.00
4.40
4.84
5.32
5.86
24.42 MAAIF
Crop pests and disease control infrastructure X X X X X
4.00
4.00
4.00
4.00
6.00
22.00 MAAIF
Banana bacterial wilt control X X X X X
0.40
0.90
0.90
0.90
0.90
4.00 MAAIF
Management of Coffee Diseases and Pests X X X X X
4.93
4.93
4.93
4.93
6.90
26.60
UCDA/MA
AIF
Control livestock diseases and vectors to ensure that
communicable diseases are managed in order to promote
animal health as a means to greater productivity and market
penetration. X X X X X
26.95
46.86
46.47
51.37
64.80
236.45 MAAIF
Uganda Tsetse and Trypanosomiasis Eradication X X X X X
2.00
5.07
5.30
12.99
15.00
40.36 MAAIF/C
OCTU

ASSP 2015/16 to 2019/20 Draft 21
ASSP IMPLEMENTATION MATRIX AND CONSTRAINED BUDGET IN LINE WITH THE NDP II
ASSP undertakings Y1 Y2 Y3 Y4 Y5
Year
1
Year
2
Year
3 Year 4 Year 5 Total
Lead
Implement
er
Eastern Uganda Regional Tsetse and Trypanosomiasis
Eradication X X X X X
2.00
5.00
5.00
5.00
7.00
24.00 MAAIF/C
OCTU
North Western Uganda Tsetse Project X X X X X
1.00
9.85
9.95
6.65
9.31
36.76 MAAIF/C
OCTU
Strengthening COCTU in Coordination, Policy and Planning X X X X X
0.09
0.06
0.15
0.05
0.07
0.41 COCTU
Control and Surveillance of Ticks X X X X X
2.21
1.78
1.17
1.10
1.53
7.79 MAAIF
Control of East Coast Fever (ECF) X X X X X
2.36
2.73
2.15
4.04
5.66
16.94 MAAIF
Control of Foot and Mouth Disease (FMD) X X X X X
10.00
15.00
15.00
15.00
20.00
75.00 MAAIF
Control of Rift Valley Fever X X X X X
1.19
1.33
1.11
0.92
0.83
5.38 MAAIF
Control of Rabies X X X X X
2.20
2.16
2.14
1.12
0.90
8.52 MAAIF
Control of African Swine Fever (ASF) X X X X X
3.00
3.00
3.00
3.00
3.00
15.00 MAAIF
Capacity Building for Animal Disease Surveillance and Control
Systems in Uganda X X X X X
0.30
0.30
0.50
0.50
0.50
2.10 MAAIF
Capacity Building for Enforcement of Veterinary Regulations in
Uganda X X X X X
0.30
0.30
0.50
0.50
0.50
2.10 MAAIF
Control of Human and Animal Brucellosis X X X X X
0.30
0.30
0.50
0.50
0.50
2.10 MAAIF
Creating an Enabling Policy and Regulatory Environment for
Livestock desease control X X X X X
2.81
2.26
1.62
1.66
1.73
10.08 MAAIF
Review three (3) outdated legislations X
0.60
0.20
0.20
0.20
0.20
1.40 MAAIF
Enact eight (8) Draft bills, X X
0.75
0.75
0.20
0.20
0.20
2.10 MAAIF
Formulate twelve (12) regulations X
0.12
0.12 MAAIF
Approve & print developed Standards X X
0.02
0.02
0.03 MAAIF

ASSP 2015/16 to 2019/20 Draft 22
ASSP IMPLEMENTATION MATRIX AND CONSTRAINED BUDGET IN LINE WITH THE NDP II
ASSP undertakings Y1 Y2 Y3 Y4 Y5
Year
1
Year
2
Year
3 Year 4 Year 5 Total
Lead
Implement
er
Review & approve three (3) policies X
0.15
0.15 MAAIF
Develop & disseminated 10 Strategies X X
0.10
0.04
0.14 MAAIF
Operationalise approved policies X X X X X
0.51
0.56
0.61
0.67
0.74
3.08 MAAIF
Equip & support established animal law enforcement Unit X X X X X
0.12
0.12
0.12
0.12
0.12
0.60 MAAIF
Equip & finance work of UVB X X X X X
0.54
0.44
0.44
0.44
0.44
2.31 MAAIF
Support continuous professional training X X X X X
0.03
0.03
0.03
0.03
0.03
0.15 MAAIF
Establishment of Disease Control infrastructure and
operationalization of effective disease control X X X X X
6.60
10.29
9.90
9.07
13.16
49.02 MAAIF
Rehabilitation or construction and equipping of 4 quarantine
stations, 14 holding grounds + 14 border posts X X X X X
2.23
2.23
2.23
2.23
4.00
12.94 MAAIF
Provision of proper transport and cold chain equipment for the
Veterinary Offices X X X X X
-
2.76
2.76
2.76
5.53
13.82 MAAIF
Development and implementation of prevention and control
strategy for major diseases X X X X X
0.17
0.17
0.17
0.17
0.17
0.86 MAAIF
Creation and implementation of individual animal (cattle) herd
and flock (goat and poultry) identification for traceability X X X X X
1.40
1.48
1.98
1.98
1.98
8.82 MAAIF
Renovate and equip the National Laboratory and establish 12
Regional Laboratory facilities X X X
0.82
0.82
0.82
2.47 MAAIF
Personnel and operational costs of the national and regional
laboratoris infrastructure X X X X X
1.37
1.37
1.37
1.37
1.37
6.84 MAAIF
Establish a national Animal Feed quality analysis laboratory-
Diary feeds X X X X X
0.60
1.45
0.56
0.56
0.12
3.28 MAAIF
Strategy 6: Other production and productivity enhancing
measures X X X X X
3.50
26.40
26.40
41.00
51.62
148.92 MAAIF

ASSP 2015/16 to 2019/20 Draft 23
ASSP IMPLEMENTATION MATRIX AND CONSTRAINED BUDGET IN LINE WITH THE NDP II
ASSP undertakings Y1 Y2 Y3 Y4 Y5
Year
1
Year
2
Year
3 Year 4 Year 5 Total
Lead
Implement
er
Sustainable Land Management/Promote adaptation of climate
change resilient agricultural production systems, technologies and
practices
X X X X X
1.70
5.00
5.00
7.00
9.00
27.70 MAAIF
Increase access to agricultural finance services by implementing
Agricultural commodity based Development Creditv facilities X X X X X
18.60
18.60
28.20
36.43
101.83 MAAIF
Promote commercialisation of agriculture particularly amongst
small holder farmers X X X X X
1.00
2.00
2.00
5.00
5.00
15.00 MAAIF
Promote time and labour saving technologies targeting women
farmers X X X X X
0.40
0.40
0.40
0.40
0.40
2.00 MAAIF
Strengthen linkages between farmers and production support
services (including financial services, capacity development and
marketing) in partnserhip with Ministry of Finance and other
stakeholders X X X X X
0.40
0.40
0.40
0.40
0.79
2.39
MAAIF
Outcome 2: Increase access to critical farm inputs: X X X X X
193.42
260.56
300.14
343.94
510.97
1,609.03
Strategy 1: Promote Agriculture mechanisation X X X X X
8.16
30.06
37.11
38.78
46.14
160.24
DAI &
WFP
Promoting acquisition and utilization of agricultural
mechanization technologies using a series of Public- Private-
Partnership (PPP)
x x x x x
3.40
19.14
26.00
28.00
34.00
110.54 DAI &
WFP
Promote sustainable local manufacture and maintenance of
suitable agricultural machinery for farm production and
postharvest processing
x x x x x
0.50
1.08
0.55
0.49
0.60
3.23 DAI &
WFP
Formulate and implement incentive frameworks for acquisition
and financing of labour saving technologies. x x x x x
0.50
0.61
0.55
0.39
0.35
2.40 DAI &
WFP
Promoting the strengthening of capacity for technical information
acquisition, equipment evaluation and sustainable operation of
agricultural machinery
x x x x x
0.50
0.66
0.38
0.36
0.34
2.24 DAI &
WFP

ASSP 2015/16 to 2019/20 Draft 24
ASSP IMPLEMENTATION MATRIX AND CONSTRAINED BUDGET IN LINE WITH THE NDP II
ASSP undertakings Y1 Y2 Y3 Y4 Y5
Year
1
Year
2
Year
3 Year 4 Year 5 Total
Lead
Implement
er
Establish an agricultural mechanization resource centre for
training machinery operators, generating technical information,
and provision of referral workshop services for testing/ evaluating
agricultural machinery.
x x x x x
1.00
3.89
4.74
4.69
6.00
20.32 DAI &
WFP
Strengthen the capacity of technical and vocational institutions for
training agricultural mechanics and technicians x x x x x
2.17
3.89
4.74
4.69
4.69
20.18 DAI &
WFP
Strengthen collaboration with the National Bureau of Standards to
eliminate importation and trade of substandard agricultural
mechanisation equipments
x x x x x
0.09
0.79
0.15
0.15
0.15
1.33 DAI &
WFP
Strategy 2: Improve access to high quality seeds, planting and
stocking materials X X X X X
171.75
179.05
180.15
182.70
201.60
915.26 MAAIF
Strengthening and rationalizing the Department of Regulation
and Certification’s seed services X X X X X
4.99
3.91
2.61
2.11
1.81
15.43 DCI & C
Improve phytosanitary control at entry points X X X X X
0.74
1.04
0.24
0.24
0.24
2.50 DCI & C
Strengthen Namelere laboratory X X X
0.80
0.50
-
0.30
-
1.60
NARO/DC
I & C
Transport to improve communication and service delivery X
0.44
-
-
-
-
0.44 DCI & C
Improve data and other information on the seed industry to
support better policy and program plans, both by government and
by the private sector
X X X X X
0.20
0.20
0.20
0.20
0.20
1.00 DCI & C
Promote seed quality insurance X X X X X
2.66
2.02
2.02
1.22
1.22
9.14 DCI & C
Achieve ISTA accreditation and maintain OECD Seed Schemes
accreditation X X X X X
0.10
0.10
0.10
0.10
0.10
0.50 DCI & C
Implement PVP X X X X X
0.05
0.05
0.05
0.05
0.05
0.25 DCI & C
Enhancing the capacity of the private seed industry to produce
pre-basic seed X X X X X
2.88
1.01
1.46
1.01
0.41
6.77 MAAIF

ASSP 2015/16 to 2019/20 Draft 25
ASSP IMPLEMENTATION MATRIX AND CONSTRAINED BUDGET IN LINE WITH THE NDP II
ASSP undertakings Y1 Y2 Y3 Y4 Y5
Year
1
Year
2
Year
3 Year 4 Year 5 Total
Lead
Implement
er
Strengthening capacity of NARI institutes involved in input
supply X X X X X
0.57
4.27
3.97
3.47
16.37
28.66 NARO
Enhance Breeder/foundation seed production and supply X X X X X
0.07
0.27
0.27
0.27
0.27
1.16 NARO
Strengthen/establish agribusiness incubation service centres X X X X X
0.50
4.00
3.70
3.20
16.10
27.50 NARO
Strengthen policies, laws and regulations for agricultural
inputs including seeds and planting materials supply and use X X X X X
2.00
4.35
3.60
5.10
10.00
25.05 MAAIF
Operationalise and implement PVP Act X
0.25
0.25 MAAIF
Establish a National Seed Sector Database X
0.50
0.50 MAAIF
Conduct regular market severance of input dealers (wholesale and
retails) X X X X X
2.00
3.60
3.60
5.10
10.00
24.30 MAAIF
Upscaling use of improved seeds and planting material
1.42
1.62
1.62
2.12
2.12
8.90 MAAIF
Extend the dealer network/Support to UNADA X X X X X
0.05
0.25
0.25
0.25
0.25
1.04 MAAIF
Improve farmer knowledge of new varieties X X X X X
1.03
1.03
1.03
1.03
1.03
5.16 MAAIF
Support to seed companies to test and promote new varieties and
cultivars X X X X X
0.34
0.34
0.34
0.84
0.84
2.70 MAAIF
Strengthen the national certification and regulation system to
guarantee the quality of seeds and other agro-inputs.
X X X X X
5.00
9.00
12.00
12.00
14.00
52.00 MAAIF
Increase availability and access to quality seeds, planting and
stocking materials
X X X X X
154.89
154.89
154.89
156.89
156.89
778.45 NAADS
Multiplication and distribution of clean planting materials of
Bananas X X X X X
3.30
3.30
3.30
3.30
3.30
16.50 NAADS
Beans Seed production, multiplication and distribution X X X X X
8.00
8.00
8.00
8.00
8.00
40.00 NAADS

ASSP 2015/16 to 2019/20 Draft 26
ASSP IMPLEMENTATION MATRIX AND CONSTRAINED BUDGET IN LINE WITH THE NDP II
ASSP undertakings Y1 Y2 Y3 Y4 Y5
Year
1
Year
2
Year
3 Year 4 Year 5 Total
Lead
Implement
er
Maize Seed production, multiplication and distribution X X X X X
14.00
14.00
14.00
14.00
14.00
70.00 NAADS
Rice Seed production, multiplication and distribution X X X X X
1.00
1.00
1.00
1.00
1.00
5.00 NAADS
production and distribution of clean planting material of improved
cassava varieties X X X X X
4.50
4.50
4.50
4.50
4.50
22.50 NAADS
Planting materials for Tea Area Expansion X X X X X
36.00
36.00
36.00
36.00
36.00
180.00 NAADS
Provision of high Yielding, diseases and pest resistant coffee
varieties to promote growing in new areas and expansion in
traditional coffee growing areas , and provision of agr-chemicals
X X X X X
20.00
20.00
20.00
20.00
20.00
100.00 UCDA
production and distribution of quality clean citrus seedlings X X X X X
14.50
14.50
14.50
16.50
16.50
76.50 NAADS
distribution of quality clean pineapple seedlings tolerant to pests
and diseases X X X X X
0.90
0.90
0.90
0.90
0.90
4.50 NAADS
production and distribution of quality clean apple seedlings
tolerant to pests and diseases X X X X X
2.00
2.00
2.00
2.00
2.00
10.00 NAADS
Provision of quality inputs for prodiction of mangoes X X X X X
7.50
7.50
7.50
7.50
7.50
37.50 NAADS
Provision of inputs for vegetables production X X X X X
0.60
0.60
0.60
0.60
0.60
3.00 NAADS
Provision of inputs for fisheries production X X X X X
2.30
2.30
2.30
2.30
2.30
11.50 NAADS
Provision of beef cattle X X X X X
0.90
0.90
0.90
0.90
0.90
4.50 NAADS
Provision of heifers - dairy cattle X X X X X
25.00
25.00
25.00
25.00
25.00
125.00 NAADS
Multiplication of pasture seed X X X X X
1.00
1.00
1.00
1.00
1.00
5.00 NAADS
Provision of improved goats X X X X X
2.00
2.00
2.00
2.00
2.00
10.00 NAADS
Cocoa seedlings provision X X X X X
3.10
3.10
3.10
3.10
3.10
15.50 NAADS

ASSP 2015/16 to 2019/20 Draft 27
ASSP IMPLEMENTATION MATRIX AND CONSTRAINED BUDGET IN LINE WITH THE NDP II
ASSP undertakings Y1 Y2 Y3 Y4 Y5
Year
1
Year
2
Year
3 Year 4 Year 5 Total
Lead
Implement
er
Cotton inputs support to farmers X X X X X
1.25
1.25
1.25
1.25
1.25
6.25 CDO
addressing challenges of access to critical farm inputs for oil palm X X X X X
1.30
1.30
1.30
1.30
1.30
6.50 MAAIF
Oil seed provision X X X X X
1.74
1.74
1.74
1.74
1.74
8.70
NAADS/M
AAIF
Provision of poultry units and piglets X X X X X
4.00
4.00
4.00
4.00
4.00
20.00 NAADS
Strategy 3: Increase access to water for agricultural
production (irrigation, water for livestock, aquaculture). X X X X X
6.10
40.30
68.42
83.70
157.61
356.13
DAI &
WFP
Strengthen the legal and institutional framework and capacity
for developing water for agricultural production X X X X X
1.00
1.00
1.00
1.00
1.00
5.00
DAI &
WFP
development of irrigation master plan, guidelines, action plans,
framework and principles for dissemination X
0.40
0.20
0.60
DAI &
WFP
preparation of guidelines for appraisal and design of small-scale
farmer-based irrigation schemes X
0.20
0.20
DAI &
WFP
development of appropriate mechanisms for cost sharing and
funding of water for agricultural production-based interventions X
0.20
0.20
DAI &
WFP
Development of guidelines for a Community Based Management
System (CBMS) for operation and maintenance of water for
agricultural production facilities and for WUAs X
0.10
0.10
DAI &
WFP
Institutionalize Water User Associations (WUAs), cooperative
societies and other farmer groups in regulation and management
of irrigated agriculture X
0.10
0.10
DAI &
WFP
establish technical support units to LGs in agricultural water
management (AWM) X X X X
0.30
0.50
0.50
0.50
1.80
DAI &
WFP
Promote the uptake and use of the adapted small scale irrigation
technologies/options X X X X
0.50
0.50
0.50
0.50
2.00
DAI &
WFP

ASSP 2015/16 to 2019/20 Draft 28
ASSP IMPLEMENTATION MATRIX AND CONSTRAINED BUDGET IN LINE WITH THE NDP II
ASSP undertakings Y1 Y2 Y3 Y4 Y5
Year
1
Year
2
Year
3 Year 4 Year 5 Total
Lead
Implement
er
Investing in modern irrigation technologies through
construction of large and promotion of small scale irrigation
technologies in line with the zoning strategy and development
of large and medium water reservoirs. X X X X X
4.30
33.30
59.38
72.70
134.00
303.68
DAI &
WFP
Evaluation and rehabilitation of nine (9) existing public irrigation
schemes of Atera, Kiige, Labori, Ongom, Olweny and Odina X X X X X
1.00
10.00
28.00
30.00
40.00
109.00
DAI &
WFP
Construction of Rhino Camp in Arua District, Labwor in Moroto
District,Katete in Kanungu District, Biiso in Bullisa
District,Pabbo in Amuru District , Namalu, Kibimba-
Gomba,Musamya, Torchi in Oyam District among others X X X X
3.00
15.00
28.88
28.50
63.50
138.88
DAI &
WFP
carrying out feasibility studies and design of 3 other irrigation
schemes covering an area of 6,900 ha-Acomai irrigation Scheme,
Atari Irrigation scheme and Namatala Irrigation Scheme X X X
5.80
5.80
DAI &
WFP
Establish 11,000 ha of commuinity-based/strategic medium to
large scale schemes at Naigomwa in Iganga District and Igogero
in Bugiri Disrtict X X
11.70
24.00
35.70
DAI &
WFP
Promotion of small scale irrigation technologies by establishing at
least a demonstration unit per district per year across the country X X X X X
0.20
1.00
1.00
1.00
3.00
6.20
DAI &
WFP
Adapt and make affordable small scale irrigation
technologies/options including garden hose, drip systems X X X X X
0.10
1.50
1.50
1.50
3.50
8.10
DAI &
WFP
Promote rainwater harvesting and storage at household and
farm levels for agriculture. X X X X X
0.80
6.00
8.04
10.00
22.61
47.45
DAI &
WFP
Rehabilitation/expansion of 102 public Valley dams X X X X X
0.10
1.00
1.00
1.00
2.00
5.10
DAI &
WFP
Rehabilitation/expansion of 195 valley tanks X X X X X
0.10
0.80
0.74
0.80
0.80
3.24
DAI &
WFP

ASSP 2015/16 to 2019/20 Draft 29
ASSP IMPLEMENTATION MATRIX AND CONSTRAINED BUDGET IN LINE WITH THE NDP II
ASSP undertakings Y1 Y2 Y3 Y4 Y5
Year
1
Year
2
Year
3 Year 4 Year 5 Total
Lead
Implement
er
Construction of 1,200 new valley tanks X X X X X
0.50
2.00
4.00
4.20
12.00
22.70
DAI &
WFP
Establish 4 commercial aquaculture sites of minimum 10 ponds X X X
0.60
1.20
2.40
4.20
DAI &
WFP
Establishing of two (2) well-planned Aquaculture Parks (APs) in
Mpologoma catchment and Olweny catchment X
1.70
1.70
3.40
DAI &
WFP
Establish four three (3) fish farms each with four (4) ponds in the
districts of Mbarara, Gulu and Sironko X X X
1.20
1.20
1.80
4.20
DAI &
WFP
Development of two (2) landing sites in Kaliro and Amolatar
districts X X
1.00
1.31
2.31
DAI &
WFP
Develop and Promote Rainwater harvesting technologies and Best
Practices for smallholder farmers X X X X X
0.10
0.50
0.50
0.60
0.60
2.30
DAI &
WFP
Strategy 4: Enhance access and use of fertilizers by all
categories of farmers. X X X X X
7.42
11.15
14.45
38.75
105.62
177.40 MAAIF
Create an enabling environment for fertilizer production,
importation and distribution X X X X X
1.24
3.93
5.13
5.96
0.33
16.59 MAAIF
Support to the Fertilizer Market Development Council (FMDC) X X X X X
0.84
0.33
0.33
0.33
0.33
2.17 MAAIF
review of the national fertilizer policy and implementing
regulations X X X X X
0.40
0.30
-
-
-
0.70 MAAIF
Credit support for Bulk Purchase and Risk Management Fund X X X X
-
3.30
4.80
5.63
0.00
13.73 MAAIF
Strengthen soil fertility knowledge management and
awareness creation X X X X X
1.10
1.18
1.16
1.09
0.96
5.50 MAAIF
update soil fertility management and fertilizer use
recommendations X X X X X
0.14
0.33
0.31
0.24
0.05
1.07 MAAIF
develop soil fertility management and fertilizer use extension
materials X X X X X
0.12
0.01
0.01
0.01
0.08
0.23 MAAIF
increase number of agro-dealers trained about fertilizer and with
enhanced business skills X X X X X
0.30
0.30
0.30
0.30
0.30
1.52 MAAIF

ASSP 2015/16 to 2019/20 Draft 30
ASSP IMPLEMENTATION MATRIX AND CONSTRAINED BUDGET IN LINE WITH THE NDP II
ASSP undertakings Y1 Y2 Y3 Y4 Y5
Year
1
Year
2
Year
3 Year 4 Year 5 Total
Lead
Implement
er
Increase number of Technology Transfer Agents (TTAs) with
fertilizer knowledge and matching inputs X X X X X
0.14
0.14
0.14
0.14
0.14
0.68 MAAIF
Increase number of farmers with fertilizer knowledge and
matching inputs X X X X X
0.40
0.40
0.40
0.40
0.40
2.00 MAAIF
Capacity Building and Physical Infrastructure for Fertilizers
1.93
2.89
5.02
28.56
101.18
139.56 MAAIF
Crop Production Risk Management X X X X X
0.05
0.44
0.86
1.10
0.32
2.77 MAAIF
Capacity Building Project X X X X X
1.88
2.45
4.16
2.46
5.86
16.79 MAAIF
Support Physical Infrastructure Project X X X X X
-
-
-
5.00
15.00
20.00 MAAIF
Development of Domestic Resources for Soil Productivity
Enhancement X X X X X
-
-
-
20.00
80.00
100.00 MAAIF
Provision of fertiliser inputs to farmers X X X X X
3.15
3.15
3.15
3.15
3.15
15.75 NAADS
Outcome 3: Improve agricultural markets and value addition
for the 12 prioritised commodities X X X X X
25.43
81.89
115.70
183.74
207.60
614.35 MAAIF
Strategy 1: Promote private sector investment in value
addition of the 12 prioritised commodities through PPP X X X X X
1.00
5.00
10.00
15.00
15.00
46.00 MAAIF
Strategy 2:Build capacities of farmers, trades and processors
in quality standards and market requirements of the 12
priority commodities X X X X X
20.23
39.89
65.70
83.74
107.60
317.15 MAAIF
Strengthen higher level farmer organization for collactive
marketing, bulking, quality and standards improvement X X X X X
2.00
3.00
4.00
5.20
7.12
21.32 MAAIF
Promote appropriate technologies and practices for
minimizing post harvest losses along the entire commodity
value chain. X X X X X
2.10
8.00
11.80
14.76
19.94
56.60
MAAIF/NA
RO

ASSP 2015/16 to 2019/20 Draft 31
ASSP IMPLEMENTATION MATRIX AND CONSTRAINED BUDGET IN LINE WITH THE NDP II
ASSP undertakings Y1 Y2 Y3 Y4 Y5
Year
1
Year
2
Year
3 Year 4 Year 5 Total
Lead
Implement
er
Develop and adapt appropriate technologies and practices for
postharvest handling along the value chain of all priority
commodities
X X X X X
0.40
2.40
2.80
2.80
3.20
11.60
MAAIF/NA
RO
Build Capacity of Value chain actors on best post harvest
handling practices for each priority commodity X X X X X
0.30
1.00
4.00
6.00
6.00
17.30
MAAIF/NA
RO
Provide farmers/ groups assorted SME processing
demo/equipment X X X X X
1.00
1.00
1.40
1.96
2.74
8.10
MAAIF/NA
RO
Develop and improve food handling, marketing and distribution
systems and linkages to local and export markets. X X X X X
0.40
3.60
3.60
4.00
8.00
19.60
MAAIF/NA
RO
Promote Commodity/farm based storage and agro processing,
as a means to increasing access to domestic and regional
market, through demonstrations and PPPs.
X X X X X
3.80
8.85
9.68
9.30
9.30
40.93 MAAIF
Innovate and adapt affordable on-farm storage solutions for the
priority and strategic commodities X X X X X
0.50
0.80
0.80
0.80
0.80
3.70 MAAIF
Facilitate private sector uptake, development, marketing and
distribution of on farm storage solutions to smallholder farmers
including developing a cost effective sales distribution system
X X X X X
0.30
1.05
1.88
1.50
1.50
6.23 MAAIF
Enhance efficiency (higher output at reduced cost) at all value
chain nodes through trainings and demonstration sites of
appropriate improved TIMPS
X X X X X
0.50
2.00
2.00
2.00
2.00
8.50 MAAIF
Product development to meet end-user market requirements e.g.
quality& safety standards, traceability, packaging, certification
for niche markets, bar coding for supermarket outlets, etc
X X X X X
1.00
2.00
2.00
2.00
2.00
9.00 MAAIF
Knowledge and skills development to enhance capacity for
engaging in high quality export markets e.g. for horticulture X X X X X
0.50
1.00
1.00
1.00
1.00
4.50 MAAIF

ASSP 2015/16 to 2019/20 Draft 32
ASSP IMPLEMENTATION MATRIX AND CONSTRAINED BUDGET IN LINE WITH THE NDP II
ASSP undertakings Y1 Y2 Y3 Y4 Y5
Year
1
Year
2
Year
3 Year 4 Year 5 Total
Lead
Implement
er
Promote cottage processing industries through incubation of new
processing technologies for both food and non-food products X X X X X
1.00
2.00
2.00
2.00
2.00
9.00 MAAIF
Marketing and value addition for specific priority and
strategic commodities
X X X X X
12.33
20.04
40.22
54.48
71.23
198.30 MAAIF
Developing National and Regional Markets for Ugandan bananas
and banana processed products X X X X X
1.00
1.25
2.25
2.25
2.25
9.00 MAAIF
Beans Marketing X X X X X
1.00
1.00
2.00
2.00
2.00
8.00 MAAIF
Maize Marketing and value addition X X X X X
1.00
2.60
4.00
6.00
6.00
19.60 MAAIF
Rice Marketing and value addition X X X X X
1.00
1.00
2.00
2.00
1.72
7.72 MAAIF
Cocoa marketing and Value addition support X X X X X
1.45
1.53
1.59
1.66
1.72
7.95
support cassava farmers and SMEs to engage in profitable
processing and marketing of quality cassava flour and chips as an
agribusiness enterprise
X X X X X
1.00
1.50
3.00
3.00
4.70
13.20 MAAIF
Establishment of new Tea Processing Facilitiesfor value addition X X X X X
-
2.00
3.00
3.00
8.40
16.40 MAAIF
Tea Marketing X X X X X
0.18
0.18
0.18
0.18
0.18
0.88 MAAIF
Coffee value addition and Generic Promotion X X X X X
1.00
1.00
1.23
0.46
0.46
4.15 UCDA
Support marketing of adequate quantities of fresh citrus fruits,
pineaples and apples for local and regional markets X X X X X
0.90
1.00
3.00
5.00
3.10
13.00 MAAIF
support fruit processors to engage in the product development of
fresh juice from green citrus fruits as a product for local market X X X X X
0.50
0.50
0.50
2.50
2.50
6.50 MAAIF
Promoting local consumption and export of milk and dairy
products. X X X X X
0.98
0.98
0.98
0.93
0.91
4.80 DDA

ASSP 2015/16 to 2019/20 Draft 33
ASSP IMPLEMENTATION MATRIX AND CONSTRAINED BUDGET IN LINE WITH THE NDP II
ASSP undertakings Y1 Y2 Y3 Y4 Y5
Year
1
Year
2
Year
3 Year 4 Year 5 Total
Lead
Implement
er
Rehabilitate existing and develop new milk cold chain and
processing infrastructure X X X X X
0.32
1.00
3.00
3.00
0.86
8.18 DDA
Development of Meat Marketing Infrastructure X X X
-
2.00
9.40
17.40
30.70
59.50 MAAIF
promotion of domestic value addition to lint X X X X X
0.50
0.80
2.00
3.00
3.62
9.92 CDO
Facilitate domestic, regional and international trade in Vegetable
Oil Products X X X X X
0.80
0.80
0.80
0.80
0.80
4.00 MAAIF
Strengthen producer-buyer/aggregator contractual relationships
for the strategic/priority commodities X X X X X
0.30
0.30
0.30
0.30
0.30
1.50 MAAIF
Identify and strengthen producer groups adding value to
agricultural commodities through training and exposure to
technologies befitting their activities.
X X X X X
0.20
0.30
0.50
0.50
0.50
2.00
MAAIF
Promote structured trading systems by linking organized
collective marketing farmer groups to large buyers and storage
handlers/warehouse operators
X X X X X
0.20
0.30
0.50
0.50
0.50
2.00 MAAIF
Strategy 3: Operationalize the commercialisation fund X X X X X
3.00
7.00
10.00
10.00
10.00
40.00 NAADS
Strategy 4: Ensure the development, maintenance and
improvement of physical agricultural marketing
infrastructure
X X X X X
1.20
30.00
30.00
75.00
75.00
211.20 MAAIF
Cold Chain storage Infrastructure X X X X X
0.40
10.00
10.00
25.00
25.00
70.40 MAAIF
Physical agricultultural commodity markets X X X X X
0.40
10.00
10.00
25.00
25.00
70.40 MAAIF
Community based grain storage facilities X X X X X
0.40
10.00
10.00
25.00
25.00
70.40 MAAIF
Outcome 4: Institutional and enabling environment
strengthening X X X X X
28.49
48.82
65.89
79.69
117.88
340.78 MAAIF

ASSP 2015/16 to 2019/20 Draft 34
ASSP IMPLEMENTATION MATRIX AND CONSTRAINED BUDGET IN LINE WITH THE NDP II
ASSP undertakings Y1 Y2 Y3 Y4 Y5
Year
1
Year
2
Year
3 Year 4 Year 5 Total
Lead
Implement
er
Strategy 1: Strengthen institutional capacity of MAAIF and
public agricultural agencies X X X X X
17.09
32.42
44.39
53.47
80.48
227.86 MAAIF
Institutional Strengthening and Capacity Building X X X X X
6.30
13.00
22.90
31.00
57.30
130.50 MAAIF
Construction of MAAIF headquaters Building in Kampala X X X
1.00
1.00
10.00
17.00
43.30
72.30 MAAIF
Construction of administrative infrastructure for selected district
production departments X X X X X
0.40
6.00
6.00
6.00
6.00
24.40 MAAIF
Human Resource Development-Training/capacity building X X X X X
1.00
2.00
2.00
3.00
3.00
11.00 MAAIF
Strengthening Institutional Linkages and Networking Capacity X X X X X
1.00
1.00
1.00
1.00
1.00
5.00 MAAIF
improving access to working facilities, tools and equipment for
MAAIF, its Agencies and local governments. X X X X X
2.90
3.00
3.90
4.00
4.00
17.80 MAAIF
transform ATIs (Bukalasa College and Fisheries Training
Institute), into institutions that are responsive to knowledge
and skill market in the extension service.
X X X X X
1.00
3.90
4.40
4.40
4.10
17.80
Bukalasa
College
and
Fisheries
Training
Institute
Bukalasa Agricultural College
X X X X X
0.50
1.95
2.20
2.20
2.05
8.90
Bukalasa
College
Curriculum review
X X X X X
0.05
0.05
0.20
0.20
0.05
0.55
Bukalasa
College
Human resources strengthening
X X X X X
0.10
0.30
0.50
0.50
0.50
1.90
Bukalasa
College

ASSP 2015/16 to 2019/20 Draft 35
ASSP IMPLEMENTATION MATRIX AND CONSTRAINED BUDGET IN LINE WITH THE NDP II
ASSP undertakings Y1 Y2 Y3 Y4 Y5
Year
1
Year
2
Year
3 Year 4 Year 5 Total
Lead
Implement
er
Infrastructural rehabilitation/development
X X X X X
0.25
1.50
1.50
1.50
1.50
6.25
Bukalasa
College
Restructuring and Operationalization
X X
0.10
0.10
-
-
-
0.20
Bukalasa
College
Fisheries Training Institute
X X X X X
0.50
1.95
2.20
2.20
2.05
8.90
Fisheries
Training
Institute
Curriculum review
X X X X X
0.05
0.05
0.20
0.20
0.05
0.55
Fisheries
Training
Institute
Human resources strengthening
X X X X X
0.10
0.30
0.50
0.50
0.50
1.90
Fisheries
Training
Institute
Infrastructural rehabilitation/development
X X X X X
0.25
1.50
1.50
1.50
1.50
6.25
Fisheries
Training
Institute
Restructuring and Operationalization
X X
0.10
0.10
-
-
-
0.20
Fisheries
Training
Institute
Support to the National Farmers’ Leadership Centre
(NFLC) 0.8 1 1.12 1.5 1.5 5.92 NFLC
Infrastructure Development and Rehabilitation X X X X X 0.5 0.5 0.5 0.6 0.5 2.6 NFLC
Equipment and Tooling X X X X X 0.2 0.3 0.32 0.4 0.5 1.72 NFLC
Training, Administration and Services X X X X X 0.1 0.2 0.3 0.5 0.5 1.6 NFLC
Supportv to District Agriculture Training and Information
Centres (DATICS) X X X X X
0.42
4.42
5.00
5.00
5.00
19.84 MAAIF

ASSP 2015/16 to 2019/20 Draft 36
ASSP IMPLEMENTATION MATRIX AND CONSTRAINED BUDGET IN LINE WITH THE NDP II
ASSP undertakings Y1 Y2 Y3 Y4 Y5
Year
1
Year
2
Year
3 Year 4 Year 5 Total
Lead
Implement
er
Review and development of curriculum X X X X X
0.42
0.42
1.00
1.00
1.00
3.84 MAAIF
Infrastructure Development X X X X X -
4.00
4.00
4.00
4.00
16.00 MAAIF
Support to Agriculture Sector Policy and Planning
2.50
3.00
3.00
3.00
3.00
14.50
MAAIF/AP
D
Capacity building for MAAIF staff in Policy and Planning X X X X X
0.40
0.60
0.60
0.60
0.60
2.80
MAAIF/AP
D
Production of bankable project proposals to support ASSP
implementation X X X X X
0.30
0.40
0.40
0.40
0.40
1.90
MAAIF/AP
D
Undertake budget execution assessment exercises X X X X X
1.00
1.10
1.10
1.10
1.10
5.40
MAAIF/AP
D
Link ASSP implementation with regional agriculture policy
undertakings (EAC, COMESA, CADAP, etc) X X X X X
0.30
0.40
0.40
0.40
0.40
1.90
MAAIF/AP
D
Cordinate production of Agricultural Sector mandatory
policy/planning/budget papers X X X X X
0.50
0.50
0.50
0.50
0.50
2.50
MAAIF/AP
D
Come up with an efficient Food Agricultural Statistics (FAS)
system to provide statistics that underpin major government
policy initiatives and poverty eradication X X X X X
2.41
3.18
4.08
4.37
5.39
19.43
MAAIF/Sta
tistics
Division
Strengthening the Coordination and Management of agriculture
sector statistical system X X X X X
0.30
0.50
0.60
0.70
0.90
3.00
MAAIF/Sta
tistics
Division
Improve usability and dissemination of agriculture statistics
X X X X X
0.36
0.32
0.16
0.16
0.28
1.28
MAAIF/Sta
tistics
Division
Mainstreaming Quality Assurance in Agriculture statistical
production X X X X X
0.37
-
0.11
0.26
0.10
0.84
MAAIF/Sta
tistics
Division

ASSP 2015/16 to 2019/20 Draft 37
ASSP IMPLEMENTATION MATRIX AND CONSTRAINED BUDGET IN LINE WITH THE NDP II
ASSP undertakings Y1 Y2 Y3 Y4 Y5
Year
1
Year
2
Year
3 Year 4 Year 5 Total
Lead
Implement
er
Strengthening Human Resource and Management
X X X X X
0.38
0.36
0.21
0.24
0.11
1.31
MAAIF/Sta
tistics
Division
Strengthening production and Management of Agriculture
statistics X X X X X
1.00
2.00
3.00
3.00
4.00
13.00
MAAIF/Sta
tistics
Division
Strengthening and improve the Sector M&E systems X X X X X
3.11
3.00
3.02
3.61
3.63
16.37
MAAIF/AP
D
Production of quality monitoring and evaluation data and
information on ASSP implementation X X X X X
2.28
1.87
2.42
3.00
3.00
12.57
MAAIF/AP
D
Strengthening Institutional and Organizational Capacity for M&E X X X X X
0.83
1.13
0.60
0.61
0.63
3.80
MAAIF/AP
D
Implementing the Agricultural Sector Communication
Strategy (ASCS)
X X X X X
0.56
0.92
0.87
0.60
0.56
3.50
MAAIF/Co
mm. &
Info
division(C
&ID)
Establishing a national agricultural information and
communication system X X X X X
0.08
0.06
0.04
0.04
0.08
0.30
MAAIF/C
&ID
Strengthening the ASCS framework X X X X X
0.19
0.39
0.40
0.19
0.18
1.34
MAAIF/C
&ID
Create an effective and efficient platform for information and
knowledge management X X X X X
0.02
0.09
0.07
0.06
0.04
0.28
MAAIF/C
&ID
Creating an enabling environment for communication X X X X X
0.10
0.13
0.16
0.16
0.11
0.66
MAAIF/C
&ID
Support Innovation in Agro-Communication across the Agro-
Value-Chain X X X X X
0.17
0.25
0.20
0.15
0.15
0.92
MAAIF/C
&ID
Strategy 2: Improve the capacity for quality assurance,
regulation, food and safety standards for outputs and products
across crops, livestock and fisheries sub-sectors. X X X X X
5.20
6.90
8.50
14.32
20.10
55.02 MAAIF

ASSP 2015/16 to 2019/20 Draft 38
ASSP IMPLEMENTATION MATRIX AND CONSTRAINED BUDGET IN LINE WITH THE NDP II
ASSP undertakings Y1 Y2 Y3 Y4 Y5
Year
1
Year
2
Year
3 Year 4 Year 5 Total
Lead
Implement
er
Enact new laws and or review existing laws, regulations and
policies to be consistent with changes in technology, regional
integration commitments and other global/regional commitments
in the crops, livestock and fisheries sub-sectors. X X X X X
0.20
0.20
0.20
0.20
0.20
1.00 MAAIF
Undertake market surveillance and strengthen enforce capacity of
all existing laws, regulations, standards and guidelines along the
entire value chain. X X X X X
2.00
2.00
3.00
4.00
6.00
17.00 MAAIF
Create awareness among farmers, traders, processors and agro
exporters about quality standards and market requirements X X X X X
1.00
2.00
2.00
4.00
6.00
15.00 MAAIF
Train food inspectors in legislation, policy, modern inspection
systems and quality management systems X X X X X
1.00
1.70
2.30
3.12
4.00
12.12 MAAIF
Strengthen national capacity for quality assurance, regulation and
safety standards to promote increased trade at all levels. X X X X X
1.00
1.00
1.00
3.00
3.90
9.90 MAAIF
Strategy 3: Mainstream Cross-cutting Issues of Gender,
Youth, HIV/AIDS, Environment and Climate Change, food
and nutritional security
X X X X X
6.20
9.50
13.00
11.90
17.30
57.90
promote the use of gender analysis and gender-based budgeting in
all community-based development programmes X X X X X
1.10
1.10
1.60
1.60
1.60
7.00
MAAIF/AP
D
Mainstream promotion of youth engagement in Agriculture in all
sector programmes X X X X X
1.00
1.00
1.00
1.00
1.00
5.00
MAAIF
Mainstream adaptation of agricultural technologies and practices
to climate change in all sector programmes-SLM X X X X X
1.50
2.00
5.00
3.90
5.30
17.70
MAAIF
Implement HIV/AIDS policies and strategies- in the Agriculture
Sector including local governments and farming communities X X X X X
1.00
1.00
1.00
1.00
1.00
5.00
MAAIF
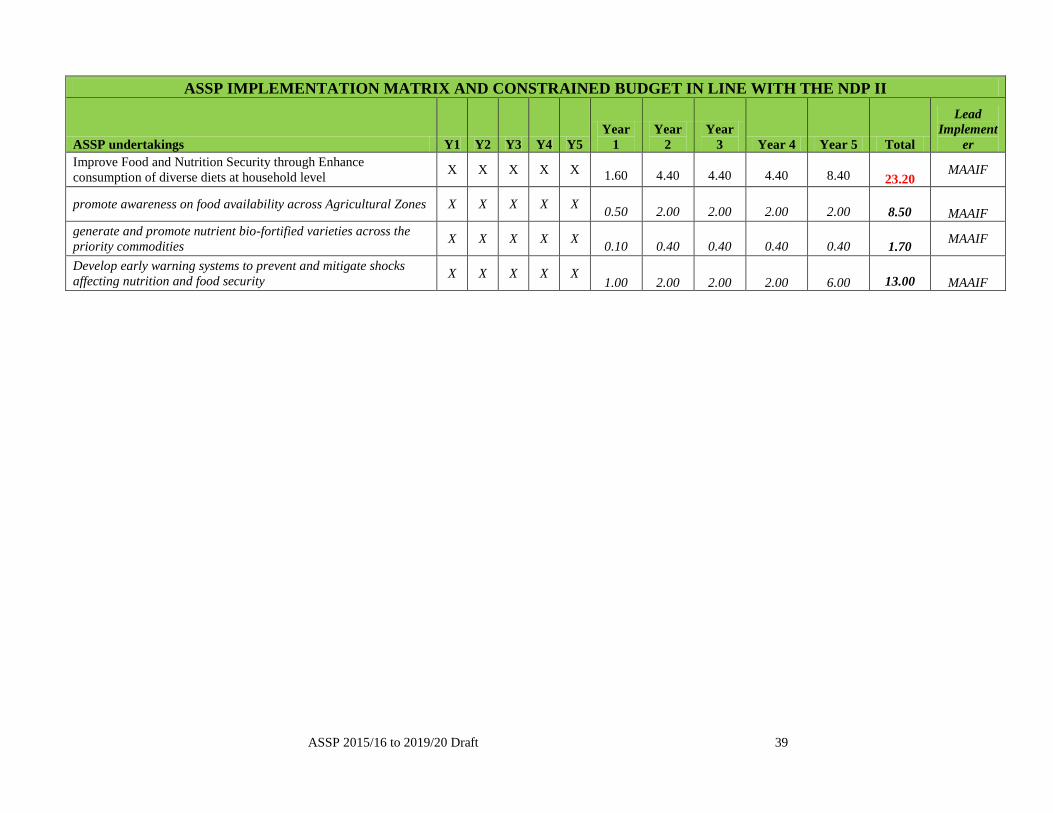
ASSP 2015/16 to 2019/20 Draft 39
ASSP IMPLEMENTATION MATRIX AND CONSTRAINED BUDGET IN LINE WITH THE NDP II
ASSP undertakings Y1 Y2 Y3 Y4 Y5
Year
1
Year
2
Year
3 Year 4 Year 5 Total
Lead
Implement
er
Improve Food and Nutrition Security through Enhance
consumption of diverse diets at household level X X X X X
1.60
4.40
4.40
4.40
8.40
23.20 MAAIF
promote awareness on food availability across Agricultural Zones X X X X X
0.50
2.00
2.00
2.00
2.00
8.50 MAAIF
generate and promote nutrient bio-fortified varieties across the
priority commodities X X X X X
0.10
0.40
0.40
0.40
0.40
1.70 MAAIF
Develop early warning systems to prevent and mitigate shocks
affecting nutrition and food security X X X X X
1.00
2.00
2.00
2.00
6.00
13.00 MAAIF

ASSP 2015/16 to 2019/20 Draft 40
Annex E: Indicative ideal budget (UGX Billions)
ASSP IDEAL BUDGET
ASSP undertakings Y1 Y2 Y3 Y4 Y5 Year 1 Year 2 Year 3 Year 4 Year 5 Total Lead
Implementer
Total budget
488.85
1,284.23
1,479.89
1,693.09
2,022.89
6,968.96
Outcome 1: Increase agricultural production and productivity X X X X X
239.01
496.56
560.26
653.99
757.47
2,707.29
Strategy 1: Strengthening ecologically sound
agricultural research and climate change
resilient technologies and practices X X X X X
75.47
106.62
112.17
119.73
131.47
545.46 NARO
Agricultural technologies, innovations and management practices (TIMPS) generation X X X X X
34.06
34.80
35.60
36.40
37.60
178.46 NARO
Breeding of climate smart – nutrient enriched
farmer preferred varieties and breeds X X X X X
4.49
4.54
4.66
4.77
4.94
23.40 NARO
Develop improved higher yielding crop
varieties and livestock breeds X X X X X
4.71
4.85
4.98
5.13
5.34
25.01 NARO
Nutrient fortified and transgenic crops
(Bananas, Maize, Irish potatoes) X X X X X
4.14
4.23
4.33
4.42
4.55
21.68 NARO
Characterizing plant and animal disease strains
and agents X X X X X
3.57
3.62
3.64
3.71
3.79
18.33 NARO
Develop and release disease, pest and drought
resistant varieties/breeds X X X X X
4.71
4.85
4.98
5.13
5.34
25.01 NARO
Develop non-conventional animal feed X X X X X
4.14
4.23
4.33
4.42
4.55
21.68 NARO
Conduct on-station and multi-location
evaluation of generated lines X X X X X
4.14
4.23
4.33
4.42
4.55
21.68 NARO
On-farm trials and national variety evaluation
trials for VCU and DUS X X X X X
4.14
4.23
4.33
4.42
4.55
21.68 NARO
Strengthening the functioning of the National
Agricultural Research System (NARS) by
identifying and building key human resource
capacity to support the sector X X X X X
3.36
9.00
10.00
10.20
10.60
43.16 NARO
Conduct an HR capacity needs assessment X
0.50
0.50 NARO

ASSP 2015/16 to 2019/20 Draft 41
ASSP IDEAL BUDGET
ASSP undertakings Y1 Y2 Y3 Y4 Y5 Year 1 Year 2 Year 3 Year 4 Year 5 Total Lead
Implementer
Develop and implement a staff recruitment and
retention strategy X
0.25
0.25
0.50 NARO
Develop and implement a mentoring
programme for junior scientists X X X X X
1.00
1.00
1.00
1.00
1.00
5.00 NARO
Conduct short and long term training on
Adaptive Research for staff X X X X X
1.41
3.00
4.00
4.20
4.35
16.96 NARO
Establish an effective staff performance
appraisal system X
0.20
0.20 NARO
Support to NARO scientists X X X X
5.00
5.00
5.00
5.00
20.00
Develop and implement a policy and
regulatory framework for biotechnology in
agriculture. X X X X X
0.40
0.90
0.90
0.90
0.90
4.00 NARO
Fast tracking the laws and standards of GMOs
production and utilization X X X X X
0.20
0.40
0.40
0.40
0.40
1.80 NARO
develop and enhance capacity for implementing
research guidelines and procedures on
biotechnology use and biosafety X X X X X
0.20
0.50
0.50
0.50
0.50
2.20 NARO
Develop and promote technologies
and protocols for value addition in
agriculture and agro processing X X X X X
9.80
14.20
14.40
14.43
14.64
67.47 NARO Conducting product development and end user
marketability tests to enhance utilization
options for a range of strategic and priority
commodities X X X X X
3.60
3.60
3.60
3.85
3.80
18.44 NARO Developing and validating technologies and
protocols for agro-processing including
protocols for enhancing shelf life,uniform
ripening, stability X X X X X
3.00
3.00
3.00
3.00
3.00
15.00 NARO
Testing and ascertain thresholds on a range of
parameters for food safety and quality
assurance and validate capacity for compliance X X X X X
1.80
1.80
1.80
1.58
1.84
8.83 NARO

ASSP 2015/16 to 2019/20 Draft 42
ASSP IDEAL BUDGET
ASSP undertakings Y1 Y2 Y3 Y4 Y5 Year 1 Year 2 Year 3 Year 4 Year 5 Total Lead
Implementer
Development of processing/packaging tools and
equipment X X X X X
1.40
5.80
6.00
6.00
6.00
25.20 NARO
Up-scaling uptake of existing and new
appropriate technologies, innovations and
management practices (TIMPS).
X X X X X
9.03
14.00
17.55
23.66
33.12
97.37
DAES/NARO
Technology promotion (production and agro-
processing) and farmer access to information/
knowledge
X X X X X
5.46
9.00
11.05
15.21
21.29
62.01 DAES/NARO
Technology uptake grants for farmers, farmer
groups and agro-processors X X X X X
3.57
5.00
6.50
8.45
11.83
35.35 DAES
Accelerate Research and Technology
Development of the selected priority/
strategic commodities
X X X X X
18.81
33.72
33.72
34.14
34.60
155.00 NARO
Banana research and technology development X X X X X
2.00
2.35
2.35
2.35
2.35
11.40 NARO
Beans Research and technology development X X X X X
1.65
2.15
2.15
2.15
2.21
10.31 NARO
Fruits Research support programme X X X X X
1.00
2.50
2.50
2.50
2.50
11.00 NARO
Maize Research Programme X X X X X
3.00
2.36
2.36
2.32
2.44
12.47 NARO
Cassava Research Programme X X X X X
1.70
4.00
4.00
4.00
4.00
17.70 NARO
Rice Research Programme X X X X X
1.00
2.37
2.37
2.37
2.51
10.62 NARO
Oil seed Research Programme X X X X X
1.00
2.59
2.59
2.59
2.82
11.58 NARO
Tea Research X X X X X
1.00
2.86
2.86
3.34
3.37
13.44 NARO
Improvement of Coffee Research Systems X X X X X
1.00
5.18
5.18
5.18
5.06
21.59 NARO
Strengthening cocoa research and technology
development X X X X X
1.96
2.20
2.20
2.20
2.20
10.78 NARO

ASSP 2015/16 to 2019/20 Draft 43
ASSP IDEAL BUDGET
ASSP undertakings Y1 Y2 Y3 Y4 Y5 Year 1 Year 2 Year 3 Year 4 Year 5 Total Lead
Implementer
Strengthening cotton production research X X X X X
1.00
2.17
2.17
2.14
2.14
9.62 NARO
Oil Palm research and technology development X X X X X
2.50
3.00
3.00
3.00
3.00
14.50 NARO
Strategy 2: Implement a Single Spine
Agricultural Extension system while
promoting gendered innovation in
agricultural research centres and extension
services. X X X X X
31.42
101.00
166.00
195.00
228.80
722.22 DAES
Wage costs of extension staff X X X X X
16.28
50.00
60.00
79.00
112.00
317.28 LG
Non-wage/operational costs at districtlevel X X X X X
14.14
45.00
100.00
110.00
110.00
379.14 LG
Farmer education and refresher trainings of
extension staff X X X X X
2.00
2.00
2.00
2.00
8.00 DAES
Institutional strengthening of extension systems
- Policy X X X X X
-
0.50
0.50
0.50
0.50
2.00 DAES support to extension information systems and
ICT
-
1.50
1.50
1.50
1.50
6.00 DAES
Reform and strengthen agricultural
extension(oil palm) X X X X X
1.00
1.00
1.00
1.00
1.40
5.40 MAAIF
Promote strategic partnerships between
research and technology development and
extension services at all levels
X X X X X
1.00
1.00
1.00
1.40
4.40 DAES
Strategy 3: Strengthen Farmer Group
formation and cohesion including commodity
associations, platforms, federations and co-
operatives
X X X X X
1.00
11.50
11.50
13.50
15.90
53.40 MAAIF
farmer institutional strenthening
-
2.50
2.50
2.50
2.50
10.00 MAAIF
Support to harmonize the farmers by UNFFE X X X X X
-
5.00
5.00
5.00
5.00
20.00 NAADS

ASSP 2015/16 to 2019/20 Draft 44
ASSP IDEAL BUDGET
ASSP undertakings Y1 Y2 Y3 Y4 Y5 Year 1 Year 2 Year 3 Year 4 Year 5 Total Lead
Implementer
agribusiness support services X X X X X
1.00
4.00
4.00
6.00
8.40
23.40
DAI & ED /
NAADS
Strategy 4: Accelerate the development and
commercialisation of the prioritised
agricultural commodities
X X X X X
67.61
136.53
131.82
166.79
188.58
691.33 MAAIF
Banana X X X X X
3.80
4.15
4.15
4.65
5.25
22.00
Increasing Banana Production and
Productivity(fertilizer promotion) X X X X X
0.80
1.15
1.15
1.65
2.25
7.00 MAAIF
Banana Extension Support
3.00
3.00
3.00
3.00
3.00
15.00 MAAIF
Beans X X X X X
1.00
1.00
2.00
2.00
2.00
8.00
Beans Extension
1.00
1.00
2.00
2.00
2.00
8.00
Maize X X X X X
1.30
6.42
6.28
6.76
7.27
28.03
Fertilizer use and promotion X X X X X
1.00
5.00
5.00
5.00
5.00
21.00 MAAIF
Support to improving maize post harvest
handling practices and technologies X X X X X
0.30
1.42
1.28
1.76
2.27
7.03 MAAIF
Cassava X X X X X
1.29
1.42
1.28
1.76
2.27
8.02
Cassava Extension X X X X X
1.29
1.42
1.28
1.76
2.27
8.02 MAAIF
Rice X X X X X
1.62
1.93
1.93
3.93
4.71
14.12 MAAIF
Information and Knowledge X X X X X
0.32
0.63
0.63
1.13
1.39
4.10 MAAIF
Mechanisation X X X X X
0.60
0.60
0.60
1.10
1.34
4.24 MAAIF
Fertilization and sustainable soil management X X X X X
0.40
0.40
0.40
0.90
1.06
3.16 MAAIF

ASSP 2015/16 to 2019/20 Draft 45
ASSP IDEAL BUDGET
ASSP undertakings Y1 Y2 Y3 Y4 Y5 Year 1 Year 2 Year 3 Year 4 Year 5 Total Lead
Implementer
Promote and distribute appropriate post-
harvest technologies X X X X X
0.30
0.30
0.30
0.80
0.92
2.62 MAAIF
Tea X X X X X
7.01
9.24
9.52
10.91
12.27
48.95 MAAIF
Tea Extension Service X X X X X
6.45
6.74
7.22
8.18
8.85
37.43 MAAIF
Tea Area Expansion X X X X X
-
2.00
1.50
2.00
2.60
8.10 MAAIF
Tea Policy X X X X X
0.56
0.50
0.80
0.73
0.82
3.42 MAAIF
Coffee X X X X X
7.31
7.51
8.41
21.26
28.05
72.53 UCDA
Promote and support adoption of good
agronomic practice at farm level X X X X X
1.62
1.62
1.62
3.62
4.27
12.74 UCDA
Promote coffee growing in new areas and
expansion in traditional coffee growing areas X X X X X
1.00
1.10
2.00
10.85
16.00
30.95 UCDA
Coffee Agro Extensions and Business
Development Services X X X X X
2.47
2.47
2.47
4.47
5.46
17.35 UCDA
Support and Strengthen Farmer Organizations X X X X X
2.22
2.32
2.32
2.32
2.32
11.49 UCDA
Fruits and Vegetables pests and disease control X X X X X
1.50
1.50
1.50
2.50
2.50
9.50 MAAIF
Dairy X X X X X
5.40
6.31
4.50
6.50
9.01
31.72 DDA
Institutional strengthening and creation of
enabling environment X X X X X
0.60
0.60
0.60
1.60
2.20
5.60 MAAIF/DDA
Enhancing availability of improved dairy cattle
germplasm X X X X X
2.00
2.00
2.00
2.00
2.00
10.00 NAGRC&DB
Building local capacity in feed production and
marketing X X X X X
2.50
3.41
1.60
2.10
3.71
13.32 DDA
Developing the national dairy herd information
management system X X X X X
0.30
0.30
0.30
0.80
1.10
2.80 DDA

ASSP 2015/16 to 2019/20 Draft 46
ASSP IDEAL BUDGET
ASSP undertakings Y1 Y2 Y3 Y4 Y5 Year 1 Year 2 Year 3 Year 4 Year 5 Total Lead
Implementer
Fisheries X X X X X
6.68
28.38
29.28
31.18
33.45
128.95 MAAIF/DFR
support to restocking of water bodies X X X X X
-
3.75
3.75
3.75
3.75
15.00 MAAIF/DFR
Developing the Fishery of Small Pelagic Fishes X X X X X
1.38
1.38
1.38
1.88
2.43
8.43 MAAIF/DFR
Promoting commercial aquaculture X X X X X
2.10
2.10
2.00
2.60
3.44
12.24 MAAIF/DFR
Infrastructure development along the value
chain X X X X X
1.20
1.20
1.20
1.70
2.18
7.48 MAAIF/DFR
Strengthen monitoring on all water bodies X X X X X
2.00
4.00
5.00
5.00
5.00
21.00 MAAIF/DFR
Fisheries aquaculture infrastructure
12.00
12.00
12.00
12.00
48.00 MAAIF/DFR
Extension for fish farming
2.50
2.50
2.50
2.50
10.00 MAAIF/DFR
Control of the new breed of weed and water
hyacinth X X X X X -
1.45
1.45
1.75
2.15
6.80 MAAIF/DFR
Meat X X X X X
9.63
24.49
23.96
22.33
24.62
105.03 MAAIF/DAR
Provision of an Enabling Environment for the
Meat X X X X X
0.50
0.50
0.50
0.50
0.70
2.70 MAAIF/DAR
Animal Feeds, Forage and Water Security
Enhancement X X X X X
0.80
0.80
0.80
0.80
1.12
4.32 MAAIF/DAR
Animal Feeds Production and Quality
Assurance Enhancement X X X X X
1.98
2.09
1.00
1.08
1.51
7.66 MAAIF/DAR
National Beef Genetics Resource Development X X X X X
2.00
2.00
2.00
2.00
2.80
10.80 NAGRC&DB
Support to animal breeding infrasrtucture X X X
-
8.00
8.00
8.00
8.00
32.00 NAGRC&DB
transport and logistical support for animal
breeding X X X
1.75
1.75
1.75
1.75
7.00 NAGRC&DB

ASSP 2015/16 to 2019/20 Draft 47
ASSP IDEAL BUDGET
ASSP undertakings Y1 Y2 Y3 Y4 Y5 Year 1 Year 2 Year 3 Year 4 Year 5 Total Lead
Implementer
support to liquid nitrogen cold chain X X X
-
0.65
0.65
0.10
-
1.40 NAGRC&DB
Goat Breed Improvement Schemes X X X X X
1.00
0.65
0.65
0.67
0.94
3.90 MAAIF/DAR
Support Investments in the Poultry Sector X X X X X
1.00
1.00
1.00
0.41
0.57
3.98 MAAIF/DAR
Kuroiler and Indigenous Chicken Resource
Development X X X X X
0.55
0.55
1.11
0.53
0.74
3.47 MAAIF/DAR
Develop the sericulture and silk production
value chain X X X X X
1.50
1.50
1.50
1.50
1.50
7.50 MAAIF/DAR
Support to Apiculture X X X X X
0.30
5.00
5.00
5.00
5.00
20.30 MAAIF/DAR
Cocoa X X X X X
1.10
0.89
0.89
1.34
2.01
6.25 MAAIF
Cocoa Extension Services X X X X X
1.10
0.89
0.89
1.34
2.01
6.25 MAAIF
Cotton X X X X X
4.78
11.00
11.00
12.50
14.75
54.03 CDO
Improving markets through formation of
farmers’ associations and capacity building X X X X X
0.78
2.00
2.00
2.00
2.00
8.78 CDO
cotton extension services X X X X X
2.00
3.00
3.00
4.50
6.75
19.25 CDO
support to mechanisation in cotton
1.00
2.50
2.50
2.50
2.50
11.00
cotton infrastructure development
1.00
3.50
3.50
3.50
3.50
15.00 CDO
Oil Seed X X X X X
1.70
1.79
1.82
2.86
3.61
11.79 MAAIF
enhance oilseed production and productivity X X X X X
1.48
1.52
1.58
2.12
2.77
9.46 MAAIF
institutional and enabling environment
strengthening X X X X X
0.22
0.27
0.25
0.75
0.85
2.33 MAAIF

ASSP 2015/16 to 2019/20 Draft 48
ASSP IDEAL BUDGET
ASSP undertakings Y1 Y2 Y3 Y4 Y5 Year 1 Year 2 Year 3 Year 4 Year 5 Total Lead
Implementer
Oil Palm X X X X X
13.50
30.50
25.30
36.30
36.82
142.42 MAAIF
Land identification and acquisition X X X X X
10.00
20.00
15.00
25.00
25.00
95.00 MAAIF
Plantation establishment and development X X X X X
2.00
9.00
9.00
10.00
10.00
40.00 MAAIF
Reform and strengthen agricultural extension X X X X X
1.00
1.00
1.00
1.00
1.40
5.40 MAAIF
Strengthen the institutional capacity of MAAIF X X X X X
0.30
0.30
0.30
0.30
0.42
1.62 MAAIF
Strengthen the capacity for quality assurance,
regulation and food safety standards X X X X X
0.20
0.20
-
-
-
0.40 MAAIF
Strategy 5: Control Pests, Vectors and
Diseases X X X X X
61.21
114.51
112.37
117.97
141.10
547.16 MAAIF
Control of pests and diseases for crops X X X X X
18.23
27.60
27.89
29.36
34.91
137.99
Crop pests and disease control regulatory
strengthening X X X X X
1.50
1.50
1.50
1.50
1.50
7.50 MAAIF
Conduct early detection and control of crop
pests, weeds and diseases X X X X X
4.00
4.40
4.84
5.32
5.86
24.42 MAAIF
Crop pests and disease control infrastructure X X X X X
4.00
4.00
4.00
4.00
6.00
22.00 MAAIF
Maize Pest and Disease control X X X X X
1.00
1.42
1.28
1.76
2.27
7.73 MAAIF
Beans Pest and Disease control X X X X X
0.80
1.35
1.35
1.85
2.39
7.74 MAAIF
Banana bacterial wilt control X X X X X
2.00
10.00
10.00
10.00
10.00
42.00 MAAIF
Management of Coffee Diseases and Pests X X X X X
4.93
4.93
4.93
4.93
6.90
26.60 UCDA/MAAIF

ASSP 2015/16 to 2019/20 Draft 49
ASSP IDEAL BUDGET
ASSP undertakings Y1 Y2 Y3 Y4 Y5 Year 1 Year 2 Year 3 Year 4 Year 5 Total Lead
Implementer
Control livestock diseases and vectors to
ensure that communicable diseases are
managed in order to promote animal health
as a means to greater productivity and
market penetration. X X X X X
32.87
54.86
54.47
59.37
72.80
274.37 MAAIF
Uganda Tsetse and Trypanosomiasis
Eradication X X X X X
2.00
5.07
5.30
12.99
15.00
40.36 MAAIF/COCTU
Eastern Uganda Regional Tsetse and
Trypanosomiasis Eradication X X X X X
2.00
5.00
5.00
5.00
7.00
24.00 MAAIF/COCTU
North Western Uganda Tsetse Project X X X X X
1.00
9.85
9.95
6.65
9.31
36.76 MAAIF/COCTU
Strengthening COCTU in Coordination, Policy
and Planning X X X X X
0.09
0.06
0.15
0.05
0.07
0.41 COCTU
Control and Surveillance of Ticks X X X X X
2.21
1.78
1.17
1.10
1.53
7.79 MAAIF
Control of East Coast Fever (ECF) X X X X X
2.36
2.73
2.15
4.04
5.66
16.94 MAAIF
Control of Foot and Mouth Disease (FMD) X X X X X
10.00
15.00
15.00
15.00
20.00
75.00 MAAIF
Control of Rift Valley Fever X X X X X
1.11
1.33
1.11
0.92
0.83
5.30 MAAIF
Control of Rabies X X X X X
2.20
2.16
2.14
1.12
0.90
8.52 MAAIF
control of PPR
3.00
3.00
3.00
3.00
3.00
15.00 MAAIF
Control HPAI
-
2.00
2.00
2.00
2.00
8.00 MAAIF
Control of Newcastle Disease
3.00
3.00
3.00
3.00
3.00
15.00 MAAIF
Control of African Swine Fever (ASF) X X X X X
3.00
3.00
3.00
3.00
3.00
15.00 MAAIF
Capacity Building for Animal Disease
Surveillance and Control Systems in Uganda X X X X X
0.30
0.30
0.50
0.50
0.50
2.10 MAAIF

ASSP 2015/16 to 2019/20 Draft 50
ASSP IDEAL BUDGET
ASSP undertakings Y1 Y2 Y3 Y4 Y5 Year 1 Year 2 Year 3 Year 4 Year 5 Total Lead
Implementer
Capacity Building for Enforcement of
Veterinary Regulations in Uganda X X X X X
0.30
0.30
0.50
0.50
0.50
2.10 MAAIF
Control of Human and Animal Brucellosis X X X X X
0.30
0.30
0.50
0.50
0.50
2.10 MAAIF
Creating an Enabling Policy and Regulatory
Environment for Livestock desease control X X X X X
2.81
2.26
1.62
1.66
1.73
10.08 MAAIF
Review three (3) outdated legislations X
0.60
0.20
0.20
0.20
0.20
1.40 MAAIF
Enact eight (8) Draft bills, X X
0.75
0.75
0.20
0.20
0.20
2.10 MAAIF
Formulate twelve (12) regulations X
0.12
0.12 MAAIF
Approve & print developed Standards X X
0.02
0.02
0.03 MAAIF
Review & approve three (3) policies X
0.15
0.15 MAAIF
Develop & disseminated 10 Strategies X X
0.10
0.04
0.14 MAAIF
Operationalise approved policies X X X X X
0.51
0.56
0.61
0.67
0.74
3.08 MAAIF
Equip & support established animal law
enforcement Unit X X X X X
0.12
0.12
0.12
0.12
0.12
0.60 MAAIF
Equip & finance work of UVB X X X X X
0.54
0.44
0.44
0.44
0.44
2.31 MAAIF
Support continuous professional training X X X X X
0.03
0.03
0.03
0.03
0.03
0.15 MAAIF
Establishment of Disease Control
infrastructure and operationalization of
effective disease control X X X X X
7.30
29.79
28.40
27.57
31.66
124.72 MAAIF
Rehabilitation or construction and equipping of
4 quarantine stations, 14 holding grounds + 14
border posts
X X X X X
2.23
2.23
2.23
2.23
4.00
12.94 MAAIF

ASSP 2015/16 to 2019/20 Draft 51
ASSP IDEAL BUDGET
ASSP undertakings Y1 Y2 Y3 Y4 Y5 Year 1 Year 2 Year 3 Year 4 Year 5 Total Lead
Implementer
Provision of proper transport and cold chain
equipment for the Veterinary Offices X X X X X
-
2.76
2.76
2.76
5.53
13.82 MAAIF
Development and implementation of prevention
and control strategy for major diseases X X X X X
0.17
0.17
0.17
0.17
0.17
0.86 MAAIF
Creation and implementation of individual
animal (cattle) herd and flock (goat and
poultry) identification for traceability
X X X X X
1.98
1.98
1.98
1.98
1.98
9.90 MAAIF
Renovate and equip the National Laboratory
and establish 12 Regional Laboratory facilities X X X
0.82
0.82
0.82
2.47 MAAIF
Personnel and operational costs of the national
and regional laboratoris infrastructure X X X X X
1.37
1.37
1.37
1.37
1.37
6.84 MAAIF
establishment of livestock disease control
infrastructure in LGs X X X X X
0.40
17.00
17.00
17.00
17.00
68.40 MAAIF
logistical support to laboratory and technicians X X X
1.50
1.50
1.50
1.50
6.00 MAAIF/DDA
Establish a national Animal Feed quality
analysis laboratory-Diary feeds X X X X X
0.32
1.95
0.56
0.56
0.12
3.50 MAAIF
Strategy 6: Other production and productivity enhancing measures
X X X X X
2.30
26.40
26.40
41.00
51.62
147.72 MAAIF Sustainable Land Management/Promote
adaptation of climate change resilient
agricultural production systems, technologies
and practices
X X X X X
1.00
5.00
5.00
7.00
9.00
27.00 MAAIF
Increase access to agricultural finance services by implementing Agricultural commodity based Development Creditv facilities
X X X X X
18.60
18.60
28.20
36.43
101.83 MAAIF
Promote commercialisation of agriculture particularly amongst small holder farmers
X X X X X
0.50
2.00
2.00
5.00
5.00
14.50 MAAIF
Promote time and labour saving technologies targeting women farmers
X X X X X
0.40
0.40
0.40
0.40
0.40
2.00 MAAIF
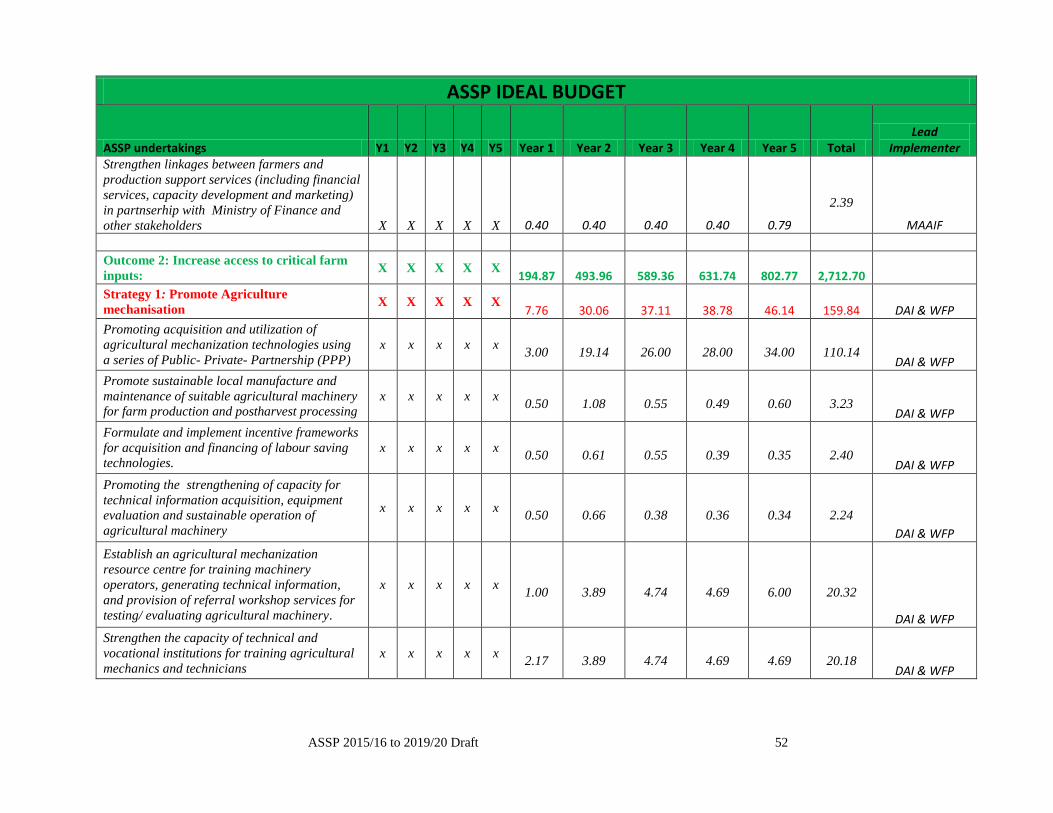
ASSP 2015/16 to 2019/20 Draft 52
ASSP IDEAL BUDGET
ASSP undertakings Y1 Y2 Y3 Y4 Y5 Year 1 Year 2 Year 3 Year 4 Year 5 Total Lead
Implementer Strengthen linkages between farmers and
production support services (including financial
services, capacity development and marketing)
in partnserhip with Ministry of Finance and
other stakeholders X X X X X
0.40
0.40
0.40
0.40
0.79
2.39
MAAIF
Outcome 2: Increase access to critical farm
inputs: X X X X X
194.87
493.96
589.36
631.74
802.77
2,712.70
Strategy 1: Promote Agriculture
mechanisation X X X X X
7.76
30.06
37.11
38.78
46.14
159.84 DAI & WFP
Promoting acquisition and utilization of
agricultural mechanization technologies using
a series of Public- Private- Partnership (PPP)
x x x x x
3.00
19.14
26.00
28.00
34.00
110.14 DAI & WFP
Promote sustainable local manufacture and
maintenance of suitable agricultural machinery
for farm production and postharvest processing
x x x x x
0.50
1.08
0.55
0.49
0.60
3.23 DAI & WFP
Formulate and implement incentive frameworks
for acquisition and financing of labour saving
technologies.
x x x x x
0.50
0.61
0.55
0.39
0.35
2.40 DAI & WFP
Promoting the strengthening of capacity for
technical information acquisition, equipment
evaluation and sustainable operation of
agricultural machinery
x x x x x
0.50
0.66
0.38
0.36
0.34
2.24
DAI & WFP
Establish an agricultural mechanization
resource centre for training machinery
operators, generating technical information,
and provision of referral workshop services for
testing/ evaluating agricultural machinery.
x x x x x
1.00
3.89
4.74
4.69
6.00
20.32
DAI & WFP
Strengthen the capacity of technical and
vocational institutions for training agricultural
mechanics and technicians
x x x x x
2.17
3.89
4.74
4.69
4.69
20.18 DAI & WFP

ASSP 2015/16 to 2019/20 Draft 53
ASSP IDEAL BUDGET
ASSP undertakings Y1 Y2 Y3 Y4 Y5 Year 1 Year 2 Year 3 Year 4 Year 5 Total Lead
Implementer Strengthen collaboration with the National
Bureau of Standards to eliminate importation
and trade of substandard agricultural
mechanisation equipments
x x x x x
0.09
0.79
0.15
0.15
0.15
1.33 DAI & WFP
Strategy 2: Improve access to high quality
seeds, planting and stocking materials X X X X X
173.60
384.85
468.25
469.00
491.90
1,987.61 MAAIF
Strengthening and rationalizing the
Department of Regulation and
Certification’s seed services X X X X X
4.98
3.91
2.61
2.11
1.81
15.42 DCI & C
Improve phytosanitary control at entry points X X X X X
0.74
1.04
0.24
0.24
0.24
2.50 DCI & C
Strengthen Namelere laboratory X X X
0.80
0.50
-
0.30
-
1.60 NARO/DCI & C
Transport to improve communication and
service delivery X
0.44
-
-
-
-
0.44 DCI & C Improve data and other information on the seed
industry to support better policy and program
plans, both by government and by the private
sector
X X X X X
0.20
0.20
0.20
0.20
0.20
1.00 DCI & C
Promote seed quality insurance X X X X X
2.65
2.02
2.02
1.22
1.22
9.13 DCI & C
Achieve ISTA accreditation and maintain
OECD Seed Schemes accreditation X X X X X
0.10
0.10
0.10
0.10
0.10
0.50 DCI & C
Implement PVP X X X X X
0.05
0.05
0.05
0.05
0.05
0.25 DCI & C
Enhancing the capacity of the private seed
industry to produce pre-basic seed X X X X X
2.88
1.01
1.46
1.01
0.41
6.77 MAAIF
Strengthening capacity of NARI institutes
involved in input supply X X X X X
0.27
4.27
4.27
3.47
22.27
34.56 NARO
Enhance Breeder/foundation seed production
and supply X X X X X
0.07
0.27
0.27
0.27
0.27
1.16 NARO
Strengthen/establish agribusiness incubation
service centres X X X X X
0.20
4.00
4.00
3.20
22.00
33.40 NARO

ASSP 2015/16 to 2019/20 Draft 54
ASSP IDEAL BUDGET
ASSP undertakings Y1 Y2 Y3 Y4 Y5 Year 1 Year 2 Year 3 Year 4 Year 5 Total Lead
Implementer
Strengthen policies, laws and regulations for
agricultural inputs including seeds and
planting materials supply and use
X X X X X 2.00
5.75
5.00
7.00
10.00
29.75 MAAIF
Operationalise and implement PVP Act X
0.25
0.25 MAAIF
Establish a National Seed Sector Database X
0.50
0.50 MAAIF
Conduct regular market severance of input
dealers (wholesale and retails) X X X X X
2.00
5.00
5.00
7.00
10.00
29.00 MAAIF
Upscaling use of improved seeds and
planting material
1.42
1.62
1.62
2.12
2.12
8.90 MAAIF
Extend the dealer network/Support to UNADA X X X X X
0.05
0.25
0.25
0.25
0.25
1.04 MAAIF
Improve farmer knowledge of new varieties X X X X X
1.03
1.03
1.03
1.03
1.03
5.16 MAAIF
Support to seed companies to test and promote
new varieties and cultivars X X X X X
0.34
0.34
0.34
0.84
0.84
2.70 MAAIF
Strengthen the national certification and
regulation system to guarantee the quality of
seeds and other agro-inputs.
X X X X X
5.00
9.00
12.00
12.00
14.00
52.00 MAAIF
Increase availability and access to quality
seeds, planting and stocking materials
X X X X X 157.05
359.29
441.29
441.29
441.29
1,840.21 NAADS
Multiplication and distribution of clean planting materials of Bananas X X X X X
3.30
4.30
5.40
5.40
5.40
23.80 NAADS
Beans Seed production, multiplication and
distribution X X X X X
8.00
27.00
34.00
34.00
34.00
137.00 NAADS
Maize Seed production, multiplication and
distribution X X X X X
14.00
63.00
79.00
79.00
79.00
314.00 NAADS
Rice Seed production, multiplication and
distribution X X X X X
1.00
3.50
4.30
4.30
4.30
17.40 NAADS
production and distribution of clean planting
material of improved cassava varieties X X X X X
4.50
19.20
24.00
24.00
24.00
95.70 NAADS

ASSP 2015/16 to 2019/20 Draft 55
ASSP IDEAL BUDGET
ASSP undertakings Y1 Y2 Y3 Y4 Y5 Year 1 Year 2 Year 3 Year 4 Year 5 Total Lead
Implementer
Planting materials for Tea Area Expansion X X X X X
33.76
82.00
103.00
103.00
103.00
424.76 NAADS
Provision of high Yielding, diseases and pest
resistant coffee varieties to promote growing in
new areas and expansion in traditional coffee
growing areas , and provision of agr-chemicals
X X X X X
27.00
47.00
59.00
59.00
59.00
251.00
UCDA
production and distribution of quality clean
citrus seedlings X X X X X
14.50
26.00
33.00
33.00
33.00
139.50 NAADS
distribution of quality clean pineapple seedlings
tolerant to pests and diseases X X X X X
0.60
0.60
0.70
0.70
0.70
3.30 NAADS
production and distribution of quality clean
apple seedlings tolerant to pests and diseases X X X X X
2.00
5.90
7.40
7.40
7.40
30.10 NAADS
Provision of quality inputs for prodiction of
mangoes X X X X X
7.50
12.00
15.00
15.00
15.00
64.50 NAADS
Provision of inputs for vegetables production X X X X X
0.60
0.60
0.60
0.60
0.60
3.00 NAADS
Fish Inputs( Fingerlings and feeds)
20.00
20.00
20.00
20.00
80.00 NAADS
Provision of beef cattle X X X X X
0.90
3.00
3.70
3.70
3.70
15.00 NAADS
Provision of heifers - dairy cattle X X X X X
25.00
25.00
29.50
29.50
29.50
138.50 NAADS
Multiplication of pasture seed X X X X X
1.00
1.00
1.00
1.00
1.00
5.00 NAADS
Provision of improved goats X X X X X
2.00
2.00
2.00
2.00
2.00
10.00 NAADS
Cocoa seedlings provision X X X X X
3.10
3.10
3.10
3.10
3.10
15.50 NAADS
Cotton inputs support to farmers X X X X X
1.25
1.25
1.25
1.25
1.25
6.25 CDO

ASSP 2015/16 to 2019/20 Draft 56
ASSP IDEAL BUDGET
ASSP undertakings Y1 Y2 Y3 Y4 Y5 Year 1 Year 2 Year 3 Year 4 Year 5 Total Lead
Implementer
addressing challenges of access to critical farm
inputs for oil palm X X X X X
1.30
1.30
1.30
1.30
1.30
6.50 MAAIF
Oil seed provision X X X X X
1.74
1.74
1.74
1.74
1.74
8.70 NAADS/MAAIF
Provision of poultry units and piglets X X X X X
4.00
9.80
12.30
12.30
12.30
50.70 NAADS
Strategy 3: Increase access to water for
agricultural production (irrigation, water for
livestock, aquaculture). X X X X X
6.10
67.90
69.54
85.20
159.11
387.85 DAI & WFP
Strengthen the legal and institutional
framework and capacity for developing
water for agricultural production X X X X X
1.00
1.60
1.00
1.00
1.00
5.60 DAI & WFP
development of irrigation master plan,
guidelines, action plans, framework and
principles for dissemination X
0.40
0.20
0.60 DAI & WFP
preparation of guidelines for appraisal and
design of small-scale farmer-based irrigation
schemes X
0.20
0.20
0.40 DAI & WFP
development of appropriate mechanisms for
cost sharing and funding of water for
agricultural production-based interventions X
0.20
0.20
0.40 DAI & WFP
Development of guidelines for a Community
Based Management System (CBMS) for
operation and maintenance of water for
agricultural production facilities and for WUAs X
0.10
0.10
0.20
DAI & WFP Institutionalize Water User Associations
(WUAs), cooperative societies and other farmer
groups in regulation and management of
irrigated agriculture X
0.10
0.10
0.20 DAI & WFP
establish technical support units to LGs in
agricultural water management (AWM) X X X X
0.30
0.50
0.50
0.50
1.80 DAI & WFP

ASSP 2015/16 to 2019/20 Draft 57
ASSP IDEAL BUDGET
ASSP undertakings Y1 Y2 Y3 Y4 Y5 Year 1 Year 2 Year 3 Year 4 Year 5 Total Lead
Implementer
Promote the uptake and use of the adapted
small scale irrigation technologies/options X X X X
0.50
0.50
0.50
0.50
2.00 DAI & WFP
Investing in modern irrigation technologies
through construction of large and promotion
of small scale irrigation technologies in line
with the zoning strategy and development of
large and medium water reservoirs. X X X X X
4.30
58.30
60.50
74.20
135.50
332.80
DAI & WFP
Evaluation and rehabilitation of nine (9)
existing public irrigation schemes of Atera,
Kiige, Labori, Ongom, Olweny and Odina X X X X X
1.00
20.00
28.00
30.00
40.00
119.00 DAI & WFP
Construction of Rhino Camp in Arua District,
Labwor in Moroto District,Katete in Kanungu
District, Biiso in Bullisa District,Pabbo in
Amuru District , Namalu, Kibimba-
Gomba,Musamya, Torchi in Oyam District
among others X X X X
3.00
30.00
30.00
30.00
65.00
158.00
DAI & WFP carrying out feasibility studies and design of 3
other irrigation schemes covering an area of
6,900 ha-Acomai irrigation Scheme, Atari
Irrigation scheme and Namatala Irrigation
Scheme X X X
5.80
5.80
DAI & WFP Establish 11,000 ha of commuinity-
based/strategic medium to large scale schemes
at Naigomwa in Iganga District and Igogero in
Bugiri Disrtict X X
11.70
24.00
35.70 DAI & WFP
Promotion of small scale irrigation
technologies by establishing at least a
demonstration unit per district per year across
the country X X X X X
0.20
1.00
1.00
1.00
3.00
6.20 DAI & WFP
Adapt and make affordable small scale
irrigation technologies/options including
garden hose, drip systems X X X X X
0.10
1.50
1.50
1.50
3.50
8.10 DAI & WFP
Promote rainwater harvesting and storage at
household and farm levels for agriculture. X X X X X
0.80
8.00
8.04
10.00
22.61
49.45 DAI & WFP

ASSP 2015/16 to 2019/20 Draft 58
ASSP IDEAL BUDGET
ASSP undertakings Y1 Y2 Y3 Y4 Y5 Year 1 Year 2 Year 3 Year 4 Year 5 Total Lead
Implementer
Rehabilitation/expansion of 102 public Valley
dams X X X X X
0.10
1.00
1.00
1.00
2.00
5.10 DAI & WFP
Rehabilitation/expansion of 195 valley tanks X X X X X
0.10
0.80
0.74
0.80
0.80
3.24 DAI & WFP
Construction of 1,200 new valley tanks X X X X X
0.50
4.00
4.00
4.20
12.00
24.70 DAI & WFP
Establish 4 commercial aquaculture sites of
minimum 10 ponds X X X
0.60
1.20
2.40
4.20 DAI & WFP
Establishing of two (2) well-planned
Aquaculture Parks (APs) in Mpologoma
catchment and Olweny catchment X
1.70
1.70
3.40 DAI & WFP
Establish four three (3) fish farms each with
four (4) ponds in the districts of Mbarara, Gulu
and Sironko X X X
1.20
1.20
1.80
4.20 DAI & WFP
Development of two (2) landing sites in Kaliro
and Amolatar districts X X
1.00
1.31
2.31 DAI & WFP
Develop and Promote Rainwater harvesting
technologies and Best Practices for smallholder
farmers X X X X X
0.10
0.50
0.50
0.60
0.60
2.30 DAI & WFP
Strategy 4: Enhance access and use of
fertilizers by all categories of farmers. X X X X X
7.42
11.15
14.45
38.75
105.62
177.40 MAAIF
Create an enabling environment for fertilizer
production, importation and distribution X X X X X
1.24
3.93
5.13
5.96
0.33
16.59 MAAIF
Support to the Fertilizer Market Development
Council (FMDC) X X X X X
0.84
0.33
0.33
0.33
0.33
2.17 MAAIF
review of the national fertilizer policy and
implementing regulations X X X X X
0.40
0.30
-
-
-
0.70 MAAIF
Credit support for Bulk Purchase and Risk
Management Fund X X X X
-
3.30
4.80
5.63
0.00
13.73 MAAIF
Strengthen soil fertility knowledge
management and awareness creation X X X X X
1.10
1.18
1.16
1.09
0.96
5.50 MAAIF

ASSP 2015/16 to 2019/20 Draft 59
ASSP IDEAL BUDGET
ASSP undertakings Y1 Y2 Y3 Y4 Y5 Year 1 Year 2 Year 3 Year 4 Year 5 Total Lead
Implementer
update soil fertility management and fertilizer
use recommendations X X X X X
0.14
0.33
0.31
0.24
0.05
1.07 MAAIF
develop soil fertility management and fertilizer
use extension materials X X X X X
0.12
0.01
0.01
0.01
0.08
0.23 MAAIF
increase number of agro-dealers trained about
fertilizer and with enhanced business skills X X X X X
0.30
0.30
0.30
0.30
0.30
1.52 MAAIF Increase number of Technology Transfer Agents
(TTAs) with fertilizer knowledge and matching
inputs
X X X X X
0.14
0.14
0.14
0.14
0.14
0.68 MAAIF
Increase number of farmers with fertilizer
knowledge and matching inputs X X X X X
0.40
0.40
0.40
0.40
0.40
2.00 MAAIF
Capacity Building and Physical
Infrastructure for Fertilizers
1.93
2.89
5.02
28.56
101.18
139.56 MAAIF
Crop Production Risk Management X X X X X
0.05
0.44
0.86
1.10
0.32
2.77 MAAIF
Capacity Building Project X X X X X
1.88
2.45
4.16
2.46
5.86
16.79 MAAIF
Support Physical Infrastructure Project X X X X X
-
-
-
5.00
15.00
20.00 MAAIF
Development of Domestic Resources for Soil
Productivity Enhancement X X X X X
-
-
-
20.00
80.00
100.00 MAAIF
Provision of fertiliser inputs to farmers X X X X X
3.15
3.15
3.15
3.15
3.15
15.75 NAADS
Outcome 3: Improve agricultural markets
and value addition for the 12 prioritised
commodities X X X X X
25.89
192.89
217.16
279.93
297.04
1,012.90 MAAIF
Strategy 1: Promote private sector
investment in value addition of the 12
prioritised commodities through PPP X X X X X
1.00
5.00
10.00
15.00
15.00
46.00 MAAIF
Strategy 2:Build capacities of farmers, trades
and processors in quality standards and
market requirements of the 12 priority
commodities X X X X X
20.69
150.89
167.16
179.93
197.04
715.70 MAAIF

ASSP 2015/16 to 2019/20 Draft 60
ASSP IDEAL BUDGET
ASSP undertakings Y1 Y2 Y3 Y4 Y5 Year 1 Year 2 Year 3 Year 4 Year 5 Total Lead
Implementer
Strengthen higher level farmer organization
for collactive marketing, bulking, quality and
standards improvement X X X X X
2.00
3.00
4.00
5.20
7.12
21.32 MAAIF
Promote appropriate technologies and
practices for minimizing post harvest losses
along the entire commodity value chain. X X X X X
2.10
8.00
11.80
14.76
19.94
56.60 MAAIF/NARO
Develop and adapt appropriate technologies
and practices for postharvest handling along
the value chain of all priority commodities
X X X X X
0.40
2.40
2.80
2.80
3.20
11.60 MAAIF/NARO
Build Capacity of Value chain actors on best
post harvest handling practices for each
priority commodity
X X X X X
0.30
1.00
4.00
6.00
6.00
17.30 MAAIF/NARO
Provide farmers/ groups assorted SME
processing demo/equipment X X X X X
1.00
1.00
1.40
1.96
2.74
8.10 MAAIF/NARO
Develop and improve food handling, marketing
and distribution systems and linkages to local
and export markets.
X X X X X
0.40
3.60
3.60
4.00
8.00
19.60 MAAIF/NARO
Promote Commodity/farm based storage and
agro processing, as a means to increasing
access to domestic and regional market,
through demonstrations and PPPs.
X X X X X
3.80
8.85
9.68
9.30
9.30
40.93 MAAIF
Innovate and adapt affordable on-farm storage
solutions for the priority and strategic
commodities
X X X X X
0.50
0.80
0.80
0.80
0.80
3.70 MAAIF
Facilitate private sector uptake, development,
marketing and distribution of on farm storage
solutions to smallholder farmers including
developing a cost effective sales distribution
system
X X X X X
0.30
1.05
1.88
1.50
1.50
6.23 MAAIF
Enhance efficiency (higher output at reduced
cost) at all value chain nodes through trainings
and demonstration sites of appropriate
improved TIMPS
X X X X X
0.50
2.00
2.00
2.00
2.00
8.50 MAAIF

ASSP 2015/16 to 2019/20 Draft 61
ASSP IDEAL BUDGET
ASSP undertakings Y1 Y2 Y3 Y4 Y5 Year 1 Year 2 Year 3 Year 4 Year 5 Total Lead
Implementer
Product development to meet end-user market
requirements e.g. quality& safety standards,
traceability, packaging, certification for niche
markets, bar coding for supermarket outlets, etc
X X X X X
1.00
2.00
2.00
2.00
2.00
9.00 MAAIF
Knowledge and skills development to enhance
capacity for engaging in high quality export
markets e.g. for horticulture
X X X X X
0.50
1.00
1.00
1.00
1.00
4.50 MAAIF
Promote cottage processing industries through
incubation of new processing technologies for
both food and non-food products
X X X X X
1.00
2.00
2.00
2.00
2.00
9.00 MAAIF
Marketing and value addition for specific
priority and strategic commodities
X X X X X 12.79
131.04
141.68
150.67
160.67
596.84 MAAIF
Developing National and Regional Markets for
Ugandan bananas and banana processed
products X X X X X
1.00
2.25
2.25
2.25
2.25
10.00 MAAIF
Beans Marketing X X X X X
1.00
1.00
2.00
2.00
2.00
8.00 MAAIF
Maize Marketing and value addition X X X X X
1.00
2.60
4.00
6.00
6.00
19.60 MAAIF
Rice Marketing and value addition X X X X X
1.00
1.00
1.20
2.00
2.62
7.82 MAAIF
Cocoa marketing and Value addition support X X X X X
1.45
1.53
1.59
1.66
1.72
7.95 support cassava farmers and SMEs to engage in
profitable processing and marketing of quality
cassava flour and chips as an agribusiness
enterprise
X X X X X
1.00
2.00
3.00
3.00
4.70
13.70 MAAIF
Establishment of new Tea Processing
Facilitiesfor value addition X X X X X
-
9.00
10.00
10.00
15.40
44.40 MAAIF
Tea Marketing X X X X X
0.18
0.18
0.18
0.18
0.18
0.88 MAAIF
Coffee value addition and Generic Promotion X X X X X
1.00
1.00
5.00
10.00
10.00
27.00 UCDA

ASSP 2015/16 to 2019/20 Draft 62
ASSP IDEAL BUDGET
ASSP undertakings Y1 Y2 Y3 Y4 Y5 Year 1 Year 2 Year 3 Year 4 Year 5 Total Lead
Implementer
Fisheries Marketing and value addition
infrastructure
13.00
13.00
13.00
13.00
52.00 MAAIF/DFR
Improving grading standards, packaging and
handling of fruits and vegetables X X X X X
0.90
1.00
3.00
3.00
5.10
13.00 MAAIF
Support to fruit processing X X X X X
0.90
29.00
34.88
34.50
34.50
133.78 NAADS
Promoting local consumption and export of
milk and dairy products. X X X X X
0.98
0.98
0.98
0.98
0.98
4.91 DDA
Rehabilitate existing and develop new milk
processing infrastructure X X X X X
-
2.00
2.50
2.50
2.50
9.50 DDA
Creating a buffer stock/animal handling
grounds to support beef processing/abattoirs X X X
1.00
58.00
50.00
50.00
50.00
209.00 MAAIF
promotion of domestic value addition to lint X X X X X
4.80
6.00
7.50
7.62
25.92 CDO
Facilitate domestic, regional and international
trade in Vegetable Oil Products X X X X X
0.80
0.80
0.80
0.80
0.80
4.00 MAAIF Strengthen producer-buyer/aggregator
contractual relationships for the
strategic/priority commodities
X X X X X
0.30
0.30
0.30
0.30
0.30
1.50 MAAIF
Identify and strengthen producer groups adding
value to agricultural commodities through
training and exposure to technologies befitting
their activities.
X X X X X
0.10
0.30
0.50
0.50
0.50
1.90
MAAIF
Promote structured trading systems by linking
organized collective marketing farmer groups
to large buyers and storage
handlers/warehouse operators
X X X X X
0.18
0.30
0.50
0.50
0.50
1.98 MAAIF
Strategy 3: Operationalize the
commercialisation fund X X X X X
3.00
7.00
10.00
10.00
10.00
40.00 NAADS
Strategy 4: Ensure the development,
maintenance and improvement of physical
agricultural marketing infrastructure
X X X X X 1.20
30.00
30.00
75.00
75.00
211.20 MAAIF

ASSP 2015/16 to 2019/20 Draft 63
ASSP IDEAL BUDGET
ASSP undertakings Y1 Y2 Y3 Y4 Y5 Year 1 Year 2 Year 3 Year 4 Year 5 Total Lead
Implementer
Cold Chain storage Infrastructure X X X X X
0.40
10.00
10.00
25.00
25.00
70.40 MAAIF
Physical agricultultural commodity markets X X X X X
0.40
10.00
10.00
25.00
25.00
70.40 MAAIF
Community based grain storage facilities X X X X X
0.40
10.00
10.00
25.00
25.00
70.40 MAAIF
Outcome 4: Institutional and enabling
environment strengthening X X X X X
29.08
100.82
113.12
127.44
165.61
536.08 MAAIF
Strategy 1: Strengthen institutional capacity
of MAAIF and public agricultural agencies X X X X X
17.09
68.67
75.87
84.47
111.46
357.57 MAAIF
Institutional Strengthening and Capacity
Building X X X X X
6.30
47.25
53.15
61.25
87.55
255.50 MAAIF
Construction of MAAIF headquaters Building
in Kampala X X X
1.00
5.00
10.00
17.00
43.30
76.30 MAAIF
Construction of administrative infrastructure
for selected district production departments X X X X X
0.40
6.00
6.00
6.00
6.00
24.40 MAAIF
Human Resource Development-
Training/capacity building X X X X X
1.00
2.00
2.00
3.00
3.00
11.00 MAAIF
Strengthening Institutional Linkages and
Networking Capacity X X X X X
1.00
1.00
1.00
1.00
1.00
5.00 MAAIF
improving access to working facilities, tools
and equipment for MAAIF, its Agencies and
local governments.
X X X X X
2.90
3.00
3.90
4.00
4.00
17.80 MAAIF
logistical support to entebbe dairy training
school X X X
0.25
0.25
0.25
0.25
1.00 DDA
institutional support to distribution of seed
planting and stocking material - OWC
20.00
20.00
20.00
20.00
80.00 NAADS
institutional support to distribution of seed
planting and stocking material - NAADS SEC
10.00
10.00
10.00
10.00
40.00 NAADS

ASSP 2015/16 to 2019/20 Draft 64
ASSP IDEAL BUDGET
ASSP undertakings Y1 Y2 Y3 Y4 Y5 Year 1 Year 2 Year 3 Year 4 Year 5 Total Lead
Implementer
transform ATIs (Bukalasa College and
Fisheries Training Institute), into institutions
that are responsive to knowledge and skill
market in the extension service.
X X X X X
1.00
3.90
4.40
4.40
4.10
17.80
Bukalasa College and
Fisheries Training Institute
Bukalasa Agricultural College X X X X X
0.50
1.95
2.20
2.20
2.05
8.90
Bukalasa College
Curriculum review X X X X X
0.05
0.05
0.20
0.20
0.05
0.55
Bukalasa College
Human resources strengthening X X X X X
0.10
0.30
0.50
0.50
0.50
1.90
Bukalasa College
Infrastructural rehabilitation/development X X X X X
0.25
1.50
1.50
1.50
1.50
6.25
Bukalasa College
Restructuring and Operationalization X X
0.10
0.10
-
-
-
0.20
Bukalasa College
Fisheries Training Institute
X X X X X
0.50
1.95
2.20
2.20
2.05
8.90
Fisheries Training Institute
Curriculum review
X X X X X
0.05
0.05
0.20
0.20
0.05
0.55
Fisheries Training Institute
Human resources strengthening
X X X X X
0.10
0.30
0.50
0.50
0.50
1.90
Fisheries Training Institute
Infrastructural rehabilitation/development
X X X X X
0.25
1.50
1.50
1.50
1.50
6.25
Fisheries Training Institute
Restructuring and Operationalization
X X
0.10
0.10
-
-
-
0.20
Fisheries Training Institute

ASSP 2015/16 to 2019/20 Draft 65
ASSP IDEAL BUDGET
ASSP undertakings Y1 Y2 Y3 Y4 Y5 Year 1 Year 2 Year 3 Year 4 Year 5 Total Lead
Implementer
Support to the National Farmers’
Leadership Centre (NFLC) 0.8 1 1.12 1.5 1.5 5.92 NFLC
Infrastructure Development and Rehabilitation X X X X X 0.5 0.5 0.5 0.6 0.5 2.6 NFLC
Equipment and Tooling X X X X X 0.2 0.3 0.32 0.4 0.5 1.72 NFLC
Training, Administration and Services X X X X X 0.1 0.2 0.3 0.5 0.5 1.6 NFLC
Supportv to District Agriculture Training and
Information Centres (DATICS) X X X X X
0.42
4.42
5.00
5.00
5.00 19.84 MAAIF
Review and development of curriculum X X X X X
0.42
0.42
1.00
1.00
1.00
3.84 MAAIF
Infrastructure Development X X X X X -
4.00
4.00
4.00
4.00
16.00 MAAIF
Support to Agriculture Sector Policy and
Planning
2.50
3.00
3.00
3.00
3.00
14.50 MAAIF/APD
Capacity building for MAAIF staff in Policy
and Planning X X X X X
0.40
0.60
0.60
0.60
0.60
2.80 MAAIF/APD
Production of bankable project proposals to
support ASSP implementation X X X X X
0.30
0.40
0.40
0.40
0.40
1.90 MAAIF/APD
Undertake budget execution assessment
exercises X X X X X
1.00
1.10
1.10
1.10
1.10
5.40 MAAIF/APD Link ASSP implementation with regional
agriculture policy undertakings (EAC,
COMESA, CADAP, etc) X X X X X
0.30
0.40
0.40
0.40
0.40
1.90 MAAIF/APD
Cordinate production of Agricultural Sector
mandatory policy/planning/budget papers X X X X X
0.50
0.50
0.50
0.50
0.50
2.50 MAAIF/APD
Agricultural Statistics, ICT and Risk
Management X X X X X
2.41
5.18
5.31
4.83
5.85
23.58
MAAIF/Statistics Division

ASSP 2015/16 to 2019/20 Draft 66
ASSP IDEAL BUDGET
ASSP undertakings Y1 Y2 Y3 Y4 Y5 Year 1 Year 2 Year 3 Year 4 Year 5 Total Lead
Implementer
Strengthening the Coordination and
Management of agriculture sector statistical
system X X X X X
0.30
0.50
0.60
0.70
0.90
3.00
MAAIF/Statistics Division
Improve usability and dissemination of
agriculture statistics X X X X X
0.36
0.32
0.16
0.16
0.28
1.28
MAAIF/Statistics Division
Mainstreaming Quality Assurance in
Agriculture statistical production X X X X X
0.37
-
0.11
0.26
0.10
0.84
MAAIF/Statistics Division
Strengthening Human Resource and
Management X X X X X
0.38
0.36
0.21
0.24
0.11
1.31
MAAIF/Statistics Division
Strengthening production and Management of
Agriculture statistics X X X X X
0.85
1.50
2.30
2.30
3.00
9.95
MAAIF/Statistics Division
Undertake a National Coffee Census, establish
and maintain a national coffee data bank X X X X X -
2.00
1.23
0.46
0.46
4.15 UCDA/MAAIF
ICT and Risk Management X X X X X
0.15
0.50
0.70
0.70
1.00
3.05 MAAIF
Strengthening and improve the Sector M&E
systems X X X X X
3.11
3.00
3.02
3.90
3.90
16.92
MAAIF/APD
Production of quality monitoring and
evaluation data and information on ASSP
implementation
X X X X X
2.28
1.87
2.42
3.29
3.27
13.13 MAAIF/APD
Strengthening Institutional and Organizational
Capacity for M&E X X X X X
0.83
1.13
0.60
0.61
0.63
3.80 MAAIF/APD
Implementing the Agricultural Sector
Communication Strategy (ASCS)
X X X X X
0.56
0.92
0.87
0.60
0.56
3.50
MAAIF/Comm. & Info division(C
&ID)

ASSP 2015/16 to 2019/20 Draft 67
ASSP IDEAL BUDGET
ASSP undertakings Y1 Y2 Y3 Y4 Y5 Year 1 Year 2 Year 3 Year 4 Year 5 Total Lead
Implementer
Establishing a national agricultural
information and communication system X X X X X
0.08
0.06
0.04
0.04
0.08
0.30 MAAIF/C&ID
Strengthening the ASCS framework X X X X X
0.19
0.39
0.40
0.19
0.18
1.34 MAAIF/C&ID
Create an effective and efficient platform for
information and knowledge management X X X X X
0.02
0.09
0.07
0.06
0.04
0.28 MAAIF/C&ID
Creating an enabling environment for
communication X X X X X
0.10
0.13
0.16
0.16
0.11
0.66 MAAIF/C&ID
Support Innovation in Agro-Communication
across the Agro-Value-Chain X X X X X
0.17
0.25
0.20
0.15
0.15
0.92 MAAIF/C&ID
Strategy 2: Improve the capacity for quality
assurance, regulation, food and safety
standards for outputs and products across
crops, livestock and fisheries sub-sectors. X X X X X
6.79
19.90
21.50
28.32
34.10
110.61 MAAIF
Enact new laws and or review existing laws,
regulations and policies to be consistent with
changes in technology, regional integration
commitments and other global/regional
commitments in the crops, livestock and
fisheries sub-sectors. X X X X X
0.20
0.20
0.20
0.20
0.20
1.00 MAAIF
Undertake market surveillance and strengthen
enforce capacity of all existing laws,
regulations, standards and guidelines along the
entire value chain. X X X X X
2.00
2.00
3.00
4.00
6.00
17.00 MAAIF
Create awareness among farmers, traders,
processors and agro exporters about quality
standards and market requirements X X X X X
1.00
2.00
2.00
4.00
6.00
15.00 MAAIF
Train food inspectors in legislation, policy,
modern inspection systems and quality
management systems X X X X X
1.00
1.70
2.30
3.12
4.00
12.12 MAAIF
Strengthen national capacity for quality
assurance, regulation and safety standards to
promote increased trade at all levels.
X X X X X 1.00
1.00
1.00
3.00
3.90
9.90 MAAIF

ASSP 2015/16 to 2019/20 Draft 68
ASSP IDEAL BUDGET
ASSP undertakings Y1 Y2 Y3 Y4 Y5 Year 1 Year 2 Year 3 Year 4 Year 5 Total Lead
Implementer
Fisheries licensing and other regulatory
activities
5.00
5.00
5.00
5.00
20.00 MAAIF/DFR
support fisheries policies and accreditaion
activities
1.00 1.00 1.00 1.00
4.00 MAAIF/DFR
fish quality assurance activities
2.00
2.00
2.00
2.00
8.00 MAAIF/DFR
Livestock diagnostics and quality assurance X X X
1.50
1.50
1.50
1.50
6.00 DDA/MAAIF
Strengthening milk quality assurance system X X X X X
0.09
2.00
2.00
2.00
2.00
8.09 DDA
Support to inspection, quality assurance,
quality control and licensing of fruits exporters X X X X X
1.50
1.50
1.50
2.50
2.50
9.50 MAAIF
Strategy 3: Mainstream Cross-cutting Issues
of Gender, Youth, HIV/AIDS, Environment
and Climate Change, food and nutritional
security
X X X X X 5.20
12.25
15.75
14.65
20.05
67.90
promote the use of gender analysis and gender-
based budgeting in all community-based
development programmes X X X X X
1.10
1.10
1.60
1.60
1.60
7.00
MAAIF/APD
Mainstream promotion of youth engagement in
Agriculture in all sector programmes X X X X X
3.75
3.75
3.75
3.75
15.00
MAAIF
Mainstream adaptation of agricultural
technologies and practices to climate change in
all sector programmes-SLM X X X X X
1.50
2.00
5.00
3.90
5.30
17.70
MAAIF
Implement HIV/AIDS policies and strategies-
in the Agriculture Sector including local
governments and farming communities X X X X X
1.00
1.00
1.00
1.00
1.00
5.00
MAAIF
Improve Food and Nutrition Security through
Enhance consumption of diverse diets at
household level X X X X X
1.60
4.40
4.40
4.40
8.40
23.20 MAAIF
promote awareness on food availability across
Agricultural Zones X X X X X
0.50
2.00
2.00
2.00
2.00
8.50 MAAIF

ASSP 2015/16 to 2019/20 Draft 69
ASSP IDEAL BUDGET
ASSP undertakings Y1 Y2 Y3 Y4 Y5 Year 1 Year 2 Year 3 Year 4 Year 5 Total Lead
Implementer
generate and promote nutrient bio-fortified
varieties across the priority commodities X X X X X
0.10
0.40
0.40
0.40
0.40
1.70 MAAIF
Develop early warning systems to prevent and mitigate shocks affecting nutrition and food security
X X X X X 1.00
2.00
2.00
2.00
6.00
13.00 MAAIF

ASSP 2015/16 to 2019/20 Draft 70
Annex F: Indicative ideal budget (UGX billions), by commodity and thematic area
ASSP IDEAL BUDGET BY COMMODITY AND THEMATIC AREA
ASSP undertakings
Y
1
Y
2
Y
3
Y
4
Y
5 Year 1 Year 2 Year 3 Year 4 Year 5 Total
Lead
Implementer
GRAND TOTAL X X X X X
488.85
1,284.23
1,479.89
1,693.09
2,022.89
6,968.96
Coffee
Improvement of Coffee Research Systems X X X X X
1.00
5.18
5.18
5.18
5.06
21.59 NARO
Promote and support adoption of good
agronomic practice at farm level X X X X X
1.62
1.62
1.62
3.62
4.27
12.74 UCDA
Promote coffee growing and fertiliser use in
new areas and expansion in traditional
coffee growing areas
X X X X X
1.00
1.10
2.00
10.85
16.00
30.95 UCDA
Coffee Agro Extensions and Business
Development Services X X X X X
2.47
2.47
2.47
4.47
5.46
17.35 UCDA
Support and Strengthen Farmer
Organizations X X X X X
2.22
2.32
2.32
2.32
2.32
11.49 UCDA
Management of Coffee Diseases and Pests X X X X X
4.93
4.93
4.93
4.93
6.90
26.60 UCDA/MAAI
F
Promoting Coffee Growing in New Areas
and Expansion in Traditional Coffee
Growing Areas
X X X X X
27.00
47.00
59.00
59.00
59.00
251.00 UCDA
Coffee value addition and Generic
Promotion X X X X X
1.00
1.00
5.00
10.00
10.00
27.00 UCDA Undertake a National Coffee Census,
establish and maintain a national coffee
data bank
X X X X X -
2.00
1.23
0.46
0.46
4.15 UCDA
Sub-Total
41.23
67.61
83.74
100.83
109.46
402.87
Tea
Tea Research X X X X X
1.00
2.86
2.86
3.34
3.37
13.44 NARO

ASSP 2015/16 to 2019/20 Draft 71
ASSP IDEAL BUDGET BY COMMODITY AND THEMATIC AREA
ASSP undertakings
Y
1
Y
2
Y
3
Y
4
Y
5 Year 1 Year 2 Year 3 Year 4 Year 5 Total
Lead
Implementer
Tea Extension Service and farmer
mobilization X X X X X
6.45
6.74
7.22
8.18
8.85
37.43 MAAIF
Tea Area Expansion X X X X X -
2.00
1.50
2.00
2.60
8.10 MAAIF
Tea Policy and establishing a conducive
institutional arrangement X X X X X
0.56
0.50
0.80
0.73
0.82
3.42 MAAIF
Distribution of quality tea plantlets X X X X X
33.76
82.00
103.00
103.00
103.00
424.76 NAADS
Establishment of new Tea Processing
Facilities for value addition X X X X X -
9.00
10.00
10.00
15.40
44.40 MAAIF
Tea Marketing X X X X X
0.18
0.18
0.18
0.18
0.18
0.88 MAAIF
Sub-Total
41.95
103.28
125.56
127.42
134.21
532.42
Rice
Rice Research Programme X X X X X
1.00
2.37
2.37
2.37
2.51
10.62 NARO
Information and Knowledge X X X X X
0.32
0.63
0.63
1.13
1.39
4.10 MAAIF
Mechanisation X X X X X
0.60
0.60
0.60
1.10
1.34
4.24 MAAIF
Fertilization and sustainable soil
management X X X X X
0.40
0.40
0.40
0.90
1.06
3.16 MAAIF
Promote and distribute appropriate post-
harvest technologies X X X X X
0.30
0.30
0.30
0.80
0.92
2.62 MAAIF
Rice Seed production, multiplication and
distribution X X X X X
1.00
3.50
4.30
4.30
4.30
17.40 NAADS
Rice Marketing and value addition X X X X X
0.88
1.00
1.20
2.00
2.62
7.70 MAAIF
Sub-Total
4.50
8.80
9.80
12.60
14.14
49.84

ASSP 2015/16 to 2019/20 Draft 72
ASSP IDEAL BUDGET BY COMMODITY AND THEMATIC AREA
ASSP undertakings
Y
1
Y
2
Y
3
Y
4
Y
5 Year 1 Year 2 Year 3 Year 4 Year 5 Total
Lead
Implementer
Maize
Maize Research Programme X X X X X
3.00
2.36
2.36
2.32
2.44
12.47 NARO
Maize Pest and Disease control X X X X X
1.00
1.42
1.28
1.76
2.27
7.73 MAAIF
Maize Seed production, multiplication and
distribution X X X X X
14.00
63.00
79.00
79.00
79.00
314.00 NAADS
Fertilizer use and promotion X X X X X
1.00
5.00
5.00
5.00
5.00
21.00 MAAIF
Support to improving maize post harvest
handling practices and technologies X X X X X
0.30
1.42
1.28
1.76
2.27
7.03 MAAIF
Maize Marketing and value addition X X X X X
1.00
2.60
4.00
6.00
6.00
19.60 MAAIF
Sub-total
20.30
75.80
92.91
95.84
96.98
381.83
Banana
Banana research and technology
development X X X X X
2.00
2.35
2.35
2.35
2.35
11.40 NARO
Increasing Banana Production and
Productivity(fertilizer promotion) X X X X X
0.80
1.15
1.15
1.65
2.25
7.00 MAAIF
Banana bacterial wilt control X X X X X
2.00
10.00
10.00
10.00
10.00
42.00 MAAIF
Multiplication and distribution of clean
planting materials of Bananas X X X X X
3.30
4.30
5.40
5.40
5.40
23.80 NAADS
Banana Extension Support
3.00
3.00
3.00
3.00
3.00
15.00 MAAIF
Support to value addition through PPPs X X X X X
1.00
2.25
2.25
2.25
2.25
10.00 MAAIF
Sub-Total
12.10
23.05
24.15
24.65
25.25
109.20
Beans

ASSP 2015/16 to 2019/20 Draft 73
ASSP IDEAL BUDGET BY COMMODITY AND THEMATIC AREA
ASSP undertakings
Y
1
Y
2
Y
3
Y
4
Y
5 Year 1 Year 2 Year 3 Year 4 Year 5 Total
Lead
Implementer
Beans Research and technology
development X X X X X
1.65
2.15
2.15
2.15
2.21
10.31 NARO
Beans Extension
1.00
1.00
2.00
2.00
2.00
8.00
Beans Marketing X X X X X
1.00
1.00
2.00
2.00
2.00
8.00 MAAIF
Beans Seed production, multiplication and
distribution X X X X X
8.00
27.00
34.00
34.00
34.00
137.00 NAADS
Pest and Disease control X X X X X
0.80
1.35
1.35
1.85
2.39
7.74 MAAIF
Sub-Total
12.45
32.50
41.50
42.00
42.60
171.05
Cassava
Cassava Research Programme X X X X X
1.70
4.00
4.00
4.00
4.00
17.70 NARO
Cassava Extension X X X X X
1.29
1.42
1.28
1.76
2.27
8.02 MAAIF
production and distribution of clean
planting material of improved cassava
varieties
X X X X X
4.50
19.20
24.00
24.00
24.00
95.70 NAADS
support cassava farmers and SMEs to
engage in profitable processing and
marketing of quality cassava flour and chips
as an agribusiness enterprise
X X X X X
1.00
2.00
3.00
3.00
4.70
13.70
MAAIF
Sub-Total
8.49
26.62
32.28
32.76
34.97
135.12
Fruits and Veg
Fruits Research support programme X X X X X
1.00
2.50
2.50
2.50
2.50
11.00 NARO
Support to inspection, quality assurance,
quality control and licensing of fruits
exporters X X X X X
1.50
1.50
1.50
2.50
2.50
9.50 MAAIF

ASSP 2015/16 to 2019/20 Draft 74
ASSP IDEAL BUDGET BY COMMODITY AND THEMATIC AREA
ASSP undertakings
Y
1
Y
2
Y
3
Y
4
Y
5 Year 1 Year 2 Year 3 Year 4 Year 5 Total
Lead
Implementer
distribution of quality clean citrus seedlings X X X X X
14.50
26.00
33.00
33.00
33.00
139.50 NAADS
distribution of quality clean pineapple
seedlings tolerant to pests and diseases X X X X X
0.60
0.60
0.70
0.70
0.70
3.30 NAADS
distribution of quality clean apple seedlings
tolerant to pests and diseases X X X X X
2.00
5.90
7.40
7.40
7.40
30.10 NAADS
Provision of quality inputs for production of
mangoes X X X X X
7.50
12.00
15.00
15.00
15.00
64.50 NAADS
Provision of inputs for vegetables
production X X X X X
0.60
0.60
0.60
0.60
0.60
3.00 NAADS
Support to fruit processing X X X X X
0.90
29.00
34.88
34.50
34.50
133.78 MAAIF
Fruits and Vegetables pests and disease control X X X X X
1.50
1.50
1.50
2.50
2.50
9.50 MAAIF
Improving grading standards, packaging
and handling of fruits and vegetables X X X X X
0.90
1.00
3.00
3.00
5.10
13.00 MAAIF
Sub-Total
31.00
80.60
100.08
101.70
103.80
417.18
Dairy
Institutional strengthening and creation of
enabling environment policy formulation X X X X X
0.60
0.60
0.60
1.60
2.20
5.60 MAAIF/DDA
Enhancing availability of improved dairy
cattle germplasm X X X X X
2.00
2.00
2.00
2.00
2.00
10.00 NAGRC&DB
Strengthening milk quality assurance system X X X X X
0.09
2.00
2.00
2.00
2.00
8.09 DDA
Building local capacity in feed production
and marketing X X X X X
2.50
3.41
1.60
2.10
3.71
13.32 DDA/MAAIF
Developing the national dairy herd
information management system X X X X X
0.30
0.30
0.30
0.80
1.10
2.80
DDA/MAAIF
& NAGRC

ASSP 2015/16 to 2019/20 Draft 75
ASSP IDEAL BUDGET BY COMMODITY AND THEMATIC AREA
ASSP undertakings
Y
1
Y
2
Y
3
Y
4
Y
5 Year 1 Year 2 Year 3 Year 4 Year 5 Total
Lead
Implementer
Provision of heifers - dairy cattle X X X X X 25.00
25.00
29.50
29.50
29.50
138.50
NAADS/DDA/
NAGRC
Multiplication of pasture seed X X X X X
0.50
0.50
0.50
0.50
0.50
2.50 NAADS
Promoting local consumption and export of
milk and dairy products. X X X X X
0.98
0.98
0.98
0.98
0.98
4.91 DDA
Rehabilitate existing and develop new milk
processing infrastructure X X X X -
2.00
2.50
2.50
2.50
9.50 MAAIF/DDA
Establish a national Animal Feed quality
analysis laboratory-Diary feeds X X X X X
0.32
1.95
0.56
0.56
0.12
3.50 MAAIF logistical support to entebbe dairy training
school X X X
0.25
0.25
0.25
0.25
1.00 DDA
Sub-Total
32.30
38.99
40.79
42.79
44.85
199.72
Meat and Other Livestock Products
Provision of an Enabling Environment for
the livestock sub-sector X X X X X
0.50
0.50
0.50
0.50
0.70
2.70 MAAIF/DAR
Animal Feeds, Forage and Water Security
Enhancement X X X X X
0.80
0.80
0.80
0.80
1.12
4.32 MAAIF/DAR
Animal Feeds Production and Quality
Assurance Enhancement X X X X X
1.98
2.09
1.00
1.08
1.51
7.66 MAAIF/DAR
National Beef Genetics Resource
Development X X X X X
2.00
2.00
2.00
2.00
2.80
10.80 NAGRC&DB
Goat Breed Improvement Schemes X X X X X
1.00
0.65
0.65
0.67
0.94
3.90 MAAIF/DAR
Support Investments in the Poultry Sector X X X X X
1.00
1.00
1.00
0.41
0.57
3.98 MAAIF/DAR
Kuroiler and Indigenous Chicken Resource
Development X X X X X
0.55
0.55
1.11
0.53
0.74
3.47 MAAIF/DAR

ASSP 2015/16 to 2019/20 Draft 76
ASSP IDEAL BUDGET BY COMMODITY AND THEMATIC AREA
ASSP undertakings
Y
1
Y
2
Y
3
Y
4
Y
5 Year 1 Year 2 Year 3 Year 4 Year 5 Total
Lead
Implementer
Develop the sericulture and silk production
value chain X X X X X
1.50
1.50
1.50
1.50
1.50
7.50 MAAIF/DAR
support to apiculture subsector X X X X X
0.30
5.00
5.00
5.00
5.00
20.30 MAAIF/DAR
Uganda Tsetse and Trypanosomiasis
Eradication X X X X X
2.00
5.07
5.30
12.99
15.00
40.36 MAAIF/COC
TU
Eastern Uganda Regional Tsetse and
Trypanosomiasis Eradication X X X X X
2.00
5.00
5.00
5.00
7.00
24.00 MAAIF/COC
TU
North Western Uganda Tsetse Project X X X X X
1.00
9.85
9.95
6.65
9.31
36.76 MAAIF/COC
TU
Strengthening COCTU in Coordination,
Policy and Planning X X X X X
0.09
0.06
0.15
0.05
0.07
0.41 COCTU
Control and Surveillance of Ticks X X X X X
2.21
1.78
1.17
1.10
1.53
7.79 MAAIF
Control of East Coast Fever (ECF) X X X X X
2.36
2.73
2.15
4.04
5.66
16.94 MAAIF
Control of Foot and Mouth Disease (FMD) X X X X X
10.00
15.00
15.00
15.00
20.00
75.00 MAAIF
Control of Rift Valley Fever X X X X X
1.11
1.33
1.11
0.92
0.83
5.30 MAAIF
Control of Rabies X X X X X
2.20
2.16
2.14
1.12
0.90
8.52 MAAIF
control of PPR
3.00
3.00
3.00
3.00
3.00
15.00 MAAIF
Control HPAI -
2.00
2.00
2.00
2.00
8.00 MAAIF
Control of Newcastle Disease
3.00
3.00
3.00
3.00
3.00
15.00 MAAIF
Control of African Swine Fever (ASF) X X X X X
3.00
3.00
3.00
3.00
3.00
15.00 MAAIF
Capacity Building for Animal Disease
Surveillance and Control Systems in
Uganda
X X X X X
0.30
0.30
0.50
0.50
0.50
2.10 MAAIF

ASSP 2015/16 to 2019/20 Draft 77
ASSP IDEAL BUDGET BY COMMODITY AND THEMATIC AREA
ASSP undertakings
Y
1
Y
2
Y
3
Y
4
Y
5 Year 1 Year 2 Year 3 Year 4 Year 5 Total
Lead
Implementer
Capacity Building for Enforcement of
Veterinary Regulations in Uganda X X X X X
0.30
0.30
0.50
0.50
0.50
2.10 MAAIF
Control of Human and Animal Brucellosis X X X X X
0.30
0.30
0.50
0.50
0.50
2.10 MAAIF
Provision of beef cattle X X X X X
0.90
3.00
3.70
3.70
3.70
15.00 NAADS
Multiplication of pasture seed X X X X X
0.50
0.50
0.50
0.50
0.50
2.50 NAADS
Provision of improved goats X X X X X
2.00
2.00
2.00
2.00
2.00
10.00 NAADS
Provision of poultry units and piglets X X X X X
4.00
9.80
12.30
12.30
12.30
50.70 NAADS
Creating a buffer stock/animal handling
grounds to support beef
processing/abattoirs
X X X X X
1.00
58.00
50.00
50.00
50.00
209.00 MAAIF
Support to animal breeding infrasrtucture X X X
-
8.00
8.00
8.00
8.00
32.00 NAGRC&DB
transport and logistical support for animal
breeding X X X
1.75
1.75
1.75
1.75
7.00 NAGRC&DB
logistical support to laboratory and
technicians X X X
1.50
1.50
1.50
1.50
6.00 MAAIF/DDA
support to liquid nitrogen cold chain X X X
-
0.65
0.65
0.10
-
1.40 NAGRC&DB
Livestock diagnostics and quality assurance X X X
1.50
1.50
1.50
1.50
6.00 DDA/MAAIF
Establishment of Disease Control
infrastructure and operationalization of
effective disease control
-
Establishment of livestock disease control
infrastructure in LGs X X X X X
0.40
17.00
17.00
17.00
17.00
68.40 MAAIF
Rehabilitation or construction and
equipping of 4 quarantine stations, 14
holding grounds + 14 border posts
X X X X X
2.23
2.23
2.23
2.23
4.00
12.94 MAAIF

ASSP 2015/16 to 2019/20 Draft 78
ASSP IDEAL BUDGET BY COMMODITY AND THEMATIC AREA
ASSP undertakings
Y
1
Y
2
Y
3
Y
4
Y
5 Year 1 Year 2 Year 3 Year 4 Year 5 Total
Lead
Implementer
Provision of proper transport and cold
chain equipment for the Veterinary Offices X X X X X -
2.76
2.76
2.76
5.53
13.82 MAAIF Development and implementation of
prevention and control strategy for major
diseases
X X X X X
0.17
0.17
0.17
0.17
0.17
0.86 MAAIF
Creation and implementation of individual
animal (cattle) herd and flock (goat and
poultry) identification for traceability
X X X X X
1.98
1.98
1.98
1.98
1.98
9.90 MAAIF
Renovate and equip the National
Laboratory and establish 12 Regional
Laboratory facilities
X X X
0.82
0.82
0.82
2.47 MAAIF
Personnel and operational costs of the
national and regional laboratoris
infrastructure
X X X X X
1.37
1.37
1.37
1.37
1.37
6.84 MAAIF
Sub-Total
57.87
181.99
176.27
178.72
198.97
793.82
Fish
support to restocking of water bodies X X X X X -
3.75
3.75
3.75
3.75
15.00 MAAIF/DFR
Developing the Fishery of Small Pelagic
Fishes X X X X X
1.38
1.38
1.38
1.88
2.43
8.43 MAAIF/DFR
Promoting commercial aquaculture X X X X X
2.10
2.10
2.00
2.60
3.44
12.24 MAAIF/DFR
Infrastructure development along the value
chain X X X X X
1.20
1.20
1.20
1.70
2.18
7.48 MAAIF/DFR
Strengthen monitoring on all water bodies X X X X X
2.00
4.00
5.00
5.00
5.00
21.00 MAAIF/DFR
Control of the new breed of weed and water
hyacinth X X X X X -
1.45
1.45
1.75
2.15
6.80 MAAIF/DFR
Fish Inputs( Fingerlings and feeds)
20.00
20.00
20.00
20.00
80.00 MAAIF/DFR

ASSP 2015/16 to 2019/20 Draft 79
ASSP IDEAL BUDGET BY COMMODITY AND THEMATIC AREA
ASSP undertakings
Y
1
Y
2
Y
3
Y
4
Y
5 Year 1 Year 2 Year 3 Year 4 Year 5 Total
Lead
Implementer
Fisheries aquaculture infrastructure
12.00
12.00
12.00
12.00
48.00 MAAIF/DFR
Fisheries Marketing and value addition
infrastructure
13.00
13.00
13.00
13.00
52.00 MAAIF/DFR
Fisheries licensing and other regulatory
activities
5.00
5.00
5.00
5.00
20.00 MAAIF/DFR
support fisheries policies and accreditaion
activities
1.00 1.00 1.00 1.00
4.00 MAAIF/DFR
fish quality assurance activities
2.00
2.00
2.00
2.00
8.00 MAAIF/DFR
Extension for fish farming
2.50
2.50
2.50
2.50
10.00 MAAIF/DFR
Sub-Total
6.68
69.38
70.28
72.18
74.45
292.95
Cotton
Strengthening cotton research X X X X X
1.00
2.17
2.17
2.14
2.14
9.62 NARO
Improving markets through formation of
farmers’ associations and capacity building X X X X X
0.78
2.00
2.00
2.00
2.00
8.78 CDO
cotton extension services X X X X X
2.00
3.00
3.00
4.50
6.75
19.25 CDO
Cotton inputs support to farmers X X X X X
1.25
1.25
1.25
1.25
1.25
6.25 CDO
promotion of domestic value addition to lint X X X X X -
4.80
6.00
7.50
7.62
25.92 CDO
support to mechanisation in cotton
1.00
2.50
2.50
2.50
2.50
11.00
cotton infrastructure development
1.00
3.50
3.50
3.50
3.50
15.00 CDO
Sub-Total
7.03
19.22
20.42
23.39
25.76
95.82

ASSP 2015/16 to 2019/20 Draft 80
ASSP IDEAL BUDGET BY COMMODITY AND THEMATIC AREA
ASSP undertakings
Y
1
Y
2
Y
3
Y
4
Y
5 Year 1 Year 2 Year 3 Year 4 Year 5 Total
Lead
Implementer
Cocoa
Strengthening cocoa research and
technology development X X X X X
1.96
2.20
2.20
2.20
2.20
10.78 NARO
Cocoa Extension Services X X X X X
1.10
0.89
0.89
1.34
2.01
6.25 MAAIF
Cocoa seedlings provision X X X X X
3.10
3.10
3.10
3.10
3.10
15.50 NAADS/MAA
IF
Cocoa marketing and Value addition
support X X X X X
1.45
1.53
1.59
1.66
1.72
7.95 MAAIF
Sub-Total 7.62 7.73 7.79 8.31 9.04
40.48
Oil Palm and Oil Seeds
Oil Palm
Oil Palm research and technology
development X X X X X
2.50
3.00
3.00
3.00
3.00
14.50 NARO
Land identification and acquisition X X X X X
10.00
20.00
15.00
25.00
25.00
95.00 MAAIF
Plantation establishment and development X X X X X
2.00
9.00
9.00
10.00
10.00
40.00 MAAIF
Reform and strengthen agricultural
extension X X X X X
1.00
1.00
1.00
1.00
1.40
5.40 MAAIF
Strengthen the institutional capacity of
MAAIF X X X X X
0.30
0.30
0.30
0.30
0.42
1.62 MAAIF
Strengthen the capacity for quality
assurance, regulation and food safety
standards
X X X X X
0.20
0.20
-
-
-
0.40 MAAIF
Provision of critical farm inputs for oil
palm X X X X X
1.30
1.30
1.30
1.30
1.30
6.50 MAAIF
Oil Seed
Oil seed Research Programme X X X X X
1.00
2.59
2.59
2.59
2.82
11.58 NARO
enhance oilseed production and
productivity X X X X X
1.48
1.52
1.58
2.12
2.77
9.46 MAAIF

ASSP 2015/16 to 2019/20 Draft 81
ASSP IDEAL BUDGET BY COMMODITY AND THEMATIC AREA
ASSP undertakings
Y
1
Y
2
Y
3
Y
4
Y
5 Year 1 Year 2 Year 3 Year 4 Year 5 Total
Lead
Implementer
Oil seed provision X X X X X
1.74
1.74
1.74
1.74
1.74
8.70 NAADS/MAA
IF
institutional and enabling environment
strengthening X X X X X
0.22
0.27
0.25
0.75
0.85
2.33 MAAIF
Facilitate domestic, regional and
international trade in Vegetable Oil
Products
X X X X X
0.80
0.80
0.80
0.80
0.80
4.00 MAAIF
Sub-Total
22.54
41.72
36.55
48.59
50.09
199.49
Agricultural Extension
Wage costs of extension staff at district X X X X X
16.28
50.00
60.00
79.00
112.00
317.28 LG
Non-wage/operational costs at district level X X X X X
14.14
45.00
100.00
110.00
110.00
379.14 LG
Farmer education and refresher trainings of
extension staff X X X X X
2.00
2.00
2.00
2.00
8.00 DAES
farmer instititutional strenthening -
2.50
2.50
2.50
2.50
10.00
Institutional strengthening of extension
systems - Policy X X X X X -
0.50
0.50
0.50
0.50
2.00 DAES
Promote strategic partnerships between
research and technology development and
extension services at all levels
X X X X X
1.00
1.00
1.00
1.40
4.40 DAES
agribusiness support services X X X X X
1.00
4.00
4.00
6.00
8.40
23.40
DAI & ED /
NAADS
support to extension information systems
and ICT -
1.50
1.50
1.50
1.50
6.00
Reform and strengthen agricultural
extension(oil palm) X X X X X
1.00
1.00
1.00
1.00
1.40
5.40 MAAIF
Technology promotion (production and
agro-processing) and farmer access to
information/ knowledge
X X X X X
5.46
9.00
11.05
15.21
21.29
62.01 DAES/NARO

ASSP 2015/16 to 2019/20 Draft 82
ASSP IDEAL BUDGET BY COMMODITY AND THEMATIC AREA
ASSP undertakings
Y
1
Y
2
Y
3
Y
4
Y
5 Year 1 Year 2 Year 3 Year 4 Year 5 Total
Lead
Implementer
Technology uptake grants for farmers,
farmer groups and agro-processors X X X X X
3.57
5.00
6.50
8.45
11.83
35.35 DAES
Support to harmonize the farmers by
UNFFE X X X X X -
5.00
5.00
5.00
5.00
20.00 NAADS
support to youth in agriculture
3.75
3.75
3.75
3.75
15.00
Sub-Total
41.46
130.25
198.80
235.91
281.57
887.99
Agricultural Research Agricultural technologies, innovations
and management practices (TIMPS)
generation
Breeding of climate smart – nutrient
enriched farmer preferred varieties and
breeds X X X X X
4.49
4.54
4.66
4.77
4.94
23.40 NARO
Develop improved higher yielding crop
varieties and livestock breeds X X X X X
4.71
4.85
4.98
5.13
5.34
25.01 NARO
Nutrient fortified and transgenic crops
(Bananas, Maize, Irish potatoes) X X X X X
4.14
4.23
4.33
4.42
4.55
21.68 NARO
Characterizing plant and animal disease
strains and agents X X X X X
3.57
3.62
3.64
3.71
3.79
18.33 NARO
Develop and release disease, pest and
drought resistant varieties/breeds X X X X X
4.71
4.85
4.98
5.13
5.34
25.01 NARO
Develop non-conventional animal feed X X X X X
4.14
4.23
4.33
4.42
4.55
21.68 NARO
Conduct on-station and multi-location
evaluation of generated lines X X X X X
4.14
4.23
4.33
4.42
4.55
21.68 NARO
On-farm trials and national variety
evaluation trials for VCU and DUS X X X X X
4.14
4.23
4.33
4.42
4.55
21.68 NARO

ASSP 2015/16 to 2019/20 Draft 83
ASSP IDEAL BUDGET BY COMMODITY AND THEMATIC AREA
ASSP undertakings
Y
1
Y
2
Y
3
Y
4
Y
5 Year 1 Year 2 Year 3 Year 4 Year 5 Total
Lead
Implementer
Strengthening the functioning of the
National Agricultural Research System
(NARS) by identifying and building key
human resource capacity to support the
sector
Conduct an HR capacity needs assessment X
0.50
0.50 NARO
Develop and implement a staff recruitment
and retention strategy X
0.25
0.25
0.50 NARO
Develop and implement a mentoring
programme for junior scientists X X X X X
1.00
1.00
1.00
1.00
1.00
5.00 NARO
Conduct short and long term training on
Adaptive Research for staff X X X X X
1.41
3.00
4.00
4.20
4.35
16.96 NARO
Establish an effective staff performance
appraisal system X
0.20
0.20 NARO
Support to NARO scientists X X X X
5.00
5.00
5.00
5.00
20.00
Develop and implement a policy and
regulatory framework for biotechnology
in agriculture.
Fast tracking the laws and standards of
GMOs production and utilization X X X X X
0.20
0.40
0.40
0.40
0.40
1.80 NARO
develop and enhance capacity for
implementing research guidelines and
procedures on biotechnology use and
biosafety X X X X X
0.20
0.50
0.50
0.50
0.50
2.20 NARO
Develop and promote technologies and
protocols for value addition in
agriculture and agro processing
Conducting product development and end
user marketability tests to enhance
utilization options for a range of strategic
and priority commodities X X X X X
3.60
3.60
3.60
3.85
3.80
18.44 NARO

ASSP 2015/16 to 2019/20 Draft 84
ASSP IDEAL BUDGET BY COMMODITY AND THEMATIC AREA
ASSP undertakings
Y
1
Y
2
Y
3
Y
4
Y
5 Year 1 Year 2 Year 3 Year 4 Year 5 Total
Lead
Implementer
Developing and validating technologies and
protocols for agro-processing including
protocols for enhancing shelf life,uniform
ripening, stability X X X X X
3.00
3.00
3.00
3.00
3.00
15.00 NARO
Testing and ascertain thresholds on a range
of parameters for food safety and quality
assurance and validate capacity for
compliance X X X X X
1.80
1.80
1.80
1.58
1.84
8.83 NARO
Development of processing/packaging tools
and equipment X X X X X
1.40
5.80
6.00
6.00
6.00
25.20 NARO
Strengthening capacity of NARI
institutes involved in input supply
Enhance Breeder/foundation seed
production and supply X X X X X
0.07
0.27
0.27
0.27
0.27
1.16 NARO
Strengthen/establish agribusiness
incubation service centres X X X X X
0.20
4.00
4.00
3.20
22.00
33.40 NARO
Sub-Total 47.89 63.17 65.17 65.40 86.01
327.65
Water for agricultural production
(irrigation, water for livestock,
aquaculture).
Strengthen the legal and institutional
framework and capacity for developing
water for agricultural production
development of irrigation master plan,
guidelines, action plans, framework and
principles for dissemination X
0.40
0.20
0.60 DAI & WFP
preparation of guidelines for appraisal and
design of small-scale farmer-based
irrigation schemes X
0.20
0.20
0.40 DAI & WFP
development of appropriate mechanisms for
cost sharing and funding of water for
agricultural production-based interventions X
0.20
0.20
0.40 DAI & WFP

ASSP 2015/16 to 2019/20 Draft 85
ASSP IDEAL BUDGET BY COMMODITY AND THEMATIC AREA
ASSP undertakings
Y
1
Y
2
Y
3
Y
4
Y
5 Year 1 Year 2 Year 3 Year 4 Year 5 Total
Lead
Implementer
Development of guidelines for a Community
Based Management System (CBMS) for
operation and maintenance of water for
agricultural production facilities and for
WUAs X
0.10
0.10
0.20 DAI & WFP
Institutionalize Water User Associations
(WUAs), cooperative societies and other
farmer groups in regulation and
management of irrigated agriculture X
0.10
0.10
0.20 DAI & WFP
establish technical support units to LGs in
agricultural water management (AWM) X X X X
0.30
0.50
0.50
0.50
1.80 DAI & WFP
Promote the uptake and use of the adapted
small scale irrigation technologies/options X X X X
0.50
0.50
0.50
0.50
2.00 DAI & WFP
Investing in modern irrigation
technologies through construction of
large and promotion of small scale
irrigation technologies in line with the
zoning strategy and development of large
and medium water reservoirs.
Evaluation and rehabilitation of nine (9)
existing public irrigation schemes of Atera,
Kiige, Labori, Ongom, Olweny and Odina X X X X X
1.00
20.00
28.00
30.00
40.00
119.00 DAI & WFP
Construction of Rhino Camp in Arua
District, Labwor in Moroto District,Katete
in Kanungu District, Biiso in Bullisa
District,Pabbo in Amuru District , Namalu,
Kibimba-Gomba,Musamya, Torchi in Oyam
District among others X X X X
3.00
30.00
30.00
30.00
65.00
158.00 DAI & WFP
carrying out feasibility studies and design of
3 other irrigation schemes covering an area
of 6,900 ha-Acomai irrigation Scheme,
Atari Irrigation scheme and Namatala
Irrigation Scheme X X X
5.80
5.80 DAI & WFP

ASSP 2015/16 to 2019/20 Draft 86
ASSP IDEAL BUDGET BY COMMODITY AND THEMATIC AREA
ASSP undertakings
Y
1
Y
2
Y
3
Y
4
Y
5 Year 1 Year 2 Year 3 Year 4 Year 5 Total
Lead
Implementer
Establish 11,000 ha of commuinity-
based/strategic medium to large scale
schemes at Naigomwa in Iganga District
and Igogero in Bugiri Disrtict X X
11.70
24.00
35.70 DAI & WFP
Promotion of small scale irrigation
technologies by establishing at least a
demonstration unit per district per year
across the country X X X X X
0.20
1.00
1.00
1.00
3.00
6.20 DAI & WFP
Adapt and make affordable small scale
irrigation technologies/options including
garden hose, drip systems X X X X X
0.10
1.50
1.50
1.50
3.50
8.10 DAI & WFP
Promote rainwater harvesting and
storage at household and farm levels for
agriculture.
Rehabilitation/expansion of 102 public
Valley dams X X X X X
0.10
1.00
1.00
1.00
2.00
5.10 DAI & WFP
Rehabilitation/expansion of 195 valley tanks X X X X X
0.10
0.80
0.74
0.80
0.80
3.24 DAI & WFP
Construction of 1,200 new valley tanks X X X X X
0.50
4.00
4.00
4.20
12.00
24.70 DAI & WFP
Establish 4 commercial aquaculture sites of
minimum 10 ponds X X X
0.60
1.20
2.40
4.20 DAI & WFP
Establishing of two (2) well-planned
Aquaculture Parks (APs) in Mpologoma
catchment and Olweny catchment X
1.70
1.70
3.40 DAI & WFP
Establish four three (3) fish farms each with
four (4) ponds in the districts of Mbarara,
Gulu and Sironko X X X
1.20
1.20
1.80
4.20 DAI & WFP
Development of two (2) landing sites in
Kaliro and Amolatar districts X X
1.00
1.31
2.31 DAI & WFP
Develop and Promote Rainwater harvesting
technologies and Best Practices for
smallholder farmers X X X X X
0.10
0.50
0.50
0.60
0.60
2.30 DAI & WFP
Sub-total
6.10
67.90
69.54
85.20
159.11
387.85

ASSP 2015/16 to 2019/20 Draft 87
ASSP IDEAL BUDGET BY COMMODITY AND THEMATIC AREA
ASSP undertakings
Y
1
Y
2
Y
3
Y
4
Y
5 Year 1 Year 2 Year 3 Year 4 Year 5 Total
Lead
Implementer
Agricultural mechanisation
Promoting acquisition and utilization of
agricultural mechanization technologies
using a series of Public- Private-
Partnership (PPP)
x x x x x
3.00
19.14
26.00
28.00
34.00
110.14
DAI & WFP
Promote sustainable local manufacture and
maintenance of suitable agricultural
machinery for farm production and
postharvest processing
x x x x x
0.50
1.08
0.55
0.49
0.60
3.23
DAI & WFP
Formulate and implement incentive
frameworks for acquisition and financing of
labour saving technologies.
x x x x x
0.50
0.61
0.55
0.39
0.35
2.40 DAI & WFP
Promoting the strengthening of capacity for
technical information acquisition,
equipment evaluation and sustainable
operation of agricultural machinery
x x x x x
0.50
0.66
0.38
0.36
0.34
2.24
DAI & WFP
Establish an agricultural mechanization
resource centre for training machinery
operators, generating technical
information, and provision of referral
workshop services for testing/ evaluating
agricultural machinery.
x x x x x
1.00
3.89
4.74
4.69
6.00
20.32
DAI & WFP
Strengthen the capacity of technical and
vocational institutions for training
agricultural mechanics and technicians
x x x x x
2.17
3.89
4.74
4.69
4.69
20.18 DAI & WFP
Strengthen collaboration with the National
Bureau of Standards to eliminate
importation and trade of substandard
agricultural mechanisation equipments
x x x x x
0.09
0.79
0.15
0.15
0.15
1.33
DAI & WFP
Sub-Total
7.76
30.06
37.11
38.78
46.14
159.84
Fertiliser

ASSP 2015/16 to 2019/20 Draft 88
ASSP IDEAL BUDGET BY COMMODITY AND THEMATIC AREA
ASSP undertakings
Y
1
Y
2
Y
3
Y
4
Y
5 Year 1 Year 2 Year 3 Year 4 Year 5 Total
Lead
Implementer
Support to the Fertilizer Market
Development Council (FMDC) X X X X X 0.841 0.331 0.331 0.331 0.331 2.17 MAAIF
review of the national fertilizer policy and
implementing regulations X X X X X 0.4 0.3 0.70 MAAIF
Credit support for Bulk Purchase and Risk
Management Fund X X X X 3.3 4.8 5.6255 0.003 13.73 MAAIF
update soil fertility management and
fertilizer use recommendations X X X X X 0.141 0.3333 0.3065 0.2415 0.0455 1.07 MAAIF
develop soil fertility management and
fertilizer use extension materials X X X X X 0.122 0.01 0.01 0.01 0.077 0.23 MAAIF
increase number of agro-dealers trained
about fertilizer and with enhanced business
skills X X X X X 0.304 0.304 0.304 0.304 0.304 1.52 MAAIF
Increase number of Technology Transfer
Agents (TTAs) with fertilizer knowledge and
matching inputs X X X X X 0.136 0.136 0.136 0.136 0.136 0.68 MAAIF
Increase number of farmers with fertilizer
knowledge and matching inputs X X X X X 0.4 0.4 0.4 0.4 0.4 2.00 MAAIF
Crop Production Risk Management X X X X X 0.05 0.44 0.86 1.1 0.32 2.77 MAAIF
Capacity Building Project X X X X X 1.875 2.445 4.155 2.455 5.855 16.79 MAAIF
Support Physical Infrastructure Project X X X X X 0 0 0 5 15 20.00 MAAIF
Development of Domestic Resources for
Soil Productivity Enhancement X X X X X 0 0 0 20 80 100.00 MAAIF
Provision of fertiliser inputs to farmers X X X X X 3.15 3.15 3.15 3.15 3.15 15.75 NAADS
Sub-Total 7.419 11.1493 14.4525 38.753 105.6215
177.395
3
Institutional and enabling environment
strengthening
Institutional Strengthening and Capacity
Building

ASSP 2015/16 to 2019/20 Draft 89
ASSP IDEAL BUDGET BY COMMODITY AND THEMATIC AREA
ASSP undertakings
Y
1
Y
2
Y
3
Y
4
Y
5 Year 1 Year 2 Year 3 Year 4 Year 5 Total
Lead
Implementer
Construction of MAAIF headquaters
Building in Kampala X X X
1.00
5.00
10.00
17.00
43.30
76.30 MAAIF
Construction of administrative
infrastructure for selected district
production departments
X X X X X
0.40
6.00
6.00
6.00
6.00
24.40 MAAIF
Human Resource Development-
Training/capacity building X X X X X
1.00
2.00
2.00
3.00
3.00
11.00 MAAIF
Strengthening Institutional Linkages and
Networking Capacity X X X X X
1.00
1.00
1.00
1.00
1.00
5.00 MAAIF
improving access to working facilities, tools
and equipment for MAAIF, its Agencies and
local governments.
X X X X X
2.90
3.00
3.90
4.00
4.00
17.80 MAAIF
Sub-Total
6.30
17.00
22.90
31.00
57.30
134.50
Transform ATIs (Bukalasa College and
Fisheries Training Institute), into
institutions that are responsive to
knowledge and skill market in the
extension service.
Bukalasa Agricultural College
Bukalasa
College
Curriculum review
X X X X X
0.05
0.05
0.20
0.20
0.05
0.55
Bukalasa
College
Human resources strengthening
X X X X X
0.10
0.30
0.50
0.50
0.50
1.90
Bukalasa
College
Infrastructural rehabilitation/development
X X X X X
0.25
1.50
1.50
1.50
1.50
6.25
Bukalasa
College

ASSP 2015/16 to 2019/20 Draft 90
ASSP IDEAL BUDGET BY COMMODITY AND THEMATIC AREA
ASSP undertakings
Y
1
Y
2
Y
3
Y
4
Y
5 Year 1 Year 2 Year 3 Year 4 Year 5 Total
Lead
Implementer
Restructuring and Operationalization
X X
0.10
0.10
-
-
-
0.20
Bukalasa
College
Fisheries Training Institute
Fisheries
Training
Institute
Curriculum review
X X X X X
0.05
0.05
0.20
0.20
0.05
0.55
Fisheries
Training
Institute
Human resources strengthening
X X X X X
0.10
0.30
0.50
0.50
0.50
1.90
Fisheries
Training
Institute
Infrastructural rehabilitation/development
X X X X X
0.25
1.50
1.50
1.50
1.50
6.25
Fisheries
Training
Institute
Restructuring and Operationalization
X X
0.10
0.10
-
-
-
0.20
Fisheries
Training
Institute
Sub-Total
1.00
3.90
4.40
4.40
4.10
17.80
Support to the National Farmers’
Leadership Centre (NFLC)
Infrastructure Development and
Rehabilitation X X X X X 0.5 0.5 0.5 0.6 0.5 2.6 NFLC
Equipment and Tooling X X X X X 0.2 0.3 0.32 0.4 0.5 1.72 NFLC
Training, Administration and Services X X X X X 0.1 0.2 0.3 0.5 0.5 1.6 NFLC
Sub-Total 0.8 1 1.12 1.5 1.5 5.92
Support to District Agriculture Training
and Information Centres (DATICS) MAAIF

ASSP 2015/16 to 2019/20 Draft 91
ASSP IDEAL BUDGET BY COMMODITY AND THEMATIC AREA
ASSP undertakings
Y
1
Y
2
Y
3
Y
4
Y
5 Year 1 Year 2 Year 3 Year 4 Year 5 Total
Lead
Implementer
Review and development of curriculum X X X X X
0.42
0.42
1.00
1.00
1.00
3.84 MAAIF
Infrastructure Development X X X X X
4.00
4.00
4.00
4.00
16.00 MAAIF
Sub-Total
0.42
4.42
5.00
5.00
5.00
19.84
Support to Agriculture Sector Policy and
Planning
Capacity building for MAAIF staff in Policy
and Planning X X X X X
0.40
0.60
0.60
0.60
0.60
2.80 MAAIF/APD
Production of bankable project proposals to
support ASSP implementation X X X X X
0.30
0.40
0.40
0.40
0.40
1.90 MAAIF/APD
Undertake budget execution assessment
exercises X X X X X
1.00
1.10
1.10
1.10
1.10
5.40 MAAIF/APD
Link ASSP implementation with regional
agriculture policy undertakings (EAC,
COMESA, CADAP, etc) X X X X X
0.30
0.40
0.40
0.40
0.40
1.90 MAAIF/APD
Cordinate production of Agricultural Sector
mandatory policy/planning/budget papers X X X X X
0.50
0.50
0.50
0.50
0.50
2.50 MAAIF/APD
Sub-Total
2.50
3.00
3.00
3.00
3.00
14.50
Agricultural Statistics, ICT and Risk
Management
Strengthening the Coordination and
Management of agriculture sector statistical
system X X X X X
0.30
0.50
0.60
0.70
0.90
3.00
MAAIF/Statis
tics Division
Improve usability and dissemination of
agriculture statistics X X X X X
0.36
0.32
0.16
0.16
0.28
1.28
MAAIF/Statis
tics Division

ASSP 2015/16 to 2019/20 Draft 92
ASSP IDEAL BUDGET BY COMMODITY AND THEMATIC AREA
ASSP undertakings
Y
1
Y
2
Y
3
Y
4
Y
5 Year 1 Year 2 Year 3 Year 4 Year 5 Total
Lead
Implementer
Mainstreaming Quality Assurance in
Agriculture statistical production X X X X X
0.37
-
0.11
0.26
0.10
0.84
MAAIF/Statis
tics Division
Strengthening Human Resource and
Management X X X X X
0.38
0.36
0.21
0.24
0.11
1.31
MAAIF/Statis
tics Division
Strengthening production and Management
of Agriculture statistics X X X X X
0.85
1.50
2.30
2.30
3.00
9.95
MAAIF/Statis
tics Division
ICT and Risk Management X X X X X
0.15
0.50
0.70
0.70
1.00
3.05
Sub-Total
2.41
3.18
4.08
4.37
5.39
19.43
Strengthening and improve the Sector
M&E systems
Production of quality monitoring and
evaluation data and information on ASSP
implementation
X X X X X
2.28
1.87
2.42
3.29
3.27
13.13 MAAIF/APD
Strengthening Institutional and
Organizational Capacity for M&E X X X X X
0.83
1.13
0.60
0.61
0.63
3.80 MAAIF/APD
Sub-Total
3.11
3.00
3.02
3.90
3.90
16.92
Implementing the Agricultural Sector
Communication Strategy (ASCS)
MAAIF/Com
m. & Info
division(C
&ID)
Establishing a national agricultural
information and communication system X X X X X
0.08
0.06
0.04
0.04
0.08
0.30
MAAIF/C&I
D

ASSP 2015/16 to 2019/20 Draft 93
ASSP IDEAL BUDGET BY COMMODITY AND THEMATIC AREA
ASSP undertakings
Y
1
Y
2
Y
3
Y
4
Y
5 Year 1 Year 2 Year 3 Year 4 Year 5 Total
Lead
Implementer
Strengthening the ASCS framework X X X X X
0.19
0.39
0.40
0.19
0.18
1.34
MAAIF/C&I
D
Create an effective and efficient platform
for information and knowledge management X X X X X
0.02
0.09
0.07
0.06
0.04
0.28
MAAIF/C&I
D
Creating an enabling environment for
communication X X X X X
0.10
0.13
0.16
0.16
0.11
0.66
MAAIF/C&I
D
Support Innovation in Agro-Communication
across the Agro-Value-Chain X X X X X
0.17
0.25
0.20
0.15
0.15
0.92
MAAIF/C&I
D
Sub-Total
0.56
0.92
0.87
0.60
0.56
3.50
Improve the capacity for quality
assurance, regulation, food and safety
standards for outputs and products
across crops, livestock and fisheries sub-
sectors.
Enact new laws and or review existing laws,
regulations and policies to be consistent
with changes in technology, regional
integration commitments and other
global/regional commitments in the crops,
livestock and fisheries sub-sectors. X X X X X
0.20
0.20
0.20
0.20
0.20
1.00 MAAIF
Undertake market surveillance and
strengthen enforce capacity of all existing
laws, regulations, standards and guidelines
along the entire value chain. X X X X X
2.00
2.00
3.00
4.00
6.00
17.00 MAAIF
Create awareness among farmers, traders,
processors and agro exporters about quality
standards and market requirements X X X X X
1.00
2.00
2.00
4.00
6.00
15.00 MAAIF
Train food inspectors in legislation, policy,
modern inspection systems and quality
management systems X X X X X
1.00
1.70
2.30
3.12
4.00
12.12 MAAIF

ASSP 2015/16 to 2019/20 Draft 94
ASSP IDEAL BUDGET BY COMMODITY AND THEMATIC AREA
ASSP undertakings
Y
1
Y
2
Y
3
Y
4
Y
5 Year 1 Year 2 Year 3 Year 4 Year 5 Total
Lead
Implementer
Strengthen national capacity for quality
assurance, regulation and safety standards
to promote increased trade at all levels.
X X X X X
1.00
1.00
1.00
3.00
3.90
9.90 MAAIF
Upscaling use of improved seeds and
planting material Extend the dealer network/Support to
UNADA X X X X X
0.05
0.25
0.25
0.25
0.25
1.04 MAAIF
Improve farmer knowledge of new varieties X X X X X
1.03
1.03
1.03
1.03
1.03
5.16 MAAIF
Support to seed companies to test and
promote new varieties and cultivars X X X X X
0.34
0.34
0.34
0.84
0.84
2.70 MAAIF
Strengthen the national certification and
regulation system to guarantee the
quality of seeds and other agro-inputs.
X X X X X
5.00
9.00
12.00
12.00
14.00
52.00 MAAIF
Strengthening and rationalizing the
Department of Regulation and
Certification’s seed services Improve phytosanitary control at entry
points X X X X X
0.74
1.04
0.24
0.24
0.24
2.50 DCI & C
Strengthen Namelere laboratory X X X
0.80
0.50
-
0.30
-
1.60
NARO/DCI &
C
Transport to improve communication and
service delivery X
0.44
-
-
-
-
0.44 DCI & C Improve data and other information on the
seed industry to support better policy and
program plans, both by government and by
the private sector
X X X X X
0.20
0.20
0.20
0.20
0.20
1.00 DCI & C
Promote seed quality insurance X X X X X
2.65
2.02
2.02
1.22
1.22
9.13 DCI & C
Achieve ISTA accreditation and maintain
OECD Seed Schemes accreditation X X X X X
0.10
0.10
0.10
0.10
0.10
0.50 DCI & C
Implement PVP X X X X X
0.05
0.05
0.05
0.05
0.05
0.25 DCI & C
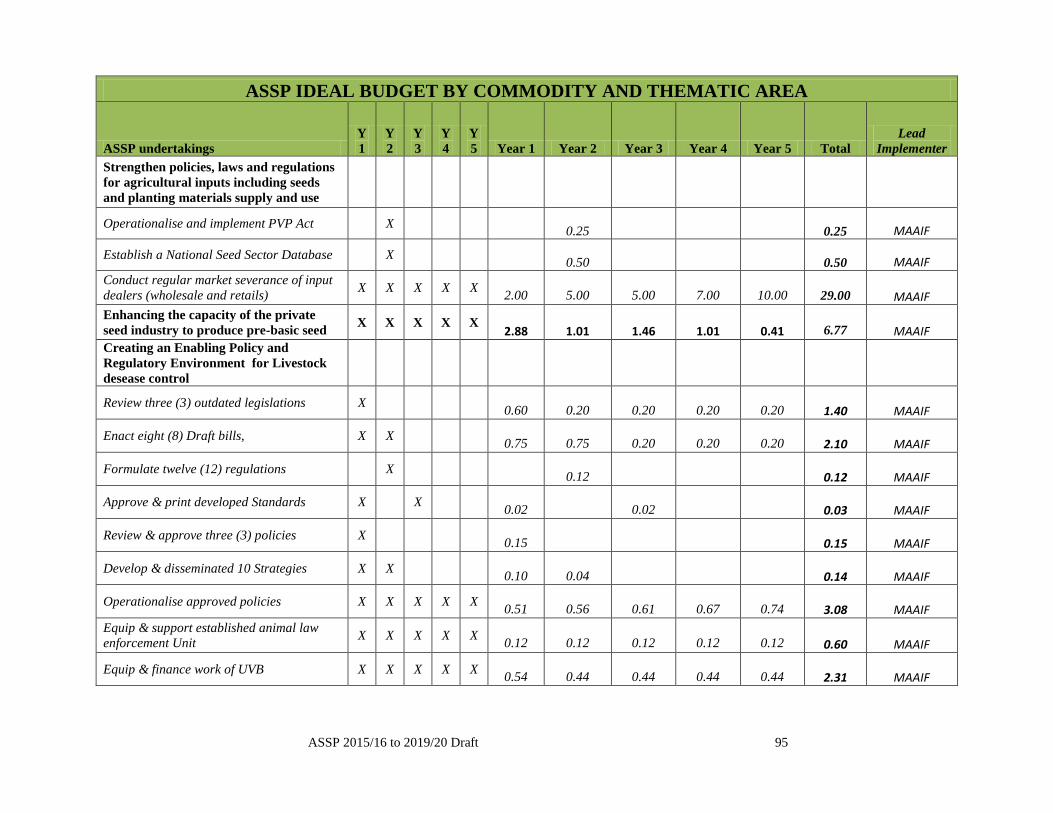
ASSP 2015/16 to 2019/20 Draft 95
ASSP IDEAL BUDGET BY COMMODITY AND THEMATIC AREA
ASSP undertakings
Y
1
Y
2
Y
3
Y
4
Y
5 Year 1 Year 2 Year 3 Year 4 Year 5 Total
Lead
Implementer
Strengthen policies, laws and regulations
for agricultural inputs including seeds
and planting materials supply and use
Operationalise and implement PVP Act X
0.25
0.25 MAAIF
Establish a National Seed Sector Database X
0.50
0.50 MAAIF
Conduct regular market severance of input
dealers (wholesale and retails) X X X X X
2.00
5.00
5.00
7.00
10.00
29.00 MAAIF
Enhancing the capacity of the private
seed industry to produce pre-basic seed X X X X X
2.88
1.01
1.46
1.01
0.41
6.77 MAAIF
Creating an Enabling Policy and
Regulatory Environment for Livestock
desease control
Review three (3) outdated legislations X
0.60
0.20
0.20
0.20
0.20
1.40 MAAIF
Enact eight (8) Draft bills, X X
0.75
0.75
0.20
0.20
0.20
2.10 MAAIF
Formulate twelve (12) regulations X
0.12
0.12 MAAIF
Approve & print developed Standards X X
0.02
0.02
0.03 MAAIF
Review & approve three (3) policies X
0.15
0.15 MAAIF
Develop & disseminated 10 Strategies X X
0.10
0.04
0.14 MAAIF
Operationalise approved policies X X X X X
0.51
0.56
0.61
0.67
0.74
3.08 MAAIF
Equip & support established animal law
enforcement Unit X X X X X
0.12
0.12
0.12
0.12
0.12
0.60 MAAIF
Equip & finance work of UVB X X X X X
0.54
0.44
0.44
0.44
0.44
2.31 MAAIF

ASSP 2015/16 to 2019/20 Draft 96
ASSP IDEAL BUDGET BY COMMODITY AND THEMATIC AREA
ASSP undertakings
Y
1
Y
2
Y
3
Y
4
Y
5 Year 1 Year 2 Year 3 Year 4 Year 5 Total
Lead
Implementer
Support continuous professional training X X X X X
0.03
0.03
0.03
0.03
0.03
0.15 MAAIF
Sub-total
24.29
30.45
32.81
40.22
50.17
177.94
Crop Pests and Disease Control
Crop pests and disease control regulatory
strengthening X X X X X 1.50
1.50
1.50
1.50
1.50
7.50 MAAIF
Conduct early detection and control of crop
pests, weeds and diseases X X X X X 4.00
4.40
4.84
5.32
5.86
24.42 MAAIF
Crop pests and disease control
infrastructure X X X X X 4.00
4.00
4.00
4.00
6.00
22.00 MAAIF
Sub-total X X X X X
9.50
9.90
10.34
10.82
13.36
53.92
Mainstream Cross-cutting Issues of
Gender, Youth, HIV/AIDS, Environment
and Climate Change, food and
nutritional security
promote the use of gender analysis and
gender-based budgeting in all community-
based development programmes
X X X X X
1.10
1.10
1.60
1.60
1.60
7.00
MAAIF/APD
Mainstream adaptation of agricultural
technologies and practices to climate change
in all sector programmes-SLM
X X X X X
1.50
2.00
5.00
3.90
5.30
17.70
MAAIF
Implement HIV/AIDS policies and
strategies- in the Agriculture Sector
including local governments and farming
communities
X X X X X
1.00
1.00
1.00
1.00
1.00
5.00
MAAIF
Improve Food and Nutrition Security
through Enhance consumption of diverse
diets at household level
-
promote awareness on food availability
across Agricultural Zones X X X X X
0.50
2.00
2.00
2.00
2.00
8.50 MAAIF

ASSP 2015/16 to 2019/20 Draft 97
ASSP IDEAL BUDGET BY COMMODITY AND THEMATIC AREA
ASSP undertakings
Y
1
Y
2
Y
3
Y
4
Y
5 Year 1 Year 2 Year 3 Year 4 Year 5 Total
Lead
Implementer
generate and promote nutrient bio-fortified
varieties across the priority commodities X X X X X
0.10
0.40
0.40
0.40
0.40
1.70 MAAIF
Develop early warning systems to prevent
and mitigate shocks affecting nutrition and
food security
X X X X X
1.00
2.00
2.00
2.00
6.00
13.00 MAAIF
institutional support to distribution of seed
planting and stocking material - OWC
20.00
20.00
20.00
20.00
80.00 NAADS
institutional support to distribution of seed
planting and stocking material - NAADS
SEC
10.00
10.00
10.00
10.00
40.00 NAADS
Sub-Total
5.20
38.50
42.00
40.90
46.30
172.90
Agricultural Markets and Value Addition Promote private sector investment in
value addition of the 12 prioritised
commodities through PPP X X X X X 1.00
5.00
10.00
15.00
15.00
46.00 MAAIF
Build capacities of farmers, traders and
processors in quality standards and
market requirements
Strengthen higher level farmer
organization for collective marketing,
bulking, quality and standards
improvement X X X X X 2.00
3.00
4.00
5.20
7.12
21.32 MAAIF
Promote appropriate technologies and
practices for minimizing post harvest
losses along the entire commodity value
chain. Develop and adapt appropriate
technologies and practices for postharvest
handling along the value chain of all
priority commodities
X X X X X
0.40
2.40
2.80
2.80
3.20
11.60
MAAIF/NAR
O
Build Capacity of Value chain actors on
best post harvest handling practices for
each priority commodity
X X X X X
0.30
1.00
4.00
6.00
6.00
17.30
MAAIF/NAR
O

ASSP 2015/16 to 2019/20 Draft 98
ASSP IDEAL BUDGET BY COMMODITY AND THEMATIC AREA
ASSP undertakings
Y
1
Y
2
Y
3
Y
4
Y
5 Year 1 Year 2 Year 3 Year 4 Year 5 Total
Lead
Implementer
Provide farmers/ groups assorted SME
processing demo/equipment X X X X X
1.00
1.00
1.40
1.96
2.74
8.10
MAAIF/NAR
O
Develop and improve food handling,
marketing and distribution systems and
linkages to local and export markets.
X X X X X
0.40
3.60
3.60
4.00
8.00
19.60
MAAIF/NAR
O
Promote Commodity/farm based storage
and agro processing, as a means to
increasing access to domestic and
regional market, through demonstrations
and PPPs.
Innovate and adapt affordable on-farm
storage solutions for the priority and
strategic commodities
X X X X X
0.50
0.80
0.80
0.80
0.80
3.70 MAAIF
Facilitate private sector uptake,
development, marketing and distribution of
on farm storage solutions to smallholder
farmers including developing a cost
effective sales distribution system
X X X X X
0.30
1.05
1.88
1.50
1.50
6.23 MAAIF
Enhance efficiency (higher output at
reduced cost) at all value chain nodes
through trainings and demonstration sites
of appropriate improved TIMPS
X X X X X
0.50
2.00
2.00
2.00
2.00
8.50 MAAIF
Product development to meet end-user
market requirements e.g. quality& safety
standards, traceability, packaging,
certification for niche markets, bar coding
for supermarket outlets, etc
X X X X X
1.00
2.00
2.00
2.00
2.00
9.00 MAAIF
Knowledge and skills development to
enhance capacity for engaging in high
quality export markets e.g. for horticulture
X X X X X
0.50
1.00
1.00
1.00
1.00
4.50 MAAIF
Promote cottage processing industries
through incubation of new processing
technologies for both food and non-food
products
X X X X X
1.00
2.00
2.00
2.00
2.00
9.00 MAAIF

ASSP 2015/16 to 2019/20 Draft 99
ASSP IDEAL BUDGET BY COMMODITY AND THEMATIC AREA
ASSP undertakings
Y
1
Y
2
Y
3
Y
4
Y
5 Year 1 Year 2 Year 3 Year 4 Year 5 Total
Lead
Implementer
Strengthen producer-buyer/aggregator
contractual relationships for the
strategic/priority commodities
X X X X X
0.30
0.30
0.30
0.30
0.30
1.50 MAAIF
Identify and strengthen producer groups
adding value to agricultural commodities
through training and exposure to
technologies befitting their activities.
X X X X X
0.20
0.30
0.50
0.50
0.50
2.00 MAAIF
Promote structured trading systems by
linking organized collective marketing
farmer groups to large buyers and storage
handlers/warehouse operators
X X X X X
0.20
0.30
0.50
0.50
0.50
2.00 MAAIF
Development, maintenance and
improvement of physical agricultural
marketing infrastructure
Cold Chain storage Infrastructure X X X X X
0.40
10.00
10.00
25.00
25.00
70.40 MAAIF
Physical agricultultural commodity markets X X X X X
0.40
10.00
10.00
25.00
25.00
70.40 MAAIF
Community based grain storage facilities X X X X X
0.40
10.00
10.00
25.00
25.00
70.40 MAAIF
Sub-Total
10.80
55.75
66.78
120.56
127.67
381.56
Other production and productivity enhancing measures
Sustainable Land Management/Promote
adaptation of climate change resilient
agricultural production systems,
technologies and practices
X X X X X
1.00
5.00
5.00
7.00
9.00
27.00 MAAIF
Increase access to agricultural finance services by implementing Agricultural commodity based Development Creditv facilities
X X X X X
18.60
18.60
28.20
36.43
101.83
MAAIF

ASSP 2015/16 to 2019/20 Draft 100
ASSP IDEAL BUDGET BY COMMODITY AND THEMATIC AREA
ASSP undertakings
Y
1
Y
2
Y
3
Y
4
Y
5 Year 1 Year 2 Year 3 Year 4 Year 5 Total
Lead
Implementer
Promote commercialisation of agriculture particularly amongst small holder farmers
X X X X X 0.50
2.00
2.00
5.00
5.00
14.50 MAAIF
Promote time and labour saving technologies targeting women farmers
X X X X X 0.40
0.40
0.40
0.40
0.40
2.00 MAAIF
Operationalize the commercialisation fund X X X X X
3.00
7.00
10.00
10.00
10.00
40.00 NAADS
Strengthen linkages between farmers and
production support services (including
financial services, capacity development
and marketing) in partnserhip with
Ministry of Finance and other stakeholders X X X X X 0.40
0.40
0.40
0.40
0.79
2.39
MAAIF
Sub-Total
5.30
33.40
36.40
51.00
61.62
187.72