the removal of cremophor® el from paclitaxel for quantitative analysis by hplc-uv
TRANSCRIPT

THE REMOVAL OF CREMOPHOR® EL FROM PACLITAXEL FOR QUANTITATIVE ANALYSIS
BY HPLC-UV
James D. Perdue
A Thesis Submitted to the University of North Carolina Wilmington in Partial Fulfillment
Of the Requirements for the Degree of Master of Science
Department of Chemistry and Biochemistry
University of North Carolina Wilmington
2005
Approved by
Advisory Committee
______________________________ ______________________________
______________________________ Chair
Accepted by
_____________________________ Dean, Graduate School
ii
TABLE OF CONTENTS ABSTRACT....................................................................................................................... iii ACKNOWLEDGEMENTS............................................................................................... iv DEDICATION.....................................................................................................................v LIST OF TABLES............................................................................................................. vi LIST OF FIGURES .......................................................................................................... vii INTRODUCTION ...............................................................................................................1 EXPERIMENTAL.............................................................................................................10 Equipment and Data Collection .........................................................................................10 Chemical Information ........................................................................................................11 Procedures..........................................................................................................................11 RESULTS AND DISCUSSION........................................................................................14 Precipitimetric Method Development................................................................................14 Interpretation of NMR Spectra ..........................................................................................22 Explanation of FTIR Studies .............................................................................................36 X-ray Crystallography Results...........................................................................................42 Optimization of HPLC Method .........................................................................................45 CONCLUSION..................................................................................................................56 REFERENCES ..................................................................................................................57 APPENDIX........................................................................................................................61
iii
ABSTRACT
The most common technique for analysis of drug substances is high performance
liquid chromatography (HPLC) using a variable wavelength detector (UV). Cremophor®
EL (ethoxylated castor oil, CrEL) is a non-ionic emulsifier that is used to assist in the
solubilization of hydrophobic drugs such as the antineoplastic agent, paclitaxel. However,
the molecular weight distribution of CrEL creates difficulties in the analysis of potency
and related substances of hydrophobic drugs via UV detection.
Using a precipitation method, CrEL was selectively removed from the paclitaxel
by pre-treating the injectable dosage form with mercuric chloride and analyzing the
filtered extract by HPLC-UV. The removal of CrEL from the injectable dosage form of
paclitaxel by precipitation with mercuric chloride resulted in a solution that was suitable
to quantitate active and related substances by HPLC-UV. The precipitate was then
characterized by nuclear magnetic resonance, infrared spectrophotometry and x-ray
diffraction to elucidate its mechanism of action. The combination of these analyses
provided sufficient evidence that the complex formed between CrEL and mercuric
chloride is from the coordination of the mercury atom to the ether oxygens present in the
CrEL.
iv
ACKNOWLEDGEMENTS
Without the financial contributions and use of facilities at aaiPharma, this thesis
would have never come to fruition. I am most grateful for aaiPharma’s generosity and
their continued support. I would also like to express my inestimable indebtedness to Dr.
Dan DeVido for making this thesis a reality. His ability to theorize and orchestrate the
challenges encountered in the pharmaceutical industry is truly admirable. I would like to
thank Dr. John Tyrell, who without his enthusiasm and unremitting insight, my long-
gestated work may have had no end. Dr. Tyrell’s sincerity, humor, and unwavering belief
were more motivating than he will ever know. I am grateful for Dr. Robert Hancock who
provided me with unbounded assistance. I also want to thank Dr. Bob Whittle and Linda
Whittall for all the insight, suggestions, and X-ray work performed in this project.
Finally, I find difficulty in expressing my gratitude to Dr. Pam Seaton who munificently
provided me with the technical support and assistance needed to make this research
successful.

v
DEDICATION
I dedicate this thesis to my newborn daughter, Malina.
vi
LIST OF TABLES Table 1. Compounds that were mixed with 50% v/v Cremophor® EL (CrEL) in ethanol to investigate alternative precipitating agents....................................................................16 Table 2. Retention times and area counts for the control preparation of paclitaxel and its related substances...............................................................................................................54 Table 3. Retention times, area counts, and percent recovery after the precipitation of CrEL from paclitaxel and its related substances................................................................55

vii
LIST OF FIGURES Figure 1. Molecular structure of paclitaxel..........................................................................3 Figure 2. Molecular structure of CrEL ................................................................................4 Figure 3. A schematic of the micellar arrangement of CrEL surrounding a paclitaxel molecule ..............................................................................................................6 Figure 4. Schematic of olefin complex, forming a mercurinium compound.....................17 Figure 5. Molecular structures of chemicals used for simulating the functional groups present in CrEL..................................................................................................................19 Figure 6. Reaction of diglyme and mercuric chloride .......................................................20 Figure 7. Reaction of triglyme and mercuric chloride to form and insoluble complex.....21 Figure 8. Overlay of CrEL and Hg-compexed CrEL 1H-NMR spectra.............................25 Figure 9. Overlay of CrEL and Hg-complexed CrEL-deuterated water 1H-NMR spectra.................................................................................................................26 Figure 10. Overlay of Hg-complexed CrEL and Hg-complexed CrEL-deuterated water 1H-NMR spectra.................................................................................................................27 Figure 11. Overlay from 40 ppm to 20 ppm of CrEL and Hg-complexed CrEL 13C-NMR spectra ...............................................................................................................30 Figure 12. Overlay from 80 ppm to 60 ppm of CrEL and Hg-complexed CrEL 13C-NMR spectra ...............................................................................................................31 Figure 13. Overlay from 176 ppm to 170 ppm of CrEL and Hg-complexed CrEL 13C NMR spectra................................................................................................................32 Figure 14. Overlay from 4 ppm to 3 ppm of PEG 400 and Hg-complexed PEG 400 1H-NMR spectra.................................................................................................................34 Figure 15. Overlay of PEG 400 and Hg-complexed PEG 400 13C-NMR spectra .............35 Figure 16. IR spectrum of CrEL ........................................................................................38 Figure 17. IR spectrum of Hg-complexed CrEL ...............................................................39 Figure 18. IR spectrum of triglyme....................................................................................40

viii
Figure 19. IR spectrum of Hg-complexed triglyme...........................................................41 Figure 20. Diffractogram of Hg-complexed CrEL ............................................................44 Figure 21. Chromatographic overlay of a 1.0% ethanolic solution of CrEL and the solution after precipitation and filtration ...........................................................................47 Figure 22. Chromatogram of paclitaxel (0.3 mg/mL) dissolved in 50% v/v CrEL in ethanol ...................................................................................................51 Figure 23. Chromatographic overlay of paclitaxel (0.5 mg/mL) in CrEL and with CrEL removed precipitation ........................................................................................................52 Figure 24. Chromatogram of precipitated and filtered paclitaxel (0.5 mg/mL) in ethanolic CrEL solution spiked with related substances mixture (0.1%) overlayed with a control solution prepared at the same concentration with no CrEL...............................................53
INTRODUCTION
For a drug to be marketed in the United States it must be effective, convenient,
and most importantly, safe. Since parenterals are administered by injection, the quality of
the finished drug product must be significantly higher than other dosage forms
(Avis, et al., 1992). The standards set forth by the U.S. Food and Drug Administration
(FDA) and United States Pharmacopoeia (USP), a private organization that works in
collaboration with the FDA, ensure that the quality (identity, purity, quantity, and
potency) of a drug product is as stated by the manufacturer (USP, 2005). Federal law
requires manufactures, processors, and packagers of drugs to take a proactive approach to
ensuring that their products are of the highest quality. The current Good Manufacturing
Practices (cGMP), which are regulations promulgated by the FDA’s Code of Federal
Regulations (CFR), provide the framework for companies to minimize or eliminate
contamination and erroneous data. The FDA’s guidelines and standards for determining
the quality of products generally include a series of methods that must be performed by
an analytical laboratory to determine their chemical composition, both quantitatively and
qualitatively.
In addition to cGMP, cost and convenience of administration are major concerns
that affect the pharmaceutical industry. Analytical methods must be developed so that the
drug products can be tested in their finished, ready-to-deliver, product form. However,
some drug products must be manufactured using a two-vial system where one vial
contains the active pharmaceutical ingredient and the other vial contains the solubilizer or
excipient. The two vials are analyzed separately and once the products are released, the
consumer mixes the vials immediately before use. This two-vial system is mandated
2
because there has not been a suitable technique or method developed that allows for the
components to be accurately analyzed when combined or due to the instability of the drug
product. Analytical laboratories must continually develop novel methods that allow for
the quality of drug products to be determined in the presence of its excipients.
The primary goal of new drug formulations and reformulation of established drug
products is to enhance bioavailability and effectiveness of the active pharmaceutical
ingredient (API). The recent advances in novel drug formulations have substantially
increased the amount of research and development required to bring a product to market.
Costs are further escalated because of certain unseen challenges that are encountered
when developing new analytical methods that determine the drug’s quality and stability.
The analytical tool that is used most extensively in determining the quality of
drug products is high performance liquid chromatography (HPLC) (Snyder, 1997). Using
HPLC methodology, the potency of compounds can be rapidly established by comparing
a known reference standard with the analytes of interest. However, if peaks in a
chromatogram attributed to the active or its related substances or degradents elute at the
same retention times of the excipients or solubilizers inaccurate results will be obtained.
Therefore, HPLC methods that accurately and specifically quantitate finished drug
products by selectively removing interfering excipients with a sample preparation before
the analyses are needed. Some techniques, like liquid-liquid extraction, preparative
HPLC purification, and solid phase extraction (SPE) have been used to remove
interfering excipients prior to HPLC analysis. Techniques like liquid-liquid extraction
and SPE that depend on solvent selectivity can not be used for some excipients because
they are soluble in such a diverse range of solvents.

3
The major challenge in analyzing hydrophobic parenteral dosage forms by HPLC-
UV is the interference of the many peaks produced by the large molecular weight
distribution of excipients such as CrEL. The retention times of the peaks due to
solubilizing agents are sometimes the same as the related impurities and degradation
products present in a drug product causing inaccurate results to be obtained. The analysis
of newly derivitized formulations of hydrophobic drugs such as paclitaxel, for example,
interfere with its excipient making the peaks due to the active and its related compounds
very difficult to quantitate by HPLC-UV.
Paclitaxel (Taxol®, Bristol-Myers Squibb Company) is one drug product that has
posed a challenge from an analytical standpoint. Paclitaxel is a potent natural product that
is harvested from the bark of the Pacific Yew tree, Taxus brevifolia. Its chemical
structure is depicted in Figure 1.
O
HN O
O
HO
OO
O
OH
O
O
O
OH
OO
Figure 1. Molecular structure of paclitaxel.
Paclitaxel is an antineoplastic agent that is indicated for the treatment of non-
small cell lung cancer, refractory breast cancer, epithelial ovarian cancer, and potentially
for multiple sclerosis and Alzheimer’s disease (Halford, 2005). In 1977, the National
4
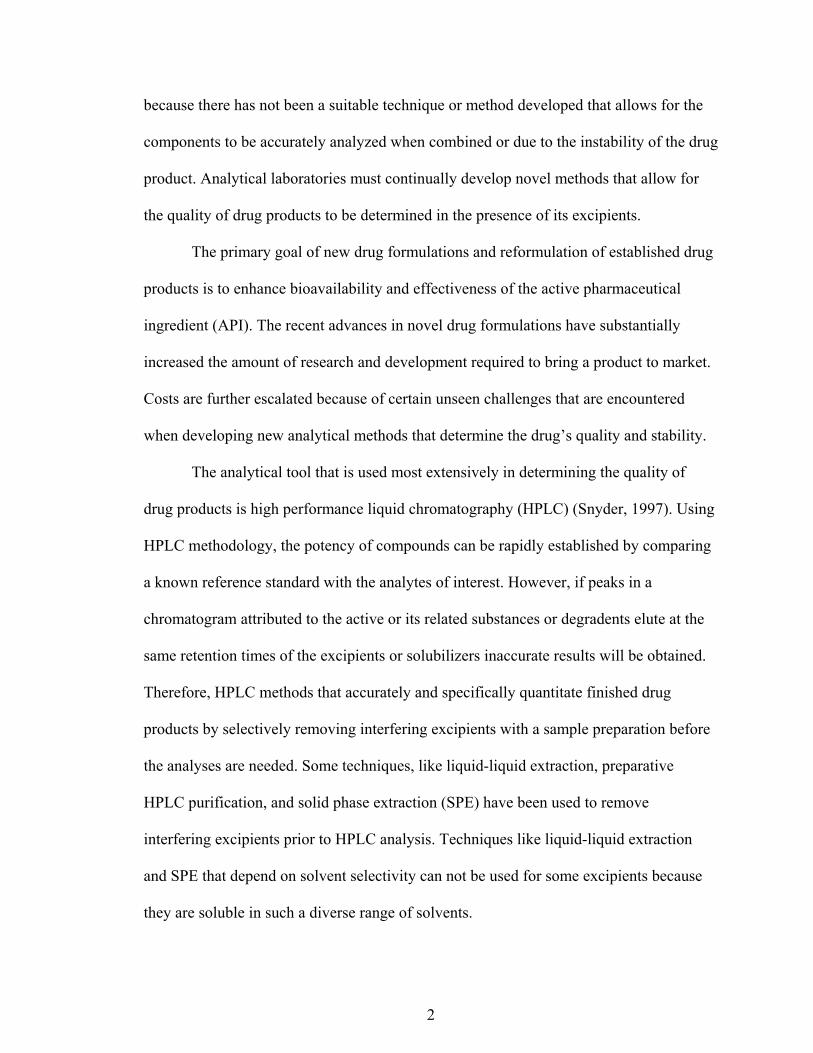
Cancer Institute (NCI) was faced with significant obstacles pertaining to the formulation
of paclitaxel. The major challenge in developing its formulation was due to the absence
of ionizable functional groups and a bulky fused ring system, which makes paclitaxel
poorly soluble in aqueous media (less than 0.1µg/ml)(Suffness, 1995).
There are a variety of vehicles that have proven to be effective in
transporting hydrophobic drugs within the human circulatory system. Mostly, the use of
nonionic solubilizers has been applied by investigators in cancer chemotherapy because
of their effectiveness. One of the non-aqueous formulations proposed and accepted by
NCI for paclitaxel was a formulation consisting of the emulsifier/solubilizer,
polyethylene glycol triricinoleate 35 (Cremophor® EL, BASF) and ethanol (Suffness,
1995). CrEL is an FDA approved amphiphilic polymer that is used as a solubilizer for the
delivery of a variety of hydrophobic parenteral drugs. It is a viscous liquid that is formed
by the reaction of ethylene oxide with castor oil at a molar ratio of 35:1 (BASF, 1998). A
major component (80%) of CrEL consists of a hydrophobic glycerol-polyethylene glycol
ricinoleate which is shown in Figure 2 (BASF, 1998).
O
O
O
O
O
O
O
O
O
OH
OH
x
y
z
OH
Figure 2. Molecular structure of CrEL. Σ(x,y,z) = 30-33
5
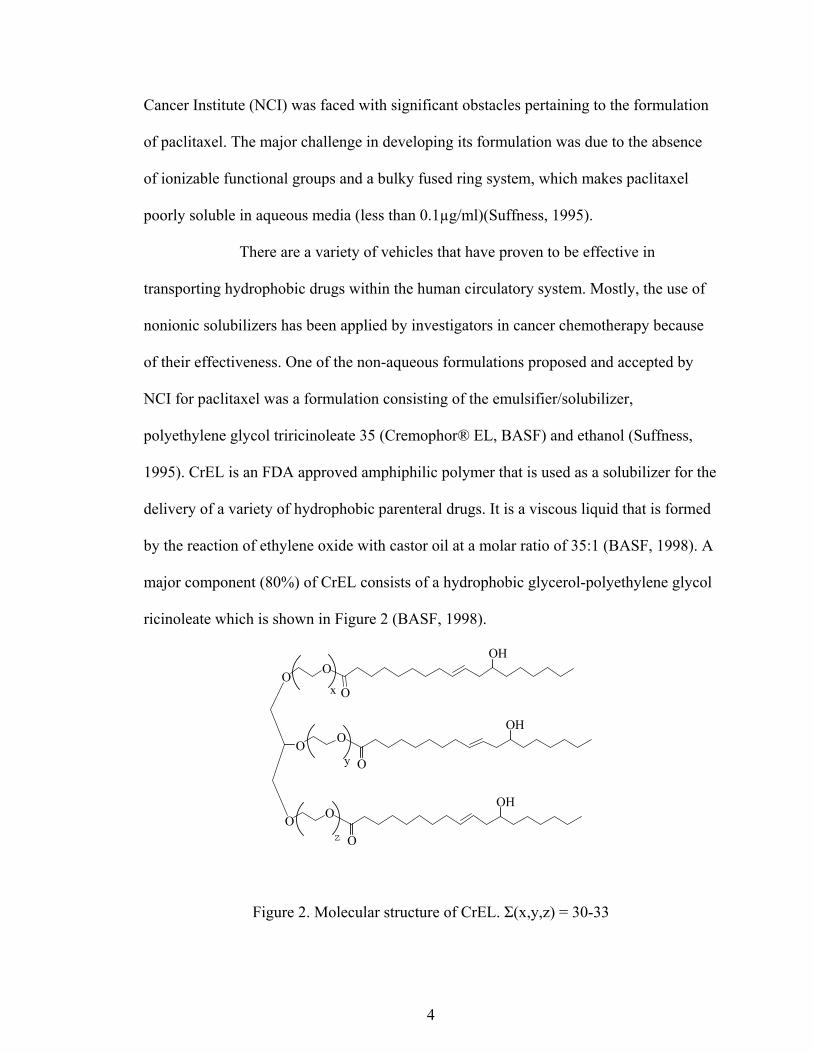
The remaining 20% of CrEL contains 7% polyethylene glycol, 10% glycerol
polyoxyethylene, and 3% non reacted castor oil (Meyer, et al., 2002). Nonionic surfactant
molecules, such as CrEL, have no formal ionic charge. Its polarity arises from the
combined effects of the many ether linkages joined to the nonpolar moiety
(Yalkowsky, 1999). CrEL, like most surface active agents, contain flexible nonpolar
alkyl chains that are oriented toward the hydrophobic core where the drug resides. The
polar region forms the hydrophilic corona that hydrogen bonds with the water molecules.
A schematic of this arrangement of CrEL molecules forming a micelle around a
paclitaxel molecule is illustrated in Figure 3. The threshold concentration above which
micelles form, that is, the critical micelle concentration (CMC) for CrEL in an aqueous
solution was previously determined by cryogenic temperature transmission electron
microscopy (cryo-TEM) to be 97-102 µg/mL (Szebeni, et al., 2001).

6
O
HN O
O
HO
OOO
OH
OO
O
OH
OO
O
OO
OO
O
OO
O
OH
OH
OH
O
O
O
O
O
O
O
O
O
OH
OH
OH
O
O
O
O
O
O
O
O
OHO
HO
HO
O
O
O
O
O
O
O
O
O
HO
HO
HO
O
O
O
O
O
O
O
O
O OH
OH
OH
O
O
O
O
O
O
O
O
O
OH
OH
OH
Figure 3. A schematic of the micellar arrangement of CrEL surrounding a paclitaxel
molecule. (Note: Ethylene oxides in parenthesis are 10-11 units in length.)

7
One of the unique properties of CrEL that BASF chemists discovered is that it is
soluble in the presence of many electrolytes. Most all salts and acids, provided their
concentrations are not too excessive, will not cause CrEL to precipitate out of solution
(BASF, 1999). However, mercuric chloride and compounds that contain phenolic
hydroxyl groups, such as resorcinol, tannin, and phenol may cause precipitation at certain
concentrations (BASF, 1999). Based on these unique properties, a method for CrEL-
containing drug products can be developed that allows CrEL to be removed by
precipitation before the analysis of parenteral drug products by HPLC-UV. The pre-
treatment of an injectable hydrophobic drug product containing CrEL with mercuric
chloride will allow for the analysis to proceed with negligible interference from the
CrEL.
When CrEL is subjected to a saturated ethanolic solution of mercuric chloride, a
dense, white precipitate is formed. When a majority of the CrEL is precipitated out of a
solution in this manner, mercuric chloride may be selective enough to complex with and
remove the interfering excipient from the injectable dosage form. Once CrEL is removed,
the drug product can be analyzed by HPLC-UV with no interference from the CrEL.
This novel precipitimetric approach to analyzing paclitaxel in a one vial system
can also be applied to other hydrophobic drugs containing CrEL. In order to apply this
precipitimetric method to other CrEL-containing finished drug products, it is critical to
investigate mercuric chloride’s mechanism of action. If mercury specifically complexes
certain functional groups present in both the solubilizer and the API, the method would
be rendered less suitable. The precipitation reaction was studied using a variety of

8
techniques including qualitative analysis, Fourier transform infrared spectrophotometry
(FTIR), 1H and 13C nuclear magnetic resonance (NMR), and X-ray diffraction.
A rapid qualitative analysis was performed to explore the potential sites where the
reaction might take place. In the qualitative analysis study, compounds that represented
key functional groups of CrEL were reacted with ethanolic mercuric chloride to
determine what part of the CrEL molecule is interacting with the mercuric chloride.
Certain functional groups that were candidates for the mercuric chloride reaction were
alcohols, ethers, and olefins.
The most valuable instrumental technique employed to elucidate the mechanism
of interaction was 1H-NMR and 13C-NMR. The goal of the NMR studies was to support
the theory of mercuric chloride complexing with the ether units present in CrEL. Special
attention was given to the changes that took place in the chemical shifts when CrEL
reacted with mercuric chloride.
Supporting data was collected using techniques in FTIR and X-ray diffraction. If
the complex is formed between the ethers and the mercury ion, then changes in the
degrees of motion for the ether bonds should be prevalent in the IR spectra. Furthermore,
an X-ray diffraction pattern of an isolated crystal of the mercury-complexed CrEL would
be sound evidence to support the proposed theory of this precipitation reaction.
Since the discovery of paclitaxel’s use as a chemotherapy drug, there have been a
variety of studies pertaining to its purification, preparation and application. Most of the
recent published data addresses the application and the resulting clinical effects of the
intravenously administered paclitaxel and/or CrEL (Ghassempour, et al., 2003,
Gelderblom, et al., 2002, Meyer, et al., 2001, Kunkel, et al., 1999, Gelderblom, et al.,

9
1999, Huizing, et al., 1998, and Sparreboom, et al., 1996). One method that particularly
addresses the chromatographic analysis of paclitaxel and CrEL was developed by Lillian
Shao and David Locke (Shao and Locke, 1997). The method they developed utilizes
micellar electrokinetic capillary chromatography to separate paclitaxel and related
taxanes (Appendix B) in the bulk drug as well as its injectable dosage form.
More recently, Ciutaru, et al. developed and validated a HPLC method that
evaluates paclitaxel’s related taxanes in its finished injectable form (Ciutaru, et al., 2003).
Ciutaru, et al. obtained chromatographic data that showed baseline resolution of the
related substances in the presence of CrEL. It was noted that there was difficultly in the
separation of related taxane peaks in the sample that contained CrEL. The method was
optimized and validated so that the peaks of the CrEL did not interfere with the related
taxanes.
The methods proposed by Shao and Locke and Ciutaru, et al. may be suitable for
analyzing the pure natural product, paclitaxel, in the presence of CrEL. However, the
peaks in the chromatographic analysis due to derivitized formulations of paclitaxel
interfere with the peaks of CrEL, making quantitation of the active and related
compounds difficult to analyze. In HPLC analysis, as illustrated here, it is paramount to
analyze finished products without interference from the excipient matrix.

10
EXPERIMENTAL
Equipment
1H and 13C nuclear magnetic resonance (NMR) spectra were acquired on a Bruker
Avance DRX400 multinuclear spectrometer. All the compounds used in the NMR
analysis were dissolved and read in d6-acetone. The spectra were acquired and processed
with XWINN-NMR® software.
Infrared (IR) absorption spectra were obtained with a Mattson Genesis Series
Fourier transform infrared (FTIR) spectrophotometer and then processed with Winnfirst®
software.
X-ray crystallographic data was obtained on a Nonius Kappa CCD diffractometer
and a Siemens D500 X-ray powder diffraction instrument. All measurements were
carried out at 23 ˚C using monochromated Cu (Kα ) radiation (λ=1.54178Å). The data
was processed with Maxus Solution® software.
The high performance liquid chromatography (HPLC) components used were a
Hewlett-Packard 1100 autosampler, Hitachi L-7100 quaternary gradient pump, and a
Waters 2487 dual wavelength absorbance detector. An auxiliary HPLC system was used
that consisted of the same components as listed above except a Waters 717Plus
Autosampler was used. The column used throughout was a Phenomenex Curosil, 250mm
x 4.6 mm, with a 5 µm particle size bonded with pentafluorophenyl (PFP) groups. The
column was maintained at ambient temperature. Separations were achieved using a
mixture of acetonitrile and water at 40% acetonitrile for mobile phase A and 70%
acetonitrile for mobile phase B. A gradient elution, flowing at 1.0 mL/min (except where
noted), was performed from 0 to 25 minutes, 90% mobile phase A, from 25 minutes to 60
11
minutes, 100% mobile phase B, and from 60.1 minutes to 70 minutes 90% mobile phase
A. These steps in the gradient, which significantly increased the runtime were critical in
eluting the excipient, CrEL and other retained impurities from the precipitation reaction.
Analytes were detected at 228 nm. The injection volume was 10µL. All chromatographic
data was acquired and processed with Waters Millennium® 4.0.
Chemical Information
See Appendix A for the list of chemicals and manufacturers used for each type of
analysis/study performed.
Procedure
Sample Preparations
The stock solution of paclitaxel was prepared in a similar manner to the
formulation of the injectable dosage form that is currently marketed (PDR, 2005).
Paclitaxel was dissolved in a 50% v/v solution of CrEL in ethanol at a concentration of
25 mg/mL. Working standard solution (1) was prepared by diluting the stock solution in
ethanol to obtain a final concentration of 0.5 mg/mL, which is approximately the final
concentration (0.3 mg/mL to 1.2 mg/mL) of the drug when being administered by
intravenous infusion. Working solution (2) was prepared at the same concentration as (1)
except using an intermediate solution containing saturated mercuric chloride in ethanol,
centrifuging and immediately filtering the supernatant with a Gelman Acrodisc 0.45 µm
borosilicate glass hydrophilic polypropylene (GHP) filter before diluting to the same
concentration (0.5 mg/mL). The pellet remaining in the centrifuge tube was transferred to

12
a Buchner funnel and washed with ethanol then dried over silica gel, under vacuum, for
three days.
Polyethylene glycol 400 (PEG 400) was dissolved in ethanol to furnish a 50% v/v
solution. To a tube containing 5 mL of this solution, 10 mL of saturated ethanolic
mercuric chloride was added and mixed vigorously. To a tube containing 5 mL of
triglyme, 10 mL of saturated ethanolic mercuric chloride was added and mixed
vigorously. The resulting precipitates from each reaction were washed and dried like the
CrEL precipitate.
Rate of Precipitation Reaction
To estimate the rate of the mercury- CrEL reaction, a preliminary time study was
performed. A 50:50 mixture of saturated ethanolic mercuric chloride and CrEL was
vortexed for 30 seconds and immediately centrifuged at 5000 rpm for ten minutes. The
supernatant was decanted into a test tube, capped, and placed at ambient laboratory
conditions for 48 hours. No further precipitation was evident. Based on these findings,
the reaction of mercuric chloride in ethanol with CrEL was determined to be immediate.
Preparations for NMR Analysis
For the 1H-NMR analysis, the dried CrEL precipitate was weighed into d6-acetone
to obtain a concentration of 20 mg/mL. A preparation of the unreacted CrEL was
prepared similarly. The 13C-NMR analyses of the same components were obtained in the
same solvent but at a concentration of 50 mg/mL. The same experiments were run with
PEG 400 at the same concentrations as CrEL. The d6-acetone peak was used for
calibration (2.04 ppm for 1H-NMR spectra and 29.94 ppm for 13C-NMR spectra). The

13
1H-NMR integral regions were relative to the calibrated acetone peak that was arbitrarily
set at 1.00.
Preparations for FTIR Analysis
Ten milligrams of the CrEL precipitant was triturated intimately with 4 drops of
mineral oil (nujol) in a mortar. The mixture was suspended between two sodium chloride
plates and the spectrum was obtained in a blank subtracted background. Ten milligrams
of the triglyme precipitant was prepared similarly. The spectrum of the unreacted CrEL
and triglyme were also obtained under the same conditions as the precipitant.
Preparations for X-ray Analysis
Using a microscope, a representative crystal was selected from the dried CrEL
precipitant and mounted on a glass fiber with epoxy cement. The data was collected by
ω-2θ scans.
Preparations for HPLC Analysis
A mixture of thirteen related taxanes was commercially purchased from Hauser
Chemical Research Company. The list of the taxanes and their structures is located in
Appendix B. The taxanes in this mixture represent the most commonly found related
substances present when analyzing the bulk, natural drug product, paclitaxel. For the
recovery study, working solution (3) was prepared with paclitaxel at 0.5 mg/mL and
spiked with the thirteen taxane mixture at 1.0% using the intermediate ethanolic mercuric
chloride solution described above. A control of paclitaxel at 0.5 mg/mL, working
standard (4), was spiked with the thirteen taxane mixture in absence of CrEL. A blank
preparation of 50% v/v CrEL in ethanol and saturated ethanolic mercuric chloride was
made in a centrifuge tube. The resulting mixture was centrifuged at 5000 rpm for 10 min.

14
A portion of the supernatant was decanted into a GHP syringe filter, filtered, and diluted
to the same concentration as the final working standard solutions.
RESULTS AND DISCUSSION
Over the past several years, there have been a multitude of studies published that
evaluate the complexation of metal ions with ethers and etheral polymers (Maunu, et al.,
1987, Varshney, et al., 1991, Doxsee, et al., 1993, Costero, et al., 1998, Shou, et al.,
1999). A majority of these reports, however, have been of crown ether complexes and
other non-polymer, well-characterized molecules containing ethers. Nonetheless, their
results provide insight into the use of metal ions to complex organic compounds.
The etheral polymer, CrEL that is used in the preparation of the hydrophobic
drug, paclitaxel has to be selectively removed so valid quantitative and qualitative
chromatographic data for the finished product can be obtained. A unique property of
CrEL that will allow for its removal from the parenteral formulation of paclitaxel, is by
selectively precipitating with metal ions.
Precipitimetric Analysis
BASF, the manufacturer of CrEL, reports that CrEL is unstable in solutions
containing mercuric chloride in addition to phenolic hydroxyl compounds (BASF, 1997).
A series of experiments was performed to determine the most effective agent for
removing CrEL from a solution by precipitation. A solution of CrEL was prepared at a
50% v/v dilution in ethanol to mimic the solubilizing concentration in finished dosage
forms of paclitaxel. The metal ions in addition to mercury that were mixed with CrEL are
listed in Table 1 (manufacturers are listed in Appendix A). When saturated solutions of

15
the metal ions listed in Table 1 were added to the 50% v/v ethanolic CrEL solution, most
yielded no visible precipitate. If a complex did form with these metals, the metal-
complex was soluble and was not further investigated due to the lack of a precipitate.
BASF also reported that some organic substances, such as resorcinol and phenol, may
cause precipitation. Experimentation with these phenolic hydroxyls yielded no observable
result. The use of organic substances as precipitating agents was also not pursued further.

16
Table 1. Compounds that were mixed with 50% v/v CrEL in ethanol to investigate
alternative precipitating agents.
Compound Insoluble precipitate with CrEL Mercuric chloride Yes Mercuric iodide No
Mercuric bromide Yes (slight) Barium chloride No Mercuric acetate Yes (slight)
Resorcinol No Phenol No
Ferric chloride No Lanthanum chloride No
Cobalt chloride No Copper chloride No
Zinc chloride No Nickel chloride No Silver chloride No
Stannous chloride No Magnesium chloride No
Lead acetate No Lithium chloride No

17
The basis of selectivity for metal ions in open chain ligands such as CrEL has
previously been investigated from a thermodynamic and geometric standpoint (Hancock,
1992). In addition to favorable entropy effects, and to a much lesser degree, enthalpy
effects, the stability of the CrEL-metal complex in ethanol is strongly related to the size
of the metal ion being chelated. Typically, metals such as lead(II), mercury(II), and
barium(II) that have an ionic radius greater than 1.0 Å, will strongly bind to CrEL where
as metals that have ionic radii smaller than 1.0 Å will not. For the metal to form an
insoluble complex, the metal ion must also maintain its bonds with the cation so as to
produce a neutral ethanol-insoluble polymer. Based on the hard/soft acid base principle,
mercury(II) is a soft acid that strongly binds chloride ions where as lead(II), a borderline
hard acid and barium(II) a hard acid do not maintain their bonds to chloride ions during
complexation (MacKay, et al., 2002). This theory supports the reason why the only metal
salt that successfully yielded a sufficient quantity of precipitated CrEL was mercuric
chloride.
The interaction of mercury and CrEL was initially thought to take place at the
carbon – carbon double bond with the π electrons acting as the nucleophile, the mercury
as the electrophile, and the chloride ions possibly as the leaving group thus forming a
stable mercurinium compound, as illustrated in Figure 4 (Cotton, et al., 1988 ).
C C R'R
Hg+
R'R + HgCl2
HH
etoh
Figure 4. A schematic of an olefin complex, forming a mercurinium compound.

18
Another experiment was performed with short alkenes to investigate the possibility of the
interaction illustrated in Figure 4. 1-Octene and 2-heptene were used as representative
olefins and mixed with a saturated ethanolic solution of mercuric chloride. No visible
precipitate was immediately obtained. The solutions were covered with a pin-punctured
piece of foil and left for about 14 days. White crystals formed at the bottom of each of the
reaction tubes. Using a microscope, a representative crystal was selected from the
1-octene reaction tube and mounted for an X-ray diffraction pattern. It was determined
that the crystals that were in the tube were of the recrystallized mercuric chloride, thus
proving this theory incorrect. Based on the result obtained with the 1-octene solution, the
2-heptene solution was not analyzed by X-ray diffraction. From this experiment it can be
inferred that the reaction appears to be taking place with the ether linkages and not the
olefin as initially thought.
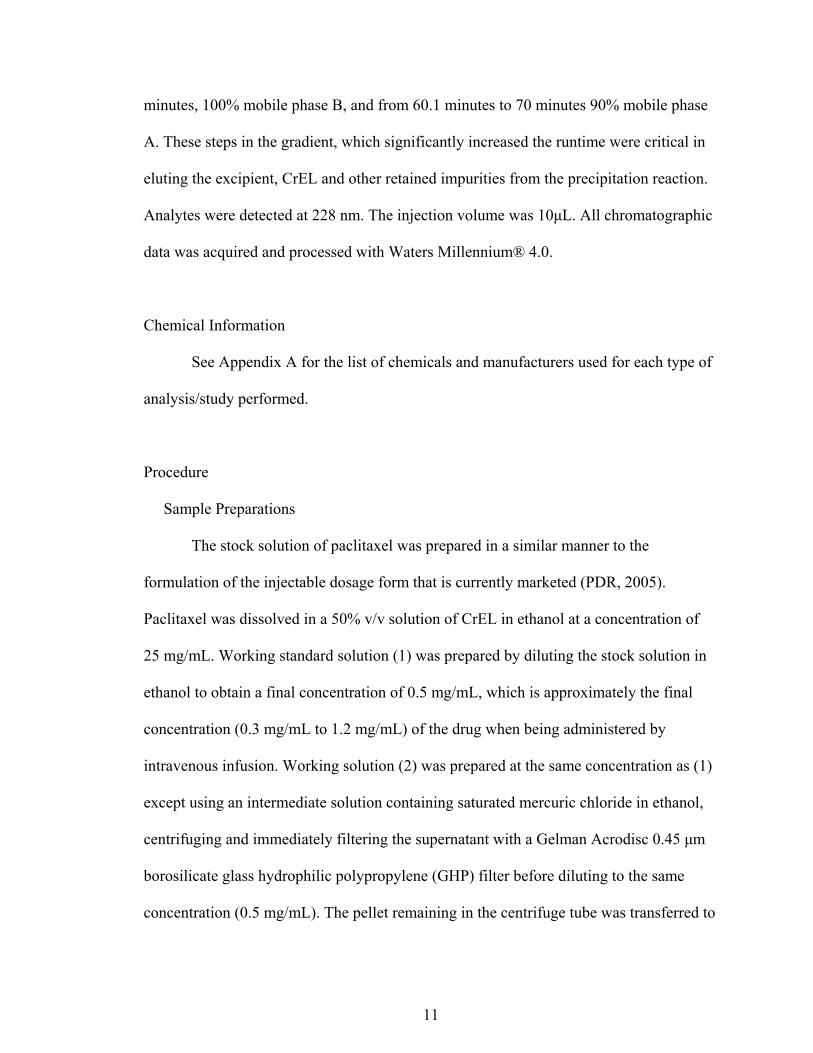
To determine which moiety of the CrEL structure was interacting with the
mercury, a rapid qualitative analysis using compounds that represent the major functional
groups was tested. The compounds that simulate the particular regions of CrEL, cis-3-
hexen-1-ol, castor oil, glycerol ethoxylate, and polyethylene glycol (PEG 400) were used.
There structures are depicted in Figure 5. They were each individually reacted with
saturated ethanolic mercuric chloride solution. Of these four compounds, PEG 400 and
glycerol ethoxylate were the compounds that, when mixed with mercuric chloride formed
a white, insoluble salt.
19
OH
Cis-3-hexen-1-ol
HO
HOO
Castor oil (~90% cis-ricenoleic acid)
CH2(OCH2CH2)nOH
CH2(OCH2CH2)nOH
CH(OCH2CH2)nOH
Glycerol ethoxylate, n=6-7
Polyethylene Glycol (MW 400), n≈9
Figure 5. Molecular structures of chemicals used for simulating the functional groups
present in CrEL.
H(OCH2CH2)nOH
20
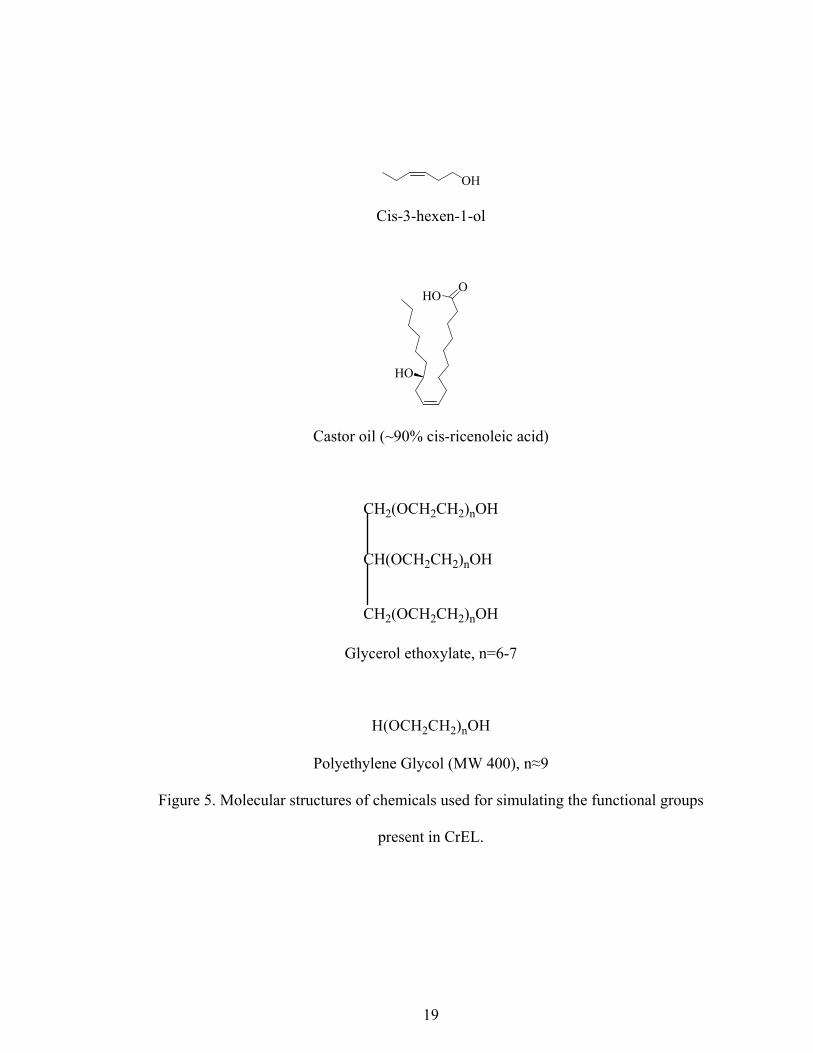
Other compounds that were investigated contained linear chains of ethers, like
diglyme and tryglyme. Diglyme (Figure 6) proved unsuccessful in producing an insoluble
precipitate where as triglyme, with one more ethylene unit, successfully complexed with
mercuric chloride to form a white precipitate.
OO
O + HgCl2 NO PPT
Figure 6. Reaction of diglyme and mercuric chloride.
Perhaps the reason diglyme was unsuccessful at complexing a mercury (II) ion is
because this cation typically forms four-coordinate tetrahedral structures in monomers
where diglyme has only three coordinating ether oxygens (Helm, et al., 2002).
Furthermore, diglyme may not be large enough to geometrically allow the oxygens to
chelate the mercury atom. Triglyme, with its all-ether structure, is very similar to crown
ethers in that they dissolve many inorganic salts by chelating the cation (Figure 7)
(Glymes, 2005). The white, solid complex that triglyme formed with mercury was
insoluble in ethanol, much like that seen in CrEL and PEG 400.

21
OO
OO
+ HgC l2
Hg
O
O O
O
etoh
Cl
Cl
OO
OO
+ HgC l2
Hg
O
O O
O
etoh
OO
OO
+ HgC l2
Hg
O
O O
O
etoh
Cl
Cl
Figure 7. Reaction of triglyme and mercuric chloride to form an insoluble complex.

22
With mercuric chloride being the only salt that furnished a precipitate with CrEL
in ethanol, the method was further optimized to separate the solid CrEL from the
solution. Based on membrane selection guides, hydrophobic drug literature, and previous
projects run using these solvents and compounds, a GHP syringe filter was selected for
this method (Williams, et al., 2001). No filter study was performed on the method
developed here. The precipitate that was formed from reacting mercuric chloride with
CrEL was immediate when performed in ethanol and was easily removed from the
solution by filtration.
NMR Analysis
Nuclear magnetic resonance spectroscopy was utilized to map the changes that
took place in the carbon-hydrogen framework when CrEL complexed with mercury. The
information derived from both the 1H-NMR and 13C-NMR spectra proved to be
extraordinarily useful for determining the change in the chemical environment when
mercury is complexed with CrEL. Even though a molecule the size and complexity of
CrEL is difficult to fully interpret by NMR spectroscopy, many structural features can
still be recognized.
The greatest amount of information that was gained from the NMR experiments
was from the change in chemical shifts when the CrEL was complexed with mercuric
chloride. When a spectrum of the pure polymer was obtained and compared to the
mercury-complexed CrEL, the chemical (magnetic) environments of certain nuclei were
effected. For instance, Figure 8 shows the overlay of the 1H-NMR spectra of the raw
polyethoxylated castor oil (CrEL) and the mercury-complexed CrEL. In regards to
chemical shift changes present in these spectra, the most notable variation is the
23
absorption of the hydrogens adjacent to the electronegative ether oxygens. In the CrEL
spectrum, the largest ether absorption is at 3.58 ppm and when mercury is complexed
with CrEL, it shifts downfield to an absorption of 3.66 ppm. From this 0.1 ppm shift, it is
evident that there is a removal of electron density surrounding the nuclei of the ether
protons when mercury is present. Similar shifting patterns in 1H-NMR were seen in
previous spectroscopic studies focusing on the polyether coordination of alkali metal
cations (Popović, 2000 and Isab, 1995). Another obvious difference in the two spectra is
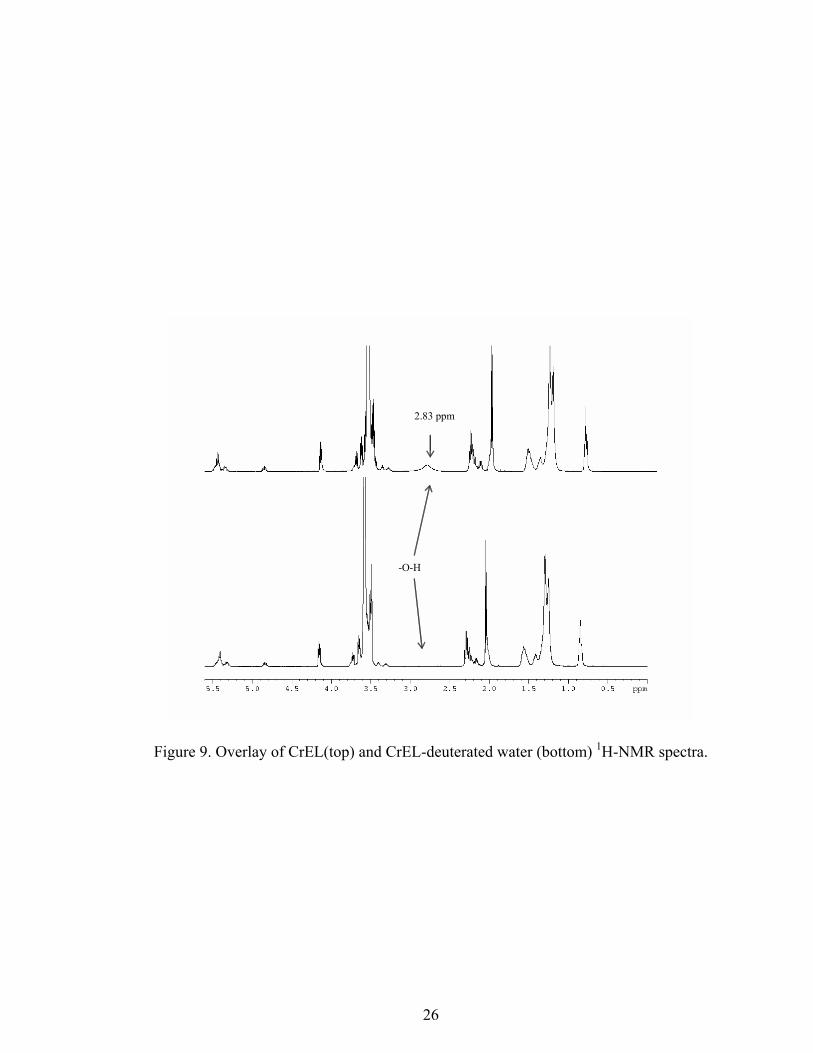
the absorption at approximately 2.84 ppm (Figure 8). When the CrEL was complexed
with the mercuric chloride, filtered and dried, it caused the broad peak at 2.84 ppm to
split into two distinct sharper peaks. The presence of residual water in raw, liquid CrEL
could potentially be masking the –OH groups present in the CrEL. To correctly identify
these absorptions as protons contributed from a functional hydroxyl group, another
experiment was performed. The NMR tubes containing CrEL and the mercury-
complexed CrEL that were dissolved in d6-acetone, 50 µL of deuterated water (D20) was
added, mixed and the NMR spectra obtained (see Figure 9 and 10). The broad peak that
was initially observed in CrEL is absent after the D2O was added. As seen in Figure 10,
the two peaks that were present at about 2.84 ppm are absent after the addition of D2O
indicating that the exchange of similar protons found in the raw CrEL was evident. The
protons were replaced with deuterium as illustrated below, thus proving that these were
–OH protons.
R-O-H + D-O-D → R-O-D + D-O-H
The absorptions for CrEL and CrEL-Hg complex were also integrated relative to the
solvent, d6-acetone. The difference in integration between the two compounds is

24
negligible. See Appendix C for the spectra containing the integrated absorptions. No
changes in chemical shifts of alkene protons (5.40 ppm), methylene protons of the
ricenoleic fatty acids (1.20 ppm) and glycerol protons (4.85 ppm and 4.15 ppm) were
observed. In conclusion, the 1H-NMR data suggests that mercuric chloride is being
complexed by the ether oxygens present in CrEL.

25
Figure 8. Overlay of CrEL (bottom) and Hg-complexed CrEL (top) 1H-NMR spectra.
-CH=CH -
- OH d 6 -acetone -CH2 --O -CH 2
2.84 ppm
3.66 ppm
3.58 ppm CrEL - Hg complex
CrEL
-CH=CH -
- OH d 6 -acetone -CH2 --O -CH 2
2.84 ppm
3.66 ppm
3.58 ppm CrEL - Hg complex
CrEL
26
-O-H
2.83 ppm
-O-H
2.83 ppm
Figure 9. Overlay of CrEL(top) and CrEL-deuterated water (bottom) 1H-NMR spectra.

27
-O-H
2.85 ppm
2.81 ppm
-O-H
2.85 ppm
2.81 ppm
Figure 10. Overlay of Hg-complexed CrEL (top) and Hg-complexed CrEL-deuterated
water 1H-NMR spectra (bottom).

28
The 13C-NMR spectra of CrEL and the Hg-CrEL complex provided further
support of the results from the 1H-NMR studies. The 13C-NMR spectra furnished results
that were unexpected at first in the region where carbons bound to oxygen absorb. The
chemical shifts of carbons single-bonded to oxygen generally absorb between 80 ppm
and 40 ppm. Figures 11-13 illustrate the specific absorptions of CrEL and the Hg-CrEL
complex. In Figure 11, the region where the alkane carbons absorb (40 ppm to 20 ppm) is
shown. As expected, there is no noticeable shifting that takes place in this region.
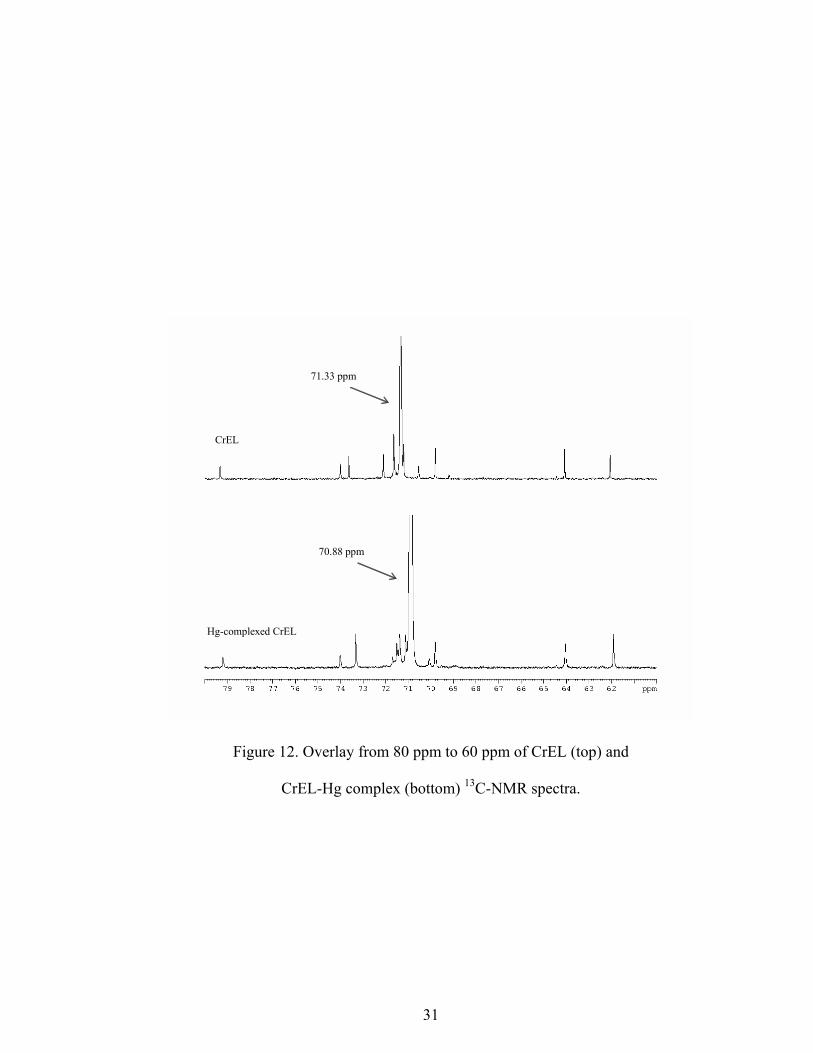
Figure 12 illustrates the region where there is significant shifting when mercury is
complexed with CrEL. In the area between 80 ppm and 60 ppm there are absorptions that
arise from the carbons bearing oxygens in CrEL. The chemical shifts are upfield in the
spectrum of the Hg-complexed CrEL, due to a shielding effect on the carbons adjacent to
the ether oxygens and the esters present. The carbonyl carbons of CrEL, which absorb at
approximately 174 ppm, do not show any effect when mercury is complexed as seen in
Figure 13. The results obtained in the 13C-NMR study further supports that the ether
oxygens present in CrEL are complexing with the mercuric chloride.
A survey of the recent literature pertaining to 13C-NMR shifts in mercury ether
complexes was performed to investigate these shifts that are in contrast (opposite
shifting) to those found in the 1H-NMR spectra. One study by Gray and Duffey included
a spectroscopic study that addressed how metallocrown ethers bind heavy metal cations
such as Hg2+ (Gray and Duffey, 1995). The 13C-NMR data was obtained for a penta-ether
molybdenum compound that was complexed with mercuric chloride. When the mercury
atom complexed with the ethers of the molybdenum compound, as further-evidenced by
X-ray diffraction studies, the chemical shift of the carbons flanked by the ether oxygens

29
were strongly shielded and required a higher applied field to bring them into resonance.
This upfield shift of the ether absorptions in the molybdenum complex supports the 13C-
NMR shifting of CrEL illustrated in Figure 12. Thus, this change in the chemical
(magnetic) environment of the C-O region shows support that the CrEL is complexing
with the mercury ion. The lack of changes in the alkene region between 150 ppm to 100
ppm of CrEL and Hg-complexed CrEL proves that the olefin present in CrEL is not
involved in the complexation reaction.

30
CrEL-Hg Complex
CrEL
CrEL-Hg Complex
CrEL
Figure 11. Overlay from 40 ppm to 20 ppm of CrEL (top) and
CrEL-Hg complex (bottom) 13C-NMR spectra.
31
70.88 ppm
71.33 ppm
CrEL
Hg-complexed CrEL
70.88 ppm
71.33 ppm
CrEL
Hg-complexed CrEL
Figure 12. Overlay from 80 ppm to 60 ppm of CrEL (top) and
CrEL-Hg complex (bottom) 13C-NMR spectra.

32
CrEL-Hg Complex
CrEL
CrEL-Hg Complex
CrEL
Figure 13. Overlay from 176 ppm to 170 ppm of CrEL and Hg-complexed CrEL
13C-NMR spectra.

33
To further support the theory that the mercury is coordinating with the
electronegative oxygens present in CrEL, another NMR spectroscopy experiment was
performed on PEG 400, a compound that reacts with mercuric chloride in a similar
fashion to CrEL. The spectra in Figure 14 are of PEG 400 and PEG 400 complexed with
mercuric chloride, prepared in a similar manner as CrEL. The full scale spectra can be
found in Appendix C. Figure 14 shows a significant shift of the ethylene protons when
complexed with the mercury. The major absorption for PEG 400 at 3.57 ppm has shifted
to 3.66 ppm when complexed with mercury. This deshielding effect corresponds to the
results seen in the CrEL shifts (0.1 ppm shift). The peak also exhibits more individual
peaks over a broader region as previously observed with the CrEL-Hg complex.
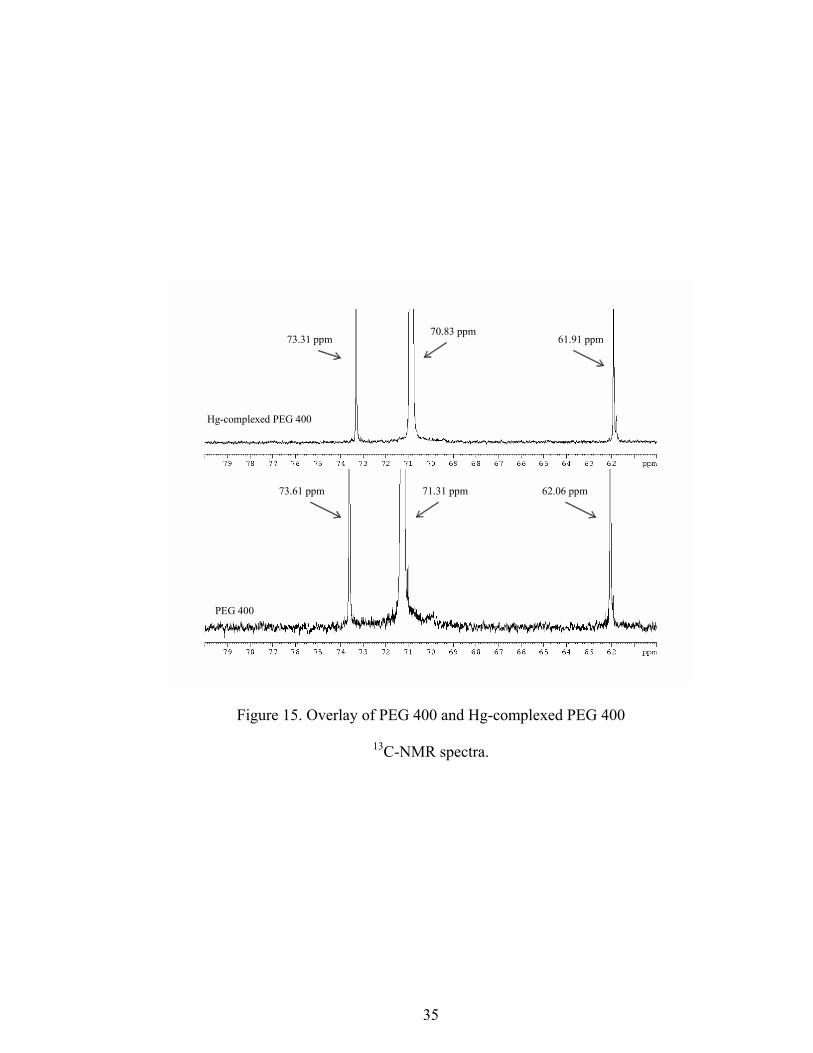
The data obtained from the 13C-NMR spectra for PEG 400 was analogous to the
data obtained for the CrEL. Figure 15 shows an overlay of the PEG 400 and the Hg-
complexed PEG 400 13C-NMR spectra. There is an upfield shift in the ether absorption
region from 71.31 ppm in the PEG 400 to 70.83 ppm in the Hg-complexed PEG 400.
This -0.5 ppm change in the absorption is indicative of a shielding effect due to the
complexation of mercuric chloride, which is analogous to the results obtained in the
studies performed with CrEL.

34
3.66 ppm
3.57 ppm
PEG 400
Hg-complexed PEG 400
3.66 ppm
3.57 ppm
PEG 400
Hg-complexed PEG 400
Figure 14. Overlay of PEG 400 and Hg-complexed PEG400
1H-NMR spectra.
35
70.83 ppm
71.31 ppm 62.06 ppm
61.91 ppm
73.61 ppm
73.31 ppm
PEG 400
Hg-complexed PEG 400
70.83 ppm
71.31 ppm 62.06 ppm
61.91 ppm
73.61 ppm
73.31 ppm
PEG 400
Hg-complexed PEG 400
Figure 15. Overlay of PEG 400 and Hg-complexed PEG 400
13C-NMR spectra.

36
FTIR Analysis
The interactions between metal ions, like divalent mercury, and polymers have
been shown to be weak in nature (Caykara, et al., 2004). Although binding forces such as
coordination bonds, hydrogen bonds, and charge-transfer interaction are generally weak,
they act cooperatively to affect the molecular environment during complex formation
(Caykara, et al., 2004). To aide in understanding these possible interactions and changes
in the molecular environment when the polymer CrEL is complexed with mercuric
chloride, techniques in Fourier transform infrared spectrophotometry (FTIR) were
employed. FTIR was used to investigate the vibrational changes in certain functional
groups present in CrEL and the Hg-complexed CrEL. The particular functional groups of
interest were the alkene, ester, and ether absorption regions.
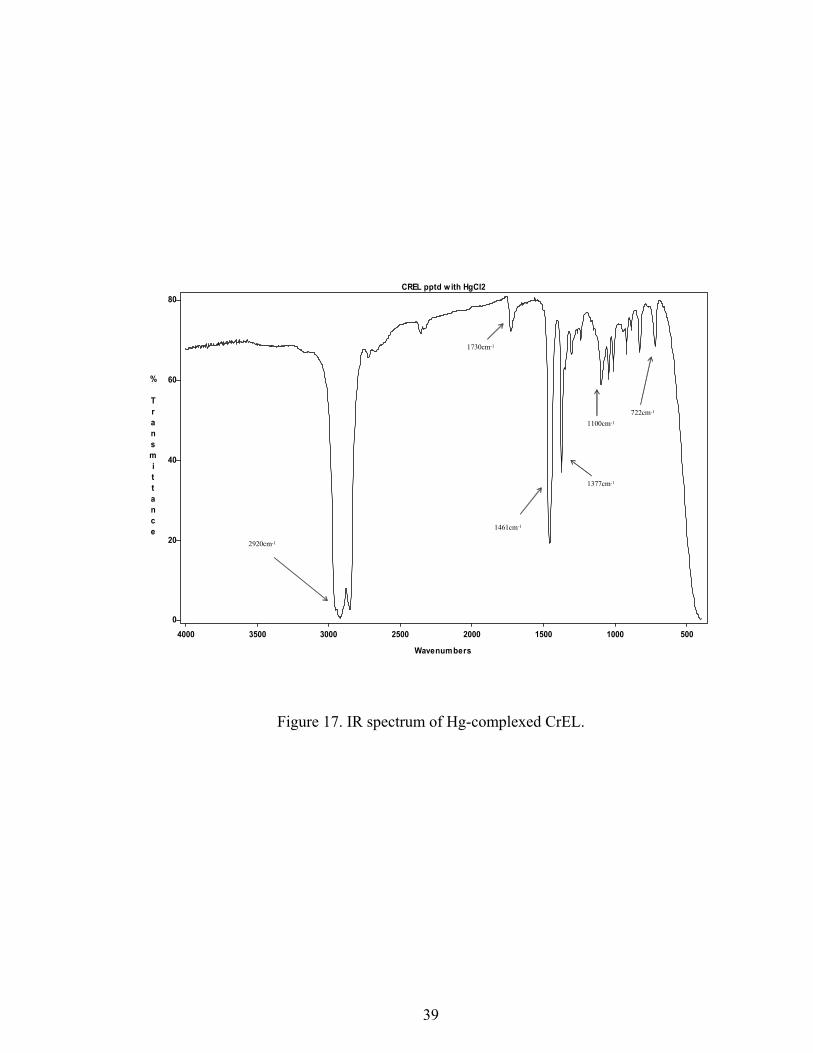
Figure 16 shows the FTIR spectra obtained from 4000 cm-1 to 500 cm-1 for the
pure polymer CrEL and Figure 17 shows the solid Hg-compexed CrEL. The pure CrEL
and the complexed solid were triturated with mineral oil (Nujol), suspended between two
sodium chloride plates and read using the infrared spectrophotometer. The absorption
bands at 1375 cm-1 and 1460 cm-1 in addition to the broad absorption at 2900 cm-1 are
partly contributable to the Nujol that was used to suspend the samples. In comparison of
the two CrEL-containing spectra found in Figure 16 and Figure 17, the most notable
difference between the two spectra is the hydroxyl region (3600 cm-1) due to residual
water, the ether region (1100 cm-1), and the ester region (1730cm-1). The absence of the
–OH stretch in Figure 17 is due to drying the CrEL-mercury complex in a vacuum over
silica gel. The residual moisture present in the raw, liquid CrEL was not able to be
removed by drying in a vacuum over silica gel. The C-O bending due to the ether

37
linkages at 1100 cm-1 is substantially reduced when complexed with mercuric chloride.
The ester peak found at 1730 cm-1 also shows a significant decrease is absorption when
complexed with mercuric chloride. No absorptions were observed for the alkene
absorption regions (3020-3100 cm-1 and 1650-1670 cm-1).
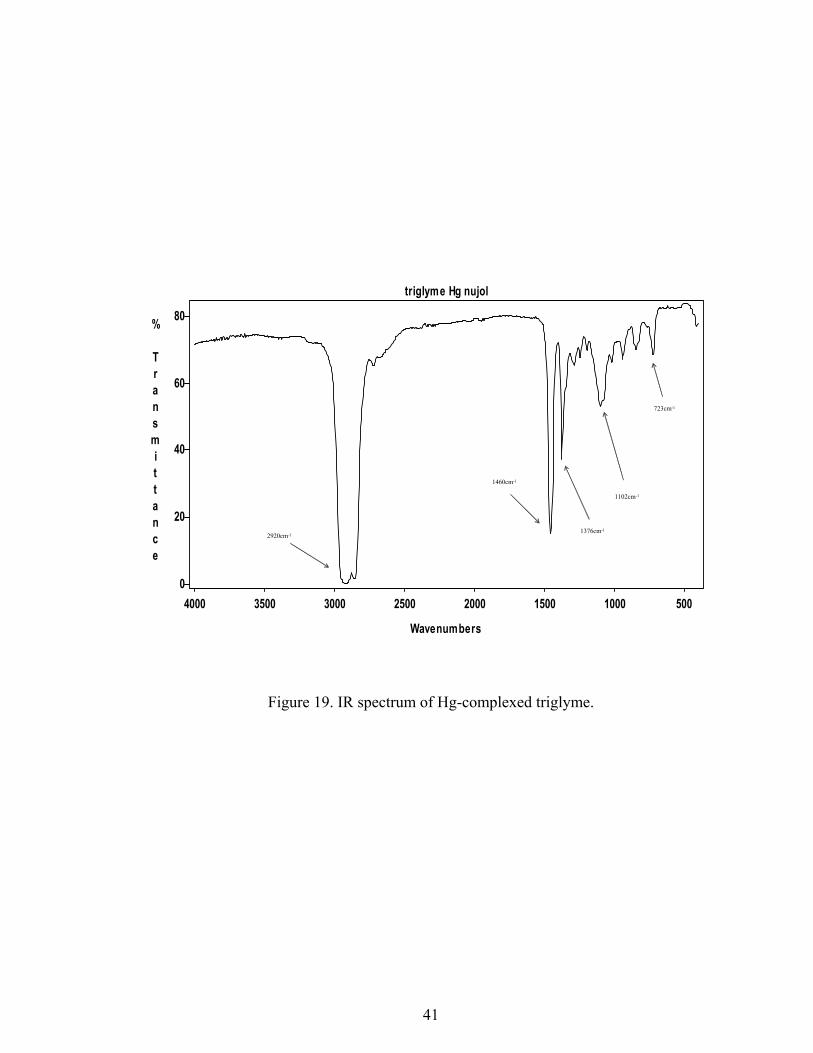
To support the observed changes in the IR spectra that were obtained with the
CrEL preparations, the same study was performed with triglyme, as illustrated in Figure
18 and Figure 19. The same effect was observed in the ether region (1100 cm-1) for
triglyme when it was complexed with the mercuric chloride as illustrated in Figure 19.
From the FTIR data that was obtained for the CrEL it is apparent that etheral oxygens
present in the molecule have a significant effect on the complexation with the cation,
mercury. This theory is supported by the similar results obtained for the ether, triglyme.

38
50010001500200025003000350040000
20
40
60
80
CREL nujol
Wavenumbers
% Transmittance
1734cm-1
1461cm-1
1112cm-1
723cm-1
2920cm-11376cm-1
50010001500200025003000350040000
20
40
60
80
CREL nujol
Wavenumbers
% Transmittance
1734cm-1
1461cm-1
1112cm-1
723cm-1
2920cm-11376cm-1
Figure 16. IR spectrum of CrEL.
39
50010001500200025003000350040000
20
40
60
80CREL pptd w ith HgCl2
Wavenumbers
% Transmittance
2920cm-1
1461cm-1
1730cm-1
722cm-1
1100cm-1
1377cm-1
50010001500200025003000350040000
20
40
60
80CREL pptd w ith HgCl2
Wavenumbers
% Transmittance
2920cm-1
1461cm-1
1730cm-1
722cm-1
1100cm-1
1377cm-1
Figure 17. IR spectrum of Hg-complexed CrEL.

40
5001000150020002500300035004000
20
40
60
80
100triglyme nujol
Wavenumbers
% Transmittance
2920cm-1
1452cm-1
1109cm-1
720cm-1
1367cm-1
5001000150020002500300035004000
20
40
60
80
100triglyme nujol
Wavenumbers
% Transmittance
2920cm-1
1452cm-1
1109cm-1
720cm-1
5001000150020002500300035004000
20
40
60
80
100triglyme nujol
Wavenumbers
% Transmittance
2920cm-1
1452cm-1
1109cm-1
720cm-1
1367cm-1
Figure 18. IR spectrum of triglyme.
41
50010001500200025003000350040000
20
40
60
80
triglyme Hg nujol
Wavenumbers
% Transmittance
2920cm-1
1460cm-1
1376cm-1
1102cm-1
723cm-1
50010001500200025003000350040000
20
40
60
80
triglyme Hg nujol
Wavenumbers
% Transmittance
2920cm-1
1460cm-1
1376cm-1
1102cm-1
723cm-1
Figure 19. IR spectrum of Hg-complexed triglyme.
42
X-ray Analysis
An X-ray diffraction study was performed to aid in the elucidation of the
mechanism of action for the precipitation of the CrEL. For single-crystal diffractometry,
it is essential to obtain a crystal that is of sufficient size (0.1-0.3 mm), shape (no physical
distortion) and uniform in its internal structure (Stout and Jensen, 1989). The selected
crystal must be pure at the atomic, ionic, or molecular level so as to provide meaningful
X-ray diffraction data. Therefore, the technique utilized to grow crystals from the liquid
phase becomes paramount. One of the preferred methods, and the one selected here, is to
grow crystals from a saturated solution that is allowed to slowly evaporate.
The first experiment performed attempted to show that the mercury atom was
complexing with the olefinic region of CrEL and then precipitating out of solution. To
simulate this reaction, 1-octene was mixed in a flat-bottom glass tube with an excess of a
saturated ethanolic solution of mercuric chloride then covered with a punctured piece of
aluminum foil. After the ethanol evaporated, a single white crystal was isolated using a
microscope, mounted on a glass fiber and placed in the gonimeter head. The data points
that were collected showed that the crystal was recrystallized mercuric chloride and that
no reaction resulting in crystallization with the olefin present in 1-octene took place.
Another X-ray study was performed on the precipitate obtained from the reaction
of CrEL with the ethanolic solution of mercuric chloride. Many attempts to isolate a
satisfactory crystal of the CrEL complex were tried using different solvents (dimethyl
sulfoxide, acetonitrile, ethanol, acetone, methanol, and dimethyl formamide) as well as
different divalent metal atoms (mercury, copper, cobalt, and zinc). The only substantial
crystals that were obtained were from the expected CrEL in ethanolic mercuric chloride.

43
Other solvent evaporations (methanol and dimethyl formamide) with mercuric chloride
furnished microcrystals that were unsuitable for analysis.
The diffractogram in Figure 20 is of the large crystal-like solid obtained from the
precipitation reaction of CrEL and ethanolic mercuric chloride. Since CrEL is not a pure
and distinct compound that can produce sizable, uniform crystals when complexed with
mercuric chloride, the quality of the diffraction pattern detailed in Figure 20 is expected.
From this diffraction pattern (Figure 20) and its tabulated data (Appendix D), it is evident
that the precipitate obtained is both amorphous and crystalline in nature due to the
fluctuating baseline and the sharp peaks respectively. To draw conclusive evidence from
this diffraction pattern, however, a significant amount of further research is needed to
develop an effective recrystallization technique for an isolated CrEL molecule so as to
properly identify the peaks present and thus, its true crystal structure.

44
Figure 20. Diffractogram of Hg-complexed CrEL.
1
2
3
4
5
6
7
8 9
10
11
12 13

45
HPLC-UV Analysis
Reverse-phase high performance liquid chromatography with ultra-violet
detection was utilized to physically separate and detect the chemical compounds present
in the parenteral formulation of paclitaxel. The extracts obtained from the bark and the
needles of the Pacific Yew tree contain a variety of taxanes in addition to paclitaxel,
which sometimes appear at low levels in the finished drug product. Over the last two
decades, a significant amount of research has been conducted on the separation of these
taxanes using HPLC. Until recently, bonded phases containing cyano-, phenyl-, and
octadecyl- groups where used (Shao and Locke, 1997). A new type of column with a PFP
bonded phase has been designed specifically for the taxanes which is remarkably
efficient. PFP phases are unique in their selectivity toward compounds containing
aromatic rings and other electron-rich groups as compared to alkyl-modified silicas.
Thus, the PFP bonded phase was selected for its ability to retain analytes with functional
groups that possess π electron systems as well as other electron-rich functional groups.
Nevertheless, a method must be developed that allows not only the separation of the
taxanes but the excipient from the taxanes as well. It is unfortunate that the excipient
(CrEL) that is required to make the drug soluble, has almost the identical absorption
spectrum (λmax ≈ 230 nm) as paclitaxel (Shao and Locke, 1997). This may cause
significant interference with coeluting peaks that are contributable to the drug product.
Dilutions of CrEL with ethanol were first prepared and injected onto the PFP
column and adjustments to the gradient and the injection volume were made so as to
optimize the chromatography. The precipitation reaction was applied to a 50% v/v
ethanolic solution of CrEL and injected onto the column. The resulting chromatograms

46
are overlayed in Figure 21. It is evident from Figure 21 that the removal of CrEL is
highly effective by the mercuric chloride precipitimetric method. The many peaks
between 17 min and 50 min caused by the large molecular weight distribution of CrEL
are removed. The ramp in the gradient of the mobile phase allowed for compounds
retained from the mercuric chloride precipitation reaction to be removed from the column
as is evidenced at 65 min in Figure 21.
Initial HPLC testing was performed on the paclitaxel raw material that was
prepared at 50 mg/mL in 50% v/v ethanolic CrEL and diluted with water to have a
working concentration of 1.0 µg/mL. Paclitaxel was diluted to 1.0 µg/mL to establish the
sensitivity of the instrument. The dilutions were initially made in water so as to prevent
the peak splitting that sometimes happens when organic liquids are injected into an
aqueous/organic phase system. It was observed during the analysis that the complexation
was not immediate and complete. Over a period of a week, the quantity of the precipitate
continued to increase in the filtered aliquot placed in the autosampler vial. When the
dilutions of stock solutions were carried out in ethanol instead of water, the reaction was
immediate and complete as evidenced by the absence of further precipitation after the
initial precipitate was centrifuged and filtered. As a result, all dilutions of stock solutions
were exclusively prepared with ethanol and not water. No peak-splitting was observed in
this method.

47
AU
-6.00
-4.00
-2.00
0.00
2.00
4.00
6.00
8.00
10.00
12.00
14.00
16.00
18.00
20.00
22.00
24.00
26.00
28.00
30.00
Time (minutes)0.00 5.00 10.00 15.00 20.00 25.00 30.00 35.00 40.00 45.00 50.00 55.00 60.00 65.00 70.00
CrEL
CrEL removed by ppt
AU
-6.00
-4.00
-2.00
0.00
2.00
4.00
6.00
8.00
10.00
12.00
14.00
16.00
18.00
20.00
22.00
24.00
26.00
28.00
30.00
Time (minutes)0.00 5.00 10.00 15.00 20.00 25.00 30.00 35.00 40.00 45.00 50.00 55.00 60.00 65.00 70.00
CrEL
CrEL removed by ppt
Figure 21. Chromatographic overlay of a 1.0% v/v ethanolic solution of CrEL (bottom)
and the solution after precipitation and filtration (top).

48
To demonstrate the broad range in which the solubilizer elutes, 1.0 mL of a
0.6 mg/mL paclitaxel solution in ethanol was spiked into 2.0ml of a 50% v/v CrEL
ethanolic solution. The chromatogram in Figure 22 illustrates this very large distribution
of CrEL. For drug substances that exhibit a greater hydrophobicity than paclitaxel and
use additional CrEL in their parental formulation when analyzing by HPLC will be an
issue.
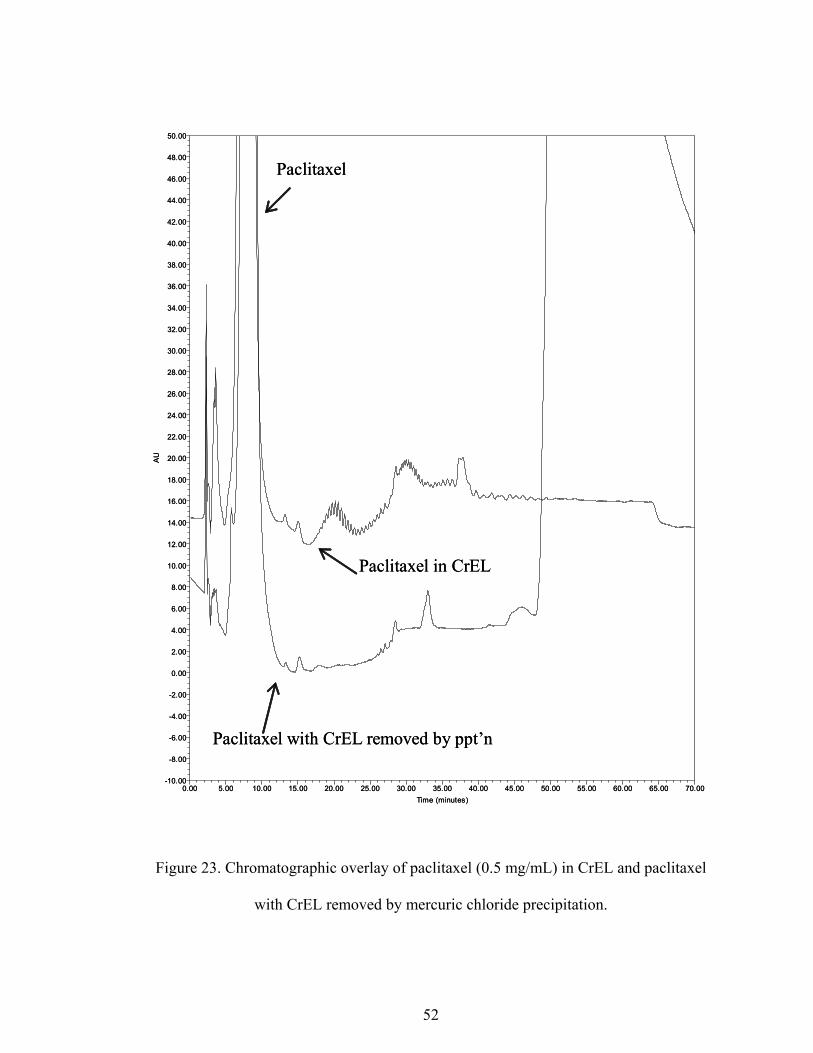
In order to determine if the precipitation reaction influences the drug product, an
experiment was performed with paclitaxel (25 mg/mL in 50% v/v ethanolic CrEL)
diluted to 0.5 mg/mL. In Figure 23, the top chromatogram is of the 0.5 mg/mL paclitaxel
solution and the bottom chromatogram is paclitaxel treated with saturated ethanolic
mercuric chloride and diluted to 0.5 mg/mL. The chromatograms illustrated in Figure 24
were acquired on the auxiliary system described in the experimental section with the flow
set at 1.5 mL/min. A majority of the CrEL was removed with the mercuric chloride
precipitation reaction and paclitaxel was not affected, as evidenced by the minor change
in the area counts of its peak (percent recovered: 95.4%).
To illustrate the selectivity of mercuric chloride for CrEL, Figure 24 shows a
chromatographic overlay of two preparations of the related substances. The bottom
chromatogram is a preparation of paclitaxel prepared at 0.5 mg/mL in ethanol and spiked
with a commercially purchased mixture of 13 taxanes at 0.1% of the 25 mg/mL paclitaxel
solution. The top chromatogram is of a preparation made at the same concentrations as
the control with CrEL present (10 µL/mL). A substitution of saturated ethanolic mercuric
chloride solution was used during an intermediate dilution step and filtered as stated in
the procedure. System suitability was established with five replicate injections of the

49
control solution with a percent-relative standard deviation (%RSD) at less than 3.0% for
all 14 components.
The elution order of the taxanes is broadly related to the molecular size and
increasing hydrophobicity. The retention time of the taxanes increase as the number of
acetylated hydroxyl groups and xylosyl groups are added to the taxane ring, (Shao and
Locke, 1997). The selectivity for the retention of taxanes is contributed by the π-π
interactions of the fluorines on the stationary phase with the carbonyl oxygens, the
principal electron-rich groups in the taxanes. In Table 2, the retention times and area
counts are listed for each of the related substances (taxanes) present in the control
solution illustrated in the bottom chromatogram in Figure 24. Table 3 lists the retention
times, area counts, and percent recovery of the related substances after precipitating CrEL
from the solution prepared at the same concentration as the control (top chromatogram in
Figure 24). Since the same concentrations were used for both preps, the percent-recovery
values were obtained by taking the ratio of the area counts of sample to the area counts of
control and multiplying by 100%. From the percent-recovery results illustrated in
Table 3, it is evident that the complexation of mercuric chloride does not interfere with
paclitaxel or its related substances. This allows for the peaks of interest in the drug
product to be accurately determined and quantitated.
The preparations illustrated in Figure 24 contained some impurities that were not
identified. There is one peak at 6.0 minutes in the top chromatogram that is an artifact of
a compound retained on the system and is diminishingly present in replicate injections of
the solution. Fortunately, this peak does not interfere with the related taxanes. There are
smaller extraneous peaks present in both chromatograms that may be due to either the
50
degradation of paclitaxel, additional taxanes present in the commercially purchased
mixture or impurities in the CrEL. The literature suggests that certain grades of CrEL
contain a sufficient amount of water to cause degradation of the paclitaxel (Shao and
Locke, 1997). The additional peaks seen in the chromatographic analysis of the paclitaxel
used in this method may be attributed to the CrEL used in this analysis. The CrEL is of
pharmaceutical grade. However, the container has been exposed to atmospheric moisture
during the last year and was not further purified. The moisture value for CrEL determined
by Karl Fisher titrimetric methods was 2.5%.

51
AU
-20.00
0.00
20.00
40.00
60.00
80.00
100.00
120.00
140.00
160.00
180.00
200.00
220.00
240.00
260.00
280.00
300.00
320.00
340.00
360.00
380.00
400.00
420.00
440.00
460.00
480.00
500.00
520.00
540.00
560.00
580.00
600.00
620.00
640.00
660.00
680.00
700.00
Time (minutes)0.00 5.00 10.00 15.00 20.00 25.00 30.00 35.00 40.00 45.00 50.00 55.00 60.00 65.00 70.00
CrEL
Paclitaxel
Figure 22. Chromatogram of paclitaxel (0.3mg/mL) dissolved in 50%CrEL in ethanol.
52
AU
-10.00
-8.00
-6.00
-4.00
-2.00
0.00
2.00
4.00
6.00
8.00
10.00
12.00
14.00
16.00
18.00
20.00
22.00
24.00
26.00
28.00
30.00
32.00
34.00
36.00
38.00
40.00
42.00
44.00
46.00
48.00
50.00
Time (minutes)0.00 5.00 10.00 15.00 20.00 25.00 30.00 35.00 40.00 45.00 50.00 55.00 60.00 65.00 70.00
Paclitaxel in CrEL
Paclitaxel with CrEL removed by ppt’n
PaclitaxelAU
-10.00
-8.00
-6.00
-4.00
-2.00
0.00
2.00
4.00
6.00
8.00
10.00
12.00
14.00
16.00
18.00
20.00
22.00
24.00
26.00
28.00
30.00
32.00
34.00
36.00
38.00
40.00
42.00
44.00
46.00
48.00
50.00
Time (minutes)0.00 5.00 10.00 15.00 20.00 25.00 30.00 35.00 40.00 45.00 50.00 55.00 60.00 65.00 70.00
Paclitaxel in CrEL
Paclitaxel with CrEL removed by ppt’n
Paclitaxel
Figure 23. Chromatographic overlay of paclitaxel (0.5 mg/mL) in CrEL and paclitaxel
with CrEL removed by mercuric chloride precipitation.

53
AU
-30.00
-28.00
-26.00
-24.00
-22.00
-20.00
-18.00
-16.00
-14.00
-12.00
-10.00
-8.00
-6.00
-4.00
-2.00
0.00
2.00
4.00
6.00
8.00
10.00
Time (minutes)0.00 2.00 4.00 6.00 8.00 10.00 12.00 14.00 16.00 18.00 20.00
321 4 5 6 7 8 9 10 11 12 13 14
Control of rel subs
Ppt’d CrEL rel subs
paclitaxel
AU
-30.00
-28.00
-26.00
-24.00
-22.00
-20.00
-18.00
-16.00
-14.00
-12.00
-10.00
-8.00
-6.00
-4.00
-2.00
0.00
2.00
4.00
6.00
8.00
10.00
Time (minutes)0.00 2.00 4.00 6.00 8.00 10.00 12.00 14.00 16.00 18.00 20.00
321 4 5 6 7 8 9 10 11 12 13 14
AU
-30.00
-28.00
-26.00
-24.00
-22.00
-20.00
-18.00
-16.00
-14.00
-12.00
-10.00
-8.00
-6.00
-4.00
-2.00
0.00
2.00
4.00
6.00
8.00
10.00
Time (minutes)0.00 2.00 4.00 6.00 8.00 10.00 12.00 14.00 16.00 18.00 20.00
321 4 5 6 7 8 9 10 11 12 13 14
Control of rel subs
Ppt’d CrEL rel subs
paclitaxel
Figure 24. Chromatogram of precipitated and filtered paclitaxel (0.5 mg/mL) in ethanolic
CrEL solution spiked with related substances mixture (0.1%) overlayed with a control
solution prepared at the same concentration with no CrEL.

54
Table 2. Retention times, and area counts for control preparation of paclitaxel and its
related substances.
Number/Name RT Control (min) Area Control 1. 10-Deacetylbaccatin III 4.89 10340 2. Baccatin III 7.24 8382 3. 7-Xylosyl-10-deacetyl-taxol B 7.99 8710 4. Taxinine M 8.33 9905 5. 7-Xylosyl-10-deacetyl-taxol 9.17 5547 6. Degradation peak unknown 10.31 4861 7. 7-Xylosyl-10-deacetyl-taxol C 10.66 9180 8. 7-Xylosyl-taxol 11.34 12244 9. 10-deacetyl-taxol 13.68 7814 10. Cephalomannine (taxol B) 13.99 20912 11. 7-Epi-10-deacetyl-taxol 14.66 14422 12. Taxol 15.44 9755687 13. Taxol C 16.61 6860 14. 7-Epi-taxol 19.05 26675

55
Table 3. Retention times, area counts, and percent-recovery after the precipitation of
CrEL from paclitaxel and its related substances.
Number/Name RT Sample (min) Area Sample %Recovery 1. 10-Deacetylbaccatin III 4.90 11520 111 2. Baccatin III 7.23 7679 92 3. 7-Xylosyl-10-deacetyl-taxol B 8.01 10092 116 4. Taxinine M 8.31 9359 94 5. 7-Xylosyl-10-deacetyl-taxol 9.14 6136 111 6. Degradation peak unknown 10.37 4352 90 7. 7-Xylosyl-10-deacetyl-taxol C 10.67 9198 100 8. 7-Xylosyl-taxol 11.35 14292 117 9. 10-Deacetyl-taxol 13.71 8820 113 10. Cephalomannine (taxol B) 14.05 26271 126 11. 7-Epi-10-deacetyl-taxol 14.75 16160 112 12. Taxol 15.52 10753090 110 13. Taxol C 16.68 6806 99 14. 7-Epi-taxol 19.19 28873 108

56
CONCLUSION
For drugs that are poorly soluble in water and are most efficacious by parenteral
administration, solubilizers such as CrEL are a necessary excipient. Furthermore, the
need for quantitatively and qualitatively determining these finished products will always
be mandated by the FDA. The sample treatment demonstrated here can be applied to
hydrophobic drugs in their finished product form that would otherwise suffer from
specificity issues due to CrEL.
The additional analysis performed on CrEL and mercury-complexed CrEL
encompassed the use of NMR, FTIR and X-ray to aide in determining the mechanism of
action. The data obtained from these experiments support the theory that CrEL is
selectively removed from a solution by divalent mercury binding to the polyether moiety
of the CrEL. Furthermore, the evidence collected from the instrumental analyses
presented here is supported by the literature referenced herein.
The goal of this work was to establish a sensitive and selective reversed-phase
HPLC method for the determination of a hydrophobic drug with CrEL removed by a
precipitimetric method. As an application of this method, Taxol® for injection
concentrate was prepared as the drug product because of its well known structure and
many related substances. The use of mercuric chloride to remove the solubilizer, CrEL,
from Taxol® for injection concentrate is adequate for the proposed objective. The
recovery results for the HPLC analysis of the 13 related taxanes demonstrate the theory
that mercury is selective enough to remove CrEL without removing the active, paclitaxel
and its related substances.

57
REFERENCES Anvarhusein, Isab A., Perzanowski, Herman P., 1H, 13C, and 199Hg NMR Studies of the -NHCS- Containing Ligands with Mercuric Halides., Polyhedron. 1995 (15-14) 2397-2401. Avis, Kenneth E., Lieberman, Herbert A., and Lachman, Leon., Pharmaceutical Dosage Forms: Parenteral Medications, Second Edition., New York: Marcel Dekker, Inc. 1992 (1). BASF Aktiengesellschaft, Cremophor EL Technical Bulletin, Marketing Feinchemie, Ludwigshafen, Germany., November 1998. Caykara, T., Inam, R., Öztürk, Z., Determination of the Complex Formation Constants for Some Water-soluble Polymers with Trivalent Metal Ions by Differential Pulse Polarography., Colloid Polymer Science. 2004 (282) 1282-1285. Ciutaru, Dana, Badea, Irinel, Lazar, Lelia, Nicolescu, Daniela, and Tudose, Aurel., A HPLC Validated Assay of Paclitaxel’s Related Impurities in Pharmaceutical Forms Containing Cremophor EL., Journal of Pharmaceutical and Biomedical Analysis. 2004 (34) 493-499. Costero, A.M., Andreu, C., Monrabal, E., Tortajada, A., Ochando, L.E., Amigo, J.M., Bis-cyclic Crown Ether Derived from Biphenyl. Different Behavior in Complexing Hg(SCN)2 and Hg(CN)2., Supramolecular Chemistry. 1998 (9) 211-219. Cotton, F.A., Wilkinson, G., Advanced Inorganic Chemistry, Fifth Edition., New York: John Wiley and Sons, 1988. Doxsee, K.M., Keegan, D.S., Wierman, H.R., Hagadorn, J.R., Arimura, M., Complexation-Mediated Crystallization., Pure & Applied Chemistry. 1993 (65-3) 429-434. Duplay, David, Physicians’ Desk Reference, 59thEdition., Montvale, New Jersey: Thomson PDR Publishers. 2005. Gelderblom, Hans, Verweij, Jaap, Brouwer, Eric, Pillay, Marrimuthoo, DeBruijn, Peter, Nooter, Kees, Stoter, Gerrit, Sparreboom, Alex, Disposition of [G-3H]Paclitaxel and Cremophor® EL, in a Patient with Severely Impaired Renal Function., Drug Metabolism and Disposition.1999 (27(11)) 1300-1305. Gelderblom, Hans, Verweij, Jaap, van Zomeren, Desiree M., Buijs, Dirk, Ouwens, Nooter, Kees, Stoter, Gerrit, Stoter, Sparreboom, Alex, Influence of Cremophor® EL on the Bioavailability of Intraperitoneal Paclitaxel., Clinical Cancer Research. 2002 (8) 1237-1241.

58
Ghassempour, Alireza, Nabid, Reza Nabid, Talebi, Mohammad, Entezami, Ali Akbar, Comparison of Pyrolysis Mass Spectrometry with High Performance Liquid Chromatography for the Analysis of Cremophor® EL in Drugs and Serum., Talanta. 2003 (59) 435-441. Gray, Gary M., Duffey, Christina H., Size-Selective Reactions of cis- Mo(CO)4{Ph2P(CH2CH2 O)nCH2CH2PPh2-P,P’} (n=4,5) Metallacrown Ethers with Mercury (II) Salts. Crystal Structure of cis- Mo(CO)4{µ-Ph2P(CH2CH2O)5CH2CH2PPh2-P,P’,O,O’,O’’, O’’’, O’’’’}·HgCl2, an Unusual Bimetallic Complex Containing a Molecular Cleft., Organometallics. 1995 (14) 245-250. Halford, Bethany., Potential New Use for Paclitaxel. Chemical and Engineering News. January 3, 2005, 9. Hancock, Robert D., Chelate Ring Size and Metal Ion Selection. Journal of Chemical Education. 1992 (69(8)) 615-621. Helm, Monte L., Combs, Charles M., VanDerveer, Donald G., Grant, Gregory J., Homoleptic Group 12 Metal Complexes of Macrocyclic Thioethers: the Crystal Structures of Bis(1,4,7-trithiacyclodecane)M(II) perchlorate: M(II) = Zinc(II), Cadmium(II), Mercury(II)., Inorganica Chemica Acta. 2002 (338) 182-188. Huizing, M.T., Rosing, H., Koopmans, F.P., Beijnen, J.H., Influence of Cremophor® EL on the Quantification of Paclitaxel in Plasma Using High Performance Liquid Chromatography with Solid-Phase Extraction as Sample Pretreatment., Journal of Chromatography B. 1998 (709) 161-165. Kunkel, M., Meyer, T., Böhler, J., Keller, E., Frahm, A.W., Titrimetric Determination of Cremophor® EL in Aqueous Solutions and Biofluids. Part 2: Ruggedness of the Method with Respect to Biofluids., Journal of Pharmaceutical and Biomedical Analysis. 1999 (21) 911-922. MacKay, K.M., MacKay, R.A., Henderson, W., Introduction to Modern Inorganic Chemistry, Sixth Edition, Nelson Thornes Ltd., United Kingdom. 2002. Maunu, S.L., Lindburg, J.J., Structural and Electrical Studies on Poly(ethylene oxide) Complexed with Inorganic Salts., Polymer Bulletin. 1987 (17) 545-549. Meyer,T., Waidelich, D., Frahm, A.W., Polyoxyethylene-∆9,11-didehydrostearate and Glycerol-polyoxyethylene-∆9,11-didehydrostearate: Two New Components of the Non-ionic Emulsifier Cremophor® EL., Journal of Pharmaceutical and Biomedical Analysis. 2002 (30) 263-271.

59
Meyer, Th., Böhler, J., Frahm, A.W., Determination of Cremophor® EL in Plasma After Sample Preparation with Solid Phase Extraction and Plasma Protein Precipitation., Journal of Pharmaceutical and Biomedical Analysis. 2001 (24) 495-506. Popović, Zora, Pavolvić, Gordana, Matković-Čalogović, Dubravka, Soldin, Želika, Rajić, Maša, Vikić-Topić, Dražen, Kovaĉek, Damir, Mercury(II) complexes of Heterocyclic thiones. Part 1. Preparation of 1:2 Complexes of Mercury(II) halides and Pseudohalides with 3,4,5,6-Tetrahydropyrimidine-2-thione. X-ray, Thermal Analysis and NMR Studies., Inorganica Acta. 2000 (306) 142-152. Shao, Lillian Kuangjing and Locke, David C., Determination of Paclitaxel and Related Taxanes in Bulk Drug and Injectable Dosage Forms by Reversed Phase Liquid Chromatography., Analytical Chemistry. 1997 (69) 2008-2016. Shao, Lillian Kuangjing and Locke, David C., Separation of Paclitaxel and Related Taxanes by Micellar Electrokinetic Capillary Chromatography., Analytical Chemistry.1998 (70) 897-906. Shou, W.Z., Browner, R.F., Evaluation of Crown Ether Complexation for Elemental Electrospray Mass Spectrometry., Analytical Chemistry. 1999 (71) 3365-3373. Snyder, Lloyd R., High Performance Liquid Chromatography, Advances and Prospectives., CS. Horvath Ed., New York: Academic Press. 1980. Sparreboom, Alex, van Tellingen, Olaf, Huizing, Manon T., Nooijen, Willem J., Beijnen, Jos H., Determination of Polyoxyethyleneglycerol triricinoleate 35 (Cremophor® EL) in Plasma by Pre-Column derivatization and Reversed-Phase High Performance Liquid Chromatography., Journal of Chromatography B. 1996 (681) 355-362. Stout, G.H., Jensen, L.H., X-ray Structure Determination, A Practical Guide, Second Edition, New York: John Wiley and Sons, 1989. Suffness, Matthew., Taxol Science and Applications., CRC press., 1995. Szebeni, Janos, Alving, Carl R., Savay, Sandor, Barenholz, Yechezkel, Priev, Aba, Danino, Dganit, Talmon, Yeshayahu, Formation of Complement-Activating Particles in Aqueous Solutions of Taxol: Possible Role in Hypersensitivity Reactions., International Immunopharmacology 1. 2001 721-735. The U.S. Pharmacopoeia, 28th ed., U.S. Pharmacopeial Convention: Rockville, MD. 2005.

60
Varshney, A., Gray, G.M., cis-Mo(CO)4{Ph2P(CH2CH2O)nCH2CH2PPh2} (n=3-5) Metallocrown Ethers. The X-ray Crystal Structure of cis- Mo(CO)4{Ph2P(CH2CH2O)nCH2CH2PPh2-P,P’}., Inorganic Chemistry.1991 (30) 1748. Williams, R.O., Sykora, M.A., Mahaguna, V., Method to Recover a Lipophilic Drug From Hydroxypropyl Methylcellulose Matrix Tablets., AAPS PharmSciTech. 2001 (2(2)) Article 8. www.glymes.com/description.php Yalkowsky, Samuel H., Solubility and Solubilization in Aqueous Media., American Chemical Society and Oxford University Press., 1999.

APPENDIX
Appendix A. Reagents used for each study.
Type of analysis/
study
reagent Manufacturer/ supplier
Precipitation Mercuric chloride Mercuric iodide
Mercuric bromide Barium chloride Mercuric acetate
Polyethylene glycol (mw 400) Diglyme (diethylene glycol
dimethyl ether) Triglyme (triethylene glycol
dimethyl ether) Glycerol ethoxylate Cis-3-hexene-1-ol
Resorcinol Cremophor® EL
Ethanol Water
Cobalt chloride Zinc chloride
Nickel chloride Silver chloride
Stannous chloride Magnesium chloride
Lead acetate Lithium chloride Ferric chloride
Lanthanum chloride Castor oil
Phenol
Aldrich Aldrich Aldrich Aldrich Aldrich Mallinckrodt Aldrich Aldrich Aldrich Aldrich Aldrich BASF Aaper Milli-Q Ultra Pure Aldrich Aldrich Aldrich Aldrich Aldrich Aldrich Fisher Fisher Fisher Fisher Fisher Aldrich
Solubility Dimethyl sulfoxide Carbon tetrachloride
Chloroform Dichloromethane
Acetonitrile Ethanol Acetone
Mercuric chloride Cremophor® EL
Methanol
Burdick and Jackson Aldrich Mallinckrodt Aldrich Burdick and Jackson Aaper Mallinckrodt Aldrich BASF Fisher

62
NMR Cremophor® EL Mercuric chloride
Ethanol Deuterated acetone Deuterated water
BASF Aldrich Aaper Aldrich Aldrich
IR Mineral oil (Nujol) Mercuric chloride Cremophor® EL
Ethanol
Sigma Aldrich BASF Aaper
X-ray Cremophor® EL Mercuric chloride
Ethanol Methanol
Isopropanol Dimethyl formamide
Cobalt chloride Zinc chloride
Nickel chloride Silver chloride Lead acetate
BASF Aldrich Aaper Fisher Fisher Burdick and Jackson Aldrich Aldrich Aldrich Aldrich Fisher
HPLC Paclitaxel Acetonitrile
Cremophor® EL Ethanol Water
Mercuric chloride 13-Taxanes mixture
AAI Pharma Burdick and Jackson BASF Aaper Milli-Q Ultra Pure Aldrich Hauser Chemical Research
Appendix B. Molecular structures of paclitaxel and related substances (taxanes).
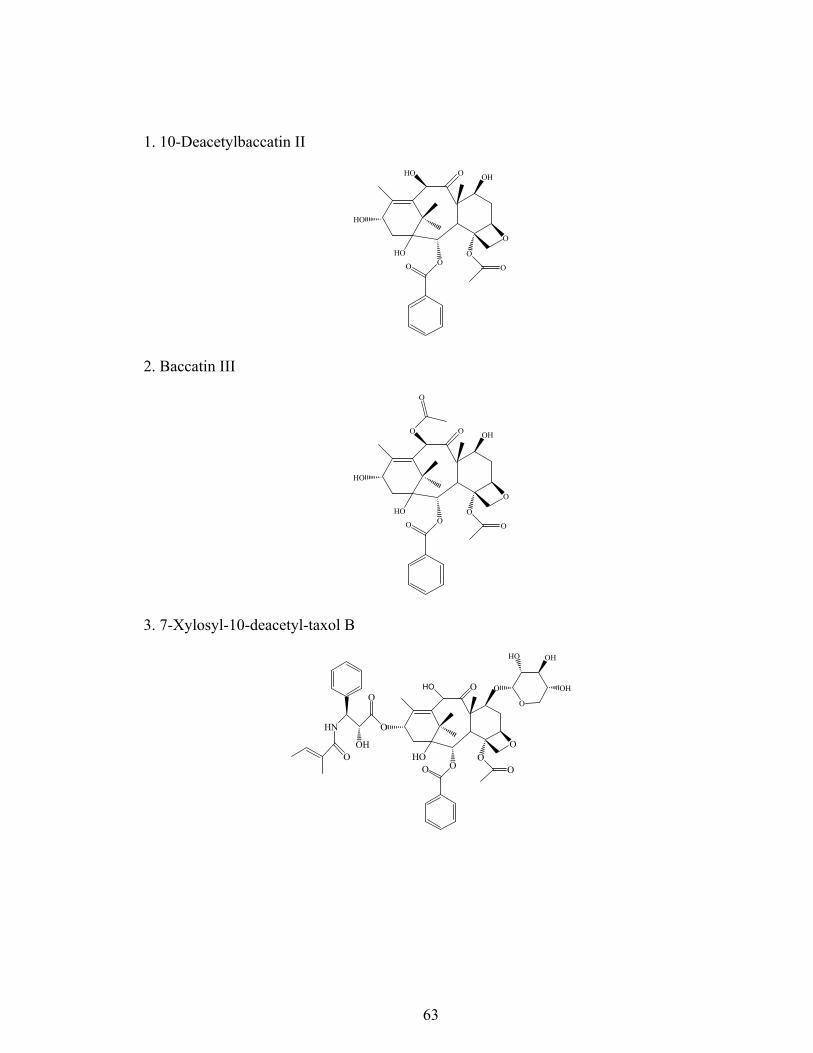
63
1. 10-Deacetylbaccatin II
HO
HO
OHO OH
O
O
OOO
2. Baccatin III
HO
HO
OO OH
O
O
OOO
O
3. 7-Xylosyl-10-deacetyl-taxol B
O
HN O
O
HO
OHO
OO
O
OH
OO
O
O
HO OH
OH

64
4. Taxinine M
OHO
HO
O
O
O
HOH
OO
O
O
O
OO
H
5. 7-Xylosyl-10-deacetyl-taxol
O
HN O
O
HO
OHO
OO
O
OH
OO
O
O
HO OH
OH
6. 7-Xylosyl-10-deacetyl-taxol C
HN O
OOHO
O
O
O
OH
OO
O HO
O
O
OH
HO OH

65
7. 7-Xylosyl-taxol
O
HN O
O
HO
OO
O
O
O
O
O
OH
OO
O
HO OH
OH
8. 10-Deacetyl-taxol
O
HN O
O
HO
OHO OH
OO
O
OH
OO
9. Cephalomannine
NH
O
O
HO
OO
O
OH
O
O
O
OH
OO
O
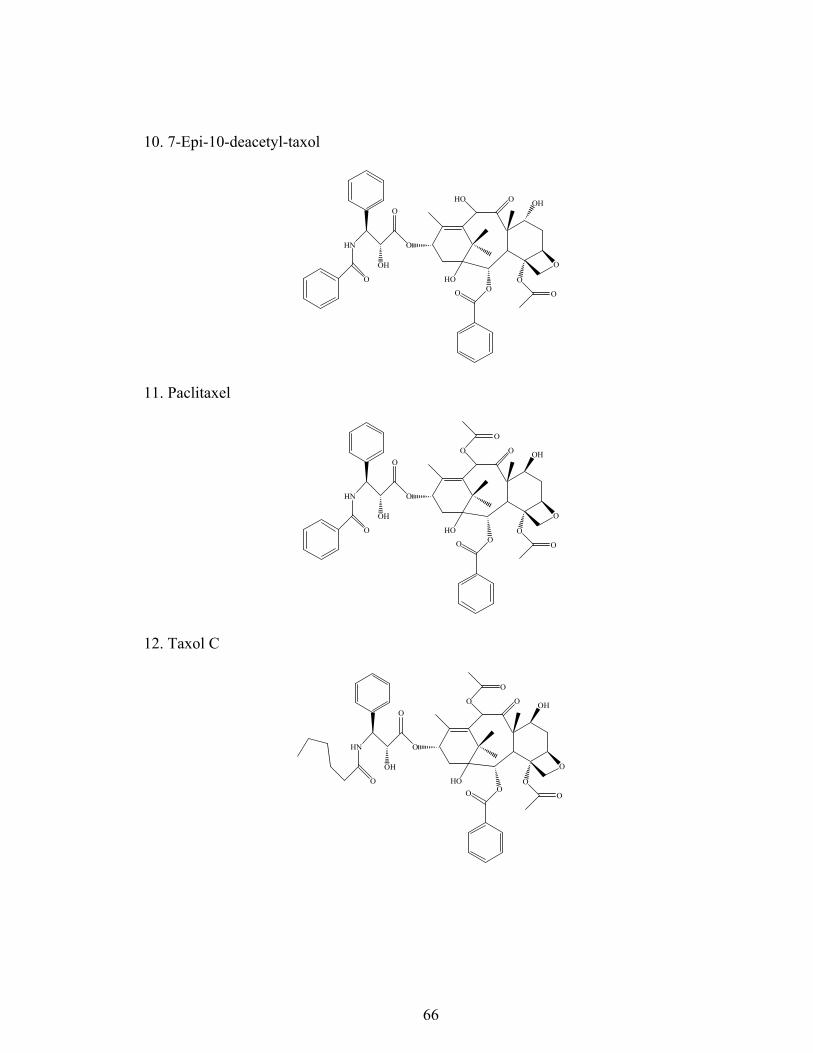
66
10. 7-Epi-10-deacetyl-taxol
O
HN O
O
HO
OHO OH
O
O
O
OH
OO
11. Paclitaxel
O
HN O
O
HO
OO
O
OH
O
O
O
OH
OO
12. Taxol C
O
HN O
O
HO
OO
O
OH
O
O
O
OH
OO
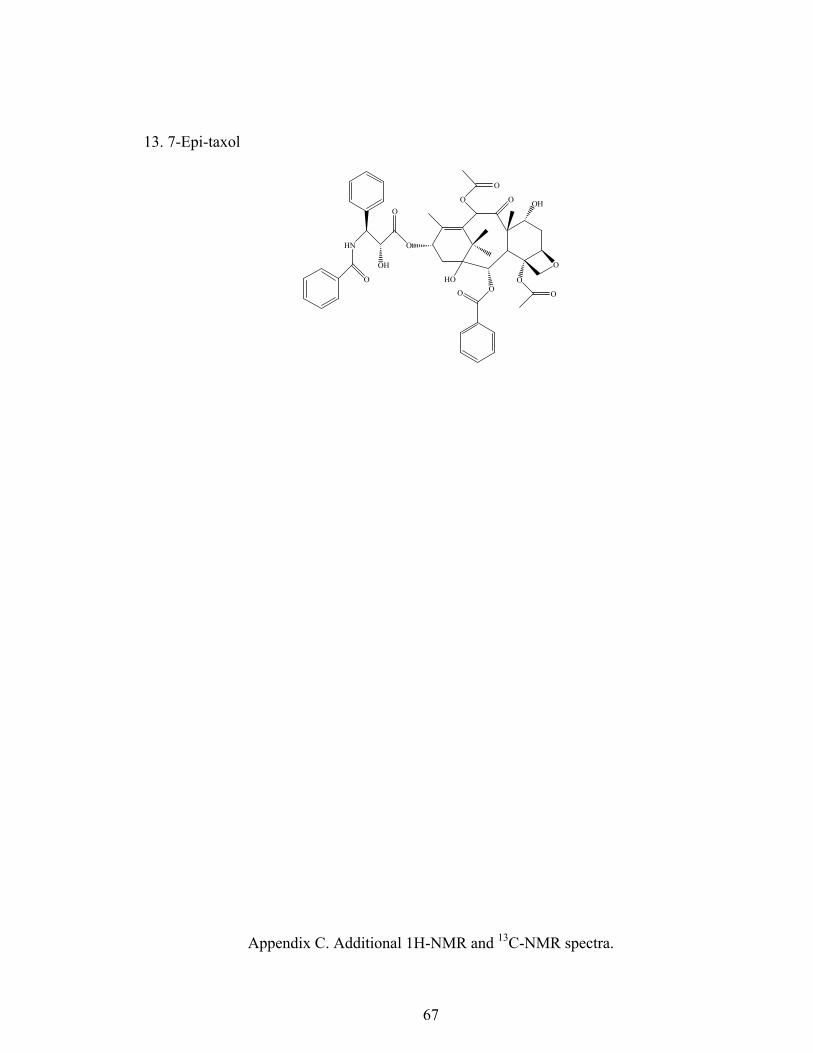
67
13. 7-Epi-taxol
O
HN O
O
HO
OO
O
OH
O
O
O
OH
OO
Appendix C. Additional 1H-NMR and 13C-NMR spectra.

68
Fullscale, integrated 1H-NMR spectrum of CrEL.
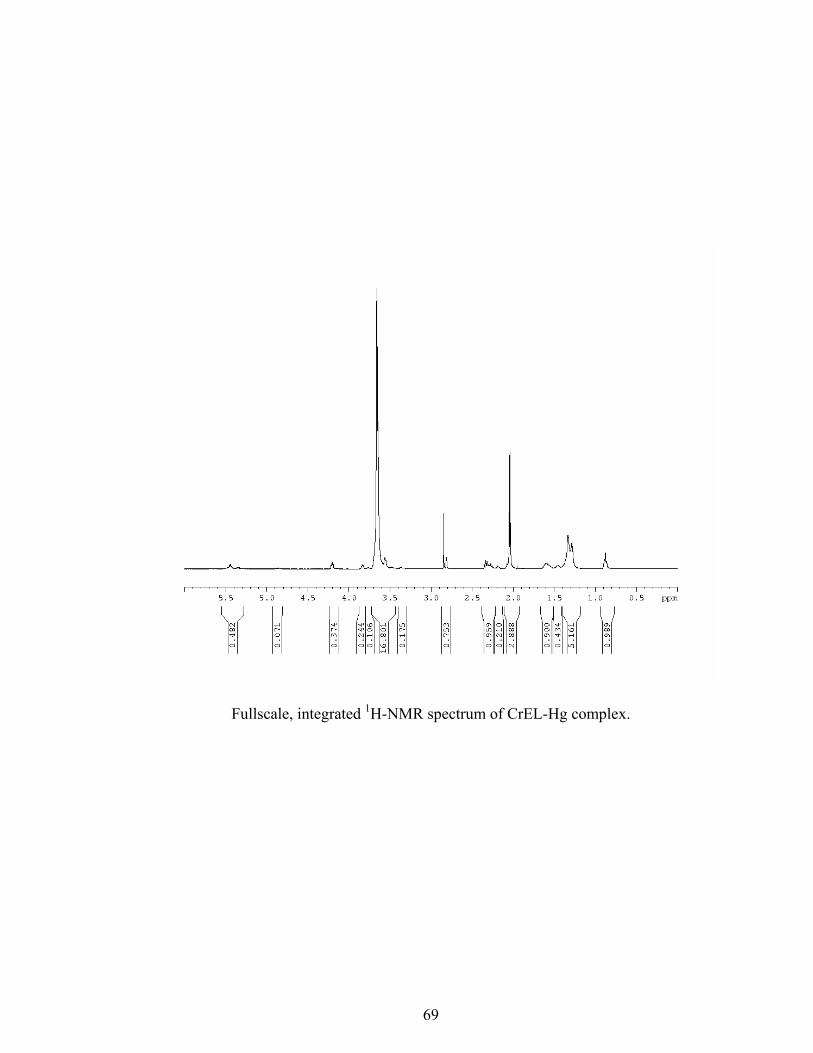
69
Fullscale, integrated 1H-NMR spectrum of CrEL-Hg complex.
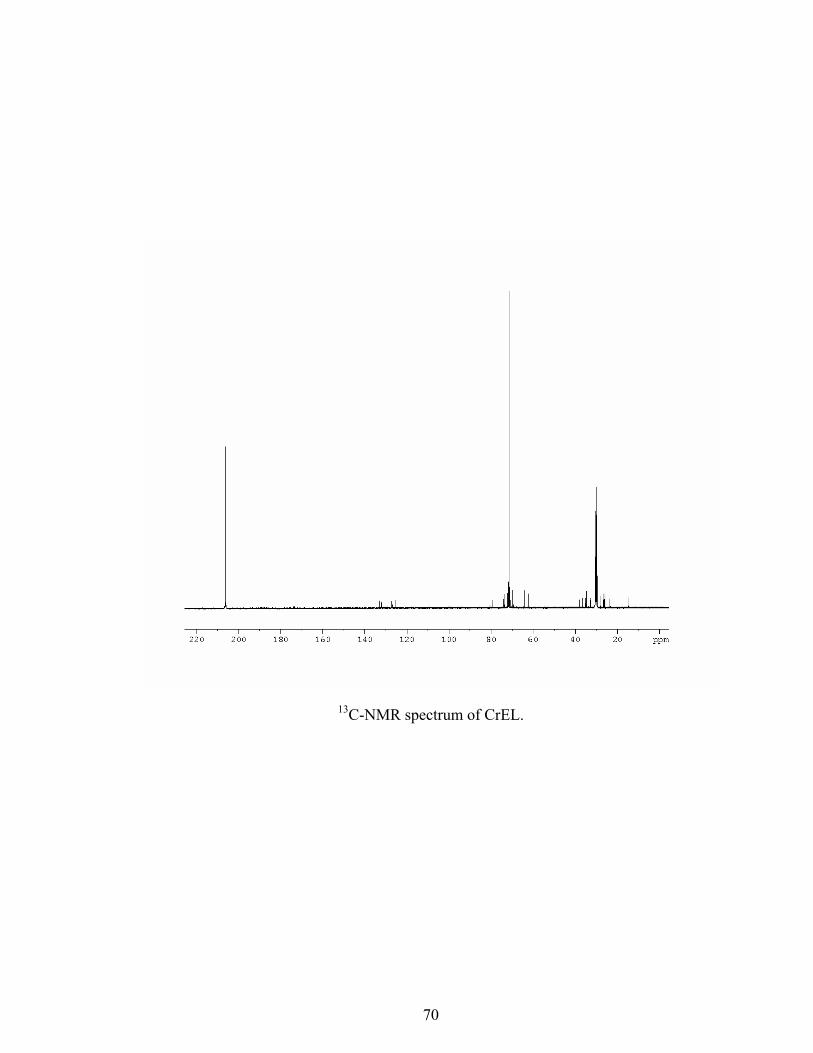
70
13C-NMR spectrum of CrEL.

71
13C-NMR spectrum of CrEL-Hg complex.

72
13C-NMR spectrum of PEG 400.
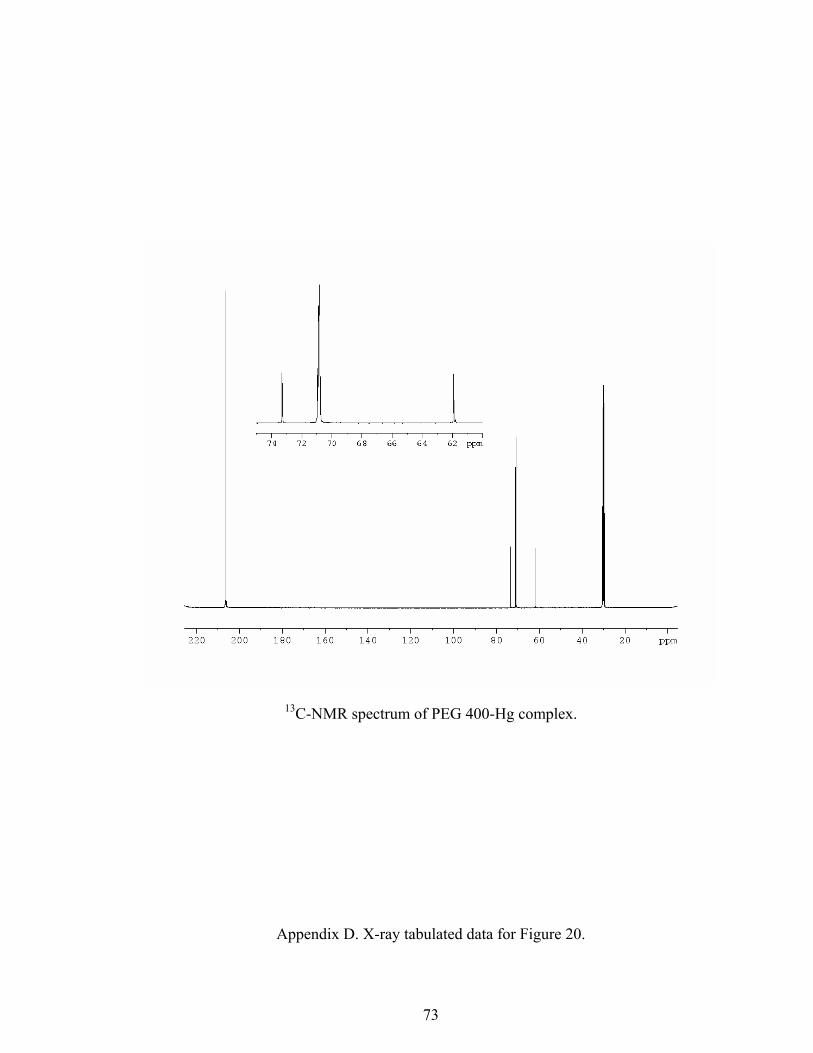
73
13C-NMR spectrum of PEG 400-Hg complex.
Appendix D. X-ray tabulated data for Figure 20.
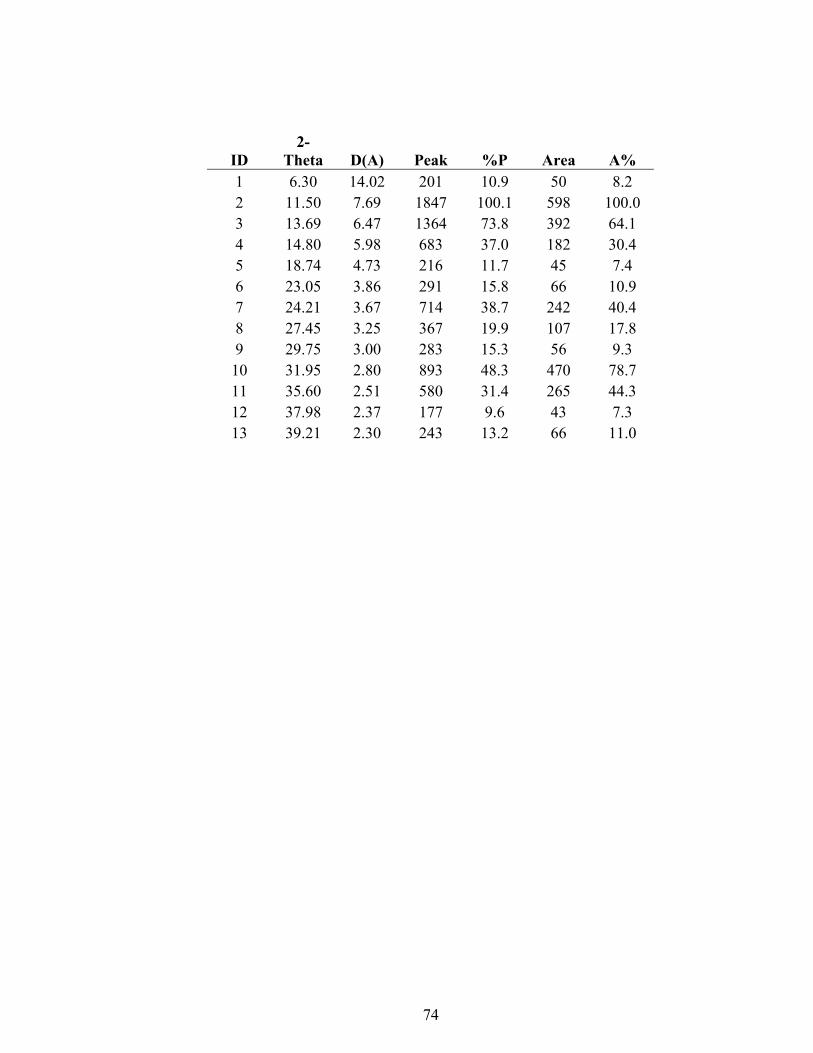
74
ID 2-
Theta D(A) Peak %P Area A% 1 6.30 14.02 201 10.9 50 8.2 2 11.50 7.69 1847 100.1 598 100.0 3 13.69 6.47 1364 73.8 392 64.1 4 14.80 5.98 683 37.0 182 30.4 5 18.74 4.73 216 11.7 45 7.4 6 23.05 3.86 291 15.8 66 10.9 7 24.21 3.67 714 38.7 242 40.4 8 27.45 3.25 367 19.9 107 17.8 9 29.75 3.00 283 15.3 56 9.3 10 31.95 2.80 893 48.3 470 78.7 11 35.60 2.51 580 31.4 265 44.3 12 37.98 2.37 177 9.6 43 7.3 13 39.21 2.30 243 13.2 66 11.0