the relative effects of several factors affecting
TRANSCRIPT

THE RELATIVE EFFECTS OF SEVERAL FACTORS AFFECTING RAINWATER DEPTHS ON PAVEMENT SURFACES Bob M. Gallaway , Jerry G. Rose , and R. E. Schiller, Jr. ,
Texas Transportation Institute, Texas A&M University
Reported are the results of a study concerned with determining the amount of water that can be expected to exist on various pavement-surface types under normal ranges of pavement cross slopes, rainfall intensities, surface textures , and drainage lengths. Equations are developed that relate these variables and their relative effects to water depth. Background information and pertinent past research pertaining to hydraulics of water flow over paved surfaces are given. Increases in pavement cross slope and surface texture resulted in decreased water depths, whereas increases in rainfall intensity and drainage length increased water depths. The findings and conclusions contained herein will be useful to highway engineers in determining proper geometric designs and paving materials commensurate with acceptable pavement friction characteristics and service demands. Suggestions for further research are also included.
•SAFETY on our nation's highways is a topic of utmost importance to the driving public. Concern for the prevention of traffic accidents is evidenced in every responsible agency from the Department of Transportation at the federal level to local highway authorities. The causes of traffic accidents are numerous, but the results are the same: costly destruction of property, incalculable human suffering, and an annual death toll exceeding 50 ,000 lives. Trends in the causes of traffic accidents have been discovered; research has been, and will continue to be, conducted in an effort to solve the problems that bring about this senseless loss of resources .
Among those topics that have received considerable attention during the past 30 or 40 years is the problem of producing roadway pavement surfaces that provide adequate tire-gripping capabilities under all operating conditions , thus reducing the occurrence of accidents attributed to skidding. Skidding occurs when frictional demands on the vehicle wheels exceed that available ; such loss results in increased stopping distance, loss of directional stability , and loss of operator control.
Characteristically, a pavement becomes slippery when the prevailing conditions are such that water lubricates the tire-road interface, when the inherently high skid resistance of a new surface has been worn and polished away by traffic , and/or when vehicle speeds during wet-pavement driving are high enough to hydrodynamically reduce or eliminate the tire-surface contact (hydroplaning) , and thus the available friction, below the level required for safe vehicle maneuvers (!) . Dearinger and Hutchinson (£) suggest that , although the details of the slipperiness-skid resistance problem are quite complex, most automobile accidents involving skidding are simply due to the unfortunately common combination of a wet pavement and an attempt by the driver to perform a maneuver (braking, cornering, or accelerating) at a speed too high for the conditions. The frequency of occurrence of this combination or circumstances has risen sharply in the past few years with continuing increases in traffic volumes and higher average vehicle speeds.
Sponsored by Committee on Surface Drainage of Highways and Committee on Operational Effects of Geometrics.
59
60
Numerous research studies have indicated that, neglecting contamination, all pavement surfaces exhibit adequate skid resistance for normal stopping and cornering maneuvers when dry and clean. When wet, however, this condition is no longer in effect for certain conditions and surface types, the only different condition being the presence of water between tire and pavement. Studying the factors affecting water-film thickness is, therefore, of paramount importance.
The research reported here deals with the effect of several variables on pavement water depth on full-scale elements of nine different pavement surface types under simulated rainfall of various intensities.
OBJECTIVES
The following were the objectives of this research:
1. To examine the relative effects of various rainfall intensities, pavement cross slopes, drainage lengths, and surface textures on resultant pavement water depths;
2. To develop an equation that relates rainfall intensity, pavement cross slope, drainage length, and surface texture to pavement water depth; and
3. To recommend means by which the findings and conclusions contained herein can be implemented by the highway engineer in determining proper geometric designs and paving materials commensurate with acceptable pavement friction characteristics and service demands.
BACKGROUND
Review of the Literature
Recognized research on the hydraulics of water flow evolved in 1775 with the investigations of Chezy (1). Manning (.1) extended this research in 1891. During the early 1900s, the so-called "rational formula" (.§) was introduced.
The first significant research on the hydraulics of water flow across paved surfaces was that of Horton in 1938 (fil. He derived a theoretical formula describing the runoff hydrograph. In 1946, Izzard (1) reported on extensive, practical experiments of overland flow and developed equations for calculating time to equilibrium flow, amount of equiiibrium fiow, and voiume of water in detention at equiiibrium. Izzard also determined that the form of the overland flow hydrograph could be presented as a dimension-1.ess graph, thus offering a means by which one might design street and parking lot structures.
Recently, researchers at the British Road Research Laboratory conducted experiments on actual road surfaces to determine relations between rainfall intensity, length of drainage path, slope, and water-film depths for the surface types most common on high-speed roads in the United Kingdom (,!!, ~' 1Q). A general equation relating these variables was developed. The tests were limited to extremely coarse-textured surfaces.
Nature of the Problem
Rainwater forms a layer of increasing thickness as it flows to the edge of a sloped pavement surface (Fig. 1). This water is a hazard to motorists due to the reduced frictional drag between the tires and the wet surface and due to the poor visibility caused by splash and heavy spray. The need to remove rainwater quickly from roads is even more important on multilane highways where greater water depths can be expected in the outside lanes. In addition, providing adequate texture in the road surface to allow escape of the remaining water under the tire is very important to achieve necessary tire-pavement mating, particularly on high-speed highways.
A lane of a modern highway surface is normally constructed to a slight plane cross slope. In practice, however, highways are not perfectly plane and do not always possess cross slopes. Water will flow across a surface along a line, the resultant slope of which depends on the transverse cross slope or superelevation and longitudinal gradient. An indication of the effects of various transverse cross slope and longitudinal gradient combinations on drainage lengths for a 24-ft wide pavement are given in

61
Table 1 (10, !.!., 11). It can be seen that steep longitudinal gradients and flat cross slopes markedly increase drainage lengths.
The existence of longitudinal gradient not only increases the flow-path length but also increases the water depth along the lower side of the road relative to the flat longitudinal gradient. The problem is further complicated by horizontal and vertical curves and combinations thereof as well as at-grade intersections. A major benefit of steep cross slopes is the reduction in the volume of water that can collect in pavement deformations. This is particularly important on surfaces that exhibit wheel-track rutting and localized deformations.
All road surface types will drain surface water rapidly and reasonably completely if cross slopes are steep enough. However , the slope must not be steeper than that acceptable from general considerations for road safety, design, drivability , and appearance . Driving on steep, tangent cross slopes presents a safety hazard, with the vehicle tending to veer toward the low edge of the pavement. According to the American Association of state Highway Officials <.!m, cross slopes up to ¼ in./ft (1 in 48) are barely noticeable in relation to vehicle steering. AASHO guidelines for cross slope with regard to surface type recommend t hat cros s slopes 11eve1· be flatter than 1/a in./ft .
Hydraulics of Water Flow
When a rainfall of constant intensity falls over a pavement surface, the following series of events takes place (Fig. 2):
1. Initially a certain amount of water is required to fill the interstices of the surface before runoff occurs. This amount is referred to as "depression storage" and is measured in volume per unit area or average depth in inches. It depends on the initial wetness of the surface, amount of surface texture , deformation in the surface, and cross slope.
2. After the amount of water required for depression storage is satisfied, runoff begins. The runoff rate increases to an equilibrium value , and for an impermeable surface this rate is equal to the rainfall intensity. It is during this interval that the amount of water detained on the surface increases to a maximum value. The thin sheet of water on the surface at the time of constant runoff, excluding that required for depression storage, is called "surface detention." It has the same units as depression storage and can also be expressed as a value at a point or an average over an area. Surface detention depends primarily on the cross slope and rainfall intensity.
3. When the rainfall ceases , the r unoff rate momentarily increases and then decreases to zero while the depth of water held by surface detention also decreases to zero.
4. Water that is contained in depression storage decreases by surface evaporation.
Yu and McNown (H) and Izzard (J) have reported that a momentary increase in runoff occurs immediately after the cessation of rainfall. This in effect indicates that raindrop impact increases the turbulence and hence increases the resistance to water flow over the surface during the period of rainfall.
When flow of thin films of water is laminar and steady, the resistance to flow is sol~ly due t o viscous shear . It has been experi mentally determined (1m, however, t hat free surface flow becomes unstable when the Froude number V /..,lgcI exce.eds 2 and the Reynolds number Vd/v exceeds 500. In these expressions Vis the average flow velocity, d is water depth , and v is the kinematic viscosity. Thus on slopes greater than 1 in 42 where the water depth is greater than 0.08 in., the water flow will tend to be nonlaminar even on perfectly planar surfaces. With the combination of rough texture and the disturbing effect of raindrops on pavement surfaces, water flow is generally turbulent after a short length of flow.
TEST FACILITIES AND PROCEDURES
Surface Types
Nine test surfaces were placed on individual 281/2-ft long by 4-ft wide, double T, prestressed concrete beams. Each surface represented a section of a highway surface 2 lanes wide taken perpendicular to the direction of travel (Fig. 3).

62
Figure 1. Water flow over an impermeable road surface.
RAINFALL INTENSITY I
Figure 2. Rainfall runoff hydrograph.
"-l's z ::, a:
CONSTANT RUNOFF RAINFALL BEGINS CEASES
INTERVAL OF EQUILIBRIUM
RUNOFF
LOST
TIME--
Table 1. Effect of cross slope and longitudinal gradient on drainage length.
Increase Transverse in Cross Longitudinal Drainage Drainage Slope Gradient Length l,ength" (in./ft) (percent) (It) (percent)
'!,, 0 24 1 52 117 2½ 118 390 5 232 866
10 461 1,820
'I, 0 24 1 25 4 2½ 31 29 5 45 88
10 80 233
3 With respect to a zero longitudinal gradient.
v
- DEPRESSION STORAGE
I - SURFACE DETENTION
Figure 3. Surface element.
63
Descriptions of the surfaces are given in Table 2. The surfaces that were chosen contain the range of textures found on Texas highway pavements. Previous research had indicated that , on a random sample of 41 Texas highway pavements , textures ranged from 0.00 to 0.07 in. (.!§). Photographs of the surfaces are shown in Figure 4.
Equipment
A general view of the test equipment is shown in Figure 5. The tests were conducted inside a former airfield hangar in order to minimize wind effects. Following are descriptions of the various components.
The two 30-ft long by 9-ft high frames used to support the 58 U.S. Forest Service Type F nozzles were composed of 4-in. wide by 1-in. deep channel iron. The upper hol'izontal channels were attached to the vertical channels in such a manner that the upper channels could be pivoted , thus permitting the water spray from the nozzles to be directed over the test surface . The nozzles, located approximately 1 ft to the sides and 5 ft above the test surface, were equally spaced 1 ft apart on the two frames. The orifices were placed so that every fourth nozzle had the same orifice size. This same pattern was followed on the opposite side ; however, the spacing of similar orifices was offset by two nozzles so that , when nozzles of a given orifice size were operating , the rainfall spray would tend to be more uniform on the surface.
The two-hose nozzles were placed directly over the test surface. One was centered at the upper end and the other centered 9 ft from the lower end of the surface. The nozzles, located 15 ft above the surface, sprayed a circular pattern, only part of which fell on the test area and thereby contributed to the intensity. Half-in. pipes attached to the top of the frame served as support for the nozzles.
Two 10-ft long, 10-in. diameter met al pipes sealed at both ends s erved a~ manifolds. Connections between the ½ -in. hose and manifolds were ¾ - in. pipe couplings . Gate valves were placed between each coupling and hose . The upper ends of the hose were attached to the upper channels.
Water was supplied to the manifolds through a 2- in. diameter pipe . Flow and pressure were controlled by both a gate valve and a butterfly valve. Another butterfly valve was used for an instant bleeder valve. Water pressure gauges were placed in bot)l manifolds to monitor the water pressure.
The end of the test surface, which was to simulate the outer or lower edge of the pavement, was placed 4 ft above the floor on a specially designed stand. This stand was bolted to the concrete floor to prevent the beam from moving. The other end of the beam was placed directly on two 2-ft high, 5-ton mechanical jacks. The jacks had a throw of 12 in. It was therefore necessary to use a 2-in. spacer between the jack and beam in order to achieve the desired range of cross slopes.
Redwood strips, 6 in. wide and 1 in. thick, were attached to each side and to the upper end of the beam. The strips extended 2 in. above the surface. The strips were required to prevent the water from running off the side of the flat beam and thus confine it to the 4-ft wide surface. The space between the strips and the surface was sealed with caulking compound. An aluminum flume was placed on the lower end of the beam for the purpose of directing the water into the collecting tank.
A 3-ft square by 2-ft deep metal tank was used to collect the water at the lower end of the beam. An auxiliary tank with similar dimensions was connected to the tank and used in combination during the heavier rainfalls . For the lower rainfall rates only one tank was needed because the capacity was sufficient to accommodate the discharge.
A special order stevens Type F Recorder was used for maintaining a graphic record of the time rate of water-level rise in the tank. The smallest time scale division of the recorder chart was equal to 3 7. 5 sec, and the scale could be estimated to the nearest 3.75 sec. In operation, the horizontal chart drum is turned in response to a large diameter float action, which is equal to changes in water levels. The large float allowed water surface measurements to the nearest 0.005 ft. The stylus is moved across the width of the chart paper at a clock-controlled constant speed. After the rate of water rise in the tank becomes constant, the rainfall intensity over the surface can be deduced from the time rate of water-level rise in the tank. The recorder was positioned dir ectly over the collecting tank, and a stilling well was used to protect the float from turbulence.
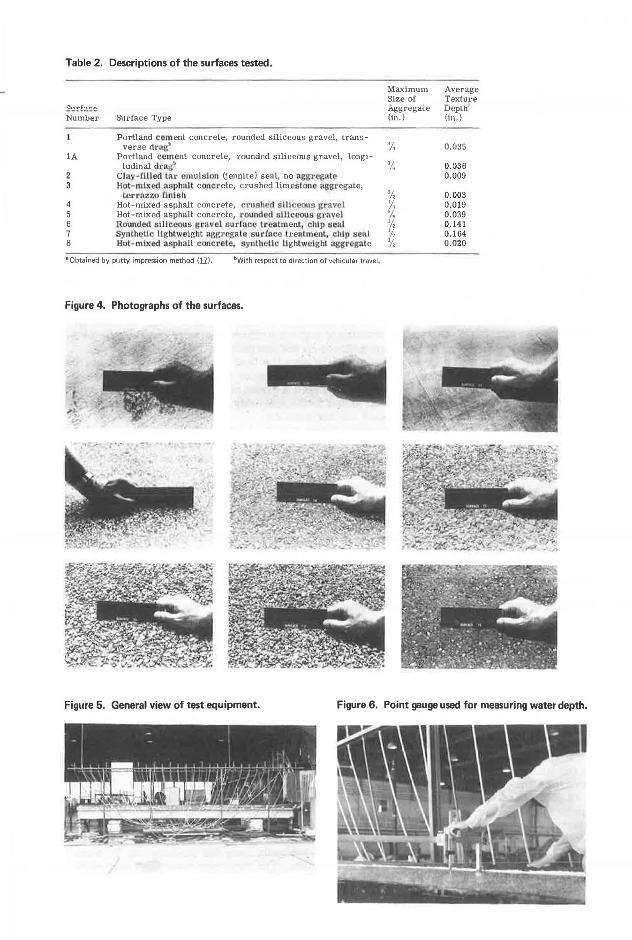
Table 2. Descriptions of the surfaces tested.
Number
lA
2 3
4 5 6 7 8
Surface Type
Portland cement concrete, rounded siliceous gravel, transverse dl·ug-'
Portland cement concrete, rounded siliceous gravel, longitudinal drag'
Clay- lllled tar emulsion {jennite) seal, no ngg1·cgntc Hot- mixed asphalt concrete, crushed limestone !l{l'.gregate,
terrRZY.O r.lnlsh Hot-mixed asphalt concrete, c rUBhetl sHlce011s g,ravcl Hot-mixed asphalt concrete, 1·ounded s iliceous gnwel Rounded fJlllccous g1·avel surface treatment, chip seal Synthetic Ughtweight aggregate sud.nee treatment, chip seal Hot - mixed asphfllt concrete, synthetic Ughtwelght aggregate
0 0btained by putty impression method (11). bWith respect to direction of vehicular travel .
Figure 4. Photographs of the surfaces.
Maximum Average Size of Texture Agi;regace Deptn' (in.) (in.)
¾ 0,035
¾ 0.036 0.009
½ 0.003 ¼ 0,019 % 0.039 ½ 0.141 ½ 0,164 ½ 0.020
Figure 5. General view of test equipment. Figure 6. Point gauge used for measuring water depth.
65
A Leupold and stevens point gauge was used for measuring the water depths on the surfaces. The metric scale vernier can be read directly to the nearest 0.2 mm. The gauge was attached to a 46-i.n. long stand as shown in Figure 6 and could be moved along the full length of the stand. Measurements were taken accordingly.
The silicone putty impression method was used for assessing the degree of surface macrotexture (Fig. 7). This method was initially developed as a means of providing surface-texture correction factors for nuclear density measurements and has also been used in pavement friction research (!1, 1fil. The equipment consisted of a 6-in. diameter by 1-in. thick metal plate with a 4-in. diameter ½0-in. deep recess machined into one side and a 15. 90-gram ball of silicone putty. When placed on a smooth surface, 15.90 grams of putty will smooth out to a 4-in. diameter circle, 1
/ 16 in. deep, thus completely filling the recess.
The silicone putty is formed into an approximate sphere and placed on the pavement surface. The recess in the plate is centered over the putty, and the place is pressed down in firm contact with the road surface. The more irregular the surface texture (the higher the macrotexture) is, the smaller the resulting putty diameter will be because more material is required to fill the surface texture. Average texture depth, based on volume per unit area, is calculated from an average of four diameter measurements.
Testing Procedure
A methodical test procedure was used for each surface . Five water depth measurements spaced equidistant ac1·oss the width of the surface were taken at four locations (approximately 6-ft intervals) along the drainage length of the sm•face. Measurements were taken at approximately 6, 12, 18, and 24 ft as measured from the upper end of the drainage area. These 20 measurements were repeated for each cross slope-1·ainfall intensity combination. Table 3 gives 25 series that were used. An additional five series at a cross slope of 1 in./ft (1:12) were taken on three sul'faces. A minimum of 500 depth measurements was taken on each surface.
Zero measurements were first taken at each test spot. These were necessru.·y in order to establish a datum plane at the top of the texture from which subsequent waterdepth measurements could be referenced. Botl1 positive (i.e. , above top of texture) and negative (i.e. below top of textu1·e) water depths were reco.rded.
It was desirable .for the raindrop size to increase ~ the rainfall intensity was increased. This requirement necessitated tl1e use of different nozzle orifice sizes; the larger orifices produced higher inte11sities and correspondingly larger drop sizes. The intensity could also be varied by regulating the water pressure and changing the number of nozzles. The hose type of nozzle was used for the lowest rainfall intensity.
ANALYSIS AND DISCUSSION OF TEST RESULTS
The water-depth data for each surface were analyzed by using a computerized multiple regression program to obtain the best fit of the data. Equations were derived for determining water depths based on both the top and bottom of the texture datum planes. Because a logru.·ithmic model was used the equations based on the top of the texture datum plane are only valid for water depths greater than zero. (Logarithmic models do not accept zero or negative values.) When the water depth above tlle texture approaches zero or becomes negative equations based on a datum plane at the bottom of the texture must be used with appropriate average texture depths subtracted from the resulting water depths. The subtraction shifts the datum plane to the top of the texture.
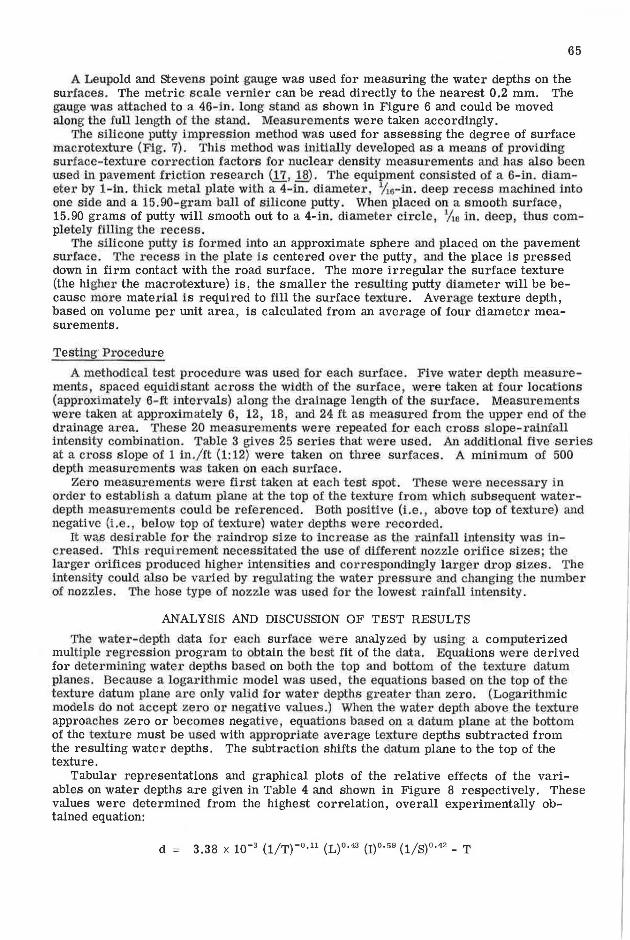
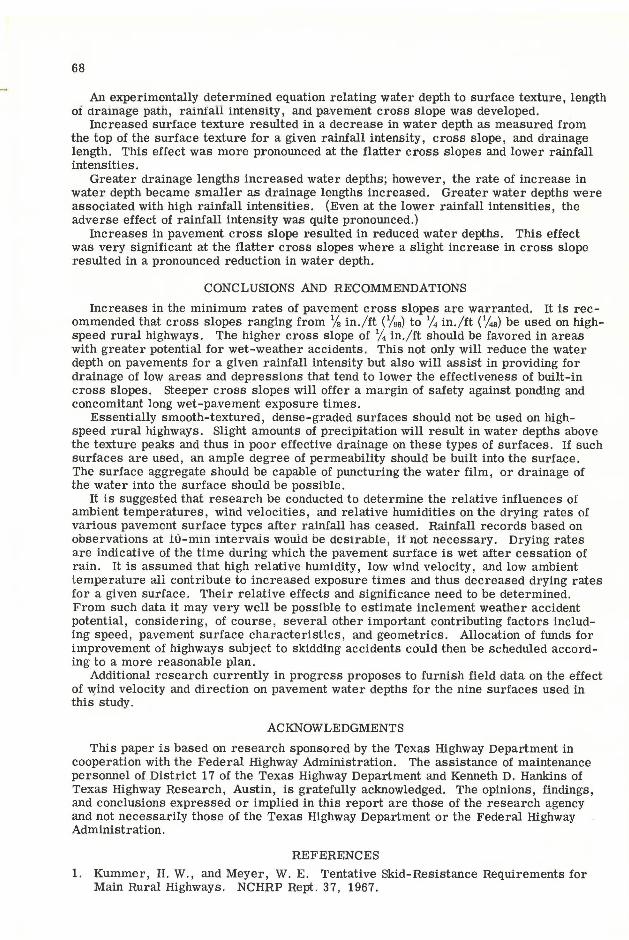
Tabular representations and graphical plots of the relative effects of the variables on water depths are given in Table 4 and shown in Figure 8 respectively. These values were determined from the highest correlation, overall experimentally obtained equation:
d 3.38 x 10⁻³ (l/T)-0.11 (L)o.43 (I)°·s9 (l/S)o.42 - T
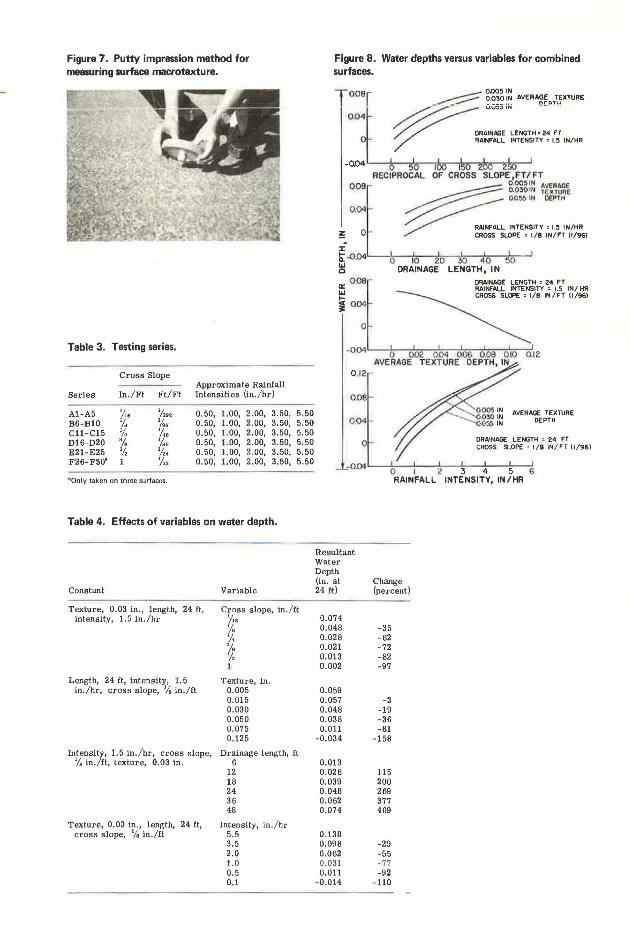
Figure 7. Putty impression method for measuring surface macrotexture.
Table 3. Testing series.
Cross Slope
Series In./Ft Ft/Ft Approximate Rainfall Int ensities (in./hr)
Al-A5 '/,, 1/ 192 0.50, 1. 00, 2.00, 3.50,
B6-B10 'I, ¼, 0.50, 1. 00, 2.00, 3.50, Cll-C15 ¼ ¼, 0.50, 1. 00, 2.00, 3.50, D16-D20 ¾ ½, 0.50, 1.00, 2.00, 3.50, E21-E25 ½ •;,. 0.50, 1. 00, 2.00, 3.50, F26-F30" 1 '/12 0.50, 1.00, 2.00, 3.50,
"Only taken on three surfaces.
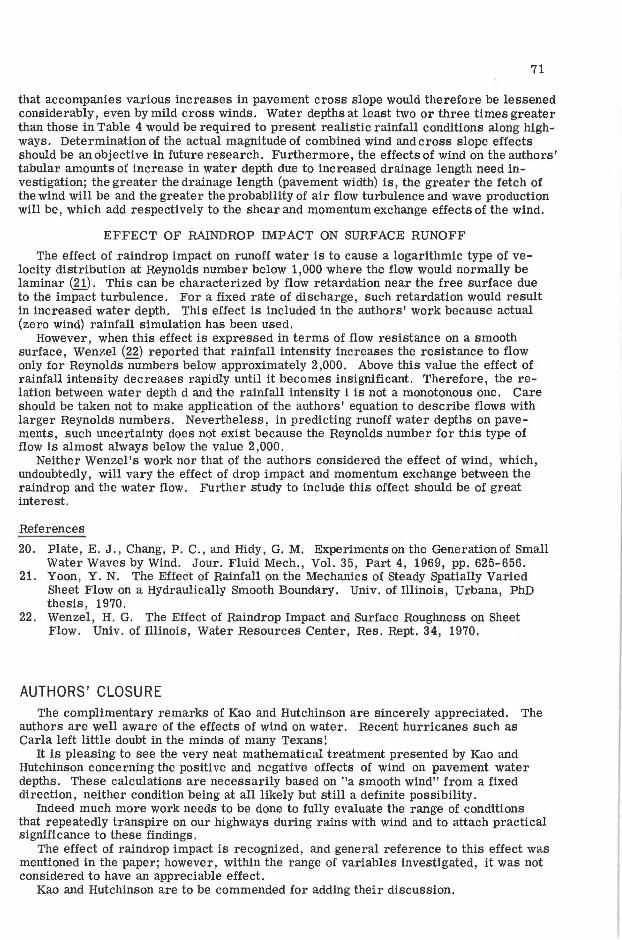
Table 4. Effects of variables on water depth.
Constant Variable
5.50 5.50 5.50 5.50 5.50 5.50
Texture, 0.03 in., length, 24 ft, Cross slope, in. / ft '/ .. intensity, 1.5 in./hr 1/. ¼ '/, ½ 1
Length, 24 ft, intensity, 1. 5 Texture, in. in./hr, cross slope, 1
/, in./ft 0.005 0.015 0.030 0.050 0.075 0.125
Intensity, 1.5 in. / hr, cross slope, Drainage length, ft 1/, in. / ft, texture, 0.03 in. 6
12 18 24 36 48
Texture, 0.03 in., length, 24 ft , Intensity, in./hr cross slope, 1
/ , in./ft 5.5 3.5 2.0 1.0 0.5 0.1
Figure 8. Water depths versus variables for combined surfaces.
0.08
0.04
0
ODO5 IN -~ ?-~~? ,I~ AVERA~~DT~pcTURE
~~ U ,V.,OON - -
1/ / DRAINAGE LENGTH• 24 FT RAINFALL INTENSITY • 1.5 IN/HR
:i::
~ ~~'--0,--,0,-~2~0,-~~,::--4~0=-~~~------l!l DRAINAGE LENGTH, IN 0:: 0.08 DRAINAGE LENGTH • 24 FT
~ ~~L/iL;;E,N~~v1~ Nr ir,~~~ j OO<I
o-
0 .12
0.08
0.04
DRAINAGE LENGTH , 24 FT CROSS SLOPE , I /8 IN/ FT (1/96)
-0-04 '---0'---'-1 --'-2--'-3--'-4---'5--'
RAINFALL INTENSITY, IN/HR
Resultant Water Depth (in. at Change 24 ft) (percent)
0.074 0.048 -35 0.028 -62 0.021 -72 0.013 -82 0.002 -97
0.059 0.057 -3 0.048 -19 0.038 -36 0.011 -81
-0.034 -158
0.013 0.028 115 0.039 200 0.048 269 0.062 377 0.074 469
0.138 0.098 - 29 0.062 -55 0.031 -77 0.011 -92
-0.014 - 110

67
where
d average water depth above the top of texture, in.; T average texture depth , in.; L = length of drainage path, ft; I rainfall intensity, in./hr; and S cross slope, ft/ft.
In its original form the equation was based on a datum plane at the bottom of the texture; however, subtraction of texture depth from the obtained depth shifts the datum plane to the top of the texture. The equation is valid for all water depths with negative values, which indicate water depths below the top of the texture.
As given in Table 4, increases in cross slope result in corresponding decreases in water depths. The effect is more pronounced at the flatter cross sl opes . For example, inc r easing t he cross slope from % in. /ft (1/u12 ft/ft) to ¼ in. / ft (¼a ft/ft) will decrease the corresponding water depth by 62 percent of its 1/16-in. / ft value in the outside wheelpath. Note, however, that cross slopes in excess of ¼ in. / ft do not affect resultant water depths as much, particularly when the magnitudes of the cross-slope increments are given consideration.
An inverse relationship between macrotexture and water depth was also found. The effect increased at the higher macrotexture levels and was more pronounced at macrotexture levels greater than 0.050 in.
As expected, water depths increased as drainage lengths increased. Also as expected, water depths decreased as rainfall intensities decreased. A rainfall intensity of about 0.3 in./hr would be required to encapsulate the asperities on a pavement surface having 0.03-in. texture , 24-ft drainage length, and 1/4-in./ft cross slope.
In addition to the previous discussion of the relative effects of cross slope on water depth , another major benefit of a steeper cross slope would be the reduced volume of water that could collect in pavement deformations. This is particularly so on flexible pavements where a certain amount of wheel-track depression often occurs because of compaction in the base and the surface. The use of paved shoulders generally reduces the subsidence of the outside one-third of the right traffic lane. Such subsidence was caused by less construction compaction near the pavement edge and subsequently greater permanent deformation during service . Where highly compacted shoulders are used, permanent deformation can still occur in the traveled lanes; thus, after a period of time, a portion of the cross slope can be lost. steeper cross slopes will reduce the effect.
It was observed during the experimental tests that , after the cessation of rainfall, the steeper cross slopes drained the remaining surface water more quickly than did the flatter slopes. This is another benefit of steep cross slopes, particularly in areas of high humidity, low wind speed, low ambient temperatures , or combinations of these. These conditions serve to increase the drying time and thus the length of the time the surface is wet. steeper cross slopes not only would serve to remove the bulk of the water more quickly but also would facilitate drainage of low areas and deformations.
Another possible means of reducing the wet-pavement exposure time would be the use of a permeable surface that could absorb some of the rainfall and also permit water to drain through the permeable layer and then laterally to the pavement edge. Admittedly, this concept has some disadvantages, but under certain circumstances these would be more than offset by improved safety. Results of field experiments by the Texas Highway Department and the Texas Transportation Institute on permeable pavements will be the subject of a separate paper.
SUMMARY OF FINDINGS AND RESULTS
Nine surfaces were tested. The surfaces were placed on individual beams, and a uniform rainfall intensity was applied to the surfaces. Water-depth measurements were taken at several drainage lengths for various combinations of rainfall intensity and pavement cross slope. Multiple regression analyses were used to determine the best fit of the relationships.
68
An experimentally determined equation relating water depth to surface texture, length of ctratnage path, raintali intensity, and pavement cross slope was developed.
Increased surface texture resulted in a decrease in water depth as measured from the top of the surface texture for a given rainfall intensity, cross slope, and drainage length. This effect was more pronounced at the flatter cross slopes and lower rainfall intensities.
Greater drainage lengths increased water depths; however, the rate of increase in water depth became smaller as drainage lengths increased. Greater water depths were associated with high rainfall intensities. (Even at the lower rainfall intensities, the adverse effect of rainfall intensity was quite pronounced.)
Increases in pavement cross slope resulted in reduced water depths. This effect was very significant at the flatter cross slopes where a slight increase in cross slope resulted in a pronounced reduction in water depth.
CONCLUSIONS AND RECOMMENDATIONS
Increases in the minimum rates of pavement cross slopes are warranted. It is recommended that cross slopes ranging from ¼ in./ft (1/96) to ¼ in./ft (¼e) be used on highspeed rural highways. The higher cross slope of ¼ in./ft should be favored in areas with greater potential for wet-weather accidents. This not only will reduce the water depth on pavements for a given rainfall intensity but also will assist in providing for drainage of low areas and depressions that tend to lower the effectiveness of built-in cross slopes. steeper cross slopes will offer a margin of safety against ponding and concomitant long wet-pavement exposure times.
Essentially smooth-textured, dense-graded surfaces should not be used on highspeed rural highways. Slight amounts of precipitation will result in water depths above the texture peaks and thus in poor effective drainage on these types of surfaces. If such surfaces are used, an ample degree of permeability should be built into the surface. The surface aggregate should be capable of puncturing the water film, or drainage of the water into the surface should be possible.
It is suggested that research be conducted to determine the relative influences of ambient temperatures, wind velocities, and relative humidities on the drying rates of various pavement surface types after rainfall has ceased. Rainfall records based on observations at i0-min intervais wouid be desirable, if not necessary. Drying rates are indicative of the time during which the pavement surface is wet after cessation of rain. It is assumed that high relative humidity, low wind velocity, and low ambient temperature all contribute to increased exposure times and thus decreased drying rates for a given surface. Their relative effects and significance need to be determined. From such data it may very well be possible to estimate inclement weather accident potential, considering, of course, several other important contributing factors including speed, pavement surface characteristics, and geometrics. Allocation of funds for improvement of highways subject to skidding accidents could then be scheduled according to a more reasonable plan.
Additional research currently in progress proposes to furnish field data on the effect of \\'.ind velocity and direction on pavement water depths for the nine surfaces used in this study.
ACKNOWLEDGMENTS
This paper is based on research sponsored by the Texas Highway Department in cooperation with the Federal Highway Administration. The assistance of maintenance personnel of District 17 of the Texas Highway Department and Kenneth D. Hankins of Texas Highway Research, Austin, is gratefully acknowledged. The opinions, findings, and conclusions expressed or implied in this report are those of the research agency and not necessarily those of the Texas Highway Department or the Federal Highway Administration.
REFERENCES
1. Kummer, H. W., and Meyer, W. E. Tentative Skid-Resistance Requirements for Main Rural Highways. NCHRP Rept. 37, 1967.

69
2. Dearinger, J. A., and Hutchinson, J. W. Traffic Control and Roadway ElementsTheir Relationship to Highway Safety, Rev. Ed. Highway Users Federation for Safety and Mobility, Washington, D.C., 1970, Ch. 7.
3. Albertson, M. L., et al. Fluid Mechanics for Engineers. Prentice-Hall, Englewood Cliffs, N.J., 1960.
4. Manning, R. On the Flow of Water in Open Channels and Pipes. Trans., Inst. of Civil Eng., Ireland, Vol. 22, 1891.
5. Bernard, J. Discussion of paper by Gregory, R. L., and Arnold, C. E., Run OffRational Run Off Formulas. Trans., ASCE, Vol. 96, 1932.
6. Horton, R. E. The Interpretation of Run Off Plot Experiments With Reference to Soil Erosion Problems. Proc., Soil Sci. Soc. Amer., 1938.
7. Izzard, C. F. Hydraulics of Runoff From Developed Surfaces. HRB Proc., Vol. 26, 1946, pp. 129-150.
8. Watkins, L. H. An Investigation of the Hydraulics of Run-Off From Road Surfaces: First Report. Gt. Brit. Road Research Laboratory, Note LN/ 418/LHW, Sept. 1963.
9. Watkins, L. H. An Investigation of the Hydraulics of Run-Off From Road Surfaces: Second Report. Gt. Brit. Road Research Laboratory, Note LN/699/LHW, Oct. 1964.
10. Ross, N. F., and Russam, K. The Depth of Rain Water on Road Surfaces. Gt. Brit. Road Research Laboratory, RRL Rept. LR 236, 1968.
11. Rose, J. G. The Effects of Rainfall Intensity, Pavement Cross Slope, and Surface Texture on Water Depths and Resultant Friction Properties of Various Pavements. Texas A&M Univ., College station, PhD dissertation, May 1971.
12. Gallaway, B. M., Schiller, R. E., Jr., and Rose, J. G. The Effects of Rainfall Intensity, Pavement Cross Slope, Surface Texture, and Drainage Length on Pavement Water Depths. Texas Transportation Institute, Texas A&M Univ., Res. Rept. 138-5, Jan. 1971.
13. A Policy on Geometric Design of Rural Highways-1965. American Association of state Highway Officials , 1966.
14. Yu , U. S. , and McNown, J. S. Runoff From Impervious Surfaces. U.S. Army Engineer Waterways Experiment station, Contract Rept. 2-66, Feb. 1963.
15. Rouse, H., ed. Engineering Hydraulics. John Wiley and Sons, New York, 1950. 16. Gallaway, B. M., and Rose, J. G. Macrotexture, Friction, Cross Slope and Wheel
Track Depression Measurement on 41 Typical Texas Highway Pavements. Texas Transportation Institute, Texas A&M Univ., Res. Rept. 138-2, June 1970.
17. Rose, J. G., Gallaway, B. M., and Hankins, K. D. Macrotexture Measurements and Related Skid Resistance at Speeds From 20 to 60 Miles Per Hour. Highway Research Record 341, 1970, pp. 33-45.
18. Gallaway, B. M., and Rose, J. G. Highway Friction Measurements With Mu-Meter and Locked Wheel Trailer. Texas Transportation Institute, Texas A&M Univ., Res. Rept. 138-3, June 1970.
19. Gallaway, B. M. , Epps , J . A. , and Tomita, H. Effects of Pavement Surface Characteristics and Textures on Skid Resistance. Texas Transportation Institute, Texas A&M Univ., Res. Rept. 138-4, Sept. 1971.
DISCUSSION T. Y. Kao and J. W. Hutchinson, University of Kentucky
The information presented concerning runoff water depths on pavement surfaces is very useful. The empirical equation obtained by the authors provides highway engineers with a new criterion for estimating the relative effects of pavement surface texture, cross slope, drainage length, and rainfall intensity on pavement surface water depths. The contribution of the authors' work is highly significant.
However, for completeness of the information, consideration should be given to the effects of wind and raindrop impact on water runoff. The former has not been included in the paper, whereas only the gross effect of the latter is included implicitly and then only with respect to zero lateral velocity of the raindrops.

70
EFFECT OF WIND ON SURFACE RUNOFF
Intuitive conjecture and direct observations suggest that flow of a liquid will be retarded to a certain degree if the air flow above it is in the opposite direction and will be further accelerated if the air flows in the direction of the liquid. These phenomena can be readily illustrated in terms of fluid dynamics.
The wind profile near a boundary can be described logarithmically and is often written in the form of the law of Wall
[u(y)/u*] = (1/0.4) ln (u*y/v.) + const
where
u(y) velocity of air as a function of distance measured upward from the boundary,
u* Jr./ Pa = shear velocity at the boundary, y distance measured from the boundary, and v. = kinematic viscosity of air.
The numerical value, 0.4, represents Karman's constant. The constant to be determined in this equation depends on the boundary characteris tics. Values ranging from +6.1 to - 7.0 have been observed by Plate, Chang, and Hidy (.W during laboratory experiments on wind-generated waves. Theil' work also indicated that, when the velocity of air relative to the surface drift current velocity u, is used in the equation for the case where no significant wave exists, the constant obtained for air flowing over a solid boundary, 5.6, can be used. The equation, therefore, can be written as
[u(y) -u,/u*] = (1/0.4) ln (u*y / v.) + 5.6
According to the definition of boundary layer thickness , 6, at y = 6, u( 6) = 0. 99 u 00 •
Here u.. is the speed of the wind. Based on the Plate, Chang, and Hidy data, a smooth wind with a velocity of 8.2 mph produces a surface drift velocity of 0.35 fps in the direction of the wind. When turbulence is introduced to the air flow , an even higher drift current velocity will result.
Assuming a linear velocity distribution in the water gives an average drift velocity for Vv"atcr ponded on a flat surface of 0.173 fps. Tu illu8Lrate the effect oi driit current velocity on pavement surface water depth, we may use the followin~ r ough approximation.
Employing the data provided by the authors, for L = 24 ft, S = 1/06 , T ::: 0.055 in., and i = 5 in./hr gives a water depth of approximately 0.12 in. At this rainfall intensity the equilibrium discharge is 0.00278 cfs/ ft at the end of the drainage length . The average velocity of flow without wind effect is 0.278 fps. When the wind effect is superimposed on water flow velocity, the average water flow velocity will be
v;; = Vw + U, = 0.453 fps
for wind in the direction of flow , and
v; = v. - u. = 0.103 fps
for wind in the negative direction of flow. The water depth will be 0.0736 in. for positive direction wind and 0,324 in. for negative direction wind as compared to d = 0.12 in. without wind effect.
Clearly, this analysis should only be used as a qualitative illustration. The actual system is much too complicated to be handled analytically. For instance, in addition to the shear effect considered, momentum exchange also occurs at the wind-water interface, adding to the total effect of the wind. This is especially important when waves are generated. Furthermore, when water is flowing on a slope, air flow approaches at an angle above the plane parallel to the water surface . The greater t he cross slope (crown) of the pavement i s , the greater the confrontat ion of the wi nd wi ll be and the greatet' t h I omentum exchange on the upwind side of the pavement will be for a given wind velocity. The authors' tabular amounts of decrease in water depth
71
that accompanies various increases in pavement cross slope would therefore be lessened considerably, even by mild cross winds. Water depths at least two or three times greater than those in Table 4 would be required to present realistic rainfall conditions along highways. Determination of the actual magnitude of combined wind and cross slope effects should be an objective in future research. Furthermore, the effects of wind on the authors' tabular amounts of increase in water depth due to increased drainage length need investigation; the greater the drainage length (pavement width) is, the greater the fetch of the wind will be and the greater the probability of air flow turbulence and wave production will be, which add respectively to the shear and momentum exchange effects of the wind.
EFFECT OF RAlNDROP IMPACT ON SURFACE RUNOFF
The effect of raindrop impact on runoff water is to cause a logarithmic type of velocity distribution at Reynolds number below 1,000 where the flow would normally be laminar (W. This can be characterized by flow retardation near the free surface due to the impact turbulence. For a fixed rate of discharge, such retardation would result in increased water depth. This effect is included in the authors' work because actual (zero wind) rainfall simulation has been used.
However, when this effect is expressed in terms of flow resistance on a smooth surface, Wenzel (22) reported that rainfall intensity increases the resistance to flow only for Reynolds numbers below approximately 2,000. Above this value the effect of rainfall intensity decreases rapidly until it becomes insignificant. Therefore, the relation between water depth d and the rainfall intensity i is not a monotonous one. Care should be taken not to make application of the authors' equation to describe flows with larger Reynolds numbers. Nevertheless, in predicting runoff water depths on pavements, such uncertainty does not exist because the Reynolds number for this type of flow is almost always below the value 2,000.
Neither Wenzel's work nor that of the authors considered the effect of wind, which, undoubtedly, will vary the effect of drop impact and momentum exchange between the raindrop and the water flow. Further study to include this effect should be of great interest.
References
20. Plate, E. J., Chang, P. C., and Hidy, G. M. Experiments on the Generationof Small Water Waves by Wind. Jour. Fluid Mech., Vol. 35, Part 4, 1969, pp. 625-656.
21. Yoon, Y. N. The Effect of Rainfall on the Mechanics of steady Spatially Varied Sheet Flow on a Hydraulically Smooth Boundary. Univ. of Illinois, Urbana, PhD thesis, 1970.
22. Wenzel, H. G. The Effect of Raindrop Impact and Surface Roughness on Sheet Flow. Univ. of Illinois, Water Resources Center, Res. Rept. 34, 1970.
AUTHORS' CLOSURE The complimentary remarks of Kao and Hutchinson are sincerely appreciated. The
authors are well aware of the effects of wind on water. Recent hurricanes such as Carla left little doubt in the minds of many Texans!
It is pleasing to see the very neat mathematical treatment presented by Kao and Hutchinson concerning the positive and negative effects of wind on pavement water depths. These calculations are necessarily based on "a smooth wind" from a fixed direction, neither condition being at all likely but still a definite possibility.
Indeed much more work needs to be done to fully evaluate the range of conditions that repeatedly transpire on our highways during rains with wind and to attach practical significance to these findings.
The effect of raindrop impact is recognized, and general reference to this effect was mentioned in the paper; however, within the range of variables investigated, it was not considered to have an appreciable effect.
Kao and Hutchinson are to be commended for adding their discussion.