the relationship of young children's motor skills to later school achievement
TRANSCRIPT

The Relationship of Young Children's Motor Skills to Later SchoolAchievement
Son, Seung-Hee.Meisels, Samuel J.
Merrill-Palmer Quarterly, Volume 52, Number 4, October 2006, pp.755-778 (Article)
Published by Wayne State University PressDOI: 10.1353/mpq.2006.0033
For additional information about this article
Access provided by University of Leeds (21 Apr 2013 12:45 GMT)
http://muse.jhu.edu/journals/mpq/summary/v052/52.4son.html

The Relationship of Young Children’s Motor Skills to Later Reading and Math Achievement
Seung-Hee Son, Purdue University
Samuel J. Meisels, Erikson Institute
This study examined empirical evidence about the relationship between motorskills at the beginning of kindergarten and reading and mathematics achieve-ment at the end of first grade, using the Early Childhood Longitudinal Study—Kindergarten cohort national dataset (N = 12,583). Results of hierarchicalregression analyses demonstrated that early kindergarten motor skills, especiallyvisual motor skills, add a small but unique amount of variance to achievement inreading and mathematics at the end of first grade even after controlling forinitial skills and demographic information. Furthermore, Receiver-Operating-Characteristic curve analyses showed that information from visual motor skills isuseful in identifying children at risk for academic underachievement. The resultssuggest the importance of the role that motor skills can play in designing andimplementing an early school achievement battery.
The relationship between motor and cognitive skills has long been the sub-ject of research in several fields. In child development, Piaget accorded sen-sorimotor skills a central role in children’s early cognitive development.According to Piaget’s (1952) developmental theory, motor skills contributeto infants’ active exploration of the environment, and it is through suchactions that infants construct their knowledge of the world. Related studiesdemonstrated that infants’ experiences of self-produced locomotion (e.g.,crawling) are related to such cognitive skills as object permanence and the
755
MERR I L L -PALMER QUARTERLY, VOL. 52, NO. 4
Seung-Hee Son, Department of Child Development and Family Studies, School of Educa-tion; Samuel J. Meisels, President, Erikson Institution.
The authors would like to thank Frederick J. Morrison and Joanne F. Carlisle for invaluablefeedback on earlier versions of this manuscript.
Correspondence should be addressed to Seung-Hee Son at the Department of Child Develop-ment and Family Studies, Purdue University, 101 Gates Road, West Lafayette, IN 47907. Phone:(765) 496-1687. Email: [email protected].
Merrill-Palmer Quarterly, October 2006, Vol. 52, No. 4, pp. 755–778. Copyright © 2006 by WayneState University Press, Detroit, MI 48201.
050 seung (755-778) 12/1/06 11:06 AM Page 755

organization of spatial information (Bai & Bertenthal, 1992; Bertenthal,Campos, & Kermoian, 1994; Campos et al., 2000).
Advances in neuropsychology also provide information about the rela-tionship between motor skills and cognition based on brain activity and struc-ture. In one of the classic theories of neuropsychology, it was suggested thatthe same brain structure can participate in more than one functional system,the same functional system can draw upon multiple local structures distrib-uted throughout the brain, and the functional systems can reorganize through-out development (Luria, 1973). Ellis (1985, 1987) applied a similar notion toliteracy acquisition. He proposed a cognitive neuropsychological model forreading and writing acquisition in which reading and writing modules are notpreformed in the infant brain waiting to be elicited by a certain kind of envi-ronmental stimulation at a particular time. Rather, the reading and writingsystems are constructed from other cognitive capabilities, such as the visual,phonological, and semantic systems. Thus, developmental reading and writ-ing disorders can be the consequence of disorders in other systems fromwhich reading and writing skills emerge.
A related review reported that intellectual and perceptual-motor skillsare acquired in fundamentally similar ways (Rosenbaum, Carlson, &Gilmore, 2001). According to this study, learning rates, training effects, andlearning stages are highly similar for the two sets of skills. In addition, brainsites serving thought and perceptual-motor processes are not as distinct asonce thought (Diamond, 2000). This may be explained by the theory thatmotor and cognitive systems develop dynamically by interacting with eachother (Iverson & Thelen, 1999; Satz & Fletcher, 1988; Smith, Thelen,Titzer, & McLin, 1999).
Overall, the weight of the theoretical evidence provides a conceptualjustification for examining motor skills in relationship to later cognitiveachievement. The literature suggests that development of motor skills isassociated with development of cognitive skills and motor skills can be anindicator of cognitive skills development.
Predictability of Early Motor Assessments
Predictability is often regarded as fundamental to early childhood measure-ment and is an important aspect of psychometric validity (Meisels, 1994).Validity represents an overall evaluative judgment of the degree to whichempirical evidence and theoretical rationales support the adequacy andappropriateness of conclusions drawn from some form of assessment (Mes-sick, 1989). Predictive validity generally implies the degree to which aninstrument of interest provides accurate measurement by comparing scores
756 Merrill-Palmer Quarterly
050 seung (755-778) 12/1/06 11:06 AM Page 756

from the instrument with scores on a relevant criterion variable of later devel-opment (Bryant, 2000). For example, screening tests that purport to identifychildren at risk for future achievement problems should include appropriateindicators presumed to show a predictive relationship to skills not yetachieved. Information about predictability is thus an indispensable aspect ofvalidity for early childhood assessment (Meisels & Atkins-Burnett, 2000).
Reports concerning the predictive validity of motor skills assessmentsfor later cognitive achievement are mixed. In some studies, children’svisual-perceptual or visual motor skills were among the best predictors ofreading achievement in first through third grades (Tramontana, Hooper, &Selzer, 1988), with a mean correlation of .38 between visual-perceptual andreading achievement (Kavale, 1982). In other studies, some of which con-trolled for initial cognitive skills, correlations between motor and cognitiveachievement were generally <.35 or sometimes statistically nonsignificant(Lesiak, 1984). Visual motor skills tend to have higher correlations withreading and mathematics achievement than do gross motor skills (Payne &Isaacs, 1999), although gross motor skills are also reported to have signifi-cant correlations (Knight & Rizzuto, 1993).
The tenuous long-term predictability of motor skills based on dataobtained from measurements in early childhood is not, in fact, specific tomotor assessment. One of the reasons for weak predictability is the instabil-ity of behaviors in young children. In addition to month-by-month changes,some conditions identified as delayed or at risk in young children may notbe present as they grow older. For example, in the Kopp and McCall (1982)and McCall (1981) research, instability in individual differences during thefirst two years of life was demonstrated repeatedly in cognitive and motortest performance. In still another study of gross motor development, 31 of800 children demonstrated poor gross motor skills at age three, but only 10of the 31 children continued to exhibit poor motor skills at age five (Silvia& Ross, 1980). The remaining 21 children had caught up by age five. Inother words, age-to-age stability in mental performance increases at abouttwo years of age, increasing rapidly until approximately five years of agefor normally developing children (Meisels with Atkins-Burnette, 1994).This suggests that measuring children’s skills when they are kindergartnerstends to have higher predictability for later achievement than testing whenthey are younger.
Whatever the stability of motor skills, the problem of prediction maylie as much with the analytic design of the investigation as with the phe-nomena being measured. A major methodological problem with these stud-ies is the use of correlation coefficients as evidence of the tests’ accuracy.Despite the fact that the bivariate correlations provide information on the
Children’s Motor Skills 757
050 seung (755-778) 12/1/06 11:06 AM Page 757

similarity of the group’s performance on tests of motor and cognitive skills,such studies provide no information about the predictability or specificidentification of children at risk for cognitive underachievement. One of themost useful ways to evaluate a test’s predictive accuracy is through anexamination of individual classification decisions (Meisels, 1989). Anotherway is to use multivariate statistical methods that can examine predictabil-ity while controlling for such confounding variables as initial skills ordemographics (Bryant, 2000). Multivariate methods also make possibleexamination of the combined as well as the independent effects of predic-tors, a strategy that is often used in investigations of motor skills (Broad-head & Church, 1988; Schmidt & Perino, 1985).
Using multivariate methods and individual classification decisions, thepresent study focuses on exploring the relationship between motor skillsmeasured at kindergarten entry and cognitive achievement during earlyschooling. Early years of formal schooling is the period when children areinstructed to develop basic academic skills in reading and mathematics,which provides foundations for later school achievement. Considering theimportance of these basic skills and possible relations between them andmotor skills, we chose to examine the predictive relationship from thebeginning of kindergarten to the end of the first grade. Specifically, thisstudy uses motoric items adapted from the Early Screening Inventory-Revised (ESI-R) (Meisels, Marsden, Wiske, & Henderson, 1997) adminis-tered in fall kindergarten to predict achievement at the end of first gradebased on data from a national survey of early childhood learning. A study ofthe predictive relationship between motor scores in early kindergarten andcognitive achievement two schooling years later may shed light on thevalue of focusing on motoric skills at the outset of school as well as on thedynamic nature of child development among the developmental domains.
Since previous studies reported that visual motor skills have differen-tial predictability for aspects of achievement (i.e., visual motor skills aremore predictive of mathematics than of reading) (Goldstein & Britt, 1994;Kurdek & Sinclair, 2001), separate analyses were conducted on reading andmathematics achievement. We hypothesized that we would discover a sig-nificant relationship between early motor and achievement in reading andmathematics in first grade and that early motor skills, especially visualmotor skills, would significantly predict later achievement. In addition, thecombined effects of motor and initial achievement were examined to testthe usefulness of adding motor items to assessments of school success.Examining combined effects as well as unique effects of motor skills couldprovide helpful information on the associations among motor and cognitivedomains of development.
758 Merrill-Palmer Quarterly
050 seung (755-778) 12/1/06 11:06 AM Page 758

Method
Data Source
To examine the relationship between kindergartners’ motor skills and cogni-tive achievement in reading and mathematics two years of schooling afterinitial testing, we used data from the Early Childhood Longitudinal Study-Kindergarten Class of 1998–99 (ECLS-K). The ECLS-K is the first nation-ally representative sample that focuses on children’s early school experiencesbeginning from kindergarten. It provides information about children’s earlyhome, preschool, and kindergarten environments; their status at entry intoschool; and their progression through the school year as measured in the falland spring of kindergarten and first grade (National Center for EducationStatistics, 2002).1
The ECLS-K uses complex survey designs. In the base year, the ECLS-K data were collected using a multistage probability sample design to selecta nationally representative sample of children in the 1998–99 school year.The primary sampling units consisted of 1,335 counties or groups of coun-ties from which 1,280 public or private schools offering kindergarten pro-grams were selected. A target sample of approximately 24 children fromeach public school and 12 children from each private school was con-structed, totaling 21,260 children attending kindergarten in the fall of 1998.The ECLS-K longitudinal K–1 data file includes 17,212 children who wereassessed in the spring of the kindergarten year (spring 1999) and at leastonce more during the first-grade year (fall 1999 or spring 2000).
Children’s motor skills were assessed in fall kindergarten, and readingand mathematics achievement was assessed in the fall of kindergarten andthe spring of first grade. Fall kindergarten scores served as a measure of ini-tial achievement and spring first-grade scores as an indicator of laterachievement. The time interval between initial and later achievement test-ing was between 15.8 and 21.5 months, with an average of 18.4 months.
Children’s Motor Skills 759
1. By kindergarten year we mean the first year of data collection, the 1998–99 school year. Byfirst-grade year we mean the second year of data collection, school year 1999–2000. Although allof the children in the kindergarten class of 1998–99 did not become first-graders by the second yearand some children repeated kindergarten or skipped the first grade, we continue to use the term“first grade” or “first-grade year” for the second year of data collection throughout the paper forconvenience. The reason we did not include only children who were first-graders in 1999 in thesample is that the current sample is more representative of the kindergarten children of the 1998–99school year with more variability than is the first-time kindergarten and first-grade–only sample.Additional analyses show that the results from the first-time kindergartners and first-grade–onlysample were very similar to those of the current sample.
050 seung (755-778) 12/1/06 11:06 AM Page 759
The Analytic Sample and Sample Weights
The sample used in this analysis was a subset of the ECLS-K, consisting offirst-time kindergartners and excluding kindergarten repeaters. First-timekindergartners are children without any previous kindergarten experienceswhen they entered kindergarten in the 1998–99 school year. Among thefirst-time kindergartners, only children with information available on bothmotor skills and achievement outcome measures were included in the ana-lytic sample, consisting of approximately 12,500 children.
Analyses using ECLS-K data employ weights to compensate for theunequal probabilities of selection and nonresponse rate. In this way, resultsbased on the weighted sample can be generalized to the children in theUnited States who were kindergartners during the 1998–99 school year forthe first time. In using the weights we normalized the longitudinal childweight variable by making it sum to the total sample size in order to avoidinflating the sample size and miscalculating standard errors and degrees offreedom. This enabled us to maintain the same sample size within the con-text of a representative national sample.
The demographic characteristics of the analytic sample were examinedusing the weighted sample (N = 12,583). The average age of the sample inearly September of the 1998–99 kindergarten year was 65 months. Althoughthe analytic sample included only first-time kindergartners, the oldest chil-dren in the sample reached 83 months of age and the youngest children 49months of age (SD = 4.07). In other words, the sample included some chil-dren whose kindergarten entry was delayed by a year and some who werepromoted to kindergarten one year early.2 Median family income was around$40,000 (SD = $53,486.41). Approximately 20% of the sample reported thattheir income was below the poverty level, and about 10% of the children useda home language other than English. Gender of children was distributednearly evenly, with 50.4% males. The sample had a fair representation ofminority children, with 15.5% African American and 17.5% Hispanic.
760 Merrill-Palmer Quarterly
2. A kindergarten class may include (1) young kindergartners who apparently were enrolledin kindergarten early (younger than 59 months old, if September is assumed as the school cutoff),(2) at-age kindergartners (60–71 months old), and (3) older kindergartners who apparently wereheld out by their parents (>71 months old). The presence of younger or older kindergartners in thissample is not unusual; rather, they are representative of the full kindergarten classroom spectrum inthe nation. The current study sample (49–83 months old) includes all three groups of children.However, the age range of the sample is limited to a three-year span. Children who are two yearsolder or two years younger than those at age were not included. We assume that this allows for chil-dren who were held out by their parents or enrolled early but retains enough homogeneity in thesample that it is not overly influenced by children who are much older or much younger than com-mon practice would normally enroll in kindergarten.
050 seung (755-778) 12/1/06 11:06 AM Page 760

Measures
Motor skills. Motor skills were assessed at the beginning of kinder-garten using visual motor and gross motor scales derived primarily from adevelopmental screening instrument, the ESI-R (Meisels, Marsden, Wiske,& Henderson, 1997). The ESI-R is a well-standardized multidomain devel-opmental screening test that has been widely used to identify preschool andkindergarten children who may be at risk for school failure (Kimmel, 2001;Paget, 2001).
The visual motor scale used in this study includes fine motor and eye-hand coordination measured with seven tasks of building a gate, drawing aperson, and copying five simple figures: circle, cross, square, triangle, andopen square and circle. Gross motor skills consisted of balancing, hopping,skipping, and walking backwards. Most items in the motor scales of thecurrent study used the ESI-R items except the open-square-and-circle fig-ure and walking backward items, which were added to solve a potentialceiling problem in the screening test that would preclude the use of certainstatistical procedures.
Descriptive analysis based on the current analytic sample indicatedthat visual motor scores showed more variance than gross motor scores.Visual motor scores had a mean of 5.75 (SD = 2.06) in a range of possiblevalues of 0–9; the average gross motor score was 6.34 (SD = 1.87) in arange of values of 0–8. The one available reliability measure was interitemreliability (alpha coefficient), and it was .57 for the visual motor and .51 forthe gross motor scale (National Center for Education Statistics, 2001). Thestrength of these reliabilities is largely a function of the binary scoring sys-tem of the items that comprise the scales.3
Cognitive achievement. Cognitive achievement was assessed in thedomains of reading and mathematics using direct cognitive assessmentsdeveloped by the National Center for Education Statistics (NCES) for theECLS-K. Reading achievement was assessed with five subscales: identify-ing letters, letter-sound association at the beginning of words, letter-soundassociation at the end of words, recognizing words, and reading words incontext. Measurement of mathematics achievement was designed to assessfive basic mathematics skill levels: number and shape, relative size, ordi-nality and sequence, addition/subtraction, and multiplication/division.
Children’s Motor Skills 761
3. Since the 0–1 or 0–2 scoring system of the motor scale limits variance of scores withineach item, thus restricting the size of reliability coefficients, interitem reliability is not the best kindof measure of reliability in a scale with this type of scoring. Nevertheless, alpha coefficients werethe only available reliability measure provided by NCES. This might have influenced the relativelysmall effect size of motor skills in predicting cognitive achievement.
050 seung (755-778) 12/1/06 11:06 AM Page 761

We used Item Response Theory (IRT)-based composite scores of read-ing and mathematics from spring first grade as outcome variables and thoseof fall kindergarten as initial status. IRT-based assessment provides a rigor-ous measure of overall achievement through statistical manipulation,examining the pattern of correct, incorrect, and omitted responses of chil-dren to the items and the difficulty, discriminability, and likelihood ofguessing for each item (Hambleton, Swaminathan, & Rogers, 1991). TheIRT makes it possible to establish a common scale of item difficulty and acommon scale of child ability or level of achievement. It is then possible toestimate the score of the child based on the test items with differing diffi-culty by placing each child on a continuous ability scale. In addition,absence of a ceiling problem in the IRT makes it possible to examine longi-tudinal measurement of gain.
IRT scores in the data indicated that children improved their level ofreading and mathematics skills for two schooling years from fall kinder-garten to spring first grade. Reading IRT scores had a mean of 22.81 (SD =8.47) and 55.72 (SD = 13.77) for fall kindergarten and spring first grade,respectively, with a range of values of 0–92. The average mathematics IRTscores were 19.53 (SD = 7.09) in fall kindergarten and 43.42 (SD = 9.13) inspring first grade with a range of values of 0–64. The reliability of the IRT-based scores that is based on the variance of repeated estimates of theta (theoverall ability estimate) ranged from .93 to .95 for reading achievement andfrom .92 to .94 for mathematics achievement.
Missing Data
As noted previously, only children with complete data were included in thestudy. To rule out systematic bias in our conclusions due to missing data,we compared the final total analytic sample used for our analyses with thechildren who missed at least one of the key variables in the analysis andwere thus removed from the analyses.
First, we compared whether there were systematic differences betweenthe final total sample used in the reading analysis (N = 12,386) and themissing group excluded from the analysis due to the absence of the motorassessment or spring first-grade reading scores (N = 358). The missinggroup had lower family income, was younger, and was much more likely tobe minority than the study group children, with all the differences statisti-cally significant. The proportion of Hispanic and Asian children in the twogroups especially contrasted sharply. Hispanic children comprised 16.3%of the sample group and 59.8% of the missing group, and Asian children
762 Merrill-Palmer Quarterly
050 seung (755-778) 12/1/06 11:06 AM Page 762
comprised 1.9% versus 13.8% of the total sample and missing group,respectively. These differences might be explained as attrition due to lim-ited English proficiency. Indeed, 71.1% of the missing group children had ahome language other than English, which was extremely high compared to8.7% for the final total group.
Second, characteristics of the total sample included in the math analy-sis (N = 12,579) were compared with those of the missing group excludedfrom math analysis due to not having the motor assessment or spring first-grade math scores (N = 165). The missing group in the math analysis hadcharacteristics similar to the missing group in reading, but the differencesbetween groups were not as extreme. More children in the missing group inmath had a home language other than English (40.6%) as compared withthe math sample group children (10.1%). The missing group was also morelikely to be Asian students (30.1%) than the total sample (1.9%). In addi-tion, missing group children had lower scores on the later reading test.However, there was no significant difference in age, initial math scores, orfamily income.
The final sample used in the analyses was less likely to be minority andmore likely to be from higher SES families, to have higher achievementscores, and to speak English as a first language than the groups that wereexcluded from analyses. While the predictive validity of the motor assess-ment might be restricted by unintentionally excluding many potential at-risk children, the missing sample comprised less than 3% of the sampleused in reading analyses and only 1.3% of the math sample.
Results
Correlations between Motor Skills and Cognitive Achievement
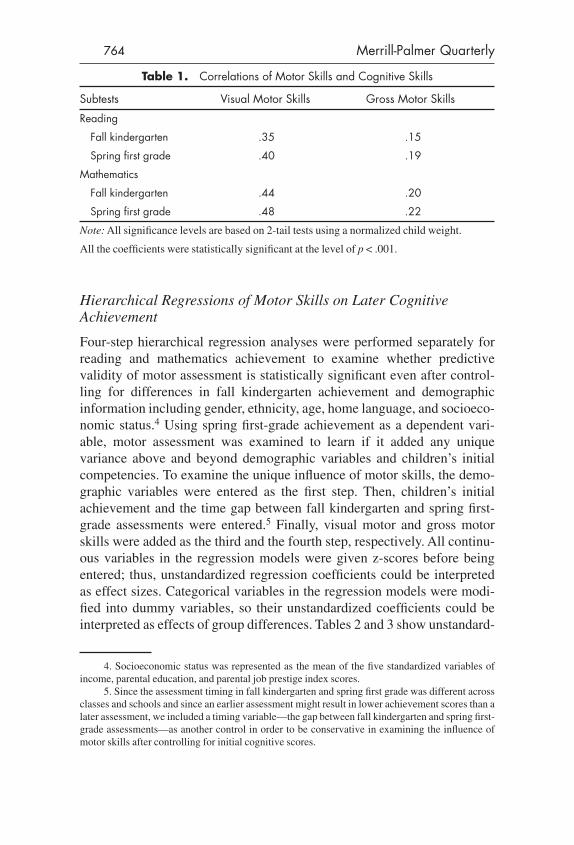
Table 1 displays correlations between reading and mathematics scores offall kindergarten and spring first grade on the one hand and students’ visualmotor and gross motor skills of fall kindergarten on the other. Correlationsrevealed that visual motor skills had significantly higher correlations withcognitive achievement than did gross motor skills (p < .001). Overall, allcorrelations with math scores were significantly higher than those withreading (p < .01), and correlations with spring first-grade achievement weresignificantly higher than those with fall kindergarten achievement (p <.001) except for the comparison of two correlations, one between grossmotor and fall kindergarten math and another between gross motor andspring first-grade math, which were not statistically significant.
Children’s Motor Skills 763
050 seung (755-778) 12/1/06 11:06 AM Page 763
Hierarchical Regressions of Motor Skills on Later CognitiveAchievement
Four-step hierarchical regression analyses were performed separately forreading and mathematics achievement to examine whether predictivevalidity of motor assessment is statistically significant even after control-ling for differences in fall kindergarten achievement and demographicinformation including gender, ethnicity, age, home language, and socioeco-nomic status.4 Using spring first-grade achievement as a dependent vari-able, motor assessment was examined to learn if it added any uniquevariance above and beyond demographic variables and children’s initialcompetencies. To examine the unique influence of motor skills, the demo-graphic variables were entered as the first step. Then, children’s initialachievement and the time gap between fall kindergarten and spring first-grade assessments were entered.5 Finally, visual motor and gross motorskills were added as the third and the fourth step, respectively. All continu-ous variables in the regression models were given z-scores before beingentered; thus, unstandardized regression coefficients could be interpretedas effect sizes. Categorical variables in the regression models were modi-fied into dummy variables, so their unstandardized coefficients could beinterpreted as effects of group differences. Tables 2 and 3 show unstandard-
764 Merrill-Palmer Quarterly
Table 1. Correlations of Motor Skills and Cognitive Skills
Subtests Visual Motor Skills Gross Motor Skills
Reading
Fall kindergarten .35 .15
Spring first grade .40 .19
Mathematics
Fall kindergarten .44 .20
Spring first grade .48 .22
Note: All significance levels are based on 2-tail tests using a normalized child weight.
All the coefficients were statistically significant at the level of p < .001.
4. Socioeconomic status was represented as the mean of the five standardized variables ofincome, parental education, and parental job prestige index scores.
5. Since the assessment timing in fall kindergarten and spring first grade was different acrossclasses and schools and since an earlier assessment might result in lower achievement scores than alater assessment, we included a timing variable—the gap between fall kindergarten and spring first-grade assessments—as another control in order to be conservative in examining the influence ofmotor skills after controlling for initial cognitive scores.
050 seung (755-778) 12/1/06 11:06 AM Page 764

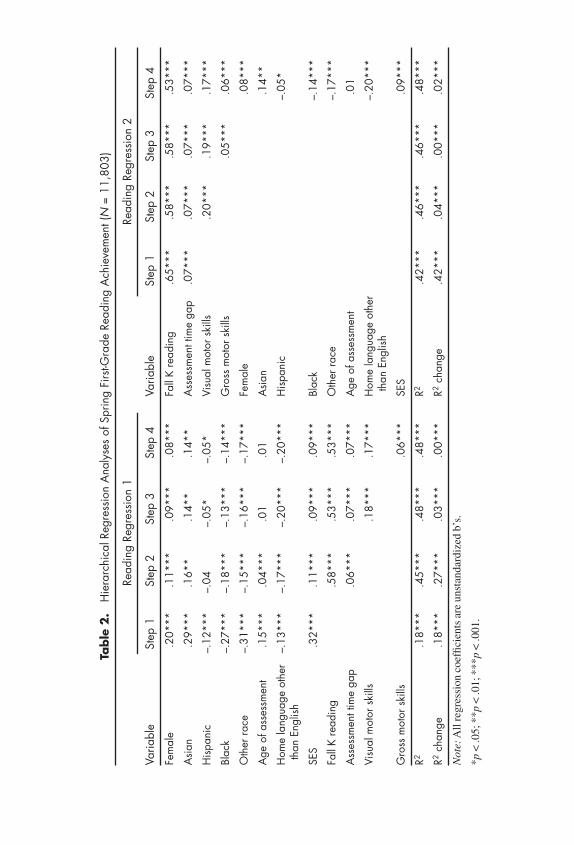
ized coefficients of the predictors of spring first-grade reading and mathe-matics achievement respectively.
In Reading Regression 1, significant associations between visual motorand reading were found even after controlling for the effects of demograph-ics and initial reading scores. Inclusion of the variable of gross motor skillsat Step 4 explained an additional 0.3% of the variance, and the predictabilityof visual motor skills diminished slightly. When all the predictors wereentered, the model explained 48.1% of the variance in spring first-gradereading. Results indicated that before entering motor skills and initial read-ing scores into the analysis, SES was the strongest predictor for readingamong the demographics. However, fall kindergarten reading scores werethe best predictor at Step 2 and thereafter. Here, the model explained 45.1%of the variance of spring first-grade reading scores by adding an additional27% variance explained by fall kindergarten reading (p < .001). Since boththe initial and later reading scores were based on the same measure ofECLS-K direct cognitive assessments, it was expected that the two scoreswould be highly correlated and the predictability of motor skills would notbe as strong as that of initial reading. Inclusion of visual motor skills at Step3 explained an additional 2.8% variance in later reading (p < .001). Althoughvisual motor skills explained a statistically significant and unique amount ofvariance in reading, the effect size was small. This could be due to high cor-relations among motor skills, fall kindergarten reading, and demographics.
Additional analysis showed that including fall kindergarten readingscores and visual and gross motor skills as the first three steps in the modelexplained almost 46% of variance in spring first-grade reading (ReadingRegression 2). In other words, the combined contribution of motor skillsand reading achievement was significant and had an effect size of .68. Inanother model, we tested the combined variance explained by motor skillsand fall kindergarten reading scores in the residuals of first-grade readingscores, after the effects of demographics variables were partialed out. Here,the combined effect size was .53. These additional analyses indicate thatmotor skills combined with initial reading significantly predicted springfirst-grade reading achievement.
The same procedure was conducted for relating motor skills to springfirst-grade mathematics achievement, after controlling for fall kindergartenmath and demographics. In Table 3, Mathematics Regression 1 indicatesthat fall kindergarten math scores were the strongest predictors of first-grade math at Step 2 and thereafter. At Step 3, the visual motor skillsexplained an additional 3.4% of the variance in first-grade math after demo-graphics and initial math scores explained 50.3% at Step 2. Inclusion ofgross motor skills at Step 4 did not substantially change the model. All the
Children’s Motor Skills 765
050 seung (755-778) 12/1/06 11:06 AM Page 765
Table
2.
Hie
rarc
hica
l Reg
ress
ion
Ana
lyse
s of
Spr
ing
Firs
t-Gra
de R
eadi
ng A
chie
vem
ent (
N=
11,8
03)
Read
ing
Regr
essi
on 1
Read
ing
Regr
essi
on 2
Varia
ble
Step
1St
ep 2
Step
3St
ep 4
Varia
ble
Step
1St
ep 2
Step
3St
ep 4
Fem
ale
.20*
**.1
1***
.09*
**.0
8***
Fall
K re
adin
g.6
5***
.58*
**.5
8***
.53*
**
Asi
an.2
9***
.16*
*.1
4**
.14*
*A
sses
smen
t tim
e ga
p.0
7***
.07*
**.0
7***
.07*
**
His
pani
c–.
12**
*–.
04–.
05*
–.05
*Vi
sual
mot
or s
kills
.20*
**.1
9***
.17*
**
Blac
k–.
27**
*–.
18**
*–.
13**
*–.
14**
*G
ross
mot
or s
kills
.05*
**.0
6***
Oth
er ra
ce–.
31**
*–.
15**
*–.
16**
*–.
17**
*Fe
mal
e.0
8***
Age
of a
sses
smen
t.1
5***
.04*
**.0
1.0
1A
sian
.14*
*
Hom
e la
ngua
ge o
ther
–.
13**
*–.
17**
*–.
20**
*–.
20**
*H
ispa
nic
–.05
*th
an E
nglis
h
SES
.32*
**.1
1***
.09*
**.0
9***
Blac
k–.
14**
*
Fall
K re
adin
g.5
8***
.53*
**.5
3***
Oth
er ra
ce–.
17**
*
Ass
essm
ent t
ime
gap
.06*
**.0
7***
.07*
**A
ge o
f ass
essm
ent
.01
Visu
al m
otor
ski
lls.1
8***
.17*
**H
ome
lang
uage
oth
er
–.20
***
than
Eng
lish
Gro
ss m
otor
ski
lls.0
6***
SES
.09*
**
R2.1
8***
.45*
**.4
8***
.48*
**R2
.42*
**.4
6***
.46*
**.4
8***
R2ch
ange
.18*
**.2
7***
.03*
**.0
0***
R2ch
ange
.42*
**.0
4***
.00*
**.0
2***
Not
e:A
ll re
gres
sion
coe
ffici
ents
are
uns
tand
ardi
zed
b’s.
*p<
.05;
**p
< .0
1; *
**p
< .0
01.
050 seung (755-778) 12/1/06 11:06 AM Page 766

Table
3.
Hie
rarc
hica
l Reg
ress
ion
Ana
lyse
s of
Spr
ing
Firs
t-Gra
de M
athe
mat
ics
Ach
ieve
men
t (N
= 12
,459
)
Mat
hem
atic
s Re
gres
sion
1M
athe
mat
ics
Regr
essi
on 2
Varia
ble
Step
1St
ep 2
Step
3St
ep 4
Varia
ble
Step
1St
ep 2
Step
3St
ep 4
Fem
ale
–.03
*–.
02~
–.06
***
–.07
***
Fall
K m
ath
.67*
**.6
0***
.60*
**.5
4***
Asi
an.0
3–.
13**
–.15
***
–.15
***
Ass
essm
ent t
ime
gap
.08*
**.0
9***
.09*
**.0
8***
His
pani
c–.
23**
*–.
06**
–.08
***
–.09
***
Visu
al m
otor
ski
lls.2
2***
.21*
**.2
0***
Blac
k–.
49**
*–.
29**
*–.
25**
*–.
27**
*G
ross
mot
or s
kills
.04*
**.0
6***
Oth
er ra
ce–.
35**
*–.
16**
*–.
17**
*–.
19**
*Fe
mal
e–.
07**
*
Age
of a
sses
smen
t.2
0***
.04*
**.0
1*.0
1A
sian
–.15
**
Hom
e la
ngua
ge o
ther
–.09
**.0
2–.
03–.
03H
ispa
nic
–.09
***
than
Eng
lish
SES
.32*
**.0
9***
.07*
**.0
7***
Blac
k–.
27**
*
Fall
K m
ath
.62*
**.5
4***
.54*
**O
ther
race
–.19
***
Ass
essm
ent t
ime
gap
.08*
**.0
8***
.08*
**A
ge o
f ass
essm
ent
.01
Visu
al m
otor
ski
lls.2
1***
.20*
**H
ome
lang
uage
oth
er
.03
than
Eng
lish
Gro
ss m
otor
ski
lls.0
6***
SES
.07*
**
R2.2
3***
.50*
**.5
4***
.54*
**R2
.48*
**.5
2***
.52*
**.5
4***
R2ch
ange
.23*
**.2
8***
.03*
**.0
0***
R2ch
ange
.48*
**.0
4***
.00*
**.0
2***
Not
e:A
ll re
gres
sion
coe
ffici
ents
are
uns
tand
ardi
zed
b’s.
*p<
.05;
**p
< .0
1; *
**p
< .0
01.
050 seung (755-778) 12/1/06 11:06 AM Page 767

predictors in the model together explained 54% of the variance in springfirst-grade math. With initial math scores and the assessment time-gap con-trolled, visual motor skills uniquely predicted spring first-grade math. Theeffect sizes of visual and gross motor skills for predicting math achieve-ment were higher than those for reading achievement.
We ran additional hierarchical regression analyses to determine theextent to which visual motor skills combined with fall kindergarten mathscores can predict spring first-grade math. Inclusion of fall kindergartenmath and visual and gross motor skills as the first three steps in the modelexplained almost 52% of variance in first-grade mathematics (MathematicsRegression 2). This represents an overall effect size of .72. In anothermodel, we tested the combined variance explained by motor skills andkindergarten mathematics scores in the residuals of first-grade mathematicsscores after the effects of demographics were partialed out. Here, the com-bined effect size was .53. It appears that visual motor skills together withinitial mathematics scores predict later mathematics scores with substantialsuccess. The character of the longitudinal relationship of motor assessmentwith cognitive achievement becomes clearer when one appreciates that fallkindergarten and spring first-grade cognitive achievements are highly cor-related (r = .65 for reading, r = .69 for mathematics).
Receiver-Operating-Characteristic Curves
To test whether the motor assessment could identify children specifically at riskor not at risk in spring first-grade reading and math achievement independ-ently and jointly with fall kindergarten achievement, Receiver-Operating-Characteristic (ROC) curve analyses were conducted. Since previousregression analyses demonstrated a higher predictability of visual motor skillsthan gross motor skills, we focused only on the visual motor skills.
ROC curve analysis is a component of logistic regression that permits acomputation of sensitivity (i.e., the probability that the motor screening testis positive given that the person has cognitive difficulties) and specificity(i.e., the probability that a motor screening test is negative given that theperson does not have cognitive difficulties) at a number of cutoff points inthe motor assessment (Hasselblad & Hedges, 1995; Sackett, Haynes, &Tugwell, 1985; Toteson & Begg, 1988). It defines an optimal cutoff basedon a favorable ratio of sensitivity and specificity. In other words, the opti-mal cutoff point will produce a favorable ratio of overreferrals to underre-ferrals while maximizing correct identifications.
In the analysis of how well visual motor skills identify reading difficul-ties, we used the visual motor skills as a test variable and spring first-gradereading achievement as an outcome state variable. Since the reading score
768 Merrill-Palmer Quarterly
050 seung (755-778) 12/1/06 11:06 AM Page 768

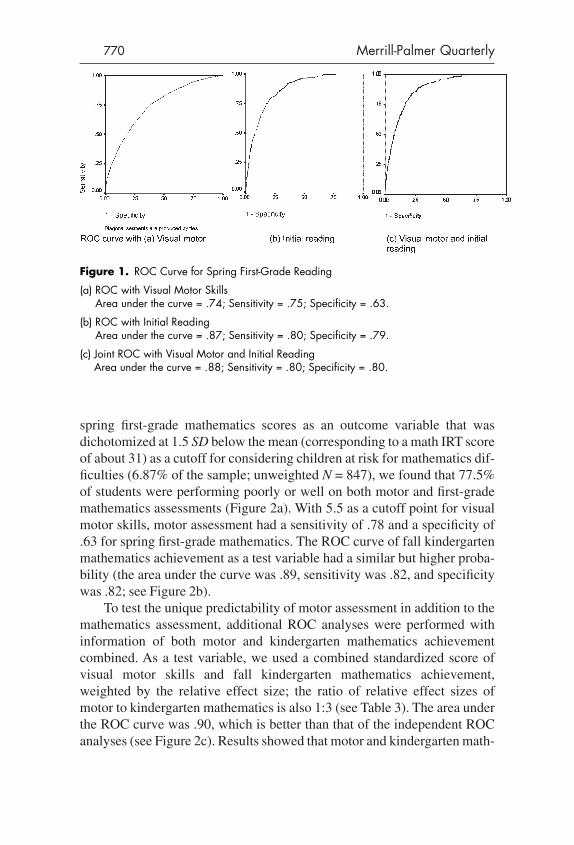
was not a dichotomous variable, 1.5 SDs below the mean (the correspon-ding reading IRT score is approximately 37) was used as a cutoff for con-sidering children at risk for reading difficulties. Due to the fact that thedistribution of scores was somewhat negatively skewed, 1 SD below themean captured only about the lowest 1.4% of children. But 1.5 SDs belowthe mean included approximately 7.1% (unweighted N = 874) of the chil-dren in the database as at risk for reading problems. The results of ROCcurve analysis showed that the area under the ROC curve was .74, repre-senting the probability of students performing poorly or well on both motorand reading assessments (Figure 1a). That is, students with poor visualmotor skills who were chosen randomly had a much higher probability ofbeing ranked lower on reading than students who had at or above averagevisual motor skills. ROC analysis showed that motor assessment had a sen-sitivity of .75 and specificity of .63 for reading achievement when 5.5 isconsidered as a cutoff score for visual motor skills problems.
The ROC curve of fall kindergarten reading achievement as a test vari-able had a similar but higher probability (the area under the curve was .87,sensitivity was .80, and specificity was .79 (Figure 1b). This suggests thatmotor skills and fall kindergarten reading achievement shared considerablevariance.
To test the predictability of motor assessment in addition to cognitiveachievement, additional ROC analysis was performed by combining infor-mation of motor and kindergarten reading achievement. We used a combinedscore of visual motor skills and fall kindergarten reading as a test variable andspring first-grade reading as an outcome state variable dichotomized at 1.5SDs below the mean. The combined scores were calculated by adding stan-dardized scores of visual motor skills and kindergarten reading after eachstandardized score was weighted by the relative effect size found in theregression analysis (the ratio of relative effect sizes of motor to reading is 1:3;see Table 2). The area under the ROC curve was .88, representing the proba-bility of students performing poorly or well on both combined scores andspring first-grade reading (Figure 1c). The probability was much better thanthat of independent ROC analysis only with visual motor skills and some-what better than that of independent ROC analysis only with fall kindergartenreading. The sensitivity and the specificity of the combined ROC (.80 and.80, respectively) were higher than those of the independent ROCs (.75 and.63 for motor and .80 and .79 for initial reading, respectively). These resultsdemonstrated that visual motor skills tended to classify children in a similarway as the spring first-grade reading difficulty variable and even more simi-larly when motor and reading scores were considered simultaneously.
The ROC analysis of mathematics achievement showed similar results.With the fall kindergarten visual motor skill scores as a test variable and
Children’s Motor Skills 769
050 seung (755-778) 12/1/06 11:06 AM Page 769
spring first-grade mathematics scores as an outcome variable that wasdichotomized at 1.5 SD below the mean (corresponding to a math IRT scoreof about 31) as a cutoff for considering children at risk for mathematics dif-ficulties (6.87% of the sample; unweighted N = 847), we found that 77.5%of students were performing poorly or well on both motor and first-grademathematics assessments (Figure 2a). With 5.5 as a cutoff point for visualmotor skills, motor assessment had a sensitivity of .78 and a specificity of.63 for spring first-grade mathematics. The ROC curve of fall kindergartenmathematics achievement as a test variable had a similar but higher proba-bility (the area under the curve was .89, sensitivity was .82, and specificitywas .82; see Figure 2b).
To test the unique predictability of motor assessment in addition to themathematics assessment, additional ROC analyses were performed withinformation of both motor and kindergarten mathematics achievementcombined. As a test variable, we used a combined standardized score ofvisual motor skills and fall kindergarten mathematics achievement,weighted by the relative effect size; the ratio of relative effect sizes ofmotor to kindergarten mathematics is also 1:3 (see Table 3). The area underthe ROC curve was .90, which is better than that of the independent ROCanalyses (see Figure 2c). Results showed that motor and kindergarten math-
770 Merrill-Palmer Quarterly
Figure 1. ROC Curve for Spring First-Grade Reading
(a) ROC with Visual Motor SkillsArea under the curve = .74; Sensitivity = .75; Specificity = .63.
(b) ROC with Initial ReadingArea under the curve = .87; Sensitivity = .80; Specificity = .79.
(c) Joint ROC with Visual Motor and Initial ReadingArea under the curve = .88; Sensitivity = .80; Specificity = .80.
050 seung (755-778) 12/1/06 11:06 AM Page 770

ematics jointly had a sensitivity of .82 and specificity of .82 for spring first-grade mathematics, both of which were higher than those of the independ-ent ROCs (.78 and .63 for motor and .82 and .82 for initial mathematics,respectively).
The ROC curve analyses demonstrate that assessment of reading andmath achievement in spring first grade and that of visual motor skills inkindergarten assigned students to roughly the same categories of risk. Ifassessment results of fall kindergarten achievement are added to those ofmotor skills, then the combined information has a greater probability ofclassifying children accurately.
Discussion
Using a nationally representative sample with more than 12,000 children,the current study intended to evince the predictive validity of motor assess-ment, information that was not available in previous small sample studies.Although relatively few data were missing, the final sample used in ouranalyses was heavily weighted toward English-speaking children. Thus,results from this study can only be generalized with caution to all childrenin the nation.
Children’s Motor Skills 771
Figure 2. ROC Curve for Spring First-Grade Mathematics
(a) ROC with Visual Motor SkillsArea under the curve = .78; Sensitivity = .78; Specificity = .63.
(b) ROC with Initial MathArea under the curve = .89; Sensitivity = .82; Specificity = .82.
(c) Joint ROC with Visual Motor and Initial MathArea under the curve = .90; Sensitivity = .82; Specificity = .82.
050 seung (755-778) 12/1/06 11:06 AM Page 771

Longitudinal Associations between Motor Skills and Cognitive Achievement
Overall, our results support the hypothesis that motor skills, specificallyvisual motor skills, are related to later cognitive achievement and are ableto successfully identify children at risk for academic underachievement atthe outset of schooling, especially when combined with initial achievementinformation. Correlational analyses demonstrated a significant relationbetween motor skills and cognitive achievement. Coefficients were similarto but higher than those reported in previous studies, whose average coeffi-cient was .30 for visual motor skills. Interestingly, correlations of kinder-garten motor skills with spring first-grade achievement were significantlyhigher than those with fall kindergarten achievement, suggesting longitudi-nal relations between early motor skills and the kinds of skills representedin later cognitive achievement.
Unique and Combined Predictability of Motor Skills for Later Cognitive Achievement
Hierarchical regression analyses that directly examined the predictabilityof early kindergarten motor skills for cognitive achievement during earlyschooling showed that visual motor skills at kindergarten entry were aunique, significant predictor of spring first-grade reading and mathematicsachievement. Gross motor skills were also significant, but their effect sizeswere negligible. Although the unique predictability of visual motor skillswas statistically significant, the effect size was not large. The results sug-gest that while motor skills are highly associated with later cognitiveachievement, combined assessment of visual motor and initial cognitiveachievement can provide better predictability than using motor informationalone as an indicator.
At the time of kindergarten entry, early cognitive and language abilitiessuch as narrative skills, vocabulary, or phonological awareness may also bestrong predictors of later academic achievement (Catts, Fey, Zhang, &Tomblin, 1999; Hart & Risley, 1995; Snow, 1985). Unfortunately, theECLS-K study does not include any variables concerning initial level ofgeneral cognitive abilities, IQ, or language skills other than early kinder-garten reading and mathematics achievement that we controlled for in ouranalyses. Future studies should consider including assessment of broadlybased cognitive and language development in their model in order to deter-mine the best predictors of later school achievement.
772 Merrill-Palmer Quarterly
050 seung (755-778) 12/1/06 11:06 AM Page 772

Identification of At-Risk Children Based on Motor Skills
The visual motor assessment also provided reliable classification informa-tion for children at risk for later academic achievement difficulties, inde-pendently and jointly with initial cognitive achievement assessments. ROCcurve analyses demonstrated that visual motor screening yielded high sen-sitivity and specificity for identifying later academic difficulties in bothreading and mathematics, although the unique predictability of motor skillsassessment over and above the predictability of kindergarten cognitiveachievement was not substantial.
The results suggest that academic skills develop partly by interactingwith visual motor skills; in practice, the results imply the use of visualmotor assessment for a kindergarten developmental screening as one ele-ment of a larger profile or battery (see Meisels with Atkins-Burnett, 1994).As shown by the regression and ROC results, the effect size of visual motorskills was not large, although it was statistically significant. This means thatthe information from the motor assessment is not strong enough to be usedalone, although motor information adds some predictability to the informa-tion obtained about initial cognitive achievement.
Implications and Limitations
The current study is not designed to verify the developmental mechanismthrough which visual motor skills may influence cognitive achievement. Infact, a proven causal mechanism has not yet been discovered. The presentstudy suggests that more than one model of the development of academicskills is valid. In addition to cognitive models (e.g., phonics approach to read-ing), there can be other pathways through visual or spatial processing thatmay influence achievement. Recent findings from neuropsychology demon-strate that visual and spatial processing is needed to fulfill complex cognitivetasks in reading and mathematics (Goel & Dolan, 2000; Zago et al., 2001).Studies of dyslexia also show that phonological, visual, and motor processingsystems all play a role in this disorder (Stein & Walsh, 1997). These studiessuggest that several specific aspects of visual motor skills (e.g., visual, spa-tial, or motor processing; visuospatial working memory; motor speed or auto-maticity; etc.) are related to cognitive achievement.
Moreover, motor skills may influence achievement indirectly throughsocial and emotional skills. For example, visual motor skills may be associ-ated with self-regulatory functions that influence academic achievement(McClelland, Morrison, & Holmes, 2000). Holding a pencil and drawing a
Children’s Motor Skills 773
050 seung (755-778) 12/1/06 11:06 AM Page 773

line, as assessed in the current visual motor scale, may be heavily influencedby self-control. In addition, gross motor skills can be indirectly related to aca-demic achievement through peer relations (Gruber, 1985), which mayexplain the lower effect size of gross motor skills on cognitive achievement.
Future research may address which aspects of visual motor skills bestpredict which subskills in reading or mathematics. Although the currentstudy was unable to examine the specificity of motor predictability, it maybe the case that specific aspects of motor skills predict different subskills inreading or mathematics. In addition, future studies may expand the studyby addressing predictability of motor skills for achievement beyond firstgrade. The significant relationship between motor skills and cognitiveachievement may be present in other developmental periods of time, con-sidering the evidence that cognitive achievement of children is stableacross grade levels (Cunningham & Stanovich, 1997). However, the degreeof association between motor skills and achievement can change dependingon the grade levels assessed, and the relationship between motor and cogni-tive achievement can vary depending on the skills measured. For instance,one study (Kurdek & Sinclair, 2001) reported a significant relationshipbetween motor skills and achievement in fourth grade, although the corre-lation coefficients were smaller (.26 with reading and .35 with mathemat-ics) than those in the current study of first-graders. Future studies mayemploy more in-depth assessment of motor skills and cognitive achieve-ment, including diverse aspects of motor skills and cognitive processing, tobetter understand how particular aspects of visual motor skills are associ-ated with aspects of ongoing achievement.
Several implications follow from our analyses. First, motor assessmentis associated with later school achievement and can be used as one of theindicators of future school achievement of young children. This studyshowed that motor performance, especially visual motor performance, cancontribute to examining children’s cognitive preparedness for school.Motor scores are not strong enough to be used in isolation to predict laterachievement or identify at-risk children, compared to the strength of initialcognitive achievement. But including motor skills in an early schoolassessment may increase the predictability of later achievement and theprobability of identifying children at risk for school failure. This may beeven more the case when early assessment or screening occurs prior toschool entry, when adequate assessment of an early cognitive achievementlevel is not relatively easy.
Second, our results support the position that developmental domains—specifically, motor, reading, and mathematics skills—are intercorrelatedaspects of a young child’s developing skills. As recent research on early
774 Merrill-Palmer Quarterly
050 seung (755-778) 12/1/06 11:06 AM Page 774

development suggests, children’s development cannot be separated easilyinto disconnected developmental domains (Smith et al., 1999). Rather,development is a complex process and is a result of interactions among thedomains; thus, it is the whole child that needs our attention (Bowman,Burns, & Donovan, 2001). Indeed, effective early childhood assessmenttools usually consist of multiple indicators or predictors of development(Meisels, 1994; Meisels & Atkins-Burnett, 2000). Teaching and researchwith young children should be based on an appreciation of this dynamicand intricate characteristic of development.
References
Bai, D. L., & Bertenthal, B. I. (1992). Locomotor status and the development ofspatial search skills. Child Development, 63, 215–226.
Bertenthal, B. I., Campos, J. J., & Kermoian, R. (1994). An epigenetic perspectiveon the development of self-produced locomotion and its consequences. Cur-rent Directions in Psychological Science, 3(5), 140–145.
Bowman, B. T., Burns, M. S., & Donovan, M. S. (Eds.). (2001). Eager to learn:Educating our preschoolers. Committee on Early Childhood Pedagogy. Wash-ington, DC: National Academy Press.
Broadhead, G. D., & Church, G. E. (1988). Contributions of motor, concept, andcommunication skills to preschool learning. In J. E. Clark & J. H. Humphrey(Eds.), Advances in motor development research (Vol. 2, pp. 115–126). NewYork: AMS Press.
Bryant, F. B. (2000). Assessing the validity of measurement. In L. G. Grimm &P. R. Yarnold (Eds.), Reading and understanding more multivariate statistics(pp. 99–146). Washington, DC: American Psychological Association.
Campos, J. J., Anderson, D. I., Barbu-Roth, M. A., Hubbard, E. M., Hertenstein, M.J., & Witherington, D. (2000). Travel broadens the mind. Infancy, 1(2),149–219.
Catts, H. W., Fey, M. E., Zhang, X., & Tomblin, J. B. (1999). Language basis ofreading and reading disabilities: Evidence from a longitudinal investigation.Scientific Studies of Reading, 3(4), 331–361.
Cunningham, A. E., & Stanovich, K. E. (1997). Early reading acquisition and itsrelation to reading experience and ability 10 years later. Developmental Psy-chology, 33(6), 934–945.
Diamond, A. (2000). Close interrelation of motor development and cognitivedevelopment and of the cerebullum and prefrontal cortex. Child Development,71(1), 44–56.
Ellis, A. (1985). The cognitive neuropsychology of developmental (and acquired)dyslexia: A critical survey. Cognitive Neuropsychology, 2, 169–205.
Children’s Motor Skills 775
050 seung (755-778) 12/1/06 11:06 AM Page 775

Ellis, A. (1987). Review of problems in developing cognitively transmitted cogni-tive modules. Mind and Language, 2, 242–251.
Goel, V., & Dolan, R. J. (2000). Anatomical segregation of component processes inan inductive inference task. Journal of Cognitive Neuroscience, 12(1),110–119.
Goldstein, D. J., & Britt, T. W., Jr. (1994). Visual-motor coordination and intelli-gence as predictors of reading, mathematics, and written language ability. Per-ceptual and Motor Skills, 78, 819–823.
Gruber, J. J. (1985). Physical activity and self-esteem development in children: Ameta-analysis. Academy Papers, 19, 30–48.
Hambleton, R. K., Swaminathan, H., & Rogers, H. J. (1991). Fundamentals of itemresponse theory. Newbury Park, CA: Sage.
Hart, B., & Risley, T. R. (1995). Meaningful differences in the everyday experienceof young American children. Baltimore, MD: Paul Brookes.
Hasselblad, V., & Hedges, L. V. (1995). Meta-analysis of screening and diagnostictests. Psychological Bulletin, 117(1), 167–178.
Iverson, J. M., & Thelen, E. (1999). Hand, mouth and brain: The dynamic emer-gence of speech and gesture. Journal of Consciousness Studies, 6(11–12),19–40.
Kavale, K. (1982). Meta-analysis of the relationship between visual perceptionskills and reading achievement. Journal of Learning Disabilities, 15, 42–51.
Kimmel, E. (2001). Review of the Early Screening Inventory-Revised. In B. S.Plake & J. C. Impara (Eds.), The fourteenth mental measurements yearbook(pp. 450–451). Lincoln: Buros Institute of Mental Measurements of the Uni-versity of Nebraska-Lincoln.
Knight, D., & Rizzuto, T. (1993). Relations for children in grades 2, 3, and 4between balance skills and academic achievement. Perceptual and MotorSkills, 76, 1296–1298.
Kopp, C. B., & McCall, R. B. (1982). Predicting later mental performance for nor-mal, at-risk, and handicapped infants. In P. B. Baltes & O. G. Brim (Eds.), Life-span development and behavior (Vol. 4, pp. 33–61). New York: Academic Press.
Kurdek, L. A., & Sinclair, R. J. (2001). Predicting reading and mathematicsachievement in fourth-grade children from kindergarten readiness scores.Journal of Educational Psychology, 93(3), 451–455.
Lesiak, J. (1984). The Bender Visual Motor Gestalt Test: Implications for the diag-nosis and prediction of reading achievement. Journal of School Psychology,22, 391–405.
Luria, A. R. (1973). The working brain. New York: Basic Books.
McCall, R. B. (1981). Early predictors of later IQ: The search continues. Intelli-gence, 5, 141–147.
776 Merrill-Palmer Quarterly
050 seung (755-778) 12/1/06 11:06 AM Page 776

McClelland, M. M., Morrison, F. J., & Holmes, D. L. (2000). Children at risk forearly academic problems: The role of learning-related social skills. EarlyChildhood Research Quarterly, 15(3), 307–329.
Meisels, S. J. (1989). Can developmental screening tests identify children who aredevelopmentally at risk? Pediatrics, 83, 578–585.
Meisels, S. J. (1994). Designing meaningful measurements for early childhood. InB. L. Mallory & R. S. New (Eds.), Diversity and developmentally appropriatepractices: Challenges for early childhood education (pp. 202–222). NewYork: Teachers College Press.
Meisels, S. J., with Atkins-Burnett, S. (1994). Developmental screening in earlychildhood: A guide (4th ed.). Washington, DC: National Association for theEducation of Young Children.
Meisels, S. J., & Atkins-Burnett, S. (2000). The elements of early childhood assess-ment. In J. P. Shonkoff & S. J. Meisels (Eds.), Handbook of early childhoodintervention (2nd ed., pp. 231–257). New York: Cambridge University Press.
Meisels, S. J., Marsden, D. B., Wiske, M. S., & Henderson, L. W. (1997). EarlyScreening Inventory-Revised. New York: Pearson Early Learning.
Messick, S. (1989). Validity. In R. L. Linn (Ed.), Educational measurement (3rded., pp. 13–103). New York: Macmillan.
National Center for Education Statistics. (2001). ECLS-K base year public-usedata files and electronic codebook. Washington, DC: National Center for Edu-cation Statistics.
National Center for Education Statistics. (2002). User’s manual for the ECLS-Kfirst grade public-use data files and electronic code book. Washington, DC:National Center for Education Statistics.
Paget, K. D. (2001). Review of the Early Screening Inventory-Revised. In B. S.Plake & J. C. Impara (Eds.), The fourteenth mental measurements yearbook(pp. 451–453). Lincoln: Buros Institute of Mental Measurements of the Uni-versity of Nebraska-Lincoln.
Payne, V. G., & Isaacs, L. D. (1999). Human motor development: A lifespanapproach (4th ed.). Mountain View, CA: Mayfield.
Piaget, J. (1952). The origins of intelligence in children. New York: InternationalUniversities Press.
Rosenbaum, D. A., Carlson, R. A., & Gilmore, R. O. (2001). Acquisition of intel-lectual and perceptual-motor skills. Annual Review of Psychology, 52,453–470.
Sackett, D. L., Haynes, R. B., & Tugwell, P. (1985). Clinical epidemiology: A basicscience for clinical medicine. Boston: Little, Brown.
Satz, P., & Fletcher, J. M. (1988). Early identification of learning disabled children:An old problem revisited. Journal of Consulting and Clinical Psychology,56(6), 824–829.
Children’s Motor Skills 777
050 seung (755-778) 12/1/06 11:06 AM Page 777

Schmidt, S., & Perino, J. (1985). Kindergarten screening results as predictors ofacademic achievement, potential, and placement in second grade. Psychologyin the Schools, 22(2), 146–151.
Silvia, P. A., & Ross, B. (1980). Gross motor development and delays in develop-ment in early childhood: Assessing significance. Journal of Human MovementStudies, 6, 211–226.
Smith, L. B., Thelen, E., Titzer, R., & McLin, D. (1999). Knowing in the context ofacting: The task dynamics of the A-not-B error. Psychological Review, 106(2),235–260.
Snow, C. E. (1985). Literacy and language relationships during the preschool years.Harvard Educational Review, 53(2), 165–189.
Stein, J., & Walsh, V. (1997). To see but not to read: The magnocellular theory ofdyslexia. Trends in Neuroscience, 20(4), 147–151.
Toteson, A. N. A., & Begg, C. B. (1988). A general regression methodology forROC curve estimation. Medical Decision Making, 8, 204–215.
Tramontana, M. C., Hooper, S. R., & Selzer, S. C. (1988). Research on the pre-school prediction of later academic achievement: A review. DevelopmentalReview, 8, 89–146.
Zago, L., Pesenti, M., Mellet, M., Crivello, F., Mazoyer, B., & Tzourio-Mazoyer,N. (2001). Neural correlates of simple and complex mental calculation. Neu-roImage, 13, 314–327.
778 Merrill-Palmer Quarterly
050 seung (755-778) 12/1/06 11:06 AM Page 778