the relationship between nurse staffing and …...the relationship between nurse staffing and...
TRANSCRIPT

The Relationship between Nurse Staffing and Patient Satisfaction in Emergency Departments
by
Imtiaz Daniel
A thesis submitted in conformity with the requirements for the degree of Doctor of Philosophy
Institute of Health Policy, Management and Evaluation University of Toronto
© Copyright by Imtiaz Daniel, 2012

ii
ii
The Relationship between Nurse Staffing and Patient Satisfaction
in Emergency Departments
Imtiaz Daniel
Doctor of Philosophy
Institute of Health Policy, Management and Evaluation University of Toronto
2012
Abstract
Patient satisfaction is a key outcome measure being examined by researchers
exploring the relationships between patient outcomes and hospital structure and care
processes. Only a few non-generalizable studies, however, have explored the
relationship of nurse staffing and patient satisfaction with nursing care in emergency
departments of hospitals. This dissertation aims to address that gap. Using more than
182,000 patient satisfaction surveys collected over a five-year period from 153
emergency departments (EDs) in 107 hospitals throughout Ontario, this study explores
the relationship between nurse staffing and patient perceptions of nursing care in a
range of Canadian ED settings, including urban and rural, community and academic,
and small and large healthcare institutions with varying sizes and case mix.
Using an established conceptual framework for investigating the relationship
between nurse staffing and patient outcomes, nineteen nurse staffing variables were
initially investigated. Ultimately, however, only five staffing variables were used in the
multi-level regression analyzes. These five variables included registered nurse (RN)
proportion, RN agency proportion, percent full-time nurse worked hours, RN worked

iii
iii
hours per patient length of stay and registered practical nurse (RPN) worked hours per
length of stay. Emergency department case mix index, patient age and gender, hospital
peer group, size, wait times, cleanliness of the emergency department, physician
courtesy, and year of measurement were controlled to account for their effect on the
relationship between nursing staffing and patient satisfaction in the ED.
The study revealed a subset of six patient satisfaction variables representing the
overall variation in patient satisfaction with nursing care in the ED. Although RN
proportion and RPN worked hours per length of stay were found to have a statistical
association with patient satisfaction in the ED, the association was weak and not
administratively actionable. Interpersonal and environmental factors such as physician
and nurse courtesy, ED cleanliness and timeliness, however, were areas which hospital
administrators should consider since they were highly associated with patient
satisfaction in EDs.

iv
iv
Acknowledgments
I would like to express my sincere gratitude to my supervisor, Jan Barnsley, and
my committee members, Linda McGillis Hall, George Pink, and Antoni Basinski for
providing support and guidance throughout the research process. Special thanks to Jan
for keeping me focused and moving forward.
I also wish to thank the Ontario Ministry of Health and Long-Term Care, the
Canadian Institute of Health Information, and the Ontario Hospital Association for
providing access to data required for this research.
Special thanks to Carey Levinton and Kevin Yu for their advice on data linkage
and analysis. I am grateful to Carol Brewer from the University of Buffalo and Sean
Clarke from the Faculty of Nursing for serving as my examiners and for their valuable
suggestions for subsequent research.
I am very grateful to my late father, Sonny, my beloved mother, Shaira, and my
entire family for their support, encouragement and assistance. My wife, Yen, provided
inspiration, encouragement and motivation. Without her, this thesis would not have
been possible. To my daughter, Kaitlyn: I adore you and appreciated having you in my
office, colouring my text books, while I was working on my thesis.

v
v
Table of Contents ACKNOWLEDGMENTS........................................................................................................................................ IV LIST OF TABLES.................................................................................................................................................... VI LIST OF FIGURES.................................................................................................................................................VII LIST OF APPENDICES....................................................................................................................................... VIII CHAPTER 1 INTRODUCTION................................................................................................................................1
1.1 STATEMENT OF THE PROBLEM.....................................................................................................................1 1.2 AIM OF STUDY.............................................................................................................................................2 1.3 SIGNIFICANCE OF STUDY .............................................................................................................................3 1.4 CONCEPTUAL FRAMEWORK ........................................................................................................................5 1.5 HYPOTHESES ...............................................................................................................................................8
CHAPTER 2 LITERATURE REVIEW..................................................................................................................10 2 OVERVIEW.....................................................................................................................................................10
2.1 BACKGROUND - EMERGENCY DEPARTMENTS ...........................................................................................11 2.2 STAFFING MODELS....................................................................................................................................14 2.3 NURSE STAFFING METHODOLOGY ............................................................................................................17 2.4 FACTORS INFLUENCING NURSE STAFFING.................................................................................................20 2.5 NURSE STAFFING MEASURES ....................................................................................................................22 2.6 PATIENT SATISFACTION WITH NURSING CARE ..........................................................................................33 2.7 INSTRUMENTS FOR MEASURING PATIENT SATISFACTION WITH NURSING CARE .......................................36 2.8 FACTORS ASSOCIATED WITH PATIENT SATISFACTION WITH NURSING ......................................................40 2.9 NURSE STAFFING THEORETICAL FRAMEWORKS........................................................................................49 2.10 SUMMARY .................................................................................................................................................51
CHAPTER 3 METHODS AND PROCEDURES ...................................................................................................53 3 OVERVIEW.....................................................................................................................................................53
3.1 STUDY DESIGN..........................................................................................................................................53 3.2 SAMPLE.....................................................................................................................................................58 3.3 POWER ANALYSIS .....................................................................................................................................59 3.4 DATA COLLECTION ...................................................................................................................................59 3.5 DATA ACCESS ...........................................................................................................................................67 3.6 DATA ANALYSIS .......................................................................................................................................67
CHAPTER 4 RESULTS ...........................................................................................................................................79 4 OVERVIEW.....................................................................................................................................................79
4.1 PATIENT SATISFACTION ............................................................................................................................79 4.2 EMERGENCY DEPARTMENT CHARACTERISTICS.........................................................................................87 4.3 RESEARCH QUESTIONS ANALYSIS.............................................................................................................96 4.4 SUMMARY ...............................................................................................................................................107
CHAPTER 5 DISCUSSION AND CONCLUSION..............................................................................................115 5 OVERVIEW...................................................................................................................................................115
5.1 STUDY VARIABLES..................................................................................................................................115 5.2 FINDINGS IN RELATION TO THE CONCEPTUAL FRAMEWORK ...................................................................119 5.3 STUDY IMPLICATIONS .............................................................................................................................125 5.4 LIMITATIONS OF THE STUDY ...................................................................................................................128 5.5 FUTURE RESEARCH .................................................................................................................................131 5.6 CONCLUSION...........................................................................................................................................132
REFERENCES ........................................................................................................................................................134
vi
vi
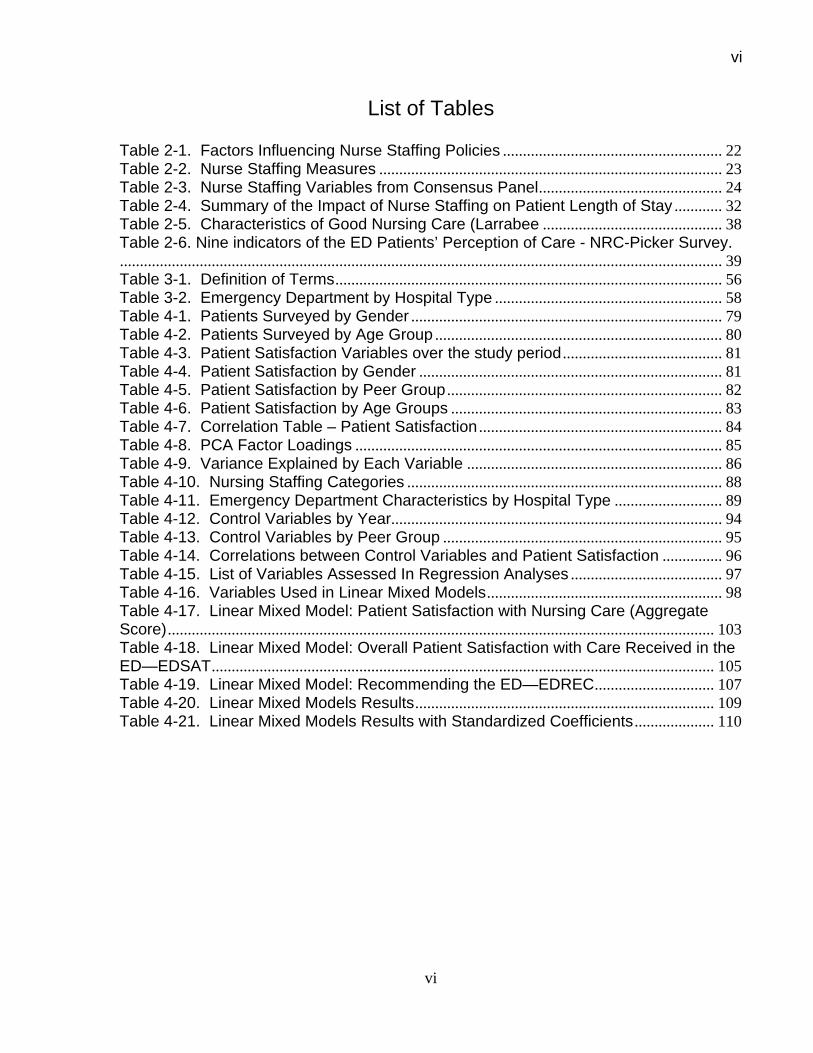
List of Tables Table 2-1. Factors Influencing Nurse Staffing Policies ....................................................... 22 Table 2-2. Nurse Staffing Measures ...................................................................................... 23 Table 2-3. Nurse Staffing Variables from Consensus Panel.............................................. 24 Table 2-4. Summary of the Impact of Nurse Staffing on Patient Length of Stay ............ 32 Table 2-5. Characteristics of Good Nursing Care (Larrabee ............................................. 38 Table 2-6. Nine indicators of the ED Patients’ Perception of Care - NRC-Picker Survey........................................................................................................................................................ 39 Table 3-1. Definition of Terms................................................................................................. 56 Table 3-2. Emergency Department by Hospital Type ......................................................... 58 Table 4-1. Patients Surveyed by Gender .............................................................................. 79 Table 4-2. Patients Surveyed by Age Group ........................................................................ 80 Table 4-3. Patient Satisfaction Variables over the study period ........................................ 81 Table 4-4. Patient Satisfaction by Gender ............................................................................ 81 Table 4-5. Patient Satisfaction by Peer Group ..................................................................... 82 Table 4-6. Patient Satisfaction by Age Groups .................................................................... 83 Table 4-7. Correlation Table – Patient Satisfaction ............................................................. 84 Table 4-8. PCA Factor Loadings ............................................................................................ 85 Table 4-9. Variance Explained by Each Variable ................................................................ 86 Table 4-10. Nursing Staffing Categories ............................................................................... 88 Table 4-11. Emergency Department Characteristics by Hospital Type ........................... 89 Table 4-12. Control Variables by Year................................................................................... 94 Table 4-13. Control Variables by Peer Group ...................................................................... 95 Table 4-14. Correlations between Control Variables and Patient Satisfaction ............... 96 Table 4-15. List of Variables Assessed In Regression Analyses ...................................... 97 Table 4-16. Variables Used in Linear Mixed Models........................................................... 98 Table 4-17. Linear Mixed Model: Patient Satisfaction with Nursing Care (Aggregate Score)......................................................................................................................................... 103 Table 4-18. Linear Mixed Model: Overall Patient Satisfaction with Care Received in the ED—EDSAT.............................................................................................................................. 105 Table 4-19. Linear Mixed Model: Recommending the ED—EDREC.............................. 107 Table 4-20. Linear Mixed Models Results........................................................................... 109 Table 4-21. Linear Mixed Models Results with Standardized Coefficients .................... 110

vii
vii
List of Figures Figure 1. Conceptual Framework of Nurse Staffing and Patient Outcomes (Kane et al., 2007) .............................................................................................................................................. 6 Figure 2. Conceptual Framework of Nurse Staffing and Patient Satisfaction ................... 7 Figure 3. Conceptual Framework of Nurse Staffing and Patient Satisfaction ................. 55 Figure 4. Predicted Satisfaction Scores for a typical ED .................................................. 113

viii
viii
List of Appendices Appendix A. Literature Review Search ................................................................................ 144 Appendix B. Outcomes Model for Healthcare Research .................................................. 148 Appendix C. Quality of Care—Dynamic Model .................................................................. 149 Appendix D. Theoretical Model of the Relationships between Context, Structure (professional practice), and Effectiveness (outcomes) ...................................................... 150 Appendix E. NRC+Picker Sampling Plan............................................................................ 151 Appendix F. OHRS Staffing Accounts ................................................................................. 152 Appendix G. Technical Specifications ................................................................................. 153 Appendix H. NACRS Database ............................................................................................ 157 Appendix I. Patient Satisfaction Descriptive Statistics ...................................................... 159 Appendix J. Patient Satisfaction Principal Component Analysis ..................................... 162 Appendix K. Patient Satisfaction Correlation Table........................................................... 165 Appendix L. Nursing Staffing Categories by Hospital Type ............................................. 166 Appendix M. Staffing Variables Correlation Table ............................................................. 167 Appendix N. Staffing Variables ............................................................................................. 172 Appendix O. Nurse Staffing and Patient Satisfaction with Nursing Care ....................... 184 Appendix P. Predicted Patient Satisfaction for a Typical ED ........................................... 198

1
Chapter 1 Introduction
1.1 Statement of the problem
Understanding the relationship between nurse staffing and patient satisfaction is
important for policy makers and administrators who want to manage effectively the
scarcity of nursing staff in a fiscally constrained environment. Due to the rising cost of
healthcare and nursing shortages, nurse staffing in emergency departments (EDs) has
become a high priority issue for policy makers and healthcare administrators. Predicting
the staffing needs of an ED, however, is difficult for several reasons. First, the volume of
patients can vary significantly during the day and from day to day, and ED
administrators must predict how much standby time is required to meet the service
demands of the department. Second, EDs must provide initial treatment for a broad
spectrum of illnesses and injuries, some of which require immediate attention because
they may be life-threatening. Finally, if the hospital has no available inpatient beds,
admitted patients could stay in the ED for an extended time (Schull et al., 2002).
Ensuring that patients not only receive adequate care, but that they also leave the ED
feeling satisfied with their experience, is therefore challenging in an era of cost control
and staffing issues.
The relationship between nurse staffing and patient satisfaction is also a concern
for researchers. One of the first studies to examine this relationship was done by
Abdellah and Levine (1958) and involved 60 large general hospitals. Gathering data
from 20,000 patients and staff in inpatient wards, Abdellah and Levine found that patient

2
satisfaction was higher when professional registered nurse (RN) hours were higher, but
when the total nursing hours (which include RN, licensed practical nurses [LPNs], and
nursing assistants) were higher, patient satisfaction was lower (Abdellah & Levine,
1958). Many studies have since investigated the relationship of nurse staff mix models
of regulated and unregulated staff and nurse-to-patient ratios to patient outcomes
(Blegen et al., 1998; Aiken et al., 2002; Needleman et al., 2002; Halm et al., 2005;
Clarke, 2007; Kane et al., 2007). In particular, recent studies on nurse staffing have
focused on topics such as the adequacy of hospital nursing staff (Aiken et al., 1996;
Unruh & Fottler, 2006), the effects of restructuring (Brewer & Frazier, 1998; Mark et al.,
2000), and nurse staffing in relation to (or as a predictor of) patient outcomes (Aiken et
al., 1994; Aiken et al., 2002; Needleman et al., 2002; Mark et al., 2004). Most studies
investigating the relationship between nurse staffing and patient satisfaction with
nursing care, however, were performed in inpatient wards of hospitals and only a few
non-generalizable studies can be found in the ED setting. As a result, a study that
investigates the relationship between nurse staffing and patient satisfaction in many
EDs over a period of time would allow administrators and policy makers to not only
understand how to improve patient satisfaction, but to do so in an effective manner.
1.2 Aim of study
This study will investigate patient satisfaction with nursing care in EDs and its
relationship to nurse staffing. Since there are few non-generalizable studies exploring
the relationship between nurse staffing and patient satisfaction in the ED, this research
will begin to fill this void by including data from a large number of EDs with different

3
case mix and size. In this study, EDs from 107 hospital corporations are examined over
a five-year period. The patient-level sample consists of 182,022 patients who were
discharged from Ontario’s EDs during the period of 2005/06 to 2009/10 and who also
completed a patient satisfaction survey that contained the following questions that
address patient satisfaction with nursing care:
1. When you had important questions to ask a nurse, did you get answers you could understand? (Answer)
2. If you had any anxieties or fears about your condition or treatment, did a nurse discuss them with you? (Explain)
3. Did you have confidence and trust in the nurses treating you? (Trust) 4. Did nurses talk in front of you as if you weren’t there? (Respect) 5. How would you rate the courtesy of your nurses? (Courtesy) 6. How would you rate the availability of your nurses? (Availability) 7. How would you rate how well the doctors and nurses worked together? (Dr-
Nurse working relationship)
By examining over 100 EDs in Ontario that served over 182,000 patients, this
study seeks to determine to what extent specific aspects of nurse staffing relate to:
1) patient satisfaction with nursing care;
2) overall satisfaction with care received in the ED; and
3) whether the patient would recommend this ED to friends and family.
The unit of analysis for this question is the hospital level. This chapter will discuss the
hypotheses, significance, and conceptual framework used in the study.
1.3 Significance of study
Patient satisfaction has become a well-established outcome indicator of health
care used by accreditation agencies, such as the Joint Commission on Accreditation of
Healthcare Organizations (JCAHO) and the National Committee on Quality Assurance

4
(NCQA) (Fahad Al-Mailam, 2005). It has been described as the “acid test” through
which the healthcare delivery system must pass when evaluating the effectiveness of
nursing (Bond & Thomas, 1992). Due to the increasing focus on patient-centred care,
which includes taking the patients’ views into account, patient satisfaction has become
more important, making it a key indicator of the quality of nursing care (Johansson et
al., 2002).
In the last decade, there has been a shift in research away from productivity
studies to exploring the relationship between the quality of patient care, nurse staffing
levels, and staff mix (McGillis Hall, 2005). The resulting change in direction is a
response to a call for more empirical studies to explore nurse staffing and patient
outcomes. This call came from a hallmark report in the United States by the Institute of
Medicine (IOM) Committee on the Adequacy of Nurse Staffing in Hospitals and Nursing
Homes (McGillis Hall, 2005). Many of the nursing studies resulting from this report,
however, focused on the inpatient setting and used different measures of staffing,
databases, and risk adjustment methods. As a result, those study findings are not
consistent (Mark, 2006). Factors such as nurse shortages, the growing demand for
hospital emergency services, tight fiscal constraints, and the desire to have patients
satisfied with the care experience, suggest that more studies are needed to understand
the relationship between nurse staffing and patient satisfaction in EDs.
ED administrators are faced with a growing volume of patients seeking care,
higher acuity of patients, and rising fiscal pressures. To address these issues,
administrators have implemented different staffing models to control cost in an
environment of higher and more complex patient volumes. Although patient satisfaction
is multidimensional and complex, patient satisfaction with nursing care has been found

5
to be the most important component of overall satisfaction with inpatient hospital care
(Strasser & Davis, 1991). In addition, funders of EDs, such as Ontario Ministry of
Health and Long-Term Care, closely monitor patient satisfaction. As policy makers
explore new funding systems that take into consideration the patient’s perspective,
understanding the nurse staffing—patient satisfaction relationship at the gateway to the
acute care system has become extremely important to health administrators, managers,
and staff. This study provides healthcare decision makers with vital information on this
relationship as an indicator of the quality of care in EDs.
1.4 Conceptual Framework
The conceptual framework for this research is adapted from the Nurse Staffing
and Patient Outcomes Model developed by Kane et al. (2007) to explain the relationship
between nurse staffing and outcomes of care (see Figure 1). The Kane et al.’s
framework focuses on two types of outcomes: nurse outcomes and patient outcomes.
The researchers argue that nurse outcome variables can interact with nurse staffing
variables to affect patient outcomes, and that nurse characteristics and patient factors
can influence nurse staffing. Patient factors and hospital organizational factors were
included in the Kane et al.’s framework because these factors may influence the effect
of nurse staffing on patient outcomes. As a result, Kane et al. argue that patient
outcomes subsequently will affect patient length of stay (LOS) since greater
complication rates will increase LOS.

6
Figure 1. Conceptual Framework of Nurse Staffing and Patient Outcomes (Kane et al., 2007)
In the current study, Kane et al.’s (2007) framework is adapted to focus on aspects
of care addressed in the literature exploring the relationship between nurse staffing and
patient satisfaction in EDs (see Figure 2). The present study investigates three different
aspects of nurse staffing:
1) Intensity of Care examined by hours per visit by staff category (RN, registered
practical nurse—RPN, Nurse Practitioner—NP, and agency nurse) and hours per
patient length of stay by staff category;
2) Nurse staff mix examined by measuring skill mix by staff category (RN, RPN,
agency nurse, NP); and
3) Staff Adequacy examined by nurse/patient staffing ratio for each staff category.

7
Figure 2. Conceptual Framework of Nurse Staffing and Patient Satisfaction
The conceptual framework includes patient factors and hospital organizational
factors that may influence the effect of nurse staffing on the selected outcomes. The
patient factors include age and gender. Hospital organizational factors include the
number of ED visits as an indicator of size, type of hospital, ED case mix index, ED
cleanliness, and proportion of patients seen within targeted length of stay timeframe.
Hospital factors and nurse characteristics can affect the relationship of nurse
staffing on patient outcomes (Aiken et al., 1994; Aiken et al., 2002). In light of this, and
because physician courtesy may also affect the relationship being investigated, the
Patient Satisfaction Outcomes • Overall Satisfaction - Overall, how
would you rate the care you received in the Emergency Department?
• Would you recommend this emergency department to your family and friends?
Nursing Care • When you had important questions to ask
a nurse, did you get answers you could understand? (Answer)
• If you had any anxieties or fears about your condition or treatment, did a nurse discuss them with you? (Explain)
• Did you have confidence and trust in the nurses treating you? (Trust)
• Did nurses talk in front of you as if you weren’t there? (Respect)
• How would you rate the courtesy of your nurses? (Courtesy)
• How would you rate the availability of your nurses? (Availability)
• How would you rate how well the doctors and nurses worked together? (Dr-Nurse working relationship)
Nurse Staffing Intensity of Care: RN hours per visit, RPN hours per visit, Agency Nurse hours per visit, NP hours per visit, Total staff hours per visit, RN hours per length of stay, RPN hours per length of stay, Agency Nurse hours per length of stay, NP hours per length of stay, Total staff hours per length of stay. Skill Mix: RN skill mix, RPN skill mix, Agency nurse skill mix, NP skill mix. Staff Adequacy: RN/Patient staffing ratio, RPN/Patient staffing ratio, Agency Nurse/Patient staffing ratio, NP/Patient staffing ratio, Total Staff/Patient staffing ratio.
Nurse Characteristics • Age • Education Level • Nurse Experience (yrs) • Full time/part time,
employment mix
Patient Characteristics • Age • Gender
Emergency Department
Care
Physician Characteristics • Physician Courtesy
Hospital Organizational Characteristics• Size (# of ED visits) • Type of hospital (teaching, small
community) • ED wait (% of patients seen within
recommended timeframe) • ED Case mix index • ED Cleanliness

8
hospital factors, nurse characteristics, and physician courtesy were included to
moderate the effects of nurse staffing variables on patient satisfaction outcome
variables.
1.5 Hypotheses
This study seeks to determine to what extent specific aspects of nurse staffing
relate to:
1) patient satisfaction with nursing care;
2) overall satisfaction with care received in the ED; and
3) whether the patient would recommend this ED to friends and family.
The study draws on existing administrative and patient satisfaction survey data from
Ontario’s EDs to test the following hypotheses:
Hypothesis 1: There is a positive relationship between RN proportion, nurse-to-patient
ratio, nursing hours per patient visit and each patient satisfaction with nursing care
variable (i.e., Answer, Explain, Trust, Respect, Courtesy, Availability, and Dr-Nurse
working relationship).
Hypothesis 2: There is a positive relationship between RN proportion, nurse-to-patient
ratio, RN hours per patient visit and overall satisfaction with care received in the ED.
Hypothesis 3: There is a positive relationship between RN proportion, nurse-to-patient
ratio, RN hours per patient visit and whether the patient would recommend the ED to
friends and family.

9
In summary, this study examines the relationship between nurse staffing and
patient satisfaction in emergency departments. Using an adapted framework of nurse
staffing and patient outcomes developed by Kane et al. (2007), the underlying structure
of patient satisfaction with nursing care and the presence, magnitude, and direction of
the relationships between nurse staffing in the ED and patient satisfaction variables are
assessed. The nurse staffing variables include the intensity of care, skill mix, and staff
adequacy. Patient satisfaction variables include variables with elements of nursing care
related to respect, courtesy, promptness, interpersonal relations, response to patient
questions, and explanation of actions taken. Overall satisfaction variables include
elements of nursing care related to overall satisfaction with care and recommending this
ED to family and friends.

10
Chapter 2 Literature Review
2 Overview
This literature review surveys the state of study on nurse staffing and patient
satisfaction with nursing care in emergency departments. Articles published over the
last three decades were examined if they focused on research related to the
relationship between nurse staffing and patient satisfaction with nursing care. Even
though there are many studies exploring the relationship of nurse staffing and outcomes
in the last ten years, very few examine the relationship between nurse staffing and
patient satisfaction with nursing care in the ED. For that reason, the search was
expanded to include all inpatient settings. The studies reviewed were primarily
observational in nature and measured staffing levels and patient satisfaction. Appendix
A gives more details on keywords used in the literature search for this review.
This review is organized in two major areas: (a) nurse staffing and (b) patient
satisfaction with nursing care. The chapter will:
• review the nature of services and models of care in EDs;
• define the concept of nurse staffing;
• examine the factors influencing nurse staffing;
• review measures of nurse staffing;
• review the concepts and measures of patient satisfaction, as well as the factors
affecting patient satisfaction measurement;

11
• examine the empirical evidence exploring the relationship between nurse staffing
and patient satisfaction; and
• examine nursing theoretical frameworks.
2.1 Background ‐ Emergency Departments
EDs are often the gateways to hospitals, and they have a higher census than in-
patient areas (Hall & Press, 1996). Patients presenting in EDs can require a range of
health services, from specialized care for life-threatening problems to primary care for
non-urgent problems. As a result, nurses highly trained in caring for major traumas may
also be caring for patients with non-urgent health needs. Moreover, the unique nature
of the ED encounter—which is brief, impersonal and emotionally intense—requires a
good understanding of the staffing strategies that influence patient outcomes.
Each year, 20% of Ontarians visit an ED at least once. In 2009/10, there were 5.4
million visits to the ED, with 73% of the resuscitation and emergent patients waiting up
to 8 hours, 75% of urgent patients waiting up to 6 hours, and 85% of the semi-urgent
and non-urgent waiting up to 4 hours (OHQC, 2010). Approximately 10% of Ontario’s
ED patients are admitted to hospital for care, but more than 80% return to the
community after receiving care in the ED (CIHI, 2011).
In the last two decades, hospital restructuring has been very prominent. In the
mid-1990s, overcrowding in EDs became a concern for Ontario’s hospitals. The growing
ED volume of patients, increases in the number of non-urgent patients, and
overcrowding of EDs led health policy makers and healthcare organizations to make
changes to the delivery of emergency care services by establishing hospital-managed

12
urgent care centres and creating fast-track services. In addition, many hospital
administrators facing funding shortfalls reduced their numbers of regulated nurses
(Aiken et al., 1996; CNA, 2004) and many registered nurse positions were replaced with
less-skilled positions (CNA, 2004).
2.1.1 Types of Emergency Departments
Emergency departments vary in size and in the types of patients seen. In
Ontario, some EDs are regional referral centres and receive severely ill patients from
other hospitals, while other EDs are the only source of care that is available 24 hours a
day, seven days per week. Traditionally, the ED has been for urgent medical care, but
in the last decade there has been a rise in the use of EDs by patients needing non-
urgent care (CIHI, 2011). A common theory for the change in utilization has been the
shortage of primary care, as a large number of ED users did not have access to primary
care when needed (Han et al., 2007). In the United States, the rise in non-urgent ED
visits has been attributed both to cuts in access to primary care services and to
individuals who lack health insurance, a regular place of medical care, or both (Tyrance
et al., 1996). Interestingly, there are also a significant number of non-urgent care ED
patients in jurisdictions such as Canada and Great Britain where there is universal
access to primary health care (Beland et al., 1998).
Non-urgent care visits in EDs are a very challenging issue facing health care
organizations, policy advisors, and patient advocates. Almost half of all ED visits are
non-urgent care patients (Williams & Bamezai, 2005), and this increase in non-urgent
visits has resulted in ED overcrowding, longer wait times, and heavy staff workloads
(Korn & Mansfield, 2008). To assist EDs, Ontario established hospital-managed urgent

13
care centres (UCCs) so that unscheduled patients presenting with acute or episodic
conditions can be treated in a setting other than EDs.
In Ontario, UCCs were established as a result of the Hospital Restructuring
Commission Services directives (HSRC, March 1997). Eleven UCCs were developed
during a period when ED overcrowding, ambulance diversions, and a growing
perception of physician and nurse shortages was attracting significant public scrutiny.
The goal of these UCCs is to assess, treat and/or plan a patient’s care within 60 to 90
minutes following arrival. Comprehensive EDs are open 24 hours a day, seven days a
week, and they provide care to patients who arrive by ambulance or other means, while
UCCs—although located in hospitals or ambulatory care centres— have restricted
hours and do not generally care for patients arriving by ambulance. They are, however,
staffed by the same types of personnel who work in comprehensive EDs.
2.1.2 Nurse Shortages
In the last decade nurse shortages in the U.S. and Canada have resulted in
vacancies in hospitals, long wait times, adverse events, and untenable work
environments for nursing staff. Canadian hospitals experienced registered nurse
shortages in the 1990s (Aiken et al., 2001). In 2004, the Canadian Nurses Association
predicted that Canada would need 60,000 full-time equivalent (FTE) registered nurses
by 2022 to meet healthcare needs (CNA, 2004). In 2007, the nurse shortage in the
United States was expected to reach 260,000 full-time equivalents by 2025 (Clarke,
2007).
Recent studies have provided evidence suggesting however that the nurse
shortage trends have reversed over the past decade (Auerbach et al., 2011; Staiger et

14
al., 2012). Between 2002 and 2009, there has been a large surge in the number of
younger RNs entering nursing resulting in a projected growth of the nursing workforce in
the U.S. in the next two decades. In fact, the growth between 2005 and 2010 is the
largest expansion of the RN workforce over a 5-year period ever observed in the last
four decades. The sudden rise in RN employment may be due to several factors
including the economic downturn. Staiger et al. (2012) stated that many RNs who were
not working or were working on a part-time basis may rejoin or change to full-time status
to ensure better personal economic security. These researchers predict that many of
the RNs who entered the workforce between 2005 and 2010 are likely to withdraw as
job recovery takes place and unemployment rates fall (Staiger et al., 2012). With an
expected wave of retirement of RNs in the next five years, another shortage is project
by 2020.
2.2 Staffing Models
A combination of nurse shortages, an increasing number of patients, and
increasing clinical responsibilities for nurses have resulted in a range of staffing models
being introduced in recent years. These models include changes in nurse staffing
levels, the nursing skill mix, staff allocation models with varying nurse staff levels (or
nurse-to-patient ratios), shift patterns, and the use of overtime and agency staff. This
review of the literature will focus on the different models of care in the emergency
department, methodology used for staffing in hospitals, factors affecting nurse staffing,
and measures of nurse staffing.

15
2.2.1 Emergency Department Models of Care
Models of care are applied to an ED to assist with the management of specific
patient profiles. Six contemporary models of care have been identified that are effective
and appropriate for EDs. These models are: fast track, short stay unit, streaming, care
coordination, rapid assessment team, and psychiatric liaison (PricewaterhouseCoopers,
2008). EDs have implemented a mix of these models, depending on the number of
visits, case mix, remoteness, skill mix, and experience of the staff.
Fast track is a model of care whereby patients with less urgent medical
conditions are "streamed" into a dedicated space for treatment (Drummond, 2002;
Yoon, 2003) . These patients are treated by a dedicated clinical team with the aim of
reducing patient discharge time from the ED to two hours. Studies found that the
implementation of fast track zones in large and middle-sized EDs with a high volume of
low-complexity patients resulted in a significant improvement in quality, safety, and
efficiency outcomes (Drummond, 2002; Yoon, 2003; Rodi et al., 2006; Considine et al.,
2008; Kwa & Blake, 2008).
Short stay units (SSUs) are also called emergency medical units (EMUs) and
clinical decision units (CDUs). These units are developed for ED patients who require
observation and specialist assessment, and whose length of stay is expected to be
limited (to less than 24 hours, for example) (Abenhaim et al., 2000; Daly et al., 2003;
NSW, 2006; Konnyu et al., 2011). SSUs are effective in improving patient flow through
an ED, limiting patient length of stay to six hours, and avoiding admissions to inpatient
units.

16
Streaming is a model of care where patients are separated into different streams
based on complexity and/or acuity and disposition (FitzGerald et al., 2010). Streaming
has been shown to improve quality, safety, and efficiency outcomes in EDs, and it has
been implemented in large and mid-sized EDs with visits per annum ranging from
35,000 to in excess of 60,000 (King et al., 2006).
Care Co-ordination Teams (CCT) and Geriatric Consultation Teams are
implemented in EDs to reduce admissions, length of stay, and re-presentations for
complex patients such as the elderly, people living alone, those requiring assistance
with activities of daily living, the homeless, and those with drug and alcohol problems.
Implementation of these teams has been associated with a significant reduction in
admissions, as well as high satisfaction among patients and staff (Sinoff et al., 1998;
OHA, 2003).
Rapid Assessment Teams (RATs) have been implemented in EDs to provide an
early comprehensive medical assessment. This has resulted in early initiation of
diagnostic tests, pain management and treatment, and the opportunity for immediate
discharge where appropriate (Bullard & Villa-Rowe, 2010). The RAT comprise of a
triage nurse and an independent clinician, with the triage nurse referring appropriate
patients to the RAT clinician for early assessment (Leaman, 2003). This model of care
is used in EDs with enough experienced medical doctors to cover both the ED and the
triage area (PricewaterhouseCoopers, 2008).
Psychiatric liaison roles provide psychiatric assessment and care for patients
who are identified with potential mental health problems. Examples of psychiatric
liaison roles include mental health triage and consultancy service nurses, mental health
liaison nurses, and psychiatric nurses. These psychiatric liaison roles are beneficial in

17
EDs where the staff may not have the expertise in assessing and treating mental health
patients, and their implementation has been associated with improvements in efficiency
measures, such as waiting times and length of stay (NSW, 2006).
The increased demand for ED care (as well as its very nature in treating
unscheduled patients presenting with acute or episodic conditions) has prompted a
change in workforce models with the introduction of nurse practitioners. The nurse
practitioner’s role expands the traditional nursing role and allows them to take on tasks
traditionally performed by physicians, including the prescription of medication, initiation
of diagnostic imaging and laboratory tests, referral of patients to specialists, and
admitting and discharging patients (Tye et al., 1998). NPs were introduced to
streamline care for those who are non-emergent patients, thus improving the efficiency
and care of the physician in the ED (McGee & Kaplan, 2007). Generally, NPs assume
responsibility for patients with minor injuries and operate independently within ED teams
(Byrne et al., 2000). NPs were found to provide equal or better care than junior doctors,
were better at recording medical histories, and had fewer unplanned follow-ups (Sakr et
al., 1999). Overall, patients who saw an emergency NP were satisfied with their care
and were both significantly more likely to have received health education and to be less
worried about their health than those who saw a doctor in the ED (Byrne et al., 2000).
2.3 Nurse Staffing Methodology
There are many definitions of the concept of nurse staffing in the literature, but
there is a convergence around a common set of elements that include appropriateness
of the amount of nursing staff, skill level of the nursing staff, mix of the nursing staff,

18
number of patients cared for on the assignment, cost efficiency, and effectiveness
(McGillis Hall, 2005). Furthermore, nurse staffing methodology can be described as a
standardized approach used to determine the appropriate number and mix of nursing
personnel required to provide nursing care that meets the workload demand of the
patient care unit.
Staffing methodologies can be classified into four areas based on the level of
logic and abstract reasoning involved in the construct (Halloran & Vermeersch, 1987).
The literature on nurse staffing methodologies can be categorized into four groups:
descriptive, industrial engineering, management engineering, and operations research.
Descriptive methodology is based on experience and judgment, where subjective
decisions are made regarding the appropriate number and mix of nursing staff. The
staffing decisions are essentially made using varying degrees of knowledge, training,
and analytical skill. Descriptive methodology results in ratios, formulas, or proportions
being developed using a wide range of techniques that vary from guesswork to
statistical analysis using empirical data. The weakness of this methodology is the lack
of consistency among users (Halloran & Vermeersch, 1987).
The industrial engineering methodology for nurse staffing was developed in the
1950s from techniques designed to improve productivity. These techniques included
work measurement, task analysis, work distribution, and reorganization. The goal of
industrial engineering method is to determine which tasks should be performed by
nurses, which tasks can be transferred to other staff, and how efficiency can be
improved through the mechanization of tasks. The solution to the problem was the re-
distribution of work from scarce resources to more abundant resources. The fallacy of

19
this concept, however, is the assumption that nursing is only a list of tasks and that
lesser skilled staff can produce the same quality of care.
Both descriptive and industrial engineering methodologies are used widely and
have contributed to the subsequent methodological developments used in staffing
decisions. The management engineering methodology encompasses industrial
engineering concepts and techniques, including work measurement, methods
improvement, and work simplification. In addition, the management engineering
methodology has concepts and techniques from operations research, most notably
variations in nursing work load, patient classification, and mathematical modeling. The
conceptualization of nursing is meaningful to both nurses and administrators since this
methodology has a clear and consistently applied protocol.
Operations research methodology is the most complex and is developed from
mathematical models to describe existing nurse staffing patterns for use in present and
future decisions. Models are developed by abstracting information on the patients and
the hospital system. Operations research methodology can manage complex situations
and identify consequences of critical decisions, and it has also been used to determine
nurse staffing patterns on inpatient care units. The concept of patient classification was
pioneered by Connor et al. in 1961, and they were the first to propose that nursing
workload on an inpatient unit varies with the degree of patient care required (Halloran &
Vermeersch, 1987).
These four nurse staffing methodologies show a gradual increase in both
sophistication and collection of reliable and pertinent data, but one common element is
that quality measurement of care—which includes patient satisfaction—is non-existent
in all four methodologies of staffing reviewed. Both hospital administrators and the
20
public are aware of the challenges of nursing personnel shortages, workload, and the
high cost of nursing services. There is, however, no scientifically based methodology
that will assist managers and hospital administrators to allocate efficiently scarce nurse
resources to promote quality patient outcomes (Yankovic & Green, 2008).
2.4 Factors Influencing Nurse Staffing
Kane et al. (2007) reviewed the literature and highlighted eight policies related to
nurse staffing in hospitals. These policies were related to:
1) staffing ratio, or the number of patients cared for by one nurse by job
category (RN, LPN, UAP);
2) staffing hours per patient day, or total number of nursing staff hours per
patient day;
3) staff mix or proportion of hours worked by each skill mix category (RN,
LPN, UAP);
4) shift rotations, or scheduling nursing staff to work different work shifts
(days, evening, nights) during a defined period of time;
5) shift rotation, or length of the shifts; overtime or policies permitting
additional worked hours over (for example, 40 hours/week, weekend
staffing or frequency of weekends worked);
6) the use of agency or temporary nurses; full-time/part-time mix, or the
number and type of full-time and part-time;
7) floating to nursing units or policies regarding when nurses can work on
other units; and

21
8) internationally educated nurses or policies regarding the hiring and use of
nurses educated in a foreign country.
Kane et al. (2007) found nurse staffing policies can be influenced by patient care
unit factors, for example, patient flow fluctuations may determine length of shift policies.
In addition, the researchers found that nurse staffing policies can be influenced in
hospitals in which nurses were unionized or of the age and/or tenure of nurses. Nurse
staffing strategies, however, result from staffing policies.
In 1999, the American Nurses Association (ANA) developed nine principles for
examining appropriate nurse staffing and three categories of factors that should be
considered when making nurse staffing decisions. These categories were: a) patient
care unit-related, b) staff related, and c) organization related (ANA, 1999). The factors
for patient care unit-related include both staffing for the individual patient and the
aggregate patient care needs of the unit. The staff-related factors, such as the
education and experience level of the nurses, are determined by the patient population
being served. Hospital-related factors, such as type and technology level, along with
patient care unit factors and nursing organization factors, for example, management
and leadership, both affect nurse staffing policies (Kane et al., 2007).
Table 2.1 summarizes the factors found by the ANA and other researchers (Mark
et al., 2000; Aiken et al., 2001; McGillis Hall et al., 2003; McGillis Hall, 2005; Kane et al.,
2007) that influence nurse staffing policies.

22
Table 2-1. Factors Influencing Nurse Staffing Policies
Factors Influencing Nurse Staffing Policies Patient physical and psychosocial Staff Related Organizational related
Primary Diagnosis Age Type, ownership, and mission Age Experience with the specific patient
population Effective and efficient support services
Comorbidity Level of nurses’ experience (e.g., novice to expert levels)
Access to timely relevant information (linked to patient outcomes)
Functional status Education and preparation (e.g. certification)
Orientation programs and ongoing competency assessment mechanism
Communication ability Language capabilities Technological preparation or technology level
Cultural and linguistics Tenure on the unit Adequate time for collaboration Severity and urgency Level of control in the practice
environment Care coordination
Scheduled procedures (patient flow/census fluctuations)
Degree of involvement in quality initiatives
Supervision of unregulated workers
The ability to meet health care requisites Immersion in activities such as nursing research
Process to facilitate transitions during mergers
Availability of social supports Involvement in interdisciplinary and collaborative activities regarding patient needs
Mechanisms for reporting unsafe conditions (risk management)
Number and competencies of clinical and non-clinical support staff
Logical method for determining nurse staffing levels and staff mix.
Contract Nurses
Many studies have examined the effects of changes in categories of nurse
staffing patterns on a number of outcomes, such as rates of in-hospital mortality, rates
of nosocomial infections, and rates of pressure ulcers (al-Haider & Wan, 1991; Blegen
et al., 1998; Dimick et al., 2001; Aiken et al., 2002; Needleman et al., 2002;
Tourangeau, 2002; Aiken et al., 2003; Aiken et al., 2003; Halm et al., 2005; Kane et al.,
2007; Cho et al., 2008). Fewer studies, however, have been found that examined the
relationship between nurse staffing and patient satisfaction (Bolton et al., 2003; Wolf et
al., 2003; Merkouris et al., 2004; Schmidt, 2004; Chan & Chau, 2005).
2.5 Nurse Staffing Measures
There is no instrument that truly measures nurse staffing, but researchers have
assessed nurse staffing using methods that focus on: a) staff compliment, and b) the

23
mix of staff employed in the organization or unit (McGillis Hall, 2005). Unfortunately, the
reliability, validity, and sensitivity of these measures cannot be assessed. In addition to
the numerical nurse staffing methods, few studies have used demographic
characteristics of nurse staff—education and experience, for example—to measure
nurse staffing (Blegen & Vaughn, 2001; O'Brien-Pallas et al., 2002; Aiken et al., 2003;
McGillis Hall et al., 2003; McGillis Hall, 2005). Table 2.2 shows some of the common
measures of nurse staffing used in studies reviewed.
Table 2-2. Nurse Staffing Measures
Measures of Nurse Staffing Proportion of Registered Nurses Blegen et al., 1998; Blegen & Vaughn,
1998; Mark et al., 2000; Needleman et al., 2002
Nursing Hours Per Patient Day Blegen et al., 1998; Blegen & Vaughn, 1998; Cho et al., 2008
Ratio of Registered Nurses to Patients Kovner & Gergen, 1998 ; (Spetz et al., 2000); Aiken et al., 2002
Number of Full-Time Equivalents (FTEs) Blegen et al., 1998; Blegen & Vaughn, 1998; Mark et al., 2000
Percentage of Full-Time, Part-Time and Casual
CIHI, 2008
Mix of Nursing Staff McGillis Hall, 1997; McGillis Hall L et al., 2003; McGillis Hall, 2005 ; (Unruh, 2003)
Level of Education and Experience Blegen & Vaughn, 2001; O'Brien-Pallas et al., 2002; Aiken et al., 2003; McGillis Hall, 2005
Controversy exists regarding the best measures of nurse staffing. An
international panel of experts was surveyed recently to get their opinion about specific
staffing measures (Van den Heede et al., 2007). The goal of the exercise was to
develop a comprehensive set of variables for future examinations of the association
between hospital nurse staffing and patient outcomes. Using a Delphi approach,
consensus was reached on ten nurse staffing measures and 29 background variables.
Table 2.3 shows three groups of staffing measures (number of nurse staff in relation to

24
patient volume, types of staff to be considered as a measure of the number of nurse
staff, and skill mix indicators) identified by the panel. Consensus was not reached,
however, for two variables: the number of full-time equivalents employed in an
organization or unit, and the proportion of RNs to all licensed nurse staffing. More
details on these variables are discussed in the following sections.
Table 2-3. Nurse Staffing Variables from Consensus Panel
2.5.1 Nurse‐to‐Patient Ratio
The nurse-to-patient ratio measures the number of patients cared for by a nurse.
One of the limitations of this measure is that the nurse-to-patient ratio relies on a
general ratio, which may include all nurses assigned to a unit, including non-clinical time
(Kane et al., 2007). The measure typically relies on less precise data about total nurse
staffing to patient volume that is derived from administrative databases, averaging
annual nurse-to-patient ratios at the hospital or unit level (Bolton et al., 2001).
Researchers have measured RN-to-patient ratio by surveying nurses in the last shift
worked (Aiken et al., 2002). This survey method has an advantage over using
Nurse Staffing Variables
Number of nurse staff in relation to patient volume Nurse-to-patient ratio Nursing hours per patient day Types of staff to be considered in a measure of the number of nurse staff Total nursing staff Total licensed nursing staff Total RN staff Skill mix indicators Proportion of licensed nursing staff to total nursing staff Proportion of RNs to total nursing staff Proportion of RNs with a Bachelor’s degree Proportion of RNs with a Master's degree

25
administrative data to calculate the ratio in that data is obtained from the nurses who
cared for the patients.
There are more specific measures of the nurse-to-patient ratio which include RN-
to-patient ratio, LPN (or RPN)-to-patient ratio and unlicensed-assistive-staff-to-patient
ratio. The ratio of patients per RN per shift ratio is frequently used as a measure of
nurse staffing in studies examining the effect of staffing on outcomes (Shortell et al.,
1994; Aiken et al., 2002).
Nurse-to-patient staffing requirements have been mandated in the U.S. In 2004,
California implemented a minimum nurse-to-patient staffing ratio requirement in acute
care hospitals that set the emergency department nurse-to-patient ratio at 1-to-4 for
general emergency, 1-to-1 for trauma and triage, and 1-to-2 for critically ill patients.
Many other states have introduced or enacted nurse staffing legislation and/or adopted
regulations addressing nurse staffing (Aiken et al., 2010). These requirements,
legislation, and regulations are in response to the concern of the adequacy of nurse
staffing in hospitals. The Emergency Nurse Association (ENA), however, has rejected
these nurse staffing levels and subsequently developed best-practice staffing guidelines
that take into consideration patient census, patient acuity, and patient length of stay
(ENA, 2003).
Studies have shown that increased nursing workload is significantly associated
with increased mortality, nurse burnout, and job dissatisfaction (Aiken et al., 2002;
Needleman et al., 2002; Kane et al., 2007; Van den Heede et al., 2009). Although the
association with the increase in RN staffing in California hospitals and improved
outcomes is difficult to assess, Aiken et al. (2010) examined whether nurse staffing
using state-mandated minimum nurse-to-patient ratios differed from nurse staffing in

26
two states that did not have legislation. This study revealed that nurses in California
hospitals cared for one less patient on average per shift than the two states without
legislation. Furthermore, lower patient-to-nurse ratios were associated with significantly
lower mortality, burnout among nurses, and job dissatisfaction.
Research has shown the consequences of the shortage of nurses. Hospitals
with high nurse-to-patient ratios have been found to have lower mortality rates (al-
Haider & Wan, 1991; Aiken et al., 2002; McGillis Hall, 2005; Kane et al., 2007). In
addition, nurse-to-patient ratios have been found to be related to process measures,
such as failure to rescue rates, adverse events, medical complications, postoperative
respiratory, and cardiac complications (Clarke, 2007).
In a study of three adult medical surgical units within a university teaching
hospital, patient satisfaction was found to increase when the number of nursing hours
per patient increased (Seago et al., 2006). Although this study showed that nurse
staffing can affect patients’ perceptions of the healthcare experience, the study cannot
be generalized.
2.5.2 Nursing Hours per Patient Day
Nursing hours per patient day is defined as the total number of productive hours
worked by all nursing staff with direct care responsibilities per patient day (a patient day
is the number of days any one patient stays in the hospital) (Kane et al., 2007).
Unfortunately, different methods have been used to estimate nurse hours per patient
day. Some investigators assume a 40-hour week and 52 working weeks per year
(2,080 hours per year). Others use more conservative estimates, such as 37.5 hours
per week for 48 weeks = 1,800 hours per year (Kane et al., 2007).

27
The ANA calculates the numerator, or nursing hours, as the number of
productive hours worked by nursing staff assigned to the unit who have direct patient
care responsibilities for more than 50% of their shift (American Nurses Association
(ANA), 2007). Productive hours are defined as the actual direct hours worked,
excluding vacation, sick time, orientation, education leave, or committee time. Direct
patient care responsibilities include both patient-centered nursing activities in the
presence of the patient and patient-related activities that occur away from the patient,
such as medication administration, nursing treatments, nursing rounds, admission,
transfer, discharge activities, patient teaching, patient communication, coordination of
patient care, documentation, and treatment planning. According to the ANA’s
methodology, nursing care hours are reported each month for registered nurses (RNs),
licensed practical nurses, licensed vocational nurses (LPNs/LVNs), and unlicensed
assistive personnel (UAP). The denominator, or patient days, is calculated from the
hospital via multiple census reports. Patient censuses are collected multiple times per
day by hospitals. These patient censuses are then averaged to get the daily average
census, and a sum of the daily average censuses is subsequently calculated to
determine patient days for the month on the unit.
Nurse hours per patient day reflect average staffing across a 24-hour period. As
a result, the measure does not reflect fluctuations in patient census, scheduling patterns
during different shifts (even the length of shifts varies), and periods of the year (Kane et
al., 2007). These issues are amplified in the emergency department, where there can
be a varying patient census in a given day. This measure also does not account for the
time nurses spend in meetings, educational activities, and administrative work.
Furthermore, while nurse hours per patient day gives an indication of the hours of care

28
available for actual patient care, it is limited in that it does not assist in identifying
whether the nursing hours were adequate for the complexity of the patient care needs
(McGillis Hall, 2005). The measure also does not take into consideration the mix of the
nursing staff.
For these reasons, the ANA (1999) questions the usefulness of the concept of
nursing hours per patient day. It argues that this measure should not be used by a
hospital to compare itself to other hospitals since the results are not adjusted to take
into consideration factors such as the patient’s age or severity of illness, either of which
may require more nursing care hours. Also, the frequency of admissions and
discharges, as well as the hospital layout, may also affect the nurse staffing needs.
In summary, nurse-to-patient ratio and nursing hours per patient day are the two
general measures of nurse staffing used in studies, and they were selected by the
international panel of nursing researchers as appropriate measures of nurse staffing
(Van den Heede et al., 2007; Van den Heede et al., 2009). The nursing hours per
patient day addressed hours of care provided by nursing staff averaging FTEs of
different nurse categories at the hospital level (Mark et al., 2004) and sometimes only
included productive hours worked in direct care (Bolton et al., 2001). As discussed
previously, however, the nurse-to-patient ratio relies on the less precise data of total
nurse staffing to patient volume that is derived from administrative databases. The ratio
of patients per RN per shift variable was more frequently used and provided greater
evidence of the effect, but both the ratio of patients per RN per shift and nurse-to-patient
ratio show generally the same trends (Kane et al., 2007).

29
2.5.3 Nursing Staff Mix
Although staff mix and staff mix models are well-described in the literature, few
studies are empirically based (McGillis Hall, 1997). Skill mix or staff mix has been
described by (Needham, 1996)—in accordance to the Royal College of Nursing— as
being:
the balance between trained and untrained, qualified and unqualified and
supervisory and operative staff within a service area … the optimum skill mix is
consistent with the efficient deployment of trained, qualified and supervisory
personnel and the maximization of contributions from all staff. (127)
This measure is defined as a proportion of productive (i.e. related to direct patient care)
hours worked by each skill mix category (RN, LPN, UAP) (Kane et al., 2007). Staff mix
may include combinations of RNs, registered practical nurses (RPN), or licensed
practical nurses (LPNs), as well as health care aides, nurse aides, and unlicensed
assistive personnel (UAP) or multi-skilled workers (McGillis Hall, 1997).
The majority of studies reviewed focused on registered nurses working in acute
care hospital settings. Kane et al. (2007) commented in their systematic review that the
evidence on the association between RPN or LPN and UAP personnel and outcomes is
limited and controversial. The proportion of registered nurses is considered to be the
direct nursing care hours provided to patients by RNs. This measure has been
calculated in different ways. For example, Blegen et al. (1998) used a two-step
approach by first calculating RN hours as the direct patient care hours provided by a
nurse, divided by total patient days on the unit. Subsequently, the proportion of RN was

30
calculated as RN hours per patient day divided by the total hours provided by all nursing
staff per patient day on the unit. Other researchers, however, calculated RN proportion
as the number of FTE RN staff divided by the number of FTE on the unit (Mark et al.,
2003).
2.5.4 Number of Full‐Time Equivalents
A count of the number of FTEs is another measure of nurse staffing. This
measure can be further broken down by category of staff, such as registered nurse
FTEs, registered practical nurse FTEs, and unregulated worker FTEs. There is
difference between the “head count” and FTE calculation: FTE represents the number
of positions in the unit, but the number of staff (head count) can be higher since a
position can be filled by part-time and casual staff. Thus, when this measure is used,
researchers have either linked it to the total number of employees employed, or they
have presented the percentage of FTE hours made up of full-time, part-time and/or
casual staff (Blegen et al., 1998; Mark et al., 2000; Blegen & Vaughn, 2001).
2.5.5 Percent of Full‐Time, Part‐Time or Casual Staff
This measure has grown in stature in the last decade because of the debate
about using casual staffing in hospitals. The Registered Nurses Association of Ontario
(RNAO) has advocated for increasing full-time employment in hospitals to be a
minimum of 70% (RNAO, 2005). No empirical literature, however, exist that associates
the number or percent of full-time, part-time, or casual nursing staff to outcomes
(McGillis Hall, 2005). This measure was also not selected by the international panel of
researchers in their selection of nurse staffing measures (Van den Heede et al., 2009).

31
2.5.6 Level of Education and Amount of Experience
Other staffing variables have been considered when exploring nurse staffing and
patient outcomes. Researchers have selected the education level and the experience
of nurses as important background variables (Van den Heede et al., 2009). Kane et al.
(2007) found a significant negative correlation between the percentage of nurses with
Bachelor of Science in Nursing (BSN) degrees and the incidence of deaths related to
health care (r = -0.46, p = 0.02). The crude rates of complications were found to be
associated with a reduction of 1.13 percent (95 percent CI 1.9-0.36) for each additional
year of nurse experience in surgical patients in the ICU (Aiken et al., 2003).
Furthermore, an increase of 1 percent in the proportion of nurses with BSN degrees
was associated with a reduction in the rate of failure to rescue by 0.04 percent (95
percent CI 0.06-0.02). The authors reported a 5 percent reduction in failure to rescue
corresponding to a 10 percent increase in the proportion of nurses with BSN degrees
(RR 0.95, 95 percent CI 0.91- 0.99). Similarly, (Aiken et al., 2003) found hospitals
reported lower rates of surgical mortality and failure to rescue if they had higher
proportions of nurses with BSN degrees.
Having more experienced nurses was found to be associated with lower
medication errors and fall rates (Blegen & Vaughn, 2001). McGillis Hall (2005) reported
similar results, with less-experienced nurses being associated with higher amounts of
wound infections on a unit. In their comprehensive review of the nurse staffing
literature, however, Kane et al. (2007) found studies that did not show significant
changes in pressure ulcers, patient falls, or urinary tract infections in relation to nurse
experience and education.

32
2.5.7 Other Factors Thungjaroenkul et al. (2007) performed a systematic review of the literature on the
impact of nurse staffing on hospitals costs and patient length of stay. The reviewers
found the relationships between nurse staffing, hospital costs, and length of stay were
mixed. The studies also found a range of methods and definitions of costs and length of
stay. Although it was difficult to conclude the effects of nurse staffing, the evidence
suggested that significant reductions in cost and length of stay may be possible with
higher ratios of nursing personnel in hospital settings (Thungjaroenkul et al., 2007). Ten
out of the 13 studies showed that the ratio of RNs to patients, nursing staff mix and
hours per patient day were significantly related to patient LOS. The researchers found
no studies that evaluated the effect of RN staff experience and RN staff education on
LOS. Table 2.4 shows the impact of nurse staffing on patient length of stay, as reported
by Thungjaroenkul et al. (2007).
Table 2-4. Summary of the Impact of Nurse Staffing on Patient Length of Stay
Effect of Nurse Staffing on Patient Length of Stay Nurse Staffing Variables Length of Stay Measures Sources Significant Findings
Ratio of RNs to patients Days of admission Ratio of actual and expected LOS Total hours
Amaravadi et al. (2000) Pronovost et al. (1998) Lichtig et al. (1999) Lassnigg et al. (2002)
Negative relationship Negative relationship NS Negative relationship
Ratio of RNs to other nursing staff
Days of admission Days at midnight census Ratio of actual and expected LOS Not identified
Pratt et al. (1993) Cho et al. (2003) Newhouse et al. (2005) Barkell et al. (2002) Lichtig et al. (1999) Needleman et al. (2006)
NS Negative relationship NS Negative relationship Negative relationship Negative relationship
Hours per patient day Days of admission Not identified
Cho et al. (2003) Schultz et al. (2003) Behner et al. (1990)
Negative relationship Negative relationship Negative relationship
(Source: Thungjaroenkul et al. (2007))

33
2.6 Patient Satisfaction with Nursing Care
This section of the review of the literature presents an overview of customer and
patient satisfaction in the marketing and health services literature, the definition of
patient satisfaction, the methodological issues in measuring patient satisfaction, and the
factors affecting patient satisfaction.
Patient satisfaction with nursing care has been defined as the patients’ subjective
evaluation of the cognitive-emotional reaction that results from the interaction of their
expectations of ideal nursing care and their perception of actual nursing care (Risser,
1975; Eriksen, 1995; Johansson et al., 2002). Unfortunately, consensus on a common
conceptual definition of patient satisfaction is still lacking (Fitzpatrick, 1991; Bond &
Thomas, 1992; Cleary et al., 1992; Williams, 1994). Laschinger et al. (2011) argue that
few studies have demonstrated empirical support for the concept of patient satisfaction.
In fact, researchers have commented that patient satisfaction, being multi-dimensional
in nature, has been measured in many different ways because there is no consensus on
the domains to be included (Hall & Dorman, 1990; Chang, 1997; Sitzia & Wood, 1997;
Merkouris et al., 1999).
Patient satisfaction is nonetheless important to hospital administrators since it is
the arbitrator between patient’s perception of quality of care and his/her future intentions
to reuse the service or recommend the service to others (Laschinger et al., 2011).
Furthermore, perception of quality can be defined as a long-term attitude developed
over time, whereas patient satisfaction can be defined as a short-term response to a
specific experience. So unlike healthcare marketers, who are interested in a patient’s
future desire to recommend the healthcare provider to others (or to return themselves),

34
nurses focus on utilizing patient satisfaction data to improve the patients’ health status.
Therefore, patient satisfaction can be treated as both an outcome measure (satisfaction
with health status following treatment) and a process measure (satisfaction with the way
in which care was delivered) (Coulter et al., 2009).
Research frameworks for patient satisfaction with nursing have been presented
in the literature (Greeneich, 1993). Concepts used in these frameworks included
explanations, concern, mutual goal settings, receptiveness to patients’ expressions of
feelings, technical competence, nursing knowledge, communication, equity of treatment,
and the giving of information (Bursch et al., 1993). With respect to the emergency
department, five important variables that correlate with overall ED patient satisfaction
are waiting time before being examined, nursing care, physicians’ concern, how
organized the staff was, and the information provided by physicians and nurses
concerning the patients’ illnesses (Bursch et al., 1993; Krishel & Baraff, 1993;
Sandovski et al., 2001).
Boudreaux et al. (2004) highlighted that the studies on patient satisfaction with
ED care have inconsistent findings, thus firm conclusions are not possible. The
researchers found several methodological issues that cause these discrepancies.
Outcomes were not standardized in ED studies, Some studies, for example, use ratings
of overall satisfaction and likelihood of recommending the ED to others. Although the
outcomes are often conceptually similar and highly correlated, they are not necessarily
identical.
Another issue for studies of nurse staffing and patient satisfaction with nursing
care is the lack of a universally accepted pool of indicators. Studies vary in the number,
type and nature of the predictors used, therefore inconsistencies among findings are not

35
surprising (Boudreaux et al., 2004). Boudreaux et al. (2004) commented that research
methodologies differ among studies with some studies using postal surveys while others
used telephone surveys, proxy raters and the time elapsed since the ED visit. In
addition, studies used highly correlated predictors, thus resulting in noncollinearity
issues for regression analyses. Lastly, there is a tendency for researchers to use the
traditional p-value cut-off strategy to interpret the results of statistical analyses, which
may artificially inflate descrepancies between studies.
Information sharing is an important predictor of satisfaction for both inpatient and
ED setting (Nerney et al., 2001). In a study of the factors associated with older patients’
satisfaction with care in an ED, anxiety and concerns felt by patients were alleviated
through effective communication (Nerney et al., 2001). Furthermore, staff interpersonal
skills, communication skills, and the provision of information are predictors of patient
satisfaction in EDs (Boudreaux et al., 2004; Boudreaux & O'Hea, 2004; Taylor &
Benger, 2004).
Nurses have consistently emphasized the importance of emotional care for
patients (Jacox et al., 1997; Boudreaux et al., 2000; Darby, 2002; Johansson et al.,
2002; Aiello et al., 2003; Boudreaux & O'Hea, 2004; Al-Mailam, 2005; Liu & Wang,
2007). This, however, is contrast to what the patients themselves feel. In a survey to
determine patient’s satisfaction with nursing, patients were found to expect the following
nursing qualities: a friendly personality, kindness, a fast response to the needs of the
patient, and adequate time to provide the needed care (Fitzpatrick, 1991). Patients also
consider technical care and providing explanations regarding their condition as
important (Megivern et al., 1992; Sitzia & Wood, 1997; Schmidt, 2003; Chan & Chau,
2005). Despite this perception, a study by (Donabedian, 1980) highlights that patients

36
have a limited knowledge of the technical aspect of care. Other researchers have
supported that conclusion, showing that patients were more concerned with the
interpersonal skills of staff than with their technical skills and competency (Nelson E &
C., 1993; O'Connell et al., 1999; Taylor & Benger, 2004). .
Patients’ expectations of the nurse are related to the nurse’s knowledge and
competence as well as ‘personal’ care (Johansson et al., 2002). Moreover, patients
expect nurses to act as a companion and adviser, be empathetic to their needs, have
good communication skills, provide the necessary information, and direct the patient
both emotionally and physically. These aspects of patients’ expectations are important
to consider in the measurement of patient satisfaction with nursing care.
2.7 Instruments for Measuring Patient Satisfaction with Nursing Care
There are several instruments used to collect patient satisfaction, but many of
them are not based on theoretical models. Researchers are unable to compare results
across settings because of the lack of a standardized instrument with sound
psychometric properties (Dansky & Miles, 1997). In 1975, Risser created the first
standardized measure of patient satisfaction. It had three dimensions of satisfaction: a)
technical/professional behaviours (i.e. nursing knowledge and techniques), b) a trusting
relationship (i.e. communication and interpersonal skills), and c) an educational
relationship (i.e. information-sharing about patient condition and care processes)
(Risser, 1975). Over the years, Risser’s measures have been adapted by many
researchers to create other instruments to measure patient satisfaction (Hinshaw &

37
Atwood, 1982; Oberst, 1984; LaMonica et al., 1986; Larson & Ferketich, 1993). In fact,
newer instruments were created by modifying and extending the three dimensions of
Risser's original instrument to “reflect nursing behaviors expected in the acute care
setting'' (LaMonica et al., 1986 p. 44). Nonetheless, all of these instruments have
limitations associated with the conceptual complexity of patient satisfaction (Dozier et
al., 2001).
Notwithstanding the conceptual limitations, there are a number of valid and
reliable instruments used to measure patient satisfaction with nursing care (Strasen,
1989; Chang, 1997; Larrabee & Bolden, 2001). In a review of 53 studies on patient
satisfaction with nursing, Chang (1997) found 13 different, published instruments
between 1992 to 1997. Having many different instruments measuring patient
satisfaction can be problematic. Chang expressed concerns about variation in the
scales used, the difference in domains covered between instruments, and the variation
in data collection methods. For these reasons, Chang concluded that it was difficult to
draw comparisons between studies.
Larrabee and Bolden (2001) performed a literature review and found 40
instruments designed to measure patient satisfaction with nursing care had been
published between 1966 to 2001. Using a convenience sample of 199 hospitalized
adult patients in a public hospital in South Central United States, the authors reported
patients identified five themes of good nursing care: providing for my needs, treating me
pleasantly, caring about me, being competent, and providing prompt care. Table 2.5
shows the concepts for each theme.

38
Table 2-5. Characteristics of Good Nursing Care (Larrabee and Bolden, 2001)
Theme Concept
Theme 1: Providing for needs Taking care of me Checking on me Responding to my requests Providing comfort Giving accurate information Providing a pleasant environment
Theme 2: Treating Me Pleasantly Treating me nicely Respecting me Having a positive attitude Treating me with patience
Theme 3: Caring about Me Being “there for me” Showing caring or concern
Theme 4: Being Competent Using knowledgeable skills Striving for excellence
Theme 5: Providing Prompt Care
More recently, there are commercially available survey instruments by the Picker
Institute and Press Ganey Associates used by hospitals to measure patient satisfaction
in hospitals (Hall & Press, 1996). These survey instruments were developed from data
retrieved in focus groups with patients and providers. The NRC-Picker survey, used in
EDs in both Ontario and British Columbia, consists of the following categories: patient
preferences, coordination of care, information and education, physical comfort,
emotional support, family and friends’ involvement, and continuity and transition.
Although the commercial tools addressed some of the issues of the earlier tools, they
are criticized as being too global and failing to measure specific aspects of nursing care.
Over the last two decades, researchers have developed and refined dimensions
of patient satisfaction to categorize variables (Ware et al., 1983; Eriksen, 1995; Chang,
1997; Larrabee & Bolden, 2001). To assist with organizing the nursing questions into
structure, process and outcome, a framework established by Chang (1997) was utilized
to organize the variables from the patient satisfaction survey. Table 2.6 shows the

39
subset of nine indicators of the emergency department patients’ perception of outcome
of care from the NRC-Picker survey used in Ontario. There are seven indicators that
relate to patients’ perception of nursing care outcomes. Item #8 and item #9 reflect the
patients' perspective of the overall satisfaction with care in the ED.
Table 2-6. Nine indicators of the ED Patients’ Perception of Care - NRC-Picker Survey.
Item Items in Survey (Variables) Chang (1997) Indicators
Outcome Indicators 1 When you had important questions to
ask a nurse, did you get answers you could understand?
Patients felt that they had better understanding of illness, received useful or helpful information, and knew how to care for themselves when they went home.
2 If you had any anxieties or fears about your condition or treatment, did a nurse discuss them with you?
Patients felt that nurses reduced their fears and concerns.
3 Did you have confidence and trust in the nurses treating you?
Patients felt that nurses met their needs and nursing care was helpful.
4 Did nurses talk in front of you as if you weren’t there?
Patients felt that nurses made them comfortable, clean, and refreshed.
5 How would you rate the courtesy of your nurses?
Patients felt calm, better, and secure after receiving nursing care.
6 How would you rate the availability of your nurses?
Patients felt that nurses met their needs and nursing care was helpful.
7 How would you rate how well the doctors and nurses worked together?
8 Would you recommend this emergency department to you family and friends?
Intend to return to this hospital if needed in the future and recommend this hospital to friends and relatives.
9 Overall, how would you rate the care you received in the Emergency Department?
Overall satisfaction or quality.
The survey questions from the NRC-Picker tool correspond to Chang’s specific
items with the exception of item #7. Using Chang’s mapping, the NRC-Picker questions
correspond to outcome variables. For items #1, #2, #8 and #9, the NRC-Picker
questions measured the same concepts as Chang’s indicators. For item #3, the NRC-
Picker question—"did you have confidence and trust in the nurses treating you"—was

40
more specific than Chang’s indicator but measured a similar concept of confidence and
trust in the nurse. Item #4—" the nurses talking in front of you as if you weren’t there"—
is more specific than Chang’s indicator of respect, privacy and dignity. Item #5—"the
courtesy of your nurses"—is more specific than Chang’s indicator, which measures if
the patient felt calm, better and secure after nursing care. Item #6—"the availability of
the nurse"—measures if the patient felt the nurse was available when he or she needed
care, emotional support, or physical assistance. So Item #6 is similar to Chang’s
indicator which measures if the patient felt his or her needs were met. In this review,
the items from the NRC-Picker survey correspond with the outcome indicators from
Chang (1997) with few differences.
2.8 Factors Associated with Patient Satisfaction with Nursing
Studies have shown that patient satisfaction with nursing care in the inpatient
setting is strongly associated with (and is an important predictor of) a patient’s overall
satisfaction with the hospital care (Johansson et al., 2002; Bolton et al., 2003; Larrabee
et al., 2004; Al-Mailam, 2005; Chan & Chau, 2005; McGillis Hall, 2005; Kane et al.,
2007). Some researchers have argued that published research on factors influencing
patient satisfaction with nursing care has typically failed to assess the extent to which
individual (patient-specific), patient-provider, and departmental (provider-specific)
influences interrelate in affecting patient satisfaction (Coulter et al., 2009). These factors
can be classified as patient characteristics, interpersonal and structural factors, nurse
job satisfaction, and nursing work environment.

41
Patient characteristics—such as cultural background, age, sex, and education—
have been found to be related to patient satisfaction ratings (Bacon & Mark, 2009).
Unfortunately, the findings are mixed since some studies did not find any relationships
between patient satisfaction and demographic variables (Laschinger et al., 2011).
The perceived quality of the interactions between the patient and nurse has been
found to be related to patient satisfaction. There are four interpersonal factors
associated with patient satisfaction: 1) involving patients in decision making about their
care and respecting their right to convey their thoughts or opinions about their care
options; 2) providing information about patients’ conditions and explanations of
symptoms they may experience; 3) using a compassionate care approach; and 4)
creating an equitable relationship that ensures fairness (Laschinger et al., 2011). The
kindness and warmth of nurses, their technical skills, the amount of information they
provided to patients, the time they spent with their patients, and the respect they
provided to the relatives and friends of patients have all been found to be associated
with enhancing the level of patients’ satisfaction and their experiences of nursing care
(Alhusban & Abualrub, 2009).
Structural factors have been found to affect patient satisfaction with nursing care.
These factors included the perception of nurses’ competency and method of delivery of
nursing care, such as critical pathways and professional practice models. The impact of
nurses’ job satisfaction on patient satisfaction with nursing care has been examined.
Patients on a unit with nurses who reported high job satisfaction themselves were found
to report higher levels of overall satisfaction with their care (Laschinger et al., 2011).
Conversely, Larrabee et al. (2004) were unable to find a significant relationship between
42
nurses’ job satisfaction and patient satisfaction. Unfortunately, these findings are not
consistent throughout the literature.
Studies have shown staffing levels in inpatient units of hospitals have
significantly influenced patient satisfaction (Sovie & Jawad, 2001; McGillis Hall et al.,
2003), but more research is required to establish the link between healthcare provider
working conditions and patient outcomes (Laschinger et al., 2011). In 2009, however,
researchers reported that increased satisfaction on units was associated with greater
support services for nursing (Bacon & Mark, 2009).
Another factor that affects patients rating their satisfaction with the quality of care
is the inability to dissociate their view of nurses from the hospital (Mahon, 1996). For
example, patients may not differentiate between nursing care and the hotel functions
provided in a hospital (Dozier et al., 2001). So while patients may feel capable of rating
the hotel functions of their hospital experience, they assume that the therapeutics and
care they receive are what they should be receiving (Williams, 1994; Dozier et al.,
2001). Therefore, the patient’s ratings of nursing care instead may be based on his/her
assessment of housekeeping or dietary services.
As discussed previously, many instruments used to measure patient satisfaction
do not adequately capture nursing activities (Chang, 1997). This can be problematic for
researchers examining the link between patient satisfaction, nursing activities, and/or
changes in staff mix and staffing ratios. Furthermore, patients have difficulty in
differentiating nurses from other hospital staff. This issue threatens the reliability and
validity of the measurement of patient satisfaction with nursing care (Pasoe, 1983).
Other factors that affect patient satisfaction with nursing care are discussed in
the next sections.

43
2.8.1 Gender
In their review of the literature, researchers have found that men are more
satisfied with their care than women (Lövgren et al., 1998; Johansson et al., 2002;
Alhusban & Abualrub, 2009; Arnetz & Arnetz, 1996.), while other studies reported
women to be more satisfied (Lövgren et al., 1998; O'Connell et al., 1999; Ahmad &
Alasad, 2004; Chan & Chau, 2005; Alhusban & Abualrub, 2009). Still some studies
reported that gender was not associated with satisfaction at all (Barbara et al., 1999);
(Wallin et al., 2000; Liu & Wang, 2007). There is a lack of consensus on the association
of patient satisfaction and gender.
2.8.2 Age
The age range of the patients attending an ED can be wide (Sandovski et al.,
2001). Although the literature revealed that the associations between patient
satisfaction, their education level, and length of stay were consistent, there are
inconsistent results in regard to the association between patient satisfaction and age or
gender. Age has been found to be significantly related to patient satisfaction
(Johansson et al., 2002; Chan & Chau, 2005; Liu & Wang, 2007). Older patients were
found more satisfied than younger patients (Mahon, 1996; O'Connell et al., 1999; Liu &
Wang, 2007; Alhusban & Abualrub, 2009), while younger patients were found to have
significantly lower satisfaction with ED care (Hansagi et al., 1992; Sun et al., 2000;
Sandovski et al., 2001). Other studies, however, reported that age was not associated
with satisfaction (Barbara et al., 1999; Wallin et al., 2000; Ahmad & Alasad, 2004;
Alhusban & Abualrub, 2009).

44
Patient satisfaction with the triage nurse was examined in the emergency
department (Chan & Chau, 2005). Similar to the studies of inpatient wards, Chan and
Chau (2005) found a statistically significant correlation between age and patient
satisfaction, with older people tending to report a higher level of patient satisfaction.
Despite this, however, an earlier study on patient satisfaction with emergency nursing
care found no significant correlation between age and patient satisfaction with
emergency nursing care, although no explanation was given as to why there was such a
difference (Raper, 1996).
2.8.3 Nurse Staffing Education and Experience
Kane et al. (2007) reviewed observational studies to examine the relationship
between nurse staffing and outcomes, including patient satisfaction. The researchers
commented that there is limited evidence to suggest that better nurse staffing is
associated with patient satisfaction with nursing care in inpatient units. Kane et al.
(2007) argued that inpatient units with a high proportion of RNs were associated with
high ratings of satisfaction. In fact, they reported that surgical patients in units using a
total patient care model with a larger proportion of RNs were more satisfied compared
with a team nursing model which included fewer RNs (84.6 ± 13 vs. 83.4 ± 13 scores on
the Parkside Patient Satisfaction Survey) (Kane et al., 2007).
Baccalaureate-level nursing education was strongly associated with quality of
care (Blegen & Vaughn, 2001). Similarly, in a study of medical units that had higher
proportions of RNs with BSN degrees, patients expressed satisfaction with care 1.5
times more often (Minnick et al., 1997). In addition, an increase by one percent in the
proportion of nurses with BSN degrees was associated with greater satisfaction by 13.6

45
± 3.6 patient satisfaction scores (Seago et al., 2006). There is some evidence from a
small number of observational studies that an increase in nurses with BSN degrees may
reduce the risk of hospital-related mortality (Kane et al., 2007), but few studies were
found that explore this effect on patient satisfaction in the emergency department.
Chan and Chau (2005) examined the relationship between triage nurse characteristics
and patient satisfaction in emergency departments. Although no statistically significant
relationship was found between patient satisfaction and the educational level of triage
nurses, patients reported a slightly higher level of satisfaction when triaged by a nurse
who had completed an additional nursing course.
2.8.4 Skewness of Ratings
Many researchers have commented about the positive skewness and lack of
variability of most patient satisfaction ratings (Munro et al., 1994; O'Connell et al., 1999;
Laschinger et al., 2011). In fact, these data characteristics create problems in
examining statistical comparisons and relationships. O’Connell et al. (1999) questioned
the sensitivity of the instruments in measuring the concept of patient satisfaction, as it
may throw doubt on the validity of the results. Furthermore, O’Connell et al. (1999)
commented that the limited variance and positively skewed distributions could be an
indication of a lack of confidence among patients in their ability to judge nursing care
activities, while patients who believe they are able to judge care may be reluctant to do
so when hospitalized or needing emergency care. In these situations, patients are more
likely to avoid criticizing or poorly rating the healthcare providers on whom they depend
for survival (Williams, 1994). Patients also may not express dissatisfaction with nursing

46
care because this may be their first exposure to care, or they may be afraid of reprisal in
the event they need to use the service in the future (Fitzpatrick, 1991).
2.8.5 Patient Satisfaction Response
Timing of the patient satisfaction survey have been found to affect both ratings
and response rates (Lin, 1996). When patients are surveyed upon discharge, the return
rates are higher than when surveyed several weeks following their discharge. It is
suggested that less-satisfied patients are less likely to return the survey (Ley et al.,
1976), but some researchers have argued that in fact it may be more-satisfied patients
who are less likely to return the survey (Ware et al., 1983). More research is required to
understand this issue.
The format of the survey response can affect the patient satisfaction data.
Researchers have found that the three- or five-point scales are preferred to an
agree/disagree scale since the former will increase the variance of the score
(Laschinger et al., 2011). In addition, when, where, and how patients are asked for their
opinions have been found to influence both response rate and bias of responses (Bond
& Thomas, 1992). A literature review of methodological issues in patient satisfaction
concluded that interviews with patients were preferable to self-completion
questionnaires (French, 1981), but this method can be more expensive.
2.8.6 Waiting Time
People generally do not like to wait to see a clinician, and it is worse when they
are anxious and uncomfortable (McMillan et al., 1986). The time spent by a patient
waiting for health services can be psychologically painful because the patient has to

47
give up more productive and rewarding activities. Some researchers have reported that
customer satisfaction is inversely proportional to waiting time (Davis & Vollmann, 1990).
Davis and Vollmann (1990) conducted a study in restaurants where they observed that
waiting time was correlated to self-report of satisfaction. The researchers found that the
longer a customer waited, the less satisfied he or she became with the service.
Furthermore, the researchers also noted that other variables may moderate the
relationship, such as the customer's prior experience, their expected waiting time, the
situational context, the time of day, the day of the week, and the importance of time to
the customer.
Some researchers argue that the perceptions regarding waiting times predict
patient satisfaction but that actual waiting time does not (Thompson et al., 1996).
Interestingly, patients in the ED who actually waited longer than expected were found to
have significantly lower satisfaction scores than patients whose actual waiting times
were the same or less than expected (Mowen et al., 1993). In other studies, long
waiting times were not a significant predictor of patient satisfaction (Kurata et al., 1992;
Monzon et al., 2005). Dansky and Miles (1997) examined the waiting times while in the
waiting room in an ED, the waiting time in the treatment room, the waiting time to see
the clinician, and the total time in an ED. Only the total time waiting to see the clinician
was significant in the model of overall satisfaction with the urgent care department. This
finding is similar to the finding of Sandovski et al. (2001) who reported a significant
negative correlation between patient satisfaction and waiting time to examination by the
ED physician.
Dansky and Miles (1997) concluded that waiting time to see the clinician
significantly predicted satisfaction with clinicians and therefore overall satisfaction in the

48
urgent care department, but it did not predict satisfaction with staff. Emergency patients
with trauma or life-threatening injuries are more satisfied than urgent and non-urgent
patients. Since it is more likely that non-urgent patients will not be treated more quickly
than trauma patients, hospitals have improved the waiting experience by ensuring the
waiting area is close to refreshments, providing magazines and privacy, and advising
them of the estimated waiting times (McMillan et al., 1986).
2.8.7 Other Factors Affecting Patient Satisfaction
To isolate the relationship between nurse staffing and patient satisfaction,
characteristics of the organization and environment should be included in the model as
control variables. The selection of such control variables is based on evidence in the
literature. These control variables represent alternative explanations of the nurse
staffing and patient satisfaction relationship and are of two types—internal
organizational characteristics and environmental characteristics. In a study to assess
the effects of four nursing strategies on the efficiency of patient care, the researchers
used a number of control variables (Bloom et al., 1997). The four nursing strategies
were: (1) the use of temporary nursing agencies; (2) the use of part-time nurses; (3)
increased skill mix of the nursing staff (proportion of registered nurses); and (4)
increased experience mix of the nursing staff. Characteristics of the organization and
environment were control variables in the analyses. The six organizational control
variables were: organizational size, ownership/control (e.g. church, for profit), teaching
status, operating capacity (occupancy rate), and input complexity/uncertainty (length of
stay). The seven environmental controls were: geographic region, urban/rural status,

49
regulatory intensity by state, local economic climate, hospital wage rates, hospital
competition within a service area, and supply of nursing labor within the community.
2.9 Nurse Staffing Theoretical Frameworks
In the late 1990s, research interests moved to examining nurse staffing in
relation to patient outcomes (McGillis Hall, 2005). This shift emerged because there
was a lack of evidence regarding the relationship between the quality of care and nurse
staffing levels and staff mix as reported by the Institute of Medicine (IOM) Committee on
the Adequacy of Nurse Staffing in Hospitals and Nursing Homes. The IOM Committee
report discussed the lack of empirical evidence regarding the relationship between the
quality of patient care, staffing levels, and staff mix. As more studies began to emerge,
researchers developed theoretical frameworks to examine nurse staffing and outcomes
that include patient satisfaction.
Nurse staffing frameworks fall within outcomes research. Research in this area
has been described using frameworks augmented from Donabedian’s conceptual model
for quality of care (Donabedian, 1966). For four decades, Donabedian's (1966)
concepts have steered outcome research to evaluate and compare health care quality.
Research on evaluating quality of care began with an emphasis on structures (having
the right things), before shifting to processes (doing things right) and then to outcomes
(having the right things happen) (Mitchell et al., 1998). Over the years, more variables
have been added to Donabedian’s (1966) conceptual model to examine nurse staffing
and quality of care. Three established models used in the literature that adapted
Donabedian’s conceptual model are: Outcomes Model for Healthcare Research, Quality

50
of Care—Dynamic Research Model, and the Nursing Role Effectiveness Model
(McGillis Hall, 2005). Appendix B, C and D show these models.
The Donabedian’s (1966) framework implies a hierarchical analysis model.
Patients are embedded in hospital units, which have both structural characteristics and
processes. Furthermore, these units are within hospitals that have both structural
characteristics and processes. Although studies using Donabedian’s (1966) framework
should use hierarchical analysis, only a few studies were published using multi-level
analyses. Access to datasets that support hierarchical analysis is a major limiting
factor.
As discussed in previous sections of this review, nursing workforce
characteristics have been studied, but few studies have included other characteristics,
such as job satisfaction or turnover. Further research is recommended on work-related
structure measures, which include organizational factors (such as measures of hospital
commitment to quality and measures of hospital leadership).
Based on these frameworks, nursing outcomes research uses data from three
types of data sources. The first are large national data sets, such as hospital discharge
abstracts, matched with nurse staffing data at a state or province level but not a unit
level. Thus, nursing workforce measures cannot distinguish between nurses in direct
patient care or those in administrative or outpatient services. Although a large number
of patient outcomes are available, nursing workforce variables are limited. The second
source, data from individual states/provinces, hospital surveys, or administrative data—
the California Nursing Outcomes Coalition Database, for example—has unit-level data
on both nursing workforce characteristics and patient outcomes. The third source is

51
data collected by researchers from convenience samples of hospitals to which they
have access, but findings that are generalized from these convenience sample studies
are questionable. Unfortunately, most nursing outcomes research uses cross-sectional
data sets which do not allow trends or estimation of lagged effects. Understanding the
trends or the lagged effects is crucial to understanding the relationship between nursing
variables and patient outcomes.
Using nursing theoretical frameworks can advance the knowledge of the
relationship between nurse staffing attributes and patient outcomes by applying data
sets that support hierarchical analyses; additional attributes of the nursing workforce;
unit-level data; and large, representative, longitudinal data sets.
2.10 Summary
Among the literature reviewed, there is consensus that patient satisfaction with
nursing care is strongly associated with (and is an important predictor of) a patient’s
overall satisfaction with the hospital care (Johansson et al., 2002; Bolton et al., 2003;
Larrabee et al., 2004; Al-Mailam, 2005; Chan & Chau, 2005; McGillis Hall, 2005; Kane
et al., 2007). The quality of interpersonal relationships between nurses and patients
has been shown to be a crucial aspect of nursing behaviour that influences patient
satisfaction (Laschinger et al., 2011). Patients’ perceptions of nurses’ interpersonal and
communication skills, friendliness, and ability to attend to the specific needs of the
patient also have been found to be associated with higher satisfaction (Cleary et al.,
1992; Larrabee et al., 2004). There is, however, a lack of generalizable studies

52
performed in the ED—where the average length of stay is less than four hours—that
examine the relationship between patient satisfaction with nursing care and the nurse
staffing models implemented.

53
Chapter 3 Methods And Procedures
3 Overview
The study explores the relationship between nurse staffing and patient
satisfaction in emergency departments using a modified Kane et al. (2007) conceptual
frame. This chapter identifies the design, setting, data collection, and analysis plan of
the study.
3.1 Study Design
This study uses a retrospective, descriptive, correlational design to examine the
relationship between ED nurse staffing and patient satisfaction. The ED study is
considered to be a natural experiment in which nurse staffing varies with a resultant
variation in patient satisfaction. The design to be used supports the aims of the study,
the research questions and hypotheses, but the design does not permit attributing direct
causal effect of nurse staffing on patient satisfaction. To do so, the requirements of
causal relationships must be achieved.
For causal relationships to be meaningful, there should be temporal precedence
of the cause, covariation between the cause and effect, and other alternative
explanations for effects should be eliminated (Cook & Campbell, 1979). Unfortunately,
these conditions cannot be fully met in this study. First, decisions regarding emergency
department staffing are normally done before a patient’s experience is known.

54
Therefore, there is no precedence of cause. Second, covariation between nurse
staffing in the emergency department and patient satisfaction is being assessed in this
study. Studies in other areas of the hospital have shown the extent to which variables
covaried may not be sufficient to meet the conditions of causal relationships (Blegen et
al., 1998; Schmidt, 2003). Lastly, alternative explanations for the variation in patient
satisfaction identified in the literature can be controlled in the multivariate analysis.
Therefore, after assessing the conditions required to establish causal relationships, the
extent to which the cause and effect varied is insufficient to establish direct causal effect
of nurse staffing on patient satisfaction. For this reason, a predictive model was not
pursued in this study; instead, a descriptive correlational design was used to address
the research questions and hypotheses presented.
The conceptual model, variables and data sources for the study are shown in
Figure 3.1 and Table 3.1. Many nurse staffing variables were computed, but only six
nurse staffing and characteristics variables were used in the multivariate analyses that
passed multicollinearity and correlation tests as discussed in Chapter 4.
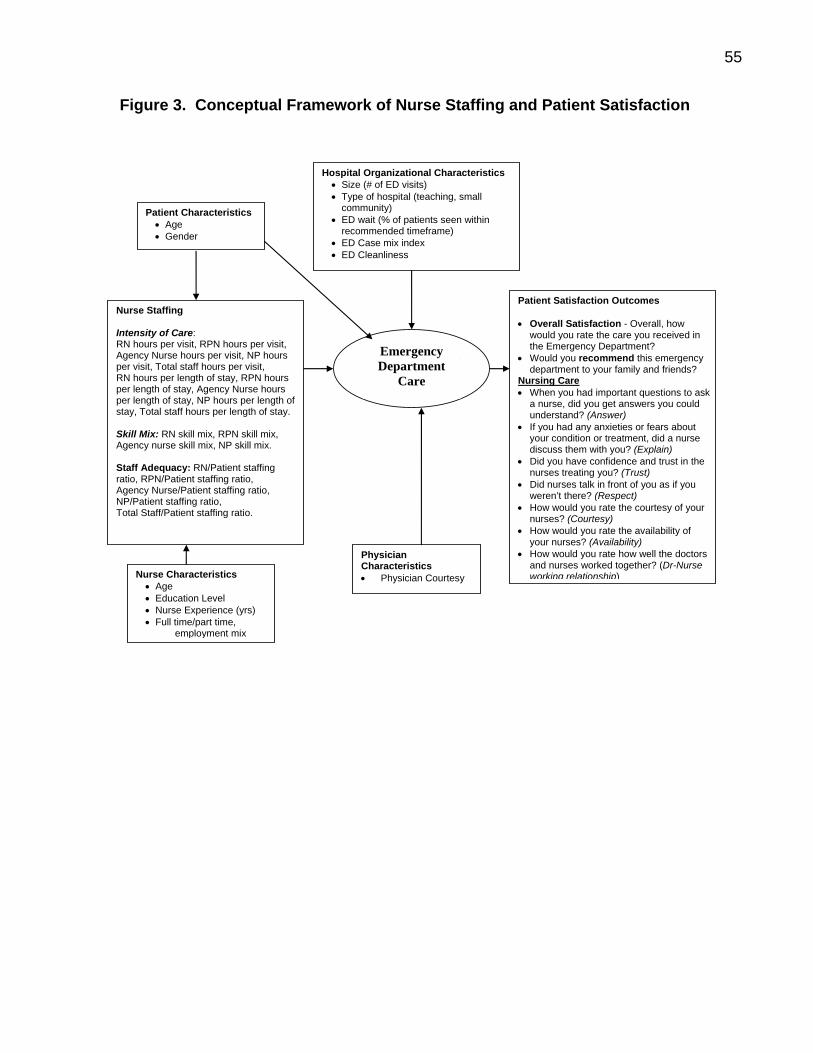
55
Figure 3. Conceptual Framework of Nurse Staffing and Patient Satisfaction
Patient Satisfaction Outcomes • Overall Satisfaction - Overall, how
would you rate the care you received in the Emergency Department?
• Would you recommend this emergency department to your family and friends?
Nursing Care • When you had important questions to ask
a nurse, did you get answers you could understand? (Answer)
• If you had any anxieties or fears about your condition or treatment, did a nurse discuss them with you? (Explain)
• Did you have confidence and trust in the nurses treating you? (Trust)
• Did nurses talk in front of you as if you weren’t there? (Respect)
• How would you rate the courtesy of your nurses? (Courtesy)
• How would you rate the availability of your nurses? (Availability)
• How would you rate how well the doctors and nurses worked together? (Dr-Nurse working relationship)
Nurse Staffing Intensity of Care: RN hours per visit, RPN hours per visit, Agency Nurse hours per visit, NP hours per visit, Total staff hours per visit, RN hours per length of stay, RPN hours per length of stay, Agency Nurse hours per length of stay, NP hours per length of stay, Total staff hours per length of stay. Skill Mix: RN skill mix, RPN skill mix, Agency nurse skill mix, NP skill mix. Staff Adequacy: RN/Patient staffing ratio, RPN/Patient staffing ratio, Agency Nurse/Patient staffing ratio, NP/Patient staffing ratio, Total Staff/Patient staffing ratio.
Nurse Characteristics • Age • Education Level • Nurse Experience (yrs) • Full time/part time,
employment mix
Patient Characteristics • Age • Gender
Emergency Department
Care
Physician Characteristics • Physician Courtesy
Hospital Organizational Characteristics• Size (# of ED visits) • Type of hospital (teaching, small
community) • ED wait (% of patients seen within
recommended timeframe) • ED Case mix index • ED Cleanliness

56
Table 3-1. Definition of Terms
Hospital Organizational Characteristics
Variable Indicator Name Data Source Size (# of ED visits) Number of ED visits SIZE OHRS
Type of Hospital Teaching, Community, Small PEERGRP OCDM
Type of ED 24-hr ED, Urgent Care Centre, Trauma Centre EDTYPE OHRS
Severity Adjustment ED Case Mix Index CMI OCDM
ED Wait Times
Proportion seen with the recommended timeframe (number of CTAS I & II patients seen within 8hrs + Number of CTAS III patients seen within 6hrs + Number of CTAS IV & V patients seen within 4hrs / total number of patient visits)
EDWAIT NACRS
ED Cleanliness Was the entire Emergency Department as clean as it should have been? Three point Likert-type scale: Yes— Definitely, Yes—Somewhat, No
EDCLEAN Patient Sat.
Patient Characteristics Age Age (in years) PATAGEGRP Patient Sat.
Gender Gender PATGENDER Patient Sat.
Nurse Characteristics Age (in years) NURSEAGE CIHI Nursing
Database
Education Level (Diploma, BSN & higher) NURSEED CIHI Nursing Database
Nursing Experience (years in nursing = years after graduation from initial nursing program) NURSEEXP CIHI Nursing
Database Employment status: Percent full-time (full-time RN & RN earned hours) divided by total nursing earned hours PERFTHRS OHRS
Nurse Staff Characteristics
Gender (Percent Female Nurses) PERFEMNURSE CIHI Nursing Database
Nurse Staffing RN worked hours per patient visit RNWKHRS OHRS, NACRS
RPN worked hours per patient visit RPNWKHRS OHRS, NACRS
Agency Nurse worked hours per patient visit AGNWKHRS OHRS, NACRS
Nurse Practitioner worked hours per patient visit NPWKHRS OHRS, NACRS
Total staff worked hours per patient visit TOTSTAFFWKHRS OHRS, NACRS RN worked hours per length of stay (Annual RN worked hours divided by Annual patient length of stay) RNPLOS OHRS, NACRS
RPN worked hours per length of stay (Annual RPN worked hours divided by Annual patient length of stay) RPNPLOS OHRS, NACRS
Agency Nurse worked hours per length of stay (Annual Agency Nurse worked hours divided by Annual patient length of stay)
AGNPLOS OHRS, NACRS
Nurse Practitioner worked hours per length of stay (Annual NP worked hours divided by Annual patient length of stay) NPPLOS OHRS, NACRS
Nursing Intensity of Care
Total worked hours per length of stay (Annual worked hours divided by Annual patient length of stay) TOTSTAFFPLOS OHRS, NACRS
RN proportion (RN worked hours divided by total staff worked hours) RNPROP OHRS
RPN proportion (RPN worked hours divided by total staff worked hours) RPNPROP OHRS
Agency proportion (Agency Nurse worked hours divided by total staff worked hours) AGNPROP OHRS Skill Mix
Nurse Practitioner Proportion (Nurse Practitioner worked hours divided by total staff worked hours) NPPROP
OHRS

57
RN Staff to Patient Ratio (number of RN staff / number of patients) RNRATIO OHRS, NACRS
RPN Staff to Patient Ratio (number of RPN staff / number of patients) RPNRATIO OHRS, NACRS
Agency Nurse Staff to Patient Ratio (number of RPN staff / number of patients) AGNRATIO OHRS, NACRS
NP Staff to Patient Ratio (number of NP staff / number of patients) NPRATIO OHRS, NACRS
Staff Adequacy
Total Staff to Patient Ratio (total number of patient care staff / number of patients) TOTSTAFFRATIO OHRS, NACRS
Physician Characteristics ED Doctor Courtesy How would you rate the courtesy of your doctors? Five
point Likert-type scale: Poor, Fair, Good, Very Good and Excellent
DRCOURTESY Patient Sat.
Patient Satisfaction with Nursing Care
Variable Indicator Name When you had important questions to ask a nurse, did you get answers you could understand?
Three point Likert-type scale: Yes—Always, Yes— Sometimes, No, Did not have any questions
ANSWER Patient Sat.
If you had any anxieties or fears about your condition or treatment, did a nurse discuss them with you?
Three point Likert-type scale: Yes—Completely, Yes— Sometimes, No, Did not have any anxieties or fears
EXPLAIN Patient Sat.
Did you have confidence and trust in the nurses treating you?
Three point Likert-type scale: Yes—Always, Yes—Sometimes, No
TRUST Patient Sat.
Did nurses talk in front of you as if you weren’t there?
Three point Likert-type scale: Yes—Often, Yes—Sometimes, No
RESPECT Patient Sat.
How would rate the courtesy of your nurses?
Five point Likert-type scale: Poor, Fair, Good, Very Good and Excellent
COURTESY Patient Sat.
How would you rate the availability of your nurses?
Five point Likert-type scale: Poor, Fair, Good, Very Good and Excellent
AVAILABILITY Patient Sat.
How would you rate how well the doctors and nurses worked together?
Five point Likert-type scale: Poor, Fair, Good, Very Good and Excellent
DRNURSEWK Patient Sat.
Overall Patient Satisfaction
Variable Indicator Name Overall, how would you rate the care you received in the ED?
Five point Likert-type scale: Poor, Fair, Good, Very Good and Excellent
EDSAT Patient Sat.
Would you recommend this ED to family and friends?
Five point Likert-type scale: Poor, Fair, Good, Very Good and Excellent
EDREC Patient Sat.

58
3.2 Sample
This study was conducted on EDs in Ontario’s acute care hospitals. The study
period was selected on the basis of the availability and quality of the data. Routinely
collected administrative and patient satisfaction data for the five-year period of 2005/06
to 2009/10 were analyzed. The patient satisfaction sample consists of the 182,022
patients who were discharged from Ontario’s emergency departments during the five-
year study period and completed a patient satisfaction survey.
Table 3.2 shows the type and number of hospitals with an emergency
department included in the study. Some hospital corporations have multiple sites with
emergency departments, and the table highlights the number of hospital corporations
with an ED. As a result, the totals presented do not indicate the actual number of EDs
because of the multisite issue. Furthermore, the total number of corporations varied
across the five-year period of the study mainly due to hospital restructuring, mergers,
and some hospitals not participating in the survey. In addition, some hospitals did not
survey patients for one or two years during the study period. 107 hospital corporations
reported patient satisfaction data for at least 1 year.
Table 3-2. Emergency Department by Hospital Type
57 24 15 9658 27 15 10061 26 16 10361 22 16 9961 24 16 101298 123 78 499
Year2005/2006YE2006/2007YE2007/2008YE2008/2009YE2009/2010YETotal
Large Community Small Teaching TotalPeer Group

59
3.3 Power Analysis
The number of independent variables or predictors, effect size, power, and level of
significance (alpha) are important when determining the sample size and power of the
study (Cohen & Cohen, 2002). A large effect size was determined to be appropriate
since no known studies have examined the relationship between nurse staffing and
patient satisfaction in emergency departments. According to Cohen and Cohen (2002),
for multiple and multiple correlation tests, the f2 = R2 / (1-R2) = 0.35 for a large effect
size that explains 26% of the variance. There were 6 nurse staffing variables used in
the regression models as discussed in Chapter 4. Since each model uses 15
independent and control variables, the sample size required for a large effect size,
power of 0.80, and a 0.05 level of significance was determined using tables reported by
Cohen (2002) and the following equation for sample size.
n = L / f2 + k + 1 (where n = sample size, k = number of independent variables,
L = value in tables)
The L value from Cohen and Cohen (2002) tables is 18.81 for power of 0.8, 0.05 level of
significance and 15 variables. Thus, a sample size of 70 EDs was determined to
provide sufficient power to conduct this study.
3.4 Data Collection
The methods and procedures to collect and manage data used for the analyses
are discussed in this section. The discussion begins with the data collected at the

60
patient level for patient satisfaction scores, followed by the data for nurse staffing and
control variables collected for each hospital ED.
3.4.1 Patient Satisfaction
The patient satisfaction data in this study was obtained from the patient
satisfaction survey data collected in most hospitals in Ontario using the NRC-Picker
Canada Emergency Department Care Patient Satisfaction survey. The survey was
developed by the Picker Institute and consists of 59 questions related to satisfaction in
four categories: a) admission and discharge processes; b) doctors and medical care; c)
nurses and nursing care; and d) the emergency department environment.
In 2003, the NRC-Picker survey instrument was introduced in Ontario’s EDs,
replacing the Standardized Hospital Patient Satisfaction Survey (SHoPSS). Every year,
over 100,000 individuals from approximately 100 participating hospitals in Ontario are
sampled using the survey from NRC-Picker. Patients discharged between April 1, 2005
and March 31, 2010 were included in the sample. Approximately 30% of the sampled
individuals returned their questionnaires every year.
The sampling plan was developed collaboratively by each participating hospital
corporation and NRC-Picker Canada (see Appendix E). Deciding factors influencing the
agreed-upon sampling plan included budget, achieving reasonable response rates, and
which sites within the corporation were of primary interest. Hospitals were then charged
with the responsibility of sending patient data files to NRC-Picker every month.
According to each hospital’s sampling plan, a random sample was drawn from the
patient data files, and surveys were mailed to the selected patients. Questionnaires
were not sent to deceased patients, psychiatric patients, infants less than 10 days old,
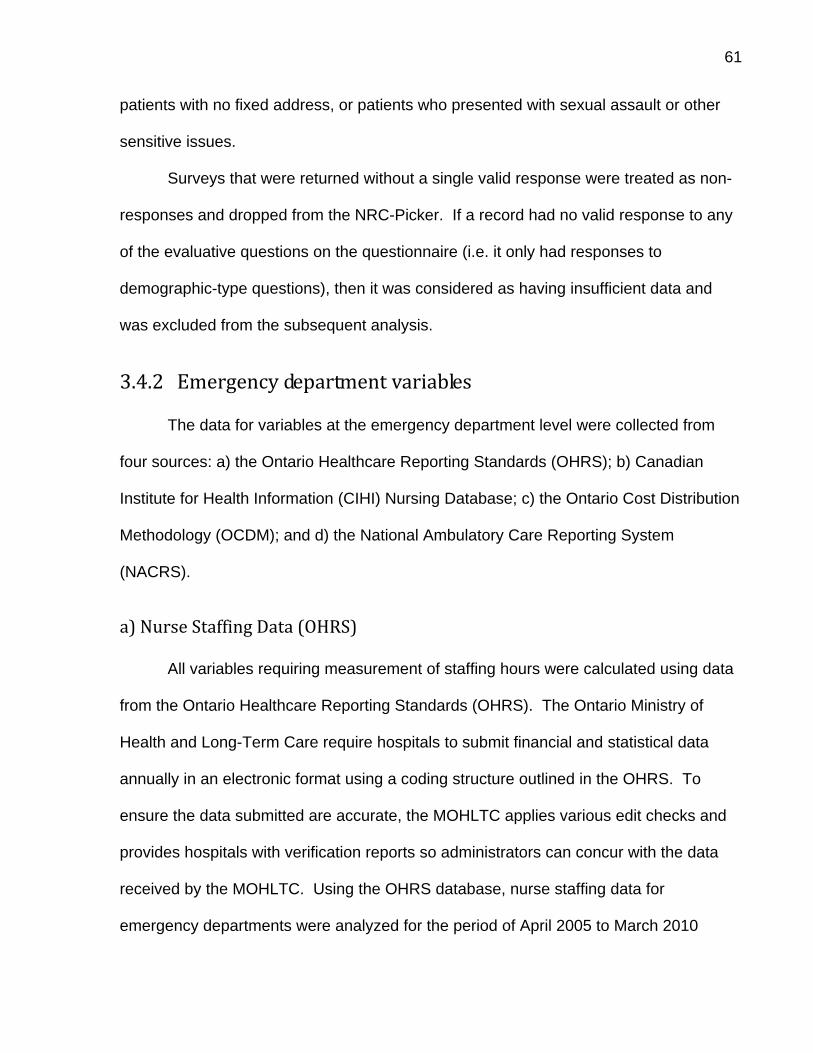
61
patients with no fixed address, or patients who presented with sexual assault or other
sensitive issues.
Surveys that were returned without a single valid response were treated as non-
responses and dropped from the NRC-Picker. If a record had no valid response to any
of the evaluative questions on the questionnaire (i.e. it only had responses to
demographic-type questions), then it was considered as having insufficient data and
was excluded from the subsequent analysis.
3.4.2 Emergency department variables
The data for variables at the emergency department level were collected from
four sources: a) the Ontario Healthcare Reporting Standards (OHRS); b) Canadian
Institute for Health Information (CIHI) Nursing Database; c) the Ontario Cost Distribution
Methodology (OCDM); and d) the National Ambulatory Care Reporting System
(NACRS).
a) Nurse Staffing Data (OHRS)
All variables requiring measurement of staffing hours were calculated using data
from the Ontario Healthcare Reporting Standards (OHRS). The Ontario Ministry of
Health and Long-Term Care require hospitals to submit financial and statistical data
annually in an electronic format using a coding structure outlined in the OHRS. To
ensure the data submitted are accurate, the MOHLTC applies various edit checks and
provides hospitals with verification reports so administrators can concur with the data
received by the MOHLTC. Using the OHRS database, nurse staffing data for
emergency departments were analyzed for the period of April 2005 to March 2010

62
(fiscal 2005/06 to 2009/10) for the hospitals that participated in the patient satisfaction
survey. The major limitation of the OHRS is that the data can only be reported at the
corporation level, so variables for hospital corporations with multiple emergency
departments were computed at an aggregated level since individual site-specific values
were not submitted to the MOHLTC.
OHRS statistical data for the emergency department include hours worked by
employment category and employment status. Staffing hours are recorded for the
following categories: worked, purchased service hours, and benefit hours. These hours
are recorded for the three broad categories of staff, which include management and
operational support, unit-producing staff, and medical staff. The medical staffing hours
were reported for only salaried ED physicians, thus the hours for fee-for-service paid
physicians are not reported. In 2005, the OHRS included additional reporting
requirements—such as employment categories for RN, RPNs, NP, and agency
nurses—for staffing information. Appendix F shows the OHRS reporting framework for
the staff information since 2005. The changes in the standards allowed for the
calculation of the nurse staffing variables in this study. The technical specifications of
the study variables drawn from the OHRS database are shown in Appendix G.
In this study, worked hours for staff were calculated by combining the reported
worked and purchased service hours. Worked hours do not include hours for vacation,
sick time, education, orientation, and holidays. The total worked hours included only the
unit producing personnel (UPP) for the emergency department. Worked hours for
registered nurses (RNs), registered practical nurse (RPNs), nurse managers, clinical
nurse specialists, nurse educators, and nurse practitioners who function as nurses were
included in the calculation of nurse worked hours.

63
The nursing care hours per visit by nursing category (RN, RPN, NP, and agency
nurse) were calculated by dividing the nursing worked hours for each nurse category by
the number of emergency department visits in a hospital for the same time period. The
worked hours were obtained from the OHRS data, while the patient activity was
obtained from the National Ambulatory Care Reporting System (NACRS) database.
The nursing hours per length of stay variable was calculated using nursing
worked hours by the different staff category for the numerator divided by the total length
of stay of patients seen for the ED in the year under consideration. The length of stay
for each patient was calculated using the times reported in NACRS as the difference of
the visit complete time minus the registration time or triage time depending (whichever
is reported first). Each patient’s length of stay was summed to compute the total length
of stay for the ED in a hospital for a fiscal year.
RN skill mix was calculated by dividing the total RN worked hours by the total
nursing care worked hours for the same time period. Similarly, skill mix for each staff
category (RPN, NP, and agency nurse) was calculated by dividing the total RPN, NP, or
agency nurse worked hours by the total nursing care worked hours for the same time
period. Similarly, the percentage of full-time employment was calculated by dividing the
full-time worked hours for nursing care staff by the total nursing care worked hours for
the ED in a hospital for a fiscal year.
The nursing staff-to-patient ratio was calculated for each nurse staff category.
The number of nursing staff was calculated as the total earned hours divided by 1950.
The number of patients was obtained from the NACRS database.

64
b) Nurse Staffing Data (CIHI‐Regulated Nursing Professions Database)
In this study, the education, experience level, and demographic information of the
nursing staff were obtained from the Canadian Regulated Nursing Professions
Database. This database, maintained by the Canadian Institute of Health Information
(CIHI), includes data for the three regulated nursing professions in Canada: Licensed
Practical Nurses, Registered Nurses, and Registered Psychiatric Nurses. In this study,
the licensed practical nurses are considered registered practical nurses. The database
contains demographic, education, and employment information on nursing staff.
The data are collected under the terms of agreements with the Ontario College of
Registered Nurses and the Ontario College of Registered Practical Nurses. These
provincial regulatory authorities are responsible for data collection, which occurs during
the annual registration process. The data are manually entered and a file is submitted
to CIHI in a standardized format. Data are received and organized by CIHI, and
calculated variables are created by combining data elements. For example, birth year is
subtracted from the data year in order to create the age variable. Average age, number
of years since graduation, percent of nursing staff that are females, percent of nursing
staff with a Bachelor in Nursing or higher were calculated using the Regulated Nursing
Professions database. Nursing staff characteristics data included both RNs and RPNs.
c) Severity Adjustment from the OCDM
Many nursing studies have identified the need to take the severity of the illness of
patients into consideration (Blegen et al., 1998; Blegen & Vaughn, 1998). Ontario’s
Ministry of Health and Long-Term Care use the emergency department case mix index
(CMI) developed by CIHI in their funding formulas to adjust the cost per patient visit for

65
patient severity. In this study, the emergency department CMIs for each hospital was
used as a severity adjustment measure and the ED CMI variable was treated as a
continuous level variable similar to other studies (Freeman et al., 1995; Rutledge et al.,
1996). CIHI calculates the CMIs for every hospital corporation with an ED, and
MOHLTC reports the CMI in every hospital’s Ontario Cost Distribution Methodology
(OCDM). The CMI was obtained for each ED in the study for each of the five years.
The CMIs used the latest 2010 Comprehensive Ambulatory Care System (CACS)
grouper and CMI weights for all years.
d) NACRS
Percent of ED patients seen within a recommended timeframe was calculated
using CIHI’s NACRS (see Appendix H for details on this database). As discussed
earlier, the length of a patient's stay in the emergency department is defined as the time
from registration or triage (whichever comes first) to the time the physician makes a
decision to either admit or discharge (UHN, 2011). In some overcrowded emergency
departments, patients can have long waits for an inpatient bed. For admitted patients,
the time spent waiting in the emergency department for an inpatient bed was not
included in the length of stay calculation.
Ontario’s Ministry of Health and Long-Term Care has established times for
patients’ length of stay that are part of each hospital’s accountability agreement. Non-
admitted patients triaged as level I and II in the Canadian Triage Acuity Scale (CTAS)
must be cared for within eight hours. Similarly, non-admitted patients triaged as CTAS
level III should have a length of stay less than six hours, while patients triaged as non-
urgent, level IV and V should have a length of stay less than four hours (UHN, 2011).

66
The proportion of patients seen within the recommended timeframes for each
emergency department was obtained by the Ministry of Health and Long-Term Care.
The number of ED visits was used as a measure of the ED size, and the number
of ED visits was measured in both the NACRS and OHRS datasets. CIHI performs data
quality checks in the NACRS dataset (using a combination of data elements to identify
abstracts that could be duplicates) to prevent over-coverage of patients (CIHI, 2011). In
addition, the MOHLTC has mandated all EDs to submit abstracts to CIHI, so there
should be minimum under-reporting. In their annual report on the data quality of
NACRS, CIHI has reported no issues with under-coverage (CIHI, 2011).
In 2007, the Joint Policy and Planning Committee (JPPC) reported concerns
about the integrity and completeness of the OHRS ED visits. The JPPC recommended
that the OHRS ED visits not be used in the 2006/07 funding allocation to hospitals
because of the data integrity issues (JPPC, 2006). The number of ED visits from the
NACRS dataset is being used by the MOHLTC in the hospital funding calculations and
hospitals accountability agreements (MOHLTC, 2011). Due to the data quality issue in
the reporting on the number of ED visits in the OHRS, however, and in order to be
consistent with the methodologies used by the MOHLTC in funding allocations, the
number of ED visits for this study was calculated from the NACRS database.
e) Control Variables
To isolate the relationship between ED satisfaction and staffing patterns,
organizational characteristics are included in the model as control variables. These
control variables represent competing or alternative explanations of the staffing and
patient satisfaction relationship. The organizational control variables included in the

67
multivariate model were hospital type (teaching, large community, or small hospital),
emergency department waits or proportion of patients seen within the recommended
timeframe, size of ED (number of visits), ED case mix index, cleanliness of the ED, and
physician courtesy. Some hospital corporations had trauma centres and urgent care
centres. Another classification variable—EDTYPE—was also investigated. EDs were
grouped into General ED, Urgent Care Center (UCC), and Trauma. Unfortunately, the
data for the nurse staffing, nurse characteristics, and covariate variables were only
available at the hospital corporation level. The UCCs and trauma centres were in
multisite organizations and the nurse staffing data could not be separated from the
general ED. Thus, EDTYPE was dropped as an explanatory variable in the study.
3.5 Data Access
Data for this study was obtained through the graduate student data access
programs at CIHI, Ontario MOHLTC and the Ontario Hospital Association.
3.6 Data Analysis
This section discusses the research question and hypotheses, as well as the
procedures and methods used to describe and analyze the data. The formation and
descriptive analysis of the datasets will be discussed. The study use SAS 9.2 and SPSS
14.0 software for the various analyses.

68
3.6.1 Patient Satisfaction Dataset
The patient satisfaction with nursing care variables include the following questions:
1. When you had important questions to ask a nurse, did you get answers you could understand? (Answer)
2. If you had any anxieties or fears about your condition or treatment, did a nurse discuss them with you? (Explain)
3. Did you have confidence and trust in the nurses treating you? (Trust) 4. Did nurses talk in front of you as if you weren’t there? (Respect) 5. How would you rate the courtesy of your nurses? (Courtesy) 6. How would you rate the availability of your nurses? (Availability) 7. How would you rate how well the doctors and nurses worked together?
(Drnursewk)
A variety of response scales are used in the NRC-Picker patient satisfaction
questionnaire. Some questions employed a Likert-type scale with five response
choices: “Poor,” “Fair,” “Good,” “Very Good,” and “Excellent.” To make interpretation of
the patient satisfaction easier, the variable five-point scale was converted into a 100-
point scale according to the procedure used by a number of studies (Hall & Press, 1996;
Boudreaux et al., 2003; CIHI, 2008). The following scores were assigned: Poor = 0,
Fair = 25, Good = 50, Very Good = 75, Excellent = 100. Other survey questions used a
three point scale with responses: “Yes —Always”, “Yes—Sometimes”, “No”. These
responses were assigned the following scores: “Yes—Always” = 100, “Yes—Sometimes”
= 50, “No” = 0. A few questions had a viable selection; for example, the question “When
you had important questions to ask a nurse, did you get answers you could
understand?” had the response option “Did not have any questions.” This was an
acceptable response to the question, but it was not assigned a score.
The data was first checked for any missing or improbable values. For the seven
patient satisfaction with nursing care variables (ANSWER, EXPLAIN, TRUST,

69
RESPECT, COURTESY, AVAILABILITY and DRNURSEWK), each variable was
checked for missing values. The missing values for a particular nursing care variable
were imputed using a linear regression, with the other nursing variables as predictors
and controlling for age and gender. The patient satisfaction variables were assessed
for normality, outliers, and linearity. Using Pearson’s index of skewness, variables that
were significantly skewed were transformed.
Principal Component Analysis (PCA), which identifies variables to maximize the
internal consistency, was used to ensure that the subset of seven nursing variables in
the NRC-Picker survey represented the set of nursing variables in a way that sufficiently
represented the overall variation in patient satisfaction with nursing care in the
emergency department. The PCA analysis procedure described by Jolliffe (2002) was
used. First, the inter-item correlations are analyzed; according to the PCA procedure,
variables with correlation less than 0.3 and greater than 0.7 are considered for deletion
(Jolliffe, 2002). The second step is the analysis of the factor loadings. In this step,
variables with loading of less than 0.4 were considered for deletion. The third step is
the analysis of eigenvalues and percentage of variance explained by each factor. The
fourth step is the visual inspection of the scree plots. Finally, the fifth step is the
analysis of impact of individual item deletion. Corrected item-total correlations of less
than 0.3 were considered for item deletion. The impact on Cronbach’s alpha on a
deleted item was assessed to see if there was any increase in alpha for any of the
variables.

70
3.6.2 Emergency Department Level Dataset
The emergency department data analysis used data from five datasets: 1) patient
satisfaction; 2) patient characteristics; 3) nurse staffing; 4) nursing staff characteristics;
and 5) emergency department characteristics.
1. Patient Satisfaction dataset
The patient satisfaction data consists of the patient level survey results. The dataset
had a hospital corporation number that was used to link it to the other datasets.
2. Patient Characteristics
The patient characteristics data were extracted from the NRC-Picker patient satisfaction
data for age and gender. These two variables were part of the patient satisfaction
dataset.
3. Staffing dataset
The staffing dataset was created with the specific fields: nursing worked hours per
visit by staff category, nursing worked hours per length of stay by staff category, skill
mix by staff category, and the ratio of nursing staff to patients. Each variable was
reported by fiscal year for each hospital corporation.
4. Nursing staff characteristics
The data for the nursing staff characteristics was obtained from the CIHI Nursing
Database. The data was sorted by postal code and linked to the postal code of each
emergency department. Each ED had its unique postal code which facilitated the data
linkage. The data was aggregated for multi-site hospital corporations. The fields in the
dataset included nurses’ age and gender, educational level, emergency department

71
experience, and full-time/part-time status. The full-time /part-time status was calculated
from the OHRS data.
5. Emergency department characteristics dataset
The data for the emergency department characteristics were obtained from the OCDM,
OHRS and NACRS. The variables included ED case mix, hospital type, and proportion
of patients seen on time. Satisfaction with cleanliness of the ED, and physician
courtesy were obtained from the NRC-Picker survey database.
Finally, a merged dataset was created at the hospital corporation level in SAS
using the hospital corporation OHRS facility number. This dataset was reviewed for any
missing data.
3.6.3 Research Question
This study seeks to determine to what extent specific aspects of nurse staffing
relate to:
1) patient satisfaction with nursing care;
2) overall satisfaction with care received in the ED; and
3) whether the patient would recommend this ED to friends and family.
The study draws on existing administrative and patient satisfaction survey data from
Ontario’s EDs to test the following hypotheses:
Hypothesis 1: There is a positive relationship between RN proportion, nurse-to-patient
ratio, nursing hours per patient visit and each patient satisfaction with nursing care
variable (i.e., Answer, Explain, Trust, Respect, Courtesy, Availability, and Dr-Nurse
working relationship).

72
Hypothesis 2: There is a positive relationship between RN proportion, nurse-to-patient
ratio, RN hours per patient visit and overall satisfaction with care received in the ED.
Hypothesis 3: There is a positive relationship between RN proportion, nurse-to-patient
ratio, RN hours per patient visit and whether the patient would recommend the ED to
friends and family.
3.6.4 Data Analysis
The unit of analysis for the study is the emergency department and the merged
dataset with staffing, patient satisfaction, patient characteristics, and nursing staff
characteristics was used for analysis. A correlation matrix was constructed for all
variables, and values with p-values were considered statistically significant if less than
or equal to .05. The correlation matrix included variables for intensity of care, skill mix,
staff adequacy, and the nine patient satisfaction variables (the seven patient satisfaction
with nursing care variables and the two patient satisfaction outcomes variables).
Descriptive statistics were calculated for each variable. Frequencies were
obtained for the patient characteristics. Analysis of variance (ANOVA) was used to test
if there are any differences, at the 0.05 level, for age between the years to be studied,
and cross-tabs with Chi-Squared statistics for gender were calculated. If differences
were found, these variables were considered for inclusion in the multivariate regression
analysis.
Similarly, nursing staff characteristics of educational level, nursing and
emergency department experience, employment status, and emergency department
characteristics were assessed for differences between the years. Any significant

73
differences were considered for inclusion as confounding variables based on
differences between years.
The patient satisfaction outcome variables were reported in a five-point Likert
scale. Since this data is ordinal, ordered multinomial logistic models were considered
for the study. The reliability of ordered multinomial regression models, however, is
contingent upon the assumptions that there is sufficient data in each category of the
dependent variable. As discussed in chapter 4, the patient satisfaction data was
negatively skewed in this study and not enough data fell into some of the categories of
the dependent variable. In addition, interpreting the cut points can be challenging using
logistic models. The ordinal data in this study was therefore treated as interval-scaled
data, a common practice among social science researchers (Hoelzle, 2011). For this
reason the patient satisfaction variable five-point scale was converted into a 100-point
scale according to the procedure used by a number of studies (Hall & Press, 1996;
Boudreaux et al., 2003; CIHI, 2008).
The data for the multivariate analyses were structured into a linear mixed model
in which repeated measurements of patient satisfaction rating over time were nested in
emergency departments. To take into account that observations in a hospital may tend
to be correlated, multilevel models were used since the correlation of observations in
the same cluster violates the assumptions of traditional linear regression (Cohen &
Cohen, 1983; Tabachnick & Fidell, 1996; Cohen & Cohen, 2002). Multilevel models
incorporate random components of cluster effects in the statistical model. In addition,
multilevel models address the under specification of the traditional linear regression,
which can lead to underestimation of standard errors and an increased likelihood of
reporting statistics as statistically significant. Unequal sample sizes within clusters and

74
missing data also can be analyzed using multilevel models with repeated measures
data (Tabachnick & Fidell, 1996).
In the original plan, nine multivariate linear mixed regression models were
expected to be developed to assess the relationship between nurse staffing and a)
patient satisfaction with nursing care (i.e., Answer, Explain, Trust, Respect, Courtesy,
Availability and Dr-Nurse working relationship), b) overall satisfaction in the emergency
department, and c) recommending this emergency department to friends and family.
After the PCA, however, the patient satisfaction with nursing care (Aggregate Score)
was used as the main nursing care satisfaction variable, which is the average of the six
nursing care variables (Answer, Explain, Trust, Courtesy, Availability, and Dr-Nurse
Working Relationship) since the factor loading were above 0.8. Thus, three hierarchical
regressions were developed in the study to answer the research question. The seven
regressions with the dependent variables being the patient satisfaction with nursing care
variables (i.e. Answer, Explain, Trust, Respect, Courtesy, Availability and Dr-Nurse
working relationship) were also developed to further understand the relationship
between patient satisfaction with nursing care and nurse staffing. The results of these
seven regressions are shown in the Appendix O, but this study focused only on the
three regression models with the dependent variable being patient satisfaction with
nursing care (Aggregate Score), overall satisfaction with care, and recommending the
ED to friends and family. Thus, original hypothesis 1 was not tested.
The three patient satisfaction outcomes or dependent variables can be
expressed using a pair of linked models: one at the patient level (level-1) and another at
the ED-level (level-2). For the model analysis, X = independent variable (Intensity of
Care, Skill Mix and Staffing Adequacy) and Y = dependent variable.

75
Assumptions of multivariate linear mixed regression procedures were tested
using SAS. Variables were assessed first to ensure they did not violate the
assumptions of normality, outliers, heteroscedacity, autocorrelation, and
multicollinearity. Regression procedures assume that variables have normal
distributions, since non-normally distributed variables can distort relationships and
significance tests. Normality was assessed visually by constructing and reviewing
histogram distributions as well as a Kolmogorov-Smirnov test of normality was
performed on the patient satisfaction variables. For the variables calculated at the ED-
level, normality was observed using the Shapiro-Wilk test. If skewness values were
greater than 1 for any nursing and control variables, the variable was considered for
deletion. Kurtosis of the distribution, which is a measure for peakedness, was assessed
to identify distributions with long or short tails. If a distribution had kurtosis values
significantly different than zero, the tails are longer or shorter than a normal distribution.
Extreme values for skewness and kurtosis are values greater than +3 or less than -3.
Outliers were identified by visual inspection of the data using histograms, frequency
distributions, and box-plots for each year, in addition to identifying any data above or
below the mean by 1.5 times the interquartile range (Larson, 2006). Outliers were re-
coded to a value calculated as the mean plus or minus 1.5 times the interquartile range
for that variable. Linearity was assessed using bivariate scatterplots of the dependent
variables against the independent variables.
Multicollinearity, a high correlation between two or more independent variables,
can lead to failure of significance of the regression coefficients and failure of the model
to converge (Cohen & Cohen, 1983; Tabachnick & Fidell, 1996). The Variance Inflation
Factor (VIF) was used to quantify the severity of multicollinearity. Multicollinearity

76
between independent variables was assessed by regressing each independent variable
on each other. If VIF values exceed 4, multicollinearity is high. The VIF of 10 was used
as a cutoff with any VIF value greater than 10 considered to multicollinear. If
multicollinearity between two variables was identified, one of the variables was
removed.
The Lasso, or least absolute shrinkage and selection operator technique, was
used to reduce the number of nurse staffing and control variables. LASSO is a
shrinkage and selection method for linear regression that minimizes the usual sum of
squared errors with a bound on the sum of the absolute values of the coefficients
(Tibshirani, 1996). In a regression, the ordinary least squares estimates are obtained
by minimizing the residual squared error but these estimates often have low bias and
large variance. Prediction accuracy can be improved by shrinking or setting to 0 some
coefficients. At the expense of a little bias, the variance of the predicted values is
reduced and hence the overall prediction accuracy may improve. In addition, the
interpretation is better since with a large number of predictors, having a smaller subset
that exhibits the strongest effects is desirable. Tibshirani (1996) stated that the two
standard techniques for improving the regression estimates are subset selection and
ridge regression, both of which have drawbacks. Subset selection provides
interpretable models but can be extremely variable so small changes in the data can
result in very different models being selected. Ridge regression shrinks coefficients and
hence is more stable however it does not set any coefficients to 0 and hence does not
give an easily interpretable model. Lasso shrinks some coefficients and sets others to 0
and hence tries to retain the good features of both subset selection and ridge
regression. For these reasons, the Lasso technique was used.

77
In the original plan, the hypotheses of the study included three nursing staffing
variables: RN proportion, nurse-to-patient ratio, and nursing hours per patient visit. This
plan to use these three nurse staffing variables in the regressions was altered after the
LASSO, and correlation and multicollinearity checks of the nursing variables were done.
The nursing variables obtained after the LASSO procedure that were not
multicollinearity were used as the independent variables in the three regression models.
For the confirmed set of variables, three hierarchical regression models were
constructed. For each regression model, the following were produced for evaluation:
regression coefficients, standard error of the estimate, analysis of variance table,
predicted values, and residuals (Cohen & Cohen, 2002). When regression models were
constructed, normality within the regression analysis was examined by looking at
scatterplots of the standardized residuals against the predicted values of the
independent variables. If the data (and the residuals) are normally distributed, the
residuals scatterplot will show the majority of residuals at the center of the plot for each
value of the predicted score, with some residuals trailing off symmetrically from the
center. Heteroscedacity was assessed by plotting the standardized and studentized
residuals against the predicted values of the independent variables. The Durbin-
Watson test was used to assess autocorrelation of the residuals. A Durbin-Watson
statistic substantially less than 2 (i.e. 0 to 1) or greater than 2 was used to identify
autocorrelation.
For the three hierarchical regression models, the magnitude and the level of
significance of the estimates were observed. The effect of the nurse staffing on patient
satisfaction was investigated by calculating the predicted satisfaction for an ED. Using
the median values for the regression covariates, the predicted satisfaction scores were

78
calculated using the estimates from the regression models. In this analysis, a typical
ED was simulated using the median values, and the ED patient satisfaction score was
predicted using the actual nurse staffing variables data. The variation of the predicted
patient satisfaction scores for the EDs in the study was calculated to investigate the
effect of the nurse staffing on patient satisfaction in a “typical” ED. In addition, a similar
analysis was performed using the median values for the nursing variables in the study
and the actual covariate data for an ED to predict the patient satisfaction score for that
ED with typical nurse staffing. The variation of the predicted satisfaction for the EDs in
the second analysis was used to investigate the effect of the covariates, such as
EDWAIT, CMI and DRCOURTESY, in an ED with a typical nurse staffing.

79
Chapter 4 Results
4 Overview
This chapter presents a description of the patient satisfaction data and
emergency department level data, which include both nursing staffing and
organizational data, followed by the results of the multivariate analyses.
4.1 Patient Satisfaction
In this study, the patient satisfaction data was the only dataset with patient-level
records. Data related to patient gender and age group are presented in Table 4.1 and
Table 4.2. No missing values were reported for these two variables. Over the five-year
period 2005/2006 to 2009/2010, 55.2% (100,532) of the 182,022 ED patients surveyed
were female. The patients were categorized into six age groups, and 29.2% were
elderly patients aged 65 years and older. Elderly patients were the most predominant
age group of ED patients surveyed.
Table 4-1. Patients Surveyed by Gender
18,988 19,256 19,207 19,232 23,849 100,53254.6% 54.8% 54.9% 56.2% 55.7% 55.2%15,820 15,895 15,771 15,011 18,993 81,49045.4% 45.2% 45.1% 43.8% 44.3% 44.8%34,808 35,151 34,978 34,243 42,842 182,022
100.0% 100.0% 100.0% 100.0% 100.0% 100.0%
Count% within YearCount% within YearCount% within Year
Female
Male
Patient Gender
Total
2005/2006YE 2006/2007YE 2007/2008YE 2008/2009YE 2009/2010YEYear
Total
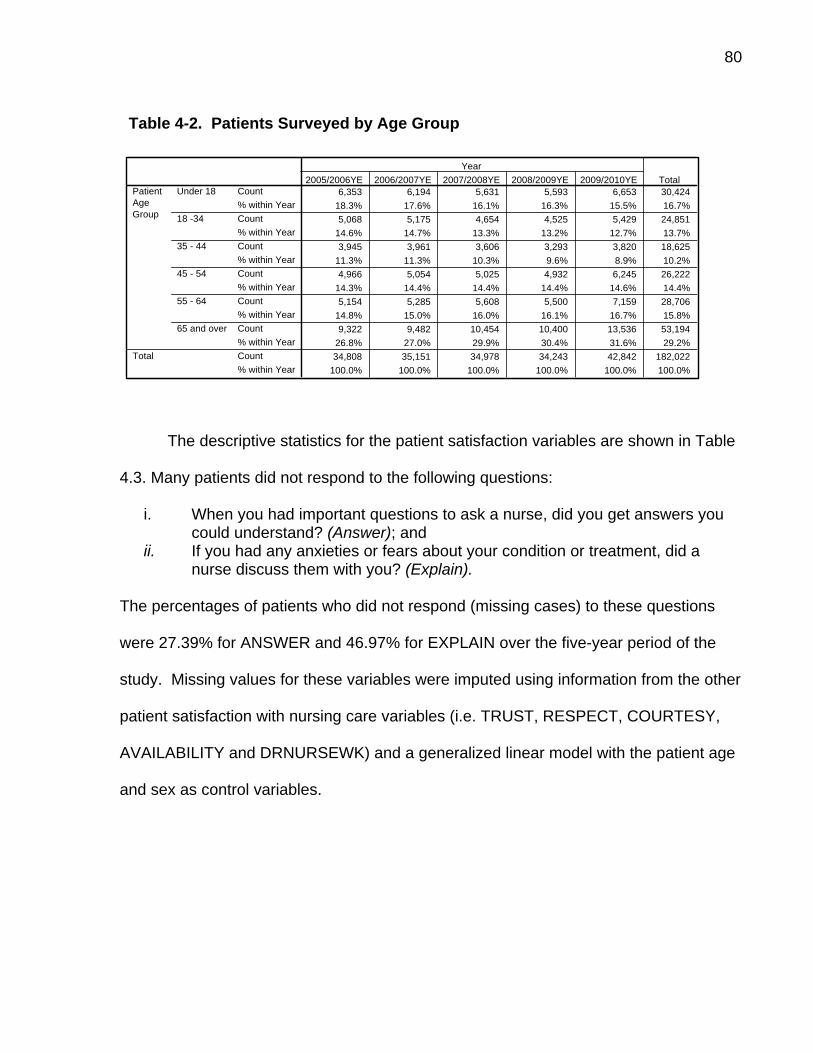
80
Table 4-2. Patients Surveyed by Age Group
6,353 6,194 5,631 5,593 6,653 30,42418.3% 17.6% 16.1% 16.3% 15.5% 16.7%5,068 5,175 4,654 4,525 5,429 24,851
14.6% 14.7% 13.3% 13.2% 12.7% 13.7%3,945 3,961 3,606 3,293 3,820 18,625
11.3% 11.3% 10.3% 9.6% 8.9% 10.2%4,966 5,054 5,025 4,932 6,245 26,222
14.3% 14.4% 14.4% 14.4% 14.6% 14.4%5,154 5,285 5,608 5,500 7,159 28,706
14.8% 15.0% 16.0% 16.1% 16.7% 15.8%9,322 9,482 10,454 10,400 13,536 53,194
26.8% 27.0% 29.9% 30.4% 31.6% 29.2%34,808 35,151 34,978 34,243 42,842 182,022
100.0% 100.0% 100.0% 100.0% 100.0% 100.0%
Count% within YearCount% within YearCount% within YearCount% within YearCount% within YearCount% within YearCount% within Year
Under 18
18 -34
35 - 44
45 - 54
55 - 64
65 and over
PatientAgeGroup
Total
2005/2006YE 2006/2007YE 2007/2008YE 2008/2009YE 2009/2010YEYear
Total
The descriptive statistics for the patient satisfaction variables are shown in Table
4.3. Many patients did not respond to the following questions:
i. When you had important questions to ask a nurse, did you get answers you could understand? (Answer); and
ii. If you had any anxieties or fears about your condition or treatment, did a nurse discuss them with you? (Explain).
The percentages of patients who did not respond (missing cases) to these questions
were 27.39% for ANSWER and 46.97% for EXPLAIN over the five-year period of the
study. Missing values for these variables were imputed using information from the other
patient satisfaction with nursing care variables (i.e. TRUST, RESPECT, COURTESY,
AVAILABILITY and DRNURSEWK) and a generalized linear model with the patient age
and sex as control variables.

81
Table 4-3. Patient Satisfaction Variables over the study period Year ANSWER EXPLAIN TRUST RESPECT COURTESY AVAILABILITY DRNURSEWK EDSAT EDREC2005/2006YE N 33,303 33,074 33,515 33,619 33,669 33,658 33,389 33,987 33,926
% Response 95.68% 95.02% 96.29% 96.58% 96.73% 96.70% 95.92% 97.64% 97.47%Mean 80.64 64.64 60.89 90.97 71.71 61.52 69.40 67.07 73.14Std. Deviation 27.43 32.82 39.76 24.19 25.52 28.57 25.91 28.43 34.16
2006/2007YE N 33,599 33,343 33,861 33,927 34,059 33,963 33,729 34,254 34,191% Response 95.58% 94.86% 96.33% 96.52% 96.89% 96.62% 95.95% 97.45% 97.27%Mean 79.89 64.20 83.06 90.14 71.18 61.17 69.31 66.88 72.52Std. Deviation 28.01 32.90 28.08 25.24 25.70 28.87 25.96 28.60 34.36
2007/2008YE N 33,307 32,957 33,542 33,673 33,757 33,709 33,465 34,043 33,968% Response 95.22% 94.22% 95.89% 96.27% 96.51% 96.37% 95.67% 97.33% 97.11%Mean 80.16 64.17 83.04 90.72 71.51 61.48 69.90 67.27 73.19Std. Deviation 27.87 32.82 28.27 24.52 25.77 28.71 26.04 28.57 34.16
2008/2009YE N 32,642 32,345 32,844 32,990 33,082 32,987 32,798 33,403 33,270% Response 95.32% 94.46% 95.91% 96.34% 96.61% 96.33% 95.78% 97.55% 97.16%Mean 79.86 63.68 82.64 90.62 71.04 60.88 69.76 66.61 72.60Std. Deviation 28.10 33.21 28.71 24.58 25.81 28.90 26.08 28.83 34.62
2009/2010YE N 40,823 40,416 41,067 41,183 41,276 41,261 41,019 41,748 41,620% Response 95.29% 94.34% 95.86% 96.13% 96.34% 96.31% 95.74% 97.45% 97.15%Mean 80.18 64.49 82.88 90.63 71.63 61.62 70.18 67.48 73.39Std. Deviation 28.00 32.99 28.54 24.65 25.69 28.75 26.11 28.49 34.20
Total N 173,674 172,135 174,829 175,392 175,843 175,578 174,400 177,435 176,975% Response 95.41% 94.57% 96.05% 96.36% 96.61% 96.46% 95.81% 97.48% 97.23%Mean 80.15 64.25 83.02 90.62 71.43 61.35 69.73 67.08 72.99Std. Deviation 27.89 32.95 28.33 24.64 25.70 28.76 26.03 28.58 34.30
The scores for each patient satisfaction variable ranged from 0 to 100. Over the
five year period, the mean score for RESPECT was highest at 90.62, followed by
TRUST (83.02), ANSWER (80.15), EDREC (72.99), COURTESY (71.43),
DRNURSEWK (69.73), EDSAT (67.08), EXPLAIN (64.25), and AVAILABILITY (61.35).
The distribution of scores for each variable was negatively skewed. The skewness
values of the distributions range from -0.35 to -2.7. A Kolmogorov-Smirnov test of
normality was performed on the patient satisfaction variables, and all variables were
normally distributed at the hospital level of analysis. More details are shown in
Appendix I.
Table 4-4. Patient Satisfaction by Gender
95,468 94,754 96,209 96,664 96,854 96,680 95,815 97,799 97,58679.17 63.15 81.56 90.59 70.17 59.98 68.73 65.87 71.72
28.438 33.748 29.243 24.473 26.254 29.094 26.267 28.889 34.73778,206 77,381 78,620 78,728 78,989 78,898 78,585 79,636 79,38981.34 65.59 84.80 90.65 72.96 63.03 70.94 68.57 74.54
27.159 31.898 27.063 24.845 24.913 28.254 25.675 28.124 33.686173,674 172,135 174,829 175,392 175,843 175,578 174,400 177,435 176,975
80.15 64.25 83.02 90.62 71.43 61.35 69.73 67.08 72.9927.890 32.951 28.329 24.641 25.697 28.759 26.025 28.579 34.298
NMeanStd. DeviationNMeanStd. DeviationNMeanStd. Deviation
GENDERFemale
Male
Total
ANSWER EXPLAIN TRUST RESPECT COURTESY AVAILABILITY DRNURSEWK EDSAT EDREC

82
Table 4.4 shows the descriptive statistics on the patient satisfaction variables by
gender. The means for males were statistically higher on each patient satisfaction
variable compared to females (p<0.01) with one exception: no statistical difference
(p=0.641) was found with patient gender for the variable RESPECT. RESPECT had a
mean patient satisfaction score of 90.59 for females and 90.65 for males. See
Appendix I for more details.
Patient satisfaction scores between the three hospital peer groups—teaching,
large community, and small hospitals—were significantly different (p<0.01), with small
hospitals having highest patient scores compared to large community and teaching
hospitals for each variable. Table 4.5 shows the patient satisfaction variables by peer
group and descriptive statistics. See Appendix I for the F-statistics and p-values.
Table 4-5. Patient Satisfaction by Peer Group
117,716 116,711 118,492 118,872 119,225 119,046 118,101 120,240 119,86779.15 63.01 82.08 90.06 70.28 59.69 68.50 65.44 70.4928.37 33.26 28.91 25.28 25.99 28.96 26.30 28.95 35.16
25,658 25,380 25,838 25,934 25,987 25,931 25,873 26,146 26,12886.83 72.64 89.79 94.62 78.67 72.81 77.47 77.17 84.3423.01 28.93 22.66 19.08 22.41 24.77 22.83 24.50 27.70
30,300 30,044 30,499 30,586 30,631 30,601 30,426 31,049 30,98078.37 61.99 80.92 89.40 69.73 58.07 67.91 64.92 73.0628.95 33.85 29.54 25.95 26.12 28.81 26.33 28.56 34.03
173,674 172,135 174,829 175,392 175,843 175,578 174,400 177,435 176,97580.15 64.25 83.02 90.62 71.43 61.35 69.73 67.08 72.9927.89 32.95 28.33 24.64 25.70 28.76 26.03 28.58 34.30
NMeanStd. DeviationNMeanStd. DeviationNMeanStd. DeviationNMeanStd. Deviation
Hospital PeerGroupLarge Community
Small
Teaching
Total
ANSWER EXPLAIN TRUST RESPECT COURTESY AVAILABILITY DRNURSEWK EDSAT EDREC
Table 4.6 shows the differences in patient satisfaction scores across the various
patient age groups. In the ED, patients over 65 years had the highest mean satisfaction
scores across all patient satisfaction variables, except RESPECT and EXPLAIN (slightly
higher in 55—64 group).

83
Table 4-6. Patient Satisfaction by Age Groups
29,422 29,127 29,536 29,604 29,596 29,592 29,448 29,792 29,67676.91 64.39 80.11 89.86 69.09 58.25 67.34 64.16 67.3328.59 32.22 29.53 25.19 26.28 28.88 26.45 28.82 35.2424,192 24,027 24,268 24,320 24,289 24,293 24,173 24,378 24,33371.43 57.29 74.43 86.91 64.78 54.13 62.42 58.37 59.5731.00 34.34 32.28 28.00 28.36 30.09 28.08 30.25 37.2118,031 17,906 18,097 18,139 18,139 18,129 18,060 18,243 18,19877.33 62.12 79.76 89.08 68.99 58.57 66.47 63.42 67.3129.10 33.48 30.21 26.47 27.13 29.58 27.30 29.92 35.8225,212 25,039 25,372 25,375 25,415 25,418 25,282 25,652 25,57480.75 64.44 83.02 91.03 72.08 61.79 69.67 67.25 72.7827.71 33.33 28.46 24.25 26.00 29.38 26.74 29.23 34.4127,283 27,136 27,525 27,655 27,680 27,669 27,479 28,063 28,00483.87 67.27 86.34 92.51 74.79 64.91 73.62 71.46 78.2226.08 32.25 26.16 22.46 24.47 28.30 24.65 27.60 31.9849,534 48,900 50,031 50,299 50,724 50,477 49,958 51,307 51,19085.00 66.59 88.26 92.16 74.67 65.46 73.74 71.74 81.9124.92 32.12 24.26 22.93 23.00 26.59 23.40 25.84 29.53
173,674 172,135 174,829 175,392 175,843 175,578 174,400 177,435 176,97580.15 64.25 83.02 90.62 71.43 61.35 69.73 67.08 72.9927.89 32.95 28.33 24.64 25.70 28.76 26.03 28.58 34.30
NMeanStd. DeviationNMeanStd. DeviationNMeanStd. DeviationNMeanStd. DeviationNMeanStd. DeviationNMeanStd. DeviationNMeanStd. Deviation
Patient Age GroupUnder 18
18 -34
35 - 44
45 - 54
55 -64
65 and over
Total
ANSWER EXPLAIN TRUST RESPECT COURTESY AVAILABILITY DRNURSEWK EDSAT EDREC
Analysis of variance between groups was used to identify differences in each
satisfaction variable between groups defined by gender, age groups, and hospital peer
groups. Statistically significant differences were found within patient age group and
patient gender (p<0.001). There were differences found at the 0.05 significance level
between years using cross-tabs with the Chi-Squared statistic for patient gender and
patient age groups. Therefore, patient age group, gender and year of measurement
were included in the multivariate analyses.
Table 4.7 shows the descriptive statistics and correlation coefficients for all study
patient satisfaction variables. There were statistically significant correlations (p<0.01)
found between overall satisfaction with care in the ED and each nursing care
satisfaction variable. Correlations with overall satisfaction with care in the ED were as
follows: DRNURSEWK (.801), COURTESY (.708), AVAILABILITY (0.70), EXPLAIN
(0.58), ANSWER (0.57), TRUST (0.57), and RESPECT (0.28). Overall satisfaction with
care in the ED was significantly associated with patients recommending the ED they
attended (0.72, p<0.01).
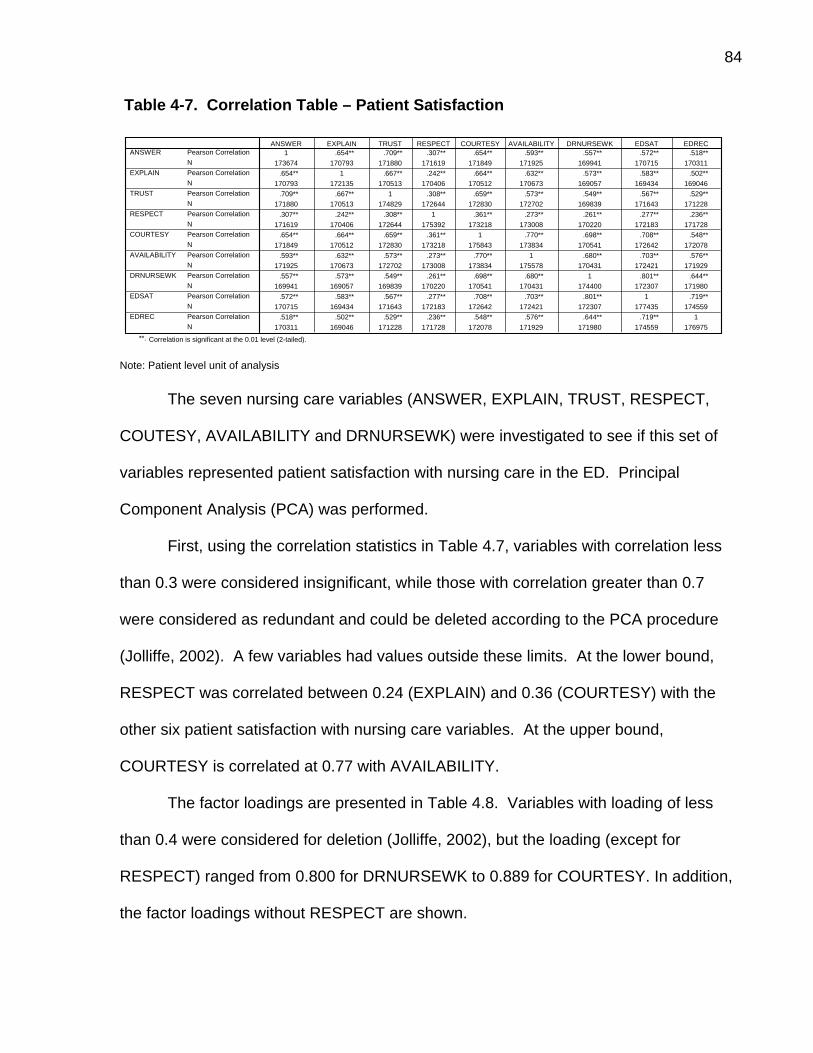
84
Table 4-7. Correlation Table – Patient Satisfaction
1 .654** .709** .307** .654** .593** .557** .572** .518**173674 170793 171880 171619 171849 171925 169941 170715 170311
.654** 1 .667** .242** .664** .632** .573** .583** .502**170793 172135 170513 170406 170512 170673 169057 169434 169046
.709** .667** 1 .308** .659** .573** .549** .567** .529**171880 170513 174829 172644 172830 172702 169839 171643 171228
.307** .242** .308** 1 .361** .273** .261** .277** .236**171619 170406 172644 175392 173218 173008 170220 172183 171728
.654** .664** .659** .361** 1 .770** .698** .708** .548**171849 170512 172830 173218 175843 173834 170541 172642 172078
.593** .632** .573** .273** .770** 1 .680** .703** .576**171925 170673 172702 173008 173834 175578 170431 172421 171929
.557** .573** .549** .261** .698** .680** 1 .801** .644**169941 169057 169839 170220 170541 170431 174400 172307 171980
.572** .583** .567** .277** .708** .703** .801** 1 .719**170715 169434 171643 172183 172642 172421 172307 177435 174559
.518** .502** .529** .236** .548** .576** .644** .719** 1170311 169046 171228 171728 172078 171929 171980 174559 176975
Pearson CorrelationNPearson CorrelationNPearson CorrelationNPearson CorrelationNPearson CorrelationNPearson CorrelationNPearson CorrelationNPearson CorrelationNPearson CorrelationN
ANSWER
EXPLAIN
TRUST
RESPECT
COURTESY
AVAILABILITY
DRNURSEWK
EDSAT
EDREC
ANSWER EXPLAIN TRUST RESPECT COURTESY AVAILABILITY DRNURSEWK EDSAT EDREC
Correlation is significant at the 0.01 level (2-tailed).**.
Note: Patient level unit of analysis
The seven nursing care variables (ANSWER, EXPLAIN, TRUST, RESPECT,
COUTESY, AVAILABILITY and DRNURSEWK) were investigated to see if this set of
variables represented patient satisfaction with nursing care in the ED. Principal
Component Analysis (PCA) was performed.
First, using the correlation statistics in Table 4.7, variables with correlation less
than 0.3 were considered insignificant, while those with correlation greater than 0.7
were considered as redundant and could be deleted according to the PCA procedure
(Jolliffe, 2002). A few variables had values outside these limits. At the lower bound,
RESPECT was correlated between 0.24 (EXPLAIN) and 0.36 (COURTESY) with the
other six patient satisfaction with nursing care variables. At the upper bound,
COURTESY is correlated at 0.77 with AVAILABILITY.
The factor loadings are presented in Table 4.8. Variables with loading of less
than 0.4 were considered for deletion (Jolliffe, 2002), but the loading (except for
RESPECT) ranged from 0.800 for DRNURSEWK to 0.889 for COURTESY. In addition,
the factor loadings without RESPECT are shown.

85
Table 4-8. PCA Factor Loadings
Variable Factor Loading (Including RESPECT)
Factor Loadings (Excluding RESPECT)
ANSWER 0.825 0.828 EXPLAIN 0.824 0.833 TRUST 0.822 0.824 RESPECT 0.438 N/A COURTESY 0.889 0.887 AVAILABILITY 0.839 0.846 DRNURSEWK 0.800 0.806 Note: Patient level unit of analysis
Analyzing the eigenvalues, only one principal component emerged that
represented 62.34% of the variance explained by the set of seven patient satisfaction
with nursing care variables. Appendix J presents the eigenvalues, the Scree Plot, and
more details of the principal component analysis. The impact of item deletion was
assessed using item-total statistics. Item-total correlations of less than 0.30 were
considered for item deletion, and the impact on alpha if the item is deleted was
assessed. As shown in Appendix J, all variables had corrected item-total correlations of
greater than 0.3, with RESPECT having the lowest value of 0.38. From the PCA
analysis, the patient satisfaction with nursing care in ED is best represented by six
variables (ANSWER, EXPLAIN, TRUST, COURTESY, AVAILABILITY and
DRNURSEWK), removing RESPECT.
The principal component analysis was repeated with all the patient satisfaction
with nursing care variables, except RESPECT. Analyzing the eigenvalues, only one
principal component emerged that represented 70.19% of the variance explained by the
set of six variables, compared to 62.34% with the completed set of variables including
RESPECT. The impact of item deletion was re-assessed using the item-total statistics.
All the variables had corrected item-total correlations of greater than 0.3, with the lowest

86
values for DRNURSEWK (0.72) and TRUST (0.75). The overall alpha (0.91) was not
improved with the deletion of any single patient satisfaction with nursing care item.
Therefore, the subset of patient satisfaction variables that represents the overall
variation in patient satisfaction with nursing care is comprised of six patient satisfaction
with nursing care variables. Appendix K shows the patient satisfaction with nursing care
(aggregate score) correlations with the other patient satisfaction variables. The patient
satisfaction with nursing care component was used as a dependent variable in the
multivariate analysis discussed later.
Table 4.9 shows the impact of each nursing variable on overall satisfaction with
care in the ED (EDSAT) and recommending the ED (EDREC) variables in terms of the
variance explained by each nursing care variable. Patients deem that a good doctor
and nurse working relationship accounts for 64% of the variance in the overall
satisfaction with ED care. The COURTESY and AVAILABILITY nursing satisfaction
variables accounted for the next highest levels of variance. These findings give an
insight into what patients value as important, relative to their overall satisfaction with ED
care.
Table 4-9. Variance Explained by Each Variable
Variable Variance (R2) -EDSAT Variance (R2) -EDREC
ANSWER 0.33 0.27 EXPLAIN 0.34 0.25 TRUST 0.32 0.28 RESPECT 0.08 0.06 COURTESY 0.50 0.30 AVAILABILITY 0.49 0.33 DRNURSEWK 0.64 0.41 NURSING CARE (Aggregate Score)
0.61 0.43
Note: Patient level unit of analysis

87
4.2 Emergency Department Characteristics
The ED staffing, nurse characteristics, and covariate variables data were drawn
from several administrative datasets for hospitals (NACRS, OHRS, OCDM and CIHI
Nursing Database) reporting at the ED level. There were no missing data for the
staffing variables, but there were missing data for nurse characteristics for 5 EDs, which
accounts for 10 data points in the five year dataset of 499 hospital level observations.
Outliers were identified by visual inspection of the data, using box-plots for each year
and identifying any data above or below the mean by 1.5 times the interquartile range.
Outliers were re-coded to a value calculated as the mean, plus or minus 1.5 times the
interquartile range for that variable. Normality was observed using the Shapiro-Wilk
test, normal probability plots, and histograms for each year. Nurse age, education, and
employment status were normally distributed, but some of the staffing variables were
not normally distributed.
Many small hospitals did not employ RPNs, agency nurses, or nurse practitioners
in the ED. Only one small hospital in the study dataset reported using agency nurses.
The percentage of teaching hospitals using nurse practitioners has been increasing
from 40% to 63%, and more large community and small hospitals have been employing
RPNs over the five year period. Appendix L shows more details. Table 4.10 shows the
worked hours per visit by nursing staffing categories. Although these variables have not
been adjusted for the severity of the patients, the table highlights that small hospitals
reported fewer agency nurses and nurse practitioners worked hours per visit than
community and teaching hospitals.

88
Table 4-10. Nursing Staffing Categories
1.3623 .05327 .02295 .003841.3894 .05441 .03234 .003091.3742 .08173 .03868 .008091.4092 .10064 .04394 .009591.4306 .11499 .03108 .009751.3936 .08165 .03396 .00695.9017 .04255 .00000 .00000.8846 .02271 .00000 .00291.9508 .02570 .00000 .00218.9444 .01226 .00048 .00447
1.0343 .01268 .00027 .00410.9418 .02339 .00014 .00270
1.7920 .01828 .03489 .008801.8294 .01955 .03058 .008811.8256 .02253 .02910 .009911.8844 .02376 .02930 .008261.8879 .02297 .01907 .014281.8447 .02148 .02848 .010041.3143 .04512 .01908 .003661.3191 .04062 .02335 .003901.3374 .05839 .02743 .006881.3827 .06857 .03192 .008241.4089 .07610 .02186 .009121.3528 .05788 .02477 .00639
Year2005/2006YE2006/2007YE2007/2008YE2008/2009YE2009/2010YETotal2005/2006YE2006/2007YE2007/2008YE2008/2009YE2009/2010YETotal2005/2006YE2006/2007YE2007/2008YE2008/2009YE2009/2010YETotal2005/2006YE2006/2007YE2007/2008YE2008/2009YE2009/2010YETotal
Hospital PeerGroupLarge Community
Small
Teaching
Total
Mean Mean Mean MeanRNWKHRS RPNWKHRS AGNWKHRS NPWKHRS
Note: ED level unit level of analysis
Descriptive statistics—including mean, standard deviation, and range for each
nurse staffing variable—are shown in Table 4.11. Nurse staff characteristics are shown
first, followed by intensity of care, skill mix, and staff adequacy variables. In addition,
emergency departments were grouped into three types of hospitals: small hospitals,
teaching or academic hospitals, and large community hospitals. Descriptive statistics
for each variable by hospital type are also presented. Using ANOVA between groups,
the patient satisfaction variable scores were statistically different among the hospital
peer groups. Thus, hospital peer group was included in the multivariate analyses.

89
Table 4-11. Emergency Department Characteristics by Hospital Type
Mean Std. Deviation Mean Std. Deviation Mean Std. Deviation Mean Std. DeviationNURSEAGE 43.37 3.44 47.09 3.38 40.13 4.48 43.80 4.23NURSEED 21.62 11.51 18.04 9.27 38.31 15.10 23.70 13.56NURSEEXP 19.21 3.90 23.60 3.84 15.92 4.74 19.79 4.73PERFEMNURSE 93.85 5.02 95.67 7.03 91.25 5.37 93.90 5.80PERFTHRS 65.84 8.76 59.92 15.57 68.17 11.69 64.75 11.60RNWKHRS 1.39 0.37 0.94 0.28 1.84 0.65 1.35 0.49RPNWKHRS 0.08 0.10 0.02 0.07 0.02 0.05 0.06 0.09AGNWKHRS 0.03 0.09 0.00 0.00 0.03 0.06 0.02 0.07NPWKHRS 0.01 0.02 0.00 0.01 0.01 0.02 0.01 0.02TOTSTAFFWKHRS 1.58 0.42 0.99 0.29 2.10 0.68 1.51 0.57RNHPLOS 0.40 0.15 0.63 0.40 0.40 0.12 0.46 0.25RPNHPLOS 0.03 0.03 0.01 0.05 0.01 0.02 0.02 0.04NPHPLOS 0.00 0.00 0.00 0.01 0.00 0.00 0.00 0.00AGNHPLOS 0.01 0.01 0.00 0.00 0.01 0.01 0.00 0.01TOTSTAFFHPLOS 0.46 0.17 0.66 0.40 0.46 0.14 0.51 0.26RNPROP 0.89 0.09 0.96 0.07 0.87 0.12 0.90 0.09RPNPROP 0.05 0.06 0.02 0.05 0.02 0.04 0.04 0.06AGNPROP 0.02 0.04 0.00 0.00 0.01 0.02 0.01 0.03NPPROP 0.00 0.01 0.00 0.01 0.00 0.01 0.00 0.01RNRATIO 0.00085 0.00023 0.00055 0.00016 0.00113 0.00041 0.00082 0.00031RPNRATIO 0.00005 0.00006 0.00001 0.00004 0.00002 0.00003 0.00003 0.00005AGNRATIO 0.00002 0.00004 0.00000 0.00000 0.00001 0.00003 0.00001 0.00004NPRATIO 0.00000 0.00001 0.00000 0.00001 0.00001 0.00001 0.00000 0.00001TOTSTAFFRATIO 0.00096 0.00026 0.00058 0.00016 0.00129 0.00043 0.00091 0.00036ANSWER 78.75 4.98 86.89 4.37 78.44 3.40 80.71 5.81EXPLAIN 59.22 6.08 69.90 7.22 59.33 5.08 61.87 7.74TRUST 82.06 4.90 89.60 3.19 81.39 3.29 83.81 5.43RESPECT 90.08 3.75 94.52 2.16 89.85 2.47 91.14 3.77COURTESY 70.24 5.11 78.37 3.97 70.33 3.36 72.26 5.78AVAILABILITY 59.65 6.03 72.60 5.33 58.55 4.07 62.67 7.98DRNURSEWK 68.54 5.05 77.07 3.93 68.49 3.52 70.63 5.87EDSAT 65.48 6.53 76.75 4.71 65.71 4.31 68.30 7.57EDREC 70.51 7.92 83.95 5.47 74.20 5.66 74.40 9.02
Patient Satisfaction
Nurse Staff Characteristics
Intensity of Care
Skill Mix
Staff Adequacy
Peer GroupLarge Community Small Teaching Total
Note: ED level unit level of analysis
4.2.1 Nurse Characteristics
Over the period from 2005/2006 to 2009/2010, the average age of the ED
nursing staff (which includes both registered nurses and registered practical nurses)
was 43.8 years. Teaching hospitals had the lowest average nursing age (40.1 years),
while small hospitals had the highest average age (47.1 years). On average, 23.7% of
the nursing staff had a baccalaureate or higher degree. Over the study period, this
percentage has been increasing. Teaching hospitals had the highest percentage of
nurses with a baccalaureate or higher degree (38.3%), compared to 18.0% in small
hospitals and 21.6% in large community hospitals.

90
The average nursing experience of the ED nursing staff ranged from 4.0 to 33.6
years over the five years, with an overall average of 19.8 years (see Appendix N). The
average nursing experience across the different hospital types ranged from 15.5 years
for teaching, 19.2 years for large community, and 23.6 years for small hospitals. The
mean percentage of female nurses ranged from 93.9 to 95.7 percent across the
different hospital peer group. The mean percentage of full-time nursing worked hours
ranged from 59.9% to 68.2%. Small hospitals had the lowest full-time nursing worked
hours (59.91%) while teaching and large community hospitals had higher percentages
(68.2% and 65.9%, respectively). In summary, ANOVA showed that all nursing
characteristics variables in the study were significantly different (p<0.01) by hospital
type.
4.2.2 Nursing Intensity of Care
The average annual RN worked hours per visit ranged from 1.31 to 1.41 hours
per visit, with a steady increase over the five-year period. The average annual RPN
worked hours per visit ranged from 0.04 to 0.08 hours per visit. Teaching and large
community hospitals had the highest agency nurse worked hours per visits compared to
small hospitals. There were significant differences (p<0.001) between the years for
RPN worked hours per visit, with means ranging from 0.04 to 0.08 hours per visit. RN
worked hours per visit, NP worked hours per visit, and agency nurse worked hours per
visit did not vary significantly (p>0.01) between the years. See Appendix N—Intensity of
Care for more details on the differences.
Registered nurse hours per patient length of stay (RNHPLOS) was calculated
using the annual registered nurse worked hours and divided by the annual total length

91
of stay of the patient reported at the emergency department level. The average annual
RNHPLOS decreased from 0.54 to 0.38 from 2005/2006 to 2007/2008, with a gradual
increase to 0.45 in 2009/2010 (see Appendix N—Intensity of Care). Over the five-year
study period, small hospitals had the highest average RNHPLOS of 0.63, compared to
large community and teaching hospitals, which had an average of 0.4. The annual
average registered practical nurse patient length of stay (RPNPLOS) ranged from 0.017
to 0.022. Small hospitals had the highest average RPNPLOS over the five-year study
period. The annual average nurse practitioner (NPHPLOS) ranged from 0.001 to 0.002,
with large community hospitals and teaching hospitals having 0.002. Similar to
NPHPLOS, annual average agency nurse hours per patient length of stay (AGNPLOS)
was low, ranging from 0.005 to 0.006. Small hospitals had the lowest annual mean
AGNPLOS of 0.0. The annual mean total staff hours per patient length of stay ranged
from 0.423 to 0.591, and small hospitals had the highest mean (0.658).
4.2.3 Skill Mix For the period from 2005/2006 to 2009/2010, the average proportion of RN
worked hours to the total staff worked hours (RNPROP) in EDs was approximately 0.90.
The skill mix proportions for the various employment categories (RNPROP, RPNPROP,
AGNPROP and NPPROP) have been relatively consistent across the five years of the
study, with no statistical difference (p>0.01) between the years. The average RN
proportion was highest in small hospitals (0.96), compared to teaching (0.87) and large
community (0.89) hospitals. See Appendix N—Skill Mix section for more details.

92
4.2.4 Staff Adequacy
The average RNRATIO variable (the ratio of the number RN staff to patients)
increased steadily but not significantly (p>0.01) over the years in the study, rising from
7.9 RNs per 10,000 patients to 8.6 RNs per 10,000 patients. Similarly, the ratio of the
average total number of staff to patient increased from 8.7 full-time equivalents to 9.7
full-time equivalents per 10,000 patients. Over the study period, teaching hospitals had
an average of 12.9 RNs per 10,000 patients, compared to small and community
hospitals, which had 5.5 RNs and 8.5 RNs per 10,000 patients, respectively.
RNRATIO, AGNRATIO, NPRATIO and TOTSTAFFRATIO did not vary significantly
(p>0.01) over the five-year period. All staff adequacy ratios in the study were
significantly different between the hospital peer groups.
There were high, statistically significant, correlations between the nurse staffing
variables. Appendix M shows the correlation coefficients for the nursing variables.
Highly correlated variables are considered redundant and were considered for deletion.
Using a data reduction process discussed later, one of the highly correlated variables
was dropped in the multivariate analyses.
4.2.5 Covariates
Five ED confounding variables are presented in Table 4.12 and Table 4.13. The
number of hospital corporations with patient satisfaction survey results in the study
varied from 96 in 2005/2006 to 103 in 2007/2008. In this study the number of ED visits
for this study was calculated from the NACRS database. The number of ED visits was
measured in both the NACRS and OHRS datasets. The numbers of visits reported in

93
these two datasets, however, were found to be different. If the difference was greater
than 5% or more than 500 visits, the number of ED visits from each dataset for that year
of the study was investigated by reviewing the volume trends over the five-year period.
There were two cases where the NACRS dataset underreported as much as 89% and
682% below the number reported in the OHRS database. In these two cases, the
number of visits from the OHRS dataset was used after reviewing the hospital trend
data.
The average number of visits has been increasing every year, from 48,810 visits
in 2005/2006 to 51,079 visits in 2009/2010. This increase has not been significant
(p>0.05). The EDs in this study vary in size with significant differences between the
hospital peer groups, with small hospitals group reporting an average number of visits of
16,078. The annual number of visits per hospital ranged from 3,778 to 200,130 visits
for a multi-site corporation.
The average ED case mix index has also been increasing during the five years of
the study, but not significantly (p>0.05). Teaching hospitals had the highest average
CMI: 0.04246. EDWAIT variable measures the proportion of ED visits seen within the
established times based on the Canadian Triage Acuity Scale (CTAS). The average
EDWAIT was approximately .8554 for EDs in the study over the five years. The average
EDWAIT was significantly different (p<0.05) between the years, with an increase in
annual mean EDWAIT in 2008/2009 and 2009/2010. Significant differences were
reported among the hospital peer groups, with small hospitals group having the highest
average EDWAIT (0.9533) compared to community and teaching hospitals (0.8389 and
0.7640, respectively).

94
The EDCLEAN variable measures the average ED score of patients who felt that
the ED they visited was clean. Over the study period, the EDCLEAN variable for the
EDs included in the study had a mean of 83.12, and there were significant differences
among the hospital peer groups. The average ED score of patients who felt the
attending physician was courteous was 72.5 over the five-year period. No significant
difference over the five years for the DRCOURTESY variable, but there were significant
differences among the peer groups, with small hospitals in the study having the highest
average score with physician courtesy.
Table 4-12. Control Variables by Year
96 100 103 99 101 49948,810 48,562 48,793 50,490 51,079 49,54936,162 36,060 36,169 36,213 38,017 36,404
96 100 103 99 101 499.03717 .03727 .03740 .03788 .03840 .03763
.005728 .006022 .006004 .006395 .006082 .00604596 100 103 99 101 499
.8671 .8632 .8799 .8337 .8327 .8554.09562 .09831 .08959 .10632 .10345 .10022
96 100 103 99 101 49983.83 82.93 83.12 82.35 83.37 83.127.96 9.12 8.95 8.45 7.78 8.4596 100 103 99 101 499
72.06 72.00 72.58 72.40 73.43 72.504.72 4.73 4.71 4.73 4.33 4.66
NMeanStd. DeviationNMeanStd. DeviationNMeanStd. DeviationNMeanStd. DeviationNMeanStd. Deviation
# of Visits
EDCMI
EDWAIT
EDCLEAN
DRCOURTESY
2005/2006 2006/2007 2007/2008 2008/2009 2009/2010 TotalYear
Note: ED level unit level of analysis

95
Table 4-13. Control Variables by Peer Group
298 123 78 49957,751 16,078 70,997 49,54935,650 6,385 32,994 36,404
298 123 78 499.03907 .03107 .04246 .03763
.004441 .001772 .007402 .006045298 123 78 499
.8389 .9533 .7640 .8554
.0856 .0276 .1031 .1002298 123 78 499
80.81 91.36 78.94 83.127.85 5.31 5.74 8.45298 123 78 499
71.04 76.14 72.32 72.504.38 4.20 2.97 4.66
NMeanStd. DeviationNMeanStd. DeviationNMeanStd. DeviationNMeanStd. DeviationNMeanStd. Deviation
# of Visits
EDCMI
EDWAIT
EDCLEAN
DRCOURTESY
Large Community Small Teaching TotalPeer Group
Note: ED level unit level of analysis
In summary, using ANOVA between groups, the covariate variable scores were
statistically different among the hospital peer groups. Only EDWAIT scores were
statistically different across the five years. The correlation coefficients for the control
variables and patient satisfaction variables are shown in Table 4.14. The correlation
coefficients for the size of the ED (number of visits) and each patient satisfaction
variable were negative and statistically significant. Similarly, EDCMI and each patient
satisfaction variable had negative correlation coefficients that were negative and
statistically significant. The correlation coefficients for EDWAIT, EDCLEAN,
DRCOURTESY, and each of the patient satisfaction variables were positive and
statistically significant, ranging from 0.61 for EDREC to 0.86 for EDSAT.
96
Table 4-14. Correlations between Control Variables and Patient Satisfaction
# Of Visits EDCMI EDWAIT EDCLEAN DRCOURTESYANSWER -0.545** -0.681** 0.680** 0.742** 0.755**EXPLAIN -0.541** -0.68** 0.668** 0.749** 0.779**TRUST -0.563** -0.702** 0.72** 0.752** 0.761**RESPECT -0.552** -0.599** 0.633** 0.659** 0.715**COURTESY -0.558** -0.655** 0.666** 0.759** 0.807**AVAILABILITY -0.573** -0.721** 0.716** 0.79** 0.753**EDSAT -0.573** -0.698** 0.699** 0.782** 0.856**EDREC -0.501** -0.646** 0.614** 0.764** 0.811**NURSING (FACTOR SCORE) -0.571** -0.696** 0.698** 0.782** 0.814**
** Correlation is significant at the 0.01 level (2-tailed). Note: ED level unit level of analysis
4.3 Research Questions Analysis
A series of linear mixed models were constructed to assess the effect of nurse
staffing on patient satisfaction outcomes in the emergency department. The initial list of
nursing characteristics and staffing variables, shown in Table 4.15, were checked for
correlation and multicollinearity. Table 4.15 shows the final list of independent variables
derived from the LASSO procedure: NURSEEXP, PERFTHRS, RNHPLOS,
RPNHPLOS, RNPROP, and AGNPROP. This final set of variables was re-checked for
correlation and multicollinearity.
The hypotheses in the initial plan included RN proportion, nurse-to-patient ratio,
and nursing worked hours per patient visit. As shown in Table 4.15, other nursing
intensity and skill mix measures were modeled to examine the relationship between
nursing staffing and patient satisfaction.

97
Table 4-15. List of Variables Assessed In Regression Analyses
Nurse Staff Characteristics Variable Label Final Model (from LASSO)
Age (in years) NURSEAGE Education Level (Diploma, BSN, & higher) NURSEED Nursing Experience (years in nursing = years after graduation from initial nursing program) NURSEEXP NURSEEXP
Employment status—Percent full-time (full-time RN & RN earned hours) divided by total nursing earned hours
PERFTHRS PERFTHRS
Nurse Staff Characteristics
Gender (Percent Female Nurses) PERFEMNURSE Nurse Staffing
RN worked hours per patient visit RNWKHRS RPN worked hours per patient visit RPNWKHRS Agency Nurse worked hours per patient visit AGNWKHRS Nurse Practitioner worked hours per patient visit NPWKHRS Total staff worked hours per patient visit TOTSTAFFWKHRS RN worked hours per patient length of stay (Annual Total RN worked hours divided by Annual Total Length of Stay)
RNHPLOS RNHPLOS
RPN worked hours per patient length of stay (Annual Total RPN worked hours divided by Annual Total Length of Stay)
RPNHPLOS RPNHPLOS
NP worked hours per patient length of stay (Annual Total NP worked hours divided by Annual Total Length of Stay)
NPHPLOS
Agency Nurse worked hours per patient length of stay (Annual Total Agency Nurse worked hours divided by Annual Total Length of Stay)
AGNHPLOS
Intensity of Care
Total staff worked hours per patient length of stay (Annual Total staff worked hours divided by Annual Total Length of Stay)
TOTSTAFFPLOS
RN proportion (RN worked hours divided by total staff worked hours) RNPROP RNPROP
RPN proportion (RPN worked hours divided by total staff worked hours) RPNPROP
Agency proportion (Agency Nurse worked hours divided by total staff worked hours) AGNPROP AGNPROP
Skill Mix
Nurse Practitioner Proportion (Nurse Practitioner worked hours divided by total staff worked hours) NPPROP
RN Staff to Patient Ratio (number of RN staff / number of patients) RNRATIO
RPN Staff to Patient Ratio (number of RPN staff / number of patients) RPNRATIO
NP Staff to Patient Ratio (number of NP staff / number of patients) NPRATIO
Staff Adequacy
Total Staff to Patient Ratio (total number of patient care staff / number of patients) TOTSTAFFRATIO

98
For the model analysis, the independent variables control variables and
dependent variables are shown in Table 4.16 below. The three regressions each had a
different dependent variable: patient satisfaction with nursing (Aggregate Score), overall
satisfaction with care in the emergency department, and recommending the emergency
department to friends and family.
Table 4-16. Variables Used in Linear Mixed Models Dependent Variables Independent Variables Control Variables Patient Satisfaction with Nursing Care (Aggregate Score)
RNHPLOS (Intensity of Care) Size of ED
Overall Patient Satisfaction with Care in the Emergency Department.
RPNHPLOS (Intensity of Care) ED Wait Times
AGNPROP (Skill Mix) Severity or Case Mix Index of the ED
RNPROP (Skill Mix) Age group of Patient PERFTEHRS (Nurse Characteristic)
Gender of Patient ED Cleanliness Doctor Courtesy Hospital Peer Group
Recommending the Emergency Department to Friends and Family
RNEXP (Nurse Characteristic)
Year of Measurement
Patient satisfaction with nursing care variables (i.e., Answer, Explain, Trust,
Respect, Courtesy, Availability and Dr-Nurse working relationship) were expected to be
more positive in EDs with higher RN proportion, nurse-to-patient ratio, and nursing
hours per patient visit. Due to the changes in the study, this hypothesis could not be
tested. Nurse-to-patient ratio and nurse hours per patient visit were not used in the
regression models because of multicollinearity and correlational issues. Despite this,
RPN hours per patient length of stay, RN hours per patient length of stay, and RN
agency nurse proportion were used as independent staffing variables. Also, a patient
satisfaction with nursing care (Aggregate Score), which included six nursing variables
except RESPECT, was used as the dependent variable in the multivariate analysis. So

99
conceptually the hypothesis was supported: there is a positive relationship between
intensity of care and RN skill mix and patient satisfaction with nursing using the
aggregate score.
Three final models were established, with (1) patient satisfaction with nursing
care (Aggregate Score), (2) overall satisfaction with received in the ED (EDSAT), and
(3) recommending this ED to family and friends (EDREC) as dependent variables.
Hierarchical linear modeling was used for all multivariate models using the SAS MIXED
procedure.
A two-level model was hypothesized to explore the relationship between nurse
staffing and each patient satisfaction with nursing variable, overall satisfaction with care,
and recommending the ED variables. The first level was the patient in ED and the
second level was the ED with repeated measurements over time. The intraclass
correlation coefficient (ICC) was calculated to assess if a two-level model was required
for each of the three regressions. For each dependent variable, the ICC was calculated
by using an unconditional intercept model. The ICC reveals what portion of the total
variance is attributable to ED-level characteristics, or what portion of the total variance
is between EDs. The ICC calculated for the following dependent variables were: Patient
Satisfaction with Nursing Care—Aggregate Score (0.06), EDSAT (0.07), AND EDREC
(0.06). The ICC indicated that there is clustering of each dependent variable score
within EDs, and therefore multi-level modeling should be used.
Two levels of analyses were conducted at the patient and the ED levels. The
first level measured the associations between patient satisfaction and nurse staffing at
the level of the individual patient. The intercept at this level accounts for potentially
correlated errors attributable to similarities among patients treated at the same hospital.

100
The second level of analyses measured the associations between mean ED satisfaction
and nurse staffing measures at the ED level, with each model using a random intercept.
Three multivariate linear mixed regression models were developed to assess the
relationship between nurse staffing and patient satisfaction in the ED. The patient
satisfaction outcome EDSAT (Yijk ) can be expressed using a pair of linked models: one
at the patient level (level-1) and another at the ED level (level-2). At level 1, the
patient’s outcome can be expressed as the sum of an intercept for the patient’s ED (b0jk)
and a random error (rijk) associated with the ith patient in the jth ED with s2 representing
the variance among patients within EDs and in the kth year. Level-1 predictors are Age
group and Gender.
Yijk = b0jk + b1AGEGRPijk+ b2PATGENDERijk + b3Yeark + bk + rijk where rijk=N(0,s2)
and AGEGRP, PATGENDER and YEAR are dummy variables. At level 2 (the ED
level), the ED level intercepts were expressed as the sum of an overall mean (γ00) and a
series of random variations from that mean.
b0jk=γ0 + γ01RNEXPjk + γ02AGNPROPjk + γ03RNHPLOSjk + γ04PERFTHRSjk +γ05RPNHPLOSjk + γ06RNPROPjk + γ07RNRATIOjk + rjk Each regression model was adjusted for heterogeneity of ED patient by entering
terms into the model pertaining to demographic characteristics of patients. Each
association was controlled for patient age, patient gender, ED cleanliness, ED physician
courtesy, ED wait times, and ED case mix index. The control variables were entered as
independent variables in the model. All dependent variables were checked for normality
of distribution. The distributions of variables were checked for normality using the
Shapiro-Wilk test for level-2 variables and the Kolmogorov-Smirnov test for the patient
satisfaction variables (level-1).

101
Model assumptions of linearity and normality were checked by analyzing the
residuals for each regression model using scatterplots of the residuals and the predicted
dependent variable. Influential hospitals were analyzed, and one hospital corporation
was found to be influential across all three models. This organization had five general
EDs of different sizes and one urgent care center. This organization was removed from
the regression analyzes.
The patient satisfaction with nursing care using the aggregate score of six
variables as the dependent variable is discussed in the next section. Models, however,
of the seven patient satisfactions with nursing care dependent variables—ANSWER,
EXPLAIN, TRUST, RESPECT, COURTESY, AVAILABILITY AND DRNURSEWK
variables—were developed for additional information. See Appendix O for the results of
these models.
4.3.1 Nurse Staffing and Patient Satisfaction with Nursing Care
Table 4.17 shows the results of the model using the patient satisfaction with
nursing care (aggregate score). Patient gender, patient age, cleanliness of the ED,
attending physician courtesy, and proportion of patients seen within recommended
timeframes were significantly associated with patient satisfaction with nursing care.
Statistically significant associations were found between ED size and case mix index
and the patient satisfaction with nursing care (aggregate score). Compared to teaching
hospitals, large community hospitals had significantly different levels of patient
satisfaction with nursing care (p<0.05).

102
On average, RN skill mix (RNPROP) and RPN worked hours per length of stay
(RPNHPLOS) were positively associated with patient satisfaction with nursing care, with
estimates of 5.639 (p<0.0001) and 14.249 (p<0.0001) respectively. Thus, for each
percent increase in RPN worked hours per length of stay, there was an associated
increase in patient satisfaction with nursing care of about .143 on a scale of 0 to 100.
For each one percent increment in RN staff skill mix, however, there was an associated
increase in patient satisfaction with nursing care of 0.056 on a scale of 0 to 100. The
percent of full-time nursing worked hours was negatively associated with patient
satisfaction with nursing care, with an estimate of -0.018 (p<0.05). Each one percent
increase in full-time nursing staff was associated with a decrease in patient satisfaction
with nursing care of approximately 0.018 on a scale of 0 to 100. No statistically
significant associations were found between agency proportion, nurse experience, RN
worked hours per length of stay, and patient satisfaction with nursing care (p>0.05).

103
Table 4-17. Linear Mixed Model: Patient Satisfaction with Nursing Care (Aggregate Score)
Effect Description Units Estimate Standard Error Pr > |t|Intercept 15.8303 2.4862 <.0001
Year 1 -0.3045 0.1644 0.0647Year 2 -0.4637 0.1585 0.0036Year 3 -0.4715 0.1625 0.0039Year 4 0.01131 0.1412 0.9362Year 5 0 a . .
Hospcmi -80.2734 33.1622 0.0155Gender Female -0.8697 0.0882 <.0001Gender Male 0 a . .
Patagegrp Under 18 -1.7865 0.1418 <.0001Patagegrp 18 -34 -4.3319 0.1448 <.0001Patagegrp 35 - 44 -1.9683 0.1588 <.0001Patagegrp 45 -54 -0.975 0.1411 <.0001Patagegrp 55 -65 -0.1806 0.1376 0.19Patagegrp Over 65 0 a . .
Peer Group Large Community
-1.1811 0.5421 0.0317
Peer Group Small 0.7891 0.7427 0.2906Peer Group Teaching 0 a . .
EDClean 0 - 100 0.1896 0.001644 <.0001# of Visits -7.59E-06 0.00000616 0.2182
DRcourtesy 0 - 100 0.485 0.001824 <.0001EDWAIT 0 - 1 8.3348 1.4561 <.0001
NURSEEXP 0.02803 0.02566 0.2747RNPROP 0 - 1 5.6386 1.4365 <.0001
AGNPROP 0 - 1 -1.56 2.9313 0.5946PERFTHRS 0 - 100 -0.01771 0.008139 0.0296RNHPLOS 0 - 1 0.5075 0.471 0.2813
RPNHPLOS 0 - 1 14.249 3.3618 <.0001a Variable is set to zero and considered a reference for the dummy variable group Note: Unit level of analysis: Level 1 – Patient; Level II - ED
4.3.2 Nurse Staffing and Overall Satisfaction with Care Received in the ED – EDSAT
Table 4.18 shows the results of the model. Patient gender, patient age group,
cleanliness of the ED, proportion of patient seen within recommended timeframes, and
attending physician courtesy all had a positive and significant association with overall
satisfaction with ED care. No statistically significant associations were found between

104
the size of the ED measured as the number of ED visits and ED case mix index and the
overall satisfaction with ED care (p>0.05). Compared to teaching hospitals, large
community hospitals had significantly different levels of patient satisfaction, with an
estimate of -1.92 (p<0.001). Patients under 54 years old had significantly different
patient satisfaction scores to elderly patients over 65 years old.
On average, RN skill mix (RNPROP) and RPN worked hours per length of stay
(RPNHPLOS) were positively associated with overall patient satisfaction with care, with
estimates of 4.98 (p<0.01) and 11.17 (p<0.01) respectively. Thus, for each percent
increase in RPN worked hours per length of stay, there was an increase in overall
patient satisfaction with care of about .112 on a scale of 0 to 100. For each one percent
increment in RN staff skill mix, there was an associated increase in overall patient
satisfaction with care received in the ED of .05 on a scale of 0 to 100. The percent of
full-time nursing worked hours was negatively associated with overall patient
satisfaction with care with an estimate of -0.02 (p<0.05). For each one percent increase
in full-time nursing staff, there was an associated decrease in overall patient satisfaction
with care received in the ED of approximately 0.02 on a scale of 0 to 100. No
statistically significant associations were found between agency proportion, nurse
experience, RN worked hours per length of stay, and overall patient satisfaction with
care received in the ED.

105
Table 4-18. Linear Mixed Model: Overall Patient Satisfaction with Care Received in the ED—EDSAT
Effect Description Units Estimate Standard Error Pr > |t|
Intercept -8.8947 2.666 0.0012Year 1 -0.7361 0.1781 <.0001Year 2 -0.7425 0.1719 <.0001Year 3 -0.8109 0.1763 <.0001Year 4 -0.1842 0.1535 0.231Year 5 0 a . .
Hospcmi -36.6417 35.4117 0.3008Gender Female -0.7057 0.09623 <.0001Gender Male 0 a . .
Patagegrp Under 18 -1.9505 0.1545 <.0001Patagegrp 18 -34 -3.9885 0.1581 <.0001Patagegrp 35 - 44 -2.1191 0.1735 <.0001Patagegrp 45 -54 -0.9252 0.1535 <.0001Patagegrp 55 -65 0.05638 0.1491 0.7054Patagegrp Over 65 0 a . .
Peer Group Large Community
-1.9218 0.5554 0.0008
Peer Group Small 0.4394 0.7651 0.567Peer Group Teaching 0 a . .
EDClean 0 - 100 0.1877 0.001786 <.0001# of Visits -0.00001 6.39E-06 0.0747
DRcourtesy 0 - 100 0.677 0.001977 <.0001EDWAIT 0 - 1 16.1939 1.574 <.0001
NURSEEXP 0.03179 0.02758 0.249RNPROP 0 - 1 4.9815 1.533 0.0012
AGNPROP 0 - 1 -4.9656 3.1513 0.1151PERFTHRS 0 - 100 -0.01996 0.008788 0.0231RNHPLOS 0 - 1 0.3139 0.5063 0.5352
RPNHPLOS 0 - 1 11.1701 3.6044 0.0019a Variable is set to zero and considered a reference for the dummy variable group Note: Unit level of analysis: Level 1 – Patient; Level II - ED
4.3.3 Nurse Staffing and Recommending the ED—EDREC
Table 4.19 shows the results of the linear mixed model. Patient gender, age,
cleanliness of the ED, proportion of patient seen within recommended timeframes, and
attending physician courtesy had a positive and statistically significant association with
the patient recommending the ED they visited. No statistically significant association

106
was found between the size of the ED measured as the number of ED visits and ED
case mix index and recommending the ED. Compared to teaching hospitals, both large
community hospitals and small hospitals had significantly lower levels of patient
recommendation scores with estimates of -6.67 (p<0.001) and -3.29 (p<0.05). Elderly
patients aged 65 years and older had higher significantly higher patient
recommendation score than other patients.
On average, RN skill mix (RNPROP) was positively associated with
recommending the ED patient satisfaction scores with estimates of 6.991 (p<0.002).
For each one percent increment in RN staff skill mix, there is an associated increase in
patient recommendation of .07 on a scale of 0 to 100. The percent of full-time nursing
worked hours was negatively associated with recommending the ED patient satisfaction
scores, with an estimate of -0.04 (p<0.01). For each one percent increase in full-time
nursing staff, there was an associated decrease in patient recommendation of
approximately 0.04 on a scale of 0 to 100. No statistically significant associations were
found between agency proportion, nurse experience, RN, and RPN worked hours per
length of stay with recommending the ED.

107
Table 4-19. Linear Mixed Model: Recommending the ED—EDREC
Effect Description Units Estimate Standard Error Pr > |t|Intercept -1.7331 3.919 0.6593
Year 1 -0.695 0.2521 0.0061Year 2 -0.9725 0.2421 <.0001Year 3 -1.2639 0.2471 <.0001Year 4 -0.1176 0.212 0.5795Year 5 0 a . .
Hospcmi -82.5197 53.1189 0.1203Gender Female -0.5131 0.132 0.0002Gender Male 0 a . .
Patagegrp Under 18 -8.9332 0.2123 <.0001Patagegrp 18 -34 -13.1292 0.2169 <.0001Patagegrp 35 - 44 -8.3558 0.238 <.0001Patagegrp 45 -54 -5.3315 0.2106 <.0001Patagegrp 55 -65 -2.955 0.2045 <.0001Patagegrp Over 65 0 a . .Peer Group Large
Community-6.6669 0.9993 <.0001
Peer Group Small -3.2903 1.3438 0.016Peer Group Teaching 0 a . .
EDClean 0 - 100 0.3258 0.002456 <.0001# of Visits 7.64E-06 0.000011 0.4782
DRcourtesy 0 - 100 0.5527 0.002716 <.0001EDWAIT 0 - 1 22.5922 2.2482 <.0001
NURSEEXP -0.00192 0.0399 0.9616RNPROP 0 - 1 6.9906 2.2591 0.002
AGNPROP 0 - 1 -0.1876 4.5112 0.9668PERFTHRS 0 - 100 -0.03649 0.01259 0.0038RNHPLOS 0 - 1 -0.4299 0.7386 0.5605
RPNHPLOS 0 - 1 8.4977 5.3051 0.1092a Variable is set to zero and considered a reference for the dummy variable group Note: Unit level of analysis: Level 1 – Patient; Level II - ED
4.4 Summary
Descriptive statistics for over 182,000 patient surveys and 107 EDs used in the
study gave valuable insight for the analyses performed to address the research
questions. One principal component emerged representing 70.19% of the variance
explained by the set of six patient satisfaction with nursing care variables (excluding
RESPECT). Three linear mixed models were used to examine the relationship of nurse
staffing in the emergency department and patient satisfaction with nursing care, overall

108
patient satisfaction with care received in the ED, and recommending the ED to family
and friends. Table 4.20 and Table 4.21 below highlights the significant relationships
found in this study.
Table 4.21 shows the standardized coefficients to highlight the relative
importance of the explanatory variables. Variables were standardized so that the
magnitude of each association was calculated as a standardized regression coefficient
that represents the number of standard deviations of change in the patient satisfaction
outcome of interest per standard deviation of change in the explanatory variable.
Therefore, the nurse staffing and nurse characteristics variables were centered and
standardized. The standardized regression coefficient allows comparisons of
magnitude across differing variables and represents an approximation of an r value.

109
Table 4-20. Linear Mixed Models Results
Effect Description Estimate Pr > |t| Estimate Pr > |t| Estimate Pr > |t|Intercept 15.8303 <.0001 -8.8947 0.0012 -1.7331 0.6593
Year 1 -0.3045 0.0641 -0.7361 <.0001 -0.695 0.0061Year 2 -0.4637 0.0034 -0.7425 <.0001 -0.9725 <.0001Year 3 -0.4715 0.0041 -0.8109 <.0001 -1.2639 <.0001Year 4 0.01131 0.8828 -0.1842 0.231 -0.1176 0.5795Year 5 0 a . 0 a . 0 a .
Hospcmi -80.2734 0.0162 -36.6417 0.3008 -82.5197 0.1203Gender Female -0.8697 <.0001 -0.7057 <.0001 -0.5131 0.0002Gender Male 0 a . 0 a . 0 a .
Patagegrp Under 18 -1.7865 <.0001 -1.9505 <.0001 -8.9332 <.0001Patagegrp 18 -34 -4.3319 <.0001 -3.9885 <.0001 -13.1292 <.0001Patagegrp 35 - 44 -1.9683 <.0001 -2.1191 <.0001 -8.3558 <.0001Patagegrp 45 -54 -0.975 <.0001 -0.9252 <.0001 -5.3315 <.0001Patagegrp 55 -65 -0.1806 0.1684 0.05638 0.7054 -2.955 <.0001Patagegrp Over 65 0 a . 0 a . 0 a .
Peer Group Large Community
-1.1811 0.0298 -1.9218 0.0008 -6.6669 <.0001
Peer Group Small 0.7891 0.3124 0.4394 0.567 -3.2903 0.016Peer Group Teaching 0 a . 0 a . 0 a .
EDClean 0.1896 <.0001 0.1877 <.0001 0.3258 <.0001# of Visits -7.59E-06 <.0001 -0.00001 0.0747 7.64E-06 0.4782
DRcourtesy 0.485 <.0001 0.677 <.0001 0.5527 <.0001EDWAIT 8.3348 <.0001 16.1939 <.0001 22.5922 <.0001
NURSEEXP 0.02803 0.2538 0.03179 0.249 -0.00192 0.9616RNPROP 5.6386 <.0001 4.9815 0.0012 6.9906 0.002
AGNPROP -1.56 0.5285 -4.9656 0.1151 -0.1876 0.9668PERFTHRS -0.01771 0.0257 -0.01996 0.0231 -0.03649 0.0038RNHPLOS 0.5075 0.2764 0.3139 0.5352 -0.4299 0.5605
RPNHPLOS 14.249 <.0001 11.1701 0.0019 8.4977 0.1092
Patient Satisfaction with Nursing (Aggregate Score) EDSAT EDREC
a Variable is set to zero; considered a reference for the dummy variable group
Note: Unit level of analysis: Level 1 – Patient; Level II - ED

110
Table 4-21. Linear Mixed Models Results with Standardized Coefficients
Effect Description Estimate Pr > |t| Estimate Pr > |t| Estimate Pr > |t|Intercept 75.2895 <.0001 71.5976 <.0001 85.4407 <.0001
Year 1 -0.3045 0.0647 -0.7361 <.0001 -0.695 0.0061Year 2 -0.4637 0.0036 -0.7425 <.0001 -0.9725 <.0001Year 3 -0.4715 0.0039 -0.8109 <.0001 -1.2639 <.0001Year 4 0.01131 0.9362 -0.1842 0.231 -0.1176 0.5795Year 5 0 a . 0 a . 0 a .
Hospcmi -0.528 0.0155 -0.241 0.3008 -0.5427 0.1203Gender Female -0.8697 <.0001 -0.7057 <.0001 -0.5131 0.0002Gender Male 0 a . 0 a . 0 a .
Patagegrp Under 18 -1.7865 <.0001 -1.9505 <.0001 -8.9332 <.0001Patagegrp 18 -34 -4.3319 <.0001 -3.9885 <.0001 -13.1292 <.0001Patagegrp 35 - 44 -1.9683 <.0001 -2.1191 <.0001 -8.3558 <.0001Patagegrp 45 -54 -0.975 <.0001 -0.9252 <.0001 -5.3315 <.0001Patagegrp 55 -65 -0.1806 0.19 0.05638 0.7054 -2.955 <.0001Patagegrp Over 65 0 a . 0 a . 0 a .
Peer Group Large Community
-1.1811 0.0317 -1.9218 0.0008 -6.6669 <.0001
Peer Group Small 0.7891 0.2906 0.4394 0.567 -3.2903 0.016Peer Group Teaching 0 a . 0 a . 0 a .
EDClean 5.5217 <.0001 5.4675 <.0001 9.4893 <.0001# of Visits -2.72E-01 0.2182 -4.08E-01 0.0747 0.2736 0.4782
DRcourtesy 12.4617 <.0001 17.3959 <.0001 14.2021 <.0001EDWAIT 0.8252 <.0001 1.6032 <.0001 2.2367 <.0001
NURSEEXP 0.1333 0.2747 0.1512 0.249 -0.00912 0.9616RNPROP 0.6276 <.0001 0.5545 0.0012 0.7781 0.002
AGNPROP -0.04995 0.5946 -0.159 0.1151 -0.00601 0.9668PERFTHRS -0.2309 0.0296 -0.2603 0.0231 -0.4758 0.0038RNHPLOS 0.2411 0.2813 0.1491 0.5352 -0.2042 0.5605
RPNHPLOS 0.8934 <.0001 0.7004 0.0019 0.5328 0.1092
Patient Satisfaction with Nursing (Aggregate Score) EDSAT EDREC
a Variable is set to zero; considered a reference for the dummy variable group
Note: Unit level of analysis: Level 1 – Patient; Level II - ED
In all the models, patient age, gender, the cleanliness of the ED, and courtesy of
the ED doctor variables were significantly associated with patient satisfaction. The
estimates for the EDWAIT, or the proportion of patient seen within the targeted length of
stay, were 16.19 and 22.59 for overall patient satisfaction with care and recommending
the ED respectively. The size of the ED was significant in the patient satisfaction with
nursing care model, but it was not significant for the EDSAT and EDREC models.

111
An increase in RNPROP was associated with an increase in patient satisfaction
with nursing care, overall patient satisfaction with care received in the ED, and patients
recommending the ED to family and friends but the magnitudes of the effect were small.
An increase in RPN worked hours per patient length of stay was statistically associated
with an increase in patient satisfaction with nursing care and overall patient satisfaction
with care received in the ED, but once again the magnitudes of the effect were small.
An unexpected finding was that a decrease in the percentage of full-time hours for
nursing staff was associated with a statistically significant increase in patient satisfaction
with nursing care, overall patient satisfaction with care, and patients recommending the
ED. So the magnitudes of the associations between nurse staffing and patient
satisfaction in EDs were significant but were small.
Table 4.21 shows that DRCOURTESY, EDCLEAN, and EDWAIT are the most
important control variables across all three models. The relative importance of the
nurse staffing variables was found to be lower compared to these covariates. The
following graphs in Figure 4 were developed to further investigate the magnitude of the
nurse staffing effect on patient satisfaction in EDs.
Using the latest year of data, 2009/2010, the actual and predicted average
patient satisfaction scores for each ED were plotted against the size or number of visits
of the ED. The first graph shows there is a large variation in the actual average patient
satisfaction scores for overall care in 2009/2010. A typical ED was simulated using the
median values for the covariate variables (CMI, EDCLEAN, DRCOURTESY, and
EDWAIT). The predicted overall patient satisfaction with care received score for an ED
was computed using the estimates from the regression model, the median values for
the covariates and the actual nurse staffing values for that ED. The predicted overall
112
satisfaction with care received was plotted for all EDs in 2009/2010 in the second graph.
This graph shows that variation in predicted overall satisfaction with care received in the
ED care was less than 2%. Finally, a typical ED was simulated using the median values
of the nursing variables. Similar to the second graph, the estimates from the regression
model, the median values of the nursing variables and the actual covariate values were
used to predict the overall patient satisfaction with care received in the ED for each ED.
The third graph showed the variation of the predicted patient satisfaction scores ranged
from 18% to 40%. This analysis confirms that the magnitude of the effect of nurse
staffing on overall patient satisfaction with care received in the ED was small since the
variation of the predicted patient satisfaction was small when using the median values
of the covariates and the actual ED nurse staffing variables.
Similar graphs were created for two other patient satisfaction outcome variables:
patient satisfaction with nursing care and recommending the ED to family and friends.
The graphs are shown in Appendix P. The results were also similar, the magnitudes of
the effect of nurse staffing on patient satisfaction with nursing care and recommending
the ED to family and friends were small since the variations of the predicted ED scores
were low.

113
Figure 4. Predicted Satisfaction Scores for a typical ED
Overall Patient Satisfaction in 2009/10
50
55
60
65
70
75
80
85
90
95
100
0 20,000 40,000 60,000 80,000 100,000 120,000 140,000 160,000 180,000
Visits
Ove
rall
Satis
fact
ion
%
Predicted Overall Satisfaction in 2009/10(Using median covariates values and nurse staffing variables)
50
55
60
65
70
75
80
85
90
95
100
0 20,000 40,000 60,000 80,000 100,000 120,000 140,000 160,000 180,000
visits
Pred
icte
d O
vera
ll Sa
t

114
50
55
60
65
70
75
80
85
90
95
100
0 20,000 40,000 60,000 80,000 100,000 120,000 140,000 160,000 180,000
Pred
icte
d O
vera
ll Sa
t
visits
Predicted Overall Patient Satisfaction in 2009/10 (using medians for nurse staffing and using covariates data)

115
Chapter 5 Discussion and Conclusion
5 Overview
Having shown in the previous chapter the results of the multivariate models, this
chapter concludes this study’s investigation of patient satisfaction and its relationship to
nurse staffing in the ED by discussing the findings in detail. In particular, the chapter
will describe the following: 1. the relationships among variables; 2. major findings; 3.
implications of the study; 4. limitations of the study 5. areas for future research; and 6.
conclusions.
5.1 Study Variables
In this study, the mean patient satisfaction scores were found to vary among the
three hospital peer groups, with emergency departments in small hospitals having
higher patient satisfaction scores than teaching and large community hospitals. Patient
satisfaction scores were also different between the age groups, with patients over 65
years old having higher mean satisfaction scores than the non-elderly. These finding
are consistent with previous studies that reported older patients were more satisfied
than younger patients (Mahon, 1996; O'Connell et al., 1999; Liu & Wang, 2007;
Alhusban & Abualrub, 2009).
In this study, mean patient satisfaction scores for males were significantly higher
on each patient satisfaction variable than they were for females (except for one variable:

116
RESPECT). Despite this, the mean patient satisfaction score for males were less than
2% higher than the mean scores for females, so the mean differences between males
and females were significant, but the magnitude of the difference was quite small.
Patient characteristics, such as cultural background, age, sex, and education have been
found to be related to patient satisfaction (Bacon & Mark, 2009). The literature is mixed,
since some studies did not find any relationships between patient satisfaction and
demographic variables (Laschinger et al., 2011). Although there is a lack of consensus
in the literature about the association of patient satisfaction and gender, some studies
have found men to be more satisfied with their care than women (Lövgren et al., 1998;
Arnetz & Arnetz, 1996.).
Seven patient satisfaction with nursing care variables were explored in this study:
ANSWER, EXPLAIN, TRUST, RESPECT, COURTESY, AVAILABILITY and
DRNURSEWK. The correlations of each patient satisfaction with nursing care variables
and the overall patient satisfaction with care in the ED variable highlighted what ED
patients determine to be important relative to their overall satisfaction with care. Having
nurses who are available, courteous, and able to work well with doctors highly
correlated with patients’ overall satisfaction with care received in the ED. These
findings support the importance of the interpersonal aspect of nursing practice similar to
the findings in other studies (Jacox et al., 1997; O'Connell et al., 1999; Taylor & Benger,
2004). The current study findings are also consistent with previous studies that found
patients expect the following nursing qualities: friendly and kind, quick to respond to
patients’ needs, and having adequate time to provide care (Fitzpatrick, 1991).
In the current study, there was considerable variance in the overall satisfaction
with care received in the ED. This variance was explained by each patient satisfaction

117
with nursing care variable, with the exception of RESPECT. The patient satisfaction
with nursing care (Aggregate Score) accounted for 61% of the variation of the overall
satisfaction with care received in the ED. These findings are consistent with previous
studies conducted in inpatient units of hospitals. Jacox et al. (1997) studied nine
medical-surgical units in a teaching hospital and found patient satisfaction with nursing
care was correlated with overall satisfaction with r=0.61. The current study overall
correlation of 0.78 between patient satisfaction with nursing care (Aggregate Score) and
overall satisfaction with care in the ED is similar to the results of Cleary et al. (1989) of
0.76 for surgical patients.
When compared to studies identified by Kane et al. (2007) in their review of the
literature on nurse staffing, the mean experience level for the nurses in the EDs in this
study was high at 19.8 years. In addition, the mean RN proportion in this study of 90%
was higher than studies reviewed on inpatient units; for example, Blegan et al. (1998)
had an RN proportion for 42 inpatient units that ranged between 46% to 96%, with an
average of 72% across all units(Blegen et al., 1998). In a study of nurse staffing in
California hospitals, researchers found RN proportion was 70.34% and 74.26% for
medical/surgical and step-down units (Bolton et al., 2007). Thus, on average, the
experience level and mix of RNs in the EDs in this study were higher than those of
inpatient units studied previously.
Patients who stayed longer in hospitals tend to be less satisfied than those who
stayed a short time (Boudreaux et al., 2000). In addition, the length of time to see a
physician is associated with patient satisfaction with emergency patients and the
number of patient who left without being seen (Mowen et al., 1993; Kyriacou et al.,
1999). In this current study, the proportion of patient seen within the recommended

118
timeframe in EDs had a positive significant association with patient satisfaction in the
ED. In fact, the magnitude of the effect of wait times on patient satisfaction in the ED for
nursing care, overall care and likelihood of recommending the ED to friends and family
was higher than any of the nurse staffing variables explored. The EDWAIT variable is
calculated at the ED level, so there may be other factors that can affect this variable.
Significant differences in patient satisfaction were found between the peer groups
used in this study, with small hospitals having higher patient satisfaction scores on
average compared to community and teaching hospitals. EDs in small hospitals did not
utilize RN agency nurses, but they still had the lowest percentage of full-time nursing
staff. Small hospitals, however, had the highest RN skill mix compared to community
and teaching hospitals. In Ontario, the small hospitals are located in rural areas where
the ED can be used for emergency medical care as well as routine care because of
access to primary care (JPPC, 2007). The relationships between small hospital staff
and community could have an impact on the higher patient satisfaction scores since
patients may fear any negative patient ratings could lead to closure or reduced funding
to their hospital.
Three covariates (DRCOURTESY, EDCLEAN and EDWAIT) were found to have
a significant association and major effect on all three patient satisfaction outcomes
investigated (patient satisfaction with nursing care-Aggregate Score, EDSAT and
EDREC). The average scores for these covariates were significantly higher for EDs in
small hospitals compared to EDs in community and teaching hospitals. The
combination of these covariates and other factors may explain the higher patient
satisfaction in EDs in small hospitals.

119
5.2 Findings in Relation to the Conceptual Framework The current study adapted the conceptual framework used by Kane et al. (2007)
to investigate the association between nurse staffing and patient satisfaction with one
major change. Kane et al. (2007) included nurse outcomes such as nurse job
satisfaction, nurse retention rate and nurse burnout rate in their conceptual framework.
Some of the relationships hypothesized in this current study were not modeled because
nurse-to-patient ratio and RN worked hours per patient visit were not included as
predictors in the regression analyses. These two variables were dropped as a result of
the LASSO procedure because of multicollinearity issues. There was weak support,
however, for the relationships hypothesized for RN proportion and patient satisfaction,
and for that reason, the conceptual model adapted from Kane et al. (2007) was only
partially confirmed in this study.
To test the conceptual model, the effect size, as discussed in Chapter Three,
must be large enough to explain 26% of the variance of the dependent variable patient
satisfaction scores (Cohen & Cohen, 2002). For the three regression models presented
in this study, the reduction in variance of the dependent variables were 0.45 for the
patient satisfaction with nursing care (Aggregate Score), 0.53 for the overall satisfaction
with care, and 0.38 for recommending the ED to family and friends, making the effect
size large enough to test the model.
5.2.1 Research Question 1 To what extent specific aspects of nurse staffing relate to patient satisfaction with
nursing care?

120
During the analysis of the data to answer this research question, two interesting
findings were observed regarding the patient satisfaction with nursing variables. First,
using Principal Component Analysis, the current study identified a subset of patient
satisfaction with nursing care variables that sufficiently represents the overall variation
in patient satisfaction with nursing. One component was found to represent the overall
variation (70.19%) in patient satisfaction with nursing care comprising six of the seven
patient satisfaction variables. RESPECT was excluded because the response to the
question “did nurses talk in front of you as if you weren’t there” was not highly
associated with patient satisfaction with nursing care in the ED. Also, there were no
differences found between men and women for RESPECT. These findings do not de-
emphasize the importance of having respect for patients, but rather, RESPECT seems
separate from patient satisfaction with nursing care in this study.
Second, the patient satisfaction with nursing care (aggregate score) was found to
be significantly associated with patient satisfaction with overall care received in the ED.
This finding is consistent with other studies that revealed patient satisfaction with
nursing care in inpatient units is associated strongly with (and is an important predictor
of) overall satisfaction with hospital care (Johansson et al., 2002; Bolton et al., 2003;
Larrabee et al., 2004; Al-Mailam, 2005; Chan & Chau, 2005; McGillis Hall, 2005; Kane
et al., 2007).
To investigate this research question, the strategy for the multivariate analysis
changed from the original plan based on the results of the principal components
analysis. Instead, the final model presented two nurse staffing variables, RNPROP and
RPNHPLOS, both of which were positively significantly associated with patient
satisfaction with nursing care. More importantly, however, the magnitude of the

121
estimates for the independent variables in this model was quite small. When
interpreting patient satisfaction results, the effect size estimates should be emphasized
rather than the p-values alone (Boudreaux et al., 2004).
With respect to the first research question—"To what extent do specific aspects
of nurse staffing relate to patient satisfaction with nursing care?"—the study findings
were unexpected regarding the effect size estimates. There are statistical associations
between RNPROP and patient satisfaction with nursing, but the magnitude of the effect
was very small. On average, the mean RN skill mix is 90% for the EDs in this study. At
higher levels of RN skill mix, any increase will result in only a very small increase in
patient satisfaction with nursing. The magnitude of the effect of the association
between RPN hours per length of stay and patient satisfaction with nursing was
significant, and although the magnitude of the effect was larger than RNPROP, the
magnitude of the effect is still small. Only a few EDs in this study reported RPNs
worked hours. Nonetheless, for each percent increase in RPN worked hours per length
of stay, there was only a small increase in overall patient satisfaction with nursing care.
Therefore, there is a statistical association between two nurse staffing measures and
patient satisfaction with nursing care, but it is a minute effect that is not actionable.
5.2.2 Research Questions 2 and 3
To what extent specific aspects of nurse staffing relate to overall satisfaction with care
in the ED and b) whether the patient would recommend this ED to friends and family?
The regression models presented two nurse staffing variables, RNPROP and
RPNHPLOS, both of which were positively significantly associated with overall
satisfaction with care in the ED. Thus, there is a positive relationship between intensity

122
of care, RN skill mix and overall satisfaction with care, and recommending the ED to
friends and family. Although the study showed that RNPROP and RPNHPLOS were
positively significantly associated with overall satisfaction with care in the ED, the
magnitude of the effect was again small.
Similar to the discussion for the previous research question, increases in RN
skill mix or RPN worked hours per length of stay are associated with very small
increases in patient satisfaction scores. The magnitude of the effect of nurse staffing
was indeed quite small, so conceptually there was very weak support for the
hypothesis. Although other studies found that a higher proportion of RNs was
associated with a significantly lower rates of patient complaints in inpatient units (Blegen
et al., 1998; Blegen & Vaughn, 1998), this current study found a statistical association
between RNPROP and patient satisfaction, but not one that is administratively
actionable by nurse managers.
The RPNHPLOS variable estimates were the highest of the nurse staffing
variables used in the three regression analyses. Higher RPN worked hours per length
of stay was associated statistically with an increase in patient satisfaction with nursing
care, overall satisfaction with care received in the ED, and recommending the ED
scores. One possible explanation is that the RN job satisfaction may be higher if RNs
concentrate on nursing tasks and do not perform non-nursing functions (McGillis Hall et
al., 2003). The current study, however, reveals that an increase in RN skill mix and
higher RPN worked hours per length of stay are associated statistically with better
patient satisfaction outcomes, although the magnitudes of the effects are too small to
draw any conclusions. The variation in the mean score for patient satisfaction and nurse
staffing measures were also very small at the ED level. In addition, the average

123
RNPROP for EDs in the current study was quite high at 90%. Blegan et al. (1998)
found in their study of relationships between major adverse events (MAE) and nurse
staffing that as the proportion of RNs on a unit increased from 50% to 85% "the rate of
MAEs declined, but as the RN proportion increased from 85% to 100% the rate of MAEs
increased" (Blegen & Vaughn, 1998). In economics, diminishing marginal returns is
referred to as the decrease in the marginal output of a production process as the
amount of a single factor of production is increased, while the amounts of all other
factors of production stay constant (Samuelson & Nordhaus, 2001). With the EDs in the
study having high RN proportions, there may be no more room for improvement in
patient satisfaction scores with additional increase in nurse staffing.
The percent of full-time nursing worked hours variable was negatively
significantly associated with each of the three patient satisfaction outcome variables:
patient satisfaction with nursing (Aggregate Score), patient satisfaction with overall care
received in the ED, and patient recommendation of the ED. Although significant, the
magnitude of the effect for percent full-time nursing worked hours was very tiny and not
meaningful with any of the three outcomes. Small hospitals had a significantly lower
mean percentage of full-time nurses compared to large community and teaching
hospitals. Furthermore, small hospitals had higher mean patient satisfaction scores
than large community and teaching hospitals. This may have led to percent of full-time
nursing variable being significant without a large effect in the multivariate models.
In the three regression models, EDWAIT (or the percent of visits seen within the
target lengths of stay) was positively significantly associated with patient satisfaction in
the ED. Put simply, patients generally do not like to wait to see a clinician (McMillan et
al., 1986) and the current study emphasizes the association of length of stay and patient

124
satisfaction. The waiting time to see the clinician was included in the total length of stay
time in the ED. Researchers have found that only the waiting time to examination by
the ED physician is significantly negatively correlated with patient satisfaction (Dansky &
Miles, 1997; Sandovski et al., 2001).
ED physician courtesy and cleanliness of the ED were positively significantly
associated with all three patient satisfaction outcomes investigated. Research has
shown patient satisfaction is correlated strongly with rating for physician courtesy
(Comstock et al., 1982). Similarly, cleanliness of the hospital has been found to be
associated with patient satisfaction (Sitzia & Wood, 1997). In the current study, both
physician courtesy and cleanliness of the ED had a higher magnitude of effect than any
other explanatory variable including the nurse staffing variables. These findings
highlight the importance of interpersonal factors and environmental factors with respect
to patient satisfaction but do not suggest a casual relationship.
As discussed in Chapter Three, the associations explored in this study do not
reflect a causal relationship. In their review of the nurse staffing literature, Kane et al.
(2007) found increased staffing in hospitals was associated with better care outcomes,
but the association did not reflect a causal relationship. Kane et al. (2007) commented
that hospitals that invest in more nurses may also invest in other actions that improve
quality. In fact, overall hospital commitment to provide high quality of care in
combination with effective nurse retention strategies has shown to lead to better patient
outcomes, greater patient satisfaction with overall care received and nursing care, and
nurse job satisfaction (Laschinger et al., 2003; Lake & Friese, 2006; Kane et al., 2007).

125
5.3 Study Implications
The findings in the current study have implications for hospital administrators,
policy and future research. The following section will describe those implications for
each group or application.
5.3.1 Administration
Hospital administrators are faced with higher acuity of patients and fiscal
pressures, and this result in new staffing models being implemented in order to control
cost, even as volume of patients seeking care in EDs continues to grow. Despite these
pressures, hospital administrators need to reflect on patient satisfaction in the planning,
delivery, and evaluation of care. The impact of any changes in staff mix or levels should
be assessed, monitored, and evaluated with respect to patient outcomes, including
patient satisfaction. The results of this study, therefore, need to be considered when
implementing quality improvement initiatives, replacing RNs with other nursing staff, and
scheduling staff in the department.
This study shows that with the present nurse staffing, there is an extremely small
or imperceptible improvement in patient satisfaction that can be achieved from staffing
measures such as RN skill mix. Other changes, however, such as alterations in the ED
physician courtesy, ED cleanliness, and reduction in patient wait times may have
greater improvement on (and are more strongly associated with) patient satisfaction
outcomes than changes in nurse staffing. Caution must be taken when using results
which demonstrate association and not cause. Administrators need to consider
initiatives to improve patient satisfaction that have high return on investment and this

126
study reveals that relatively small improvement in patient satisfaction can be achieved
through changes to nurse staffing. More research on causation of higher patient
satisfaction ratings in the ED is required so that administrators can act with greater
certainty of changes to satisfaction scores.
This study also emphasizes the association of nursing availability to overall
satisfaction with care in the ED and highlights the importance of the interpersonal
aspect of nursing practice. For that reason, there is a real need to explore effective
ways for improving interpersonal aspects of patient care in the potentially high-stress
environment of a hospital. Hospital administrators, nurse managers, researchers, and
nurses all must investigate the factors affecting the interpersonal aspect of nursing in
EDs.
The current study shows the correlation between nurses’ availability, courtesy,
ability to answer questions from patients, nurse competency, and patient satisfaction
with overall care received in the ED. These results have implications for administrators
as they monitor and evaluate their ED patient satisfaction scores. The workload in EDs
are unpredictable, however, managers must recognize the importance of having
courteous, competent staff in EDs with enough stand-by capacity so staff are able to
address questions and concerns of patients at all times. To investigate patient
satisfaction scores, administrators need to explore initiatives to improve the
interpersonal aspects of care, environmental factors such as the cleanliness of the ED,
and the overall wait times in the ED.
Finally, this study highlights the limitations with aggregate level of data in
reporting and evaluating patient satisfaction with nursing care. Hospital administrators
and nurses need to support database systems that are not only effective, but that can

127
be used to improve the quality of care and patient experience through research. The
database should include the amount and type of nursing resources used to care for
each ED patient.
5.3.2 Policy
In Ontario, the Excellent Care for All Act, 2010 puts patients first by improving the
quality and value of the patient experience. This legislation magnifies the importance of
the patient experiences and requires hospitals to survey patients in order to assess their
satisfaction with services provided. In addition, the Centers for Medicare & Medicaid
Services (CMS) have begun to publicly report patient satisfaction in the U.S. by using a
standardized survey—the Hospital Consumer Assessment of Healthcare Providers &
Systems (HCAHPS)—that was developed by the Agency for Healthcare Research and
Quality. As more states consider regulating nurse-to-patient ratios and more public
reporting of patient satisfaction, there is an urgent need to improve the perception
patients have of their care experience.
In the U.S. and U.K., hospital payments will eventually depend on patient
satisfaction scores, as there is a shift to a patient-centered health system. Beginning in
the fiscal year 2013, CMS is in the process of implementing a Hospital Value-Based
Purchasing (VBP) program that will pay incentives to acute care hospitals based on
achievement or improvement related to predefined quality measures. Patient
satisfaction is a core measure of the VBP program and will include better patient-
clinician communication, pain management, and preparation for discharge. Similarly,
10% of the payments to NHS trusts in the U.K. will depend on patient satisfaction.

128
Thus, the findings of this current study are important to both policy makers and hospital
administrators as the effort continues to improve quality of care and decrease cost.
In the U.S., some federal or state legislatures have mandated hospitals to
implement staffing plans with specific nurse-to-patient ratios. This study does not bring
into dispute the importance of nurse staffing, but the current study highlights how the
association between nurse staffing and patient satisfaction can be affected by different
factors, such as patient and nurse characteristics, and environmental characteristics of
the emergency department (such as cleanliness). If policy makers expect large
changes in patient satisfaction with mandated staffing ratios, this study has shown the
effect of nurse staffing in the ED on patient satisfaction may be, at the most, very small.
5.4 Limitations of the Study
The major limitation of the study is its use of aggregate hospital-level data
instead of patient-level data. This current study can be considered as a partial
ecological study where the variables can be grouped as individual-level (properties of
each patient) and ecological variables (properties of organizations). Ecological studies
can be used for hypothesis-generating exercises, but they require confirmation using
individual-level variables. They are also potentially prone to biases that may occur
when the association that exists between variables at an aggregate level do not
represent the true association that exists at an individual level (Piantadosi et al., 1988).
Another limitation of the current study relates to missing data. Missing data were
found at two levels: the patient level and the hospital level. Some patients did not
respond to the questions in the patient satisfaction survey, therefore missing data were

129
imputed for two patient satisfaction with nursing variables, ANSWER and EXPLAIN. At
the hospital ED level, missing data were found for the nursing characteristics for specific
years and were subsequently removed from the analysis.
The nurse staffing data for the 153 emergency departments included in the study
were reported for 107 hospital corporations. For hospital corporations with a general
ED and an UCC, for example, the nurse staffing variables were reported collectively
since it was not possible to separate the data by site. For hospital corporations with
different types of EDs, the effects of organizational characteristics, which could affect
the relationship between nurse staffing and patient satisfaction with care, were unable
to be controlled in the current study.
In this study, there were no medical staffing measures because of the lack of
reporting of the fee-for-service physicians. Two general measures of nurse staffing,
however, were studied. One addressed hours of care provided by nursing staff of
different nurse categories at the hospital level for the emergency department. The
hours of care or worked hours comprised both direct times (patient-related) and non-
direct times, such as lunch breaks and training times. The other nurse staffing measure
was based on less precise data of total nurse staffing, averaging FTE to patient volume
to create a ratio of nurse staffing to patient. In studies of nursing staffing and patient
outcomes, Kane et al. (2007) found that RN per shift ratio was more frequently used
and provided greater evidence of the effect, although generally they showed the same
trends as nurse-to-patient ratios. RN per shift ratio and measures of only direct nursing
patient care times could not be obtained from the administrative databases.
Another limitation of the current study is that only two control variables for
differences in served patients were included: age and gender. Patient factors has been

130
found to account for as much as 47.5% of the variance in patient satisfaction with
nursing care (Angelo et al., 2003). In the current study, patient severity, length of stay,
and the amount of nursing hours were reported at the hospital corporation level and not
at the patient level. Other patient characteristics, such as education level, were not
included. In addition, this study did not consider nurse ethnicity, race and language
considerations. It is unknown, therefore, to what extent RN characteristics make any
difference in patient satisfaction outcomes.
As discussed previously, the framework devised by Kane et al. (2007) included
nursing outcome variables such as nursing staff satisfaction, burnout, and turnover. In
hospitals with high patient-to-nurse ratios, nurses are more likely to experience burnout
and job dissatisfaction, outcomes that can, in turn, affect patient outcomes (Aiken et al.,
2002). For example, researchers have found nurse outcomes can affect patient
outcomes which includes patient satisfaction. For example, nurses may become
dissatisfied with their work when unable to give good care, leading to reduced patient
satisfaction (McNeese-Smith, 1999; Vahey DC, 2004). Furthermore, RN turnover has
been found to be inversely related to patient satisfaction (Henry, 1992). Unfortunately,
nursing outcomes data were not available for this study.
Finally, another limitation of the current study is the omission of data about
physicians. Only physician courtesy was included in this study. It is possible that EDs
with higher level of nursing staff could also have greater numbers of better-qualified
doctors working in the ED. In patient outcomes studies, researchers found that doctors
were the most important professional group associated with reductions in mortality
(Aiken et al., 2002; Aiken et al., 2003).

131
5.5 Future Research
Patient satisfaction with nursing has grown in importance for researchers for a
number of reasons. Assessing patient satisfaction provides a means of monitoring the
quality of nursing care and evaluating effectiveness of nursing interventions.
Satisfaction with nursing care is also the most important predictor of overall satisfaction
with hospital care (Greeneich, 1993).
The current study makes important contributions to better understand the
relationship between nurse staffing and patient satisfaction in emergency departments.
The results reinforce the findings by previous studies that indicate that there are
differences in patient satisfaction between men and women and between elderly and
non-elderly patients. These differences should be addressed in the design and data
analysis of health services research on patient satisfaction, and these variables should
also be controlled to address any potential confounding in future research.
The present research in this study used hierarchical linear mixed models.
Although the patient satisfaction outcomes were patient specific, the analysis could not
be performed at the patient level because of data limitations. If staffing and acuity data
for each patient were obtained by shift for the patients surveyed, the sensitivity of the
study to detect the association between nurse staffing and patient satisfaction would
have been increased. In addition, the current study has also shown that the proportion
of patients seen within the recommended timeframe is associated with patient
satisfaction in EDs. Future research examining the relationship between nurse staffing
and patient satisfaction in emergency departments should include patient-level data for
acuity, staffing, length of stay, as well as the time to see a physician.

132
Future research on the relationship between nurse staffing and patient
satisfaction in emergency departments should include additional patient-level
characteristics (patient education level, for example). Since patient factors have been
found to account for much of the variance in patient satisfaction with nursing care
(Angelo et al., 2003), including other patient characteristics will improve the model.
Given the established association between nurse outcomes and patient
outcomes including patient satisfaction (Aiken et al., 2002; Vahey DC, 2004) gaining
further understanding about these relationships in the ED is important. Future research
should examine the effect of nursing outcomes such as nurse satisfaction, burnout, and
turnover on patient satisfaction in EDs. Additionally, this study included the RN
characteristics of education, experience, and age, however future research should
include RPN characteristics.
In the current study, there were different types of EDs, such as general EDs,
UCCs, or trauma centres. The type of ED was not used to control for organizational
characteristics. Future research should include the type of ED, which may in turn better
isolate the effects of the hospital characteristics, including case mix index and wait
times, on the relationship between nurse staffing and patient satisfaction.
5.6 Conclusion
Patient satisfaction is a key outcome measure being examined by researchers
exploring relationships among patient outcomes, hospital structure, and care processes.
No studies have examined the relationship between nurse staffing and patient

133
perceptions of nursing care in multiple EDs using shared definitions of nurse staffing
and a common patient satisfaction survey tool. This five-year study makes an important
contribution to the literature by presenting findings from over 100 EDs across urban and
rural, community and academic, small and large, healthcare institutions with varying
sizes and case mix, and for using common measures for both nurse staffing and patient
perception of care from 182,000 patients.
The current conceptual model linking nurse staffing and patient satisfaction
outcomes in EDs was not fully supported. Although the hypotheses for the study could
not be confirmed, RN proportion and RPN worked hours per length of stay were found
to have a weak statistical association with patient satisfaction with nursing care, patient
satisfaction with overall care in the ED, and the likelihood to recommend the ED to
friends and family. Notwithstanding the limitations of ecological variables used in the
analyses, interpersonal and environmental factors such as courtesy, cleanliness, and
timeliness—rather than nurse staffing—should be the focus of both administrative
efforts for consideration to investigate to improve patient satisfaction in EDs and further
research on the subject.

134
References Abdellah, F. G. & Levine, E. (1958). Effect of Nurse Staffing on Satisfactions with Nursing
Care, American Hospital Association. Abenhaim, H. A., Kahn, S. R., Raffoul, J. & Becker, M. R. (2000). "Program Description: a
hospitalist-run, medical short stay unit in a teaching hospital." CMAJ Canadian Medical Association Journal 163(11): 1477-80.
Ahmad, M. M. & Alasad, J. A. (2004). "Predictors of patients' experiences of nursing care in medical-surgical wards." International Journal of Nursing Practice 10(5): 235-41.
Aiello, A., Garman, A. & Morris, S. B. (2003). "Patient satisfaction with nursing care: a multilevel analysis." Quality Management in Health Care 12(3): 187-90.
Aiken, L. H., Clarke, S. P. & Cheung. R. B (2003). "Educational levels of hospital nurses and surgical patient mortality. ." JAMA 290(12): 1617-23.
Aiken, L. H., Clarke, S. P., Silber, J. H. & Sloane, D. (2003). "Hospital nurse staffing, education, and patient mortality." LDI issue brief 9(2): 1-4.
Aiken, L. H., Clarke, S. P. & Sloane, D. M. (2002). "Hospital staffing, organization, and quality of care: Cross-national findings." Nursing outlook 50(5): 187-94.
Aiken, L. H., Clarke, S. P., Sloane, D. M., J.A., S., Busse, R. & Clarke, H. (2001). "Nurses' reports on hospital care in five countries." Health Affairs 20(3): 43-53.
Aiken, L. H., Clarke, S. P., Sloane, D. M., Sochalski, J. & Silber, J. H. (2002). "Hospital nurse staffing and patient mortality, nurse burnout, and job dissatisfaction." JAMA 288(16): 1987-93.
Aiken, L. H., Sloane, D. M., Cimiotti, J. P., Clarke, S. P., Flynn, L., Seago, J. A., Spetz, J. & Smith, H. L. (2010). "Implications of the California Nurse Staffing Mandate for Other States."
Aiken, L. H., Smith, H. L. & Lake, E. T. (1994). "Lower Medicare mortality among a set of hospitals known for good nursing care." Medical care 32(8): 771-87.
Aiken, L. H., Sochalski, J. & Anderson, G. F. (1996). "Downsizing the hospital nursing workforce." Health Affairs 15: 88-92.
al-Haider, A. S. & Wan, T. T. (1991). "Modeling organizational determinants of hospital mortality." Health services research 26(3): 303-23.
Alhusban, M. A. & Abualrub, R. F. (2009). "Patient satisfaction with nursing care in Jordon." Journal of Nursing Management 17: 749-758.
Al-Mailam, F. F. (2005). "The effect of nursing care on overall patient satisfaction and its predictive value on return-to-provider behavior: a survey study." Quality Management in Health Care 14(2): 116-20.
American Nurses Association (ANA) (2007). "NDNQI® Guidelines." Angelo, A., Andrew, G. & Scott, B. (2003). "Patient satisfaction with nursing care: a multilevel
analysis." Qual Manag Health Care. 12:187-190. Arnetz, J. E. & Arnetz, B. B. ( 1996.). "The development and application of a patient satisfaction
measurement system for hospital-wide quality improvement." Int J Qual Health Care. 8(6): 555-66.
Auerbach, D. L., Buerhaus, P. I. & Staiger, D. O. (2011). "Registered Nurse Supply Grows Faster Then Projected Amid Surge In New Entrants Ages 23-26." Health Affairs 30;12: 2286-2292.

135
Bacon, C. T. & Mark, B. (2009). "Organizational effects on patient satisfaction in hospital medical-surgical units." Journal of Nursing Administration 39: 220-227.
Barbara, A., Davis, D. & Elaine, D. (1999). "Patient satisfaction wth nursing care in rural and an urban emergency department." Australian Journal of Rural Health 7: 97-103.
Beland, F., Lemay, A. & Boucher, M. (1998). "Patterns of Visits to Hospital-Based Emergency Rooms." Soc. Sci. Med. 47: p. 165-179.
Blegen, M. A., Goode, C. J. & Reed, L. (1998). "Nurse staffing and patient outcomes." Nursing research 47(1): 43-50.
Blegen, M. A. & Vaughn, T. (1998). "A multisite study of nurse staffing and patient occurrences." Nursing economic$ 16(4): 196-203.
Blegen, M. A. & Vaughn, T. (2001). "Nurse experience and education." Journal of Nursing Administration 31(1): 33-39.
Bloom, J. R., Alexander, J. A. & Nuchols, B. A. (1997). "Nurse staffing patterns and hospital efficiency in the United States." Social science & medicine (1982) 44(2): 147-55.
Bolton, L. B., Aydin, C. E., Donaldson, N., Brown, D. S., Nelson, M. S. & Harms, D. (2003). "Nurse staffing and patient perceptions of nursing care." Journal of Nursing Administration 33(11): 607-14.
Bolton, L. B., Aydin, C. E. & Nancy Donaldson, D. S. B., Meenu Sandhu, Moshe Fridman and (2007). "Mandated Nurse Staffing Ratios in California: A Comparison of Staffing and Nursing-Sensitive Outcomes Pre- and Postregulation." Policy, Politics, & Nursing Practice 8; 238.
Bolton, L. B., Jones, D. & Aydin, C. E. (2001). "A response to California's mandated nursing ratios." J Nurs Scholarsh 33(2): 179-84.
Bond, S. & Thomas, L. H. (1992). "Measuring patients' satisfaction with nursing care." Joumal of Advanced Nursing 17: 52-6.
Boudreaux, E. D., Ary, R. D., Mandry, C. V. & McCabe, B. (2000). "Determinants of patient satisfaction in a large, municipal ED: the role of demographic variables, visit characteristics, and patient perceptions." American Journal of Emergency Medicine 18(4): 394-400.
Boudreaux, E. D., D'Autremont, S., Wood, K. & Jones, G. N. (2004). "Predictors of emergency department patient satisfaction: stability over 17 months." Academic Emergency Medicine 11(1): 51-8.
Boudreaux, E. D., Mandry, C. V. & Wood, K. (2003). "Patient satisfaction data as a quality indicator: a tale of two emergency departments." Academic Emergency Medicine 10(3): 261-8.
Boudreaux, E. D. & O'Hea, E. L. (2004). "Patient satisfaction in the Emergency Department: a review of the literature and implications for practice." Journal of Emergency Medicine 26(1): 13-26.
Brewer, C. S. & Frazier, P. (1998). "The influence of structure, staff type, and managed-care indicators on registered nurse staffing." Journal of Nursing Administration 28(9): 28-36.
Bullard, M. J. & Villa-Rowe, C. (2010). "The role of a rapid assessment zone/pod on reducing overcrowding in emergency departments: a systematic review." Emerg Med J 103598.
Bursch, B., Beezy, J. & Shaw, R. (1993). "Emergency department satisfaction: what matters most?" Annals of Emergency Medicine 22(3): 586-91.
Byrne, G., Richardson, M., Brunsdon, A. & Patel, A. (2000). "Patient satisfaction with emergency nurse practitioners in A&E." Journal of Clinical Nursing 9: 83-93.
136
Chan, J. N. & Chau, J. (2005). "Patient satisfaction with triage nursing care in Hong Kong." Journal of Advanced Nursing 50(5): 498-507.
Chang, B. L. (1997). "Dimensions and indicators of patients' perceived nursing care quality in the hospital setting." Journal of Nursing Care Quality 11(6): 26-37.
Cho, S. H., Hwang, J. H. & Kim, J. (2008). "Nurse staffing and patient mortality in intensive care units." Nursing research 57(5): 322-30.
CIHI (2008). Hospital e-Scorecard Report 2008: Emergency Department Care Patient Satisfaction Technical Summary, Canadian Institute for Health Information.
CIHI (2011). Canadian Institute for Health Information, Highlights of 2009–2010 Inpatient Hospitalizations and Emergency Department Visits.
CIHI (2011). Data Quality Documentation for External Users: National Ambulatory Care Reporting System, 2010–2011.
Clarke, S. P. (2007). "Nurse staffing in acute care settings: research perspectives and practice implications." Joint Commission journal on quality and patient safety / Joint Commission Resources 33(11 Suppl): 30-44.
Cleary, P. D., S. Edgman-Levitan, S., McMullen, W. & Delbanco, T. L. (1992). "The relationship between reported problems and patient summary evaluations of hospital care." Qual Rev Bull. 18: 53-59.
CNA, C. N. A. (2004). Nursing Staff Mix: A Literature Review. CNA, C. N. A. (2004). Tested Solutions for Eliminating Canada's Registered Nurse Shortage. Cohen, J. & Cohen, P. (1983). Applied Multiple Regression/Correlation Analysis for the
Behavioral Sciences, Lawerence Erlbaum Associates, Publishers, Hillsdale, New Jersey. Cohen, J. & Cohen, P. (2002). Applied Multiple Regression/Correlation Analysis for the
Behavioral Sciences, Lawerence Erlbaum Associates, Publishers, Hillsdale, New Jersey. Comstock, L., Hooper, E., Goodwin, J. & Goodwin, J. (1982). "Physician behaviors that
correlate with patient satisfaction." Journal of Medical Education 57(2): 105-12. Considine, J., Kropman, M., Kelly, E. & Winter, C. (2008). "Effect of emergency department
fast track on emergency department length of stay: a case control study." Emergency Medicine Journal 25(815-819).
Cook, T. D. & Campbell, D. T. (1979). Quasi-Experimentation: Design and Analysis for Field Settings, R and McNally, Chicago, Illinois.
Coulter, A., Fitzpatrick, R. & Cornwell, J. (2009). "The Point of Care Measures of patients' experience in hospital: purpose, methods and uses." The King's Fund ISBN: 978 1 85717 585 1.
Daly, S., Cambell, D. A. & Cameron, P. A. (2003). "Short Stay Units and Observational Medicine: A systematic Review -." MJA 178: 559-563.
Dansky, K. & Miles, J. (1997). "Patient satisfaction with ambulatory healthcare services: waiting time and filling time." Hosp Health Serv Adm. 42(2): 165-77.
Darby, C. (2002). "Patient/parent assessment of the quality of care." Ambulatory Pediatrics 2(4 Suppl): 345-8.
Davis, M. M. & Vollmann, T. A. (1990). "A framework for relating wait time and customer satisfaction in a service operation." Journal of Service Marketing 4(1): 61-69.
Dimick, J. B., Swoboda, S. M., Pronovost, P. J. & Lipsett, P. A. (2001). "Effect of nurse-to-patient ratio in the intensive care unit on pulmonary complications and resource use after hepatectomy." American Journal of Critical Care 10(6): 376-82.
Donabedian, A. (1966). "Evaluating the quality of medical care." Millbank Memorial Fund Quarterly 44(3): 166-206.

137
Donabedian, A. (1980). Explorations in quality assessment and monitoring, Ann Arbor: Health Administration Press.
Dozier, A. M., Kitzman, H. J., Ingersoll, G. L., Holmberg, S. & Schultz, A. W. (2001). "Development of an Instrument to Measure Patient Perception of the Quality of Nursing Care." Research in Nursing & Health, 2001, 24, 24: 506±517.
Drummond, A. J. (2002). "No room at the inn: overcrowding in Ontario's emergency departments." CMAJ Canadian Medical Association Journal 4(2):91-97.
ENA (2003). Emergency Nurses Association White Paper: Staffing and Productivity in the Emergency Care Setting. 2011.
Eriksen, L. R. (1995). "Patient satisfaction with nursing care: concept clarification." Journal of Nursing Measurement 3(1): 59-76.
Fahad Al-Mailam, F. (2005). "The effect of nursing care on overall patient satisfaction and its predictive value on return-to-provider behaviour: A survey study." Quality Management in Health Care 14(2): 116-120.
FitzGerald, G., Jelinek, G. A., Scott, D. & Gerdtz, M. F. (2010). "Emergency department triage." Emer Med J 27: 86-92.
Fitzpatrick, R. (1991). "Surveys of patient satisfaction: II--Designing a questionnaire and conducting a survey." BMJ 302(6785): . 1129–1132.
Freeman, J. L., Fetter, R. B., Park, H., Schneider, K. C. & al., e. (1995). "Diagnosis-Related Group Refinement with Diagnsis- and Procedure-Specific Comorbodities and Complications." Medical Care 33(8): 806-827.
French, K. (1981). "Methodological consideration in hospital patient opinion surveys." International Journal of Nursing Studies. 18: 7-32.
Greeneich, D. (1993). "The link between new and return business and quality of care: Patient satisfaction." Advances in Nursing Science 16:: 62-72.
Hall, J. A. & Dorman, M. C. (1990). "Patient sociodemographic characteristics as predictors of satisfaction with medical care: A meta-analysis." Social science & medicine 30: 811-818.
Hall, M. F. & Press, I. (1996). "Keys to patient satisfaction in the emergency department: results of a multiple facility study." Hospital & Health Services Administration 41(4): 515-32.
Halloran, E. & Vermeersch, P. (1987). "Variability in Nurse Staffing Research." 17(2):. 26-34. Halm, M., Peterson, M., Kandels, M., Sabo, J., Blalock, M., Braden, R., Gryczman, A., Krisko-
Hagel, K., Larson, D., Lemay, D., Sisler, B., Strom, L. & Topham, D. (2005). "Hospital nurse staffing and patient mortality, emotional exhaustion, and job dissatisfaction." Clinical Nurse Specialist 19(5): 241-51.
Han, a., Ospina, M., Blitz, S., Strome, T. & Rowe, B. H. (2007). "Patients presenting to the emergency department: the use of other health care services and reasons for presentation." CJEM Canadian Journal of Emergency Medical Care 9(6): 428-434.
Hansagi, H., Cadsson, B. & Brismar (1992). "The urgency of care need and patient satisfaction at a hospital emergency department." Health Care Management Review 17.: 71-5.
Henry, B. (1992). "Leadership, nurses, and patient satisfaction: a pilot study." Nurs Adm Q. 16:(3):: 72-74.
Hinshaw, A. & Atwood, J. (1982). "A patient satisfaction instrument. Precision by replication." Nursing research 31: 170-175.
Hoelzle, B. (2011). "Regression Analysis with the Ordered Multinomial Logistic Model." Paper presented at the annual meeting of the Southwest Educational Research Association, San Antonio, TX, Feb 2-4, 2011.

138
HSRC (March 1997). Health Services Restructuring Commission, Metropolitan Toronto Health Services Restructuring Report.
Jacox, A. K., Bausell, B. R. & Mahrenholz, D. M. (1997). "Patient satisfaction with nursing care in hospitals." Outcomes Management for Nursing Practice 1(1): 20-8.
Johansson, P., Oleni, M. & Fridlund, B. (2002). "Patient satisfaction with nursing care in the context of health care: a literature study." Scandinavian Journal of Caring Sciences 16(4): 337-44.
Jolliffe, I. (2002). Principal Component Analysis. New York, Springer. JPPC, O. J. P. a. P. C. (2006). Summary Report of the Hospital Funding Committee on the Use
of 2004/05 Cost and Activity Data. JPPC, O. J. P. a. P. C. (2007). Recommendation of CACS grouper and Modified RIWs for
Emergency Department and Day Surgery. Toronto, Ontario. Kane, R. L., Shamliyan, T., Mueller, C., Duval, S. & Wilt, T. J. (2007). " Nursing Staffing and
Quality of Patient Care." Evidence Report/Technology Assessment No. 151 (Prepared by the Minnesota Evidence-based Practice Center under Contract No. 290-02-0009.) AHRQ Publication No. 07-E005. Rockville, MD: Agency for Healthcare Research and Quality.: 1-115.
King, D. L., Ben-Tovim, D. I. & Bassham, J. (2006). "Redesigning emergency department patient flows: Application of Lean
Thinking to healthcare." Emergency Medicine Australasia 18: 391-397. Konnyu, K., Kwok, E., Grimshaw, J. & Moher, D. (2011). What is the evidence of the
effectiveness and safety of emergency department short stay units., Ottawa Hospital Research Institute.
Korn, R. & Mansfield, M. (2008). "ED overcrowding: an assessment tool to monitor ED registered nurse workload that accounts for admitted patients residing in the emergency department." Journal of Emergency Nursing 34(5): 441-6.
Krishel, S. & Baraff, L. J. (1993). "Effect of emergency department information on patient satisfaction." Annals of Emergency Medicine 22(3): 568-72.
Kurata, J., Nogawa, A., Phillips, D., Hoffman, S. & Werblum, M. (1992). "Patient and provider satisfaction with medical care." J of Fam Prac 35: 176-9.
Kwa, P. & Blake, D. (2008). "Fast Track: Has it changed patient care in the emergency department?" Emergency Medicine, Australasia 20: 10-15.
Kyriacou, D. N., Ricketts, V., Dyne, P. L., McCollough, M. D. & Talan, D. A. (1999). "A 5-year time study analysis of emergency department patient care efficiency.[see comment]." Annals of Emergency Medicine 34(3): 326-35.
Lake, E. & Friese, C. (2006). "Variations in nursing practice environments: relation to staffing and hospital characteristics." Nurs Res 55(1):1-9.
LaMonica, E., Oberst, M., Madea, A. & Wolf, R. (1986). "Development of a patient satisfaction scale." Research in Nursing & Health 9: 43 - 50.
Larrabee, J. H. & Bolden, L. V. (2001). "Defining patient-perceived quality of nursing care." Journal of Nursing Care Quality 16(1): 34-60.
Larrabee, J. H., Ostrow, C. L., Withrow, M. L., Janney, M. A., Hobbs, G. R. & Burant, C. (2004). "Predictors of patient satisfaction with inpatient hospital nursing care." Research in Nursing & Health 27: 254-268.
Larson, M. G. (2006). "Descriptive Statistics and Graphical Displays." Journal of the American Heart Association 114: 76-81.

139
Larson, P. J. & Ferketich, S. L. (1993). "Patients' satisfaction with nurses' caring during hospitalization." Western Journal of Nursing Research 15(6): 690-703.
Laschinger, H., Gilbert, S. & Smith, L. (2011). "Nursing Outcomes; The State of the Science." Jones & Barlett, Learning ISBN 978-0-7637-8325-9.
Laschinger, H., J;, A. & D., T.-H. (2003). "Workplace empowerment and magnet hospital characteristics: making the link." J Nurs Adm 33(7-8): 410-22.
Leaman, A. M. (2003). "See and treat: A management driven method of achieving targets or a tool for better patient care? One size does not fit all.." Emergency Medicine Journal 20: 118.
Ley, P. J., Kinsey, S. T. & Atherton, B. (1976). "Increasing patients' satisfaction with communication." British Journal of Clinical Psychology 15: 403-413.
Lin, C. C. (1996). "Patient satisfaction with nursing care as an outcome variable: dilemmas for nursing evaluation researchers." Journal of Professional Nursing 12(4): 207-16.
Liu, Y. & Wang, G. (2007). "Inpatient Satisfaction With Nursing Care and Factors Influencing Satisfaction in a Teaching Hospital in China." J Nurs Care Qual 22(3): 266-271.
Lövgren, G., Sandman, P. O., Engström, B., Norberg, A. & Eriksson, S. (1998). "The view of caring among patients and personnel." Scand J Caring Sci.. 12(1): 33-41.
Mahon, P. Y. (1996). "An analysis of the concept 'patient satisfaction' as it relates to contemporary nursing care." Journal of Advanced Nursing 24(6): 1241-8.
Mark, B. A. (2006). "Methodological Issues in Nurse Staffing Research." Western Journal of Nursing Research 28(6): 694-709.
Mark, B. A., Harless, D. W. & McCue, M., . (2004). "A longitudinal examination of hospital registered nurse staffing and quality of care." Health Serv Res 39(2): 279-300.
Mark, B. A., Salyer, J. & Wan, T. T. (2000). "Market, hospital, and nursing unit characteristics as predictors of nursing unit skill mix: a contextual analysis." Journal of Nursing Administration 30(11): 552-60.
Mark, B. M., Salyer, J. & Wan, T. T. (2003). "Professional Nursing Practice; Impact on Organizational and Patient Outcomes." Journal of Nursing Administration 33 (4): 224-234.
McGee, L. A. & Kaplan, L. (2007). "Factors influencing the decision to use nurse practitioners in the emergency department." Journal of Emergency Nursing 33(5): 441-6.
McGillis Hall, L. (1997). "Staff Mix Models: Complementary or substitute roles for nurses." Nursing Administration Quarterly 21(2): 31-39.
McGillis Hall, L. (2005). "Quality Work Environments for Nurse and Patient Safety." McGillis Hall, L., Doran, D., Baker, G., Pink, G., Sidani, S., O'Brien-Pallas, L. & GJ., D. (2003).
"Nurse staffing models as predictors of patient outcomes." Medical Care 41(9):: 1096-109.
McMillan, R., Younger, M. & DeWme, L. (1986). "Sahsfachon with hospital emergency department as a funchon of patient tnage." Health Care Management Revtew 11(3): 21-27.
McNeese-Smith, D. (1999). "A content analysis of staff nurse descriptions of job satisfaction and dissatisfaction." J Adv Nurs. 29(6): 1332-41.
Megivern, K., Halm, M. A. & Jones, G. (1992). "Measuring patient satisfaction as an outcome of nursing care." Journal of Nursing Care Quality 6(4): 9-24.
Merkouris, A., Ifantopoulosh, J., Lanara, V. & Lemonidou, C. (1999). "Patient satisfaction: a key concept for evaluating and improving nursing services." Journal of Nursing Management 7: 19-28.

140
Merkouris, A., Papathanassoglou, E. D. & Lemonidou, C. (2004). "Evaluation of patient satisfaction with nursing care: quantitative or qualitative approach?" International Journal of Nursing Studies 41(4): 355-67.
Minnick, A. F., Roberts, M. J. & Young, W. B. (1997). "What influences patients' reports of three aspects of hospital services? ." Med Care 35(4): 399-409.
Mitchell, P., Ferketich, S. & Jennings, B. (1998). "Quality health outcomes model." Journal of Nursing Scholarship 30: 43-46.
MOHLTC (2011). Health Based Allocation Model (HBAM) Manual. Monzon, J., Friedman, S. M., Clarke, C. & Arenovich, T. (2005). "Patients Who Leave the
Emergency Department Without Being Seen by a Physician: A Control-Matched Study." Canadian Journal of Emergency Medicine 7(2). 107-13.
Mowen, J. C., Licata, J. W. & McPhail, J. (1993). "Waiting in the emergency room: how to improve patient satisfaction." Journal of Health Care Marketing 13(2): 26-33.
Munro, B., Jacobsen, B. S. & Brooten, D. A. (1994). "Re-examination of the pschometric characteristics of the La Monica-Oberst Patient Satisfaction Scale." Research in Nursing & Health 17: 119-125.
Needham, J. (1996). "Balancing skill mix--future paediatric health care provision." J Nurs Manag. 4(3):: 127-31.
Needleman, J., Buerhaus, P., Mattke, S., Stewart, M. & Zelevinsky, K. (2002). "Nurse-staffing levels and the quality of care in hospitals." The New England journal of medicine 346(22): 1715-22.
Nelson E & C., L. (1993). "Patients' good and bad surprises: How do they relate to overall patient satisfaction?" Quality Review Bulletin 19: 89-94.
Nerney, M. P., Chin, M. H., Jin, L., Karrison, T. G., Walter, J., Mulliken, R., Miller, A., Hayley, D. C. & Friedmann, P. D. (2001). "Factors associated with older patients' satisfaction with care in an inner-city emergency department." Annals of Emergency Medicine 38(2): 140-5.
NSW, N. S. W. (2006). Clinical Services Redesign Program: Models of emergency care. North Sydney: NSW Health.
Oberst, M. (1984). "Patient's perception of care." Cancer 53: 2366-2375. O'Brien-Pallas, L., Doran, I., Murray, M., Cockerill, R., Sidan, i. S. & Laurie-Shaw, B. (2002).
"Evaluation of a client care delivery model, Part 2: Variability in client outcomes in community home nursing." Nursing economic$ 20: 13-23.
O'Connell, B., Young, J. & Twigg, D. (1999). "Patient satisfaction with nursing care: a measurement conundrum." International Journal of Nursing Practice 5(2): 72-7.
OHA (2003). Geriatric Emergency Management, Ontario Hospital Association. OHQC (2010). Ontario Health Quality Council, Quality Monitor 2010. Pasoe, G. C. (1983). "Patient satisaction in primary health care: A literature review and analysis."
Evaluation and Program Planning 6: 185-210. Piantadosi, S., Byar, D. P. & Green, S. B. (1988). "The Ecological Fallacy." American Journal of
Epidemoology 127, 5. PricewaterhouseCoopers (2008). NSW Health Emergency Department Workforce Research
Project Final Report. Raper, J. L. (1996). "A cognitive approach to patient satisfaction with emergency department
nursing care." Journal of Nursing Care Quality 10(4): 48-58. Risser, N. L. (1975). "Development of an instrument to measure patient satisfaction with nurses
and nursing care in primary care settings." Nursing research 24(1): 45-52.

141
RNAO (2005). "The 70 percent solution: A progress report on increasing full-time employment for Ontario RNs." Registered Nurses' Association of Ontario.
Rodi, S. W., Grau, M. V. & Orsini, C. M. (2006). "Evaluation of a fast track unit: alignment of resources and demand results in improved satisfaction and decreased length of stay for emergency department patients." Quality Management in Health Care 15(3): 163-70.
Rutledge, R., Osler, T. & Kromhout-Schiro, S. (1996). "Illness severity adjustments for outcomes analysis: validation of the ICISS methodology in all 821,455 patients hospitalized in North Carolina in 1996." Surgery 124(2): 187-94.
Sakr, M., Angus, J., Perrin, J., Nixon, C., Nicholl, J. & Wardrope, J. (1999). "Care of minor injuries by emergency nurse practitioners or junior doctors: a randomised controlled trial." The Lancet 354: 1321-1326.
Samuelson, P. A. & Nordhaus, W. D. (2001). Microeconomics, McGraw Hill. Sandovski, U., Salman, H., Bergman, M., Neiman, V., Bessler, H. & Djaldetti, M. (2001).
"Patients' satisfaction with the staff function in an emergency department." European Journal of Emergency Medicine 8(2): 117-22.
Schmidt, L. A. (2003). "Patients' perceptions of nursing care in the hospital setting." Journal of Advanced Nursing 44(4): 393-9.
Schmidt, L. A. (2004). "Patients' perceptions of nurse staffing, nursing care, adverse events, and overall satisfaction with the hospital experience." Nursing Economics 22(6): 295-306.
Schull, M. J., Slaughter, P. M. & Redelmeier, D. A. (2002). "Urban emergency department overcrowding: defining the problem and eliminating misconceptions." Canadian Journal of Emergency Medicine 4(2): 76-83.
Seago, J. A., Williamson, A. & Atwood, C. (2006). "Longitudinal analyses of nurse staffing and patient outcomes: more about failure to rescue." J Nurs Adm 36(1): 13-21.
Shortell, S. M., Zimmerman, J. E., Rousseau, D. M., Gillies, R. R., Wagner, D. P., Draper, E. A., Knaus, W. A. & Duffy, J. (1994). "The performance of intensive care units: does good management make a difference?" Medical care 32(5): 508-25.
Sinoff, G., Clarfield, A., Bergman, H. & Beaudet, M. (1998). "A two-year follow-up of Geriatric Consults In Emergency Departments." Journal of the American Geriatrics Society 46(6): 716-720.
Sitzia, J. & Wood, N. (1997). "Patient satisfaction: A review of issues and concepts." Social science & medicine 45: 1829-1843.
Sovie, M. D. & Jawad, A. F. (2001). "Hospital restructuring and its impact on outcomes: Nursing staff regulations are premature." Journal of Nursing Administration 31: 975-990.
Spetz, J., Seago JA, Coffman, J., Rosenoff, E. & O'Neil, E. (2000). "Minimum Nurse Staffing Ratios in California Acute Care Hospitals." Oakland,CA: Californai Health Care Foundation.
Staiger, D. O., Auerbach, D. I. & Buerhaus, P. I. (2012). "Registered Nurse Labour Supply and the Recession - Are we in a bubble?" The New England Journal of Medicine 10, 1055.
Strasen, L. (1989). "Incorporating Patient Satisfaction Standards Into Quality of Care Measures." Journal of Nursing Administration: 18(11): 5-6.
Strasser, S. & Davis, R. M. (1991). Measuring patient satisfaction for improved patient services, Ann Arbor: Health Administration Press.
Sun, B. C., Adams, J., Orav, E. J., Rucker, D. W., Brennan, T. A. & Burstin, H. R. (2000). "Determinants of patient satisfaction and willingness to return with emergency care.[see comment]." Annals of Emergency Medicine 35(5): 426-34.

142
Tabachnick, B. G. & Fidell, L. S. (1996). Using Multivariate Statistics, Harper Collins College Publishers (New York, NY).
Taylor, C. & Benger, J. R. (2004). "Patient satisfaction in emergency medicine." Emergency Medicine Journal 21(5): 528-32.
Thompson, D. A., Yarnold, P. R., Williams, D. R. & Adams, S. L. (1996). "Effects of actual waiting time, perceived waiting time, information delivery, and expressive quality on patient satisfaction in the emergency department." Annals of Emergency Medicine 28(6): 657-65.
Thungjaroenkul, P., Cummings, G. G. & Embleton, A. (2007). "The Impact of Nurse Staffing on Hospital Costs and Patient Length of Stay: A Systematic Review." Nursing Economics 25(5): 255-265.
Tibshirani, R. (1996). "Regression Shrinkage and Selection via the Lasso." Journal of the Royal Statistical Society, Series B (Methodological), Volume 58(1).
Tourangeau, A. (2002). "Nursing skill mix and experience reduce patient mortality." Hospital quarterly 5(3): 19-20.
Tye, C. C., Ross, F. & Kerry, S. M. (1998). "Emergency nurse practitioner services in major accident and emergency departments: a United Kingdom postal survey." Journal of Accident & Emergency Medicine 15: 31-34.
Tyrance, P. H., Jr., , Himmelstein, D. U. & Woolhandler, S. (1996). "US Emergency Department Costs: No Emergency." American Journal of Public Health 86(11): p. 1527 - 1531.
UHN (2011). H-SAA Amending Agreement. Agreement between Toronto Central Local Health Network and University Health Network.
Unruh, L. (2003). "Licensed nurse staffing and adverse events in hospitals." Medical care 41(1): 142-52.
Unruh, L. Y. & Fottler, M. D. (2006). "Patient Turnover and Nursing Staff Adequacy." Health Services Research 41(2): 599-612.
Vahey DC, e. a. (2004). "Nurse burnout and patient satisfaction." Med Care 42(2 Suppl):II57-66.
Van den Heede, K., Clarke, S. P., Sermeus, W., Vleugels, A. & Aiken, L. H. (2007). "International experts' perspectives on the state of the nurse staffing and patient outcomes literature." J Nurs Scholarsh 39(4)(J Nurs Scholarsh.): 290-7.
Van den Heede, K., Sermeus, W., Diya, L., Clarke, S. P., Lesaffre, E., Vleugels, A. & Aiken, L. H. (2009). "Nurse staffing and patient outcomes in Belgian acute hospitals: Cross-sectional analysis of administrative data." International Journal of Nursing Studies 46: 928–939.
Wallin, E., Lundergren, P., Ulander, K. & Holistein, C. (2000). "Does age, gender, or educational background affect patients' satisfaction with short stay surgery?" Ambulatory Surgery 8: 79-88.
Ware, J. E., Synder, M. K., Wright, W. R. & Allison, R. D. (1983). "Defining and measuring patient satisfaction with medical care." Evaluation and Program Planning 6: 247-263.
Williams, B. (1994). "Patient satisfaction:A valid concept?" Social science & medicine 38: 509-516.
Williams, R. M. & Bamezai, A. (2005). "The costs of visits to emergency departments - Revisited ." Annals of Emergency Medicine 46(5): p. 471-473.
Wolf, Z. R., Miller, P. A. & Devine, M. (2003). "Relationship between nurse caring and patient satisfaction in patients undergoing invasive cardiac procedures." MEDSURG Nursing 12(6): 391-6.

143
Yankovic, N. & Green, L. V. (2008). ""A Queueing Model for Nurse Staffing" Working Paper." Columbia University.
Yoon, P. (2003). Emergency Department Fast Track System, Alberta Heritage Foundation for Medical Research.

144
Appendix A. Literature Review Search Identification of papers for review The search strategy used to identify pertinent literature was based on the conceptual
model. An iterative process was developed using the results of the broader search to
identify sub-categories of staff mix and patient outcomes. Table 1 shows the final text-
word query and describes the strategies for the research questions. The same eligibility
criteria, selection of studies, and analysis were used to examine the association
between nurse staffing and patient outcomes.
Studies were sought from a wide variety of sources, including MEDLINE®,
PubMed®, CINAHL, EBSCO research database, Canadian Institute for Health
Information (CIHI) reports, federal reports, and Digital Dissertations. In addition to
traditional medical databases, alternative databases of associated literature were also
searched. Structured Internet searches were conducted for organizations that perform
relevant research, such as the National Database of Nursing Quality Indicators, National
Center for Health Workforce Analysis, American Nurses Association, Canadian Nurse
Association, Emergency Nurse Association, Registered Nursing Association of Ontario,
Canadian Practical Nurse Association, Practical Nurse Association of Ontario,
Registered American Academy of Nurse Practitioners, and Provincial Ministry of Health
and Long-Term Care.

145
Table A1. Search Strategy and Data Sources
Search Strategy Data Sources
Text-word queries for “staff mix models” or “models of nursing” or “nurse staffing strategies” or “patient satisfaction” were combined with subject queries for “urgent care centres” or “ambulatory care facilities” or “walk-in clinics” or “hospitals” or “emergency medical services” or “Accident and Emergency Departments” or their equivalents
• Medline (1980 – 2012) • HealthStar (1980 – 2012) • Social Science Abstracts (1980 – 2012) • Pubmed (1980 – 2012) • EMBASE (1980 – 2012) • (PAIS) (1980 – 2012) • Consolidated International Nursing and Allied Health Sciences
Library (CINAHL) (1980-2012) electronic databases • Web-Science (1980 – 2012)
Searches of complete volumes published between 1980—2012 • Healthcare Management Review • The Journal of Ambulatory Care Management • The Canadian Journal of Emergency Medicine • American Journal of Emergency Medicine • Journal of Accident and Emergency Medicine • Journal of Emergency Nursing • Academic Emergency Medicine • Annals of Emergency Medicine
Searches of the on-line documents published between 1980—2012 • Searches of the on-line government documents • Searches of web-sites for documents on Emergency Department
staffing in Canada, United States, United Kingdom, Australia and New Zealand
• Searches of the Proquest Digital Dissertation Abstracts (1975 to 2011) for dissertations on either Emergency Departments, Nurse Staffing, Searches of on-line catalogues at the University of Toronto and The Institute for Clinical Evaluative Sciences in Ontario
Gleaning of the reference lists of articles eventually selected for this review
Personal communication with hospital managers of Ontario emergency departments, Ontario Ministry of Health and Long-Term Care, and the Ontario Nursing Secretariat.
Eligibility
Abstracts were reviewed to exclude studies with ineligible target populations.
Reviews, letters, comments, legal cases, and editorials were also excluded. The full
texts of the original epidemiologic studies were examined to define eligible independent
variables (nurse staffing and strategies) and patient satisfaction.
Studies outside of the emergency department were included, but studies were
excluded if they did not test the associative hypotheses and did not provide adequate

146
information on tested hypotheses. Inclusion criteria were applied to select articles for full
review. Studies needed to meet one of the following criteria:
• Retrospective observational cohort studies and retrospective cross sectional
comparisons;
• Administrative cross-sectional survey and analyses;
• Evaluates the associations between nurse staffing and patient;
• Satisfaction/nurse quality measures among eligible target populations (either
patients hospitalized in acute care hospitals or emergency department
patients); or
• Ecologic studies on correlations between nurse staffing and patient
satisfaction.
During the period of 1980 to 2012, there were potentially relevant documents that
explored nursing staffing and patient outcomes, but few studies were found that focused
on the emergency department setting. Documents written in the English language and
restricted to publications on nursing staffing and outcomes in Canada, the United States
of America, the United Kingdom, Australia and New Zealand were considered. This
broad search, which included inpatient units as well as the emergency department,
identified key elements of heterogeneity. The articles were classified by the following
themes:
• Emergency department nurse staffing;
• Emergency department patient satisfaction; and
• Nursing Staffing and patient satisfaction (inpatient units).
Abstraction forms were used to collect the data and the bibliographic information was
manipulated using Thomas ISI ResearchSoft EndNote (Version 6) reference manager

147
program. A log of ineligible studies was created using custom fields in the EndNote
library. The log includes the reasons why studies are deemed ineligible (Petitti, 1994).
In total, 251 papers were selected for this review and are categorized as shown
in Table 2.
Table A2. Paper selected by categories
Topic of Paper # of Articles # of Articles Selected
Nurse staffing 323 119
Patient satisfaction 231 132
Total 554 251

148
Appendix B. Outcomes Model for Healthcare Research
Figure B-1 Outcomes Model for Healthcare Research
Health Facility Environment • Mission
Size Teaching Status Location Funding Status
• Organizational Structure • Leadership
Unit Qualities • Culture
RN-MD relationships Control over practice Autonomy
• Leadership • RN-Patient interaction • RN staffing • Staff mix
The Effect of Nursing Care on Outcomes
Nursing Qualities • Intrinsic
Critical thinking skills Communication skills Compassion/caring Professionalism Stress/Fatigue Competency
• Extrinsic Experience Education Age Physical ability Certification
Patient Qualities • Acuity level • Disease • Patient-Family dynamics
Nursing Care • Caregiver
Dependency Comfort Education Therapeutics Monitoring/
Surveillance • Integrator
Nurse/Patient Nurse-to-patient Nurse/Physician Nurse/
Other Caregivers
Outcomes • Facility • Unit • Nurse • Patient

149
Appendix C. Quality of Care—Dynamic Model
Table C-1 Components and Variables of the Model Components of the Model Variables System Includes the traditional structure variables: size
of the organization, ownership, nurse skill mix, client demographics, and technology.
Client Client health, demographics, and disease risk factors.
Interventions Clinical processes and activities that contribute to the outcomes.
Outcomes Results of care structures and processes: achievement of appropriate self-care, demonstration of health promoting behaviours, health-related quality of life, perception of being well cared for, and symptom management.

150
Appendix D. Theoretical Model of the Relationships between Context, Structure (professional practice), and Effectiveness
(outcomes)
Components and Variables of the Model
Components of the Model Variables Nurse Experience level, knowledge, and skill level. Organizational Measures of availability of nursing staff (e.g., staff mix, daily
staffing levels, nurse/patient ratios) and nurse assignment patterns (e.g., functional nursing, team nursing, primary or modular nursing).
Structure
Patient Age, physical function at admission, severity of presenting problem, and co-morbidity.
Nurses’ Independence Role
Roles for which nurses are held accountable. These include the activities of assessment, decision making, intervention, and follow-up. Nurse-initiated treatments are also included (e.g., physiological comfort promotion, coping assistance, self-care facilitation, activity and exercise enhancement, immobility management, and nutritional support). Outcomes affected include symptom control, functional health status, and knowledge of self-care strategies.
Nurses’ Dependence Role
Functions and responsibilities associated with implementing medical orders and medical treatments initiated by the physician. Outcomes affected include adverse events such as medication errors.
Process
Nurses’ Interdependence Role
Activities and functions that are partially or totally dependent on the functions of other health providers. These include monitoring and reporting of changes in the patient’s health conditions and coordinating health services. Outcomes affected are the quality of intra-team and interprofessional communication and coordinating care.
Outcomes Nurse-sensitive patient outcomes
General patient state, behaviour, or perception resulting from nursing interventions. Outcomes include prevention of complications (such as nosocomial infections), symptom control, functional health outcomes, and satisfaction with care and cost.
Hospital Characteristics
Technological Complexity Case Mix Index Teaching Status
Admission Volatility Size
Nursing Unit Characteristics
Experience Education Skill Mix Unit Size
Support Services Patient Technology
Organizational Outcomes
Nursing Work Satisfaction Nursing Turnover
Patient Length of Stay
Patient Outcomes
Patient Satisfaction Medication Errors
Patient Falls
PROFESSIONAL
PRATICE
CONTEXT STRUCTURE EFFECTIVENESS

151
Appendix E. NRC+Picker Sampling Plan The Survey Process
Sampling Plan Participating hospital corporations and NRC+Picker collaboratively established a sampling plan. Deciding factors influencing the agreed-upon sampling plan included budget, achieving reasonable response rates, and which sites within the corporation were of primary interest. Hospitals were then charged with the responsibility of sending patient data files to NRC+Picker every month. Patient satisfaction data were collected for all 12 months of each fiscal year. Then, according to each hospital’s sampling plan, a random sample was drawn from the patient data files, and surveys were mailed. Questionnaires were not sent to deceased patients, psychiatric patients, infants less than 10 days old, patients with no fixed address, or patients who presented with sexual assault or other sensitive issues.
Mailing of Questionnaires Included in each patient mailing were an explanatory cover letter, a return envelope (postage-paid), and the questionnaire itself. The first mailing went out within a couple of weeks of NRC’s reception of a hospital’s monthly patient data file. To increase response rates, there was a second wave of mailings to patients whose first questionnaires were not returned within three weeks of the original mailing date.
Inclusion/Exclusion Criteria Surveys that were returned without a single valid response were treated as non-responses and dropped from the analysis. If a record had no valid responses to any of the evaluative questions on the questionnaire (i.e. it only had responses to demographic-type questions), then it was seen as having insufficient data and was excluded from the subsequent analysis.

152
Appendix F. OHRS Staffing Accounts
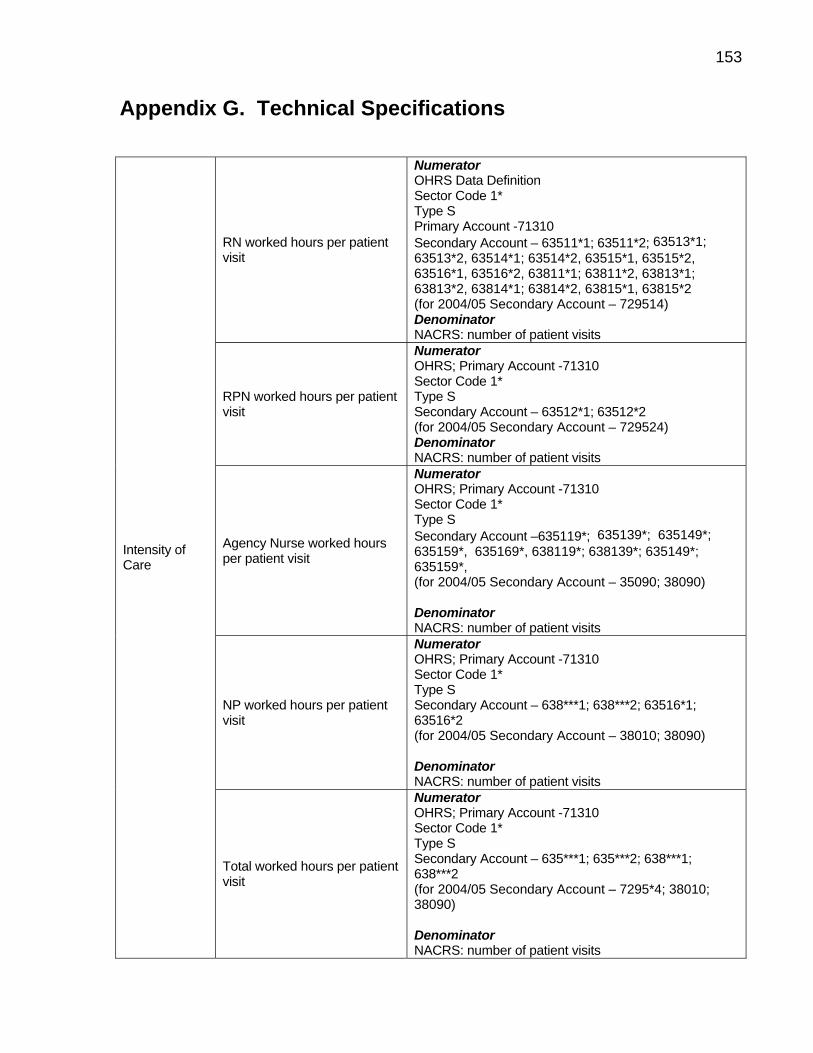
153
Appendix G. Technical Specifications
RN worked hours per patient visit
Numerator OHRS Data Definition Sector Code 1* Type S Primary Account -71310 Secondary Account – 63511*1; 63511*2; 63513*1; 63513*2, 63514*1; 63514*2, 63515*1, 63515*2, 63516*1, 63516*2, 63811*1; 63811*2, 63813*1; 63813*2, 63814*1; 63814*2, 63815*1, 63815*2 (for 2004/05 Secondary Account – 729514) Denominator NACRS: number of patient visits
RPN worked hours per patient visit
Numerator OHRS; Primary Account -71310 Sector Code 1* Type S Secondary Account – 63512*1; 63512*2 (for 2004/05 Secondary Account – 729524) Denominator NACRS: number of patient visits
Agency Nurse worked hours per patient visit
Numerator OHRS; Primary Account -71310 Sector Code 1* Type S Secondary Account –635119*; 635139*; 635149*; 635159*, 635169*, 638119*; 638139*; 635149*; 635159*, (for 2004/05 Secondary Account – 35090; 38090) Denominator NACRS: number of patient visits
NP worked hours per patient visit
Numerator OHRS; Primary Account -71310 Sector Code 1* Type S Secondary Account – 638***1; 638***2; 63516*1; 63516*2 (for 2004/05 Secondary Account – 38010; 38090) Denominator NACRS: number of patient visits
Intensity of Care
Total worked hours per patient visit
Numerator OHRS; Primary Account -71310 Sector Code 1* Type S Secondary Account – 635***1; 635***2; 638***1; 638***2 (for 2004/05 Secondary Account – 7295*4; 38010; 38090) Denominator NACRS: number of patient visits

154
RN proportion (RN worked hours divided by total staff worked hours)
Numerator OHRS Data Definition Sector Code 1* Type S Primary Account -71310 Secondary Account – 63511*1; 63511*2; 63513*1; 63513*2, 63514*1; 63514*2, 63515*1, 63515*2, 63516*1, 63516*2, 63811*1; 63811*2, 63813*1; 63813*2, 63814*1; 63814*2, 63815*1, 63815*2 (for 2004/05 Secondary Account – 729514) Denominator OHRS Data Definition Sector Code 1* Type S Primary Account -71310 Secondary Account – 635***1; 635***2; 638***1; 638***2 (for 2004/05 Secondary Account – 7295*4, 38010 38090)
RPN proportion (RPN worked hours divided by total staff worked hours)
Numerator OHRS Data Definition Sector Code 1* Type S Primary Account -71310 Secondary Account – 63512*1; 63512*2; (for 2004/05 Secondary Account – 729524) Denominator OHRS Data Definition Sector Code 1* Type S Primary Account -71310 Secondary Account – 635***1; 635***2; 638***1; 638***2 (for 2004/05 Secondary Account – 7295*4, 38010 38090)
Skill Mix
Agency Nurse proportion (Agency nurse worked hours divided by total staff worked hours)
Numerator OHRS Data Definition Sector Code 1* Type S Primary Account -71310 Secondary Account – 635119*; 635139*; 635149*; 635159*, 635169*, 638119*; 638139*1; 638149*; 638159* Denominator OHRS Data Definition Sector Code 1* Type S Primary Account -71310 Secondary Account – 635***1; 635***2; 638***1; 638***2 (for 2004/05 Secondary Account – 7295*4, 38010 38090)

155
Skill Mix NP proportion (NP worked hours divided by total staff worked hours)
Numerator OHRS Data Definition Sector Code 1* Type S Primary Account -71310 Secondary Account –638***1; 638***2; 63516*1; 63516*2 (for 2004/05 Secondary Account – 38010; 38090) Denominator OHRS Data Definition Sector Code 1* Type S Primary Account -71310 Secondary Account – 635***1; 635***2; 638***1; 638***2 (for 2004/05 Secondary Account – 7295*4; 38010 38090)
RN Staff to Patient Ratio (number of RN staff / number of patients)
Numerator OHRS Data Definition Sector Code 1* Type S Primary Account -71310 Secondary Account –63511*; 63513*; 63514*; 63515*, 63516*, 63811*; 63813*; 63814*; 63815* (for 2004/05 Secondary Account – 72951*) Divided by 1950 Denominator NACRS: number of patient visits
RPN Staff to Patient Ratio (number of RPN staff / number of patients)
Numerator OHRS Data Definition Sector Code 1* Type S Primary Account -71310 Secondary Account – 63512* (for 2004/05 Secondary Account – 72952*) Divided by 1950 Denominator NACRS; Number of patient visits
Staff Adequacy
Agency Nurse Staff to Patient Ratio (number of Agency Nurse staff / number of patients) (NB: agency nurses report only worked hours)
Numerator OHRS Data Definition Sector Code 1* Type S Primary Account -71310 Secondary Account – 635119*; 635139*; 635149*; 635159*, 635169*, 638119*; 638139*; 638149*; 638159*, 638169* (for 2004/05 Secondary Account – 35090; 38090) Divided by 1950 Denominator NACRS; Number of patient visits

156
NP Staff to Patient Ratio (number of NP staff / number of patients)
Numerator OHRS Data Definition Sector Code 1* Type S Primary Account -71310 Secondary Account – 638*; 63516* (for 2004/05 Secondary Account – 380*) Divided by 1950 Denominator NACRS; Number of patient visits Staff
Adequacy
Total Staff to Patient Ratio (total number of patient care staff / number of patients)
Numerator OHRS Data Definition Sector Code 1* Type S Primary Account -71310 Secondary Account – 635*; 638* (for 2004/05 Secondary Account – 7295*; 380&) Divided by 1950 Denominator NACRS; Number of patient visits

157
Appendix H. NACRS Database
The National Ambulatory Care Reporting System (NACRS) was developed by
the Canadian Institute for Health Information (CIHI) in consultation with clinicians and
managers. The NACRS is a data collection tool designed to capture information on
client visits to facility- and community-based ambulatory care. The data set provides
information on the type of patients seen in EDs, the type of care provided, and the
outcomes of care. The database includes: demographic data, clinical data,
administrative data, financial data, and service-specific data elements.
The Ontario Ministry of Health and Long-Term Care mandated all Ontario EDs to
begin reporting clinical activity using NACRS effective July, 2000. Every time a patient
is registered at an Ontario ED, a NACRS record or abstract is generated for that visit
and submitted to CIHI. The NACRS Abstract is the record of ambulatory care visit
activity that is submitted to CIHI’s NACRS database from each facility. Each abstract is
associated with a client visit and contains a list of the relevant data elements to be
submitted to the NACRS for that client visit.
All abstracts sent to the NACRS contain an MIS (Management Information
System) functional centre to determine the functional centre where the activity occurred.
Prior to 2006–2007, a multiple contact record (MCR) was created when an Allied Health
Professional (AHP) outside of the mandated MIS functional centre in which the visit
occurred provides care and/or treatment. MCRs were discontinued in the 2006–2007
reporting year. Hospitals were instructed to collect AHP care on the main visit abstract.
In FY 2002–2003, NACRS was re-engineered to collect diagnosis- and
intervention-related information solely in the ICD-10-CA/CCI coding system. The

158
enhanced ICD-10-CA replaces the earlier 9th Revision of the International Statistical
Classification of Diseases (ICD-9). The Canadian Classification of Health Interventions
(CCI) contains a comprehensive list of diagnostic, therapeutic, and support
interventions, and replaces the Canadian Classification of Diagnostic, Therapeutic, and
Surgical Procedures (CCP) and the ICD-9-Clinical Modification (ICD-9-CM) intervention
codes. In fiscal year 2001-2002, NACRS diagnosis and intervention coding were
classified using the ICD-9-CM/CCP classification system. Since then, all clinical data
submitted to the NACRS has been coded in ICD-10-CA/CCI.
The postal code is a common variable in almost all CIHI databases. Along with
the PCCF (Postal Code Conversion File), any standard geographical classification can
be obtained, making it possible to compare with other databases. The forward sortation
area (first three digits of a postal code) is typically the lowest level of aggregation
normally available to external users under CIHI’s Privacy and Confidentiality Policy.

159
Appendix I. Patient Satisfaction Descriptive Statistics
25,184 0 100 80.46 29.775 -1.254 .015 .531 .03125,481 0 100 79.49 30.450 -1.203 .015 .378 .03125,281 0 100 79.63 30.238 -1.201 .015 .385 .03124,918 0 100 79.47 30.416 -1.198 .016 .368 .03131,308 0 100 79.74 30.317 -1.218 .014 .419 .028
132,172 0 100 79.75 30.246 -1.215 .007 .415 .01318,632 0 100 60.89 39.758 -.409 .018 -1.307 .03618,489 0 100 60.22 39.926 -.383 .018 -1.334 .03618,235 0 100 60.01 39.800 -.373 .018 -1.330 .03618,238 0 100 59.44 40.016 -.353 .018 -1.356 .03622,932 0 100 60.64 39.766 -.399 .016 -1.314 .03296,526 0 100 60.26 39.851 -.384 .008 -1.328 .01633,515 0 100 83.50 27.997 -1.487 .013 1.232 .02733,861 0 100 83.06 28.081 -1.431 .013 1.066 .02733,542 0 100 83.04 28.272 -1.447 .013 1.104 .02732,844 0 100 82.64 28.707 -1.432 .014 1.039 .02741,067 0 100 82.88 28.541 -1.449 .012 1.097 .024
174,829 0 100 83.02 28.329 -1.449 .006 1.107 .01233,619 0 100 90.97 24.186 -2.702 .013 6.400 .02733,927 0 100 90.14 25.241 -2.553 .013 5.519 .02733,673 0 100 90.72 24.519 -2.657 .013 6.122 .02732,990 0 100 90.62 24.583 -2.633 .013 5.997 .02741,183 0 100 90.63 24.648 -2.641 .012 6.024 .024
175,392 0 100 90.62 24.641 -2.636 .006 6.004 .01233,669 0 100 71.71 25.515 -.743 .013 .065 .02734,059 0 100 71.18 25.700 -.713 .013 -.009 .02733,757 0 100 71.51 25.767 -.723 .013 -.012 .02733,082 0 100 71.04 25.809 -.729 .013 .024 .02741,276 0 100 71.63 25.692 -.757 .012 .092 .024
175,843 0 100 71.43 25.697 -.734 .006 .034 .01233,658 0 100 61.52 28.573 -.372 .013 -.631 .02733,963 0 100 61.17 28.868 -.368 .013 -.652 .02733,709 0 100 61.48 28.711 -.377 .013 -.633 .02732,987 0 100 60.88 28.895 -.372 .013 -.646 .02741,261 0 100 61.62 28.746 -.393 .012 -.616 .024
175,578 0 100 61.35 28.759 -.377 .006 -.635 .01233,389 0 100 69.40 25.913 -.619 .013 -.150 .02733,729 0 100 69.31 25.964 -.609 .013 -.183 .02733,465 0 100 69.90 26.036 -.633 .013 -.169 .02732,798 0 100 69.76 26.081 -.646 .014 -.131 .02741,019 0 100 70.18 26.105 -.677 .012 -.087 .024
174,400 0 100 69.73 26.025 -.638 .006 -.143 .01233,987 0 100 67.07 28.430 -.623 .013 -.377 .02734,254 0 100 66.88 28.600 -.604 .013 -.425 .02634,043 0 100 67.27 28.569 -.624 .013 -.398 .02733,403 0 100 66.61 28.828 -.621 .013 -.407 .02741,748 0 100 67.48 28.487 -.655 .012 -.330 .024
177,435 0 100 67.08 28.579 -.627 .006 -.386 .01233,926 0 100 73.14 34.164 -.892 .013 -.422 .02734,191 0 100 72.52 34.355 -.860 .013 -.480 .02633,968 0 100 73.19 34.163 -.895 .013 -.417 .02733,270 0 100 72.60 34.623 -.875 .013 -.479 .02741,620 0 100 73.39 34.202 -.910 .012 -.399 .024
176,975 0 100 72.99 34.298 -.887 .006 -.438 .012
Year2005/2006YE2006/2007YE2007/2008YE2008/2009YE2009/2010YETotal2005/2006YE2006/2007YE2007/2008YE2008/2009YE2009/2010YETotal2005/2006YE2006/2007YE2007/2008YE2008/2009YE2009/2010YETotal2005/2006YE2006/2007YE2007/2008YE2008/2009YE2009/2010YETotal2005/2006YE2006/2007YE2007/2008YE2008/2009YE2009/2010YETotal2005/2006YE2006/2007YE2007/2008YE2008/2009YE2009/2010YETotal2005/2006YE2006/2007YE2007/2008YE2008/2009YE2009/2010YETotal2005/2006YE2006/2007YE2007/2008YE2008/2009YE2009/2010YETotal2005/2006YE2006/2007YE2007/2008YE2008/2009YE2009/2010YETotal
ANSWER
EXPLAIN
TRUST
RESPECT
COURTESY
AVAILABILITY
DRNURSEWK
EDSAT
EDREC
N Minimum Maximum Mean Std. Deviation Skewness
Std. Errorof
Skewness Kurtosis
Std. Errorof
Kurtosis

160
Analysis of Variance Between Groups: Year
ANOVA Table
16597.103 4 4149.276 4.536 .0011.2E+008 132167 914.6971.2E+008 132171
24258.606 4 6064.651 3.819 .0041.5E+008 96521 1587.9411.5E+008 96525
13439.615 4 3359.904 4.187 .0021.4E+008 174824 802.5001.4E+008 174828
12115.750 4 3028.938 4.989 .0011.1E+008 175387 607.1011.1E+008 175391
11601.459 4 2900.365 4.392 .0011.2E+008 175838 660.3101.2E+008 175842
12990.466 4 3247.616 3.927 .0031.5E+008 175573 827.0371.5E+008 175577
19108.316 4 4777.079 7.054 .0001.2E+008 174395 677.2221.2E+008 174399
16472.170 4 4118.042 5.042 .0001.4E+008 177430 816.7101.4E+008 177434
21411.379 4 5352.845 4.551 .0012.1E+008 176970 1176.2482.1E+008 176974
(Combined)Between GroupsWithin GroupsTotal
(Combined)Between GroupsWithin GroupsTotal
(Combined)Between GroupsWithin GroupsTotal
(Combined)Between GroupsWithin GroupsTotal
(Combined)Between GroupsWithin GroupsTotal
(Combined)Between GroupsWithin GroupsTotal
(Combined)Between GroupsWithin GroupsTotal
(Combined)Between GroupsWithin GroupsTotal
(Combined)Between GroupsWithin GroupsTotal
ANSWER * Year
EXPLAIN * Year
TRUST * Year
RESPECT * Year
COURTESY * Year
AVAILABILITY * Year
DRNURSEWK * Year
EDSAT * Year
EDREC * Year
Sum ofSquares df Mean Square F Sig.
Note: Unit Patient level unit of analysis
Analysis of Variance Between Groups: Patient Age Group
ANOVA Table
3250639 5 650127.779 730.288 .0001.2E+008 132166 890.2341.2E+008 1321711273013 5 254602.661 161.650 .000
1.5E+008 96520 1575.0201.5E+008 965253910838 5 782167.588 1002.507 .000
1.4E+008 174823 780.2111.4E+008 174828617086.8 5 123417.368 204.450 .0001.1E+008 175386 603.6551.1E+008 1753912199579 5 439915.809 679.018 .000
1.1E+008 175837 647.8701.2E+008 1758422895794 5 579158.782 714.462 .000
1.4E+008 175572 810.6221.5E+008 1755772870145 5 574028.940 868.586 .000
1.2E+008 174394 660.8781.2E+008 1743993999832 5 799966.326 1007.180 .000
1.4E+008 177429 794.2641.4E+008 17743410763449 5 2152689.818 1929.705 .0002.0E+008 176969 1115.5542.1E+008 176974
(Combined)Between GroupsWithin GroupsTotal
(Combined)Between GroupsWithin GroupsTotal
(Combined)Between GroupsWithin GroupsTotal
(Combined)Between GroupsWithin GroupsTotal
(Combined)Between GroupsWithin GroupsTotal
(Combined)Between GroupsWithin GroupsTotal
(Combined)Between GroupsWithin GroupsTotal
(Combined)Between GroupsWithin GroupsTotal
(Combined)Between GroupsWithin GroupsTotal
ANSWER * Patagegrp
EXPLAIN * Patagegrp
TRUST * Patagegrp
RESPECT * Patagegrp
COURTESY * Patagegrp
AVAILABILITY * Patagegrp
DRNURSEWK *Patagegrp
EDSAT * Patagegrp
EDREC * Patagegrp
Sum ofSquares df Mean Square F Sig.
Note: Unit Patient level unit of analysis

161
Analysis of Variance Between Groups: Patient Age Group
ANOVA Table
172044.4 1 172044.379 188.335 .0001.2E+008 132170 913.5001.2E+008 132171153037.1 1 153037.112 96.459 .0001.5E+008 96524 1586.5581.5E+008 96525455383.5 1 455383.527 569.259 .0001.4E+008 174827 799.9581.4E+008 174828
131.999 1 131.999 .217 .6411.1E+008 175390 607.1591.1E+008 175391338293.3 1 338293.298 513.780 .0001.2E+008 175841 658.4411.2E+008 175842403977.3 1 403977.336 489.791 .0001.4E+008 175576 824.7961.5E+008 175577211113.1 1 211113.126 312.247 .0001.2E+008 174398 676.1091.2E+008 174399318451.0 1 318450.984 390.740 .0001.4E+008 177433 814.9941.4E+008 177434346547.4 1 346547.413 295.087 .0002.1E+008 176973 1174.3902.1E+008 176974
(Combined)Between GroupsWithin GroupsTotal
(Combined)Between GroupsWithin GroupsTotal
(Combined)Between GroupsWithin GroupsTotal
(Combined)Between GroupsWithin GroupsTotal
(Combined)Between GroupsWithin GroupsTotal
(Combined)Between GroupsWithin GroupsTotal
(Combined)Between GroupsWithin GroupsTotal
(Combined)Between GroupsWithin GroupsTotal
(Combined)Between GroupsWithin GroupsTotal
ANSWER * patgender
EXPLAIN * patgender
TRUST * patgender
RESPECT * patgender
COURTESY * patgender
AVAILABILITY * patgender
DRNURSEWK *patgender
EDSAT * patgender
EDREC * patgender
Sum ofSquares df Mean Square F Sig.
Note: Unit Patient level unit of analysis

162
Appendix J. Patient Satisfaction Principal Component Analysis
Inter-Item Correlation Matrix
1.000 .652 .707 .307 .653 .591 .557.652 1.000 .665 .243 .665 .631 .574.707 .665 1.000 .310 .656 .568 .549.307 .243 .310 1.000 .363 .275 .264.653 .665 .656 .363 1.000 .768 .699.591 .631 .568 .275 .768 1.000 .679.557 .574 .549 .264 .699 .679 1.000
ANSWEREXPLAINTRUSTRESPECTCOURTESYAVAILABILITYDRNURSEWK
ANSWER EXPLAIN TRUST RESPECT COURTESY AVAILABILITY DRNURSEWK
Note: Unit Patient level unit of analysis
PCA with All Items
Total Variance Explained
4.363 62.327 62.327 4.363 62.327 62.327.857 12.244 74.571.596 8.515 83.086.357 5.100 88.185.322 4.597 92.782.291 4.154 96.937.214 3.063 100.000
Component1234567
Total % of Variance Cumulative % Total % of Variance Cumulative %Initial Eigenvalues Extraction Sums of Squared Loadings
Extraction Method: Principal Component Analysis.

163
Item-Total Statistics
443.4463 16567.080 .747 .594 .871458.9694 15593.625 .737 .580 .873440.4767 16497.457 .743 .601 .872433.2204 19606.212 .348 .147 .913452.0657 16522.159 .828 .714 .863462.0772 16283.754 .753 .646 .870454.0009 17107.328 .708 .552 .876
ANSWEREXPLAINTRUSTRESPECTCOURTESYAVAILABILITYDRNURSEWK
Scale Mean ifItem Deleted
ScaleVariance if
Item Deleted
CorrectedItem-TotalCorrelation
SquaredMultiple
Correlation
Cronbach'sAlpha if Item
Deleted
Note: Unit Patient level unit of analysis
PCA Excluding RESPECT
Total Variance Explained
4.212 70.193 70.193 4.212 70.193 70.193.595 9.922 80.115.360 5.993 86.108.325 5.412 91.520.291 4.858 96.377.217 3.623 100.000
Component123456
Total % of Variance Cumulative % Total % of Variance Cumulative %Initial Eigenvalues Extraction Sums of Squared Loadings
Extraction Method: Principal Component Analysis.

164
PCA Excluding RESPECT
Item-Total Statistics
352.3596 14062.776 .749 .593 .898367.8661 13066.171 .755 .579 .899349.3969 14001.706 .745 .600 .899360.9863 14063.204 .825 .706 .889370.9811 13758.497 .765 .647 .896362.9067 14533.346 .717 .553 .903
ANSWEREXPLAINTRUSTCOURTESYAVAILABILITYDRNURSEWK
Scale Mean ifItem Deleted
ScaleVariance if
Item Deleted
CorrectedItem-TotalCorrelation
SquaredMultiple
Correlation
Cronbach'sAlpha if Item
Deleted
Note: Unit Patient level unit of analysis

165
Appendix K. Patient Satisfaction Correlation Table
1.000 .654** .709** .307** .654** .593** .557** .572** .518** .829**.000 .000 .000 .000 .000 .000 .000 .000 .000
173,674 170,793 171,880 171,619 171,849 171,925 169,941 170,715 170,311 166,046.654** 1.000 .667** .242** .664** .632** .573** .583** .502** .846**.000 .000 .000 .000 .000 .000 .000 .000 .000
173,674 172,135 170,513 170,406 170,512 170,673 169,057 169,434 169,046 166,046.654** .667** 1.000 .308** .659** .573** .549** .567** .529** .827**.000 .000 .000 .000 .000 .000 .000 .000 .000
170,793 170,513 174,829 172,644 172,830 172,702 169,839 171,643 171,228 166,046.307** .242** .308** 1.000 .361** .273** .261** .277** .236** .348**.000 .000 .000 .000 .000 .000 .000 .000 .000
171,619 170,406 172,644 175,392 173,218 173,008 170,220 172,183 171,728 165,189.654** .664** .659** .361** 1.000 .770** .698** .708** .548** .878**.000 .000 .000 .000 .000 .000 .000 .000 .000
171,849 170,512 172,830 173,218 175,843 173,834 170,541 172,642 172,078 166,046.593** .632** .573** .273** .770** 1.000 .680** .703** .576** .843**.000 .000 .000 .000 .000 .000 .000 .000 .000
171,925 170,673 172,702 173,008 173,834 175,578 170,431 172,421 171,929 166,046.557** .573** .549** .261** .698** .680** 1.000 .801** .644** .801**.000 .000 .000 .000 .000 .000 .000 .000 .000
169,941 169,057 169,839 170,220 170,541 170,431 174,400 172,307 171,980 166,046.572** .583** .567** .277** .708** .703** .801** 1.000 .719** .778**.000 .000 .000 .000 .000 .000 .000 .000 .000
170,715 169,434 171,643 172,183 172,642 172,421 172,307 177,435 174,559 164,371.518** .502** .529** .236** .548** .576** .644** .719** 1.000 .656**.000 .000 .000 .000 .000 .000 .000 .000 .000
170,311 169,046 171,228 171,728 172,078 171,929 171,980 174,559 176,975 164,050.829** .846** .827** .348** .878** .843** .801** .778** .656** 1.000.000 .000 .000 .000 .000 .000 .000 .000 .000
166,046 166,046 166,046 165,189 166,046 166,046 166,046 164,371 164,050 166,046
Pearson CorrelationSig. (2-tailed)NPearson CorrelationSig. (2-tailed)NPearson CorrelationSig. (2-tailed)NPearson CorrelationSig. (2-tailed)NPearson CorrelationSig. (2-tailed)NPearson CorrelationSig. (2-tailed)NPearson CorrelationSig. (2-tailed)NPearson CorrelationSig. (2-tailed)NPearson CorrelationSig. (2-tailed)NPearson CorrelationSig. (2-tailed)N
ANSWER
EXPLAIN
TRUST
RESPECT
COURTESY
AVAILABILITY
DRNURSEWK
EDSAT
EDREC
Satisfaction withNursing (AggregateScore)
ANSWER EXPLAIN TRUST RESPECT COURTESY AVAILABILITY DRNURSEWK EDSAT EDREC
Satisfactionwith Nursing(Aggregate
Score)
Correlation is significant at the 0.01 level (2-tailed).**.
Note: Unit Patient level unit of analysis

166
Appendix L. Nursing Staffing Categories by Hospital Type Number of Hospitals (Percent of Total Number)
Peer Group Year # of Hospitals
RN RPN NP Agency Nurse
Large Community 2005/06 57 57 (100%) 48 (84%) 7 (12%) 15 (26%) Large Community 2006/07 58 58 (100%) 50 (86%) 8 (14%) 21 (36%) Large Community 2007/08 61 61 (100%) 57 (93%) 15 (25%) 20 (33%) Large Community 2008/09 61 61 (100%) 59 (97%) 15 (25%) 18 (30%) Large Community 2009/10 61 61 (100%) 57 (93%) 17 (28%) 20 (33%) Small 2005/06 24 24 (100%) 12 (50%) 0 (0%) 0 (0%) Small 2006/07 27 27 (100%) 14 (52%) 1 (4%) 0 (0%) Small 2007/08 26 26 (100%) 13 (50%) 1 (4%) 0 (0%) Small 2008/09 22 22 (100%) 15 (68%) 2 (9%) 1 (5%) Small 2009/10 24 24 (100%) 16 (67%) 2 (8%) 1 (4%) Teaching 2005/06 15 15 (100%) 8 (53%) 6 (40%) 6 (40%) Teaching 2006/07 15 15 (100%) 10 (67%) 5 (33%) 6 (40%) Teaching 2007/08 16 16 (100%) 7 (44%) 6 (38%) 6 (38%) Teaching 2008/09 16 16 (100%) 8 (50%) 5 (31%) 6 (38%) Teaching 2009/10 16 16 (100%) 8 (50%) 10 (63%) 8 (50%) Note: Unit ED level unit of analysis

167
Appendix M. Staffing Variables Correlation Table
Variable NURSEAGE NURSEED NURSEEXP PERFEMNURSE PERFTHRS
Pearson Correlation 1 -.512(**) .959(**) .394(**) -.205(**)
Sig. (2-tailed) 0.000 0.000 0.000 0.000Pearson Correlation -.512(**) 1 -.521(**) -.336(**) .206(**)
Sig. (2-tailed) 0.000 0.000 0.000 0.000Pearson Correlation .959(**) -.521(**) 1 .425(**) -.251(**)
Sig. (2-tailed) 0.000 0.000 0.000 0.000Pearson Correlation .394(**) -.336(**) .425(**) 1 -.168(**)
Sig. (2-tailed) 0.000 0.000 0.000 0.000Pearson Correlation -.205(**) .206(**) -.251(**) -.168(**) 1
Sig. (2-tailed) 0.000 0.000 0.000 0.000
Pearson Correlation -.583(**) .449(**) -.627(**) -.338(**) .400(**)
Sig. (2-tailed) 0.000 0.000 0.000 0.000 0.000Pearson Correlation -0.065 -0.007 -0.080 0.025 -0.014
Sig. (2-tailed) 0.153 0.876 0.077 0.575 0.751Pearson Correlation -.206(**) .221(**) -.242(**) -.160(**) .093(*)
Sig. (2-tailed) 0.000 0.000 0.000 0.000 0.038Pearson Correlation -.151(**) .119(*) -.146(**) -.110(*) 0.055
Sig. (2-tailed) 0.001 0.013 0.001 0.015 0.217Pearson Correlation -.593(**) .474(**) -.636(**) -.357(**) .379(**)
Sig. (2-tailed) 0.000 0.000 0.000 0.000 0.000Pearson Correlation .242(**) -.224(**) .238(**) .218(**) -0.060
Sig. (2-tailed) 0.000 0.000 0.000 0.000 0.182Pearson Correlation -0.004 -.113(*) 0.015 .160(**) -0.070
Sig. (2-tailed) 0.935 0.017 0.741 0.000 0.116Pearson Correlation -0.046 0.054 -0.044 -0.033 -0.038
Sig. (2-tailed) 0.311 0.256 0.331 0.474 0.403Pearson Correlation -.218(**) .206(**) -.248(**) -.146(**) .092(*)
Sig. (2-tailed) 0.000 0.000 0.000 0.001 0.039Pearson Correlation .215(**) -.208(**) .215(**) .218(**) -0.063
Sig. (2-tailed) 0.000 0.000 0.000 0.000 0.158
Pearson Correlation .146(**) -.118(*) .144(**) .101(*) 0.030
Sig. (2-tailed) 0.001 0.013 0.001 0.026 0.508Pearson Correlation 0.023 -0.082 0.029 .090(*) -.106(*)
Sig. (2-tailed) 0.608 0.085 0.516 0.048 0.018Pearson Correlation -.214(**) .214(**) -.249(**) -.158(**) .092(*)
Sig. (2-tailed) 0.000 0.000 0.000 0.000 0.039Pearson Correlation -.099(*) 0.069 -.095(*) -0.078 0.003
Sig. (2-tailed) 0.029 0.146 0.036 0.084 0.942
Pearson Correlation -.595(**) .461(**) -.639(**) -.359(**) .428(**)Sig. (2-tailed) 0.000 0.000 0.000 0.000 0.000Pearson Correlation -0.088 0.013 -.104(*) 0.012 0.002Sig. (2-tailed) 0.053 0.781 0.022 0.794 0.971Pearson Correlation -.206(**) .221(**) -.242(**) -.160(**) .093(*)Sig. (2-tailed) 0.000 0.000 0.000 0.000 0.038Pearson Correlation -.148(**) .125(**) -.144(**) -.102(*) 0.058Sig. (2-tailed) 0.001 0.009 0.001 0.024 0.198Pearson Correlation -.604(**) .484(**) -.647(**) -.376(**) .407(**)Sig. (2-tailed) 0.000 0.000 0.000 0.000 0.000
Nurse Characteristics
NURSEAGE
NURSEED
Nurse Characteristics
Intensity of Care
Skill Mix
Staff Adequacy
RPNWKHRS
AGNWKHRS
NPWKHRS
TOTSTAFFWKHRS
NURSEEXP
PERFEMNURSE
PERFTHRS
RNWKHRS
TOTSTAFFHPLOS
RNPROP
RPNPROP
AGNPROP
RNHPLOS
RPNHPLOS
NPHPLOS
AGNHPLOS
NPRATIO
TOTSTAFFRATIO
**. Correlation is significant at the 0.01 level (2-tailed).
*. Correlation is significant at the 0.05 level (2-tailed).
NPPROP
RNRATIO
RPNRATIO
AGNRATIO
Note: Unit ED level unit of analysis

168
Staffing Variables Correlation Table
Variable RNWKHRS RPNWKHRS AGNWKHRS NPWKHRS TOTSTAFFWKHRS
Pearson Correlation -.583(**) -0.065 -.206(**) -.151(**) -.593(**)
Sig. (2-tailed) 0.000 0.153 0.000 0.001 0.000Pearson Correlation .449(**) -0.007 .221(**) .119(*) .474(**)
Sig. (2-tailed) 0.000 0.876 0.000 0.013 0.000Pearson Correlation -.627(**) -0.080 -.242(**) -.146(**) -.636(**)
Sig. (2-tailed) 0.000 0.077 0.000 0.001 0.000Pearson Correlation -.338(**) 0.025 -.160(**) -.110(*) -.357(**)
Sig. (2-tailed) 0.000 0.575 0.000 0.015 0.000Pearson Correlation .400(**) -0.014 .093(*) 0.055 .379(**)
Sig. (2-tailed) 0.000 0.751 0.038 0.217 0.000
Pearson Correlation 1 -.102(*) .392(**) .247(**) .955(**)
Sig. (2-tailed) 0.022 0.000 0.000 0.000Pearson Correlation -.102(*) 1 0.085 -0.068 .089(*)
Sig. (2-tailed) 0.022 0.056 0.132 0.046Pearson Correlation .392(**) 0.085 1 -0.029 .428(**)
Sig. (2-tailed) 0.000 0.056 0.520 0.000Pearson Correlation .247(**) -0.068 -0.029 1 .241(**)
Sig. (2-tailed) 0.000 0.132 0.520 0.000Pearson Correlation .955(**) .089(*) .428(**) .241(**) 1
Sig. (2-tailed) 0.000 0.046 0.000 0.000Pearson Correlation -0.032 -.169(**) -.158(**) -0.086 -.102(*)
Sig. (2-tailed) 0.471 0.000 0.000 0.055 0.023Pearson Correlation -.228(**) .808(**) -0.050 -0.074 -0.083
Sig. (2-tailed) 0.000 0.000 0.270 0.098 0.063Pearson Correlation .119(**) -0.034 -0.056 .882(**) .119(**)
Sig. (2-tailed) 0.008 0.450 0.215 0.000 0.008Pearson Correlation .353(**) 0.084 .883(**) -0.039 .390(**)
Sig. (2-tailed) 0.000 0.061 0.000 0.380 0.000Pearson Correlation -0.045 -0.042 -.147(**) -0.082 -0.060
Sig. (2-tailed) 0.319 0.352 0.001 0.067 0.182
Pearson Correlation 0.030 -.653(**) -.137(**) -0.006 -.250(**)
Sig. (2-tailed) 0.508 0.000 0.002 0.891 0.000Pearson Correlation -.254(**) .930(**) -0.017 -.101(*) -0.085
Sig. (2-tailed) 0.000 0.000 0.708 0.024 0.059Pearson Correlation .360(**) .089(*) .983(**) -0.044 .392(**)
Sig. (2-tailed) 0.000 0.048 0.000 0.325 0.000Pearson Correlation .153(**) -0.065 -0.057 .961(**) .139(**)
Sig. (2-tailed) 0.001 0.150 0.208 0.000 0.002
Pearson Correlation .994(**) -.094(*) .391(**) .237(**) .948(**)Sig. (2-tailed) 0.000 0.037 0.000 0.000 0.000Pearson Correlation -0.077 .988(**) .101(*) -0.073 .116(**)Sig. (2-tailed) 0.085 0.000 0.024 0.106 0.009Pearson Correlation .392(**) 0.085 1.000(**) -0.029 .428(**)Sig. (2-tailed) 0.000 0.056 0.000 0.520 0.000Pearson Correlation .244(**) -0.065 -0.034 .993(**) .237(**)Sig. (2-tailed) 0.000 0.145 0.452 0.000 0.000Pearson Correlation .956(**) 0.082 .425(**) .235(**) .995(**)Sig. (2-tailed) 0.000 0.066 0.000 0.000 0.000
Intensity of Care
NURSEAGE
NURSEED
Nurse Characteristics
Intensity of Care
Skill Mix
Staff Adequacy
RPNWKHRS
AGNWKHRS
NPWKHRS
TOTSTAFFWKHRS
NURSEEXP
PERFEMNURSE
PERFTHRS
RNWKHRS
TOTSTAFFHPLOS
RNPROP
RPNPROP
AGNPROP
RNHPLOS
RPNHPLOS
NPHPLOS
AGNHPLOS
NPRATIO
TOTSTAFFRATIO
**. Correlation is significant at the 0.01 level (2-tailed).
*. Correlation is significant at the 0.05 level (2-tailed).
NPPROP
RNRATIO
RPNRATIO
AGNRATIO
Note: Unit ED level unit of analysis

169
Staffing Variables Correlation Table
Variable RNHPLOS RPNHPLOS NPHPLOS AGNHPLOS TOTSTAFFHPLOS
Pearson Correlation .242(**) -0.004 -0.046 -.218(**) .215(**)
Sig. (2-tailed) 0.000 0.935 0.311 0.000 0.000Pearson Correlation -.224(**) -.113(*) 0.054 .206(**) -.208(**)
Sig. (2-tailed) 0.000 0.017 0.256 0.000 0.000Pearson Correlation .238(**) 0.015 -0.044 -.248(**) .215(**)
Sig. (2-tailed) 0.000 0.741 0.331 0.000 0.000Pearson Correlation .218(**) .160(**) -0.033 -.146(**) .218(**)
Sig. (2-tailed) 0.000 0.000 0.474 0.001 0.000Pearson Correlation -0.060 -0.070 -0.038 .092(*) -0.063
Sig. (2-tailed) 0.182 0.116 0.403 0.039 0.158
Pearson Correlation -0.032 -.228(**) .119(**) .353(**) -0.045
Sig. (2-tailed) 0.471 0.000 0.008 0.000 0.319Pearson Correlation -.169(**) .808(**) -0.034 0.084 -0.042
Sig. (2-tailed) 0.000 0.000 0.450 0.061 0.352Pearson Correlation -.158(**) -0.050 -0.056 .883(**) -.147(**)
Sig. (2-tailed) 0.000 0.270 0.215 0.000 0.001Pearson Correlation -0.086 -0.074 .882(**) -0.039 -0.082
Sig. (2-tailed) 0.055 0.098 0.000 0.380 0.067Pearson Correlation -.102(*) -0.083 .119(**) .390(**) -0.060
Sig. (2-tailed) 0.023 0.063 0.008 0.000 0.182Pearson Correlation 1 0.026 0.015 -.114(*) .976(**)
Sig. (2-tailed) 0.561 0.731 0.011 0.000Pearson Correlation 0.026 1 -0.029 -0.034 .175(**)
Sig. (2-tailed) 0.561 0.521 0.445 0.000Pearson Correlation 0.015 -0.029 1 -0.055 0.021
Sig. (2-tailed) 0.731 0.521 0.216 0.640Pearson Correlation -.114(*) -0.034 -0.055 1 -.096(*)
Sig. (2-tailed) 0.011 0.445 0.216 0.031Pearson Correlation .976(**) .175(**) 0.021 -.096(*) 1
Sig. (2-tailed) 0.000 0.000 0.640 0.031
Pearson Correlation .251(**) -.541(**) -0.002 -.138(**) 0.057
Sig. (2-tailed) 0.000 0.000 0.971 0.002 0.202Pearson Correlation -.155(**) .873(**) -0.063 -0.011 -0.028
Sig. (2-tailed) 0.001 0.000 0.160 0.815 0.526Pearson Correlation -.161(**) -0.045 -0.063 .925(**) -.150(**)
Sig. (2-tailed) 0.000 0.321 0.159 0.000 0.001Pearson Correlation -0.070 -0.068 .938(**) -0.062 -0.074
Sig. (2-tailed) 0.117 0.130 0.000 0.166 0.099
Pearson Correlation -0.072 -.223(**) .110(*) .351(**) -0.083
Sig. (2-tailed) 0.110 0.000 0.014 0.000 0.062Pearson Correlation -.170(**) .795(**) -0.041 .096(*) -0.042
Sig. (2-tailed) 0.000 0.000 0.365 0.031 0.350Pearson Correlation -.158(**) -0.050 -0.056 .883(**) -.147(**)
Sig. (2-tailed) 0.000 0.270 0.215 0.000 0.001Pearson Correlation -0.086 -0.074 .871(**) -0.045 -0.082
Sig. (2-tailed) 0.056 0.101 0.000 0.315 0.069Pearson Correlation -.131(**) -.090(*) .113(*) .386(**) -.092(*)
Sig. (2-tailed) 0.003 0.044 0.012 0.000 0.039
Intensity of Care
NURSEAGE
NURSEED
Nurse Characteristics
Intensity of Care
Skill Mix
Staff Adequacy
RPNWKHRS
AGNWKHRS
NPWKHRS
TOTSTAFFWKHRS
NURSEEXP
PERFEMNURSE
PERFTHRS
RNWKHRS
TOTSTAFFHPLOS
RNPROP
RPNPROP
AGNPROP
RNHPLOS
RPNHPLOS
NPHPLOS
AGNHPLOS
NPRATIO
TOTSTAFFRATIO
**. Correlation is significant at the 0.01 level (2-tailed).
*. Correlation is significant at the 0.05 level (2-tailed).
NPPROP
RNRATIO
RPNRATIO
AGNRATIO
Note: Unit ED level unit of analysis

170
Staffing Variables Correlation Table
Variable RNPROP RPNPROP AGNPROP NPPROP
Pearson Correlation .146(**) 0.023 -.214(**) -.099(*)
Sig. (2-tailed) 0.001 0.608 0.000 0.029Pearson Correlation -.118(*) -0.082 .214(**) 0.069
Sig. (2-tailed) 0.013 0.085 0.000 0.146Pearson Correlation .144(**) 0.029 -.249(**) -.095(*)
Sig. (2-tailed) 0.001 0.516 0.000 0.036Pearson Correlation .101(*) .090(*) -.158(**) -0.078
Sig. (2-tailed) 0.026 0.048 0.000 0.084Pearson Correlation 0.030 -.106(*) .092(*) 0.003
Sig. (2-tailed) 0.508 0.018 0.039 0.942
Pearson Correlation 0.030 -.254(**) .360(**) .153(**)
Sig. (2-tailed) 0.508 0.000 0.000 0.001Pearson Correlation -.653(**) .930(**) .089(*) -0.065
Sig. (2-tailed) 0.000 0.000 0.048 0.150Pearson Correlation -.137(**) -0.017 .983(**) -0.057
Sig. (2-tailed) 0.002 0.708 0.000 0.208Pearson Correlation -0.006 -.101(*) -0.044 .961(**)
Sig. (2-tailed) 0.891 0.024 0.325 0.000Pearson Correlation -.250(**) -0.085 .392(**) .139(**)
Sig. (2-tailed) 0.000 0.059 0.000 0.002Pearson Correlation .251(**) -.155(**) -.161(**) -0.070
Sig. (2-tailed) 0.000 0.001 0.000 0.117Pearson Correlation -.541(**) .873(**) -0.045 -0.068
Sig. (2-tailed) 0.000 0.000 0.321 0.130Pearson Correlation -0.002 -0.063 -0.063 .938(**)
Sig. (2-tailed) 0.971 0.160 0.159 0.000Pearson Correlation -.138(**) -0.011 .925(**) -0.062
Sig. (2-tailed) 0.002 0.815 0.000 0.166Pearson Correlation 0.057 -0.028 -.150(**) -0.074
Sig. (2-tailed) 0.202 0.526 0.001 0.099
Pearson Correlation 1 -.636(**) -.132(**) 0.029
Sig. (2-tailed) 0.000 0.003 0.516Pearson Correlation -.636(**) 1 -0.009 -.088(*)
Sig. (2-tailed) 0.000 0.836 0.050Pearson Correlation -.132(**) -0.009 1 -0.063
Sig. (2-tailed) 0.003 0.836 0.157Pearson Correlation 0.029 -.088(*) -0.063 1
Sig. (2-tailed) 0.516 0.050 0.157
Pearson Correlation 0.029 -.249(**) .359(**) .145(**)
Sig. (2-tailed) 0.523 0.000 0.000 0.001Pearson Correlation -.653(**) .912(**) .104(*) -0.070
Sig. (2-tailed) 0.000 0.000 0.020 0.119Pearson Correlation -.137(**) -0.017 .983(**) -0.057
Sig. (2-tailed) 0.002 0.708 0.000 0.208Pearson Correlation -0.007 -.100(*) -0.049 .952(**)
Sig. (2-tailed) 0.873 0.025 0.273 0.000Pearson Correlation -.231(**) -.093(*) .391(**) .135(**)
Sig. (2-tailed) 0.000 0.038 0.000 0.003
Skill Mix
NURSEAGE
NURSEED
Nurse Characteristics
Intensity of Care
Skill Mix
Staff Adequacy
RPNWKHRS
AGNWKHRS
NPWKHRS
TOTSTAFFWKHRS
NURSEEXP
PERFEMNURSE
PERFTHRS
RNWKHRS
TOTSTAFFHPLOS
RNPROP
RPNPROP
AGNPROP
RNHPLOS
RPNHPLOS
NPHPLOS
AGNHPLOS
NPRATIO
TOTSTAFFRATIO
**. Correlation is significant at the 0.01 level (2-tailed).
*. Correlation is significant at the 0.05 level (2-tailed).
NPPROP
RNRATIO
RPNRATIO
AGNRATIO
Note: Unit ED level unit of analysis

171
Staffing Variables Correlation Table
Variable RNRATIO RPNRATIO AGNRATIO NPRATIO TOTSTAFFRATIO
Pearson Correlation -.595(**) -0.088 -.206(**) -.148(**) -.604(**)
Sig. (2-tailed) 0.000 0.053 0.000 0.001 0.000Pearson Correlation .461(**) 0.013 .221(**) .125(**) .484(**)
Sig. (2-tailed) 0.000 0.781 0.000 0.009 0.000Pearson Correlation -.639(**) -.104(*) -.242(**) -.144(**) -.647(**)
Sig. (2-tailed) 0.000 0.022 0.000 0.001 0.000Pearson Correlation -.359(**) 0.012 -.160(**) -.102(*) -.376(**)
Sig. (2-tailed) 0.000 0.794 0.000 0.024 0.000Pearson Correlation .428(**) 0.002 .093(*) 0.058 .407(**)
Sig. (2-tailed) 0.000 0.971 0.038 0.198 0.000
Pearson Correlation .994(**) -0.077 .392(**) .244(**) .956(**)
Sig. (2-tailed) 0.000 0.085 0.000 0.000 0.000Pearson Correlation -.094(*) .988(**) 0.085 -0.065 0.082
Sig. (2-tailed) 0.037 0.000 0.056 0.145 0.066Pearson Correlation .391(**) .101(*) 1.000(**) -0.034 .425(**)
Sig. (2-tailed) 0.000 0.024 0.000 0.452 0.000Pearson Correlation .237(**) -0.073 -0.029 .993(**) .235(**)
Sig. (2-tailed) 0.000 0.106 0.520 0.000 0.000Pearson Correlation .948(**) .116(**) .428(**) .237(**) .995(**)
Sig. (2-tailed) 0.000 0.009 0.000 0.000 0.000Pearson Correlation -0.072 -.170(**) -.158(**) -0.086 -.131(**)
Sig. (2-tailed) 0.110 0.000 0.000 0.056 0.003Pearson Correlation -.223(**) .795(**) -0.050 -0.074 -.090(*)
Sig. (2-tailed) 0.000 0.000 0.270 0.101 0.044Pearson Correlation .110(*) -0.041 -0.056 .871(**) .113(*)
Sig. (2-tailed) 0.014 0.365 0.215 0.000 0.012Pearson Correlation .351(**) .096(*) .883(**) -0.045 .386(**)
Sig. (2-tailed) 0.000 0.031 0.000 0.315 0.000Pearson Correlation -0.083 -0.042 -.147(**) -0.082 -.092(*)
Sig. (2-tailed) 0.062 0.350 0.001 0.069 0.039
Pearson Correlation 0.029 -.653(**) -.137(**) -0.007 -.231(**)
Sig. (2-tailed) 0.523 0.000 0.002 0.873 0.000Pearson Correlation -.249(**) .912(**) -0.017 -.100(*) -.093(*)
Sig. (2-tailed) 0.000 0.000 0.708 0.025 0.038Pearson Correlation .359(**) .104(*) .983(**) -0.049 .391(**)
Sig. (2-tailed) 0.000 0.020 0.000 0.273 0.000Pearson Correlation .145(**) -0.070 -0.057 .952(**) .135(**)
Sig. (2-tailed) 0.001 0.119 0.208 0.000 0.003
Pearson Correlation 1 -0.069 .391(**) .235(**) .960(**)
Sig. (2-tailed) 0.123 0.000 0.000 0.000Pearson Correlation -0.069 1 .101(*) -0.070 .111(*)
Sig. (2-tailed) 0.123 0.024 0.117 0.013Pearson Correlation .391(**) .101(*) 1 -0.034 .425(**)
Sig. (2-tailed) 0.000 0.024 0.452 0.000Pearson Correlation .235(**) -0.070 -0.034 1 .233(**)
Sig. (2-tailed) 0.000 0.117 0.452 0.000Pearson Correlation .960(**) .111(*) .425(**) .233(**) 1
Sig. (2-tailed) 0.000 0.013 0.000 0.000
Staff Adequacy
NURSEAGE
NURSEED
Nurse Characteristics
Intensity of Care
Skill Mix
Staff Adequacy
RPNWKHRS
AGNWKHRS
NPWKHRS
TOTSTAFFWKHRS
NURSEEXP
PERFEMNURSE
PERFTHRS
RNWKHRS
TOTSTAFFHPLOS
RNPROP
RPNPROP
AGNPROP
RNHPLOS
RPNHPLOS
NPHPLOS
AGNHPLOS
NPRATIO
TOTSTAFFRATIO
**. Correlation is significant at the 0.01 level (2-tailed).
*. Correlation is significant at the 0.05 level (2-tailed).
NPPROP
RNRATIO
RPNRATIO
AGNRATIO
Note: Unit ED level unit of analysis

172
Appendix N. Staffing Variables
Nurse Characteristics – Descriptive Statistics
91 43.9055 3.68529 37.53 53.67 .391 .253 -.485 .50098 43.7303 4.11671 33.00 53.33 .094 .244 -.155 .483102 44.0017 4.70542 27.00 54.80 -.062 .239 1.058 .47498 43.6714 4.25966 29.20 52.00 -.285 .244 .637 .483100 43.6821 4.34627 30.60 54.50 .172 .241 .407 .478489 43.7979 4.23230 27.00 54.80 .030 .110 .480 .22078 17.5004 10.45073 1.39 57.38 1.240 .272 2.041 .53884 19.8019 11.02423 4.35 50.75 .956 .263 .355 .52088 23.4686 12.10045 4.00 60.98 .837 .257 .559 .50896 26.1147 13.73863 4.35 66.67 .654 .246 .164 .48895 30.0267 15.69196 4.76 81.58 .683 .247 .317 .490441 23.7034 13.56421 1.39 81.58 .936 .116 .789 .23291 19.9935 4.44561 12.93 33.00 .541 .253 -.235 .50098 19.9214 4.66917 9.50 32.40 .408 .244 -.190 .483102 19.9891 5.14202 4.00 33.60 .263 .239 .442 .47498 19.6308 4.68156 4.80 30.14 -.043 .244 .046 .483100 19.4526 4.72555 6.40 31.77 .201 .241 .123 .478489 19.7948 4.73130 4.00 33.60 .261 .110 .090 .22091 95.1067 4.75953 83.33 100.00 -.528 .253 -.829 .50097 93.9915 5.87451 66.67 100.00 -1.262 .245 3.463 .485102 93.7379 6.27246 71.43 100.00 -1.242 .239 2.161 .47498 93.4239 5.74307 71.43 100.00 -.736 .244 .767 .483100 93.3467 6.08315 77.78 100.00 -.571 .241 -.559 .478488 93.9004 5.79901 66.67 100.00 -.944 .111 1.306 .22196 61.7875 11.71849 19.06 92.28 -.352 .246 1.065 .488100 62.8355 11.85959 17.17 89.17 -.728 .241 1.695 .478103 64.8552 11.24280 35.94 95.66 -.269 .238 .317 .47299 66.1644 10.67591 38.55 86.71 -.460 .243 -.130 .481101 67.9566 11.64085 33.64 100.00 -.326 .240 .934 .476499 64.7477 11.60167 17.17 100.00 -.421 .109 .809 .218
Year2005/2006YE2006/2007YE2007/2008YE2008/2009YE2009/2010YETotal2005/2006YE2006/2007YE2007/2008YE2008/2009YE2009/2010YETotal2005/2006YE2006/2007YE2007/2008YE2008/2009YE2009/2010YETotal2005/2006YE2006/2007YE2007/2008YE2008/2009YE2009/2010YETotal2005/2006YE2006/2007YE2007/2008YE2008/2009YE2009/2010YETotal
NURSEAGE
NURSEED
NURSEEXP
PERFEMNURSE
PERFTHRS
N Mean Std. Deviation Minimum Maximum Skewness
Std. Errorof
Skewness Kurtosis
Std. Errorof
Kurtosis
Note: Unit ED level unit of analysis
Analysis of Variance between Groups: Year
ANOVA Table
8.647 4 2.162 .120 .9758732.599 484 18.0438741.246 4888641.405 4 2160.351 13.025 .000
72313.258 436 165.85680954.664 440
23.362 4 5.841 .259 .90410900.603 484 22.52210923.965 488
188.838 4 47.209 1.409 .23016188.254 483 33.51616377.092 487
2446.759 4 611.690 4.679 .00164583.384 494 130.73667030.142 498
(Combined)Between GroupsWithin GroupsTotal
(Combined)Between GroupsWithin GroupsTotal
(Combined)Between GroupsWithin GroupsTotal
(Combined)Between GroupsWithin GroupsTotal
(Combined)Between GroupsWithin GroupsTotal
NURSEAGE * Year
NURSEED * Year
NURSEEXP * Year
PERFEMNURSE * Year
PERFTHRS * Year
Sum ofSquares df Mean Square F Sig.
Note: Unit ED level unit of analysis

173
Nurse Characteristics by Hospital Peer Groups
289 43.3738 3.43605 32.00 54.15 .244 .143 .488 .286123 47.0913 3.38274 40.75 54.80 .294 .218 -.604 .43377 40.1285 4.47527 27.00 53.67 .546 .274 2.531 .541
489 43.7979 4.23230 27.00 54.80 .030 .110 .480 .220273 21.6185 11.50865 1.39 58.25 .594 .147 -.268 .29493 18.0440 9.26532 5.26 50.00 1.141 .250 1.167 .49575 38.3100 15.09598 10.29 81.58 .418 .277 -.125 .548
441 23.7034 13.56421 1.39 81.58 .936 .116 .789 .232289 19.2067 3.89729 10.00 32.33 .515 .143 .098 .286123 23.6025 3.84426 14.29 33.60 .377 .218 -.106 .43377 15.9199 4.73942 4.00 30.83 .868 .274 2.422 .541
489 19.7948 4.73130 4.00 33.60 .261 .110 .090 .220288 93.8548 5.01632 75.00 100.00 -.732 .144 .342 .286123 95.6682 7.03351 66.67 100.00 -1.737 .218 3.064 .43377 91.2467 5.37116 71.43 100.00 -.282 .274 1.495 .541
488 93.9004 5.79901 66.67 100.00 -.944 .111 1.306 .221
298 65.8426 8.76342 41.39 92.28 .032 .141 .056 .281123 59.9242 15.56623 17.17 100.00 .039 .218 -.056 .43378 68.1711 11.69226 35.94 89.76 -.794 .272 .439 .538
499 64.7477 11.60167 17.17 100.00 -.421 .109 .809 .218
Peer_GrpLarge CommunitySmallTeachingTotalLarge CommunitySmallTeachingTotalLarge CommunitySmallTeachingTotalLarge CommunitySmallTeachingTotal
Large CommunitySmallTeachingTotal
NURSEAGE
NURSEED
NURSEEXP
PERFEMNURSE
PERFTHRS
N Mean Std. Deviation Minimum Maximum Skewness
Std. Errorof
Skewness Kurtosis
Std. Errorof
Kurtosis
Note: Unit ED level unit of analysis
Analysis of Variance between Groups: Hospital Peer Group
ANOVA Table
2422.819 2 1211.410 93.179 .0006318.427 486 13.0018741.246 488
20166.908 2 10083.454 72.655 .00060787.756 438 138.78580954.664 4403039.488 2 1519.744 93.677 .0007884.477 486 16.223
10923.965 488927.250 2 463.625 14.554 .000
15449.842 485 31.85516377.092 4874133.166 2 2066.583 16.297 .000
62896.977 496 126.80867030.142 498
(Combined)Between GroupsWithin GroupsTotal
(Combined)Between GroupsWithin GroupsTotal
(Combined)Between GroupsWithin GroupsTotal
(Combined)Between GroupsWithin GroupsTotal
(Combined)Between GroupsWithin GroupsTotal
NURSEAGE * Peer_Grp
NURSEED * Peer_Grp
NURSEEXP * Peer_Grp
PERFEMNURSE *Peer_Grp
PERFTHRS * Peer_Grp
Sum ofSquares df Mean Square F Sig.
Note: Unit ED level unit of analysis

174
Intensity of Care Variables – Descriptive Statistics
96 1.3143 .48225 .50 2.70 .681 .246 .096 .488100 1.3191 .48977 .13 2.54 .473 .241 -.112 .478103 1.3374 .49583 .21 2.61 .579 .238 .082 .47299 1.3827 .50874 .55 2.69 .720 .243 .235 .481
101 1.4089 .49745 .53 3.08 .853 .240 .872 .476499 1.3528 .49437 .13 3.08 .656 .109 .227 .21896 .04512 .083133 .000 .496 2.799 .246 9.853 .488
100 .04062 .069782 .000 .312 2.058 .241 3.978 .478103 .05839 .087313 .000 .380 1.747 .238 2.521 .47299 .06857 .095002 .000 .515 1.848 .243 4.328 .481
101 .07610 .098156 .000 .474 1.520 .240 2.117 .476499 .05788 .087977 .000 .515 1.951 .109 4.180 .21896 .01908 .061666 .000 .393 4.590 .246 23.086 .488
100 .02335 .064114 .000 .374 3.771 .241 15.848 .478103 .02743 .071959 .000 .449 3.485 .238 13.900 .47299 .03192 .092896 .000 .687 4.594 .243 26.474 .481
101 .02186 .061849 .000 .361 3.892 .240 15.928 .476499 .02477 96 1.3143 .48225 .50 2.70 .681 .24696 .00366 100 1.3191 .48977 .13 2.54 .473 .241
100 .00390 103 1.3374 .49583 .21 2.61 .579 .238103 .00688 99 1.3827 .50874 .55 2.69 .720 .24399 .00824 101 1.4089 .49745 .53 3.08 .853 .240
101 .00912 499 1.3528 .49437 .13 3.08 .656 .109499 .00639 96 .04512 .083133 .000 .496 2.799 .24696 1.4526 100 .04062 .069782 .000 .312 2.058 .241
100 1.4489 103 .05839 .087313 .000 .380 1.747 .238103 1.4961 99 .06857 .095002 .000 .515 1.848 .24399 1.5647 101 .07610 .098156 .000 .474 1.520 .240
101 1.6035 499 .05788 .087977 .000 .515 1.951 .109499 1.5136 96 .01908 .061666 .000 .393 4.590 .246
Year2005/2006YE2006/2007YE2007/2008YE2008/2009YE2009/2010YETotal2005/2006YE2006/2007YE2007/2008YE2008/2009YE2009/2010YETotal2005/2006YE2006/2007YE2007/2008YE2008/2009YE2009/2010YETotal2005/2006YE2006/2007YE2007/2008YE2008/2009YE2009/2010YETotal2005/2006YE2006/2007YE2007/2008YE2008/2009YE2009/2010YETotal
RNWKHRS
RPNWKHRS
AGNWKHRS
NPWKHRS
TOTSTAFFWKHRS
N Mean Std. Deviation Minimum Maximum Skewness
Std. Errorof
Skewness Kurtosis
Std. Errorof
Kurtosis
Note: Unit ED level unit of analysis
Analysis of Variance between Groups: Year
ANOVA Table
.686 4 .172 .700 .592121.028 494 .245121.714 498
.090 4 .023 2.962 .0193.764 494 .0083.854 498
.010 4 .002 .487 .7452.525 494 .0052.535 498
.002 4 .001 2.347 .054
.129 494 .000
.132 4981.882 4 .471 1.452 .216
160.060 494 .324161.943 498
(Combined)Between GroupsWithin GroupsTotal
(Combined)Between GroupsWithin GroupsTotal
(Combined)Between GroupsWithin GroupsTotal
(Combined)Between GroupsWithin GroupsTotal
(Combined)Between GroupsWithin GroupsTotal
RNWKHRS * Year
RPNWKHRS * Year
AGNWKHRS * Year
NPWKHRS * Year
TOTSTAFFWKHRS * Year
Sum ofSquares df Mean Square F Sig.
Note: Unit ED level unit of analysis
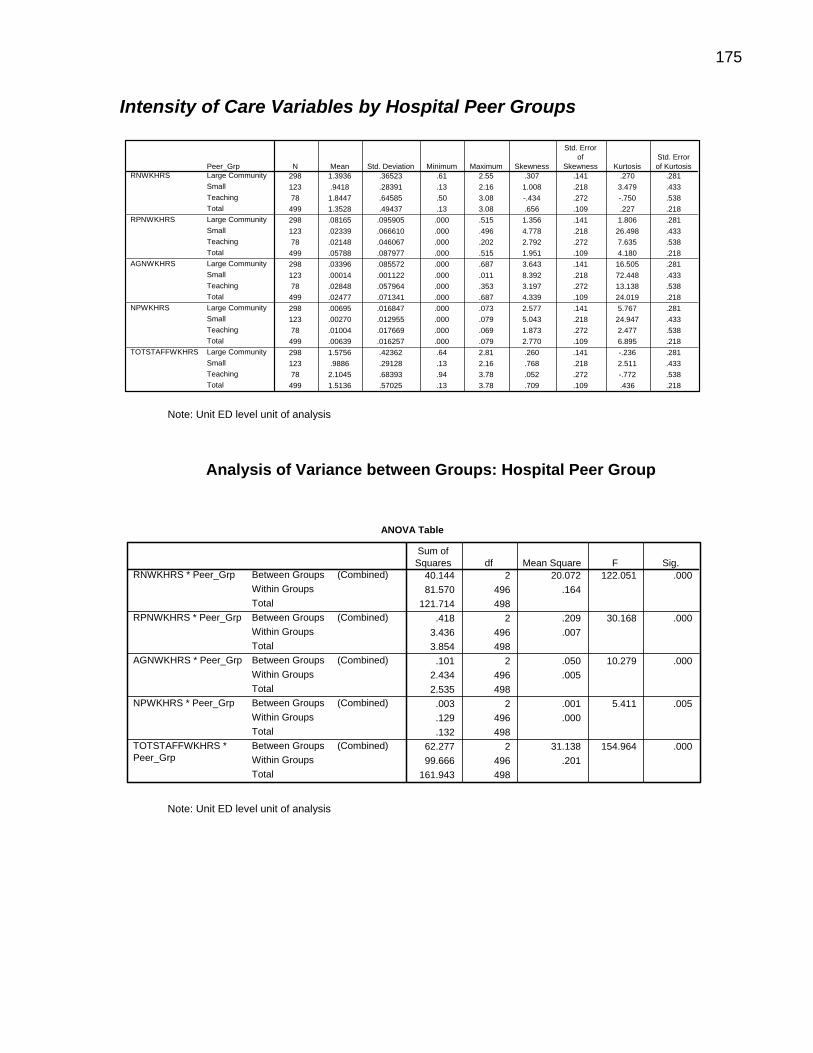
175
Intensity of Care Variables by Hospital Peer Groups
298 1.3936 .36523 .61 2.55 .307 .141 .270 .281123 .9418 .28391 .13 2.16 1.008 .218 3.479 .43378 1.8447 .64585 .50 3.08 -.434 .272 -.750 .538
499 1.3528 .49437 .13 3.08 .656 .109 .227 .218298 .08165 .095905 .000 .515 1.356 .141 1.806 .281123 .02339 .066610 .000 .496 4.778 .218 26.498 .43378 .02148 .046067 .000 .202 2.792 .272 7.635 .538
499 .05788 .087977 .000 .515 1.951 .109 4.180 .218298 .03396 .085572 .000 .687 3.643 .141 16.505 .281123 .00014 .001122 .000 .011 8.392 .218 72.448 .43378 .02848 .057964 .000 .353 3.197 .272 13.138 .538
499 .02477 .071341 .000 .687 4.339 .109 24.019 .218298 .00695 .016847 .000 .073 2.577 .141 5.767 .281123 .00270 .012955 .000 .079 5.043 .218 24.947 .43378 .01004 .017669 .000 .069 1.873 .272 2.477 .538
499 .00639 .016257 .000 .079 2.770 .109 6.895 .218298 1.5756 .42362 .64 2.81 .260 .141 -.236 .281123 .9886 .29128 .13 2.16 .768 .218 2.511 .43378 2.1045 .68393 .94 3.78 .052 .272 -.772 .538
499 1.5136 .57025 .13 3.78 .709 .109 .436 .218
Peer_GrpLarge CommunitySmallTeachingTotalLarge CommunitySmallTeachingTotalLarge CommunitySmallTeachingTotalLarge CommunitySmallTeachingTotalLarge CommunitySmallTeachingTotal
RNWKHRS
RPNWKHRS
AGNWKHRS
NPWKHRS
TOTSTAFFWKHRS
N Mean Std. Deviation Minimum Maximum Skewness
Std. Errorof
Skewness KurtosisStd. Errorof Kurtosis
Note: Unit ED level unit of analysis
Analysis of Variance between Groups: Hospital Peer Group
ANOVA Table
40.144 2 20.072 122.051 .00081.570 496 .164
121.714 498.418 2 .209 30.168 .000
3.436 496 .0073.854 498
.101 2 .050 10.279 .0002.434 496 .0052.535 498
.003 2 .001 5.411 .005
.129 496 .000
.132 49862.277 2 31.138 154.964 .00099.666 496 .201
161.943 498
(Combined)Between GroupsWithin GroupsTotal
(Combined)Between GroupsWithin GroupsTotal
(Combined)Between GroupsWithin GroupsTotal
(Combined)Between GroupsWithin GroupsTotal
(Combined)Between GroupsWithin GroupsTotal
RNWKHRS * Peer_Grp
RPNWKHRS * Peer_Grp
AGNWKHRS * Peer_Grp
NPWKHRS * Peer_Grp
TOTSTAFFWKHRS *Peer_Grp
Sum ofSquares df Mean Square F Sig.
Note: Unit ED level unit of analysis

176
Intensity of Care Variables – Descriptive Statistics
96 .5424 .28373 .19 2.89 6.236 .246 49.982 .488100 .5354 .21864 .08 2.21 4.762 .241 34.985 .478103 .3814 .28830 .00 2.38 3.469 .238 22.144 .47299 .3933 .17893 .00 1.11 .857 .243 3.229 .481
101 .4464 .23324 .02 2.29 5.184 .240 38.750 .476499 .4587 .25250 .00 2.89 4.203 .109 32.782 .21896 .01985 .047272 .000 .386 5.527 .246 38.892 .488
100 .01727 .031827 .000 .197 2.863 .241 10.992 .478103 .01964 .040295 .000 .251 3.632 .238 15.935 .47299 .02120 .034306 .000 .217 2.746 .243 10.785 .481
101 .02157 .027849 .000 .126 1.515 .240 2.182 .476499 .01990 .036740 .000 .386 4.096 .109 26.978 .21896 .00129 .004499 .000 .030 4.410 .246 21.230 .488
100 .00126 .004457 .000 .034 5.243 .241 33.024 .478103 .00165 .005659 .000 .046 5.411 .238 36.478 .47299 .00195 .004960 .000 .023 2.777 .243 6.943 .481
101 .00228 .005272 .000 .026 2.796 .240 7.970 .476499 .00169 .004994 .000 .046 4.123 .109 21.390 .21896 .00460 .014118 .000 .088 4.291 .246 20.396 .488
100 .00556 .014258 .000 .079 3.322 .241 12.020 .478103 .00428 .011070 .000 .061 3.141 .238 10.496 .47299 .00506 .012275 .000 .059 2.742 .243 7.188 .481
101 .00400 .010341 .000 .055 3.422 .240 12.133 .476499 .00469 .012449 .000 .088 3.518 .109 13.982 .21896 .5912 .28120 .26 2.89 6.063 .246 47.570 .488
100 .5824 .21468 .08 2.21 4.567 .241 33.478 .478103 .4232 .30362 .00 2.38 2.944 .238 16.882 .47299 .4441 .20108 .00 1.44 1.154 .243 6.054 .481
101 .4977 .22599 .02 2.29 5.156 .240 39.248 .476499 .5067 .25711 .00 2.89 3.751 .109 28.124 .218
Year2005/2006YE2006/2007YE2007/2008YE2008/2009YE2009/2010YETotal2005/2006YE2006/2007YE2007/2008YE2008/2009YE2009/2010YETotal2005/2006YE2006/2007YE2007/2008YE2008/2009YE2009/2010YETotal2005/2006YE2006/2007YE2007/2008YE2008/2009YE2009/2010YETotal2005/2006YE2006/2007YE2007/2008YE2008/2009YE2009/2010YETotal
RNHPLOS
RPNHPLOS
NPHPLOS
AGNHPLOS
TOTSTAFFHPLOS
N Mean Std. Deviation Minimum Maximum Skewness
Std. Errorof
Skewness Kurtosis
Std.Error ofKurtosis
Note: Unit ED level unit of analysis
Analysis of Variance between Groups: Year
ANOVA Table
2.314 4 .579 9.710 .00029.435 494 .06031.750 498
.001 4 .000 .211 .932
.671 494 .001
.672 498
.000 4 .000 .750 .558
.012 494 .000
.012 498
.000 4 .000 .249 .910
.077 494 .000
.077 4982.373 4 .593 9.594 .000
30.547 494 .06232.920 498
(Combined)Between GroupsWithin GroupsTotal
(Combined)Between GroupsWithin GroupsTotal
(Combined)Between GroupsWithin GroupsTotal
(Combined)Between GroupsWithin GroupsTotal
(Combined)Between GroupsWithin GroupsTotal
RNHPLOS * Year
RPNHPLOS * Year
NPHPLOS * Year
AGNHPLOS * Year
TOTSTAFFHPLOS * Year
Sum ofSquares df Mean Square F Sig.
Note: Unit ED level unit of analysis

177
Intensity of Care Variables by Hospital Peer Groups
298 .4036 .15047 .00 1.11 .407 .141 3.390 .281123 .6297 .39544 .01 2.89 3.268 .218 14.679 .43378 .3996 .12349 .00 .69 -.829 .272 2.232 .538499 .4587 .25250 .00 2.89 4.203 .109 32.782 .218298 .02532 .033947 .000 .251 2.428 .141 9.811 .281123 .01477 .047558 .000 .386 5.470 .218 34.911 .43378 .00731 .019633 .000 .099 3.626 .272 13.118 .538499 .01990 .036740 .000 .386 4.096 .109 26.978 .218298 .00167 .004433 .000 .030 3.205 .141 11.342 .281123 .00132 .006271 .000 .046 5.217 .218 28.709 .43378 .00234 .004751 .000 .020 2.512 .272 5.729 .538499 .00169 .004994 .000 .046 4.123 .109 21.390 .218298 .00648 .014657 .000 .088 2.776 .141 8.121 .281123 .00005 .000412 .000 .004 8.828 .218 81.325 .43378 .00520 .011243 .000 .079 4.155 .272 23.692 .538499 .00469 .012449 .000 .088 3.518 .109 13.982 .218298 .4556 .17123 .00 1.44 .931 .141 7.205 .281123 .6576 .39548 .01 2.89 3.090 .218 13.760 .43378 .4636 .13524 .00 .74 -1.067 .272 2.624 .538499 .5067 .25711 .00 2.89 3.751 .109 28.124 .218
Peer_GrpLarge CommunitySmallTeachingTotalLarge CommunitySmallTeachingTotalLarge CommunitySmallTeachingTotalLarge CommunitySmallTeachingTotalLarge CommunitySmallTeachingTotal
RNHPLOS
RPNHPLOS
NPHPLOS
AGNHPLOS
TOTSTAFFHPLOS
N Mean Std. Deviation Minimum Maximum SkewnessStd. Error ofSkewness Kurtosis
Std. Errorof Kurtosis
Note: Unit ED level unit of analysis
Analysis of Variance between Groups: Hospital Peer Group
ANOVA Table
4.773 2 2.387 43.883 .00026.976 496 .05431.750 498
.024 2 .012 9.321 .000
.648 496 .001
.672 498
.000 2 .000 1.005 .367
.012 496 .000
.012 498
.004 2 .002 12.208 .000
.074 496 .000
.077 4983.722 2 1.861 31.612 .000
29.198 496 .05932.920 498
(Combined)Between GroupsWithin GroupsTotal
(Combined)Between GroupsWithin GroupsTotal
(Combined)Between GroupsWithin GroupsTotal
(Combined)Between GroupsWithin GroupsTotal
(Combined)Between GroupsWithin GroupsTotal
RNHPLOS * Peer_Grp
RPNHPLOS * Peer_Grp
NPHPLOS * Peer_Grp
AGNHPLOS * Peer_Grp
TOTSTAFFHPLOS *Peer_Grp
Sum ofSquares df Mean Square F Sig.
Note: Unit ED level unit of analysis

178
Skill Mix Variables – Descriptive Statistics
96 .9140 .09526 .52 1.00 -1.580 .246 3.031 .488100 .9172 .08966 .56 1.00 -1.416 .241 2.339 .478103 .9012 .09454 .54 1.00 -.959 .238 .717 .47299 .8919 .09469 .53 1.00 -.944 .243 .981 .481
101 .8895 .09908 .53 1.00 -.923 .240 .720 .476499 .9027 .09498 .52 1.00 -1.127 .109 1.277 .21896 .03336 .060288 .000 .332 2.637 .246 8.184 .488
100 .03075 .054455 .000 .250 2.276 .241 5.329 .478103 .04216 .063053 .000 .267 1.755 .238 2.531 .47299 .04588 .060396 .000 .236 1.374 .243 1.117 .481
101 .04822 .059574 .000 .245 1.275 .240 .941 .476499 .04015 .059790 .000 .332 1.799 .109 3.062 .21896 .00889 .027478 .000 .169 4.216 .246 19.265 .488
100 .01161 .031576 .000 .196 3.762 .241 15.941 .478103 .01337 .033345 .000 .182 3.134 .238 10.366 .47299 .01462 .039289 .000 .249 3.716 .243 15.955 .481
101 .00979 .025423 .000 .128 3.376 .240 11.487 .476499 .01168 .031750 .000 .249 3.732 .109 15.922 .21896 .00253 .009503 .000 .066 4.941 .246 26.567 .488
100 .00237 .008303 .000 .060 4.903 .241 27.767 .478103 .00405 .009921 .000 .057 2.904 .238 9.137 .47299 .00465 .011107 .000 .051 2.504 .243 5.386 .481
101 .00484 .010425 .000 .053 2.440 .240 5.868 .476499 .00370 .009913 .000 .066 3.260 .109 11.372 .218
Year2005/2006YE2006/2007YE2007/2008YE2008/2009YE2009/2010YETotal2005/2006YE2006/2007YE2007/2008YE2008/2009YE2009/2010YETotal2005/2006YE2006/2007YE2007/2008YE2008/2009YE2009/2010YETotal2005/2006YE2006/2007YE2007/2008YE2008/2009YE2009/2010YETotal
RNPROP
RPNPROP
AGNPROP
NPPROP
N Mean Std. Deviation Minimum Maximum Skewness
Std. Errorof
Skewness Kurtosis
Std. Errorof
Kurtosis
Note: Unit ED level unit of analysis
Analysis of Variance between Groups: Year
ANOVA Table
.063 4 .016 1.746 .1394.430 494 .0094.493 498
.024 4 .006 1.653 .1601.757 494 .0041.780 498
.002 4 .001 .558 .694
.500 494 .001
.502 498
.001 4 .000 1.383 .239
.048 494 .000
.049 498
(Combined)Between GroupsWithin GroupsTotal
(Combined)Between GroupsWithin GroupsTotal
(Combined)Between GroupsWithin GroupsTotal
(Combined)Between GroupsWithin GroupsTotal
RNPROP * Year
RPNPROP * Year
AGNPROP * Year
NPPROP * Year
Sum ofSquares df Mean Square F Sig.
Note: Unit ED level unit of analysis

179
Skill Mix Variables by Hospital Peer Group – Descriptive Statistics
298 .8907 .08940 .63 1.00 -.636 .141 -.485 .281123 .9551 .06968 .65 1.00 -1.943 .218 3.886 .43378 .8657 .11617 .52 1.00 -1.463 .272 2.184 .538499 .9027 .09498 .52 1.00 -1.127 .109 1.277 .218298 .05361 .062027 .000 .267 1.231 .141 .958 .281123 .02203 .053735 .000 .332 3.593 .218 14.554 .43378 .01725 .044144 .000 .202 3.318 .272 10.421 .538499 .04015 .059790 .000 .332 1.799 .109 3.062 .218298 .01655 .038466 .000 .249 2.983 .141 9.640 .281123 .00012 .000996 .000 .010 8.741 .218 79.563 .43378 .01128 .022481 .000 .147 3.460 .272 16.618 .538499 .01168 .031750 .000 .249 3.732 .109 15.922 .218298 .00404 .009771 .000 .066 2.774 .141 8.306 .281123 .00222 .010319 .000 .060 4.774 .218 22.036 .43378 .00475 .009672 .000 .049 2.784 .272 7.973 .538499 .00370 .009913 .000 .066 3.260 .109 11.372 .218
Peer_GrpLarge CommunitySmallTeachingTotalLarge CommunitySmallTeachingTotalLarge CommunitySmallTeachingTotalLarge CommunitySmallTeachingTotal
RNPROP
RPNPROP
AGNPROP
NPPROP
N Mean Std. Deviation Minimum Maximum Skewness
Std. Errorof
Skewness KurtosisStd. Errorof Kurtosis
Note: Unit ED level unit of analysis
Analysis of Variance between Groups: Hospital Peer Group
ANOVA Table
.487 2 .244 30.186 .0004.005 496 .0084.493 498
.135 2 .068 20.396 .0001.645 496 .0031.780 498
.024 2 .012 12.193 .000
.478 496 .001
.502 498
.000 2 .000 2.002 .136
.049 496 .000
.049 498
(Combined)Between GroupsWithin GroupsTotal
(Combined)Between GroupsWithin GroupsTotal
(Combined)Between GroupsWithin GroupsTotal
(Combined)Between GroupsWithin GroupsTotal
RNPROP * Peer_Grp
RPNPROP * Peer_Grp
AGNPROP * Peer_Grp
NPPROP * Peer_Grp
Sum ofSquares df Mean Square F Sig.
Note: Unit ED level unit of analysis

180
Staff Adequacy Variables – Descriptive Statistics
96 .00079 .000303 .000 .002 .680 .246 .022 .488100 .00080 .000308 .000 .002 .525 .241 -.106 .478103 .00081 .000315 .000 .002 .590 .238 .093 .47299 .00084 .000319 .000 .002 .740 .243 .251 .481101 .00086 .000313 .000 .002 .833 .240 .680 .476499 .00082 .000312 .000 .002 .666 .109 .181 .21896 .00003 .000049 .000 .000 2.793 .246 9.582 .488100 .00002 .000041 .000 .000 2.145 .241 4.640 .478103 .00003 .000052 .000 .000 1.904 .238 3.690 .47299 .00004 .000057 .000 .000 1.789 .243 4.185 .481101 .00005 .000059 .000 .000 1.581 .240 2.522 .476499 .00003 .000052 .000 .000 1.994 .109 4.514 .21896 .00001 .000032 .000 .000 4.590 .246 23.086 .488100 .00001 .000033 .000 .000 3.771 .241 15.848 .478103 .00001 .000037 .000 .000 3.485 .238 13.900 .47299 .00002 .000048 .000 .000 4.594 .243 26.474 .481101 .00001 .000032 .000 .000 3.892 .240 15.928 .476499 .00001 .000037 .000 .000 4.339 .109 24.019 .21896 .00000 .000008 .000 .000 4.616 .246 23.428 .488100 .00000 .000007 .000 .000 3.930 .241 17.214 .478103 .00000 .000010 .000 .000 2.685 .238 6.646 .47299 .00001 .000012 .000 .000 2.453 .243 4.941 .481101 .00001 .000012 .000 .000 2.274 .240 4.535 .476499 .00000 .000010 .000 .000 2.928 .109 8.170 .21896 .00087 .000345 .000 .002 .798 .246 .235 .488100 .00087 .000343 .000 .002 .595 .241 -.051 .478103 .00091 .000352 .000 .002 .511 .238 -.098 .47299 .00095 .000370 .000 .002 .759 .243 .377 .481101 .00097 .000367 .000 .002 .820 .240 .695 .476499 .00091 .000357 .000 .002 .700 .109 .261 .218
Year2005/2006YE2006/2007YE2007/2008YE2008/2009YE2009/2010YETotal2005/2006YE2006/2007YE2007/2008YE2008/2009YE2009/2010YETotal2005/2006YE2006/2007YE2007/2008YE2008/2009YE2009/2010YETotal2005/2006YE2006/2007YE2007/2008YE2008/2009YE2009/2010YETotal2005/2006YE2006/2007YE2007/2008YE2008/2009YE2009/2010YETotal
RNRATIO
RPNRATIO
AGNRATIO
NPRATIO
TOTSTAFFRATIO
N Mean Std. Deviation Minimum Maximum SkewnessStd. Error ofSkewness Kurtosis
Std. Errorof
Kurtosis
Note: Unit ED level unit of analysis
Analysis of Variance between Groups: Year
ANOVA Table
.000 4 .000 .897 .466
.000 494 .000
.000 498
.000 4 .000 3.290 .011
.000 494 .000
.000 498
.000 4 .000 .487 .745
.000 494 .000
.000 498
.000 4 .000 2.176 .071
.000 494 .000
.000 498
.000 4 .000 1.664 .157
.000 494 .000
.000 498
(Combined)Between GroupsWithin GroupsTotal
(Combined)Between GroupsWithin GroupsTotal
(Combined)Between GroupsWithin GroupsTotal
(Combined)Between GroupsWithin GroupsTotal
(Combined)Between GroupsWithin GroupsTotal
RNRATIO * Year
RPNRATIO * Year
AGNRATIO * Year
NPRATIO * Year
TOTSTAFFRATIO * Year
Sum ofSquares df Mean Square F Sig.
Note: Unit ED level unit of analysis

181
Staff Adequacy Variables by Hospital Peer Group – Descriptive Statistics
298 .00085 .000230 .000 .002 .310 .141 .261 .281123 .00055 .000159 .000 .001 .547 .218 1.897 .43378 .00113 .000410 .000 .002 -.480 .272 -.807 .538
499 .00082 .000312 .000 .002 .666 .109 .181 .218298 .00005 .000057 .000 .000 1.452 .141 2.388 .281123 .00001 .000039 .000 .000 4.799 .218 26.497 .43378 .00002 .000032 .000 .000 2.766 .272 7.426 .538
499 .00003 .000052 .000 .000 1.994 .109 4.514 .218298 .00002 .000044 .000 .000 3.643 .141 16.505 .281123 .00000 .000001 .000 .000 8.392 .218 72.448 .43378 .00001 .000030 .000 .000 3.197 .272 13.138 .538
499 .00001 .000037 .000 .000 4.339 .109 24.019 .218298 .00000 .000010 .000 .000 2.768 .141 7.273 .281123 .00000 .000008 .000 .000 5.134 .218 25.823 .43378 .00001 .000011 .000 .000 2.092 .272 3.879 .538
499 .00000 .000010 .000 .000 2.928 .109 8.170 .218298 .00096 .000264 .000 .002 .301 .141 -.114 .281123 .00058 .000164 .000 .001 .357 .218 1.313 .43378 .00129 .000430 .001 .002 -.117 .272 -.959 .538
499 .00091 .000357 .000 .002 .700 .109 .261 .218
Peer_GrpLarge CommunitySmallTeachingTotalLarge CommunitySmallTeachingTotalLarge CommunitySmallTeachingTotalLarge CommunitySmallTeachingTotalLarge CommunitySmallTeachingTotal
RNRATIO
RPNRATIO
AGNRATIO
NPRATIO
TOTSTAFFRATIO
N Mean Std. Deviation Minimum Maximum Skewness
Std. Errorof
Skewness Kurtosis
Std. Errorof
Kurtosis
Note: Unit ED level unit of analysis

182
Covariates – Descriptive Statistics
96 48810.05 36161.562 4505 194460 1.482 .246 2.647 .488100 48561.52 36059.987 4311 200130 1.383 .241 2.425 .478103 48792.63 36169.480 4248 197065 1.360 .238 2.177 .47299 50490.14 36213.012 4953 192037 1.314 .243 1.859 .481101 51078.89 38016.840 3778 188919 1.292 .240 1.551 .476499 49549.20 36404.012 3778 200130 1.348 .109 1.977 .21896 .03717 .005728 .028 .050 .257 .246 -1.032 .488100 .03727 .006022 .027 .055 .390 .241 -.608 .478103 .03740 .006004 .028 .055 .450 .238 -.503 .47299 .03788 .006395 .018 .056 .071 .243 -.035 .481101 .03840 .006082 .028 .057 .260 .240 -.470 .476499 .03763 .006045 .018 .057 .283 .109 -.508 .21896 .8671 .09562 .65 1.00 -.620 .246 -.776 .488100 .8632 .09831 .61 .99 -.740 .241 -.509 .478103 .8799 .08959 .61 1.00 -.753 .238 -.174 .47299 .8337 .10632 .55 .99 -.487 .243 -.564 .481101 .8327 .10345 .57 .99 -.433 .240 -.732 .476499 .8554 .10022 .55 1.00 -.617 .109 -.540 .21896 83.8345 7.95867 59.88 96.68 -.639 .246 .409 .488100 82.9251 9.11663 53.95 97.22 -.746 .241 .799 .478103 83.1237 8.95447 55.10 100.00 -.562 .238 .388 .47299 82.3524 8.45292 60.90 98.40 -.190 .243 -.522 .481101 83.3674 7.78067 62.01 96.98 -.144 .240 -.491 .476499 83.1169 8.45465 53.95 100.00 -.487 .109 .183 .21896 72.0589 4.71737 61.10 84.10 .133 .246 -.085 .488100 71.9960 4.73070 59.95 82.64 -.068 .241 .125 .478103 72.5802 4.71372 57.70 85.53 -.039 .238 .797 .47299 72.3967 4.73112 57.26 84.15 -.510 .243 1.161 .481101 73.4268 4.33185 60.73 83.81 -.342 .240 .410 .476499 72.4978 4.65661 57.26 85.53 -.173 .109 .385 .218
Year2005/2006YE2006/2007YE2007/2008YE2008/2009YE2009/2010YETotal2005/2006YE2006/2007YE2007/2008YE2008/2009YE2009/2010YETotal2005/2006YE2006/2007YE2007/2008YE2008/2009YE2009/2010YETotal2005/2006YE2006/2007YE2007/2008YE2008/2009YE2009/2010YETotal2005/2006YE2006/2007YE2007/2008YE2008/2009YE2009/2010YETotal
# OF VISITS
EDCMI
EDWAIT
EDCLEAN
DRCOURTESY
N Mean Std. Deviation Minimum Maximum Skewness
Std. Errorof
Skewness Kurtosis
Std. Errorof
Kurtosis
Note: Unit ED level unit of analysis
Analysis of Variance between Groups: Year
ANOVA Table
5.3E+008 4 133235942.5 .100 .9826.6E+011 494 13349040076.6E+011 498
.000 4 .000 .718 .580
.018 494 .000
.018 498
.180 4 .045 4.610 .0014.822 494 .0105.002 498
117.313 4 29.328 .408 .80335480.285 494 71.82235597.599 498
132.556 4 33.139 1.535 .19110666.094 494 21.59110798.650 498
(Combined)Between GroupsWithin GroupsTotal
(Combined)Between GroupsWithin GroupsTotal
(Combined)Between GroupsWithin GroupsTotal
(Combined)Between GroupsWithin GroupsTotal
(Combined)Between GroupsWithin GroupsTotal
# OF VISITS* Year
EDCMI * Year
EDWAIT * Year
EDCLEAN * Year
DRCOURTESY * Year
Sum ofSquares df Mean Square F Sig.
Note: Unit ED level unit of analysis

183
Covariates by Hospital Peer Group – Descriptive Statistics
298 57750.51 35649.728 4953 200130 1.474 .141 2.655 .281123 16078.45 6385.215 3778 32558 .360 .218 -.286 .43378 70996.77 32994.216 14856 146695 .760 .272 -.351 .538
499 49549.20 36404.012 3778 200130 1.348 .109 1.977 .218298 .03907 .004441 .018 .047 -.600 .141 .541 .281123 .03107 .001772 .027 .035 .325 .218 -.461 .43378 .04246 .007402 .030 .057 -.250 .272 -1.021 .538
499 .03763 .006045 .018 .057 .283 .109 -.508 .218298 .8389 .08565 .57 .99 -.395 .141 -.451 .281123 .9533 .02756 .84 1.00 -1.164 .218 2.295 .43378 .7640 .10313 .55 .98 .226 .272 -.802 .538
499 .8554 .10022 .55 1.00 -.617 .109 -.540 .218298 80.8056 7.84973 53.95 97.06 -.743 .141 .805 .281123 91.3634 5.31239 75.00 100.00 -1.148 .218 .829 .43378 78.9433 5.74207 64.93 90.70 -.377 .272 -.507 .538
499 83.1169 8.45465 53.95 100.00 -.487 .109 .183 .218298 71.0411 4.38151 57.26 81.21 -.458 .141 .213 .281123 76.1380 4.19979 67.06 85.53 .022 .218 -.713 .43378 72.3227 2.97286 64.00 80.06 -.360 .272 .031 .538
499 72.4978 4.65661 57.26 85.53 -.173 .109 .385 .218
Peer_GrpLarge CommunitySmallTeachingTotalLarge CommunitySmallTeachingTotalLarge CommunitySmallTeachingTotalLarge CommunitySmallTeachingTotalLarge CommunitySmallTeachingTotal
# OF VISITS
EDCMI
EDWAIT
EDCLEAN
DRCOURTESY
N Mean Std. Deviation Minimum Maximum SkewnessStd. Error ofSkewness Kurtosis
Std. Error ofKurtosis
Note: Unit ED level unit of analysis
Analysis of Variance between Groups: Peer Group
ANOVA Table
1.9E+011 2 9.686E+010 103.039 .0004.7E+011 496 940032041.66.6E+011 498
.008 2 .004 183.463 .000
.010 496 .000
.018 4981.912 2 .956 153.403 .0003.090 496 .0065.002 498
11315.144 2 5657.572 115.563 .00024282.454 496 48.95735597.599 4982264.581 2 1132.291 65.809 .0008534.069 496 17.206
10798.650 498
(Combined)Between GroupsWithin GroupsTotal
(Combined)Between GroupsWithin GroupsTotal
(Combined)Between GroupsWithin GroupsTotal
(Combined)Between GroupsWithin GroupsTotal
(Combined)Between GroupsWithin GroupsTotal
# OF VISITS * Peer_Grp
EDCMI * Peer_Grp
EDWAIT * Peer_Grp
EDCLEAN * Peer_Grp
DRCOURTESY *Peer_Grp
Sum ofSquares df Mean Square F Sig.
Note: Unit ED level unit of analysis
184
Appendix O. Nurse Staffing and Patient Satisfaction with Nursing Care
Nurse Staffing and Patient Satisfaction with Nursing Care—Answer Table O.1 shows the results of the model. Patient gender, age, cleanliness of
the ED, attending physician courtesy, and wait times were significantly associated with
patient satisfaction with nursing care—ANSWER. No statistically significant
associations were found between ED size and case mix index and the patient
satisfaction with nursing care—ANSWER. Compared to teaching hospitals, large
community and small hospitals did not have significantly different levels of patient
satisfaction with nursing care—ANSWER.
The percent of full-time nursing worked hours was negatively associated with
patient satisfaction with nursing care—ANSWER with an estimate of -0.03 (p<0.05).
Each one percent increase in full-time nursing staff was associated with a decrease in
patient satisfaction with nursing care of approximately 0.03 on a scale of 0 to 100. No
statistically significant associations were found between RN proportion, agency
proportion, nurse experience, RN, and RPN worked hours per length of stay and patient
satisfaction with nursing care—ANSWER.

185
Table O-1. Linear Mixed Model: Patient Satisfaction with Nursing Care—ANSWER
Effect Description Estimate Standard Error Pr > |t|
Intercept 31.6474 3.8884 <.0001Year 1 0.3406 0.273 0.2129Year 2 -0.3021 0.2651 0.2552Year 3 -0.2595 0.2739 0.344Year 4 0.4523 0.2425 0.063Year 5 0 a . .
Hospcmi -47.487 50.756 0.3495Gender Female -0.4591 0.1536 0.0035Gender Male 0 a . .
Patagegrp Under 18 -3.6338 0.246 <.0001Patagegrp 18 -34 -7.5193 0.2515 <.0001Patagegrp 35 - 44 -3.1388 0.2765 <.0001Patagegrp 45 -54 -1.6092 0.2451 <.0001Patagegrp 55 -65 -0.6429 0.2391 0.0074Patagegrp Over 65 0 a . .
Peer Group Large Community
-1.3728 0.6554 0.0387
Peer Group Small -0.09011 0.9281 0.9228Peer Group Teaching 0 a . .
EDClean 0.216 0.002809 <.0001# of Visits -7.52E-06 7.90E-06 0.3408
DRcourtesy 0.3849 0.003093 <.0001EDWAIT 10.072 2.3429 <.0001
NURSEEXP 0.02271 0.04052 0.5751RNPROP 1.9809 2.1959 0.367
AGNPROP -1.5404 4.5958 0.7375PERFTHRS -0.03072 0.01302 0.0183RNHPLOS 0.3476 0.7348 0.6362
RPNHPLOS 6.4306 5.1329 0.2103
Note: Unit level of analysis: Level 1 – Patient; Level II - ED

186
Nurse Staffing and Patient Satisfaction with Nursing Care—Explain
Table O.2 shows the results of the model. Patient age, cleanliness of the ED,
and attending physician courtesy were significantly associated with patient satisfaction
with nursing care—EXPLAIN. No statistically significant associations were found
between ED size, case mix index, wait times, and the patient satisfaction with nursing—
EXPLAIN. Compared to teaching hospitals, large community and small hospital did not
have significantly different levels of patient satisfaction with nursing care—EXPLAIN.
On average, RN skill mix (RNPROP) and RPN worked hours per length of stay
(RPNHPLOS) were positively associated with patient satisfaction with nursing care—
EXPLAIN with estimates of 8.52 (p<0.05) and 22.08 (p<0.01) respectively. Thus, for
each hour increase in RPN worked hours per length of stay, there was an associated
increase in patient satisfaction with nursing care—EXPLAIN of about .22 on a scale of 0
to 100. For each one percent increment in RN staff skill mix, however, there was an
associated increased in patient satisfaction with nursing care of 0.085 on a scale of 0 to
100. No statistically significant associations were found between agency proportion,
percent full-time nurses, nurse experience, RN worked hours per length of stay, and
patient satisfaction with nursing care—EXPLAIN.

187
Table O-2. Linear Mixed Model: Patient Satisfaction with Nursing Care—EXPLAIN
Effect Description Estimate Standard Error Pr > |t|
Intercept 0.4122 6.0474 0.9458Year 1 -0.3861 0.4294 0.3692Year 2 -0.7493 0.4205 0.0756Year 3 -0.6843 0.4351 0.1166Year 4 -0.6269 0.3838 0.1032Year 5 0 a . .
Hospcmi -121.57 79.047 0.1241Gender Female -0.3164 0.2456 0.2005Gender Male 0 a . .
Patagegrp Under 18 3.267 0.3941 <.0001Patagegrp 18 -34 -2.0923 0.3942 <.0001Patagegrp 35 - 44 0.7656 0.4397 0.0823Patagegrp 45 -54 0.8632 0.3891 0.027Patagegrp 55 -65 1.5821 0.3799 <.0001Patagegrp Over 65 0 a . .
Peer Group Large Community
-1.0507 0.9897 0.2909
Peer Group Small 2.1679 1.4126 0.1279Peer Group Teaching 0 a . .
EDClean 0.2374 0.00429 <.0001# of Visits -7.44E-06 0.000012 0.5344
DRcourtesy 0.4965 0.004703 <.0001EDWAIT 6.3903 3.6584 0.0807
NURSEEXP -0.03347 0.06379 0.5998RNPROP 8.521 3.4127 0.0125
AGNPROP 10.4811 7.0333 0.1362PERFTHRS -0.00752 0.02085 0.7183RNHPLOS 0.5557 1.1712 0.6352
RPNHPLOS 22.0833 8.2541 0.0075 Note: Unit level of analysis: Level 1 – Patient; Level II - ED

188
Nurse Staffing and Patient Satisfaction with Nursing Care—Trust
Table O.3 shows the results of the model. Patient gender, age, cleanliness of
the ED, attending physician courtesy, and wait times were significantly associated with
patient satisfaction with nursing care. No statistically significant associations were
found between ED size and case mix index and the patient satisfaction with nursing
care—EXPLAIN. Compared to teaching hospitals, large community had significantly
different levels of patient satisfaction with nursing care—Trust.
On average, RN skill mix (RNPROP) and RPN worked hours per length of stay
(RPNHPLOS) were positively associated with patient satisfaction with nursing care, with
estimates of 5.43 (p<0.01) and 11.02 (p<0.01), respectively. Thus, for each one
percent increase in RPNHPLOS, there was an associated increase in patient
satisfaction with nursing care of about .11 on a scale of 0 to 100. For each one percent
increment in RN staff skill mix, however, there was an associated increased in patient
satisfaction with nursing care of 0.05 on a scale of 0 to 100. No statistically significant
associations were found between agency proportion, nurse experience, RN worked
hours per length of stay, percent full-time nurses, and patient satisfaction with nursing
care—TRUST.

189
Table O-3. Linear Mixed Model: Patient Satisfaction with Nursing Care—TRUST
Effect Description Estimate Standard Error Pr > |t|
Intercept 31.6585 3.1773 <.0001Year 1 0.2452 0.2228 0.2717Year 2 0.07601 0.2159 0.725Year 3 -0.2677 0.2223 0.2292Year 4 0.3223 0.197 0.1027Year 5 0 a . .
Hospcmi -49.7257 41.2176 0.2277Gender Female -1.5881 0.1242 <.0001Gender Male 0 a . .
Patagegrp Under 18 -3.9802 0.1989 <.0001Patagegrp 18 -34 -7.4181 0.2037 <.0001Patagegrp 35 - 44 -4.1821 0.2237 <.0001Patagegrp 45 -54 -2.7259 0.1983 <.0001Patagegrp 55 -65 -1.5422 0.1931 <.0001Patagegrp Over 65 0 a . .
Peer Group Large Community
-1.3493 0.5532 0.0164
Peer Group Small -0.5848 0.7783 0.4542Peer Group Teaching 0 a . .
EDClean 0.2183 0.002302 <.0001# of Visits -6.51E-06 6.63E-06 0.3261
DRcourtesy 0.3581 0.00255 <.0001EDWAIT 11.0772 1.9206 <.0001
NURSEEXP 0.07763 0.03314 0.0192RNPROP 5.4292 1.7962 0.0025
AGNPROP -2.2508 3.8297 0.5567PERFTHRS -0.01842 0.01068 0.0846RNHPLOS 0.1232 0.6054 0.8387
RPNHPLOS 11.0146 4.2526 0.0096
Note: Unit level of analysis: Level 1 – Patient; Level II - ED

190
Nurse Staffing and Patient Satisfaction with Nursing Care—Respect
Table O.4 shows the results of the model. Patient gender, age, cleanliness of
the ED, attending physician courtesy, ED size, and wait times were significantly
associated with patient satisfaction with nursing care. No statistically significant
associations were found between case mix index and the patient satisfaction with
nursing—RESPECT. Compared to teaching hospitals, large community had
significantly different levels of patient satisfaction with nursing care—RESPECT
(p<0.05).
No statistically significant associations were found between RN proportion,
agency proportion, percent full-time nurses, nurse experience, RN worked hours per
length of stay, and patient satisfaction with nursing care—RESPECT.

191
Table O-4. Linear Mixed Model: Patient Satisfaction with Nursing Care—RESPECT
Effect Description Estimate Standard Error Pr > |t|
Intercept 66.212 3.0302 <.0001Year 1 -0.3016 0.2148 0.1611Year 2 -0.979 0.2085 <.0001Year 3 -0.4777 0.2145 0.0265Year 4 0.08033 0.1907 0.6739Year 5 0 a . .
Hospcmi -8.9954 39.1387 0.8182Gender Female 0.5647 0.1204 <.0001Gender Male 0 a . .
Patagegrp Under 18 -0.5538 0.1926 0.0042Patagegrp 18 -34 -2.751 0.1975 <.0001Patagegrp 35 - 44 -1.2372 0.2169 <.0001Patagegrp 45 -54 -0.1793 0.1923 0.3517Patagegrp 55 -65 0.37 0.1871 0.0485Patagegrp Over 65 0 a . .
Peer Group Large Community
-1.1514 0.5114 0.0265
Peer Group Small -1.0398 0.7222 0.153Peer Group Teaching 0 a . .
EDClean 0.07406 0.00223 <.0001# of Visits -0.00002 6.16E-06 <.0001
DRcourtesy 0.1564 0.002472 <.0001EDWAIT 8.6956 1.84 <.0001
NURSEEXP 0.05693 0.03161 0.0717RNPROP 3.1897 1.7035 0.0611
AGNPROP -7.0737 3.6608 0.0533PERFTHRS -0.01566 0.01021 0.1252RNHPLOS 0.2135 0.5781 0.7119
RPNHPLOS 6.4177 4.0435 0.1125
Note: Unit level of analysis: Level 1 – Patient; Level II - ED

192
Nurse Staffing and Patient Satisfaction with Nursing Care—Courtesy
Table O.5 shows the results of the model. Patient gender, age, cleanliness of
the ED, attending physician courtesy, and wait times were significantly associated with
patient satisfaction with nursing care. No statistically significant associations were
found between ED size and case mix index and the patient satisfaction with nursing—
Courtesy. Compared to teaching hospitals, large community had significantly different
levels of patient satisfaction with nursing care—Courtesy (p<0.05).
On average, RN skill mix (RNPROP) and RPN worked hours per length of stay
(RPNHPLOS) were positively associated with patient satisfaction with nursing care—
COURTESY, with estimates of 5.85 (p<0.001) and 16.55 (p<0.0001), respectively.
Thus, for each percent increase in RPNHPLOS, there was an associated increase in
patient satisfaction with nursing care of about .166 on a scale of 0 to 100. For each one
percent increment in RN staff skill mix, however, there was an associated increased in
patient satisfaction with nursing care—COURTESY of 0.058 on a scale of 0 to 100. The
percent of full-time nursing worked hours was negatively associated with patient
satisfaction with nursing care—COURTESY with an estimate of -0.02 (p<0.05). Each
one percent increase in full-time nursing staff was associated with a decrease in patient
satisfaction with nursing care—COURTESY of approximately 0.02 on a scale of 0 to
100. No statistically significant associations were found between agency proportion,
nurse experience, RN worked hours per length of stay, and patient satisfaction with
nursing care—COURTESY.

193
Table O-5. Linear Mixed Model: Patient Satisfaction with Nursing Care—COURTESY
Effect Description Estimate Standard Error Pr > |t|
Intercept 16.3941 2.8142 <.0001Year 1 -0.1678 0.187 0.3701Year 2 -0.4931 0.1803 0.0065Year 3 -0.3571 0.1849 0.0542Year 4 -0.06089 0.1609 0.7053Year 5 0 a . .
Hospcmi -67.9217 37.4723 0.0699Gender Female -1.248 0.1007 <.0001Gender Male 0 a . .
Patagegrp Under 18 -1.24 0.1616 <.0001Patagegrp 18 -34 -2.4759 0.1652 <.0001Patagegrp 35 - 44 -0.7995 0.1813 <.0001Patagegrp 45 -54 0.1319 0.1607 0.4121Patagegrp 55 -65 0.295 0.1563 0.0597Patagegrp Over 65 0 a . .
Peer Group Large Community
-1.2553 0.6 0.0389
Peer Group Small 0.1823 0.8244 0.8255Peer Group Teaching 0 a . .
EDClean 0.1518 0.001868 <.0001# of Visits -0.00001 6.86E-06 0.1198
DRcourtesy 0.5219 0.002067 <.0001EDWAIT 7.1667 1.654 <.0001
NURSEEXP 0.01798 0.02909 0.5364RNPROP 5.8487 1.6219 0.0003
AGNPROP -3.3657 3.3216 0.3109PERFTHRS -0.02264 0.009254 0.0144RNHPLOS 0.4965 0.5335 0.3521
RPNHPLOS 16.5479 3.8048 <.0001 Note: Unit level of analysis: Level 1 – Patient; Level II - ED

194
Nurse Staffing and Patient Satisfaction with Nursing Care—Availability
Table O.6 shows the results of the model. Patient gender, age, cleanliness of
the ED, attending physician courtesy, and wait times were significantly associated with
patient satisfaction with nursing care. No statistically significant associations were
found between ED size and case mix index and the patient satisfaction with nursing—
AVAILABLE. Compared to teaching hospitals, small hospitals had significantly different
levels of patient satisfaction with nursing care—AVAILABILITY (p<0.001).
On average, RN skill mix (RNPROP), RN worked hours per length of stay
(RNHPLOS), and RPN worked hours per length of stay (RPNHPLOS) were positively
associated with patient satisfaction with nursing care—AVAILABILITY, with estimates of
6.38 (p<0.01), 1.45 (p<0.05), and 18.1 (p<0.0001), respectively. Thus, for each percent
increase in RNHPLOS there was an associated increase in patient satisfaction with
nursing care—AVAILABILITY of about .015 on a scale of 0 to 100. For each percent
increase in RPNHPLOS, there was an associated increase in patient satisfaction with
nursing care of about .181 on a scale of 0 to 100. For each one percent increment in
RN staff skill mix, however, there was an associated increased in patient satisfaction
with nursing care of 0.06 on a scale of 0 to 100. The percent of full-time nursing worked
hours was negatively associated with patient satisfaction with nursing care with an
estimate of -0.02 (p<0.05). Each one percent increase in full-time nursing staff was
associated with a decrease in patient satisfaction with nursing care of approximately
0.02 on a scale of 0 to 100. No statistically significant associations were found between
agency proportion and nurse experience and patient satisfaction with nursing care—
AVAILABILITY.

195
Table O-6. Linear Mixed Model: Patient Satisfaction with Nursing Care—AVAILABILITY
Effect Description Estimate Standard Error Pr > |t|
Intercept -2.6184 3.3719 0.4392Year 1 -1.011 0.2193 <.0001Year 2 -1.0032 0.2111 <.0001Year 3 -0.7004 0.2159 0.0013Year 4 -0.2375 0.1862 0.2029Year 5 0 a . .
Hospcmi -77.0963 45.4634 0.0899Gender Female -1.4333 0.1161 <.0001Gender Male 0 a . .
Patagegrp Under 18 -2.0887 0.1867 <.0001Patagegrp 18 -34 -3.334 0.1906 <.0001Patagegrp 35 - 44 -1.5755 0.2091 <.0001Patagegrp 45 -54 -0.705 0.1854 0.0002Patagegrp 55 -65 -0.2557 0.1804 0.1568Patagegrp Over 65 0 a . .
Peer Group Large Community
-0.8402 0.8 0.2961
Peer Group Small 3.7159 1.0853 0.0009Peer Group Teaching 0 a . .
EDClean 0.2048 0.002154 <.0001# of Visits -7.83E-06 8.85E-06 0.3761
DRcourtesy 0.5012 0.002383 <.0001EDWAIT 13.3885 1.9494 <.0001
NURSEEXP 0.03492 0.03455 0.3121RNPROP 6.3762 1.9488 0.0011
AGNPROP -4.7601 3.9262 0.2254PERFTHRS -0.02172 0.01093 0.047RNHPLOS 1.4489 0.6373 0.023
RPNHPLOS 18.0958 4.5625 <.0001
Note: Unit level of analysis: Level 1 – Patient; Level II - ED

196
Nurse Staffing and Patient Satisfaction with Nursing Care—DRNURSEWK
Table O.7 shows the results of the model. Patient gender, age, cleanliness of
the ED, attending physician courtesy, and wait times were significantly associated with
patient satisfaction with nursing care—DRNURSEWK. No statistically significant
associations were found between ED size and case mix index and the patient
satisfaction with nursing—DRNURSEWK. Compared to teaching hospitals, large
community and small hospitals did not have significantly different levels of patient
satisfaction with nursing care—DRNURSEWK (p>0.05).
On average, RN skill mix (RNPROP) and RPN worked hours per length of stay
(RPNHPLOS) were positively associated with patient satisfaction with nursing care—
DRNURSEWK, with estimates of 4.09 (p<0.01) and 8.84 (p<0.01), respectively. Thus,
for each percent increase in RPNHPLOS, there was an associated increase in patient
satisfaction with nursing care—DRNURSEWK of about .088 on a scale of 0 to 100. For
each one percent increment in RN staff skill mix, however, there was an associated
increased in patient satisfaction with nursing care of .041 on a scale of 0 to 100.
NURSEEXP was positively associated with patient satisfaction with nursing care—
DRNURSEWK with estimates of 0.05 (p<0.05). So for each year of nursing experience,
there was an associated increase in patient satisfaction with nursing—DRNURSEWK of
about 0.05 on a scale of 0 to 100. No statistically significant associations were found
between agency proportion, RN worked hours per length of stay, percent full-time
nurse, and patient satisfaction with nursing care—DRNURSEWK.

197
Table O-7. Linear Mixed Model: Patient Satisfaction with Nursing Care—DRNURSEWK
Effect Description Estimate Standard Error Pr > |t|
Intercept 4.2904 2.3462 0.0704Year 1 -0.7084 0.1614 <.0001Year 2 -0.5446 0.1563 0.0005Year 3 -0.3802 0.1606 0.0185Year 4 0.1926 0.1415 0.1742Year 5 0 a . .
Hospcmi -56.0645 30.6745 0.0676Gender Female -0.4962 0.08903 <.0001Gender Male 0 a . .
Patagegrp Under 18 -1.1906 0.1427 <.0001Patagegrp 18 -34 -2.5906 0.1462 <.0001Patagegrp 35 - 44 -1.5939 0.1604 <.0001Patagegrp 45 -54 -0.7519 0.1422 <.0001Patagegrp 55 -65 0.1756 0.1383 0.205Patagegrp Over 65 0 a . .
Peer Group Large Community
-0.6313 0.4331 0.148
Peer Group Small 1.1198 0.6051 0.0671Peer Group Teaching 0 a . .
EDClean 0.16 0.001656 <.0001# of Visits 1.85E-06 5.13E-06 0.7188
DRcourtesy 0.6431 0.001838 <.0001EDWAIT 6.778 1.4075 <.0001
NURSEEXP 0.04913 0.02441 0.0442RNPROP 4.0928 1.3359 0.0022
AGNPROP -5.6523 2.8114 0.0444PERFTHRS -0.01367 0.007834 0.0809RNHPLOS 0.6856 0.4464 0.1246
RPNHPLOS 8.8352 3.1558 0.0051
Note: Unit level of analysis: Level 1 – Patient; Level II - ED

198
Appendix P. Predicted Patient Satisfaction for a Typical ED
Patient Satisfaction with Nursing Care (Nurse Aggregate Score) in 2009/10
50
55
60
65
70
75
80
85
90
95
100
0 20,000 40,000 60,000 80,000 100,000 120,000 140,000 160,000 180,000Visits
Pat
Sat
with
Nur
sing
Car
e %
Predicted Patient Satisfaction with Nursing Care in 2009/10(Using median covariates values and nurse staffing variables)
50
55
60
65
70
75
80
85
90
95
100
0 20,000 40,000 60,000 80,000 100,000 120,000 140,000 160,000 180,000
visits
Pred
icte
d Sa
tisfa
ctio
n %

199
Predicted Patient Satisfaction with Nursing Care in 2009/10 (using medians for nurse staffing and using covariates data)
50
55
60
65
70
75
80
85
90
95
100
0 20,000 40,000 60,000 80,000 100,000 120,000 140,000 160,000 180,000
visits
Pred
icte
d Sa
tisfa
ctio
n %
Recommending the ED in 2009/10
50
55
60
65
70
75
80
85
90
95
100
0 20,000 40,000 60,000 80,000 100,000 120,000 140,000 160,000 180,000Visits
Rec
omm
endi
ng th
e E
D %

200
Predicted Patient Satisfaction - Recommending the ED in 2009/10(Using median covariates values and nurse staffing variables)
50
55
60
65
70
75
80
85
90
95
100
0 20,000 40,000 60,000 80,000 100,000 120,000 140,000 160,000 180,000
visits
Pred
icte
d Sa
tisfa
ctio
n %
Predicted Patient Satisfaction - Recommending the ED in 2009/10 (using medians for nurse staffing and using covariates data)
50
55
60
65
70
75
80
85
90
95
100
0 20,000 40,000 60,000 80,000 100,000 120,000 140,000 160,000 180,000
visits
Pred
icte
d Sa
tisfa
ctio
n %