the relationship between job …docs.neu.edu.tr/library/6507615412.pdfwork commitment among...
TRANSCRIPT

NEAR EAST UNIVERSITY
GRADUATE SCHOOL OF SOCIAL SCIENCES
BUSINESS ADMINISTRATION DEPARTMENT
BUSINESS ADMINISTRATION (MBA) PROGRAMME
MASTER'S THESIS
THE RELATIONSHIP BETWEEN JOB SATISFACTION AND
ORGANIZATIONAL COMMITMENT FOR ACADEMIC STAFF
AND ADMINISTRATIVE SUPPORT STAFF: A STUDY OF A
COLLEGE IN PALESTINE
AREEJ RAMZI A. H. ABURADAHI
NICOSIA
2017
NEAR EAST UNIVERSITY
GRADUATE SCHOOL OF SOCIAL SCIENCES
BUSINESS ADMINISTRATION DEPARTMENT
BUSINESS ADMINISTRATION (MBA) PROGRAMME
MASTER'S THESIS
THE RELATIONSHIP BETWEEN JOB SATISFACTION AND
ORGANIZATIONAL COMMITMENT FOR ACADEMIC STAFF
AND ADMINISTRATIVE SUPPORT STAFF: A STUDY OF A
COLLEGE IN PALESTINE
PREPARED BY
AREEJ RAMZI A. H. ABURADAHI
20146783
THESIS SUPERVISOR
ASSOC.PROF.DR. SERIFE EYÜPOĞLU
NICOSIA
2017

NEAT EAST UNIVERSTITY
THE GRADUATE SCHOOL OF SOCIAL SCIENCES
Business Administration Master Program
Thesis Defense
The Relationship between Job satisfaction and organizational commitment for
Academic staff and Administrative Support staff: a study of a college in
Palestine
We certify the thesis is satisfactory for the award of degree of Masters of
Business Administration
Prepared by:
Areej Ramzi A. H. Aburadahi
Examining Committee in Charge
Assoc. Prof. Dr. Serife Eyüpoğlu Near East University
Department of Business Administration
Assoc. Prof. Dr. Tülen Saner Near East University
School of Tourism and Hotel Management
Dr. Berna Serener Near East University
Department of Human Resource Management
Approval of the Graduate School of Social Sciences
Assoc. Prof. Dr. Serife Eyüpoğlu
Acting Director

88
REFERENCES
Akfopure, R.R., Ikhifa, O.G., Imide, O.I., & Okokoyo, I. E. (2006). "Job
satisfaction among educators in colleges of education in Southern
Nigeria". Journal of Applied Sciences, 6(5), 1094-1098.
Allen, N.J. and Meyer, J.P. (1990) ‘The Measurement and Antecedents of
Affective, Continuance and Normative Commitment to the Organization’,
Journal of Occupational Psychology, 63, 1–18.
Al-Smadi Marwm , Qblan's Yahay (2015). Assessment of Job Satisfaction amongFaculty Members and its Relationship with Some Variables in NajranUniversity Journal of Education and Practic. Vol.6, No.35, 2015.
Anchani, King chan, (1986) "Communication, job satisfaction and organizational
commitment at business college faculty" Dissertation Abstract
International. Vol.46. No-12. p.3774.
Awang, Z., Ahmad, J. H. & Zin, N. M. (2010). Modelling Job Satisfaction And
Work Commitment Among Lecturers: A Case of UiTM Kelantan. Journal
of Statistical Modeling and Analytics,1(2), 45-59.
Ayeni, C. O., & Phopoola, S. O. (2007). ‘Work Motivation, Job Satisfaction, and
Organizational Commitment of Library Personnel in Academic and
Research Libraries in Oyo State, Nigeria’, Library Philosophy and
Practice 2007.
Abu- Nada, S. (2007). The relationship between some personal variables and
leadership types, on the one hand, and the organizational commitment and the
feeling of organizational justice, on the other, in some Palestinian Ministries in
Gaza Strip. Master thesis, Islamic university, Gaza, Palestine.
Bahari bin Mat (1997),‘Kepuasan Kerja Dikalangan Guru-Guru Sekolah
Menengah Di Felda Jengka’, Unpublish Masters Desertation, Universiti
Utara Malaysia
Bateman, T.S. and Strasser, S. (1984). A Longitudinal Analysis Of The
Antecedents Of Organizational Commitment, Academy of Management
Journal, 27, 95-112.

89
Becker, T. E., Randal, D. M., & Riegel, C. D. (1995). The Multidimensional View
Of Commitment And Theory Of Reasoned Action. A Comparative
Berry, J. L., (1977) Research in Higher Education, 7: 269 – 280.
Evaluation: Journal of Management,21(4), 17-638.
Bhuian, S. N. & Menguc, B. (2002). An Extension And Evaluation Of Job
Characteristics, Organizational Commitment And Job Satisfaction In An
Expatriate, Guest Worker, Sales Setting. Journal of Personal Selling & Sales
Management, 22(1), 1-11.
Boles, J., Madupalli, R., Rutherford, B., & Wood, J. A. (2007). The Relationship
Of Facets Of Salesperson Job Satisfaction With Affective Organizational
Commitment. Journal of Business & Industrial Marketing, 22, 311-321.
Bowling, N.A. (2007). Is the Job Satisfaction-Job Performance Relationship
Spurious: A Meta-Analytic Examination. Journal of Vocational Behavior, 71,
167-185.
Bruner, M., C., (1994). The overall job satisfaction of faculty members in selected
rural community colleges. (Ed. D. East Texas State University, IN.
Cohen, A. (1996). On The Discriminant Validity Of The Meyer And Allen
Measure Of Organizational Commitment: How Does It Fit With The
Work Commitment Construct. Educational & Psychological
Measurement, 56(3), 494-593.
Cote, S., & Heslin, P. (2003). ‘Job Satisfaction and Organizational Commitment’.
Chandrashekharan, N. (2006). Towards Logistics Effectiveness In India. Materials
Management Review, 10.
Cranny, C., Smith, P., & Stone, E. (Eds.). (1992). Job Satisfaction: How People
Feel About Their Jobs And How It Affects Their Performance. New York:
Lexington Books.
Currivan D.B. (1999). The Causal Order Of Job Satisfaction And Organizational
Commitment In Models Of Employee Turnover. Human Resource
Management Review, 10534822, Winter 99, 9(4). Dissertation Abstract
International.55(2), 187-A.

90
Carry L., Cooper and Denek Tomington, (1979) "Strategies for Relieving Stress at
work, "Personnel Management", Vol. 11. No.6.
Carengi Foundation for the Advancement of teaching change, 1985; 17: No. 4, 31-
34.
Colardarci, T., (1992). Teacher's of efficiency and commitment to teaching.
Journal of Experimental Education, 60(4), 323-373.
Davis, Keith and Newstrom, John, (1985). Human behavior at work:
organizational behavior, 7th ed. McGrow- Hill Book Company, New
York. 158
Dubinsky, A. J., Micheals, R. E., Kotabe, M., Chae, U. L. and Hee-Cheol, M.,
(1990). Influence Of Role Stress On Industrial Salespeople’s Work
Outcomes In The United States, Japan, And Korea. Journal of
International Business Studies, First Quarter, 77-99.
Eyupoglu, Saner's study (2009). "Job satisfaction: Does rank make a difference?".African Journal of Business Management Vol.3 (10), pp. 609-615,October,http://www.academicjournals.org/ajbm DOI: 10.5897/AJBM09.Academic Journals
Friedman, L., A., (1991). High – and low burnout school culture aspects of
teacher burnout. Journal of Educational Research, 84(6), 325-332.
Feinstein, A. (2002). A Study Of Relationships Between Job Satisfaction And
Organizational Commitment Among Restaurant Employees.William F.
Harrah College Of Hotel Administration University Of Nevada, Las
Vegas.
Fiorita, J. A., Bozeman, D. P., Young, A., Meurs, J. A. (2007). Organization
Commitment, Human Resource Practices, And Organization
Characteristic. Journal Of Managerial Issues 19(2), 186-207.
George, Jenniffer M., and Gareth R. Jones. (1999). Organizational behavior,
2Ed, Addison- Wesley Publishing company, Inc.
Gillett, K., et. Al, (1997) Administrators in north Carolina community
colleges: A comparative study by gender Eric, ED 49073.

91
Glick, N., L., (1991). Satisfaction among academic administration at selected
American colleges and universities Dissertation Abstract International,
52(2), 736A.
Gregersen H., and Stewart (1992). Antecedents to commitment to a parent
company and a foreign operation. Academy of Management Journal,
35(1): 65-90.
Gautam, T., R. Van Dick, U. Wagner, N. Upadhyay, and A.J. Davis, 2005,
“Organizational Citizenship Behaviour And Organizational Commitment
In Nepal”, Asian Journal Of Social Psychology, 8, 305-314.
Getahun, S. B., Sims, Hummer, D. (2008). Job Satisfaction And Organizational
Commitment Among Probation And Parole Officers: A Case Study. A
Professional Journal, 3(1).
Glisson, C. and Durick, M. (1988), “Predictors Of Job Satisfaction And
Organizational Commitment In Human Service Organizations”,
Administrative Science Quarterly, 33, 1, 61-81.
Gunlu, E., Aksarayli, M. & Percin, N. S. (2009). Job Satisfaction And
Organizational Commitment Of Hotel Managers In Turkey. International
Journal of Contemporary Hospitality Management, 22(5), 693-717
Herbert, G., (1980). Personal human resources management I Illihois: Richard
lewin, INC.
Hickman, Craig. And Silva, Michael. (1984). Creating excellence American
Library, New York.
Hoppock, R., (1935). Job Satisfaction, Harper. New York. 159
Hoy, W.,K., & Miskel, C.,W., (1978). Educational administration: theory into
practice (5th ed). McGraw- Hill, New York.
Wood Leith, K and Jantzi, D., (1994). Transformational leadership and
teachers' commitment to change. In Richard Sager and Bruce
G. Barnett (eds) the principal a transformed leader. California Corwing, press, Inc.
Luthans, Fred. (1992). Organizational behavior , 6Ed, New york,
McGraw – Hill, Inc. 124.

92
Hackett, R. D., Bycio, P., & Hausadorf, P.A. (1994). Further Assessment Of
Meyer And Allen's 1991 Three Components Model Of Organizational
Commitment. Journal of Applied Psychology 79, 340-350.
Hellriegel, D., Slocum, J. W., & Woodman, R. W. (2001). Organizational
Behaviour (9th ed.) Ohio: South-Western Publishing.
Hodson, R. (1991). Workplace Behaviors: Good Soldiers, Smooth Operators, and
Saboteurs. Work and Occupations, 18(3), 271-290.
Irving, P. G., Coleman, D. F., & Cooper, C. L. (1997). Futher Assessment Of A
Three Component Model Of Occupational Commitment: Generalizability
And Differences Across Occupation. Journal Of Aplied Psychology, 444-
452.
Joolideh F. & Yeshodhara K. (2008). Organizational Commitment Among High
School Teacher Of India And Iran. Journal Of Educational
Administration, 47(1), 127-136.
Judge, T. A., Thoresen, C. J., Bono, J. E., & Patton, G. K. (2001). The Job
Satisfaction-Job Performance Relationship: A Qualitative And
Quantitative Review. Psychological Bulletin, 127(3), 376-407.
Kim, W.G., Leong, J.K. and Lee, Y. (2005), “Effect Of Service
Orientation On Job Satisfaction, Organizational Commitment, And
Intention Of Leaving In A Casual Dining Chain Restaurant”, Hospitality
Management, 24, 171-93.
Llies, R., & Judge, T. A. (2004). An Experience-Sampling Measure Of Job
Satisfaction And Its Relationships With Affectivity, Mood At Work, Job
Beliefs, And General Job Satisfaction. European Journal of Work and
Organizational Psychology, 13(3), 367-389.
Lambert, E. G. (2004). Organizational citizenship behavior and commitment
among correctional staff. Criminal justice and behavior 35(1).
Lau, C.M. and Chong, J. (2002). The Effects Of Budget Emphasis,
Participation And Organizational Commitment On Job Satisfaction:

93
Evidence From The Financial Services Sector, Advances In Accounting
Behavioral Research, 5, 183-211.
Linz, J. S. (2003).Job Satisfaction Among Russian Workers. Michigan State
University, East Lansing, Michigan, USA.
Locke, E. A. (1976). Organizational Behavior: Effect in the Workplace.
Annual Review of Psychology.
Lok P. & Crawford J. (2001). Antecedents Of Organizational Commitment And
The Mediating Role Of Job Satisfaction. Journal Of Managerial
Psychology, 16(8), 594-613.
Luthans, F. (1998). Organisational Behaviour. (8th ed). Boston: Irwin McGraw-
Hill.
Luchak, A. A., Pohler, D. M., & Gellatly, I. R. (2008). When Do Committed
Employees Retire? The Effects Of Organizational Commitment On
Retirement Plans Under A Defined-Benefit Pension Plan. Human
Resource Management, 47(3), 581-599
Marsh, Robert, and Mannari, Hirosh (1977).Organizational commitment and
Turnover: A prediction Study Administrative Science quarterly. Vol 22,
P.p57- 75.
Maslow, A., (1943). A theory of human motivation. Psychological Review, vol.
50, 370-396.
Morris, J., and J., Sherman, (1981). Generaliz ability of an organizational
commitment model, Academy of Managment Journal, 24: 512-525.
Mowday, Richard T.,& steers, Richard M., (1979). The measurement of
organizational commitment. Journal of Vocational Behavior, 14, 224-
247. 160
Malhorta, N. & Mukerjee, A. (2004). The relative influence of organizational
commitment and job satisfaction on service quality of customer contact
employees in banking call centre. Journal of services marketing 18(3),
162-174.
Meyer, John P., Stanley, David J., Herscovitch, Lynne, Topolnytsky, Laryssa.
(2002). Affective, Continuance, And Normative Commitment To The

94
Organization: A Meta-Analysis Of Antecedents, Correlates, And
Consequences. Journal of Vocational Behavior, 61, 20-52 .
Mowday, R., Porter, L., & Steers, R. (1982). Employee—Organization Linkages:
The Psychology Of Commitment, Absenteeism, And Turnover. New
York: Academic Press.
Murray, L. P., Gregoire, M. B., & Downey, R. G. (1991), “Organizational
Commitment Of Management Employees In Restaurant Operations”,
Hospitality Research Journal,14, 339-348.
Naisbitt, J. & Aburdene, P. (1985). Reinventing The Corporation. New York:
Warner Books.
Nor Salina Saidin (1994 / 1995), ‘Kepuasan Kerja Di Kalangan Pensyarah Di
Unversiti Malaya, Latihan Ilmiah, Sarjana Muda Ekonomi.
Okpara, J. O. (2004). ‘Job Satisfaction and Organizational Commitment: Are
There Differences Between American And Nigerian Managers Employed
In The US Mncs Innigeria? Academy of Business & Administrative
Sciences, Briarcliffe College, Switzerland.
Porter, L., steers, R., Mowday, R., and Boulian, P., (1974) Organizational
commitment, Job satisfaction, and Turnover Among Psychiatric
Technicians. Journal of Applied Psychology, P.59.
Petty, G., and Hatcher, L., M., (1991). Job satisfaction of faculty from technical
institutes community colleges, and universities. Journal of Studies in
Technical Centers 13(4) 361-367.
Reyes, Pedro, Imber Michaed (1992). Teachers perceptions of the Fairness of
their work and their commitment, job satisfaction, and morale:
implications for teacher evaluation, Journal of Personal Examination in
Education, V5, n3p. 291-302.
Rozenholtz, S., (1990). Workplace conditions that affect teacher quality and
commitment: teacher induction programs. The Elementary School
Journal, 89, (4), 421-439.

95
Rozenholtz, S., J., and Simpsom, C., (1990). Workplace condition and the rise and
fall of teacher' commitment. Sociology of Educations, 63, 244-257.
Rosin, H. M., & Korabik, K. (1991). Workplace Variables, Affective Responses,
And Intention To Leave Among Woman Manager. Journal Of Occupational
Psychology, 64, 317-330.
Shuman, J., T., (1982). The relationship between organizational climate, leader
behavior, and teacher job satisfaction in government secondary schools for
boys in Ramallah district. Unpublished thesis of Master of Arts in
Education, Birzeit University.
Samad, S. (2007). Assessing the Effects of Job Satisfaction and Psychological
Contract on Organizational Commitment among Employees in Malaysian
SMEs. The 4th SMEs IN A Global Economy Conference 2007.
Saari, L. M. & Judge, T. A. (2004). Employee Attitudes And Job Satisfaction.
Human Resource Management, 43, 395-407
Sekaran, U. (2003). Research Methods For Business: A Skill Building Approach.
New York : John Wiley & Sons.
Sekaran, U. (2006). Research Methods For Business: A Skill Building Approach.
(4ed.). New Delhi: Sharda Ofsett Press
Swailes, S. (2002). Organizational Commitment: A Critique Of The Construct
And Measures. International Journal Of Management Reviews, 4(2), 155-
78.
Steers R., M., (1977). Antecedents and outcomes of organizational commitment
to organization, Administrative Sciences Quarterly, 22: 143-150.
Smith, P., Kendall. L., and Tlullin, C., (1969) the Measurement of satisfaction
in work and retirement, Chicago: Rand Mchally.
Tarter, C.,J., and Hoy, W.,K., (1989). Principal leadership and organizational
commitment: the principal must deliver. Planning and Changing, 1(3),
130-139. Vroom, V., (1964). Work and motivation. John wiley & Sons,
New York.

96
Taqi (2002) Measuring the ability of demographic factors and work pressure in
predicting the level of organizational commitment in the Kuwaiti health
organizations.
Tülen Saner, Şerife Zihni Eyüpoğlu.(2012). " The Age and Job SatisfactionRelationship in Higher Education". Procedia - Social and BehavioralSciencesVolume 55, 5, Pages 1020-1026 3rd. International Conference on NewHorizons in Education - INTE 2012.
Wild, R., and Dawson, J. A. (1972). The Relationship Of Specific Job Attitudes
With Overall Job Satisfaction And The Influence Of Biographical
Variables. Journal Of Management Studies, 9, 150-157.
Wilson DC, Rosenfield RH (1990). Managing Organizations. London: McGraw-
Hill.
Wong, Y. T., Ngo, H. Y., & Wong, Y. T., (2002). Affective Organizational
Commitment Of Workers In Chinese Joint Ventures. Journal Of
Managerial Psychology.
Zikmund, W. G., Babin, B. J., Carr, J. C. & Griffin, M. (2010). Business Research
Methods (8ed.). Canada: South Western.

97
APPENDEX
THE QUESTIONNAIRE
Dear Respondent,
This questionnaire is part of a master thesis study and it aims to measure whetherthe job satisfaction of employees working in an educational institution influencestheir organizational commitment to the institution. The questionnaire consist ofthree parts. Part 1 is demographical information, part 2 measures job satisfaction,and part 3 measures organization commitment. Please answer as honestly aspossible and it is important that you respond to all of the statements. Theinformation collected will be used for research purposes only. Thank you for yourtime.
Best RegardsAreej AbuRadahi
Part One: Demographical Information
1) Age
1. 20 - 29 2. 30 - 39 3. 40 - 49 5. 50 or morethan
2) Gender
1.Male 2. Female
3) Marital Status
1.Married 2.Not married
4) Position
1. Administrative 2. Academic

98
5) Years of experience in your current job
1. less than 1 2. 1 to 4 3.5 to 9 4. 10 to14 5. 15 to19 6. 20 ormore
6) Years of experience in the sector
1. less than 1 2. 1 to 4 3.5 to 9 4. 10 to 14 5. 15 to 19 6. 20 ormore
7) Monthly salary
1. less than 1000$
2. 1000$ to 1499$
3. 1500$ to1999$
4. 2000$ or more
8) Qualification
1. Diploma 2. Graduate degree 3.Master Degree 4. PhD degree
5. Other (please specify).............................
Part Two Job SATISFACTION
Please use the rating scale below to indicate how satisfied you feel about each of the below listedaspects of your job (The Minnesota Satisfaction Questionnaire, Weiss et al., 1967). Please answeras honestly as possible. It is important that you respond to all the statements.
Very dissatisfied Dissatisfied Neithersatisfied nordissatisfied
Satisfied Very satisfied
1 2 3 4 5

99
1.Being able to keep busy all the time (Activity) 1 2 3 4 5
2. The chance to work alone on the job(Independence)
1 2 3 4 5
3. The chance to do different things from time totime (Variety)
1 2 3 4 5
4. The chance to be somebody in the community(Social Status)
1 2 3 4 5
5. The way my boss handles his/her subordinates(Supervision/ human relations)
1 2 3 4 5
6. The competence of my supervisor in makingdecisions (Supervision/ technical)
1 2 3 4 5
7. Being able to do things that don‘t go againstmy conscience (Moral values)
1 2 3 4 5
8. The way my job provides for steadyemployment (Security)
1 2 3 4 5
9. The chance to do things for other people(Social service)
1 2 3 4 5
10. The chance to tell people what to do(Authority)
1 2 3 4 5
11. The chance to do something that makes use ofmy abilities (Ability)
1 2 3 4 5
12. The way company policies are put intopractice (Policies and practices)
1 2 3 4 5
13. My pay and the amount of work I do(Compensation)
1 2 3 4 5
14. The chances for advancement in this job(Advancement)
1 2 3 4 5
15. The freedom to use my own judgment(Responsibility)
1 2 3 4 5
16. The chance to try my own methods of doingthe job (Creativity)
1 2 3 4 5
17. The working conditions (Working conditions) 1 2 3 4 5
18. The way my colleagues get along with eachother (Co-workers)
1 2 3 4 5
19. The praise I get for doing a good job.(Recognition)
1 2 3 4 5
20. The feeling of accomplishment I get from thejob (Achievement)
1 2 3 4 5

100
Part Three: ORGANIZATIONAL COMMITMENT
definitely disagree Mostlydisagree
Neither Agreenor Disagree
MostlyAgree
Definitely Agree
1 2 3 4 5
1) Affective Commitment Scale Items
1. I would be very happy to spend the rest of mycareer with this organization.
1 2 3 4 5
2. I enjoy discussing about my organization withpeople outside it.
1 2 3 4 5
3. I really feel as if this organization’s problems aremy own.
1 2 3 4 5
4. I think that I could easily become as attached toanother organization as I am to this one.
1 2 3 4 5
5. I do not feel like ‘part of the family’ at myorganization.
1 2 3 4 5
6. I do not feel ‘emotionally attached’ to thisorganization.
1 2 3 4 5
7. This organization has a great deal of personalmeaning for me.
1 2 3 4 5
8. I do not feel a ‘strong’ sense of belonging tomy organization.
1 2 3 4 5
2) Continuance Commitment Scale Items
9. I am not afraid of what might happen if I quitmy job without having another one lined up.
1 2 3 4 5
10. It would be very hard for me to leave myorganization right now, even if I wanted to.
1 2 3 4 5
11. Too much in my life would be disrupted if Idecided to leave my organization now.
1 2 3 4 5
12. It wouldn’t be too costly for me to leave myorganization now.
1 2 3 4 5
13. Right now, staying with my organization is amatter of necessity as much as desire.
1 2 3 4 5

101
The end
Thank you for your time
14. I feel that I have very few options to considerleaving this organization.
1 2 3 4 5
15. One of the few serious consequences of leavingthis organization would be the scarcity of availablealternatives.
1 2 3 4 5
16. One of the major reasons I continue to work forthis organization is that leaving would requireconsiderable personal sacrifice—another organizationmay not match the overall benefits I have here.
1 2 3 4 5
3) Normative Commitment Scale Items
17. I think that people these days move fromcompany to company too often.
1 2 3 4 5
18. I do not believe that a person must always beloyal to his or her organization.
1 2 3 4 5
19. Jumping from organization to organization doesnot seem at all unethical to me.
1 2 3 4 5
20 One of the major reasons I continue to work inthis organization is that I believe loyalty is importantand therefore feel a sense of moral obligation toremain.
1 2 3 4 5
21. If I got another offer for a better job elsewhere Iwould not feel it was right to leave my organization.
1 2 3 4 5
22. I was taught to believe in the value of remainingloyal to one organization.
1 2 3 4 5
23. Things were better in the days when peoplestayed in one organization for most of their careers.
1 2 3 4 5
24. I do not think that to be a ‘company man’ or‘company woman’ is sensible anymore.
1 2 3 4 5

102
ABBREVATIONS
LSD .......................................................................... Least Significant Difference
Q................................................................................. Question
BA.............................................................................. Bachelor
NO...............................................................................Number
S................................................................................... Support
SD...............................................................................Standard Deviation

i
ACKNOWLEDGMENT
I would like to extend my deepest gratitude and appreciation to all who have
helped and supported me to finish this research, without their assistance, this work
would not have reached its end… Thank you
I would like to express my sincere gratitude, thanks and appreciation to my
supervisor Assoc. Prof. Dr. Serife Zihni Eyupoglu for her valuable time,
assistance, guidance and encouragement during this study.
I would also thank my colleagues at Palestine Technical College for their infinite
support, encouragement, advice, and constructive suggestions. For their help and
support during the period of this research.
My sincere thanks and love goes to my beloved family. My parents, sisters and my
only brother. who have been the source of encouragement, unlimited patience and
endless assistance.
To all my friends, without them it would not have been possible to make it and
reach its end for their advice, help, love and support during this research.

ii
ABSTRACT
This study examined the relationship between job satisfaction and organizational
commitment among Palestine college academic staff and administrative support staff.
It also identified the most important factors that contribute in raising the level of their
satisfaction and commitment. and test the effect of some demographic variables (such
as Gender, Marital status, Position, Qualification, Age, years of experiences in the
current job, years of experiences in the sector, and Monthly salary) on level of job
satisfaction and organizational commitment.
The sample of this study was 164 employees out of 168 staff, selected on a stratified
random base, and distributed according to the nature of work, and level of education.
The questionnaire was the main tool for collecting the needed data, It was designed
especially for this aim, and divided into 3 main parts:- the first one meant to collect
personal data, the second part: included questions on job satisfaction, the third part
included questions on employees level of organizational commitment.
SPSS was the main statistical analysis program of the collected data, descriptive
analysis such as frequencies, statistical means, and percentage, were drawn, in
addition to some tests such as one way ANOVAs, T- test, Least Significant Difference
(LSD) test, and the significant level used in this study was 0.05.
Findings indicated there is a relationship between organizational commitment and job
satisfaction and a neutrals' estimate level of organizational commitment and a slightly
estimate job satisfaction among Palestine technical college staff. In addition, there is a
significant difference on organizational commitment and job satisfaction level among
Palestine college staff, related to following demographical variables: (Age,
Qualification, years of experience in the current job, and years of experience in the
sector, Position, Monthly salary of these staff). Also there is no and very little
significant differences on commitment level and satisfaction of these staff related to
(Gender, Marital Status).
Keywords: Job Satisfaction, Organizational Commitment, Higher Education in
Palestine, Palestine Technical College Ramallah, Academic Staff, Administration
Support Staff

iii
الملخص
كلیة فلسطین وموظفي في تناولت هذه الدراسة العالقة بین الرضا الوظیفي وااللتزام التنظیمي بین أعضاء هیئة التدریس
، واختبار تأثیر التنظیميلتزامهمواالوظیفيأهم العوامل التي تساهم في رفع مستوى رضاهمتحددالدعم اإلداري، كما
في الخبرةمثل كما الجنس، الحالة االجتماعیة، الوظیفة، المؤهل العلمي، العمر، سنوات (بعض المتغیرات الدیموغرافیة
على مستوى الرضا الوظیفي وااللتزام التنظیمي) الشهري، والراتبالعمل في قطاعلخبرةالحالیة، سنوات من االوظیفة
.لدیهم
طبقیة عشوائیة، وزعت بطریقةموظفا، تم اختیارهم على 168موظفا من أصل 164مكونة منوكانت عینة الدراسة
.وفقا لطبیعة العمل، ومستوى التعلیم
أجزاء 3إلىهو مقسممیمه خصیصا لهذا الهدف، و وكان االستبیان األداة الرئیسیة لجمع البیانات الالزمة، وقد تم تص
یفي، الجزء تضمن أسئلة حول الرضا الوظ: یهدف إلى جمع البیانات الشخصیة، والجزء الثانيالجزء األول-: رئیسیة
SPSSبرنامج التحلیل اإلحصائيواستخدم .لدى العاملین االلتزام التنظیمياألسئلة عن مستوىعلىالثالث وشمل
، وتحلیل النزعة المركزیة، والنسبة المئویة، الوصفي مثل التكراراتتحلیل وتم استخدام اللبیانات التي تم جمعها، لتحلیل ا
المستخدمة في ، كان مستوى الكفاءة ) LSD(واختبار، تي ، اختبار ANOVAsى بعض االختبارات مثل باإلضافة إل
.0.05هذه الدراسة
مستوى عال من االلتزام التنظیمي كما أشارة إلى والرضا الوظیفي لتزام التنظیميعالقة بین االوأشارت النتائج أن هناك
التنظیمي هناك فروق ذات داللة إحصائیة على مستوى االلتزاموأن والرضا الوظیفي بین الموظفین كلیة فلسطین التقنیة،
العمر، المؤهل العلمي، سنوات من الخبرة في العمل (فیة المتغیرات الدیموغرابفي كلیة فلسطین بین موظوالرضا الوظیفي
فورقاتهناككان ، وأیضا لم )الحالي، وسنوات من الخبرة في هذا القطاع، والوظیفة والراتب الشهري لهؤالء الموظفین
الحالة نس، الج(ذات داللة إحصائیة عن مستوى االلتزام واالرتیاح من هؤالء الموظفین المتعلقة ب قلیلة جدا
)االجتماعیة
الرضا الوظیفي، االلتزام الوظیفي ، التعلیم العالي الفلسطیني، كلیة فلسطین التقنیة رام اهللا للبنات، :الكلمات المفتاحیة
.كادر الدعم اإلداريالكادر األكادیمي،

iv
TABLE OF CONTENTS
ACKNOWLEDGMENT............................................................................ i
ABSTRACT................................................................................................ ii
...........................................................................................................الملخص iii
CHAPTER1................................................................................................. 1
The Study Problem And Its Importance.................................................. 1
1.1 Introduction and background................................................................. 1
1.2 Problem statement ................................................................................. 3
1.3 The purpose of the Study........................................................................ 4
1.4 Objectives of the study........................................................................... 6
1.5 Research Questions.......................................................................................... 7
1.6 Significance of the Study.................................................................................. 7
1.7 Terminology of study............................................................................. 9
1.7.1 Definition of Key Terms...................................................................... 9
1.7.1.1 Job Satisfaction........................................................................ 9
1.7.1.2 Organizational Commitment................................................... 9
1.7.1.3 Higher Education in Palestine................................................ 9
1.7.1.4 Palestine Technical College Ramallah.................................... 10
1.7.1.5 Academic Staff........................................................................ 10
1.7.1.6 Administration Support Staff................................................... 10
1.8 The limits of the study............................................................................ 11
CHAPTER2................................................................................................. 12
LITERURE REVIEW................................................................................ 12
2.1 Introduction........................................................................................... 12
2.2 Organizational Commitment................................................................. 12

v
2.3 Job satisfaction....................................................................................... 16
2.4 The link between job satisfaction and organizational
commitment.................................................................................................. 18
2.5 Job Satisfaction and Organizational Commitment in Institutions of
Higher Education.......................................................................................... 20
CHAPTER 3................................................................................................ 25
METHOLDOLOGY AND PROCEDURES OF THE STUDY.............. 25
3.1 Introduction............................................................................................ 25
3.2 Methodology.......................................................................................... 25
3.4 Research Design.............................................................................................. 25
3.4.1 Data Collection Method................................................................
3.4.2 Questionnaire Design...................................................................
3.4.3 Population of Study....................................................................
3.4.4 The Study Sample.........................................................................
25
252727
3.5 Data analysis......................................................................................... 27
3.7 Data Analysis Techniques..................................................................... 35
CHAPTER 4..................................................................................................... 36
RESULTS AND ANLYSIS............................................................................ 36
4.1 Introduction............................................................................................ 36
4.2 Reliability Analysis............................................................................... 36
4.3 Descriptive............................................................................................. 37
4.4 The study analyzed questions................................................................ 37
CHAPTER 5................................................................................................ 71
DISCUSSION AND RECOMMENDATIONS........................................ 71
5.1 Introduction............................................................................................ 71
5.2 Discussion............................................................................................... 71

vi
5.2.1 Research Question 1.............................................................
5.2.2 Research Question 2.............................................................
5.2.3 Research Question 3............................................................
5.2.4 Research Question 4.............................................................
5.2.5 Research Question 5.............................................................
5.2.6 Research Question 6.............................................................
71
72
74
76
78
79
5.3 Recommendations ................................................................................. 85
5.4 Recommendations For Future Researchers................................ 86
CHAPTER6................................................................................................. 87
CONCLOUTION......................................................................................... 87
6.1 Conclusion.............................................................................................. 87
REDERENCES........................................................................................ 88
APPENDIX.................................................................................................. 97
ABBREVIATIONS...................................................................................... 102

vii
LIST OF TABLES
Table 3.1: Layout of the questionnaire.......................................................... 26
Table 3.2: Measurement Item....................................................................... 26
Table 3.3: study population............................................................................... 26
Table 3.4: distribution of the sample according demographical variables... 27
Table 4.1: Summary of Reliability Analysis...................................................... 35
Table 4.2: Overall descriptive statistics of the study variables.......................... 35
Table 4.3: Averages, SD depending on the job satisfaction of Academics
Staff..................................................................................................................... 36
Table 4.4: Averages, SD depending on the Affective commitment of Academic
Staff.......................................................................................................................... 37
Table 4.5: Averages, SD depending on the Continuance commitment of
Academic Staff................................................................................................... 38
Table 4.6: Averages, SD depending on the Normative commitment of
Academics Staff.................................................................................................. 39
Table 4.7: Averages, SD depending on the Organizational commitment of
Academics staff ................................................................................................ 40
Table 4.8 : Averages, SD depending on the job satisfaction of administrative
support staff........................................................................................................ 41
Table 4.9 : Averages, SD depending on the Affective commitment of
administrative support staff................................................................................ 43
Table 4.10 : Averages, SD depending on the Continuance commitment of
administrative support staff................................................................................ 44
Table 4.11 : Averages, SD depending on the Normative commitment of
administrative support staff ............................................................................... 45
Table 4.12 : Averages, SD depending on the Organizational commitment of
administrative support staff ............................................................................... 46
Table 4.13 :Pearson’s Correlation Coefficients of the Study
Variables(N=164).............................................................................................. 47
Table 4.14 : Test results (T- test ) depending on Gender........................... 47

viii
Table 4.15 : Test results (Mean and SD) depending on Qualification................... 48
Table 4.16 : Results One way ANOVAs analysis Qualification variable......... 49
Table 4.17 :(LSD) Test depending on the field Affective commitment............. 50
Table 4.18: (LSD) Test depending on the field Continuance commitment........ 50
Table 4.19 :(LSD) Test depending on the field Normative commitment........... 51
Table 4.20: Test results (T- test ) depending on Marital status......................... 52
Table 4.21 : Test results (T- test ) depending on position................................. 53
Table 4.22 :Test results (Mean and SD ) depending on Year of Experience in
the sector............................................................................................................. 54
Table 14.23 : Results One way ANOVAs analysis depending Year
Experience in the sector variable........................................................................ 54
Table 4.24 : (LSD) Test depending on the field job satisfaction........................ 55
Table 4.25 : (LSD) Test depending on the field Affective commitment........... 56
Table 4.26 : (LSD) Test depending on the field continuance commitment........ 57
Table 4.27 : (LSD) Test depending on the field Normative commitment.......... 58
Table 4.28: (LSD) Test depending on the field organizational commitment..... 58
Table 4.29 : Test results (Mean and SD ) depending on Year of Experience in
the Current Job................................................................................................... 59
Table 4.30 : Results One way ANOVAs analysis depending Year Experience
in the Current job variable..................................................................................
59
60
Table 4.31 : (LSD) Test depending on the field job satisfaction........................ 60
Table 4.32 : (LSD) Test depending on the field Affective commitment........... 61
Table 4.33 : (LSD) Test depending on the field Normative commitment.......... 62
Table 4.34 : (LSD) Test depending on the field organizational
commitment........................................................................................................ 62
Table (4.35) : Test results (Mean and SD ) depending on Age....................... 63
Table (4.36) : Results One way ANOVAs analysis depending Age.................. 64
Table 4.37 : (LSD) Test depending on the field Continuance commitment....... 65
Table 4.38 : (LSD) Test depending on the field Normative commitment.......... 65
Table 4.39 :Test results (Mean and SD ) depending on Monthly Salary.......... 66
Table 4.40 : Results One way ANOVAs analysis depending Monthly

ix
Salary................................................................................................................. 66
Table 4.41 : (LSD) Test depending on the field job satisfaction........................ 67
Table 4.42 : (LSD) Test depending on the field Affective commitment........... 68
Table 4.43: (LSD) Test depending on the field continuance commitment......... 68
Table 4.44 : (LSD) Test depending on the field Normative commitment.......... 69
Table 4.45: (LSD) Test depending on the field organizational
commitment.................................................................................................... 70
Table 5.1 : Averages, SD depending on the Organizational commitment of
Academics staff................................................................................................ 72
Table 5.2 : Averages, SD depending on the Organizational commitment of
administrative support staff................................................................................ 76
Table 5.3 : Pearson’s Correlation Coefficients of the Study
Variables(N=164)..................................................................................................... 78

1
Chapter 1
The Study Problem and Its Importance
1.1 Introduction and Background
Deemed universities of the most important educational institutions in the present
era, because the important role of university education in the life of developed and
developing nations a like where he sees (Dyke) that universities in these countries
are considered the conscience the nation, as it contribute to preparing the leaders
in various fields making its role in influencing the pivotal community, and of
great importance (Jarbawi, 1986).
The university representing summit educational pyramid, not just being the end
of formal education system known, but also because they have a dangerous
mission in the influence the young thinking and affiliation, and from college
graduates stand out community leaders in various scientific fields, economic,
administrative, cultural, and through of them prosperity of society (Ammar,
1996).
Confirms Al-buthaina and Arabi, (1993) that the university is the most part
important in the educational process because it focuses on the success of the
educational process, and their ability to achieve their goals, depend primarily on
the adequacy of teaching the staff members, in addition to the availability of
administrative necessary capabilities.
In past years, interest increasing in the studies of incentives, job satisfaction or
dissatisfaction with the teaching in institutions of higher education academic staff,
has this interest appeared because of a greater sense of the importance of teaching
staff in shaping the future of the societies. and the power they hold in the
development and transfer targets the goals of higher education institutions, as well
as the popular belief that the faculty members are satisfied with their work more

2
able to carry out their duties and a higher level of efficiency than their colleagues
who are dissatisfied (Tanash, 2000).
The Higher Education have a special place in Palestinian society because of the
unusual circumstances experienced by, and because the higher education is the
basic elements of the renaissance of the nation. as much as it was education
prosperous and advanced, as much as they contribute effectively in the
independence movement and freedom through the makings of intellectuals and
writers. scientists and planners in the various fields of knowledge (Rashid, 2005).
As the university is a social institution, it is assumed that they affect and are
affected by the society in which arise and thrive in it, it was reflected by what in
the society of well-being. and the system and mess, development and retardation,
the justice or injustice, however supposedly at the university to be an institution of
educational and culture and a beacon of civilization and progress. The Arab
universities have still influenced by some of the negatives that prevail in their
communities, and still need to work a lot in order to develop abilities, policies and
regulations and means. All this must has reflected the stability of the faculty and
staff in these universities and what can achieve levels of efficiency and
achievement (Zeid Kilani and Ades, 2004).
Job satisfaction is of utmost importance because it is an indicator of the success of
the individual in the various aspects of his life. whether family or social, it is here
became successful organizations and their leaders more interested in individuals,
and took also make the effort and spend huge amounts of money and better
efficiency to choose, and training them to the requirements of the job and give
them moral and material incentives, that could contribute to fill various needs, and
in turn. All that is required of them is to adhere to these regulations and sincerity
in its service and provide the performance and effort excellence to achieve its
goals efficiently and effectively. They show a strong desire not to left them and
move them to the other in the back of the many benefits (Al Keriota, 2001).

3
Most of the studies conducted in the field of organizational commitment has been
reported that the individuals are more committed to their institutions their few
absence rates and have job satisfaction growing. Also the unrest in working are
very few, and on this basis ability to achievement and innovation are necessary
and inevitable result of the above, which most of the countries and institutions
seek it . These things are necessary to increase production and the invasion of the
markets and get the fame that is the goal of all institutions and organizations, and
exceed more than that matter. Access to individual's commitment to their
institutions leads to reduce the cost of production of goods and improve its quality
and to provide appropriate ways that help the administration in the development
of services provided to citizens (Almadhwn and Aldzrrari 1995).
The researcher he found that he should have been studying this subject, which is
the goal of the first place to know the organizational level of commitment and job
satisfaction among workers at the Palestine Technical College Ramallah to be an
important source of information for decision-makers in Palestine moreover, to
work hard to improve educational quality in Palestine for by strengthening the
commitment and the satisfaction level of employees.
1.2 Problem Statement
Given the importance of the role of the Academic staff and administrative support
staff in the Palestinian college of the impact in the community, it was interest in
the study factors related to their career and the problems they face. In order to
ensure their giving and their devotion and dedication to the goals of the
community and create effective educational environment which is the ultimate
goal of higher education from here saw the researcher. that the study of
organizational commitment and job satisfaction among academic staff and
administrative support staff in the Palestinian college subject worthy of research
and study, so it was necessary to conduct a scientific study based on clear

4
methodology, and specifically the problem of the study is to answer the following
questions::
1. What is the degree level of organizational commitment of academic in the
Palestinian college?
2. What is the degree level of job satisfaction among academic members in the
Palestinian college?
3. What is the degree level of organizational commitment of the administrative
support staff in the Palestinian college?
4. What is the degree level of job satisfaction of the administrative support staff in
the Palestinian college?
5. Is there a relationship between organizational commitment and job satisfaction
among academic staff and administrative support staff in the Palestinian college?
6. What is the role of the variables: Gender, qualification, years of experience in
the current job, years of experience in the sector, monthly salary, age, And marital
status in influencing the organizational commitment and job satisfaction among
academic staff and administrative support staff in the Palestinian college?
1.3 The Purpose of the Study
The study Aims to Investigate the Following:
Knowledge of the regulatory level of commitment and satisfaction among workers
in the Palestinian colleges toward of their institution under study, by measuring
the level of loyalty, responsibility, continue to work, and faith in the institution
under study.
Determine the effect of individual differences for employees of the Palestinian
college, on the functional level of commitment and satisfaction they have the

5
direction of the institution in which they work and what is nature of this
relationship in terms of positive and negative.
Provide decision makers in Palestinian college the facts and useful information
about their employees.
Development of special proposals to improve the quality of organizational
commitment and job satisfaction to employees of the Palestinian college.
To contribute development performance the administrative and academic in the
Palestinian college through the promotion of the concept of organizational
commitment and job satisfaction of personnel and decision-makers in these
institution under study.
We can said - within the limits of researcher ideas - that the Arab intellectual
output lacks studies directly related to the study of the relationship between job
satisfaction and organizational commitment and there is an urgent need to conduct
this type of study to meet the shortfall. First and find out the reality of job
satisfaction for workers (academic staff and administrate support staff) in the
Palestine technical College and the degree of impact in organizational
commitment. Secondly, the researcher works in academic staff and administrative
support staff in the Palestine Technical College a long time. She knows of the
nature of the relationship between management and workers, particularly with
regard to the relationship between job satisfaction and organizational commitment
and its impact on workers, positively or negatively. The problem of the study is
limited is the detection of the degree of job satisfaction and commitment
Organizational and their relationship with the workers in the Palestine technical
College in Palestine. and to detect how some intermediate variables, such as
Gender, age , experience in the sector, and qualifications, monthly salary,
experience in current job, impact on job satisfaction and organizational
commitment to employees.

6
1.4 Objectives of the Study
Specifically, this study mainly seeks to achieve the following objectives:
- Determine the job satisfaction of the Academic staff in the Palestine Technical
College Ramallah for Girls.
- Identify the level of job satisfaction of the administrative support staff in the
Palestine Technical College Ramallah for Girls.
- Determine the organizational commitment of Academic staff in the Palestine
Technical College, Ramallah for Girls.
- Determine the organizational Commitment of administrative support staff in the
Palestine Technical College Ramallah for Girls.
-Determine the relationship between organizational commitment and job
satisfaction.
- Comparative between job satisfaction and organizational commitment of
Academic staff and administrative support staff at the Palestine Technical College
Ramallah for Girls.
- Stand on the relationship of each of the organizational commitment and job
satisfaction for some personal variables include: (gender, Age, Position,
qualification, years of experience in the current job, years of experience in the
sector, marital status) for employees at the Palestine Technical College.

7
1.5 Research Questions
Based on the above, this study will work to provide answers to the following
questions:
1. Does job satisfaction exist amongst Palestine Technical college Academics
staff?
2. Does organizational commitment exist amongst Palestine Technical College
Academics staff?
3. Does job satisfaction exist amongst Palestine Technical College administrative
support staff?
4. Does organizational commitment exist amongst Palestine Technical college
administrative support staff?
5. Is there any difference between job satisfaction and organizational commitment
exists amongst Administrative support staff and Academic Staff at Palestine
Technical College?
6. Does any significant differences exist in the level of job satisfaction and
organizational commitment with regard to demographic characteristics?
1.6 Significance of the Study
The significance of this study being combine two important elements of their
presence is essential in any successful organization, or any organization puts
success in prioritizing. It combines the organizational commitment on the one
hand and between job satisfactions on the other. The importance of this study
being specialty to decisions makers in this country, academic staff and

8
administrative support staff in the Palestinian college who are the nucleus of this
community and the backbone of this nation.
Despite the importance of organizational commitment and job satisfaction as the
most important pillars on the administrative work, but studies on this subject a
few in either the public domain or in Palestine in particular, so the importance of
the subject and it was the birth of such a study.
Summarize the importance of this study are as follows:
1. The importance of the theme, which deals with the variables of organizational
commitment, and job satisfaction And the relationship between them because of
the importance of these two variables in the performance of faculty and
administrative support staff members at the college.
2. This study is the first studies in Palestine, which addressed the issue of the
relationship between job satisfaction and organizational commitment when
academic staff and administrative support staff at the Palestine Technical College
Ramallah.
3. To provide Palestinian university's decision makers useful facts and information
about their employees.
4. Development of special suggestions to improve the quality of organizational
commitment and job satisfaction of employees at universities Palestinian.
5. To contribute development performance the administrative and academic in the
Palestinian college through the promotion of the concept of organizational
commitment and job satisfaction of personnel and decision-makers in these
institution under study.

9
1.7 Terminology of Study
1.7.1 Definition of Key Terms
1.7.1.1 Job Satisfaction: Is a variable matter. It usually depends on the mind of
the employee / worker. Positive attitude regarding to any work of a person has
stated as job satisfaction. It is a mental condition of a person for any type of work.
Someone may feel satisfaction to a work and in contrary; another person may feel
unsatisfactory to the same work depending on his or her attitude regarding the
work/job.
1.7.1.2 Organizational Commitment: may have viewed as an organizational
member's psychological attachment to the organization. Organizational
commitment plays a very large role in determining whether a member will stay
with the organization and zealously work towards organizational goals.
Affective Organization Commitment: The effective emotional
attachment to identification with, and involvement in the organization
(Allen & Meyer, 1990).
Continuance Organization Commitment: The wish associated with
leaving the organization (Allen & Meyer, 1990).
Normative Organization Commitment: A feeling of obligation to
continue employment (Allen & Meyer, 1990).
1.7.1.3 Higher Education in Palestine: Types of tertiary education institutions
According to the Law on Higher Education, HE institutions can be one of the
following:
- Universities: consisting of no less than three colleges or faculties which
confer Bachelor degrees or higher;

10
- University colleges: offering academic, technical or professional
programs and conferring two or three-year diplomas or ordinary or honors
Bachelor degrees;
- Polytechnics: they confer diplomas or Bachelor. And higher degrees in
professional and technical fields;
- Community colleges: offering academic, professional or technical
programs of a minimum of one year’s duration leading to diplomas in the
respective programs. The community colleges offer programs aimed at
preparing a middle-level labor force, which forms the link between
specialized and skilled workers. The diploma programs (equivalent to an
associate degree) consist of approximately 72 credit hours distributed over
four semesters.
1.7.1.4 Palestine Technical College Ramallah: The Palestine Technical
College Founded in 1956. as the first college to teach girls to become teachers in
the schools and in 1996 was converted college from education college to a
technical and professional, college because the labor market need this. the college
granted two types of certificates the first diploma and second bachelor's degree
start at 2004.
1.7.1.5 Academic Staff: They are those people who have masters and PhD work
in Palestinian universities certificates campaign, in the field of teaching.
1.7.1.6 Administration Support Staff: responsible for the management of the
administrative and operations staff and services or is a broad job category that
designates an individual who provides various kinds of administrative to people
and groups in the College.

11
1.8 The Limits of the Study
- This study was limited to the Palestine Technical College of Ramallah in the
West Bank without moving into the Gaza Strip, due to the difficulty of movement
imposed by the Israeli occupation forces.
- The study is limited to measuring employee satisfaction and organizational
commitment of Palestine Technical College staff in the public sector and not the
private sector.
- It will be applied to study at all university employees totaling 168 employees.
-The study has conducted on workers in the Palestinian university of academics
and administrative support stuff without working in the service department
because of the differences in variables the study in terms of qualification and the
nature of work in the service sector

12
CHAPTER 2
Literature Review
2.1 Introduction
The literature review consists of Forth parts. The first part describes the concept
of organizational commitment, while the second part explains job satisfaction;
Three Parts take about the link between the job satisfaction and organizational
commitment, while the fourth and final part present studies in Job Satisfaction or
Organization Commitment in Institutions of Higher Education.
2.2 Organizational Commitment:
Swailes's study (2002) Organization's commitment refers to the employee's
emotional attachment to, identify with, and involvement in the organization. In
essence, measuring organizational commitment is an assessment of the
congruence between an individual's own values and beliefs and those of the
organization.
Organizational commitment is characterized as employees' willingness to
contribute to organizational goals. When employees are sure that they will grow
and learn with their current employers, their level of commitment to stay with that
particular organization is higher (Opkara, 2004).
Taqi's study (2002) entitled "Measuring the ability of demographic factors and
work pressure in predicting the level of organizational commitment in the Kuwaiti
health organizations, which aim to:
1) Identify the most important determinants, which prevent effective
organizational commitment.

13
2) To identify the nature of the work pressure in the target group and determine
whether the pressure varies among individuals depending on variables which
contributes to the work to mitigate them.
3) Make recommendations to help in the promotion of organizational
commitment. This study was aim at health professional sector help in Kuwait.
totaling 2293 employees and employee distributors on different functions,
including health professionals, medical secretaries, nursing staff, and secretarial
offices, was chosen as a random sample of 500 individuals representing 23% of
the study population. It used the questionnaire consisting of two parts, the first of
which relates to the measurement of organizational commitment, the second
includes clauses to measure the pressure of work, and the main results are as
follows:
(A) The presence of a statistically significant positive correlation between
organizational commitment and all of the type of profession, educational
qualification, age and number of years of service.
(B) There is no statistically significant inverse relationship between organizational
commitment and work pressure.
The study recommended introducing organizational commitment theory in the
health service sector in Kuwait, where it can be applied in fact through training
program theory, it is necessary to clarify the concept of organizational
commitment and its content and its features and how to strengthen it at all staff.
As it should be linked to the organizational commitment to the standards and
practices that are carefully designed and are built with incentives and control
systems and must include the criteria used for justice and fair competition in the
work as well as the production and effective achievement. As the researcher
recommended the need to encourage, further field research to measure the
pressures of work and organizational commitment in a variety of services-sectors
to increase the credibility of the verification measures that could be reached
during the search.

14
In Yassin's study (2003) aimed to know the degree of organizational commitment
and professional of teachers in public schools in the governorates of Ramallah and
Al Bireh, so the population of the study (2424) teachers researcher of them chose
a random sample size was (362) have been distributed a questionnaire composed
of (50 ) items, and noted the results of the statistical analysis that the degree of
organizational commitment when teachers about the school and the profession is
high, and found statistically significant differences in the degree of organizational
commitment attributed to the variable year of experience . Also, show that there
were no statistically significant differences in the degree of organizational
commitment of teachers attributed to the variable sex.
Carry's study (1986) Thinkers administration has pointed generally to the
individual in the organization as a key element helps to achieve the objectives of
the organization, and therefore has been focusing on this element and the study of
behavior and try to influence this behavior, to comply with the behavior of the
organization, and is no doubt that there are multiple variables significantly affect
the behavior of the individual, and these variables differ from one person to
another, and when searching in the professional or organizational affiliation, we
find that there are many definitions and concepts interspersed type of difficulty
because of differences in the multiplicity of variables that affect it, it has increased
the attention of researchers in organizational commitment from the beginning of
end of the sixties and early seventies.
Porter (1974) is and his companions of the most important researchers who were
interested in clarifying and defining what organizational commitment, has focused
on the individual. Who has shown commitment to the organization where he
works. Show has a state of harmony and interacts with the organization and its
employees. and noted specifications its specific impact in deviate organizational
commitment of the individual and these qualities:
a. A strong belief to accept the organization's goals and values

15
B. Ready to make maximum efforts on behalf of the organization
C. The desire to continue to stay in his membership in the organization
Sherman and Morris's study (1981 ) But Morris and Sherman partners have
focused on compatibility and Engagement of the individual in the organization or
institution and the extent of his feelings safely which increases its effectiveness,
which becomes more commitment (loyalty) of the regulation. They pointed out
that the commitment is the individual's attitude toward his organization and
identified the following characteristics an individual who enjoys a high
commitment of the institution, and these qualities:
a. Compliance with the goals and values of the organization
B. A high link in its effectiveness at work
C. Loyalty to the organization
In addition, Meyer (2002) found antecedents that correlated with affective and
continuance commitments, while no antecedents were found to correlate
specifically with normative commitment. Therefore, the authors have suggested
that the first component, affective commitment, should be used to analyze
organizational commitment as it correlates the strongest with the underlying
factors of organizational commitment, and has the strongest validity of the three
components Ko, Price, & Mueller (1997). For that reason, affective organizational
commitment has used for research purposes in this paper.
Ghannam's study (2005) aimed to identify the personality traits and organizational
commitment to the basic school teachers in government schools in Nablus, and the
study population consisted of all basic schoolteachers in the city of Nablus,
bringing the number of women (1088) was selected sample number of members
(183). The researcher used Gordon scale of personality included (39) items, and
the measure of organizational commitment included (28) paragraph the study.
found a range of results, including: that the regulatory commitment degrees was
very large at female teachers, and lack of statistically significant differences in the

16
degree of organizational commitment. Differences attributed to place work,
Qualifications, place of residence , years of experience and the monthly of
income.
Al-Khshali's study (2003) aimed to know the impact of the use of heads
department in the Jordanian private universities for driving patterns on the
organizational commitment of faculty members. The study sample consisted of
(240) faculty member were distributed to them a questionnaire composed of three
sections. According to results and a negative relationship between autocratic
leadership style and organizational commitment, and results showed a positive
relationship between the Democratic leadership and commitment organizational
pattern.
2.3 Job Satisfaction
Gunnam Yousf's study (2007) aimed to investigate the relationship among
organizational loyalty and job satisfaction among staff members at A Najah
National University and the effect of gender, qualification, academic rank, college
years of experience and age on the relationship among organizational loyalty and
job satisfaction among staff members at Najah National University the Sample of
(144). Staff member have chosen and measure tool of three parts is preferred to
conduct the study. The first part included personal data about staff members. The
second part consisted of the organizational loyalty measure, which contained
items.
The third part is the job satisfaction measure, which consisted 53 items distributed
on six axes. The results of the study show that the degree of organizational loyalty
and job satisfaction is high among An Najah employee. There are differences
with some statistical significance at the level of organizational loyalty attributed to
gender and academic rank. The results, however, showing no difference with
statistical significance in job satisfaction attributed to the variable of gender and,

17
there are no differences of statistical significance between the level of
organizational loyalty and job satisfaction attributed to the variables of university
experience, age, on income.
Jessie L. Grant study (2006) aimed to measure satisfaction or lack of job
satisfaction among workers, Department of Student Affairs at the Union of
American colleges. also aimed to determine the effect of the following factors:
(recognition of the effort and promotion of good supervision and relationship with
colleagues. and the policy laid down by the organization, working conditions and
salary and safety) on satisfaction or lack of job satisfaction. The results showed
that there are 83% of the staff members of the Union of American colleges
(Satisfied with their work).
Karmelo Bezzin's study (2006) aimed to investigate the job satisfaction among
nurses who work in long-term Maltese care institutions, and this study applied to
the largest institution for the care of the elderly in Malta. The study found that
there is a lack of satisfaction and a sense of bewilderment and low self-respect by
nurses because of the hard work and challenges difficult to work, the study
recommended the dissolution (The problem of shortage of nurses with a focus on
their needs at work).
Ssesanga's study (2005) aimed to identify the level of job satisfaction among
Academics University Ugandans, where the study was conducted an investigation
into a test to examine the factors that contribute to and support the job satisfaction
of employees in higher education in the developed world. a sample composed 182
individuals pre-selected in Uganda University. where he scored analysis of the
most influential in satisfaction factors which everything is connected to the
behavior of co-workers, supervision, and aspects of the real and fundamental
education, and the motivation to create dissatisfaction was most external factors
such as rewards and control, research, promotion and the work environment, also
found that age and academic rank they indication of the effect in job satisfaction,
while there was no indication of the effect of sex on job satisfaction.

18
Kristin L. Straiter's study (2004) aimed to investigate the relationship between the
trust granted by superiors to subordinates and between job satisfaction and
organizational commitment. This study applied to 117 sales managers working in
a warehouse for drugs. The study found that there are significant differences
between the confidence placed between superiors and subordinates and between
job satisfaction relationships. also it found the results of this study indicated that
there is a strong relationship between the confidence placed between superiors and
subordinates and between organizational commitment.
Harem's study (2001) aimed to identify the job satisfaction among faculty
members of the college's own community in Jordan. The study adopted
descriptive and analytical approach and the study sample included 125 faculty
members, have been distributed a questionnaire consisting of 40 items, The study
results indicated varying levels of job satisfaction in the different fields of work,
as well as the existence of differences in job satisfaction due to gender, age and
years of experience.
2.4 The Link between Job Satisfaction and Organizational Commitment
Aydogdu and Asikgil study (2011): An Empirical Study of the Relationship
among Job Satisfaction, Organizational Commitment and Turnover Intention.
Aims to gain a better understanding of the relationships between job satisfaction,
organizational commitment and turnover intention. This study is conducted from
two organizations in Istanbul. Of these organizations are in private sector, one of
these organizations is in production area, the other one is service provider. Data
were collected through questionnaire.
The most important results of the study are:
a. Job Satisfaction has a significant and positive relationship with three
dimensions of organizational commitment.
b. Turnover intention has a significant and negative relationship with job
satisfaction and organizational commitment.

19
c. High job satisfaction and organizational commitment will avoid turnover
intention and actual turnover.
d. Every employee has different kinds of needs and expectations and it is
impossible to satisfy every need and expectation of the employees.
The most important recommendations of the study are:
a. Employers should promote their employees by improving supervision styles
that well treated employees develop a positive attitude towards supervision and
the organization.
b. Involving more employees in decision making process, providing better
working condition and providing flexible working hours and paying fairly,
encouraging employees to use their own skills and abilities help them to have a
sense of self pride and self confidence that increases job satisfaction.
c. Employees having a high job satisfaction are expected to be committed to the
Organization, but it is important to know how these employees connect to the
Organization in terms of membership status.
d. Both employee and employer should try to generate a working condition that
they will work in a happy, motivated and productive atmosphere to reach the
certain goals.
Ahmadi's study (2006) sought to determine job satisfaction levels and
organizational commitment of workers in primary health care centers in the
Kingdom of Saudi Arabia and the relationship between them and some of the
personal and functional characteristics such as sex, qualification and experience.
The results showed that there are substantial differences in job satisfaction and
organizational commitment levels according to sex educational qualification and
experience, as the results showed a positive relationship between job satisfaction
and Organizational Commitment.

20
Alawneh's study (2006) purposed to determine the level of job satisfaction and
organizational commitment and the relationship between them when the teachers
of private schools in the city of Nablus, and effect of the sex, qualification and
years of experience and age in job satisfaction and to the organizational
commitment of the teachers of private schools in the city of Nablus. The study
population in private school teachers in the city of Nablus, chosen sample size
was (126) teachers. To complete the study prepared, composed of three sections
tool: Section I: personal information about teachers, and the second section:
consisting of organizational commitment scale of (17) paragraph, third section
measure for job satisfaction component of (53) items distributed on six axes.
Results of the study showed that job satisfaction when teachers of private schools
in Nablus was high level, and organizational commitment at the private school
teachers in the Nablus city was high level. The results indicated that there were
no statistically significant differences in the level of job satisfaction due to the
variable gender, educational qualification and years of experience differences and
age. as well as the lack of statistically significant differences in organizational
commitment due to the variable educational qualification and years of experience,
age, also found statistically significant differences in organizational commitment
due to the variable Gender, as the results of the study indicated that there is a
positive relationship between job satisfaction and organizational commitment.
2.5 Studies in Job Satisfaction or Organizational Commitment in Institutions
of Higher Education
NORIZAN ISMAIL's study (2014) "organizational commitment and job
satisfaction among staff of higher learning education institutions in Kelantan"
aims to found the relationship between organizational commitment and job
satisfaction and he use the regression analysis to find the result. the result was
there is no relationship between organizational commitment and job satisfaction.

21
Mwadiani (2002) the role of Universities in the provision and development of
work force required for the social, economic and technological advancement of
any nation cannot be overemphasized. By their unique nature universities are
expected to be a repository of the most specialized and skilled intellectuals. They
serve as storehouses of knowledge for nurturing the work force needs of the
nation and hence for satisfying the aspirations of the people for a good and
humane society. Central to the realization of University goals and objective are
the academic and administrative staff whose roles are crucial and their number,
quality and their effectiveness makes the difference in university education
production function and to the wider society.
Pienaar (2008) the academic profession is fundamental to the functioning of any
university. Without well-qualified and committed academic staff, no academic
institution can really ensure sustainability and quality over the long haul. Higher
education institutions are therefore more dependent on the intellectual and
creative abilities and commitment of the academic staff than most other
organizations. This therefore makes it critically important to retain this cadre of
staff.
Al-Smadi, Qblan's study (2015) aimed to identify the impact of some variables
(gender, Teaching experience and college type) on assessing the level of job
satisfaction among faculty of Najran University. A survey was conducted in this
study by a 23-item questionnaire, distributed to (262) male and female faculty
members from various colleges. The questionnaire items distributed to four
domains: Academic environment, salaries and financial support, psychological
and social aspects, and interpersonal communication. The results showed a
moderate degree of job satisfaction in general, and there are statistically
significant differences due to (gender, teaching experience and college type),
where the differences in favor of males, scientific colleges and more experienced.

22
Saner, Eyüpoğlu's study (2012) aims to examine the age-job satisfaction
relationship in higher education of academics in North Cyprus. The results show
that 1) the job satisfaction levels of the older age groups of academics are overall
higher than the younger age groups. 2) Overall job satisfaction and extrinsic
satisfaction do not seem to indicate a linear relationship with age, 3) overall job
satisfaction and extrinsic satisfaction levels varying for different age groups.
Saner, Eyupoglu's study (2012) aims to provide empirical evidence to establish
whether gender differences exists in relation to the job satisfaction of male and
female university teachers in Turkish universities in North Cyprus. The study will
also demonstrate whether gender is a reliable predictor of their job satisfaction.
The results indicate that 1) female university teachers, as compared to male
university teachers, have a higher level of satisfaction with overall job satisfaction
with this difference being statistically significant with gender.
Eyupoglu, Saner's study (2009) aims to provide empirical evidence as to the job
satisfaction levels of academics in North Cyprus and to ascertain as to whether an
academic rank is a reliable predictor of their job satisfaction. The result show that
indicate the extent of the low to moderate satisfaction levels that exists among
academics in North Cyprus.
Al-Masry's study (2009): "The Impact of Compensations on Employees'
Satisfaction in Islamic University of Gaza" aims to investigate the effects of the
compensation on the Islamic University of Gaza Employees satisfaction. Data
were collected through questionnaires.
The most important results of the study are:
a. There is a positive relationship between salaries & compensations and
employees' satisfaction.
b. There are significant differences in the sample of studies concerning the effects
of the compensations to the employee satisfaction at the level of significance

23
a=0.05, which attributed to two personal characteristics only; the sex and the
position type.
c. There are non- significant differences in the sample of research concerning the
effects of the compensations to the employee satisfaction at the level of
significance a= 0.05, which attributed to two personal characteristics only; the
Scientific qualification, the social status, the number of dependent sons, the
position grade and years of experience. The most important recommendation of
the study is that more efforts should be exerted concerning all the components of
the compensations, which will work on improving the employee compensations
according to their labor and personal characteristics.
Abu-Nada's study (2007) aims to know Relationship Between Some Personal
Variables and Leadership Types, on the one hand, and The Organizational
Commitment and The Feeling of Organizational Justice, on the other, in Some
Palestinian Ministries in Gaza Strip. to underscore the existence differences that
have statistical significance in leadership types in these ministries, and to find out
the effects of these types on organizational commitment among the employees and
their feelings of organizational justice. The study has been applied on a random
sample from the society of the study, which included largest six ministries in the
Gaza Strip. Data were collected through questionnaires. The most important
results of the study are:
a. There is an organizational justice in the Palestinian ministries in the Gaza Strip,
but it is weak and close to average.
b. There are no differences between the respondents of the study sample (at 0.05
levels) about organizational justice attributable to the salary and incentives.
The most important recommendations of the study are:
a. Reconsidering the systems of rewards, promotions in the ranks and evaluations
of performance, in a way that achieves subjectivity and justice in these systems
b. Reconsidering the employment conditions of the woman, and the legal rules
concerning the compensations of civil service to guarantee higher degrees of

24
organizational commitment and feeling of organizational justice among employed
women
c. The importance of training leaders how to build up positive work relationships
between themselves and their employees, taking into consideration the positive
effects of these relationships on behavioral variables which affect in turn the
organizational commitment and the levels of performance and productivity.

25
CHAPTER 3
Methodology and Procedures of the Study
3.1 Introduction
In this chapter, the researcher presents the procedures and steps that was use in the
study, also explains and clarifies methodology of the study, the population of the
study, selecting the sample of the study, tools and statistical methods that are used
in the data analysis to get the results and the findings.
3.2 Methodology
in this chapter the researcher used the analytical, descriptive approach that tries to
answer the basic question. A chapter the researcher found that the questionnaire
was most appropriate instrument to achieve the objectives of the study and
statistical software (SPSS V 17) was used to analyses the data.
3.4 Research Design
3.4.1 Data Collection Method
The data was collecting using a structured questionnaire, which consisted of 52
items. The questions have written in English and Arabic. The questionnaire
explains to the participant their roles in evaluating their job satisfaction in part 2,
and to answer the personal information in part 1, then to evaluating the
organizational commitment by the answer part 3 in the questionnaires. The
respondents were giving one day to answer and return the questionnaire to the
researcher by Email on the day after. On average, it took 7 minutes to answer the
questionnaire.
3.4.2 Questionnaire Design
The descriptive research (Quantitative Research) method, which was primarily
used to obtain the information need for the purpose of the study. The

26
questionnaire was divided into three parts to study the characteristics of the
important variables in identifying the relationship between the relationship
between organizational commitment and job satisfaction among employees.
Part 1 demographical information it consists of Age, Gender, marital status,
position years of experience in your current job, years of experience in the sector,
monthly salary, Qualification. Part 2 consists of 20 items about job satisfaction.
Whereas part 3 consists of 24 items about organizational commitment.
Table 3.1 Layout of the Questionnaire
Layout of the Questionnaire
Section ItemPart 1 Demographic
Age Gender Marital Status Position Years of experience in your current job year of experience
In the sector Monthly Salary Qualification
8
Part 2 Job satisfaction 20
Part 3 Organizational Commitment 24
3.1 Affective Commitment 83.2 Continuance Commitment 83.3 Normative Commitment 8
Table 3.2 Measurement Items
3
.
4
Measurement ItemsVariables Total
No. ofItems
Scales Sources
Job Satisfaction 20 Five Point Likert Scale (1-5) Minnesota , (1967)
AffectiveCommitment
8 Five Point Likert Scale (1-5) Allen and Meyer, (1990)
ContinuanceCommitment
8 Five Point Likert Scale (1-5) Allen and Meyer, (1990)
NormativeCommitment
8 Five Point Likert Scale (1-5) Allen and Meyer, (1990)
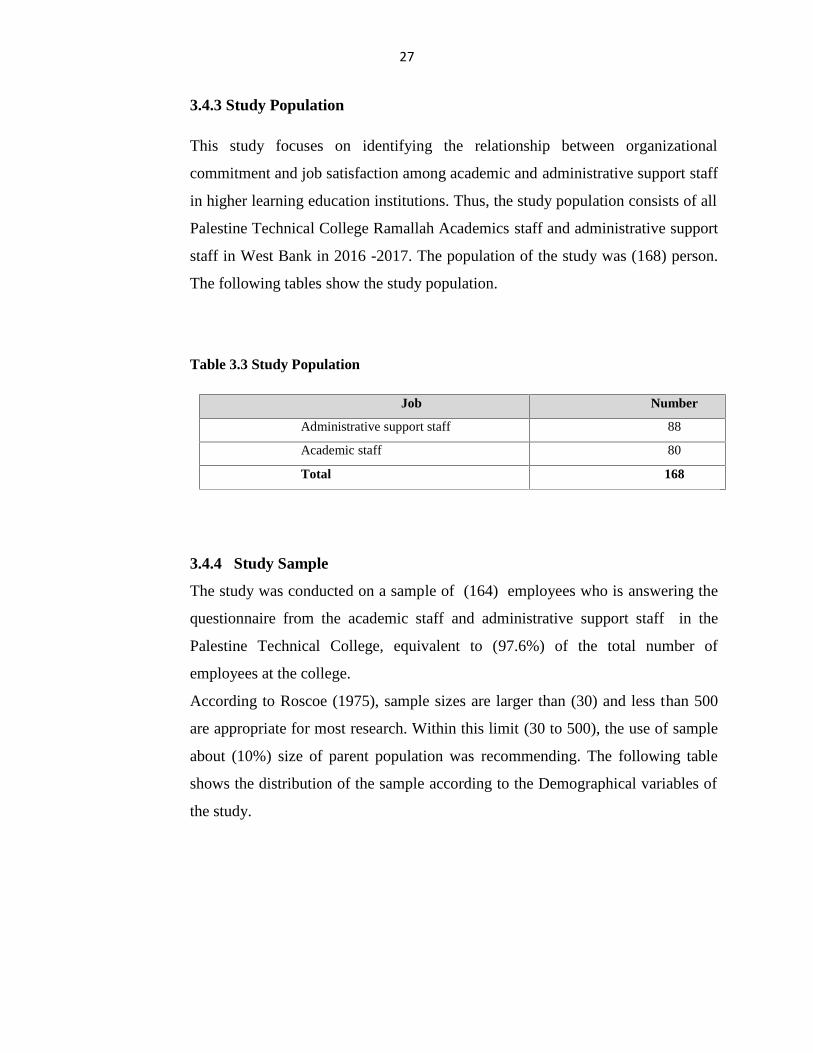
27
3.4.3 Study Population
This study focuses on identifying the relationship between organizational
commitment and job satisfaction among academic and administrative support staff
in higher learning education institutions. Thus, the study population consists of all
Palestine Technical College Ramallah Academics staff and administrative support
staff in West Bank in 2016 -2017. The population of the study was (168) person.
The following tables show the study population.
Table 3.3 Study Population
Job Number
Administrative support staff 88
Academic staff 80
Total 168
3.4.4 Study Sample
The study was conducted on a sample of (164) employees who is answering the
questionnaire from the academic staff and administrative support staff in the
Palestine Technical College, equivalent to (97.6%) of the total number of
employees at the college.
According to Roscoe (1975), sample sizes are larger than (30) and less than 500
are appropriate for most research. Within this limit (30 to 500), the use of sample
about (10%) size of parent population was recommending. The following table
shows the distribution of the sample according to the Demographical variables of
the study.

28
Table 3.4 distribution of the sample according to the Demographical variables
Position Number
Administrative support staff 84
Academic Staff 80
Total 164
Gender Number
Female academic staff 40
Female administrative support staff 50
Female Total 90
Male academic staff 35
Male administrative support staff 39
Male Total 74
Total 164
Marital status Number
Married 110
Not married 54
Total 164
Qualification Academic Administrative S Number
PhD 30 3 33
Master 40 35 75
BA 10 40 50
Diploma _ 6 6
Total 80 84 164
Age Academic Administrative S Total
20-29 8 12 20
30-39 37 31 68
40-49 20 25 45
More than 50 15 16 31
Total 80 84 164

29
Years in current job AcademicAdministrative
SupportTotal
Less than 1 9 10 19
1 to 4 10 11 21
5 to 9 20 18 38
10 to 14 14 17 31
15 to 19 16 13 29
20 or more 11 15 26
Total 80 84 164
Years in the sector AcademicAdministrative
SupportTotal
Less than 1 6 10 16
1 to 4 10 8 18
5 to 9 15 17 32
10 to 14 14 15 29
15 to 19 15 13 28
20 or more 20 21 41
Total 80 84 164
Monthly Salary Academic Administrative S Total
Less than $1000 5 26 31
$1000 to $1499 42 40 82
$1500 to $1999 15 8 23
$2000 or more 18 10 28
Total 80 84 164
It is seen from the above table, which shows the distribution of the sample
depending on the variable position that the number of administrative support staff
(84) member, and is a ratio (51.2%) of the sample size, and the number of
academics staff (80) faculty members and accounts for (48.8%) of the sample
size.
Seen from the table above, the number of holders PhD degree in college (33)
members, as a percentage of (20.1%) of the sample size. Faculty members as (30)

30
members, a percentage (18.3%) and (3) of the administrative support staff as a
percentage (1.8%). As well as Number of Master's degree, holders have numbered
(75) at a rate (45.7%) The number of holders of a master's degree from the
Academy of (40) members, a percentage (24.4%) while the number of
administrative support staff (35) has been accounted for (21.3%). Whereas
Number of BA degree holders have numbered (50) at a rate (30.5%) The number
of holders of a BA degree from the Academy of (10) members, a percentage
(6.1%) while the number of administrative support staff has been (40) accounted
for (24.4%). At the end, Number of diploma degree holders have numbered (6) at
a rate (3.7%) all of them from administrative support staff.
Seen from the above table, which shows the distribution of the sample according
to gender, the number of Male (74) members, and is a ratio (45.2%) of the sample
size, and the number of females (90) members, and a ratio (54.9%). The number
of female workers in the academic field (40) members, and a ratio (24.4%) from
the sample size.
While the number of female workers in the administrative support job amounted
to( 50) members, at a rate (30.5%). While the number of male workers in the
academic field of (35) members, at a rate (21.3%), while the number of male
workers in the field of administrative support (39) members, at a rate (23.7%).
Seen from the above table, which shows the sample distribution according to age
variable, the number of employees of the (20-29) age group was (20) members, as
a percentage of (12.2%) of the sample size, the number of workers in the
academic field, including (8) members, as a percentage It amounted to (4.9%),
while the number of administrative support staff by (12), a percentage (7.3%) of
the sample size.
While the largest number of workers between the ages of (30 to 39) was (68)
members, a percentage reached (41.5%) of the sample size, the number of workers
in the academic field, including (37) member amounted to a rate of (22.5%), while

31
the number of administrative support staff of (31) members, by percentage
amounted to (19%) of the sample size.
Whereas the number of employees in the age group of (40 to 49), it was (45)
members, a percentage of (27.4%) of the sample size. The number of faculty, staff
(20) members, a percentage reached (12.2%) of the sample size. While the
number of members of the administrative support staff of (25) members, at a rate
of (15.2%) of the sample size.
Otherwise, the number of employees who have reached the age of (50 and more)
was (31) a member of a percentage (19%), the number of (15) faculty members as
a percentage (9.2%). While the number of administrative support staff of 16
members, as a percentage of (9.8%) of the sample size.
Seen from the table above, which shows the sample distribution depending on the
variable years of experience in the current job, the number of employees who
have the experience of a year or less was (19) employees, ratio a (11.6%) of the
sample size. The number of employees who works with academic staff as (9)
members, as a percentage (5.5%) from the sample size. While as the number of
administrative support staff is (10) members, as a percentage (6.1%).
Furthermore the number of employees who have the experience of a (1 to 4) years
was (21) employees, ratio a (13%) from the sample size. The number of
employees who works with academic staff as (10) members, as a percentage (6%)
from the size of the sample. However, the number of employees who works in
administrative support staff is (11) members, as a percentage (7%).
As we have seen from the table the number of employees who have the
experience of a (5 to 9) years was (38) employees, ratio a (23%) of the sample
size. The number of employees who works with academic staff as (20) members,
as a percentage (12%) from the size of the sample. Nevertheless, the number of

32
employees who works in administrative support staff is (18) members, as a
percentage (11%).
While as the number of employees who have the experience of a (10 to 14) years
was (31) employees, ratio a (19%) of the sample size. The number of employees
who works with academic staff as (14) members, as a percentage (8.5%) from the
size of the sample. However, the number of employees who works in
administrative support staff is (17) members, as a percentage (10.5%).
Nevertheless, when we look to the staff who have years experience from (15 to
19) years we found the number was (29) members, as a ratio (18%) from the size
of the sample. The administrative support number was (13) members, as a
percentage (8%) from the sample size. While the number of academic was (16)
members, as a percentage ratio (10%).
While as the number of employees who have the experience of a (two or more
than) was (26) employees, ratio a (16%) from the sample size. The number of
employees who works with academic staff as (11) members, as a percentage (7%)
from the size of the sample. However, the number of employees who works in
administrative support staff is (15) members, as a percentage (9%).
As we have seen in the table above we found the percentage of the married
employees was (67%), while the percentage of not married employees was (33%).
Seen from the table above, which shows the sample distribution depending on the
variable years of experience in the Sector, the number of employees who have the
experience of a year or less was (16) employees, ratio a (10%) of the sample size.
the number of employees who works in academic staff as (6) members, as a
percentage (4%) from the sample size. While as the number of administrative
support staff is (10) members, as a percentage (6%).

33
Further the number of employees who have the experience of a (1 to 4) years was
(18) employees, ratio a (11%) from the sample size. The number of employees
who works in academic staff as (10) members, as a percentage (6%) from the size
of the sample. but the number of employees who works in administrative support
staff is (8) members, as a percentage (5%).
As we seen from the table (3.8), the number of employees who have the
experience of a (5 to 9) years was (32) employees, ratio a (20%) from the sample
size. The number of employees who works in academic staff as (15) members, as
a percentage (9%) from the size of the sample. but the number of employees who
works in administrative support staff is (17) members, as a percentage (11%).
While as the number of employees who have the experience of a (10 to 14) years
was (29) employees, ratio a (18%) from the sample size. The number of
employees who works in academic staff as (14) members, as a percentage (8.5%)
from the size of the sample. but the number of employees who works in
administrative support staff is (15) members, as a percentage (9.5%).
Nevertheless, when we look to the staff who have years experience from (15 to
19) years we found the number was (28) members, as a ratio (17%) from the size
of the sample. The administrative support number was (13) members, as a
percentage (8%) from the sample size. while the number of academic was (15)
members, as a percentage ratio (9%).
While as the number of employees who have the experience of a (20 or more
than) was (41) employees, ratio a (25%) from the sample size. The number of
employees who works in academic staff as (20) members, as a percentage (12%)
from the size of the sample. but the number of employees who works in
administrative support staff is (21) members, as a percentage (13%).

34
Seen from the table above, which shows the sample distribution depending on the
variable years of monthly salary, The number of employees who gets monthly
salary less than $1000 was( 31) members, was ratio (19% )from the sample size.
The number of the academic staff was (5) as a percentage (3%) from the sample
size. While as the number of the administrative support staff was (25) member, as
a percentage (16%) from the size of the sample.
The employees who gets monthly salary between ($1000 to $1455) that the
biggest number of categories, the number was (82) members, as the percentage
(50%). The number of the academic staff was (42) members, as a percentage
(26%). while the number of the administrative support staff was (40) members, as
a percentage ( 24%) from the sample size.
Moreover we found the category of the monthly salary $1500 to $1999 have the
number was (23) members, as the percentage (14%). The number of the academic
staff was (15) members, as a percentage (9%). while the number of the
administrative support staff was (8) members, as a percentage (5%) from the
sample size.
Finally, we find that the (28) employees who gets salary $2000 or more, as a
percentage (17%) from the sample size. The number of the academic staff was
(18) members, as a percentage (11%). while the number of the administrative
support staff was 10 members, as a percentage (6%) from the sample size.
3.5 Data Analysis Techniques
From the questionnaires, a few procedures can be done such as checking the data
for accuracy. Besides that, the questions were being code to enable for analysis
using Statistical Packages for the Social Science (SPSS).Using the following
statistical treatments:
-Averages, standard deviations, and percentages

35
-Independent-T-test
-One Way ANOVA - one-way analysis of variance test
- Fishers Least Significant Difference (LSD) test in Prism
This was following by the examination and presentation of demographic profile of
respondents using Descriptive Statistic. According to Zikmund (2000), descriptive
analysis refers to the transformation of the raw data into a form that will make
them easy to understand and interpret.
Secondly, the Cronbach Alpha testing will be used as it is the most well accepted
reliability test tools applied by social researcher Sekaran (2006). In Cronbach’s
Alpha reliability analysis, the closer Cronbach’s Alpha to 1.0, the higher the
internal consistency reliability. (Cronbach’s Alpha; Cronbach, (1946)). Cronbach
measures;
1. Reliability less than 0.6 considered poor.
2. Reliability in the range 0.7 considered acceptable.
3. Reliability more than 0.8 considered good
Third, in order to determine whether there are significant relationships among the
independent variables and dependent variable, Pearson Correlation Coefficient
analysis will be carry out. The scale model suggested by Davies (1971) used to
describe the relationship between the independent variables and the dependent
variable, are as shown below:
1. 0.7 and above – very strong relationship,
2. 0.50 to 0.69 – strong relationship,
3. 0.30 to 0.49 – moderate relationship,
4. 0.10 to 0.29 – low relationships and
5. 0.01 to 0.09 – very low relationship.
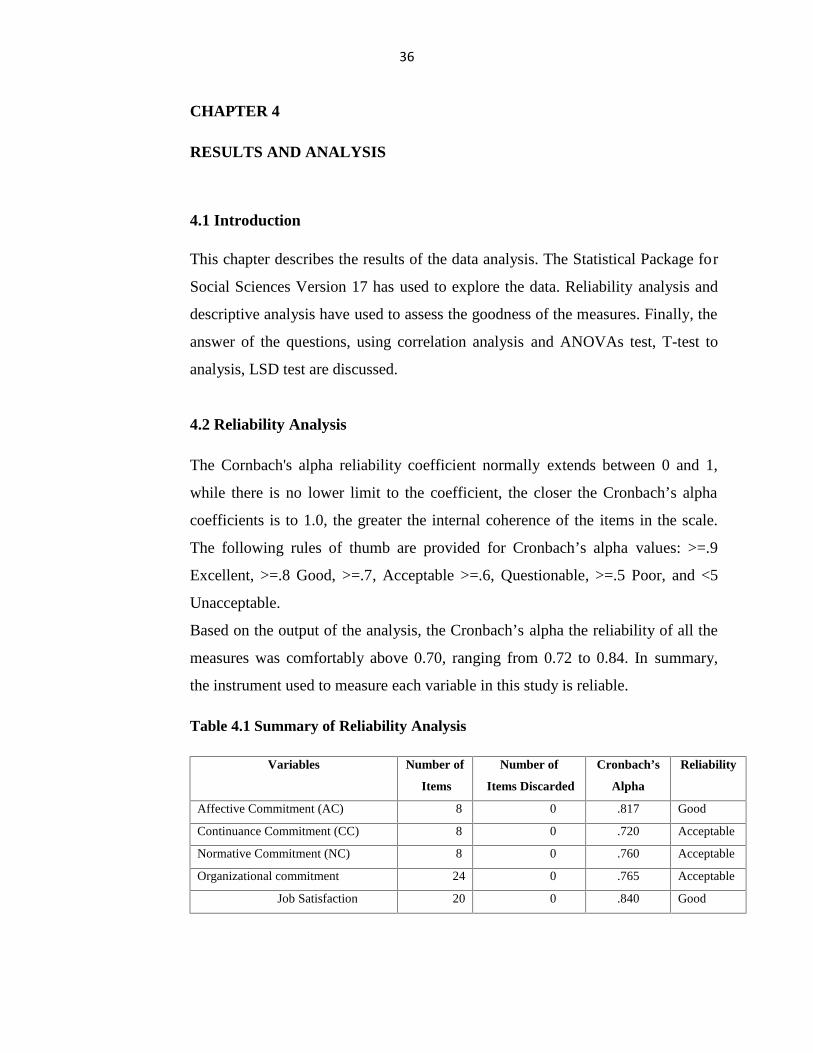
36
CHAPTER 4
RESULTS AND ANALYSIS
4.1 Introduction
This chapter describes the results of the data analysis. The Statistical Package for
Social Sciences Version 17 has used to explore the data. Reliability analysis and
descriptive analysis have used to assess the goodness of the measures. Finally, the
answer of the questions, using correlation analysis and ANOVAs test, T-test to
analysis, LSD test are discussed.
4.2 Reliability Analysis
The Cornbach's alpha reliability coefficient normally extends between 0 and 1,
while there is no lower limit to the coefficient, the closer the Cronbach’s alpha
coefficients is to 1.0, the greater the internal coherence of the items in the scale.
The following rules of thumb are provided for Cronbach’s alpha values: >=.9
Excellent, >=.8 Good, >=.7, Acceptable >=.6, Questionable, >=.5 Poor, and <5
Unacceptable.
Based on the output of the analysis, the Cronbach’s alpha the reliability of all the
measures was comfortably above 0.70, ranging from 0.72 to 0.84. In summary,
the instrument used to measure each variable in this study is reliable.
Table 4.1 Summary of Reliability Analysis
Variables Number of
Items
Number of
Items Discarded
Cronbach’s
Alpha
Reliability
Affective Commitment (AC) 8 0 .817 Good
Continuance Commitment (CC) 8 0 .720 Acceptable
Normative Commitment (NC) 8 0 .760 Acceptable
Organizational commitment 24 0 .765 Acceptable
Job Satisfaction 20 0 .840 Good

37
4.3 Descriptive
The summary of the descriptive statistics to all variables are evaluated depending
on a 5-point scale (1 being very high disagree to 5 being very high agree). The
results show that the mean on affective commitment was 3.51 with SD = 0.90, the
mean for continuance commitment was 3.61 with SD = 0.99, the mean for
normative commitment was 3.55 with SD = 0.76 but the mean if organizational
commitment was 3.55 and with SD= .88 and the mean and standard deviation for
job satisfaction was 3.54 and 0.76 respectively. The mean values of all the
variables are slightly (moderately satisfied).
Table 4.2 Overall Descriptive Statistics of the Study VariablesFactor N Min Max. Mean SD
Job satisfaction 164 2.00 4.86 3.71 0.89
Affective commitment 164 2.17 4.86 3.51 0.90
Continuance commitment 164 1.65 4.43 3.61 0.99
Normative commitment 164 2.33 4.67 3.55 0.76
Organizational commitment 164 2.05 4.65 3.55 0.88
Valid N (list wise) 164
4.4 The Study Analyzed Questions
Q1: Does Job Satisfaction Exist amongst Palestine Technical College
Academics staff?
To answer the study question the researcher used the averages, standard
deviations, and percentages and rating the degree of job satisfaction. The
following ranking the degree of job satisfaction has adopted as follows: that
based on the scale in terms of averages, as shown in the following rating:Level Below 3 3 - 3.49 3.50 - 3.99 4.00 - 4.49 4.50 and above
Average Not satisfied Neutral (neither
satisfied or
dissatisfied
Slightly
moderately
satisfied
Satisfied Highly satisfied

38
Table 4.3 Averages, SD, depending on the Job Satisfaction of Academics Staff
No Paragraph Mean SD Percentage
1. Being able to keep busy all the time (Activity) 3.05 1.16 61.0
2. The chance to work alone on the job (Independence) 3.47 1.16 69.1
3. The chance to do different things from time to time
(Variety)
4.28 .64 85.6
4. The chance to be somebody in the community (Social
Status)
4.13 .82 82.6
5. The way my boss handles his/her subordinates
(Supervision/ human relations)
3.96 .81 79.3
6. The competence of my supervisor in making decisions
(Supervision/ technical)
4.02 .93 80.4
7. Being able to do things that don‘t go against my
conscience (Moral values)
4.02 .78 80.3
8. The way my job provides for steady employment
(Security)
2.80 1.05 65.1
9. The chance to do things for other people (Social
service)
3.77 .87 75.5
10. The chance to tell people what to do (Authority) 4.43 .57 86.1
11. The chance to do something that makes use of my
abilities (Ability)
4.28 .64 85.6
12. The way company policies are put into practice
(Policies and practices)
3.02 1.14 60.3
13. My pay and the amount of work I do (Compensation) 2.88 1.17 57.6
14. The chances for advancement in this job
(Advancement)
3.15 1.14 63.0
15. The freedom to use my own judgment (Responsibility) 3.09 .76 78.8
16. The chance to try my own methods of doing the job
(Creativity).
4.45 .57 88.9
17. The working conditions (Working conditions) 2.85 1.09 57.1
18. The way my colleagues get along with each other (Co-
workers)
3.96 .81 79.3
19. The praise I get for doing a good job. (Recognition) 3.34 1.11 68.7
20. The feeling of accomplishment I get from the job
(Achievement)
4.02 .78 80.3
Total to all Paragraphs 3.64 .9 74.23

39
It is noticeable that all the averages between (2.80 to 4.43) and this gives an
indication that the statistical averages not in excess of (4.5 and above) indicate the
presence of a high level of job satisfaction. As we seen from the above table that
paragraphs (8,13,17) have got a not satisfied estimate, while as the paragraphs
(1,2,12,14,15,19) have a Neutrals, and (5, 9, 18) have got a slightly estimate,
while as (3, 4, 6, 7, 10, 11, 16 , 20) have got a satisfied estimate. The total score of
all paragraphs at job satisfaction for Academics staff have got slightly estimate.
Q2: Does Organizational Commitment Exist Amongst Palestine Technical
College Academics Staff.
Table 4.4 Averages, SD, Depending on the Affective Commitment of Academics
Staff
No Paragraph Mean SD Percentage
1. I would be very happy to spend the rest of my
career with this organization.
3.56 .81 79.8
2. I enjoy discussing about my organization with
people outside it.
4.7 .96 83.4
3. I really feel as if this organization’s problems are
my own.
3.6 .69 79.8
4. I think that I could easily become as attached to
another organization as I am to this one.
4.2 .88 80.1
5. I do not feel like ‘part of the family’ at my
organization.
3.4 .78 79.4
6. I do not feel ‘emotionally attached’ to this
organization.
2.1 1.14 60.1
7. This organization has a great deal of personal
meaning for me.
4.1 .79 78.3
8. I do not feel a ‘strong’ sense of belonging to my
organization.
1.6 1.01 58.1
Total Paragraphs 3.51 0.88 74.87

40
It is noticeable that all the averages between (1.6 to 4.7) and this gives an
indication that the statistical averages not excess of (4.5 and above) indicate the
presence of a high level of affective commitment. As we seen from the above table
that paragraph (2) have got a high estimate, while paragraph (5) have got Neutrals
estimate , but the paragraphs(6,8) have got not satisfied estimate, while as the
paragraphs ( 1, 3) have got a slightly estimate, and paragraphs (4 ,7) have got a
satisfied estimate. The total score of all paragraphs at affective commitment for
academics staff have slightly estimate.
Table 4.5 Averages, SD Depending on the Continuance Commitment of
Academic StaffNo Paragraph Mean SD Percentage
9. I am not afraid of what might happen if I quit my job
without having another one lined up.
3.05 1.09 61.4
10. It would be very hard for me to leave my organization
right now, even if I wanted to.
2.89 1.13 57.8
11. Too much in my life would be disrupted if I decided to
leave my organization now.
2.88 1.17 57.6
12. It would not be too costly for me to leave my
organization now.
3.01 1.09 60.2
13. Right now, staying with my organization is a matter of
necessity as much as desire.
3.9 0.78 78.1
14. I feel that I have very few options to consider leaving
this organization.
2.58 1.07 51.5
15. One of the few serious consequences of leaving this
organization would be the scarcity of available
alternatives.
2.9 0.73 58.1
16. One of the major reasons I continue to work for this
organization is that leaving would require considerable
personal sacrifice another organization may not match the
overall benefits I have here.
2.80 1.05 56.1
Total Paragraphs 3.20 1.01 60.1
It is noticeable that all the averages between (2.80 to 3.9) and this gives an
indication that the statistical averages not excess of (4.5 and above) indicate the

41
presence of a high level of continuance commitment. As we seen from the above
table that no paragraphs have got a high estimate, while paragraphs (5, 12) have got
Neutrals estimate , but the paragraphs (10, 11, 14, 15, 16) have got not satisfied
estimate, while as the paragraph ( 13) have got a slightly estimate, and no paragraphs
have got a satisfied estimate. The total score of all paragraphs at continuance
commitment for academics staff have Neutrals' estimate.
Table 4.6 Averages, SD Depending on the Normative Commitment of Academics
StaffNo Paragraph Mean SD Percentage
17. I think that people these days move from company to
company too often.
3.42 .71 74.1
18. I do not believe that a person must always be loyal to
his or her organization.
3.66 .65 76.3
19. Jumping from organization to organization does not
seem at all unethical to me.
3.56 .56 78.1
20. One of the major reasons I continue to work in this
organization is that I believe loyalty is important and
therefore feel a sense of moral obligation to remain.
3.1 .90 65.4
21. If I got another offer for a better job elsewhere I would
not feel it was right to leave my organization.
4.1 .67 80.1
22. I was taught to believe in the value of remaining loyal
to one organization.
3.7 .56 75.1
23. Things were better in the days when people stayed in
one organization for most of their careers.
2.8 1.02 59.2
24. I do not think that to be a ‘company man’ or ‘company
woman’ is sensible anymore.
3.0 .96 63.4
Total Paragraphs 3.41 0.75 71.46
It is noticeable that all the averages between (2.80 to 4.1) and this gives an
indication that the statistical averages not excess of (4.5 and above) indicate the
presence of a high level of normative commitment. As we seen from the above
table that no paragraphs have got a high estimate, while paragraphs (17, 20, 24) have
got Neutrals estimate , but the paragraph (23) have got not satisfied estimate, while as
the paragraphs (18, 19, 22) have got a slightly estimate, and paragraph (21) have got a

42
satisfied estimate. The total score of all paragraphs at normative commitment for
Academics staff have Neutrals' estimate.
Table 4.7 Averages, SD Depending on the Organizational Commitment of
Academics staff
No Paragraph Mean SD Percentage
1. Affective commitment 3.51 0.88 74.87
2. Continuance commitment 3.20 1.01 60.1
3. Normative commitment 3.41 0.75 71.46
Organizational commitment 3.40 0.88 68.81
It is noticeable that all the averages between (3.2 to 3.51) and this give an
indication that the statistical averages in excess of (3 to 3.49) indicate the presence
of a neutrals level of organizational commitment.
Q3: Does Job Satisfaction Exist Amongst Palestine Technical College
Administrative Support Staff?
To answer the study question the researcher used the averages, standard
deviations, and percentages and rating the degree of job satisfaction. The
following ranking the degree of job satisfaction has adopted as follows: that
based on the scale in terms of averages, as shown in the following rating:Level Below 3 3 - 3.49 3.50 - 3.99 4.00 - 4.49 4.50 and above
Average Not satisfied Neutral (neither
satisfied or
dissatisfied
Slightly
moderately
satisfied
Satisfied Highly satisfied
Table 4.8 Averages, SD Depending on the Job Satisfaction of Administrative
Support Staff
No Paragraph Mean SD Percentage
1. Being able to keep busy all the time (Activity) 3.05 1.1 61
2. The chance to work alone on the job
(Independence)
3.3 1.12 65.2

43
3. The chance to do different things from time to
time (Varieties)
4.1 0.6 83.6
4. The chance to be somebody in the community
(Social Status)
4 0.79 80.3
5. The way my boss handles his/her subordinates
(Supervision/ human relations)
3.4 0.9 76.3
6. The competence of my supervisor in making
decisions (Supervision/ technical)
3.93 1.01 78.9
7. Being able to do things that don‘t go against my
conscience (Moral values)
3.86 0.75 78.2
8. The way my job provides for steady employment
(Security)
2.5 1.12 63.2
9. The chance to do things for other people (Social
service)
3.56 0.84 75.2
10. The chance to tell people what to do (Authority) 4.12 0.57 85.7
11. The chance to do something that makes use of
my abilities (Ability)
4.11 0.66 84.7
12. The way company policies are put into practice
(Policies and practices)
3 1.14 59.1
13. My pay and the amount of work I do
(Compensation)
2.6 1.02 56.7
14. The chances for advancement in this job
(Advancement)
3.2 1.2 63
15. The freedom to use my own judgment
(Responsibility)
3.01 0.78 78.5
16. The chance to try my own methods of doing the
job. (Creativity)
4.02 0.6 85.9
17. The working conditions (Working conditions) 2.85 1.21 56.9
18. The way my colleagues get along with each other
(Co-workers)
3.25 0.75 75.7
19. The praise I get for doing a good job.
(Recognition)
3.01 1 65.7
20. The feeling of accomplishment I get from the job
(Achievement)
3.78 0.74 78.1
Total to all Paragraphs 3.53 0.89 72.59
It is noticeable that all the averages between (2.5 to 4.12) and this gives an
indication that the statistical averages not in excess of (4.5 and above) indicate the
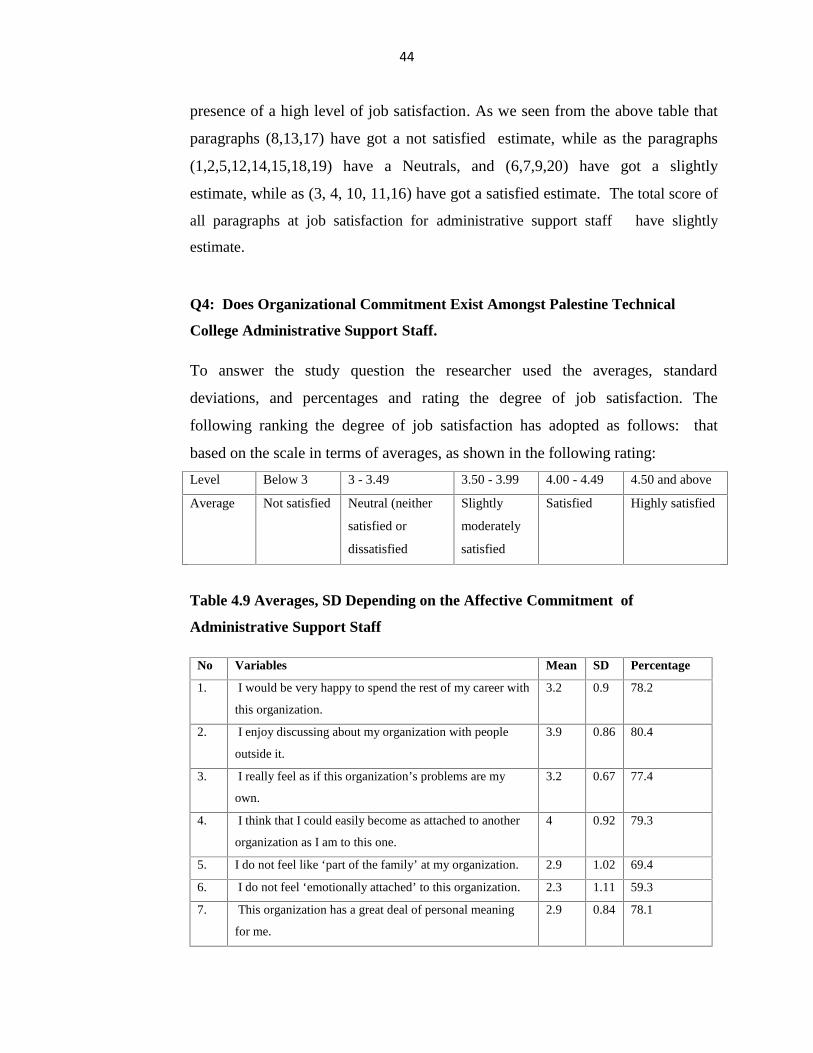
44
presence of a high level of job satisfaction. As we seen from the above table that
paragraphs (8,13,17) have got a not satisfied estimate, while as the paragraphs
(1,2,5,12,14,15,18,19) have a Neutrals, and (6,7,9,20) have got a slightly
estimate, while as (3, 4, 10, 11,16) have got a satisfied estimate. The total score of
all paragraphs at job satisfaction for administrative support staff have slightly
estimate.
Q4: Does Organizational Commitment Exist Amongst Palestine Technical
College Administrative Support Staff.
To answer the study question the researcher used the averages, standard
deviations, and percentages and rating the degree of job satisfaction. The
following ranking the degree of job satisfaction has adopted as follows: that
based on the scale in terms of averages, as shown in the following rating:Level Below 3 3 - 3.49 3.50 - 3.99 4.00 - 4.49 4.50 and above
Average Not satisfied Neutral (neither
satisfied or
dissatisfied
Slightly
moderately
satisfied
Satisfied Highly satisfied
Table 4.9 Averages, SD Depending on the Affective Commitment of
Administrative Support Staff
No Variables Mean SD Percentage
1. I would be very happy to spend the rest of my career with
this organization.
3.2 0.9 78.2
2. I enjoy discussing about my organization with people
outside it.
3.9 0.86 80.4
3. I really feel as if this organization’s problems are my
own.
3.2 0.67 77.4
4. I think that I could easily become as attached to another
organization as I am to this one.
4 0.92 79.3
5. I do not feel like ‘part of the family’ at my organization. 2.9 1.02 69.4
6. I do not feel ‘emotionally attached’ to this organization. 2.3 1.11 59.3
7. This organization has a great deal of personal meaning
for me.
2.9 0.84 78.1

45
8. I do not feel a ‘strong’ sense of belonging to my
organization.
1.5 1.01 58.1
Total Paragraphs 3.2 0.91 72.52
It is noticeable that all the averages between (1.5 to 4) and this gives an indication
that the statistical averages not excess of (4.5 and above) indicate the presence of
a high level of affective commitment. As we seen from the above table that no
paragraphs have got a high estimate, while paragraphs (1,3) have got Neutrals
estimate , but the paragraphs (5,6,7,8) have got not satisfied estimate, while as the
paragraph (2) have got a slightly estimate, and paragraph (5) have got a satisfied
estimate. The total score of all paragraphs at affective commitment for administrative
support staff have Naturals estimate.
Table 4.10 Averages, SD Depending on the Continuance Commitment of
Administrative Support StaffNo Variables Mean SD Percentage
9.I am not afraid of what might happen if I quit my job
without having another one lined up.3.2 0.99 60.5
10.It would be very hard for me to leave my organization
right now, even if I wanted to.2.7 1.15 57.4
11.Too much in my life would be disrupted if I decided to
leave my organization now.2.67 1.05 55.7
12.It would not be too costly for me to leave my organization
now.3.4 1.05 60.2
13.Right now, staying with my organization is a matter of
necessity as much as desire.3.7 0.76 77.5
14.I feel that I have very few options to consider leaving this
organization.2.7 0.95 55.5
15.
One of the few serious consequences of leaving this
organization would be the scarcity of available
alternatives.
2.8 0.71 58.4
16.
One of the major reasons I continue to work for this
organization is that leaving would require considerable
personal sacrifice another organization might not match
the overall benefits I have here.
2.4 1.09 56.2
Total Paragraphs 2.92 0.96 60.17

46
It is noticeable that all the averages between (2.4 to 3.7) and this gives an
indication that the statistical averages not excess of (4.5 and above) indicate the
presence of a high level of a continuance commitment. As we seen from the above
table that no paragraphs have got a high estimate, while paragraphs (9,12) have got
Neutrals estimate , but the paragraphs (10,11,14,15,16) have got not satisfied
estimate, while as the paragraphs (13) have got a slightly estimate, and no paragraphs
have got a satisfied estimate. The total score of all paragraphs at Continuance
commitment for administrative support staff have not satisfied estimate.
Table 4.11 Averages, SD Depending on the Normative Commitment of
Administrative Support Staff
No Paragraph Mean SD Percentage
17. I think that people these days move from
company to company too often.
3.7 0.69 73.9
18. I do not believe that a person must always be
loyal to his or her organization.
3.4 0.68 75.9
19. Jumping from organization to organization does
not seem at all unethical to me.
3.5 0.62 78.3
20. One of the major reasons I continue to work in
this organization is that I believe loyalty is
important and therefore feel a sense of moral
obligation to remain.
3.2 0.92 65.1
21. If I got another offer for a better job elsewhere, I
would not feel it was right to leave my
organization.
4.3 0.69 80.4
22. I was taught to believe in the value of remaining
loyal to one organization.
3.4 0.58 74.1
23. Things were better in the days when people
stayed in one organization for most of their
careers.
2.8 1.12 59.1
24. I do not think that to be a ‘company man’ or
‘company woman’ is sensible anymore.
3.6 0.92 64.1
Total Paragraphs 3.5 0.77 71.36

47
It is noticeable that all the averages between (2.8 to 4.3) and this gives an
indication that the statistical averages not excess of (4.5 and above) indicate the
presence of a high level of normative commitment. As we seen from the above
table that no paragraphs have got a high estimate, while paragraphs (18,20,22) have
got Neutrals estimate , but the paragraph (23) have got not satisfied estimate, while as
the paragraphs (17,19,24) have got a slightly estimate, and paragraph (21) have got a
satisfied estimate. The total score of all paragraphs at normative commitment for
administrative support staff have slightly estimate.
Table 4.12 Averages, SD Depending on the Organizational Commitment of
Administrative Support Staff
No Paragraph Mean SD Percentage
1. Affective commitment 3.20 0.91 72.52
2. Continuance commitment 2.92 0.96 60.17
3. Normative commitment 3.50 0.77 71.36
Organizational commitment 3.20 0.88 68.02
As we seen from the table above it is noticeable that all the averages between
(2.92 to 3.50) and this give an indication that the statistical averages in excess of
(3 to 3.49) indicate the presence of a neutral level of organizational commitment.
Q4: Is there any Difference between Job Satisfaction and Organizational
Commitment Exist amongst Administrative Support Staff and Academic staff at
Palestine Technical College?
Correlation Analysis
Inter-correlations coefficients (r) have calculated by the means of Pearson’s Product
Moment. According to Cohen (1988), r raging from 0.10 to 0.29 indicating a low
degree of correlation, r 0.30 to 0.49 indicating a moderate degree of correlation and r
raging from 0.50 to 1.00 a high degree of correlation. Table (4.13) shows the
summary of the results. The result indicates that there are positive significant
relationship between affective commitment, continuance commitment and normative

48
commitment on job satisfaction that the greater the job satisfaction increased
organizational commitment.
(r = .389, n =164, p <.001; r =.318, n =164, p<.001, r = .332, n = 164, p <.001)
Table 4.13 Pearson’s Correlation Coefficients of the Study Variables (N=164)
The Field Person's Correlation Significant
Affective commitment 0.389** .001
Continuance commitment 0.318** .001
Normative commitment 0.332** .001
Job satisfaction 0.390** .001
Organizational Commitment 0.357** .001
** Correlation is significant at the 0.01 level
Q5: Does any Significant Differences Exist in the Level of Job Satisfaction and
Organizational Commitment with Regard to Demographic Characteristics?
- Gender
To find the results have been used Independent -t- test, Results illustrated in the
following table (4.14)
Table 4.14 Test results (T- test) depending on Gender
The FieldMale (74) Female(90)
T-value SignificantSD Mean SD Mean
Job satisfaction 0.60 3.41 0.49 3.43 0.45 0.88
Affective commitment 0.55 3.77 0.46 3.75 0.57 0.85
Continuance commitment 0.79 3.36 0.67 3.31 0.35 0.72
Normative Commitment 0.78 3.18 0.57 3.33 0.68 0.26
Total of Job satisfaction 0.60 3.41 0.49 3.43 0.32 0.88
Total of organizational Commitment 0.71 3.44 0.57 3.46 0.53 0.61
* Statistically at the significance level (0.05)

49
It is seen from the above table that the value of (t) calculated less than the value (T)
tabulated on job satisfaction and job commitment , that mean there are no
statistically significant differences at (alpha = 0.05), because the differences between
the average of male and female was very little significance level as It is shown in the
table.
- Qualification
In order to answer the question researcher used the One Way ANOVA test and that
the results shown in the table (4.16), While the table (4.15) show averages variable
depending on the qualifications as follows:
Table 4.15 Test Results (Mean and SD) Depending on Qualification
The FieldPHD Master BA Diploma
Mean SD Mean SD Mean SD Mean SD
Job satisfaction 3.60 0.74 3.43 0.66 3.35 0.52 3.34 0.64
Affective commitment 3.92 0.55 3.68 0.51 3.73 0.47 3.74 0.87
Continuance commitment 3.40 0.73 3.23 0.81 3.21 0.76 3.27 0.92
Normative Commitment 3.18 0.79 3.12 0.80 3.19 0.97 3.35 .97
Total of Job satisfaction 3.60 0.74 3.43 0.66 3.35 0.52 3.34 0.64
Total of organizational
Commitment3.50 0.69 3.34 0.71 3.38 0.73 3.45 0.92
* Statistically at the significance level (0.05)
Table 4.16 Results One-Way ANOVAs depending Qualification
The Field Sum of
Squares
DF Mean
Square
F *Sig.
Job satisfaction Between Groups
Within Groups
Total
1.593
83.572
85.165
3
160
163
0.398
0.349
1.142 0.10*
Affective commitment Between Groups
Within Groups
Total
2.878
87.761
90.638
3
160
163
0.719
0.295
2.435 0.04
Continuance
commitment
Between Groups
Within Groups
Total
8.828
174.402
183.230
3
160
163
2.207
0.587
3.758 0.05

50
Normative
Commitment
Between Groups
Within Groups
Total
5.363
156.842
162.205
3
160
163
1.341
0.528
2.539 0.40*
Total of Job
satisfaction
Between Groups
Within Groups
Total
1.593
83.572
85.165
3
160
163
0.398
0.349
1.142 0.10*
Total of organizational
Commitment
Between Groups
Within Groups
Total
1.597
92.026
93.623
3
160
163
0.399
0.310
1.289 0.27*
* Statistically at the significance level (0.05)
Seen from the above table that the value of (F) calculated less than the value of (F)
Tabulated on job satisfaction but for the areas of organizational commitment, there
were statistically significant differences the level of (0.05 = α).
To find out to whom of returning the differences, researcher used the test (LSD) to
enables to make direct comparisons between two means from two individual groups.
Any difference larger than the LSD has considered a significant result. The result
shows in tables (17, 18, and 19).
Table 4.17 (LSD) Test Depending on the Field Job Satisfaction
The Field PhD Master BA Diploma
PhD -.12 -.11 -.03*
Master -.49 -.018*
BA -.023*
Diploma
* Statistically significant at α = 0.05//Signal Negative means an inverse relationship
It has seen from the above table that there are statistically significant differences
between the groups as follows:
- (PhD, Diploma) for Diploma
- (Mater, Diploma) for Diploma
- (BA, Diploma) for Diploma

51
Table 4.18 (LSD) Test Depending on the Field Normative Commitment
The Field PhD Master BA Diploma
PhD .03 -.13 -.035*
Master -.19 -0.4*
BA -.038*
Diploma
* Statistically significant at α = 0.05
//Signal Negative means an inverse relationship
It has seen from the above table that there are statistically significant differences
between the groups as follows:
- (PhD, Diploma) in favor Diploma
- (Master, Diploma) in favor Diploma
- (BA, Diploma) in favor Diploma
Table 4.19 (LSD) Test Depending on the Field Normative Commitment
The Field PhD Master BA Diploma
PhD .047* .032* .043*
Master .01 .12
BA .11
Diploma
* Statistically significant at α = 0.05
//Signal Negative means an inverse relationship
It has seen from the above table that there are statistically significant differences
between the groups as follows:
- (PhD, Master) in favor PhD
- (PhD, BA) in favor PhD
- (PhD, Diploma) in favor PhD

52
- Marital status
To find the results have been used Independent -t- test, Results illustrated in the
following table (4.20)
Table 4.20 Test results (T- test) depending on marital status
The FieldMarried(110) Not Married (54)
T-value Sig.SD Mean SD Mean
Job satisfaction 4.28 .64 3.77 0.46 0.206 0.81
Affective commitment 3.6 .69 3.36 0.67 0.160 0.70
Continuance commitment 4.2 .88 3.18 0.57 0.311 0.65
Normative Commitment 3.4 .78 3.41 0.49 .96 0.26
Total of Job satisfaction 4.28 .64 3.77 0.46 0.206 0.81
Total of organizational Commitment 3.73 0.78 3.31 0.57 0.47 0.53
* Statistically significant at the significance level (0.05)
It is seen from the above table that the value of (t) calculated less than the value (T)
tabulated on job satisfaction and job commitment , that mean there are not
statistically significant differences at (alpha = 0.05), because the differences, between
the average of married and not married was very little significance level as It is
shown in the table.
- Position
To find the results have been used Independent -t- test, Results illustrated in the
following table (4.21)
Table 4.21 Test Results (T- test) Depending on Position
The FieldAcademic(80) Administrative
T-value Sig.SD Mean SD Mean
Job satisfaction 0.602 3.41 0.496 3.43 -0.148 0.88*

53
Affective commitment 0.559 3.77 0.463 3.75 0.188 0.85
Continuance commitment 0.793 3.36 0.674 3.31 0.353 0.72
Normative Commitment 0.787 3.18 0.576 3.33 -1.109 0.26*
Total of Job satisfaction 0.602 3.41 0.496 3.43 -0.148 0.88*
Total of organizational Commitment 0.68 3.43 0.55 3.45 -0.17 0.67*
* Statistically significant at the significance level (0.05)
It has seen from the above table that the value of (t) calculated less than the value (T)
tabulated on job satisfaction and job commitment , that mean there are statistically
significant differences at (alpha = 0.05), because the differences, between the average
of Academic staff and administrative support staff significance level as It is shown
in the table
- Year of Experience in the Sector
In order to answer the question researcher used the One Way ANOVA test and that
the results shown in the table (4.23), While the table (4.22) show averages variable
depending on the Experience in the sector as follows:
Table 4.22 Test Results (Mean and SD) Depending on Year of Experience in the
Sector
The FieldLess than 1 1 to 4 5 to 9 10 to 14 15 to 19 20 or more
Mean SD Mean SD Mean SD Mean SD Mean SD Mean SD
Job
satisfaction3.47 0.59 3.44 0.60 3.33 0.56 3.35 0.60 3.85 0.56 3.85 0.50
Affective
commitment3.61 0.55 3.68 0.54 3.64 0.74 3.40 0.74 3.16 0.79 3.39 0.78
Continuance
commitment3.23 0.67 2.99 0.78 3.05 0.76 2.86 0.72 2.99 0.79 2.67 0.66
Normative
Commitment2.72
0.69 3.130.54 3.38 0.56 3.90 0.53 3.98 0.32 3.56 4.01
Total of Job
satisfaction3.47 0.59 3.44 0.60 3.33 0.56 3.35 0.60 3.85 0.56 3.85 0.50
Total of
organizational
Commitment
3.19 0.64 3.27 0.62 3.36 0.69 3.39 0.66 3.38 0.63 3.21 1.82

54
Table 14.23 Results One way ANOVAs Analysis Depending Year Experience in
the Sector
The Field Sum of
Squares
DF Mean
Square
F Sig.
Job satisfaction Between Groups
Within Groups
Total
4.63
88.99
93.62
4
159
163
1.54
0.29
5.17 0.02*
Affective commitment Between Groups
Within Groups
Total
2.88
87.75
90.63
4
159
163
0.96
0.26
3.26 0.02*
Continuance
commitment
Between Groups
Within Groups
Total
15.17
168.05
183.23
4
159
163
5.05
0.56
8.972 0. 01*
Normative Commitment Between Groups
Within Groups
Total
7.04
170.10
177.14
4
159
163
2.34
0.57
4.11 0.03*
Total of Job satisfaction Between Groups
Within Groups
Total
4.63
88.99
93.62
4
159
163
1.54
0.29
5.17 0.02*
Total of organizational
Commitment
Between Groups
Within Groups
Total
1.17
25.75
26.92
4
159
163
0.39
0.086
4.531 0.04*
* Statistically significant at the significance level (0.05)
Seen from the above table that the value of (F) calculated greater than the value of (F)
Tabulated on job satisfaction and Affective commitment and continuance
commitment and normative commitment (organizational commitment), there were
statistically significant differences the level of (0.05 = α).
To find out to whom of returning the differences, researcher used the test (LSD) to
enables to make direct comparisons between two means from two individual groups.
Any difference larger than the LSD has considered a significant result. The result
shows in tables (24, 25, 26, 27, and 28).

55
Table 4.24 (LSD) Test Depending on the Field Job Satisfaction
The Field Less than 1 1 to 4 5 to 9 10 to 14 15 to 19 More than 20
Less than 1 0.05 0.031* 0.025* 0.027* -0.06
1 to 4 -0.016* -0.013* -0.108 -0.07
5 to 9 -0.07 .032* 0.027*
10 to 14 0.14 .017
15 to 19 0.03
More than 10
* Statistically significant at α = 0.05
//Signal Negative means an inverse relationship
It has seen from the above table that there are statistically significant differences
between the groups as follows:
- (less than 1, 5 to 9) in favor less than 1
- (less than 1, 10 to 14) in favor less than 1
- (less than 1, 15 to 19) in favor less than 1
- (1 to 4, 5 to 9) in favor (5 to 9)
- (1 to 4, 10 to 14) in favor (10 to 14)
- (5 to 9, 15 to 19) in favor (5 to 9)
- (5 to 9, more than 20) in favor (5 to 9)
Table 4.25 (LSD) Test Depending on the Field Affective Commitment
The Field Less than 1 1 to 4 5 to 9 10 to 14 15 to 19 More than 20
Less than 1 -0.016* -0.07 0.031* 0.019* 0.04
1 to 4 0.19 0.027* -0.12 0.032*
5 to 9 0.039* 0. 3 -0.15
10 to 14 -0.019* 0.18
15 to 19 -0.23
More than

56
10
* Statistically significant at α = 0.05
//Signal Negative means an inverse relationship
It has seen from the above table that there are statistically significant differences
between the groups as follows:
- (less than 1, 1to4) in favor (1 to 4)
- (less than 1, 10 to 14) in favor less than 1
- (less than 1, 15 to 19) in favor less than 1
- (1 to 4, 10 to 14) in favor (1 to 4)
- (1 to 4, More than 20) in favor (1 to 4)
- (5 to 9, 10 to 14) in favor (5 to 9)
- (10 to 14, 15 to 19) in favor (15 to 19)
Table 4.26 (LSD) Test Depending on the Field Continuance Commitment
The Field Less than 1 1 to 4 5 to 9 10 to 14 15 to 19 More than 20
Less than 1 0.15 0.039* 0.033* 0.24 0.18
1 to 4 -0.1 -0.04* 0.012* 0.16
5 to 9 -0.022* 0.30 0.12
10 to 14 0.03* -0.11
15 to 19 -0.50
More than 10
* Statistically significant at α = 0.05
//Signal Negative means an inverse relationship
It has seen from the above table that there are statistically significant differences
between the groups as follows:
-(less than 1, 5 to 9) in favor less than 1
-(less than 1, 10 to 14) in favor less than 1
- (l to 4, 10 to 14) in favor (10 to 14)

57
- (1 to 4, 15 to 19) in favor (1 to 4)
- (5 to 9, 10 to 14) in favor (10 to 14)
- (10 to 14, 15 to 19) in favor (10 to 14)
Table 4.27 (LSD) Test Depending on the Field Normative Commitment
The Field Less than 1 1 to 4 5 to 9 10 to 14 15 to 19 More than 20
Less than 1 0.023* 0.2 -0.03* 0.12 0.048*
1 to 4 - 0.11 0.024* 0.36 0.032*
5 to 9 -0.03 0.021* -.011
10 to 14 0.12 -0.15
15 to 19 -0.013*
More than 10
* Statistically significant at α = 0.05
//Signal Negative means an inverse relationship
It has seen from the above table that there are statistically significant differences
between the groups as follows:
-(less than 1, 1 to 4) in favor less than 1
-(less than 1, 10 to 14) in favor (10 to 14)
- (less than 1, More than 20) in favor less than 1
- (1 to 4, 10 to 14) in favor (1 to 4)
- (1 to 4, More than 20) in favor (1 to 4)
- (5 to 9, 15 to 19) in favor (5 to 9)
- (15to 19, More than 20) in favor more than 20
Table 4.28 (LSD) Test Depending on the Field Organizational Commitment
The Field Less than 1 1 to 4 5 to 9 10 to 14 15 to 19 More than
20
Less than 1 0.02* 0.13 -0.03* 0.06* 0.034*

58
1 to 4 0.11 -0.12 0.05* 0.051*
5 to 9 0.02 -0.041* -0.072*
10 to 14 0.31 0.061*
15 to 19 0.13
More than 10
* Statistically significant at α = 0.05
//Signal Negative means an inverse relationship
It has seen from the above table that there are statistically significant differences
between the groups as follows:
- (less than 1, 1 to 4) in favor less than 1
-(less than 1, 10 to 14) in favor l0 to 14
-(less than 1, 15 to 19) in favor less than 1
-(less than 1, More than 20) in favor less than 1
- (1 to 4, 15 to 19) in favor (1 to 4)
- (1to 4, more than 20) in favor (1 to 4)
- (5 to 9, 15 to 19) in favor (15 to 19)
- (5 to 9, more than 20) in favor more than 20
- (10 to 14, more than 20) in favor (10 to 14)
- Year of Experience in the Current Job
In order to answer the question researcher used the One Way ANOVA test and that
the results shown in the table (4.30), While the table (4.29) show averages variable
depending on the Experience in the current job as follows:

59
Table 4.29 Test Results (Mean and SD) Depending on Year of Experience in the
Current Job
The FieldLess than 1 1 to 4 5 to 9 10 to 14 15 to 19 20 or more
Mean SD Mean SD Mean SD Mean SD Mean SD Mean SD
Job
satisfaction3.30 0.59 3.45 0.55 3.76 0.52 3.66 0.53 3.25 0.54 3.56 0.66
Affective
commitment3.65 0.58 3.85 0.47 4.13 0.37 3.68 0.54 3.83 0.41 3.71 0.65
Continuance
commitment3.16 0.82 3.49 0.68 3.91 0.61 3.24 0.81 3.36 0.64 3.37 0.77
Normative
Commitment2.95 0.76 3.33 0.69 3.71 0.61 3.01 0.74 3.23 0.63 3.44 0.84
Total of Job
satisfaction3.30 0.59 3.45 0.55 3.76 0.52 3.66 0.53 3.25 0.54 3.56 0.66
Total of
organizational
Commitment
3.25 0.72 3.56 0.61 3.92 0.53 3.31 0.70 3.47 0.56 3.51 0.75
Table 4.30 Results One way ANOVAs Analysis Depending Year Experience in
the Current job
The Field Sum of
Squares
DF Mean
Square
F *Sig.
Job satisfaction Between Groups
Within Groups
Total
9.21
84.40
93.62
4
159
163
1.84
0.285
6.46 0.01*
Affective commitment Between Groups
Within Groups
Total
6.43
98.72
105.16
4
159
163
1.28
0.33
3.86 0.02*
Continuance
commitment
Between Groups
Within Groups
Total
0.51
26.40
26.91
4
159
163
0.10
0.089
1.16 0.32
Normative Commitment Between Groups
Within Groups
Total
18.93
158.21
177.14
4
159
163
3.78
0.56
7.08 0.01*

60
Total of Job satisfaction Between Groups
Within Groups
Total
9.21
84.40
93.62
4
159
163
1.84
0.285
6.46 0.01*
Total of organizational
Commitment
Between Groups
Within Groups
Total
8.62
94.44
103.07
4
159
163
1.72
0.32
4.03 0.01*
* Statistically significant at the significance level (0.05)
Seen from the above table that the value of (F) calculated less than the value of (F)
Tabulated on continuance commitment, While job satisfaction and Affective
commitment and normative commitment (organizational commitment), there were
greater than value of (F) Tabulated that mean's statistically significant differences the
level of (0.05 = α).
To find out to whom of returning the differences, researcher used the test (LSD) to
enables to make direct comparisons between two means from two individual groups.
Any difference larger than the LSD has considered a significant result. The result
shows in tables (31, 32, 33, and 34).
Table 4.31 (LSD) Test Depending on the Field Job Satisfaction
The Field Less than 1 1 to 4 5 to 9 10 to 14 15 to 19 More than 20
Less than 1 -0.14 -0.045* -0.06 0.04 -0.026*
1 to 4 -0.085* 0.19 0.11 0.31
5 to 9 0.039* 0.019* 0.050*
10 to 14 0.11 -0.20
15 to 19 -0.020*
More than 10
* Statistically significant at α = 0.05
//Signal Negative means an inverse relationship
It has seen from the above table that there are statistically significant differences
between the groups as follows:
-(less than 1, 5 to 9) in favor (5 to 9)
-(less than 1, More than 20) in favor more than 20
- (1 to 4,5to 9) in favor (5 to 9)

61
- (5 to 9, 10 to 14) in favor (5 to 9)
- (5 to 9, 15 to 19) in favor (5 to 9)
- (5 to 9, More than 20) in favor (5 to 9)
- (15 to 19, More than 20) in favor more than 20
Table 4.32(LSD) Test Depending on the Field Affective Commitment
The Field Less than 1 1 to 4 5 to 9 10 to 14 15 to 19 More than 20
Less than 1 -0.019* -0.047* -0. 25 - 0.18 - 0.6
1 to 4 - 0.027* 0.17 0.015 0.13
5 to 9 0.045* 0.029* 0.041*
10 to 14 - 0.15 0.3
15 to 19 0.11
More than 10
* Statistically significant at α = 0.05
//Signal Negative means an inverse relationship
It has seen from the above table that there are statistically significant differences
between the groups as follows:
-(less than 1, 1 to 4) in favor 1 to 4)
-(less than1, 5 to 9) in favor (5 to 9)
- (1 to 4, 5 to 9) in favor (5 to 9)
- (5 to 9, 10 to 14) in favor (5 to 9)
- (5 to 9, 15 to 19) in favor (5 to 9)
- (5 to 9, More than 20) in favor (5 to 9)

62
Table (4.33) (LSD) Test Depending on the Field Normative Commitment
The Field Less than 1 1 to 4 5 to 9 10 to 14 15 to 19 More than 20
Less than 1 -0.033* -0.075* -0.07 -0.19 -0.20
1 to 4 -0.045* 0.25 0.13 0.12
5 to 9 0.067* 0.055* 0.054*
10 to 14 -0.11 -0.13
15 to 19 -0.11
More than 10
* Statistically significant at α = 0.05
//Signal Negative means an inverse relationship
It has seen from the above table that there are statistically significant differences
between the groups as follows:
-(less than 1, 1 to 4) in favor (1 to 4)
-(less than 1, 5 to 9) in favor (5 to 9)
- (1 to 4, 5 to 9) in favor (5 to 9)
- (5 to 9, 10 to 14) in favor (5 to 9)
- (5 to 9, 15 to 19) in favor (5 to 9)
- (5 to 9, more than 20) in favor (5 to 9)
Table 4.34 (LSD) Test Depending on the Field Organizational Commitment
The Field Less than 1 1 to 4 5 to 9 10 to 14 15 to 19 More than 20
Less than 1 - 0.038* - 0.076* -0.6 -0.27 -0.049*
1 to 4 - 0.037* 0.031* 0.10 -0.11
5 to 9 0.69* 0.048* 0.26
10 to 14 -0.21 -0.043*
15 to 19 -0.20
More than 10
* Statistically significant at α = 0.05
//Signal Negative means an inverse relationship

63
It has seen from the above table that there are statistically significant differences
between the groups as follows:
-(less than 1, 1 to 4) in favor (1 to 4)
-(less than 1, 5 to 9) in favor (5 to 9)
-(less than 1, More than 20) in favor (more than 20)
- (1 to 4, 5 to 9) in favor (5 to 9)
- (1 to 4, 10 to 14) in favor (1 to 4)
- (5 to 9, 10 to 14) in favor (5 to 9)
- (5 to 9, 15 to 19) in favor (5 to 9)
- (10 to 14, more than 20) in favor (more than 20)
- Age
In order to answer the question researcher used the One Way ANOVA test and that
the results shown in the table (4.36), While the table (4.35) show averages variable
depending on the Age as follows:
Table 4.35 Test Results (Mean and SD) Depending on Age
The Field20 to 29 30 to 39 40 to 49 More than 50
Mean SD Mean SD Mean SD Mean SD
Job satisfaction 3.68 0.54 3.61 0.55 3.85 0.50 3.85 0.56
Affective commitment 3.64 0.74 3.40 0.74 3.04 0.79 3.16 0.74
Continuance
commitment3.39 0.78 3.23 0.67 2.99 0.78 3.05 0.78
Normative Commitment 2.86 0.72 2.99 0.79 2.67 0.66 2.72 0.69
Total of Job satisfaction 3.68 0.54 3.61 0.55 3.85 0.50 3.85 0.56
Total of organizational
Commitment3.44 0.54 3.38 0.56 3.13 0.53 3.19 0.54

64
Table 4.36 Results One way ANOVAs Analysis Depending Age
The Field Sum of
Squares
DF Mean
Square
F Sig.
Job satisfaction Between Groups
Within Groups
Total
1.63
175.50
177.13
3
160
163
0.40
0.59
0.693 0.59
Affective
commitment
Between Groups
Within Groups
Total
1.59
92.02
93.61
3
160
163
0.39
0.31
1.28 0.27
Continuance
commitment
Between Groups
Within Groups
Total
0.68
26.24
26.92
3
160
163
0.17
0.08
1.99 0.01*
Normative
Commitment
Between Groups
Within Groups
Total
5.36
156.84
162.20
3
160
163
1.34
0.52
2.539 0.04*
Total of Job
satisfaction
Between Groups
Within Groups
Total
1.63
175.50
177.13
3
160
163
0.40
0.59
0.693 0.59
Total of
organizational
Commitment
Between Groups
Within Groups
Total
2.54
91.70
94.24
3
160
163
0.63
0.39
1.81 0.13
* Statistically significant at the significance level (0.05)
Seen from the above table that the value of (F) calculated less than the value of (F)
Tabulated on job satisfaction and Affective commitment and organizational
commitment, While normative commitment and continuance commitment there were
greater than value of (F) Tabulated that mean's statistically significant differences the
level of (0.05 = α).
To find out to whom of returning the differences, researcher used the test (LSD) to
enables to make direct comparisons between two means from two individual groups.
Any difference larger than the LSD has considered a significant result. The result
shows in tables (37, 38)

65
Table 4.37 (LSD) Test Depending on the Field Continuance Commitment
The Field 20 to 29 30 to 39 40 to 49 More than 50
20 to 29 0.23 0.056* 0.12
30 to 39 -0.013* 0.32
40 to 49 0.14
More than 50
* Statistically significant at α = 0.05
//Signal Negative means an inverse relationship
It has seen from the above table that there are statistically significant differences
between the groups as follows:
- (20 to 29, 40 to 49) in favor (20 to 29)
- (30 to 30, 40 to 49) in favor (40 to 40)
Table 4.38 (LSD) Test depending on the field Normative Commitment
The Field 20 to 29 30 to 39 40 to 49 More than 50
20 to 29 0.023* 0.12 0.016*
30 to 39 -0.26 -0.022*
40 to 49 0.036*
More than 50
* Statistically significant at α = 0.05
//Signal Negative means an inverse relationship
It has seen from the above table that there are statistically significant differences
between the groups as follows:
- (20 to 29, 30 to 30) in favor (20 to 29)
- (20 to 29, more than 50) in favor (20 to 29)
- (30 to 39, more than 50) in favor (more than 50)
- (40 to 49, more than 50) in favor (40 to 49)

66
- Monthly Salary
In order to answer the question researcher used the One Way ANOVA test and that
the results shown in the table (4.40), While the table (4.39) show averages variable
depending on the Monthly salary as follows:
Table 4.39 Test Results (Mean and SD) Depending on Monthly Salary
The FieldLess than $1000 $1000 to $1499 $1500 to $1999 $2000 or more
Mean SD Mean SD Mean SD Mean SD
Job satisfaction 3.75 .76 3.55 .91 3.43 .83 3.05 .89
Affective
commitment3.88 .92 3.76 .95 3.86 .85 3.72 .92
Continuance
commitment3.72 .68 3.50 .80 3.65 .99 3.73 .66
Normative
Commitment3.49 .82 3.79 .73 3.51 .93 3.30 .86
Total of Job
satisfaction3.75 .76 3.55 .91 3.43 .83 3.05 .89
Total of
organizational
Commitment
3.70 0.81 3.68 0.83 3.67 0.92 3.58 0.81
Table 4.40 Results One-Way ANOVAs analysis depending Monthly Salary
The Field Sum of
Squares
DF Mean
Square
F *Sig.
Job satisfaction Between Groups
Within Groups
Total
24.38
162.02
186.40
3
160
163
12.19
.626
2.11 0.01*
Affective
commitment
Between Groups
Within Groups
Total
11.20
191.89
203.09
3
160
163
5.60
.741
2.15 0.02*
Continuance
commitment
Between Groups
Within Groups
Total
25.71
203.37
203.37
3
160
163
12.85
.785
1.99 0.02*

67
Normative
Commitment
Between Groups
Within Groups
Total
18.75
186.28
205.03
3
160
163
9.37
.719
2.53 0.04*
Total of Job
satisfaction
Between Groups
Within Groups
Total
24.38
162.02
186.40
3
160
163
12.19
.626
2.11 0.015*
Total of
organizational
Commitment
Between Groups
Within Groups
Total
18.55
138.00
156.56
3
160
163
9.72
.492
2.40 0.044*
* Statistically significant at the significance level (0.05)
Seen from the above table that the value of (F) calculated greater than the value of (F)
Tabulated on job satisfaction and Affective commitment and organizational
commitment, and normative commitment and continuance commitment that mean's
statistically significant differences the level of (0.05 = α).
To find out to whom of returning the differences, researcher used the test (LSD) to
enables to make direct comparisons between two means from two individual groups.
Any difference larger than the LSD has considered a significant result. The result
shown in tables (41, 42, 43, 44, 45)
Table 4.41 (LSD) Test Depending on the Field Job Satisfaction
*Statistically significant at α = 0.05
//Signal Negative means an inverse relationship
It has seen from the above table that there are statistically significant differences
between the groups as follows:
The Field Less than
$1000
$1000 to $1499 $1500 to $1999 $2000 or
more
Less than $1000 -0.13 -0.016* -0.019*
$1000 to $1499 -00.23* -0.016*
$1500 to $1999 -0.017*
$2000 or more

68
-(less than $1000, $1500 to 1999) in favor ($1500 to 1999)
-(less than $ 1000, $2000 or more) in favor ($2000 or more)
- ($1000 to $1499, $1500 to $1999) in favor ($1500 to $1999)
- ($1000 to $1499, $2000 or more) in favor ($2000 or more)
- ($1500 to $1999, $2000 or more) in favor ($2000 or more)
Table 4.42 (LSD) Test Depending on the Field Affective Commitment
The Field Less than $1000 $1000 to $1499 $1500 to $1999 $2000 or more
Less than $1000 -0.023* -0.021* -0.026*
$1000 to $1499 -0.011* -.023*
$1500 to $1999 -0.060*
$2000 or more
* Statistically significant at α = 0.05
//Signal Negative means an inverse relationship
It has seen from the above table that there are statistically significant differences
between the groups as follows:
- (less than $1000, $1000 to $1499) in favor ($1000 to $1499)
- (less than $1000, $1500 to $1999) in favor ($1500 to $1999)
- (less than $1000, $2000 or more) in favor ($2000 or more)
- ($1000 to $1499, $1500 to $1999) in favor ($1500 to $1999)
- ($1000 to $1499, $2000 or more) in favor ($2000 or more)
- ($1500 to $1999, $2000 or more) in favor ($2000 or more)
Table 4.43 (LSD) Test depending on the Field Continuance Commitment
The Field Less than $1000 $1000 to $1499 $1500 to $1999 $2000 or more
Less than $1000 -0.23* -0.40* -0.51*
$1000 to $1499 -.11* -0.14
$1500 to $1999 -0.42*
$2000 or more
* Statistically significant at α = 0.05
//Signal Negative means an inverse relationship

69
It has seen from the above table that there are statistically significant differences
between the groups as follows:
- (less than $1000, $1000 to $1499) in favor ($1000 to $1499)
- (less than $1000, $1500 to $1999) in favor ($1500 to $1999)
- (less than $1000, $2000 or more) in favor ($2000 or more)
- ($1000 to $1499, $1500 to $1999) in favor ($1500 to $1999)
- ($1500 to $1999, $2000 or more) in favor ($2000 or more)
Table 4.44 (LSD) Test Depending on the Field Normative Commitment
*
S
t
atistically significant at α = 0.05
//Signal Negative means an inverse relationship
It has seen from the above table that there are statistically significant differences
between the groups as follows:
- (less than $1000, $1000 to $1499) in favor ($1000 to $1499)
- (less than $1000, $1500 to $1999) in favor ($1500 to $1999)
- (less than $1000, $2000 or more) in favor ($2000 or more)
- ($1000 to $1499, $1500 to $1999) in favor ($1500 to $1999)
- ($1000 to $1499, $2000 or more) in favor ($2000 or more)
- ($1500 to $1999, $2000 or more) in favor ($2000 or more)
The Field Less than $1000 $1000 to $1499 $1500 to $1999 $2000 or more
Less than $1000 -0.023* -0.057* -0.012*
$1000 to $1499 -0.013* -0.034*
$1500 to $1999 -0.057*
$2000 or more

70
Table 4.45 (LSD) Test Depending on the Field Organizational Commitment
The Field Less than
$1000
$1000 to $1499 $1500 to $1999 $2000 or more
Less than $1000 -0.025* -0.059* -0.015*
$1000 to $1499 -0.013* -0.031*
$1500 to $1999 -0.017*
$2000 or more
* Statistically significant at α = 0.05
//Signal Negative means an inverse relationship
It has seen from the above table that there are statistically significant differences
between the groups as follows:
- (less than $1000, $1000 to $1499) in favor ($1000 to $1499)
- (less than $1000, $1500 to $1999) in favor ($1500 to $1999)
- (less than $1000, $2000 or more) in favor ($2000 or more)
- ($1000 to $1499, $1500 to $1999) in favor ($1500 to $1999)
- ($1000 to $1499, $2000 or more) in favor ($2000 or more)
- ($1500 to $1999, $2000 or more) in favor ($2000 or more)

71
CHAPTER 5
DISCUSSION AND RECOMMENDATIONS
5.1 Introduction
This chapter presents the discussions of the results and the findings based on the
analysis conducted throughout the entire study. Recommendations have also
presented in order to guide future researcher's determination the relationship
between organizational commitment and job satisfaction among employee in the
Palestine College.
5.2 Discussion
The main aim of this study is to investigate the relationship between
organizational commitments on job satisfaction. This study attempts to answer the
following objectives and questions:
5.2.1 Research Question 1: Does Job Satisfaction Exist Amongst Palestine
Technical College Academics Staff?
The mean scores (Mean) = 3.64 and standard deviations (SD) = .9 for the job
satisfaction of academics in Palestine Technical college Ramallah. With a mean
score of 3.64 academics, indicate a slightly (moderately satisfied) level of
satisfaction for their job, “satisfaction-dissatisfaction” scale with mean scores
above 3.50 being more on the “satisfied” side of the scale Pearson and Seiler
(1983). In this respect, academics can be said to be satisfied with the most of
aspect of their job, however indicating not satisfaction for "the way of my job
provides for steady employment" ,"my pay and the amount of work I do" and
"The working conditions". "Being able to keep busy all the time", "The chance to
work alone on the job", " The way company policies are put into practice ", " The
chances for advancement in this job", " The freedom to use my own judgment",
and " The praise I get for doing a good job" indicated to neutral satisfied." The
way my boss handles his/her subordinates ","The chance to do things for other

72
people", and "The way my colleagues get along with each other" indicated to
slightly satisfied. While "The chance to do different things from time to time",
"The chance to be somebody in the community", "The competence of my
supervisor in making decisions", "Being able to do things that don‘t go against my
conscience", "The chance to tell people what to do", and "The chance to do
something that makes use of my abilities". Indicated to satisfied. The overall job
satisfaction level for academics staff (Mean = 3.64) can be considered slightly
(moderately satisfied).
This agrees with Jessie L. Grant study (2006). The results showed that there are
83% of the staff members of the Union of American colleges (moderately
Satisfied with their work). In addition, agree with Harem's study (2001) aimed to
identify the job satisfaction among faculty members at colleges own community
in Jordan. The study results indicated varying levels of job satisfaction in the
different fields of work.
5.2.2 Research Question 2: Does Organizational Commitment Exist Amongst
Palestine Technical College Academics Staff.
The mean scores (Mean)=3.3 and standard deviations (SD)=.88 for the
organizational commitment of academics in Palestine Technical college Ramallah
can be seen in Table (5.1) With a mean score of (3.30) academics indicate a
Neutral satisfied level of organizational commitment for their job.
Table 5.1 Averages, SD Depending on the Organizational Commitment of
Academic Staff
No Variables Mean SD Percentage Estimate
1. Affective commitment 3.51 0.88 74.87 Slightly
2. Continuance commitment 3.30 1.01 60.1 Neutral
3. Normative commitment 3.41 0.75 71.46 Neutral
Organizational Commitment 3.30 0.88 68.81 Neutral

73
When the 18 facets of the job analyzed individually in relation to academic
organizational commitment, three of the facets are statistically significant with
academic organizational commitment at a 0.05 significance level. These are
Affective, Continuance and Normative and as the results indicates that Normative
commitment mean = 3.41, SD=.75 and affective commitment mean=3.50 and SD
=.88 and Continuance commitment mean =3.30 and SD=1.01 and the
organizational commitment mean = 3.30, SD= 0.88. We found the paragraphs "I
do not feel ‘emotionally attached’ to this organization" and "I do not feel a
‘strong’ sense of belonging to my organization," indicated to not satisfied
paragraphs. While "I do not feel like ‘part of the family’ at my organization"
indicated to neutral satisfied. "I would be very happy to spend the rest of my
career with this organization", and "I really feel as if this organization’s problems
are my own," indicated to slightly satisfied. While as "I think that I could easily
become as attached to another organization as I am to this one", and "This
organization has a great deal of personal meaning for me," indicated to satisfied.
"I enjoy discussing about my organization with people outside it," indicated to
highly satisfied. The total of all paragraphs are 3.51, indicated to slightly satisfied.
This is about affective commitment. In addition we found , "It would be very hard
for me to leave my organization right now, even if I wanted to", "Too much in my
life would be disrupted if I decided to leave my organization now", " I feel that I
have very few options to consider leaving this organization", " One of the few
serious consequences of leaving this organization would be the scarcity of
available alternatives", and " One of the major reasons I continue to work for this
organization is that leaving would require considerable personal sacrifice another
organization may not match the overall benefits I have here" indicated to not
satisfied paragraphs. While "I am not afraid of what might happen if I quit my job
without having another one lined up", and "It wouldn’t be too costly for me to
leave my organization now" indicated to neutral satisfied. In addition, "Right now,
staying with my organization is a matter of necessity as much as desire," indicated
to slightly satisfied paragraph. The total of all paragraphs are 3.20, indicated to
neutral satisfied. This is about continues commitment. As while as we found,

74
"Things were better in the days when people stayed in one organization for most
of their careers" indicated to not satisfied paragraph. While "I think that people
these days move from company to company too often", "One of the major reasons
I continue to work in this organization is that I believe loyalty is important and
therefore feel a sense of moral obligation to remain", and "I do not think that to be
a ‘company man’ or ‘company woman’ is sensible anymore". Indicated to neutral
satisfied. In addition "I do not believe that a person must always be loyal to his or
her organization", "Jumping from organization to organization does not seem at
all unethical to me", and "I was taught to believe in the value of remaining loyal to
one organization," indicated slightly satisfied. While "If I got another offer for a
better job elsewhere I would not feel it was right to leave my organization",
indicated to highly satisfied. The total of all paragraphs are 3.41, indicated to
slightly (moderately satisfied). This is about normative commitment.
This agree with Yassin's study (2003), aimed to know the degree of organizational
commitment and professional of teachers in public schools in Ramallah and Al
Bireh city. The results of the statistical analysis that the degree of organizational
commitment for teachers in the school and the profession is neutral, and found
statistically significant differences in the degree of organizational commitment
attributed to the variable year of experience. Also, show that there were no
statistically significant differences in the degree of organizational commitment of
teachers attributed to the variable sex.
5.2.3 Research Question 3: Does Job Satisfaction Exist Amongst Palestine
Technical College Administrative Support Staff?
The mean scores (Mean) = 3.53 and standard deviations (SD) = .89 for the job
satisfaction of administrative support staff in Palestine Technical college
Ramallah. With a mean score of 3.53 academics, indicate a slightly (moderately
satisfied) level of satisfaction for their job. In this respect, administrative support
staff can say to be satisfied with the most of aspect of their job. However

75
indicating not satisfaction for "The way my job provides for steady employment",
"My pay and the amount of work I do" and "The working conditions". While
"Being able to keep busy all the time", "The chance to work alone on the job",
"The way my boss handles his/her subordinates", "The way company policies are
put into practice", "The chances for advancement in this job", "The freedom to use
my own judgment"," The way my colleagues get along with each other", and "The
praise I get for doing a good job". Indicated to neutral satisfied. In addition, "The
competence of my supervisor in making decisions", "Being able to do things that
don‘t go against my conscience", "The chance to do things for other people", and
"The feeling of accomplishment I get from the job". Indicated slightly (moderately
satisfied). Moreover "The chance to do different things from time to time", "The
chance to be somebody in the community", "The chance to tell people what to
do", "The chance to do something that makes use of my abilities", and "The
chance to try my own methods of doing the job", indicated to satisfied paragraphs.
The overall job satisfaction level for administrative support staff (Mean = 3.53)
can be considered slightly (moderately satisfied).
This agrees with Jessie L. Grant study (2006). The results showed that there are
83% of the staff members of the Union of American colleges (Satisfied with their
work). In addition, agree with Harem's study (2001) aimed to identify the job
satisfaction among faculty members at colleges own community in Jordan. The
study results indicated varying levels of job satisfaction in the different fields of
work.
This agree with Yassin's study (2003), aimed to know the degree of organizational
commitment and professional of teachers in public schools in Ramallah and Al
Bireh city. The results of the statistical analysis that the degree of organizational
commitment for teachers in the school and the profession is neutral, and found
statistically significant differences in the degree of organizational commitment
attributed to the variable year of experience. Also, show that there were no
statistically significant differences in the degree of organizational commitment of
teachers attributed to the variable sex.

76
5.2.4 Research Question 3: Does Organizational Commitment Exist Amongst
Palestine Technical College Administrative Support Staff.
The mean scores (Mean) =3.20 and standard deviations (SD) =.88 for the
organizational commitment of academics in Palestine Technical college Ramallah
can be seen in Table(5.2) With a mean score of (3.20) administrative indicate a
neutral level of organizational commitment for their job.
Table 5.2 Averages, SD Depending on the Organizational Commitment of
Administrative Support Staff
No Paragraph Mean SD Estimate1. Affective commitment 3.20 0.91 Neutral2. Continuance commitment 2.92 0.96 Not satisfied3. Normative commitment 3.50 0.77 Slightly (moderately satisfied)
Organizational commitment 3.20 0.88 Neutral
When the 18 facets of the job analyzed individually in relation to administrative
support staff organizational commitment, three of the facets are statistically
significant with administrative support staff organizational commitment at a 0.05
significance level. These are Affective, Continuance and Normative and as the
results indicates that Normative commitment mean= 3.50, SD = .77 and affective
commitment mean = 3.20, SD = .91 have high level but Continuance commitment
mean = 2.92, SD = .96 have Moderate level. When we analyze Affective
commitment variable, we found that the "I do not feel like ‘part of the family’ at
my organization", "I do not feel ‘emotionally attached’ to this organization", "This
organization has a great deal of personal meaning for me" and "I do not feel a
‘strong’ sense of belonging to my organization", indicated to not satisfied
paragraphs. While "I would be very happy to spend the rest of my career with this
organization" and "I really feel as if this organization’s problems are my own,"
indicated to neutral satisfied. In addition, "I enjoy discussing about my

77
organization with people outside it" indicated slightly (moderated satisfied). "I do
not feel like ‘part of the family’ at my organization," indicated satisfied. The total
of all paragraphs are 3.2, indicated to neutral satisfied. This is about affective
commitment. About continues commitment we found "It would be very hard for
me to leave my organization right now, even if I wanted to"," Too much in my life
would be disrupted if I decided to leave my organization now", "I feel that I have
very few options to consider leaving this organization", "One of the few serious
consequences of leaving this organization would be the scarcity of available
alternatives", and " One of the major reasons I continue to work for this
organization is that leaving would require" indicated to not satisfied. While as "I
am not afraid of what might happen if I quit my job without having another one
lined up" and " It wouldn’t be too costly for me to leave my organization now"
indicated slightly. The total of all paragraphs are 2.29 indicated not satisfied. In
addition, about continuance commitment we found "Things were better in the
days when people stayed in one organization for most of their careers" indicated
not satisfied. "I do not believe that a person must always be loyal to his or her
organization", "One of the major reasons I continue to work in this organization is
that I believe loyalty is important therefore feel a sense of moral obligation to
remain", and "I was taught to believe in the value of remaining loyal to one
organization" indicated neutral satisfied. While "I think that people these days
move from company to company too often", "Jumping from organization to
organization does not seem at all unethical to me", and "I do not think that to be a
‘company man’ or ‘company woman’ is sensible anymore," indicated slightly
satisfied. "If I got another offer for a better job elsewhere I would not feel it was
right to leave my organization," indicated satisfied. The total of all paragraphs 3.5
indicated slightly satisfied.

78
5.2.5 Research Question 5: Is There any Difference between Job Satisfaction
and Organizational Commitment Exist Amongst Administrative Support
Staff and Academic Staff at Palestine Technical College?
To answer this question we use Pearson’s Correlation Coefficients, The
relationship between affective organizational commitment, continuance
commitment, and normative organizational commitment were investigating
against job satisfaction. Table (5.3) shows the summary of the results. The result
indicates that there are positive significant relationship between affective
commitment, continuance commitment and normative commitment on job
satisfaction that the greater the job satisfaction increased organizational
commitment.
(r = .389, n =164, p <.001; r =.318, n =164, p<.001, r = .332, n = 164, p <.001).
Table 5.3 Pearson’s Correlation Coefficients of the Study Variables (N=164)
The Field Person's Correlation Significant
Affective commitment 0.389** .001
Continuance commitment 0.318** .001
Normative commitment 0.332** .001
Job satisfaction 0.390** .001
Organizational Commitment 0.357** 0.01
** Correlation is significant at the 0.01 level
It was clear from the statistical findings that there is a direct positive correlation
function statistical between job satisfaction and career commitment of the
academics and administrative support staff in the Palestinian Technical College
Ramallah. The findings of this study are the same to the study by Lok and
Crawford (2001), who found that the variable closely to the commitment is job
satisfaction.
This agree with Ahmadi's study (2006) the results showed a positive relationship
between job satisfaction and Organizational Commitment.

79
This disagrees with NORIZAN ISMAIL's study (2014) the results indicated that
there is no relationship between organizational commitment and job satisfaction
among academic staff in higher education institutions.
5.2.6 Research Question 6: Does any Significant Differences Exist in the Level
of Job Satisfaction and Organizational Commitment with Regard to
Demographic Characteristics?
- Gender
Very little statistically significant differences (α = 5%) between organizational
commitment and job satisfaction among Academics staff and administrative
support staff at the Palestine Technical College for Girls Ramallah due to the
variable Gender. To find the results have been used Independent Test (T- test) and
the value of total job satisfaction was 56% while the total value of organizational
commitment was 45%. Hence it is clear that the Gender variable does not affect
the job satisfaction and organizational commitment to the
The researcher believes that the reason is due to the unification of the regulations
and laws in the Palestinian universities, as well as the burden of academic, unified
system of lectures, exams unified and promotions, and the conditions of the
Palestinian community to make the commitment and satisfaction equal to some
extent.
This is inconsistent with Muranekh (2004); which proved that there is a
correlation between the following variables (qualification, sex, internal work
environment, scope of work, some moral incentives, some laws of the Palestine
labor, some external work environment) and the level of satisfaction. In addition,
it is inconsistent with Hannouna (2006). Showed that there are statistically
significant differences about the desire to continue working at the university due
to the variable gender, where the differences were in favor of females, and this
may be due to the desire that the females workers in the Palestinian universities.

80
This desire may be attributing to the nature of work at the university, which
provides high stability and high position in social terms, in addition to the dearth
of career opportunities in other business sector.
-Age
About Age variable the researcher found that the p-value smaller than the level of
significance α = 0.05, then there is significant difference among the respondents
toward each field due to age. This means that the personal characteristics’ age has
an effect on each field. For each field, the mean for the category "50 years or
more" respondents have the highest among the other age, then it means that the
category "50 years or more" respondents is agreed much more than the other age
category. This is because employees with more than 50 years tend to stay at a
secure job away from changing that young people prefer, also perhaps that those
in the high ages achieved high social status at their jobs and they got high
positions which granted them higher salaries with less risks and dangers. While
employees less than 40 years still have the ambition to change their jobs
especially after the experience they got which will qualify them to get better jobs
elsewhere. This agrees with the study of Ghali (2015) which approved that there
were statistically significant differences between organizational commitment level
due to the variable age, where the employees with more than 55 years are most
likely have the highest intention to stay at their work, and they are the most
committed than others. In addition, it agrees with Kumar & Giri (2009) entitled
"The effect of age and experience on job satisfaction and organizational
commitment", which found that job satisfaction and organizational commitment
among older workers are larger than the younger.
Qualification
About Qualification variable that P <= 0.05 is smaller than the level of
significance α = 0.05 for each field, then there is significant difference among the
respondents toward each field due to educational qualifications. This means that

81
the personal characteristics’ educational qualifications have an effect on each
field. For each field, The mean for the category "PHD" respondents have the
highest among the other educational qualifications, then it means that the category
"PHD" respondents is agreed much more than the other educational qualifications
category. This is because of the social status, job level and the rate of the high
salaries offered by the Palestinian universities lead to higher desire of intention to
stay at the university, so that the employees with bachelor degree feel more
responsible toward their job due to the opportunity of success that these
institutions can offer. In addition to the ongoing competition between colleagues
to get higher positions, also because, the university always encourages and
supports them to complete their higher education. This agrees with Hannouna
(2006) study and Abu-Nada (2007) study, which showed that the personal
characteristics’ educational qualification has an effect on field of study.
- Position
About the position variable, that P > 0.05 is greater than the level of significance α
= 0.05 for the fields "Affective commitment and Continuance commitment", then
there is insignificant difference among the respondents toward these fields due to
job category. This means that the personal characteristics’ job category has no
effect on these fields. For the other fields, P<=0.05 is smaller than the level of
significance α = 0.05, then there is significant difference among the respondents
toward these fields due to job category. This means that the personal
characteristics’ job category has an effect on the other fields. This may be
attributing to the heavy tasks assigned to the academic administrative employees,
where they have to work under pressure to achieve the goals; they give lectures,
attend meetings, help students, and participate in administrative work at office.
This all can push this category to feel more responsible and more commitment to
stay at the university, where they feel more important, attain high social status,
and get high experience and salaries. This study is inconsistent with Hannouna
(2006) study, which approved that there are no statistically significant differences
between employees' category in the Palestinian universities sector regarding the

82
field of the desire to continue working at the university. The researcher attributed
this to that Palestinian universities have the most stable salary and social status in
Palestinian society when compared to the jobs available in the local markets, as
well as the university has a special status in the minds of the Palestinians, which
gives a high degree of confidence of the university staff member, whether
academic or administrative.
-years of experience in the current job
About the years of experience in the current job that P<=0.05 is less than the level
of significance α = 0.05 for each of the fields, then there is significant difference
among the respondents toward each of fields due to years of service. The
researcher concluded that the personal characteristics' years of service in the
current for the each fields, P> 0.05 is greater than the level of significance α =
0.05, then there is significant difference among the respondents toward these
fields due to years of service in the current job. This means that the personal
characteristics’ years of service in the current job has an effect on the other fields.
The mean for the category "20 years or more" respondents have the highest
among the other years of service, then it means that the category "20 years or
more" respondents is agreed much more than the other years of service category.
This is because employees with more than 20 years of service are most likely to
achieve the highest progress in their administrative functions, which will be
reflected on their intention to stay at the same job and achieve higher and higher
positions or to leave for a new job to start over, in addition they have the highest
salaries due to their long experience at the university that leads them to adapt to
the working conditions. This agrees with Ghali (2015) study which showed that
there were statistically significant differences between organizational commitment
level due to the variable years of service, where the employees who served more
than 20 years at the university are most likely have the highest intention to stay at
their work, and they are the most committed than others. However, it is
inconsistent with Hannouna (2006) study, which indicated that employees who are
serving less than 5 years have the highest intention to continue working at their

83
jobs, the researcher attributed this to the high ambition that the young people have
when starting in a good job, especially when looking at the other jobs available at
the local market. Where working at university achieve high social status for
employees. Contrary the desire to continue working at university is less for those
who served more than 15 years due to the routine of work.
- Years of experience in the sector
There are significant differences (P-value > 0.05), between the means of job
satisfaction degrees and organizational commitment (affective commitment,
continuance commitment, normative commitment), for academics staff and
administrative support staff in Palestine technical college toward the no. of
service years (1 years and less, from 1 to 4 years, from 5 to 9, from 10 to 14, from
15 to 19, 20 or more). which means that all years of experiences in the sector
have not the same levels of job satisfaction and organizational commitment.
There are statistical significant differences between the degrees of job satisfaction
and organizational commitment among experiences in the sector, the test of LSD
(Least Square Differences) was using to figure out the differences between the
categories of number of experiences years in the sector. The test showed that
service provider who have serviced 1 years and less have job satisfaction and
organizational commitment less than the service provider who have serviced from
all categories of number of experiences in the sector and these difference were
significant differences, and the result showed that there statistical significant
differences between other group.
-Monthly Salary
About the years of monthly Salary that the P-value <=0.05 is less than the level of
significance α = 0.05 for each of the fields, then there is significant difference
among the respondents toward each of fields due to monthly income. The
researcher concluded that the personal characteristics' monthly salary for the each
fields, the P-value> 0.05 is greater than the level of significance α = 0.05, then

84
there is significant difference among the respondents toward these fields due to
monthly salary. This means that the personal characteristics’ monthly salary has
an effect on the other fields. The mean for the category "2000$ or more"
respondents have the highest among the other monthly income, then it means that
the category "2000$ or more" respondents is agreed much more than the other
monthly salary category. This is because employees with more than 2000$ are
most likely to achieve the highest progress in their administrative function. Which
will be reflecting on their intention to stay at the same job and achieve higher and
higher positions or to leave for a new job to start over, in addition they have the
highest salaries due to their long experience at the university that leads them to
adapt to the working conditions.
-Marital status
The marital status variable that there were no significant differences (P-
value>0.05) between the means of job satisfaction degrees and organizational
commitment for academics staff and administrative support staff in Palestine
technical college toward marital status (married, not married), which means that
all marital status have the same levels of job satisfaction and organizational
commitment.
The researcher can be explaining the result that all employees have the same
rights even was married or any other marital status, all employees work the same
hours and have the same rights from ministry of health. Also there is respecting
between employees about this point, our religion determine that there is no
difference between any person except in his initiatively to do good work and fear
from Allah. In addition, because our society is Muslim, they work and believe in
our religion instructions.

85
5.3 Recommendations
The light of the results, which the researchers found, she recommends the
following:
- the necessity that ministry of education adoption a plan for administrative
planning , including the Palestinian college to ensure the satisfaction of urgent
needs of the employees, which guarantees providing of stability job, security,
justice and objectivity.
- Development of systems and motives promotion so as to satisfy the needs and
ambitions of employees fairly to spread assurance, psychological rest of the
employees, and also setting up of a system for promotions and motives of the
teaching staff who obtain high academic qualifications and training courses.
-Support scientific research allocations, because that encourages academic staff to
do local research useful to the community
-Work to increase the means of communication between the President and
subordinates, and hold regular meetings to discuss development plans and taking
the opinion of workers on programs and plans before they are issue in order to
broaden the base of decision-making, programs and development plans.
- Increase and activate services provided to academic staff and administrative
support staff in universities of amenities such as adjustment and heating,
computers and others.
- Modifying the salaries system so that commensurate with the cost of living

86
5.3.1 Recommendation for Future Researchers
- Do some studies concerned with the status of academic and administrative
support staff in the Palestinian college, especially those studies that focus on the
attention of the university management to increase interest in academic staff.
- A comparative study between the Arab universities and local universities in the
organizational commitment and job satisfaction, and its relationship promotions
systems
- Finally, we hope to increase that useful studies would be beneficial to the Higher
Learning Education Institutions, academic research, as well as students
87
CHAPTER 6
CONCLUSION
6.1 Conclusion
The purpose of the research was to analyze the relationship between
organizational commitment and job satisfaction among academic staff and
administrative support staff in Palestine College. A questionnaire was prepared to
gather the information was releasing to employees in workplaces in Palestine
College.
The key findings of the research were inconclusive. Findings indicated there are a
relationship between organization commitment and job satisfaction and a neutrals'
estimate level of organizational commitment and a slightly estimate of job
satisfaction among Palestine technical college staff. There is a significant
difference on commitment level among Palestine College staff related to
following demographical variables: (Age, Qualification, years of experience in the
current job, and years of experience in the sector, Position, Monthly salary of
these staff). In addition, there is no and very little significant differences on
commitment level and satisfaction of these staff related to (Gender, Marital
Status).
However, the job satisfaction and organizational commitment are not static,
indicating that the employees’ opinions change over time. There will always be a
dilemma of satisfying all the employees, and it is therefore important that the
management properly integrate all their employees into the company, for example
through courses and other tools. In the end, it is all about accomplishing the best
possible employee job satisfaction and organizational commitment, with the
purpose to avoid inefficiency, turnover and absenteeism that can reduce the
company’s bottom line.