the relationship between facebookâ„¢ activity and academic
TRANSCRIPT

1
THE RELATIONSHIP BETWEEN FACEBOOK™ ACTIVITY
AND ACADEMIC PERFORMANCE AMONG
AFRICAN AMERICAN STUDENTS
by
Eric V. Brubaker
Liberty University
A Dissertation Presented in Partial Fulfillment
Of the Requirements for the Degree
Doctor of Education
Liberty University
April, 2013

2
The Relationship Between Facebook™ Activity
and Academic Performance Among
African American Students
by
Eric V. Brubaker
A Dissertation Presented in Partial Fulfillment
Of the Requirements for the Degree
Doctor of Education
Liberty University, Lynchburg, VA
April, 2013
APPROVED BY:
Amanda Rockinson-Szapkiw, Ed.D., Committee Chair
Jennifer Courduff, Ph.D., Committee Member
Judy Sandlin, Ph.D., Committee Member
Scott Watson, Ph.D., Associate Dean, Advanced Programs

3
ABSTRACT
This non-experimental, regression study examined the relationship between Facebook™
activity and academic performance for an African American sample population. The
study was conducted at a large, four-year, private university in the Mid-Atlantic. All
undergraduate, African American students enrolled in the College of General Studies,
School of Health Sciences, and School of Education comprised the sample population.
Volunteer participants completed a Facebook™ Activity Survey, which is an instrument
used to collect semester grade point averages (GPAs), time-use of Facebook™,
multitasking information, type of Facebook™ activities, and demographic information.
The results of the survey were analyzed using hierarchical multiple regression statistics.
The analysis showed the strength of the relationship between the predictor variables
(average daily minutes of using Facebook™, demographic data, academic data, daily
minutes of multitasking, and types of Facebook™ activities used while multitasking) and
the criterion variable (semester GPA). The results of the study suggested that Facebook™
activities did not have a statistically significant contribution on the participants’ semester
GPAs.
Keywords: social media, GPA, multitasking, cognitive load theory, Facebook™

4
Acknowledgments
First I would first like to thank the Lord Jesus Christ for guiding me to Liberty
University 15 years ago as an undergraduate student and showing me that through Him
all things are possible. Through His love, grace, and mercy I was able to have the
motivation, courage, and ability to complete this doctoral degree. I would also like to
thank my wife, Melinda, for her patience, love, and encouragement over the last three
years as I worked through this program. Thank you for allowing me to have time at
nights, weekends, and even vacations to work on my dissertation as you managed the
kids. To Blake and Brody, thank you for always being able to put a smile on my face
even when I felt overwhelmed. Thank you to my parents for always giving me the love
and encouragement to shoot for the stars in whatever I do in life. The motivation and
inspiration that you provided me throughout my life is what has gotten me to where I am
today.
I would also like to thank my dissertation chair, Dr. Amanda Rockinson-Szapkiw,
for your hard work and encouragement throughout this entire process. I truly appreciate
how hard you worked on providing quick responses on all of my emails, questions, and
revisions. To my committee members, Drs. Jennifer Courduff and Judy Sandlin, I would
like to thank you for all of your insightful and helpful revisions and encouragement. I
believe that I was blessed with a “Dream Team” committee, which allowed me to excel
through the motivation and encouragement that was provided. Finally, I would like to
thank the Center for Multicultural Enrichment at Liberty University, who supported my
research through the donation of prizes and recruitment of participants.

5
Table of Contents
Abstract………………………………………………………...……………………........3
Acknowledgments……………………...……………………………………………........4
List of Tables…………………………...……………………………………………........8
List of Abbreviations…………………...……………………………………………........9
CHAPTER ONE: INTRODUCTION……………………………………………….....10
Introduction…..………………………………………………………………...…….10
Cognitive Load Theory……………………………………………………………….13
Academic Impact of Technology on the Current Generation…………………….......14
Facebook™ Activities and Academics Variables………………………………..16
Lack of Diversity……………………………………………………………........18
Problem Statement……………………………………………………………….........20
Purpose Statement…………………………………………………………….….........21
Significance of the Study……………………………………………………….……..22
Research Questions..…………………………………………………………...…...... 23
Hypotheses…………………………………………………………………..……...... 24
Identification of Variables…………………………………………………..…....….. 26
Definitions…………………………………………………………………..…....…... 28
CHAPTER TWO: REVIEW OF THE LITERATURE…………………..……............ 30
Social Media and the Current Generation……………………………….……............30
Social Media Definition and Usage…..…………………………..……………...30
Motivation for Heavy Social Media Use………………………………………....…...32
Social and Racial Identity…………………………………………...……....…...32
Social Capital………………………………………………………...…....……..35
The Influence of Social Media on Academics…………………………….…....……..35
Positive Influences……………………………………………………..………...35
Negative Influences……………………………………………………..……….36
Gender Differences in Social Media Use..…………………………………...…….….37
Racial Differences in Social Media Use...…………………………………….....……39
Cognitive Load Theory ………………………………. ………………..…………......43
Cognitive Load Theory and Social Media Multitasking…………………….….. 44

6
Multitasking Trends of College Students…………………………………….… 45
The Relationship Between Multitasking and Academics..……………….…….. 47
Impact of Multitasking on GPAs………………………………………….…….48
Challenges of Social Media Use on Academics………………………………….…...49
Student GPAs……………………………………………………………….…...50
Student Engagement………………………………………………………….….51
Benefits of Social Media Use in Academics……………………………………….…52
Student Engagement……………………………………………………………..53
Positive Academic Results……………………………………………………....54
Psychological Benefits…………………………………………………………..56
Summary……………………………………………………………………………....57
CHAPTER THREE: METHODOLOGY…………………...…………………………..60
Introduction…………………………………………………………………………...60
Design………………………………………………………………………………....60
Questions and Hypotheses………………………………………………………….....61
Participants…………………………………………………………………………….64
Setting…………………………………………………………………………….…...65
Instrumentation…………………………………………………………………….….66
Criterion Variable………………………………………………………...............66
Predictor Variable………………………………………………………………..67
Frequency of Multitasking……………………………………………………….68
Types of Facebook™ Activities Used while Multitasking….……………………69
Facebook™ Time………………………………………………………………....69
Academic and Demographic Variables………………………………………….70
Procedures……………………………………………………………………….75
Data Analysis………………………………………………………………………….76
Summary..……………………………………………………………………………..81
CHAPTER FOUR: FINDINGS…………………………………………………...…...83
Introduction…………………………………………………………………………...83
Descriptive Data………………………………………………………………………84
Correlation of Predictor Variables and Semester GPA……………………………….87

7
Assumption Testing…………………………………………………………………...90
Results of Hierarchical Regression Model……………………………………………90
Additional Analyses……………………………………………………………..91
CHAPTER FIVE: DISCUSSION…………………………….....…………….…...…...95
Introduction………………………………………………………………….…...…..95
Results of the Hypotheses……………………………………………….………...….96
Relationships of the Results to Research and Theory……………………………….. 97
Implications of this Study…………………………………………………….….......99
Limitations and Implications for Future Research…………………………….…....101
Summary……………………………………………………………………….……102
REFERENCES……………………………………………………………….…….…..104
APPENDIX ………………….……………………………………………………..…..112
Appendix A: Facebook™ Activity Survey……………………………………..……112
Appendix B: Sample Facebook™ Data Report…….…………….….……………....115
Appendix C: Consent Form………………………….……………………………....116
Appendix D: Instrument Feedback Sheet…………………………………….……..119
Appendix E: Facebook™ Application Example…………………………….…….....120
Appendix F: Initial Recruitment Email to Participants……………………………..121
Appendix G: Follow Up Recruitment Email to Participants………………………..122
Appendix H: IRB Approval Letter………………………………………………….123
8
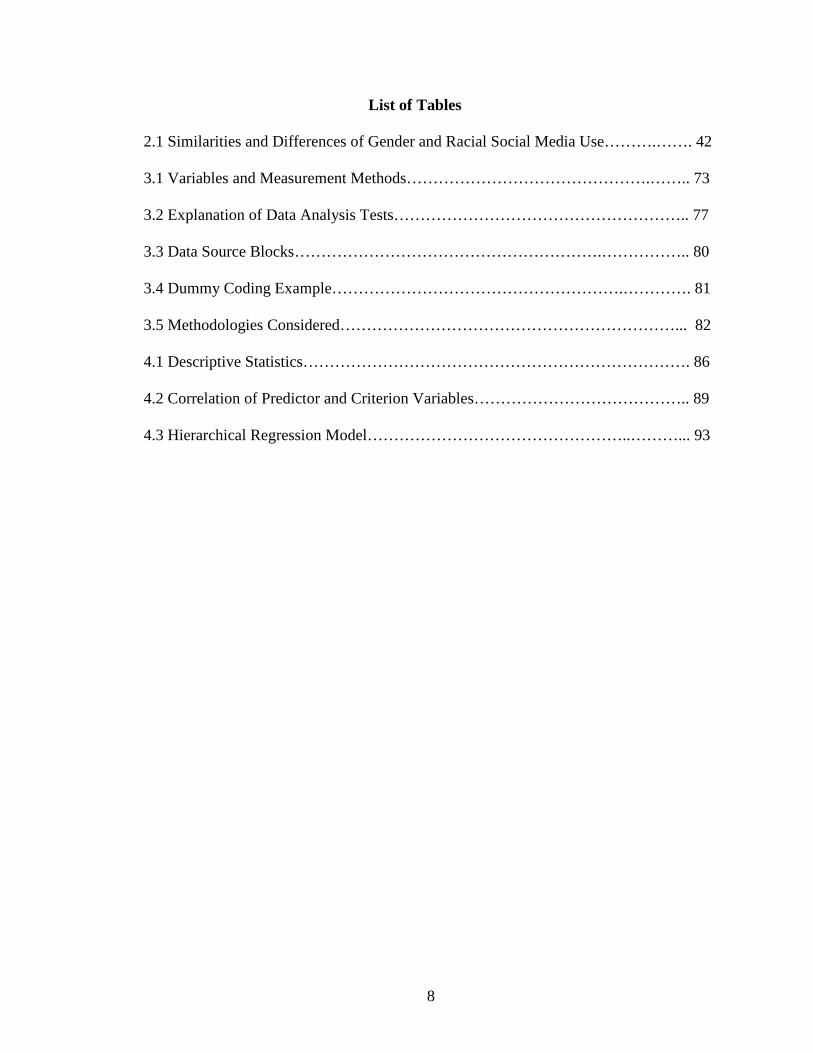
List of Tables
2.1 Similarities and Differences of Gender and Racial Social Media Use……….……. 42
3.1 Variables and Measurement Methods……………………………………….…….. 73
3.2 Explanation of Data Analysis Tests……………………………………………….. 77
3.3 Data Source Blocks………………………………………………….…………….. 80
3.4 Dummy Coding Example……………………………………………….…………. 81
3.5 Methodologies Considered………………………………………………………... 82
4.1 Descriptive Statistics………………………………………………………………. 86
4.2 Correlation of Predictor and Criterion Variables………………………………….. 89
4.3 Hierarchical Regression Model…………………………………………..………... 93

9
List of Abbreviations
Cognitive Load Theory (CLT)
Grade Point Average (GPA)
High School Grape Point Average (HSGPA)
Instant Messaging (IM)
Social Economic Status (SES)

10
CHAPTER ONE: INTRODUCTION
Introduction
In this current technology savvy generation of college students, the use of
Facebook™ has become commonplace (Hanson, Drumheller, Mallard, McKee, &
Schlegel, 2011). Connecting to Facebook™ has become easier and more convenient with
the increased popularity of wireless technology. This has contributed to an increase of
more than one billion people logging on to Facebook™ daily. Young adults, 18-29 years
old, are the most active user of wireless technology; 81% are active users (Lenhart,
Purcell, Smith, & Zickuhr, 2010). The demand for social networking among college
students is significant; 92% of all undergraduate students are members of Facebook™
(Junco & Cotten, 2012). As college students are increasingly adopting social media, it is
important for faculty and administrators in higher education institutions to understand
how this is influencing students’ academic performance.
Research on Facebook™ has been limited. Studies that have been conducted
primarily focused on factors such as engagement, faculty perceptions, and multitasking
(Junco, 2012a; Junco & Cotten, 2012; Roblyer, McDaniel, Webb, Herman, & Witty,
2010). Facebook™ usage has been shown to increase students overall wellbeing and
social connectedness (Junco & Cotten, 2012; Heiberger & Harper, 2008). Few have
examined the influence of Facebook™ on academic achievement, and research with this
focus has been mixed (Junco, 2012a; Roblyer et al., 2010). Some research has suggested
that Facebook™ use has been proven to have some positive influences on college
students’ academics (Hanson, et al., 2011; Kirschner & Karpinski, 2010). While other
studies demonstrate that high use of these technologies by students can result in negative

11
academic effects (Junco & Cotten, 2011). Junco and Cotton (2012) conducted a study
that examined how high school grade point average (HSGPA), self-reported social media
multitasking, and demographics impacted college students grade point averages (GPAs).
The results of a hierarchical regression model were significant suggesting that high levels
of social media multitasking negatively correlated with academic influence while
controlling for HSGPA and Facebook™ (Junco & Cotten, 2012). A second study
conducted by Jacobsen and Forste (2011), used time diaries written by first-year college
students to determine the influence technology has on college students. The researchers
examined semester GPAs, electronic media, demographics, education, and employment.
Results suggested that the use of social networking sites caused a negative impact on
college student GPAs (Jacobsen & Forste, 2011). Studies have also found that race and
gender influence Facebook™ use and its influence on academics (Hargittai, 2008; Junco,
Merson, & Salter, 2010). Junco and Cotten (2012) found that African American college
students’ GPA can be negatively influenced by the use of Facebook™ during study time;
that is, more negatively affected than their Caucasian counterparts (Junco & Cotten,
2012). Multitasking Facebook™ and study time split the students’ attention, which
caused the decrease in knowledge retention (Junco & Cotten, 2012). Junco and Cotton
(2012) suggested that future research be done to verify the results with other populations,
especially diverse populations, since their sample population only consisted of 5%
African Americans.
The negative consequences of multitasking Facebook™ and academics is a result
of cognitive capacities being limited (Lee, Lin, & Robertson, 2011). Cognitive Load
Theory (CLT) suggests the brain has a limited memory capacity that can become

12
overloaded (Sweller, 1994). When an individual performs several tasks at the same time
the chance of putting excess amounts of load on the brain increases. This can lead to
decreasing the brain’s ability to process and retain knowledge effectively (Sweller, 1994).
As students multitask Facebook™ and academics, the Cognitive Load Theory
(CLT) suggests their cognitive capabilities are reduced due to excess load being placed
on the brain (Sweller, 1994). Although some research has suggested and theory supports
that multitasking with Facebook™ can negatively influence academic performance,
college students perceive Facebook™ to be a positive resource (Kirschner & Karpinski,
2010). Research has also suggested that Facebook™ may positively influence students’
learning. The types of Facebook™ activities and the manner in which use has been
measured may be an underlying reason why some studies find that Facebook™
multitasking positively influences achievement, while others find that it results in
negative consequences (Junco, 2012b). Some research has suggested that faculty/student
connectedness through Facebook™ has led to an increase in communication and overall
academic experience (Junco, 2012a; Kirschner & Karpinski, 2010). Other research has
suggested that multitasking Facebook™ and academics can lead to lower GPA and a
reduction in knowledge retention (Bowman, Levine, Waite, & Gendron, 2010; Burak,
2012). Types of Facebook™ activities where students collect and share information have
been shown to lead to positive academics results; however, activities that are used for
socializing have led to academic decreases (Junco & Cotten, 2012). Current research on
Facebook™ use and academics have achieved both positive and negative results due to
the data collection methods used. Studies to date have used students’ self-report surveys
and activity time logs; thus, dishonesty or underestimation may have influenced the

13
results. Therefore, more studies that utilize accurate data collection methods are needed,
so the relationship of Facebook™ use and academics can be better understood.
After controlling for demographic variables that have been shown to influence
academic achievement and social networking use and previous and current academic
variables (HSGPA, GPA, student classification, major), this study examined the
relationship between semester GPA and average daily time spent on Facebook™, type
and frequency of Facebook™ activities, and time spent multitasking of an African
American sample population. Chapter one includes the background, the problem
statement, the purpose statement, and significance for this study. In addition, the research
questions and variables are stated. The chapter concluded with a definition of terms, an
assumptions, and limitations section.
Cognitive Load Theory
This study examined the relationship that high use and multitasking of
Facebook™ has with college students’ GPAs. According to Sweller’s (1994) Cognitive
Load Theory, multitasking several tasks at one time can influence how effective the brain
is at successfully accomplishing every task. Thus, this theory was the theoretical
framework that guided this study. CLT suggests that an individual only has a limited
amount of working memory that is used in knowledge acquisition (Sweller, 1994). When
working memory is overloaded, the brain is unable to effectively understand the
information being learned (Sweller, 1994). The theory relates intrinsic loads to the
educational knowledge being gained and extraneous loads as distractions that may occur,
which take away from the learning process. When a college student participates in high
use or multitasks social media with academics, high levels of intrinsic and extraneous

14
loads diminish the brains working memory (Sweller, 1994). The reduction in working
memory results in a diminished capacity by the student to grasp the knowledge being
studied (Sweller, 1994). The ability to store information for future use while multitasking
is dependent on an individual’s cognitive load capabilities (Lee, et al., 2011). Research
has suggested that the human brains’ working memory is only capable of processing a
limited amount of information before it becomes overloaded and knowledge retention is
affected (Mayer & Moreno, 2003).
As college students continue the trend of using Facebook™ for social purposes,
the amount of time they use this technology and the decision to multitask during
academic time increase (Moreno, et al., 2012). CLT suggests overloading the brain’s
cognitive processes with high use and multitasking of technology can influence its overall
academic effectiveness (Sweller, 1994); that is, a decrease in cognitive capabilities and
GPAs (Jacobsen & Forste, 2011; Wood, et al., 2012). Sweller’s (1994) Theory is
affirmed through a few studies that examined the impact of social media use on student
GPAs (Kirschner & Karpinski, 2010; Lee, et.al., 2011; Wood, et al., 2012). The literature
review, variables, and discussion of results for this study are based within the framework
of the CLT.
Academic Impact of Technology on the Current Generation
Over the last decade, the use of social media has grown significantly (Moreno, et
al., 2012). Social media includes, “social networking websites, such as Facebook™ and
Twitter, have become an integral part of U.S. college students’ lives” (Junco, Loken, &
Heiberger, 2011, p. 120). Multitasking with social media is also increasing, as one study
revealed, one-fourth of its population frequently used Facebook™ while in a classroom

15
setting (Burak, 2012). Multitasking can be defined as, engaging in multiple tasks through
the process of switching back and forth between each task, and the current generation of
college students believes they can gain new knowledge while multitasking with
technology (Hanson et al., 2011).
Unfortunately, research demonstrates that multitasking can have negative
influences on cognitive processing and academic success (Bowman, et al., 2010; Junco &
Cotten, 2012). As students multitask, their brain is cognitively overloaded, which can
lead to possible decreases in academic tasks (Ellis, Daniels, & Jauregui, 2011). As the
brain becomes overloaded the cognitive processes become less effective causing students
to become more easily distracted (Burak, 2012). As a result, self-reported multitasking of
social media and academic tasks cause negative effects on student GPAs (Junco &
Cotten, 2012). These positive improvements in performance capabilities can contribute to
a student increasing their overall academic abilities. Both positive and negative results
are based on the manner students use social media and the amount of use. Further
research on this topic is important due to the mixed results and limited diversity that
current research has suggested. Similar studies found a negative GPA impact from
Facebook™ use, but used a predominantly Caucasian population, self-reported GPA data,
and self-reported Facebook™ data (Junco, 2012b; Junco & Cotton, 2012; Kirschner &
Karpinski, 2010). By using archived data from a predominantly African American
population for this study, the results were more accurate, dependable and diverse. The
archived GPA and Facebook™ account activity log enabled the results to be
strengthened and provided a better understanding of this topic.

16
Facebook™ Activities and Academics Variables
As previous academic achievement and study time influences current
achievement, studies examining the relationship between Facebook™ use and activity
and achievement needs to control for these and other academic variables (Junco, 2012b;
Kirschner & Karpinski, 2010; Pempek, Yermolayeva, & Calvert, 2009). For this study,
academics, is measured by high school GPA (HSGPA), hours per week studying, student
classification, and major. Each of the predictor variables that make up academics served
as a measurement of the relationship between Facebook™ use and academics. Research
has suggested that HSGPA is one of the most accurate measurements of predicting
college GPAs (Junco & Cotten, 2012). In addition to HSGPA, hours per week spent
studying has been shown to influence student academic performance. Kirschner and
Karpinski (2010), suggest that Facebook™ users spend fewer hours studying, when
compared to non-users. Astin’s (1984) and Chickering and Gamson’s (1987) theories
suggest that the amount of time engaged in academic work is predictive of academic
success.
Measuring Facebook™ activity and use has been done in a variety of ways
(Junco, 2012b; Pempek, et.al., 2009; Wood, et al., 2012). The frequency of multitasking,
the type of activities, and the time spent using Facebook™ was measured in this study.
The amount of time spent using Facebook™ was measured in daily minutes for this
study. When students use Facebook™ for significant amounts of time daily the ability to
spend adequate amounts of time studying is limited (Junco, 2012b). Current research
studies have measured this variable through self-reporting and diaries (Junco, 2012a;
Pempek, Yermolayeva, & Calvert, 2009). Diaries and self-reporting methods provide

17
results that are based on the participants responses and can often be inaccurate and
unreliable. This studies used an archived activity log to measure the amount of time using
Facebook™. The activity time log provided accurate and reliable data for this variable.
Multitasking is a second variable that can influence a college students academic
capabilities. Multitasking was measured in this study by the amount of daily minutes a
student engages in multitasking studying and Facebook™ use. Engaging in two tasks at
one time, such as studying and Facebook™ use, has been shown to reduce a student’s
cognitive and knowledge retaining capabilities (Wood, et al., 2012). Previous research
studies have used self-reporting to measure the amount of time participants multitask
Facebook™ and academics (Junco & Cotten, 2012; Moreno, et al., 2012). This research
study also utilized self-reporting of this variable within the survey questions. Few studies
have focused on the impact that multitasking has on academic outcomes, so providing
further research within this area was necessary (Junco & Cotten, 2012).
The third predictor variable, types of Facebook™ activities students use, included
posting status updates, sending private messages, commenting on statuses, chatting,
posting, tagging, or viewing photos and videos. Studies have shown that in addition to
frequency of Facebook™ use, the types of activities can impact a students ability to
achieve success (Junco, 2012a). This research study used self-reporting methods within
the survey to identify specific activities students engaged in while using Facebook™.
This approach is similar to current research studies that have used this variable. Each of
the predictor variables discussed are important in enabling this study to produce results
that identified specific demographics of students whose academic outcomes were most
impacted.

18
Lack of Diversity
Demographics such as gender, race, and SES, have been measured in past studies
that have examined the relationship between Facebook™ use and academic performance
(Jones, Johnson-Yale, & Millermaier, 2009; Junco, 2012b; Junco & Cotten, , 2012).
Demographics have been shown to influence the relationship between Facebook™
multitasking and academic performance. Research studies have neglected to provide
diversity and have primarily examined Caucasian student populations (Hanson, et.al.,
2011; Jacobsen & Forste, 2011; Kirschner & Karpinski, 2010). A lack of racial
representation within research sample populations has created a gap within the literature.
Current research studies have suggested further investigation in light of other research
that will seek to add diversity to the topic by finding the relationship between
Facebook™ and an African American population.
Research has suggested that gender and racial differences are significant indicators
of social media usage (Hargittai, 2008). Results have demonstrated that women tend to
use social media networks more frequently than men, and African Americans usage has
increased due to wireless technology (Hargittai, 2008; Lenhart, et.al., 2010). Research
has suggested that a digital divide among gender and racial populations is significant with
technology usage worldwide (Jackson, Eye, Fitzgerald, Zhao & Witt, 2010). Gaining
diversity on the impact social media has on academic performance is important, because
African Americans use mobile technology more than any other race (Lenhart, et al.,
2010). Some African American students have a strong dependence on socialization; thus,
contributing to increases of social media use among the African American student
population.
19
Junco (2012b) suggested that an increase in social media use could decrease the
GPAs of college students’. With the presence of an achievement gap between African
American and Caucasian students at both the undergraduate and graduate levels (Rovai &
Ponton, 2005), it was important to further examine the relationship between academics
and Facebook activities, usage, and multitasking of African American students. The
results of this study provided diversity to current research and allowed a stronger
understanding of the types of college students who are most at risk.
When studying diverse populations in the context of academic performance, it
would be remiss to not recognize that diversity of communication and learning styles
exist between the races (Rovai & Ponton, 2005). African American college students have
been shown to learn knowledge better when it is presented in a social context (Rovai &
Gallien, 2005). This could be a result of the dependence African American students place
on socialization. Having a strong dependence on socialization could be a contributing
factor to increases in social media use; however, increased collaboration via social media
use could also have the potential to create a social context to facilitate learning,
depending on how it is used. Faculty often use social media to encourage student
collaboration by assigning class discussions outside of class through social networking
sites (Junco, Elavsky, & Heiberger, 2012). Social media is also used by educators to
make a connection with students and provide them with the opportunity to seek out
answers to questions they may have related to the course (Roblyer, et.al., 2010). These
educational approaches can help build a positive learning environment for the students,
which facilitates learning (Jones, Johnson-Yale, Millermaier, & Seoane Perez, 2008). A

20
collective ethnic group may benefit or not benefit from the use of social media (Junco,
2012b; Roblyer, et al., 2010) and more research is needed to investigate this further.
Therefore, this study extended the current body of literature on the relationship
between academics and daily time spent on Facebook™, type of Facebook™ activity,
and frequency of multitasking of an African American undergraduate student sample
population. The results provided an increase in diversity for this research topic and will
assist future researchers in identifying interventions to meet the needs of the African
American student population.
Problem Statement
High usage and multitasking of Facebook™ by college students has resulted in
less academic engagement and a reduction in overall grades (Junco & Cotten, 2012).
Although some mixed results exist, results of recent studies have revealed the negative
impact multitasking can have on college students’ academic performance (Ellis, et al.,
2011; Junco & Cotten, 2012; Pempek, et al., 2009). In many cases, the social aspect of
social media technology takes precedence over academics, which can result in
detrimental effects (Hanson, et al., 2011). To date, studies that have focused on the
influence of social media and academics examined predominantly Caucasian populations.
These research studies have lacked racial diversity within the sample population (Levine,
Waite, & Bowman, 2007; Junco, 2012a; Pempek, et al., 2009). Research is needed to
examine if the CLT applies to this media with this population (Ellis, et al., 2011; (Junco,
2012b; Junco, et al., 2011). This study examined this issue within the African-American
college student population so that an increase in knowledge related to diverse populations
could be gained about this topic .
21
Purpose Statement
The purpose of this non-experimental, regression study was to test the CLT that
relates semester GPA and Facebook™ activity, while controlling for demographic
variables and academic variables. This study utilized undergraduate African-American
college students enrolled at a large, four-year, evangelical university in the mid-Atlantic.
Students were enrolled in the College of General Studies, School of Health Sciences, and
the School of Education. The criterion variable, GPA, was generally defined as the
semester grade point average college students achieved on a 4.0 scale. The first predictor
variable, the amount of time using Facebook™, was defined as the average amount of
time students were logged into Facebook™ on a daily basis, and was measured through a
Facebook™ data file. Multitasking, the second predictor variable, is the process of
performing multiple tasks at one time, which leads to divided attention and task switching
(Junco & Cotten, 2012). This variable was measured through self-report on the survey.
The third predictor variable, type of Facebook™ activity, included the following
activities; posting status updates, sending private messages, commenting on statuses,
chatting, posting, tagging, or viewing photos and videos. This was also measured via self-
report. Demographic variables were defined as SES and gender. A self-report of SES has
been significant in other studies in its relationship to student academics and Facebook™
use (Junco & Cotten, 2012). Academic variables were defined as HSGPA, major,
classification, self-reported hours per week studying. Accurate records of the
participants’ HSGPAs, major, and classification were gained through the registrar’s
office. Self-reporting of the time spent studying per week was achieved through the
survey also.

22
As applied to this study, the CLT states that if an individual’s cognitive load is
surpassed then the brain’s ability to process knowledge is reduced (Sweller, 1994).
Researchers are still trying to narrow down the most influential variable on college
students academics. Each of the variables for this study have been shown, in other
studies, to have some influence on participants’ academics and cognitive loads (Junco &
Cotten, 2012). These influences have led researchers to recommend future studies to
focus on these variables, so that more can be learned about the specific impact that they
have on students’ academics. The relationship between the criterion and predictor
variables, either positive or negative, will identify the cognitive impact they have on the
participants and specific demographics of who is most influenced. This was measured by
grouping predictor variables (i.e. daily time spent on Facebook™, multitasking with
Facebook™, and type of Facebook™ activity) with demographic and academic variables
(i.e. gender, SES, classification, HSGPA, major, classification, and self-reported hours
per week studying) and identifying the relationship each group had on the participants’
semester GPAs. The results suggested associations that are present among the variables,
and identified any demographic or academic differences.
Significance of the Study
The use of social media among the college student population is significantly high
(Hanson, et al., 2011). Social media usage is common among college students with 85–
99% of students reporting Facebook™ usage (Junco, 2012a). Social media, such as
Facebook™ and Twitter, impact academic performance when students overuse or
multitask while doing schoolwork (Ellis, et al., 2011; Junco, 2012b; Wood, et al., 2012).
Instant messaging (IM), a commonly used Facebook™ activity, has been shown to
23
contribute to students multitasking social media and studying. Junco & Cotton (2011)
stated that 75% of their studies participants reported multitasking instant messaging (IM)
and studying. Through the results of this research, universities will be able to have a
better understanding of specific student demographics that are ultimately affected by this
social media trend. A stronger understanding of specific demographics will enable
universities and K-12 school division administrators across the nation to better educate
their students on the pitfalls of overusing Facebook™.
Current research on the impact of social media use on academic performance has
shown various results, but predominantly used Caucasian college students (Junco &
Cotten, 2011; Junco & Cotten, 2012; Junco, Elavsky, et al., 2012; Wood, et al., 2012).
This research study contributed empirically to this topic, since no studies have primarily
focused on how this relationship affects African American college students. The results
helped provide diversity to this topic, since several studies have identified this as a
limitation and suggested future research address this inadequacy (Junco, 2012b; Junco &
Cotten, 2012; Junco, et al., 2011). This study addressed the need for research that focused
specifically on the African American population and contributed to the empirical gap that
is present. Theoretically, the CLT provided a framework to test for a relationship between
Facebook™ and academic performance of African American college students. By filling
the empirical gaps, this study enabled the results to be utilized in future research seeking
to explain causation on this topic (Lee, et al., 2011).
Research Questions
The research questions guiding this study are:

24
RQ1: Will there be a statistically significant relationship between African
American undergraduate students’ semester GPA and Facebook™ activity (i.e. daily time
spent on Facebook™, multitasking with Facebook™, and type of Facebook™ activity
used while multitasking), while controlling for demographic variables (i.e. gender and
SES) and academic variables (i.e. HSGPA, major, classification, semester credit hours,
self-reported hours per week studying)?
RQ1a: Will there be a statistically significant contribution from demographic
variables (i.e. gender and SES) and academic variables (i.e. HSGPA, major,
classification, semester credit hours, self-reported hours per week studying) to the model
for predicting African American undergraduate students’ semester GPA?
RQ1b: Will there be a statistically significant contribution from the amount of
daily minutes students use Facebook™ to the model for predicting African American
undergraduate students’ semester GPA?
RQ1c: Will there be a statistically significant contribution from multitasking with
Facebook™ to the model for predicting African American undergraduate students’
semester GPA?
RQ1d: Will there be a statistically significant contribution from the types of
Facebook™ activities used while multitasking to the model for predicting African
American undergraduate students’ semester GPA?
Hypotheses
The following are the research hypotheses:
H1: There will be a statistically significant relationship between African
American undergraduate students’ semester GPA and Facebook™ activity (i.e. daily time
spent on Facebook™, multitasking with Facebook™, and type of Facebook™ activity
25
used while multitasking), while controlling for demographic variables (i.e. gender and
SES) and academic variables (i.e. HSGPA, major, classification, semester credit hours,
self-reported hours per week studying).
H1a: The demographic variables (i.e. gender and SES) and academic variables
(i.e. HSGPA, major, classification, semester credit hours, self-reported hours per week
studying) will significantly contribute to the model for predicting African American
undergraduate students’ semester GPA.
H1b: The amount of daily minutes students use Facebook™ will statistically
contribute to the model for predicting African American undergraduate students’
semester GPA.
H1c: Multitasking with Facebook™ will significantly contribute to the model for
predicting African American undergraduate students’ semester GPA.
H1d: The types of Facebook™ activities used while multitasking will significantly
contribute to the model for predicting African American undergraduate students’
semester GPA.
Alternatively, the following are the null hypotheses:
H01: There will be no statistically significant relationship between African
American undergraduate students’ semester GPA and Facebook™ activity (i.e. daily time
spent on Facebook™, multitasking with Facebook™, and type of Facebook™ activity
used while multitasking), while controlling for demographic variables (i.e. gender and
SES) and academic variables (i.e. HSGPA, major, classification, semester credit hours,
self-reported hours per week studying).

26
H01a: The demographic variables (i.e. gender and SES) and academic variables
(i.e. HSGPA, major, classification, semester credit hours, self-reported hours per week
studying) will not significantly contribute to the model for predicting African American
undergraduate students’ semester GPA.
H01b: The amount of daily minutes students use Facebook™ will not statistically
contribute to the model for predicting African American undergraduate students’
semester GPA.
H01c: Multitasking with Facebook™ will not significantly contribute to the model
for predicting African American undergraduate students’ semester GPA.
H01d: The types of Facebook™ activities used while multitasking will not
significantly contribute to the model for predicting African American undergraduate
students’ semester GPA.
Identification of Variables
The criterion variable for this study was semester GPAs of African-American
college students. Research has suggested that GPA is a valuable measurement tool that
identifies the impact other variables have on educational outcomes (Bacon & Bean,
2006). GPA is a common and reliable scale that is used by higher education institutions
throughout the world as a measure of academic success (Bacon & Bean, 2006). The
institution for this study utilizes a 4.0 grading scale for undergraduate level courses. This
study used the semester GPA scores of its participants in order to maintain a level of
consistency.
The first predictor variable for this study was time stamped information from
Facebook™ on the average amount of daily time students use this social media network.

27
Social media is comprised of social networking sites such as, Facebook™ and Twitter;
however this study focused only on Facebook™ usage. Social media networks are used at
a high rate among the college student population, because they are part of a digital
generation (Junco & Cotten, 2012). The social opportunities offered through social media
is what has caused the college student population to overuse these resources (Kirschner &
Karpinski, 2010). Daily Facebook™ time was measured through the participants
Facebook™ activity files that were submitted with the survey.
The second predictor variable for this study was frequency of multitasking.
Multitasking is defined as, simultaneous switching between two tasks (Junco & Cotten,
2012). This study focused on the participants multitasking through their task switching
frequencies between Facebook™ and study time. Multitasking trends were self-reported
by the participants on the Facebook™ Activity Survey (see Appendix A). The third
predictor variable was type of Facebook™ activities, which included posting status
updates, sending private messages, commenting on statuses, chatting, posting, tagging, or
viewing photos and videos. Facebook™ activities can potentially have a different impact
on academic outcomes than frequency of use might have on the participants. For this
study the types of Facebook™ activities were self-reported on the survey and were
defined as the activities that are used by the participants on a daily basis.
In addition to the three predictor variables, demographic and academic variables
were the control variables. The demographic variables included gender and SES. The
gender variable was self-reported and classified as male or female. SES was a
classification of the participants social status based on family income. This variable was
self-reported and defined as either lower class, middle class, or upper-middle class. These

28
variables allowed the research to identify specific demographics and study habits of
college students that are most influential on impacting semester GPAs. Academic
variables included HSGPA, major, classification, self-reported hours per week studying.
HSGPA was defined as a participants cumulative grades based on a 4.0 scale. Major was
the area of academic study the student was enrolled in, while the classification was
considered the students classification of either freshman, sophomore, junior, senior.
Major, HSGPA, and classification data was gained through an academic list provided by
the registrar’s office. Self-reported hours per week studying was the weekly total amount
of time the participants study. Each of predictor variables were grouped with
demographic and academic variables, which showed the type of relationship each block
had with semester GPA.
Definitions
Social media: Social networking sites, such as Facebook™ and Twitter, which are
currently used in high demand by college students (Junco & Cotten, 2012).
GPA: A tool used to measure a student’s academic achievements, which is based
on a 4.0 scale that ranges from 0 to 4.0 (Junco et al., 2011).
Multitasking: “Divided attention and non-sequential task switching for ill-defined
tasks as they are performed in learning situations” (Junco & Cotten, 2012, p. 505-506).
Student Engagement: The amount of time or energy a student commits to an
academic experience (Junco et al., 2011).
Cognitive Load Theory: The human brain has only a limited amount of working
memory. When intrinsic and extraneous loads are at high levels the brains ability to
effectively process and build schema are reduced (Sweller, 1994).

29
Schema: Cognitive information that is organized and stored in the brain from
information learned that can be used for future use (Sweller, 1994).
Intrinsic Load: The cognitive load caused by learning materials and the
interconnectedness of that information with previously acquired knowledge (Kalyuga,
2011).
Extraneous Load: Non-academic distractions that may interrupt or hinder an
individual from learning knowledge and building schemas in relation to that process
(Kalyuga, 2011).
Time Usage: The amount of time, measured in minutes, that students reported
spending time using social media (Pempek et al., 2009).
Social Media Overuse: The use of social media for significantly large amounts of
time on a daily basis (Kuss & Griffiths, 2011).

30
CHAPTER TWO: REVIEW OF THE LITERATURE
Social Media and the Current Generation
Research has suggested that, 94% of first year college students are users of at
least one social media network (Junco et al., 2011). Numerous social media networks
exist, including Twitter, and Facebook™. College students spend countless hours using
social media. Twitter users currently total, “200 million people who send an estimated
155 million messages or tweets per day” (Junco et al., 2012, p. 1). Instant messaging
among college students has recently declined, but students still spend an average of an
hour and 20 minutes per day chatting. Facebook™ is one of the most commonly used
social media networks with approximately 85%-99% of undergraduate students utilizing
it (Junco, 2012a). As smart phone technology continues to be developed, more students
will have easier access to social media networks, and students will use them more
frequently (Stollak, Vandenberg, Burkland, & Weiss, 2011).
Social Media Definition and Usage
College students of the current generation have been exposed to a technology rich
world that has led them to become dependent on social media as a means for
communication (Hanson et al., 2011). Social media technology has become
commonplace among students and has caused them to become reliant on it. College
students seek to stay connected with their social lives and Facebook™ enables them to
achieve this task. Sixty-five percent of freshman and sophomores in college use
Facebook™ to remain in contact with friends or family (Pempek et al., 2009). A recent
study revealed that 85% of college students use social media websites as a major method
of communication (Heiberger & Harper, 2008). The need to remain in constant
communication motivates students to use Facebook™ for longer periods of time.

31
Social media is defined as Internet networks that provide an online community for
users to interact in a fast, convenient manner (Ahmed, 2011). Within social media
networks, users are able to create profiles, share information, and view other users
comments. Facebook™ and Twitter are two frequently used social media networks that
enable its users to interact in a microblogging platform (Java, Song, Finin, & Tseng,
2007). Twitter and Facebook™ recently created applications on each site that links the
two networks together enabling users to post their status from one site to the other
(Twitter, 2012b). Although Twitter is classified as an information network, it still
possesses social media features that contribute to the amount of time students use
Facebook™. As technology makes social media more accessible, the use of Facebook™
and other social media sites will likely increase significantly.
Facebook™. Founded in 2004 by Mark Zuckerberg, Facebook™ was originally
designed for only Harvard University students (Boyd & Ellison, 2008). As the demand
and popularity for social media networks grew throughout the world, Facebook™
creators expanded their network to include everyone (Boyd & Ellison, 2008). This
change started a massive following of individuals and made Facebook™ one of the most
popular social media networks in the world (Ahmed, 2011).
Facebook™ is a social network that enables users to communicate with their
friends and family. Users create a profile and communicate through a list of their online
friends. As individuals increase the number of Facebook™ friends, the ability to make an
online connection increases. Users are able to communicate with their friends by posting
messages on their Wall, live chatting with them, or posting videos and pictures (Ahmed,
2011). The popularity to socialize through Facebook™ has grown significantly, as

32
membership has nearly reached one billion users and more than eight billion minutes
have been spent on Facebook™ daily (Barnett, 2012; Kirschner & Karpinski, 2010).
Motivation for Heavy Social Media Use
The current college student population is one that has formed a strong relationship
with technology since birth (Kirschner & Karpinski, 2010). College students of this
generation tend to focus on social interactions, which, in conjunction with their
technology bond, create a high tendency to use social media (Hanson et al., 2011).
Having a variety of social media networks motivates many students to satisfy their social
needs through the use of these sites (Hanson et.al., 2011). Several researchers have
identified social identity, racial identity, and social capital as primary reasons why
students use social media so frequently and contribute to the social media usage trends
(Junco, 2012b; Kirschner & Karpinski, 2010).
Social and Racial Identity
Social Identity. College students tend to define and identify the type of identity
they possess (Grasmuck, Martin, & Zhao, 2009). The psychological and developmental
dynamics that are present in most college age students make them vulnerable to their
peers as they seek to create an identity (Chou, Condron, & Belland, 2005). Through the
use of social media, college students are able to disclose information about themselves
and then receive feedback on it from their peers (Pempek, et al., 2009). These actions are
related to Janis’ (1972) groupthink theory, which states individuals within a group
constantly conform to the decisions of the group. Through Facebook™ groups, college
students often create social identifies that conform to the group as they seek validation
and fulfillment. As a result, students self-categorize themselves based on group norms,

33
which leads to longer amounts of time using social media networks (Hogg & Hains,
1998). Using social media as a method to communicate with peers and gain validation
can influence the identity of a particular student and motivate them to use it more often.
The effects of groupthink and the power of peer group feedback is evident, since many
students base their decisions on what others think and say through social media outlets
(Pempek et al., 2009). As more college students increase the amount of time they use
social media networks, social identities continue to be shaped through the ideas,
decisions, and opinions of the peer group that they frequently interact with daily. This
type of influence can have mixed outcomes, since positive or negative self-esteem can
result from the type of feedback students receive from their peers (Pempek et al., 2009).
Some of the negative consequences of groupthink include ethnocentrism and intergroup
discrimination (Hogg & Hains, 1998). As students’ dependence on the opinions of their
social media group increases more time will be logged on social networks.
Racial identity. Research has suggested a racial digital divide with technology
due to limited availability to Internet resources. However, it has been proven that this
divide dissipates once students are placed in an academic environment, like college,
where technology resources are more accessible (Cotten & Jelenewicz, 2006). College
students reach a point in their lives where they seek to define who they are and many
utilize the technology resources available to them to express this information. College has
been linked to a time in an individual’s life when they seek out racial self-identification
with social networks being a primary tool for self-presentation (Lee, 2012). Students of
various races often attempt to create their racial identity through online social networks.
African American is one race that has been linked to extensive identity construction on
34
Facebook™ (Grasmuck et.al., 2009). Through the Facebook™ aspects of displaying
pictures, background information, and personal comments African Americans are able to
display their own racial identity (Lee, 2012). An African American’s racial identity is
how they are commonly viewed by others on social media sites. A student’s identity is
built on how they identify themselves on the network, and the degree of endorsement
from their peers (Zhao, Grasmuck, & Martin, 2008). The process of racial identity,
through social networks, has caused students to become obsessed with monitoring these
networks, which has led to an increase in the amount of time they use social media
networks.
Research has suggested that African Americans display racial cues on
Facebook™ in order to help improve their overall self-identification (Lee, 2012).
Through the use of several Facebook™ activities African American students are able to
create a stronger racial bond with other students. One study suggested that, “African
Americans are often concerned with how they are read by others on the social network
site, especially faculty and White students” (Lee, 2012, p. 341). This causes an increased
amount of effort preparing an adequate profile, which is time consuming. One study
identified African American women as being the most frequent users of the Internet than
any other racial group (Hargittai & Hinnant, 2008). The dramatic increase in African
American Internet usage can be traced back to the ease of technology access provided in
schools. Students with low SES typically have little to no previous exposure to the
Internet. The school curriculum introduces it to them and it is a factor that has led to
students conforming to their peers and forming online identities (Jones et al., 2009). As
more students become increasingly obsessed with their racial identities, the amount of
35
time they log on to their social network accounts to update their information will
increase.
Social Capital
Social capital is defined as the resources an individual gains from the
relationships that he or she creates through a network of interrelated individuals (Ellison,
Steinford, & Lampe, 2007). Through the use of social media, college students are able to
build social capital based on interactions online. Social media networks enable
individuals to maintain a vast list of relationships that provides access to various
resources (Ellison et al., 2007). The number of relationships built through social media
networks is larger than original face to face methods due to the design and easy access of
the sites. As college students become more concerned with building social capital
through these websites, more time will likely be spent using these networks. However,
research has suggested a “positive relationship between using Facebook™ and forming
and maintaining social capital” (Junco, 2012b, p. 187). Social capital provides several
positive and negative aspects that can influence a college student’s life. If students are
able to use social media to maintain and grow their social capital without allowing it to
interfere with their academics then positive results can occur.
The Influence of Social Media on Academics
Positive Influences
As it continues to grow in popularity, more faculty will begin to increase their use
of social networking in order to successfully teach the next generation of college
students. Social networking sites are already in use in many college classrooms across the
nation and have received mixed results (Jacobsen & Forste, 2011; Jones et al., 2008).

36
Many faculty who implement this technology view it as a method in which to build a
positive relationship with the students, while educating them. Experts have stated that,
“social communications among college students can become a main contributor to
successful learning” (Roblyer et al., 2010, p. 137). As faculty seek to build relationships
with their students, many will use social networks since students of this generation utilize
them to remain socially connected (Hanson et al., 2011). Social networking is viewed as
the technology that will provide a stronger connection with this generation of college
students. The approach students take with the amount of time they use social media is the
determining factor of whether positive or negative results will occur. Limiting time spent
on social media networks and still using them to connect with their professors, family,
and friends can enable college students to achieve positive academic results. However, if
the current trend of social networking continues students will likely spend too much non-
academic time on these websites, which will have a negative academic influence
(Kirschner & Karpinski, 2010).
Negative Influences
As college students become more reliant on social media they begin to view it as
a significant aspect of their lives. This leads to heavy usage that can negatively influence
college students’ academic performance. Sixty-five percent of freshman and sophomores
in college use Facebook™ to remain in contact with friends or family from back home
(Pempek et al., 2009). The need to remain in constant communication motivates students
to use Facebook™ for longer periods of time. As students increase the amount of time on
Facebook™ their grades become directly influenced (Kirschner & Karpinski, 2010). In
relation to student GPA, Kirschner & Karpinski (2010) stated, “Facebook™ users have a
37
lower mean GPA as compared to non-users” (p. 1243). Social media diminishes focus on
academics and influences personal study habits (Jacobsen & Forste, 2011). For example,
college students who frequently use Facebook™ study 1-5 hours per week as compared
to non-users who spend 11-15 hours studying per week (Stollak et al., 2011). However, if
students become obsessed with building their social capital and the result is multitasking
social media and academics then a negative academic influence could occur (Junco &
Cotton, 2012).
Gender Differences in Social Media Use
Current research on social media has examined the influence on college students’
populations, but with little regard for differences among demographic variables.
Demographics are significant to consider since research has suggested that differences
among users are common. Researchers have recommended future research to utilize
various demographics in order to help identify any user differences (Junco, 2012b; Junco
& Cotten, 2012; Wood et al., 2012). Through the incorporation of alternate demographics
a stronger understanding of this topic will be understood.
For many young adults the use of social media networks is a way in which to
display their personalities and connect with others all over the world (Mazman &
Yasemin, 2011). As social media use within this population continues to rise, experts
look to identify specific demographics that are impacted the most. Studies have revealed,
“females are more likely than males to report spending longer amounts of time on
Facebook™ than initially intended” (Thompson & Lougheed, 2012, p. 88). The social
aspects of these networks appeal to females who are typically the more social of the two
genders (Mazman & Yasemin, 2011). Females frequently use the Internet to access social

38
media networks, whereas males utilize the Internet more frequently for entertainment and
information purposes (Jackson et al., 2008). Although males dominate the overall amount
of time spent on the Internet, females possess the most time logged into social media
networks due social preferences (Jones et al., 2009). Social preferences have resulted in
gender differences between males and females. The preferences of male and female
Internet and social media use can be met in a variety of ways. For females, social
networks provide the ability to meet their need to socialize through the maintenance of
personal relationships and social browsing (Mazman & Yasemin, 2011). For males, the
Internet provides a valuable resource for, “entertainment, information, and commerce”
(Jackson et al., 2008, p. 438). The communicative aspects of social media are not as
essential for males, which results in a decrease in the amount of time they use these
networks. Facebook™ is a common social media network that is used by many college
students of both genders for social purposes. One study revealed that the females within
their population reported using Facebook™ 62% of the time while on the Internet, which
was in comparison to 44% of Facebook™ usage by males (Thompson & Lougheed,
2012). The difference in the amount of time each gender uses Facebook™ can be related
to several of the key factors discussed. The increased use and high reliance on using
social media networks for primary communication purposes has changed the way male
and female college students interact with friends, family, and professors. Research has
suggested that both males and females tend to substitute typical social communication
with the Internet and social media networks (Jones et al., 2009) The reliance on social
media for communication purposes has caused adverse effects, such as stress and anxiety,
on some college students. Research has suggested that females are more commonly

39
impacted by these effects than males due to their higher levels of social media usage
(Thompson & Lougheed, 2012). Higher levels of social media use, along with stress and
anxiety, have negatively impacted academic GPAs of both males and females (Stollak et
al., 2011). In addition to gender differences, research has suggested a change in the racial
differences of Facebook™ users also.
Racial Differences in Social Media Use
Since the early 2000s Caucasian, young adults have been considered one of the
most dominant users of the Internet (Cotten & Jelenewicz, 2006). Many experts linked
African Americans and several other racial backgrounds to low Internet connectedness
during this time due to factors such as low income, personal preference, and
inaccessibility to a computer (Jackson, et al., 2008). As social media’s popularity grew, in
2006, Caucasian students were among the highest users due to several of these factors
limiting Internet connectedness of other racial backgrounds. However, as technology
availability changed and Internet accessibility became affordable the diversity of social
media users increased. Today, African Americans are, “the most active users of the
mobile Internet,” which significantly contributes to the recent increase in diversity of
social media and Internet usage (Lenhart et al., 2010, p. 15).
Racial differences among young adults use of the Internet and social media has
significantly decreased since the early 2000s (Jackson et al., 2008). As the popularity of
mobile technology improves more African Americans are increasing the amount of time
they are accessing the Internet. Over 48% of African Americans and only 31% of
Caucasian young adults now use their cell phone and other mobile devices to access the
Internet, which provides more opportunity to use social media networks (Lenhart et al.,

40
2010). The increased opportunity and popularity of mobile devices has caused young
African Americans to increase their Internet usage, causing racial differences to decrease.
Research has shown that the decrease in racial differences of Internet use is so significant
that African American and Caucasian young adults are equally likely to use social media
networks (Lenhart et al., 2010) (see Table 2.1). Facebook™ studies have focused
primarily on Predominantly White Institutions (PWI) and Caucasian students. The
population of two separate Facebook™ studies conducted at a 4-year public university in
the northeastern United States only contained 4.6% and 5% of African Americans (Junco,
2012b; Junco & Cotten, 2012). A third Facebook™ study conducted in a large,
midwestern university only had an African American population of 7.8% (Kirschner &
Karpinski, 2010). Given the known differences in technology use and influence of
technology that exists between racial populations, more research must be completed to
determine if previous findings concerning Facebook™ use and academic performance are
applicable to the racially diverse populations (Junco, 2012b; Junco & Cotten, 2012;
Lenhart et al., 2010). As the popularity of mobile devices continues to increase among
young adults more opportunities to access social media will occur. This could potentially
lead to an increase in the amount of time college students’ access these networks
throughout their daily activities.
Academically, an achievement gap is present between Caucasian and African
American students at various levels of education including higher education (Spenner,
Bachmann, & Landerman, 2004). Scores on achievement tests have shown that African
American students typically score worse on these exams and create a significant
difference between other races (Spenner et al., 2004). Some researchers have suggested

41
that social media networks enable college students to build social capital, and provide
themselves with an adequate resource list of individuals, which causes an increase in their
use of social media (Zhao et.al., 2008). Through the communicative capabilities of social
media African Americans are able to gain valuable knowledge and motivation towards
achievement. Positive improvements on African American young adults social capital has
shown to improve their academic results (Ellison et al., 2007). Research has suggested
that, “high school students with well-developed social capital have higher educational
outcomes” (Spenner et al., 2004, p. 188). These academic results provide a positive
change to the achievement gap and enable more students to become increasingly more
involved with their schoolwork. Although many faculty are hesitant to incorporate social
media technology within the classroom it is important that they see some of the positive
outcomes that can result (Roblyer et al., 2010). These changes can aid students in
succeeding in their college courses and prepare them for their future endeavors.

42
Table 2.1
Similarities and Differences of Gender and Racial Social Media Use
Similarities Differences
Gender 85% of all college students use social media for communication (Heiberger & Harper, 2008).
Males tend to use the Internet for longer periods of time (Jones et al., 2009).
A majority of both genders base their decisions on their Facebook™ group (Pempek et al., 2009).
Females tend to use Facebook™ longer periods of time (Jones et al., 2009).
Both genders substitute social communication with social media use (Jones et al., 2009).
Females primary use of social media is for communicative purposes (Imhof et al., 2007).
Both genders tend to multitask academics with Facebook™ use (Lee et al., 2011).
Males primary use of social media is for games and research (Imhof et al., 2007).
Race The majority of all races use
Facebook™ as a way to create an online self-identity (Lee, 2012).
African Americans are linked to extensive identity construction on Facebook™ (Grasmuck et al., 2009).
The majority of all races are reliant on using Facebook™ (Lee, 2012).
African American women are the most frequent users of social media (Hargittai & Hinnant, 2008).
Build social capital through online interactions (Junco & Cotten, 2012).
African Americans use mobile technology more frequently (Lenhart et al., 2010).
African Americans tend to score lower on achievement tests (Spenner et al., 2004)
Facebook™ use has been shown to have positive and negative influences on
college students, which may be mediated by race and gender. Theory however would
suggest that the influence of Facebook™ is likely to have a negative influence on

43
students’ achievement. When students multitask with Facebook™, they have less ability
to concentrate on academics. The CLT (Sweller, 1994), is affirmed through the studies
above that (see Table 2.1) students increased use is likely to decrease cognitive
capabilities. The hypotheses for this study are organized within this framework.
However, as research suggests these hypotheses may be moderated by type of use. The
incorporation of social media for use with class assignments has enables professors to
motivate students to participate and learn effectively inside and outside of class. By
positively utilizing the popularity of social media within the curriculum students are
motivated to learn the information being taught. Below the theory and how it related to
this study is affirmed by a review of past research on social media.
Cognitive Load Theory
The brain is an intricate organ in the human body that performs multiple jobs, one
of which is the storage of knowledge in memory. As college students learn knowledge
through their coursework, several factors play a role in effectively processing the
information. As an individual learns new information, the brain organizes the knowledge
as schemas and stores it in working memory (Sweller, 1994). A schema is the stored
information used for recalling knowledge that a person may need for future use. As an
individual gains new knowledge, through learning and experience, their brain continues
to build schemas for long-term memory. If an individual faces a need to recall the stored
information the brain uses the stored schema to allow the working memory to provide a
fast, automated response (van Merriënboer & Sweller, 2005). The CLT states that when a
person learns new knowledge there are three factors, intrinsic load, extraneous load, and
germane load, that influence the effectiveness of schema storage (van Merriënboer &
Sweller, 2005). Intrinsic load is caused by learning materials and the interconnectedness

44
of the information being taught with previously acquired knowledge (Kalyuga, 2011).
Extraneous loads are non-academic distractions that may interrupt or hinder an individual
from learning knowledge and building schemas in relation to that process (Kalyuga,
2011). Germane load is considered the load placed on the brain due to the processing and
storing methods of the knowledge into schemas (van Merriënboer & Sweller, 2005).
According to the CLT, the working memory of the brain is limited to the amount of load
that can be placed upon it before its effectiveness in storing information is hindered
(Sweller, 1994). When a college student engages in activities with high intrinsic and
extraneous loads, such as multitasking, their abilities to store academic knowledge can be
impacted (Sweller, 1994).
Cognitive Load Theory and Social Media Multitasking
Social media use among the college student population has become increasingly
popular in this current generation and has led to a multitasking trend (Hanson et al.,
2011). And, some researchers suggest that a negative relationship exists between
multitasking schoolwork and social media use. For example, higher levels of
distractibility are associated with specific Facebook™ activities, which have caused
reduced cognitive capabilities of college students (Moreno et al., 2012). During
multitasking students engage in an unrelated activity that takes away from their ability to
fully comprehend knowledge being taught (Wood et al., 2012). Multitasking can impact
student learning capabilities by causing students to be distracted from their schoolwork
and adding excess load on the brain (Wood et al., 2012). This is consistent with the CLT,
which states that the combination of typical learning processes and external distractions
can result in a reduction of the brains ability to effectively process knowledge (Sweller,
1994). The multitasking trend is an issue that continues to grow as social media plays an

45
important role in the lives of this current generation of college students (Junco et al.,
2011).
Multitasking Trends of College Students
The majority of college students in this current generation have the perception
that they can multitask and be successful at performing several tasks (Burak, 2012). The
success rate for college students to multitask and be effective is high and is a result of
increased exposure and practice performing these tasks (Willingham, 2010). However,
research has suggested that it is not the higher levels of exposure, but rather higher
working memory capabilities of the younger generation (Willingham, 2010). By having
larger working memory capabilities students of this current generation believe they can
successfully multitask, since they see higher performance results in comparison with
older adults. Research has suggested that although they do maintain higher cognitive
abilities, “college students who report being chronic multitaskers tend to be inferior at
standard cognitive control abilities than others” (Willingham, 2010, p. 25).
Statistics have suggested that the trend of multitasking among teenagers has
increased with every new generation of students (Lee et al., 2011). Although college
students cognitive capabilities are inhibited, as a result, many continue to multitask.
Multitasking social media and academics is common among the college student
population, since they have the perception that they can be successful at it (Lee et al.,
2011). Experts, however, have suggested limits to information processing capabilities of
the brain at one time (Lee et al., 2011). Some have even theorized that when two tasks are
switched back and forth the brain may remove one task from working memory, so that
the brain does not have excess load amounts (Kieras, Meyer, Ballas, & Lauber, 2000). A

46
contributing factor to overloading the brains working memory is switching between two
tasks, which contributes to the brains inability to process the information making it
difficult to build an effective schema (Burak, 2012). This is caused by the brain having an
overload threshold, which places a limit on the amount of load that the brain can
successfully process (Wickens, 2002). When two simultaneous tasks are used during
multitasking, too much load demand is placed on the brain and the threshold is surpassed.
This results in a reduction of working memory capabilities and knowledge
comprehension for long term cognition (Ellis et al., 2011). A reduction in cognitive
capabilities, due to multitasking, has been proven to result in poor learning outcomes and
a reduction in academic performance (Kirschner & Karpinski, 2010). Studies have
revealed that although college students academic performance capabilities are reduced
the students do not view multitasking as the factor that causes this influence (Kirschner &
Karpinski, 2010). Due to this thought process college students continue to multitask
social media and academics, which leads to higher levels of academic failure throughout
the college student population (Junco, 2012a; Pempek et al., 2009; Burak, 2012).
The types of tasks that college students utilize vary depending on their personal
preferences. Research has suggested that some tasks are so engaging to users that they
totally disregard or neglect other simultaneous tasks (Wickens, 2002). Social media is
considered a highly engaging task that can take precedence over academics and
negatively influence comprehension capabilities (Hanson et al., 2011). On average,
teenagers send 3,146 text messages per month, which typically overlaps with instances of
academic learning contributing to negative results (Lee et al., 2011). Although the use of
technology within the classroom has shown to have some positive aspects in assisting

47
students to learn, multitasking has decreased students overall effectiveness. Recent
studies have shown that mobile technologies, such as laptops, BlackBerrys, iPads, and
iPhones, which are considered acceptable academic aides, often allow students to
multitask during lectures (Wood et al., 2012). Producing this extraneous load during class
time causes students to surpass their overload threshold prompting a reduction in their
knowledge retention capabilities (Wickens, 2002). As the availability of mobile
technologies continues to increase more multitasking will occur, which will influence the
learning effectiveness and GPAs of future generations.
The Relationship Between Multitasking and Academics
A student’s ability to succeed in school is typically dependent on their ability to
successfully learn and apply course outcomes. As the trend to multitask social media
during lectures increases, more college students are unable to pay attention and
performance capabilities decrease (Bowman et al., 2010). Multitasking within the
classroom has significantly increased as technology improvements have occurred (Burak,
2012). Cell phone usage in the classroom has been utilized by students for texting and
social media access, and is detrimental to students’ abilities to learn and store knowledge
(Ellis et al., 2011). Having easy access to social media within the classroom has led to
students multitasking during periods of instruction and learning (Ellis et al., 2011).
Through multitasking, students shift their attention between the social media technology
and instruction, which causes their attention to be divided among multiple tasks reducing
their learning capabilities. This aligns with the CLT, since students are engaging in a
nonacademic activity during instruction that causes a detriment in their overall learning
effectiveness (Wood et al., 2012).

48
Reducing a student's learning effectiveness not only impacts their learning and
short term knowledge retention but also their ability to retain knowledge for future use.
When a student multitasks social media with academic learning, their ability to
cognitively process and gain a thorough understanding of the material decreases
significantly (Junco & Cotten, 2012). Multitasking social media and academics is,
“counter intuitive to the principles of information processing” and influences students’
ability to effectively learn the information (Lee et al., 2011, p. 95). As a student
multitasks, short term memory becomes overloaded, which can cause excessive cognitive
load. Having an excessive amount of cognitive load hinders the student from being able
to learn, process, and gain a full understanding of the material being taught (Lee et al.,
2011). This results in students unsuccessfully comprehending the course material and
outcomes for the class. A learning detriment like this can have adverse effects on a
college student’s GPA and their ability to effectively perform within the classroom
setting.
Impact of Multitasking on GPAs
Many college students do not have a primary focus on academics but rather on
being socially connected (Hanson et al., 2011). The amount of time spent on social media
has been shown to have a direct influence on media multitasking and the GPAs of college
students. Statistics have revealed, from 2007 to 2008 the overall time spent on
Facebook™ increased 566% (Kuss & Griffiths, 2011). As more students increase the
amount of time using social media networks, like Facebook™, multitasking will occur
and impact student GPAs. Research has shown that individuals who use Facebook™ tend
to study less and have significantly lower GPAs (Kuss & Griffiths, 2011). The decrease

49
in academic performance and GPAs can be related to an individual’s brain only being
able to sustain a limited amount of input. As the CLT states, “human information
processing can be insufficient during periods of multitasking, since the brain is unable to
keep up with multiple input streams” (Junco & Cotten, 2012, p. 506). The inability of the
brain to be effective during periods of multitasking has caused academic deficiencies for
numerous college students. For many, social activities take precedence over academic,
which encourages the use of multitasking to meet their social needs (Hanson et al., 2011).
As the frequency of multitasking social media and academics increases lower overall
GPAs will result (Junco & Cotten, 2012). In addition to lower GPAs, college students
who engage in multitasking will reduce their ability to learn and retain knowledge for
long term application (Junco & Cotten, 2011). This can impact graduating students
overall effectiveness at their future place of employment.
Challenges of Social Media Use on Academics
Social media incorporation can present several challenges to the academic success
of college students. Social media use negatively influences various aspects of college
students’ academics lives, which includes GPA, academic engagement, and time
management skills. The use of social media has increased on college campuses and more
students are choosing to spend greater amounts of time on social media websites (Levine
et al., 2007). This increase in usage encourages students to multitask during their study
time or simply decrease the amount of time spent studying. This decision is ultimately
what has the greatest influence on student GPAs and engagement levels.

50
Student GPAs
Student use of social networks has been linked to a decrease in academic success,
with 8.9% of students in 2000 reporting this occurrence (Junco & Cotten, 2011).
Adolescents and young adults are considered to be the most frequent users of today’s
online technologies (Kirschner & Karpinski, 2010). As the trend to use social media
networks becomes more prominent among college students’ academic failure is likely to
occur. A recent study of college undergraduate students revealed that 76% of the students
felt that Facebook™ had a negative effect on their ability to study effectively (Pempek et
al., 2009). The same study also showed that 82% of the same students felt that
Facebook™ had a positive influence on their social lives (Pempek et al., 2009). These
statistics indicate that students have become aware of the dangers of overusing social
media, but continue to use them due to the social benefits. College-aged students consider
their social lives a high priority, and as a result allow the use of social media networks to
interfere with their study time. As students continue to rank their social lives above
academics, GPAs will likely be negatively impacted.
As students increase the amount of time they use social media, overall educational
experiences will continue to decline. Research has shown that students who use social
media for extended periods of time or multitask have an increased risk of not being able
to achieve the educational outcomes of their courses (Willingham, 2010). Reducing
student abilities to comprehend and achieve learning outcomes can have a significant
impact on their grades (Jacobsen & Forste, 2011). Research over the last decade has
suggested that the human brain is not effective at processing or performing multiple tasks
(Junco & Cotten, 2012, p. 506). This level of ineffectiveness of the human brain can

51
cause a detriment in college students’ ability to fully understand the knowledge being
taught (Lee et al., 2011). As Junco and Cole-Avent (2008) suggested, technology can
create productive and unproductive results. The manner and amount of time students
choose to use social media is one of the determining factors of influence on grades. If
current trends remain, unproductive uses will continue to occur, which will have a
significant influence on students’ abilities to successfully achieve learning outcomes
(Jacobsen & Forste, 2011).
Student Engagement
Student engagement is defined as, “the amount of time and effort students invest
in educational activities that are linked to learning outcomes” (Junco, et al., 2012, p. 2).
The amount of engagement a student has with academics can play a crucial role in their
academic success. As more college students increase the amount of time they use social
media, engagement levels continue to drop. A decrease in student engagement can lead to
unsuccessful achievement of learning outcomes and a decrease in GPAs. Studies have
shown that student academic engagement plays an integral role in academic success
(Junco, 2012a). Statistically, between 67% and 75% of undergraduate students use social
media networks, which can have detrimental effects on the students’ academic experience
(Junco, 2012b). A student’s ability to engage in course work for both in class and out of
class settings is integral to their success (Junco et al., 2011). As social media becomes
more accessible and used for longer periods of time, students have less time to engage
with their course work. Many students of this generation place too much time and
emphasis on updating their Facebook™ status rather than completing schoolwork
(Hanson et al., 2011). Students lose their sense of commitment to their schoolwork as

52
they are drawn away from it by social media websites. For many students the problem is
the amount of time spent at social media websites, while for others, academics is simply
not their primary focus (Hanson et al., 2011). Student engagement has been linked to
academic success, so as students become less involved, due to social media, their GPAs
and academic abilities will be significantly impacted (Junco, 2012b).
Student engagement can be divided into two categories: social and academic. The
use of social media networks has been shown to improve students’ social engagement
and decrease academic engagement (Junco et al., 2011). College students of this
Millennial generation (born after 1982) have a strong emphasis on being socially
connected, so using social media in large amounts of time is common (Hanson et al.,
2011). By increasing the amount of time spent on social media students limit their
opportunities to spend time on academic work (Junco, 2012b). Since there is a constant
focus on social connectedness students’ academic engagement levels decrease and their
GPAs are negatively impacted. Although this occurs often, many of the students are not
worried, since they are meeting their primary concern of being connected with their
friends (Kirschner & Karpinski, 2010). Even though the trend of social connectedness
can be considered a detriment to college students’ grades, the use of social media can
provide some academic benefits.
Benefits of Social Media Use in Academics
Recent studies have revealed that although social media has the potential to create
negative results for college students it can serve as a positive resource for academics if it
is used properly (Hanson et al., 2011; Junco et al., 2011). For example, research has
shown that universities that use technology can positively motivate students’ in their

53
course work (Jones et al., 2008). An increase in student motivation can often result in a
positive impact on student engagement, grades, and on personal psychological aspects
(Imhof, Vollmeyer, & Beierlein, 2007). Although some higher education faculty are
against its use, social networking sites are still the fastest growing technology among
students (Junco & Cole-Avent, 2008). Research has suggested that other faculty, “view
Facebook™-like technologies as an efficient and business-like way to establish a
relationship with students” (Roblyer et al., 2010, p. 135). As more university faculty
incorporate social media technology within the classroom and students utilize its use
efficiently outside of the classroom the Net Generation students will have the potential to
benefit academically, socially, and psychologically. African American college students
will greatly benefit since, research has suggested they learn knowledge better when it is
presented in a social context (Rovai & Gallien, 2005). Through an increase of class
collaboration through social media, professors can facilitate learning and positively
utilize the social learning habits of African American students. As mobile technology
becomes increasingly popular and available to these students, student engagement and
positive academic results will occur as social media is utilized within their courses
(Lenhart et.al., 2010).
Student Engagement
On average, 94% of students use some type of social media network during a
normal week (Heiberger & Harper, 2008). The task for university faculty is being able to
successfully engage these students on a daily basis (Junco et al., 2011). Many experts
suggest the use of social media as an educational tool in order to achieve a successful
engagement level (Junco et al., 2011). Although students are highly motivated to use

54
social media, many university faculty do not support its use in the classroom. Being able
to understand the learning characteristics of the current student generation can allow
faculty to understand how social media will assist student learning in certain areas.
Through the use of collaborative interaction students could remain socially connected
without having to sacrifice academic time (Hanson et al., 2011). Using social media
networks as a method to facilitate group collaborative work would enable faculty
members to meet the social demands of students in an academic manner. This approach
would allow the technology savvy students to interact on the social media networks in
order to accomplish group tasks. A recent study revealed, “Three-quarters of college
students spend between one and three hours per week using the Internet for social
communication” (Heiberger & Harper, 2008, p. 22). As the social technology trend
continues it is imperative that universities utilize these resources to assist in meeting the
educational needs of all the students. Social media, such as Facebook™, has also been
linked to providing freshman with a connection to other new students, which helps to
serve as positive reinforcement (Mazman & Yasemin, 2011). Assisting students with the
transition into college through the use of social media can help provide a positive
academic environment that could lead to an increase in student engagement and grades
(Heiberger & Harper, 2008). Using social media as an educational tool has shown mixed
academic results, however, student motivation to use social media can provide some level
of positive influence (Roblyer et.al., 2010).
Positive Academic Results
College students’ academics have the potential to increase according to their level
of motivation to engage in the course work. Several studies have shown that universities

55
who incorporate some level of technology, such as social media, into the curriculum have
seen positive academic results (Junco et al., 2011). Being engaged in their schoolwork
enables students to focus on their academics and retain more information being taught
(Roblyer et al., 2010). A recent survey revealed, “72% of college students having an
interest to IM with an admissions counselor, and 64% having an interest to read a blog
written by a professor” (Junco & Cole-Avent, 2008, p. 4). These interests can be seen as
motivating factors that can encourage students to become more engaged within their
school work. The use of social media through classroom learning encourages a people-
oriented and relational approach to learning, which research has shown to be beneficial
for certain student populations, like African Americans (Rovai & Ponton, 2005). The
current Net Generation of students perceive social activities as a primary focus, so being
able to incorporate this focus into the classroom will encourage student engagement
levels to positively increase for inside and outside of the classroom (Hanson et al., 2011).
Several social media networks have been shown to create a positive learning
environment for students. As students create online communities, through social media,
they are able to engage with other students in their class (Bowman et al., 2010). Research
has suggested that through peer interaction and group collaboration with social media a
positive impact on student learning can occur (Tervakari et al., 2012). Twitter and
Facebook™ are the two most commonly used networks that are used to enable students
to interact with each other and provide constructive criticism on various activities
(Pempek et al., 2009). Providing a technology based activity motivates students to
participate and positively improves their connection to others within the class (Jones et
al., 2008). Social media has also been used by university admissions offices to allow
56
incoming students the ability to connect with other students and make a more positive
connection with the university (Junco & Cole-Avent, 2008). Maintaining a level of
connectedness is a primary concern of college students, so utilizing social media
networks through creative methods can allow students to become engaged not only in
their academics, but even before they step on to campus for the first time. Studies have
suggested that social media can not only have a positive impact on student academics, but
also on students psychological health as well (Junco & Cole-Avent, 2008). Having an
increase in their psychological health can help contribute to student motivation to
participate in class activities.
Psychological Benefits
Social media technology provides college students with a technological platform
to create a personal identity, form bonds with others, and provide the feeling of belonging
to a community (Stollak, et al., 2011). For many college students the sense of community
they gain from the use of social media has a direct impact on their academic experience
(Jones, et.al., 2008). The use of online communities is popular among college students
with 85% being active users (Heiberger & Harper, 2008). As students transition into the
college environment they seek out ways in which to become connected to the university.
For many students, “there is a need for an authentic community that binds them with
others through shared values, ideals, and goals” (Rovai & Ponton, 2005, p. 77). Social
media is a platform that is able to meet this personal need of students and make them feel
like they belong to a community (Stollak et al., 2011). Through this platform students are
able to gain a level of connectedness with the university and other students with similar

57
problems, which can result in positive self-esteem and academic environments (Selwyn,
2009).
Increasing the opportunities, through social media, for college students’ self-
esteem to be improved can facilitate several positive characteristics. One characteristic
students gain from utilizing social media is the ability to stay connected with friends and
family (Ramirez & Broneck, 2009). Maintaining communication with friends and family
can provide students with motivation and positive self-esteem. Social media usage has
been linked to, “decreasing symptoms of loneliness and depression, while increasing
social support and self-esteem” (Junco & Cole-Avent, 2008, p. 10). Having these
positive characteristics provides students with motivation to excel in their academic and
university social lives. Although these positive benefits can be seen from social media it
is the manner in which students overuse it that causes detrimental academic results to
occur.
Summary
The demand and appeal of technology among the college student population
continues to increase worldwide. Social media has become an extremely popular resource
that meets the social needs of students (Pempek et al., 2009). Among all of the social
media networks Facebook™ has become one of the most popular sites with more than
half of the active users being associated with a university network (Heiberger & Harper,
2008). College students have become reliant on the daily use of Facebook™, which has
caused many students to multitask Facebook™ usage with academics. As students
continue to embrace multitasking as a part of daily life, academics will continue to be
impacted (Lee et al., 2011).

58
As college students use Facebook™ to build their social identities and social
capital, experts have studied how influential this has become on academic achievement
(Lee., 2012). Several experts have researched this phenomenon among a predominantly
Caucasian population, but have neglected to focus primarily on African American
students. Since African Americans dominant use of the mobile technology has increased
their Internet and social media usage over the past decade, research is needed to identify
if a relationship is present between Facebook™ usage and this population (Hanson et al.,
2011; Junco, 2012a; Kirschner & Karpinski, 2010). In addition to the African American
population, it is also necessary to identify any gender differences that may be present.
Current research has identified both genders as being frequent Facebook™ users, but
suggested women spend longer amounts of time using it (Thompson & Lougheed, 2012).
Since studies dealing with this topic are limited on African American populations, it is
necessary to look at the gender differences to see if any are present within this
demographic. Some studies suggest that the gender gap for computer usage is closing, so
it is an important variable to measure in this particular study (Imhof et al., 2007).
Throughout all college student populations, Facebook™ use has been shown to
present several challenges to academics as students continue to spend excess amounts of
time using it (Jacobsen & Forste, 2011). However, research has shown that there are
some benefits to the inclusion of Facebook™ within a controlled classroom environment
(Jones et al., 2009). As students continue to increase their reliance on this social media
network many college professors are split on the idea of incorporating it, due to the
mixed results that it has received (Roblyer et al., 2010). As social technology continues to
flourish throughout the world students within this current generation will remain reliant
59
on using it for their communication needs (Hanson et al., 2011). It is important that
specific student populations and demographics, like African Americans and gender, be
studied so that experts can understand who is most affected by this phenomenon and what
steps can be taken to minimize negative influences and maximize positive ones (Wood et
al., 2012). As Facebook™’s popularity increases and more multitasking occurs an
intervention plan is needed by universities to reduce the influence this will have on the
overall academic experience and GPAs of future generations. Within the following three
chapters the methodology used for this study will be explained, the findings will be
examined, and a discussion of the results will be included.

60
CHAPTER THREE: METHODOLOGY
Introduction
The purpose of this regression study was to test the CLT that related Facebook™
use and activity (i.e. daily time spent on Facebook™, multitasking with Facebook™ and
type of Facebook™ activity used while multitasking) to students’ semester GPA, while
controlling for demographic variables (i.e. gender and SES) and academic variables (i.e.
HSGPA, major, classification, self-reported hours per week studying), for undergraduate
African American college students. Students from a four-year, residential, private
university were surveyed to measure the relationship Facebook™ use had on their
academic performance. A hierarchical multiple regression was utilized to show the
relationship between the criterion variable and the predictor variables. In this chapter, I
discuss the design, the research questions and hypotheses, the participants, and the setting
for this study. In addition, the instrumentation, procedures, and data analyses for the
study are described to show the specific methods used for gathering and analyzing the
data.
Design
A cross sectional, predictive research design was chosen to examine the
relationship between African American undergraduate students semester GPAs and
Facebook™ use and activity, while controlling for demographics and academic variables.
The aim of this study was to examine the relationship among variables; thus, this research
design was appropriate (Warner, 2008). A correlational research design identifies the
relationship between variables and explores possible causal relationships, which classifies
it as exploratory research (Gall, Gall, & Borg, 2007). Exploratory research was warranted
on this topic, since few studies have focused on the variables under study and even fewer

61
studies have focused primarily on the African American population (Gall et al, 2007).
This design was also appropriate as previous research had used this type of design to
identify the relationship between Facebook™ usage and other variables of interest and
reported successful results (Junco, 2012a; Junco, 2012b; Junco & Cotten, 2012). Through
the use of this regression design, future studies will be able to use the results to find a
possible causal relationship between the variables and develop additional predictive
models (Gall et al., 2007).
Questions and Hypotheses
The research questions for this study were:
RQ1: Will there be a statistically significant relationship between African
American undergraduate students’ semester GPA and Facebook™ activity (i.e. daily time
spent on Facebook™, multitasking with Facebook™, and type of Facebook™ activity
used while multitasking), while controlling for demographic variables (i.e. gender and
SES) and academic variables (i.e. HSGPA, major, classification, semester credit hours,
self-reported hours per week studying)?
RQ1a: Will there be a statistically significant contribution from demographic
variables (i.e. gender and SES) and academic variables (i.e. HSGPA, major,
classification, semester credit hours, self-reported hours per week studying) to the model
for predicting African American undergraduate students’ semester GPA?
RQ1b: Will there be a statistically significant contribution from the amount of
daily minutes students use Facebook™ to the model for predicting African American
undergraduate students’ semester GPA?

62
RQ1c: Will there be a statistically significant contribution from multitasking with
Facebook™ to the model for predicting African American undergraduate students’
semester GPA?
RQ1d: Will there be a statistically significant contribution from the types of
Facebook™ activities used while multitasking to the model for predicting African
American undergraduate students’ semester GPA?
The following were the research hypotheses:
H1: There will be a statistically significant relationship between African
American undergraduate students’ semester GPA and Facebook™ activity (i.e. daily time
spent on Facebook™, multitasking with Facebook™, and type of Facebook™ activity
used while mutitasking), while controlling for demographic variables (i.e. gender and
SES) and academic variables (i.e. HSGPA, major, classification, semester credit hours,
self-reported hours per week studying).
H1a: The demographic variables (i.e. gender and SES) and academic variables
(i.e. HSGPA, major, classification, semester credit hours, self-reported hours per week
studying) will significantly contribute to the model for predicting African American
undergraduate students’ semester GPA.
H1b: The amount of daily minutes students use Facebook™ will statistically
contribute to the model for predicting African American undergraduate students’
semester GPA.
H1c: Multitasking with Facebook™ will significantly contribute to the model for
predicting African American undergraduate students’ semester GPA.

63
H1d: The types of Facebook™ activities used while multitasking will significantly
contribute to the model for predicting African American undergraduate students’
semester GPA.
Alternatively, the following were the null hypotheses:
H01: There will be no statistically significant relationship between African
American undergraduate students’ semester GPA and Facebook™ activity (i.e. daily time
spent on Facebook™, multitasking with Facebook™, and type of Facebook™ activity
used while multitasking), while controlling for demographic variables (i.e. gender and
SES) and academic variables (i.e. HSGPA, major, classification, semester credit hours,
self-reported hours per week studying).
H01a: The demographic variables (i.e. gender and SES) and academic variables
(i.e. HSGPA, major, classification, semester credit hours, self-reported hours per week
studying) will not significantly contribute to the model for predicting African American
undergraduate students’ semester GPA.
H01b: The amount of daily minutes students use Facebook™ will not statistically
contribute to the model for predicting African American undergraduate students’
semester GPA.
H01c: Multitasking with Facebook™ will not significantly contribute to the model
for predicting African American undergraduate students’ semester GPA.
H01d: The types of Facebook™ activities used while multitasking will not
significantly contribute to the model for predicting African American undergraduate
students’ semester GPA.

64
Participants
For the purposes of this study, a convenience sample of 73 undergraduate, African
American students enrolled in the College of General Studies, School of Health Sciences,
and School of Education at a large, private, evangelical, four-year university in the Mid-
Atlantic was utilized. There were a total of 90 responses with 17 having to be removed
due to incomplete data, therefore 73 responses were used. This specific sample
population was used as it was convenient and accessible to me (Gall et al., 2007). African
American students enrolled in the three academic areas at the chosen university received
an email describing the purpose of the study, how the results were used, information on
the prize drawing, and how to access the survey through the provided link (see Appendix
F). I also recruited participants at the university’s Center for Multicultural Enrichment
Martin Luther King Day celebration event through a three minute announcement about
the study. A power analysis, with an effect size of .5 and a power of .8, indicated a
needed minimum sample size of 70 or more for the chosen analysis (Warner, 2008). To
ensure sufficient participation and achievement of the minimum sample size, a drawing
was conducted for participants to win one of several prizes. Prizes consisted of four $25
Amazon gift cards, a Roku, a $50 Wal-Mart gift card, a Samsung DVD/CD player, and
two five pound chocolate bars that were randomly given to the drawing winners to
motivate them to participate and submit the entire survey. The researcher funded the
Amazon gift cards and chocolate bars, while the Center for Multicultural Enrichment at
the university provided the Roku, Wal-Mart gift card, and Samsung DVD player.

65
Setting
African American undergraduate students from a private, residential, Southern
Association of Colleges and Schools (SACS) accredited, university in the Mid-Atlantic
were used for this study. Students were enrolled in the College of General Studies,
School of Health Sciences, or School of Education. The university is religiously based
and consists of an estimated 1,100 African American residential undergraduate students.
The male to female ratio of enrolled students is 49% and 51%, respectively. The
university is accredited through SACS, and helps prepare students for associate,
baccalaureate, masters, education specialist, and doctoral level degrees. The university
offers 253 total residential and online undergraduate degrees. African American
residential, undergraduate students in the three schools/colleges at this university
received an email with a link to the online survey (see Appendix F).
The survey that participants took was hosted on SurveyMonkey
(http://www.surveymonkey.com), an online survey system, and taken via personal
computers. The online system allowed participants to submit their surveys without any
pressure from outside factors. By providing this type of environment, participants had an
increased likelihood to provide more honest and accurate information. In addition to the
survey, students logged on to their Facebook™ accounts, requested an archival data file,
and submitted the file to provide an accurate time stamp of their Facebook™ activity.
The survey had a set of instructions on how to request, download, and submit the
Facebook™ activity data file. Once the data was collected the results were transferred to
Statistical Product and Service Solutions (SPSS) Version 20 software for analysis.
Students were permitted to use their own personal computers or university library

66
computers to access the survey. Providing students with the option to use their personal
computer or the university library computers created a private environment for the
participants.
The environment under study was the Facebook™ application (see Appendix E).
This social media setting provides its users with the ability to communicate with family,
friends, and acquaintances through a variety of methods. Communication by Facebook™
users is accomplished through posting updates on their Walls, posting pictures and
videos, instant messaging, and updating their profiles. Upon logging on to the social
media network students are shown updated Wall posts of their friends. This type of
setting encourages a high level of communication and enables users to receive updates
about their friends. The Facebook™ setting is not just a blog system where posts are left
on others Walls, since users are also able to communicate in real time through the IM
feature. The Facebook™ features provided to users encourages interaction and allows
easy access to the daily lives of others. This virtual setting was an important aspect of this
study since, all of the predictor variables involve some interaction with Facebook™.
Instrumentation
Criterion Variable
Semester GPA. Academic information used in this study was gained from the
registrar’s office and includes the following criterion variable, semester GPA. Student
permission to request GPA information was gained from the survey consent form, which
was digitally signed prior to the survey (see Appendix C). On the survey, students
provided their university ID numbers. University IDs were used to request from the
registrar GPAs for the semester. Semester GPAs were measured on a 4.0 scale, which is

67
commonly considered a valid measure of academic achievement in higher education
(Bacon & Bean, 2006).
Predictor Variables
Facebook™ usage variables, demographics , and academic variables served as
predictor variables in this study and data was obtain through a research created self-report
survey as well as archival data. The Facebook™ variables included, average daily
minutes of Facebook™ use, Facebook™ use while multitasking with homework, and the
types of Facebook™ activities used while multitasking with homework. The average
daily minutes of Facebook™ use was obtained from the participants Facebook™ activity
time log as archival data. Facebook™ use while multitasking and types of Facebook™
activities used while multitasking with homework was obtained through survey questions
as self-reported data. Academic predictor variables, HSGPA, major, classification, and
semester credit hours were obtained through archival data from the registrar’s office. The
amount of time students spent on homework was acquired as self-reported data from a
survey question (see Appendix A). Demographic variables, including gender, and SES,
were obtained as self reported data through survey questions and were verified through
the registrar’s office report.
Survey development. Established on previously developed surveys for
Facebook™ usage (Swang, 2011; Junco, 2012b) and additional Facebook™ research
(Junco, 2012a; Junco & Cotten, 2012), I created a survey to measure Facebook™
activities as well as demographic and academic variables (see Appendix A). The survey
collected data about Facebook™ use for the purposes of description and explanation.
Content and face validity for the Facebook™ Activity Survey was established with a

68
three expert panel review. The three subject matter experts have doctoral degrees in
educational technology, kinesiology, and distance education with 22, 20, and ten years of
experience in their fields of study. Through their educational backgrounds, one of the
subject matter experts currently works as an instructional technology coordinator for a K-
12 school district, while another expert teaches education technology courses in higher
education. Each expert reviewed the instrument independently using both current
literature and experience to inform their review. Input via written feedback was provided
relative to item readability, suitability, and intelligibility and whether the items were
critical, beneficial, or extraneous in assessing the variables in the study (Tabachnick &
Fidell, 2007). A feedback sheet was used to rate each question; poorly rated questions
were removed or revised. The removal, addition, and modification of questions resulted
in 16 survey questions (see Appendix D). The survey was conducted through
SurveyMonkey.com, an online survey system, so that it was accessible to all participants.
The surveys asked questions to measure Facebook™ activity time, frequency of
multitasking, and types of Facebook™ activities used while multitasking. The survey
also included demographic and academic questions, and provided a set of instructions for
how to download and submit the Facebook™ data file.
Frequency of Multitasking
Question 9 on the survey measured the multitasking trends of the participants (see
Appendix A). The multitasking question for this study included, “After looking at your
Facebook™ report, estimate how many minutes per day you spend multitasking using
Facebook™, while doing homework”. This was an open-ended question in which
69
participants entered a number. The number of minutes were used to identify the total
amount of time participants spent multitasking.
Types of Facebook™ Activities Used while Multitasking
Survey questions also collected data on the types of Facebook™ activities
students used when multitasking. This predictor variable was measured to identify
specific activities on Facebook™ that students engaged in most frequently. Survey
question 13, “On average how often do you participate in the following activities on
Facebook™, while multitasking homework”, measured the types of Facebook™
activities participants used while multitasking and included, updating profile,
downloading videos and pictures, post messages on my Wall, post messages on my New
Feed, live chat, and get help/help others with homework (see Appendix A). The
following Likert-type scale was used, 7= once every 60 minutes, 6= once every 50
minutes, 5= once every 40 minutes, 4= once every 30 minutes, 3= once every 20 minutes,
2= once every 10 minutes, 1= once every minute, 0= never. Individual scale scores were
used to examine the contribution of each activity. Raw scores for each item ranged from
a maximum of 7 to a minimum of 0.
Facebook™ Time
The predictor variable, Facebook™ time, was measured through a Facebook™
activity file submitted through the survey. Student permission to use the submitted
Facebook™ file was gained from the survey consent form, which was signed prior to the
survey (see Appendix C). The Facebook™ activity file is an electronic document students
accessed through their Facebook™ accounts. Students were directed through a set of
instructions to log on to their Facebook™ accounts, select account settings, select

70
download a copy of the Facebook™ data, and then click on start my archive. Students
received an email in two to three hours from Facebook™ once the archive was
accessible. Students then clicked on a link, provided in the email, which redirected them
to the Facebook™ archive, so they could download the file. Within the Facebook™ file,
students saved the account activity form to their computer, attached it to an email, and
sent it to the Principal Investigator with their student ID number in the subject line of the
email. This form contained the date and the individual login times, web session
termination times, and session updates for every access of Facebook™ during a two
month period. The two month period was examined at the end of the semester, so that
students Facebook™ use would be consistent with their semester habits and reflective of
their GPA scores. Average daily minutes of Facebook™ use was established by
calculating the difference between login time and web session termination times daily.
All daily time stamps were added and averaged for data analysis purposes with scores
ranging from an average of 0 minutes a day to 659 minutes a day.
Academic and Demographic Variables
The survey included academic and demographic questions to assess the variables
of HSGPA, major, classification, gender, and SES. Demographic questions 1 and 16 for
this study included, “What is your gender,” and “What is your parents combined yearly
income bracket.” For gender, students were given the option of male or female. For the
SES question students were given eight options that started at less than $24,000 and
ranged up to more than $200,000. This self-reported data was verified through school
records and used to examine gender and SES based on the data provided. Additional data
gained from survey questions 5 and 6, “What is your age,” and “What is your

71
race/ethnicity.” Students were asked to numerically enter their age for question 5, and
were given the options of Caucasian, African American, Latino, Asian, and Other for
question 6. This data provided further demographic information to better describe the
sample and verify ethnicity met the criteria for the study.
Academic information used in this study was gained from the registrar’s office
and included the following variables; HSGPA, academic majors, classification, and
semester credit hours. Student permission to request GPA information was gained from
the survey consent form, which was digitally signed prior to the survey (see Appendix C).
On the survey, students provided their university ID numbers for the purpose of obtaining
the semester GPAs, HSGPAs, majors, classification, and semester credit hours data.
HSGPA was measured on a 4.0 scale, which is a commonly used measurement in higher
education for academic success (Bacon & Bean, 2006). Student majors were based on
specific academic degrees offered in the College of General Studies, School of Health
Sciences, and School of Education. Students were classified by one of the seven majors
offered within these areas. Student classifications consisted of the academic level the
student was at in their academic careers. Classifications included freshman, sophomore,
junior, or senior. Semester credit hours data gained from survey question 3, “What is the
total number of credit hours you are enrolled in this semester”, ensured full time status of
the participants. In addition to academic data gained from the registrar, Questions 2, 4,
and 15 “What is your college level classification,” “What is your major,” and “What is
your unweighted high school GPA,” provided the research with self-reported major,
classification, and HSGPA data of the participants. Information about academics was
gathered and verified with the registrar’s records. The registrar’s data was complete and
72
matched survey data. The information presented in Table 3.1 identifies the theoretical
framework, the variables, measurement and unit of analysis for the variables.
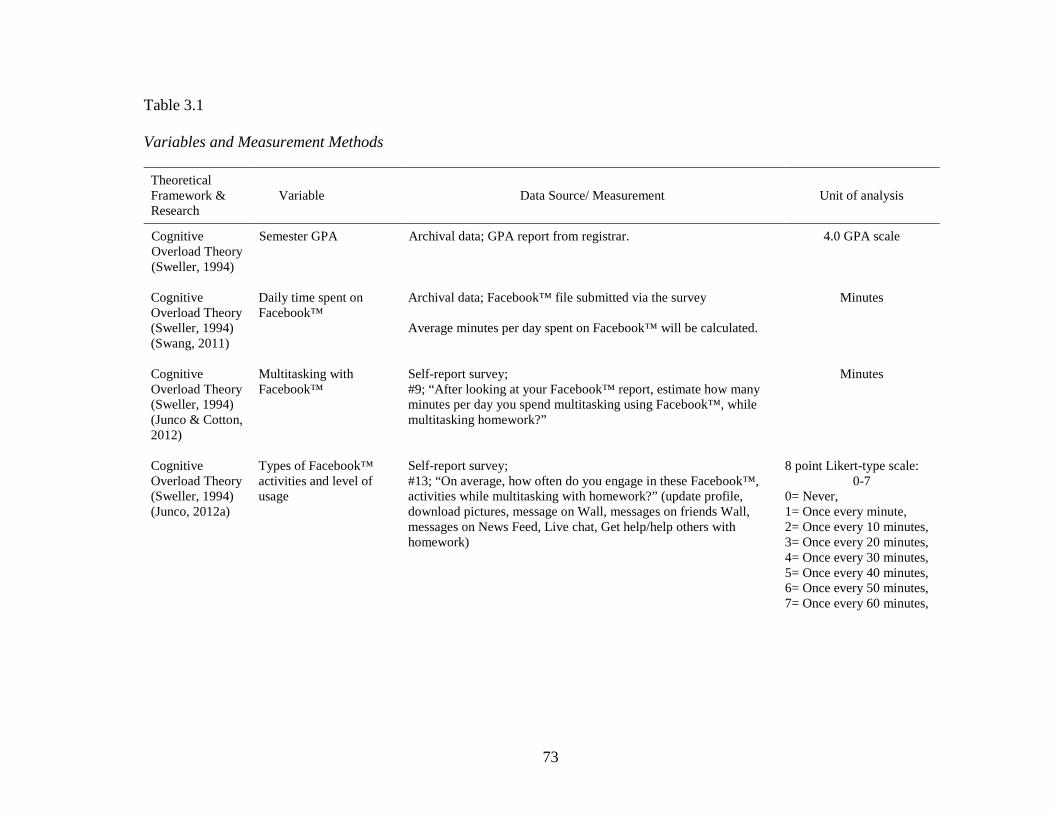
73
Table 3.1
Variables and Measurement Methods
Theoretical Framework & Research
Variable Data Source/ Measurement Unit of analysis
Cognitive Overload Theory (Sweller, 1994)
Semester GPA Archival data; GPA report from registrar. 4.0 GPA scale
Cognitive Overload Theory (Sweller, 1994) (Swang, 2011)
Daily time spent on Facebook™
Archival data; Facebook™ file submitted via the survey Average minutes per day spent on Facebook™ will be calculated.
Minutes
Cognitive Overload Theory (Sweller, 1994) (Junco & Cotton, 2012)
Multitasking with Facebook™
Self-report survey; #9; “After looking at your Facebook™ report, estimate how many minutes per day you spend multitasking using Facebook™, while multitasking homework?”
Minutes
Cognitive Overload Theory (Sweller, 1994) (Junco, 2012a)
Types of Facebook™ activities and level of usage
Self-report survey; #13; “On average, how often do you engage in these Facebook™, activities while multitasking with homework?” (update profile, download pictures, message on Wall, messages on friends Wall, messages on News Feed, Live chat, Get help/help others with homework)
8 point Likert-type scale: 0-7
0= Never, 1= Once every minute, 2= Once every 10 minutes, 3= Once every 20 minutes, 4= Once every 30 minutes, 5= Once every 40 minutes, 6= Once every 50 minutes, 7= Once every 60 minutes,

74
Table 3.1
Variables and Measurement Methods (continued)
Theoretical Framework & Research
Variable Data Source/ Measurement Unit of analysis
Cognitive Overload Theory (Sweller, 1994)
Demographic Data
- Gender
Self-report survey; #1; “What is your gender?”
Male/Female
- Social
Economic Status
Self-report survey; #16; “What is your parents combined yearly income bracket?”
Measurement will be based on the self-reported financial scale?
Cognitive Overload Theory (Sweller, 1994)
Academic Data
- High school GPA (HSGPA)
Self-report survey; #15; “What was your unweighted overall high school GPA?” Verified via archival data gained from the registrar.
Self-reported HSGPA based on a 4.0 scale
- Major Self-report survey; #4; “What is your major?” Verified via archival data
Major
- Classification
Self-report survey; #2; “What is your college level classification?” Verified via archival data gained from the registrar.
Based on the following scale: freshman, sophomore, junior, senior
- Semester Credit Hours
Self-report survey; #3; “What is the total number of credit hours you are enrolled in this semester?”
Self-reported; number of hours
- Minutes per day studying
Self-report survey; #7; “On average, how many minutes per day do you work on homework?”
Self-reported; minutes

75
Procedures
The initial step of this study was to gain approval from the Institutional Review
Board. After gaining approval and submitting the necessary paperwork, I began the
research study. Upon request, the registrar forwarded an email to the undergraduate,
African American students’ enrolled in the College of General Studies, School of Health
Sciences, and School of Education. This email, to elicit participation, described the study,
discussed the prize drawings for those who volunteer, and provided a link to the survey
for students to participate (see Appendix F). Students were also instructed to gather their
Facebook™ data prior to taking the survey. Within the initial email, a deadline was set
for students to complete the survey. One week after the initial email, a second email was
sent out, by the registrar, to remind students about the study, the prizes, and provided the
survey link (see Appendix G). In addition to sending the email, I recruited participants at
the university’s Center for Multicultural Enrichment Martin Luther King Day celebration
event through a 3 minute announcement about the study. Prior to taking the survey,
students electronically signed a consent form providing permission to use their GPA
records and Facebook™ file data for this study (see Appendix C). Students completed
surveys on SurveyMonkey.com, and submitted their results. SurveyMonkey compiled the
completed surveys, prior to their transfer to an SPSS program. The participants’
university identification numbers were submitted to the university registrar and a list of
the participants GPA, HSGPA, major and classification were requested. Once data was
received, access to it was limited to the Principal Investigator and his committee
members. List linking codes to personal identifiers and the survey research data was
stored separately on a password protected computer and in a locked filing cabinet in the

76
Principal Investigator's office for a period of three years. The GPA data from the registrar
and completed surveys were analyzed by me on an SPSS program to find any correlations
between the variables. Results of the analyses were conveyed within the results section of
this study.
Data Analysis
A hierarchical multiple regression with a significance level of .05 was used to
analyze the null hypotheses. Using hierarchical multiple regression analyses allowed the
examination of the strength of the relationship between the variables of interest (Gall et
al., 2007). Prior to data analysis, I conducted assumption testing. Tests were used to
examine the assumption of normality, homoscedasticity, linearity, and extreme outliers.
Histograms were used to measure the distribution of the data to check for normality (Gall
et al., 2007). A scatterplot checked for homoscedasticity and linearity of the data to
ensure the criterion and predictor variables had a linear relationship (Gall et al., 2007). A
probability-probability plot (p-p plot) was included in the analyses to ensure normal
distribution of the residuals. In addition, Cook’s distance was used to identify any
multivariate outliers that could be influential on the overall results. A Cook’s distance of
greater than 1 was considered an influential outlier in the data and was removed prior to
the conduction of analyses (Cook & Weisberg, 1982).
A correlation matrix was also used to assess the relationship among variables to
test the assumption of multicollinearity and singularity. The r value had a small standard
of error and showed the magnitude of the relationship between the variables (Gall et al.,
2007); the strength of the relationship between variables was interpreted through the use
of the correlation coefficient scale of -1.0 to 1.0. Positive correlations were closer to 1.0,

77
negative correlations closer to -1.0, and no correlation between the variables had a
coefficient of zero (Gall et al., 2007). A variance-inflation factor (VIF) identified the
presence or absence of multicollinearity (Warner, 2008). A high VIF score suggested that
there was high multicollinearity present, and a low score suggested low multicollinearity.
The VIF cutoff threshold for this study was a value of 10 (Warner, 2008). A collinearity
diagnostic table in SPSS assessed if there was too much multicollinearity in the data (Gall
et al., 2007). If multiple eigenvalues were close to 0, then the condition indices were
examined to identify any possible issues with multicollinearity (Warner, 2008). A
condition index exceeding 30 suggested serious collinearity problems and one or more of
the predictor variables would be removed (Warner, 2008).

78
Table 3.2
Explanation of Data Analysis Tests
Data Analysis Test Purpose
Hierarchical Multiple Regression Examined the strength of the relationship between the variables
Histograms Measured data distribution to check for normality
Scatterplot Checked for homoscedasticity and linearity of the data
Probability-Probability Plot (p-p plot)
Ensured normal distribution of the residuals
Cook’s Distance Identified multivariate outliers
Correlation Matrix Assessed the relationship among variables to test the assumption of multicollinearity and singularity
Variance-Inflation Factor (VIF) Identified the presence or absence of multicollinearity
Collinearity Diagnostic Table (SPSS)
Assessed if there was too much multicollinearity in the data
The predictor variables were placed into “blocks” or groups, so that the
significance level of the relationship that each had with the criterion variable could be
seen. Block 1 consisted of academic (HSGPA, major, classification, number of minutes
spent on homework) and demographic (gender and SES) data. Block 2 included the
predictor variable daily time spent on Facebook™. Block 3 included the multitasking
with Facebook™ variables. Block 4 included the types of Facebook™ activities used
while multitasking and their level of usage. Each of the variables within the blocks
showed the contribution that was made on semester GPA. The blocks are summarized in
79
Table 3.3. Through this a stronger understanding of which specific variables influenced
the criterion variable was understood.

80
Table 3.3
Data Source Blocks
Data Source Blocks Variables
Block 1
Academic Data HSGPA Major Classification Time spent on Homework Demographic Data Gender SES
Block 2
Daily time spent on Facebook™
Block 3
Multitasking with Facebook™
Block 4 Types of Facebook™ activities and level of usage
Dummy coding was utilized to allow categorical predictor variables to be used in
the analysis procedures. The predictor variables that were assigned this dummy coding
included, student gender and major. The dummy code consisted of a 1 being classified as
the selected answer and a 0 being classified as the other answers that were not selected.
For example, if a student selected nursing as his/her major it was assigned a 1 and all of
the other major options were assigned a 0. Using dummy coding allowed for categorical
predictor variables to be used as nominal data for analysis.

81
Table 3.4
Dummy Coding Example
Male Female
-1 0
0 1
Summary
This non-experimental, regression study examined the relationship between
Facebook™ activity (i.e. daily time spent on Facebook™, multitasking with Facebook™,
and types of Facebook™ activities used while multitasking), and academic performance
for an African American sample population, while controlling for demographic and
academic variables. Similar research studies on this topic have used different analysis
approaches, such as Multivariate analysis of variance (MANOVA) and analysis of
variance (ANOVA) (Hanson et al., 2011; Kirschner & Karpinski, 2010; Junco & Cotten,
2011; Junco et al., 2011). Due to the similar nature of the research, these methodologies
were considered for this study. A MANOVA was not selected as the methodology since,
it required more than one criterion or dependent variable (Gall et al., 2007). An ANOVA
was also not selected for this study since, the participants were not put into groups in
order to identify any differences between the groups (Gall et al., 2007). A hierarchical
regression was selected since, it provided an examination of the strength of the
relationship between the variables of interest and identified specific predictor variables
that had a significant influence on the criterion variable.

82
Table 3.5
Methodologies Considered
Analysis Similar Studies
that Implemented this Analysis
Reason Analysis was Selected or Rejected
Hierarchical Regression
Junco, 2012a; Junco, 2012b; Junco & Cotten, 2012
Allowed me to examine the correlation of specific predictor variables on the criterion variable, which suggests the predictor variables that were most influential (Warner, 2008). This analysis was accepted.
MANOVA Hanson et al., 2011; Kirschner & Karpinski, 2010
Required one or more criterion variable, which did not apply to this study. This analysis was rejected.
ANOVA Junco & Cotten, 2011; Junco et al., 2011; Junco, Elavsky, & Heiberger, 2012
Participants of this current study were not placed into groups for the purposes of examining the differences between each group. This analysis was rejected.
Chapter Three, the data analysis chapter, provided an understanding of the
relationship that each predictor variable had with the criterion variable. Chapter Four,
findings, will follow to provide an explanation of what the results revealed about the
relationships. By thoroughly describing the results in chapter four, a stronger
understanding of how each predictor variable related to the criterion variable was
understood. This enabled me to form an opinion about the results. The explanation within
Chapter Four will help form a discussion about the results, which will follow in Chapter
Five. However, having a strong understanding of the analysis findings, Chapter Four, is
important and helped facilitate a more comprehensive Chapter Five.

83
CHAPTER FOUR: FINDINGS
Introduction
The study examined the relationship between Facebook™ activity and academic
performance of African American college students. It controlled for demographic (gender
and SES) and academic (HSGPA, major, classification, self-reported hours spent
studying per week) variables so more specific results could be achieved. The following
research questions were used to conduct this study:
RQ1: Will there be a statistically significant relationship between African
American undergraduate students’ semester GPA and Facebook™ activity (i.e. daily time
spent on Facebook™, multitasking with Facebook™, and type of Facebook™ activity
used while multitasking), while controlling for demographic variables (i.e. gender and
SES) and academic variables (i.e. HSGPA, major, classification, semester credit hours,
self-reported hours per week studying)?
RQ1a: Will there be a statistically significant contribution from demographic
variables (i.e. gender and SES) and academic variables (i.e. HSGPA, major,
classification, semester credit hours, self-reported hours per week studying) to the model
for predicting African American undergraduate students’ semester GPA?
RQ1b: Will there be a statistically significant contribution from the amount of
daily minutes students use Facebook™ to the model for predicting African American
undergraduate students’ semester GPA?
RQ1c: Will there be a statistically significant contribution from multitasking with
Facebook™ to the model for predicting African American undergraduate students’
semester GPA?

84
RQ1d: Will there be a statistically significant contribution from the types of
Facebook™ activities used while multitasking to the model for predicting African
American undergraduate students’ semester GPA?
The remainder of this chapter will describe the descriptive data, the correlation of the
variables, assumption testing, and the statistical results of the research questions.
Descriptive Data
Demographic data for the 73 participants is presented in Tables 10. Prior to
analyses, all categorical variables, gender and major were dummy coded. The age of the
participants ranged from 18 to 30, with a mean age of 20.78 (SD = 2.10). Among the
participants, 90.4% identified as African American students and 9.6% as Other. The
university grouped African American and Black students within one category, which
explained the 9.6% Other result. The parental combined income of the participants
ranged from less than $24,000 to greater than $200,000 (see Table 4.1). This data
indicated that 56 (76.6%) of the participants SES was in the lower to middle income
class. Academically, student HSGPAs, a positive predictor of college GPAs, had a mean
score of 3.05 (SD = .52). Classification of the participants included 13 (17.8%) freshman,
15 (20.5%) sophomores, 10 (13.7%) juniors, and 35 (47.9%) seniors. The participants
were enrolled in academic majors from one of the following schools, Education 6 (8.2%),
Health Sciences 36 (49.2%), and General Education 31 (42.7%). Participants’ HSGPA,
classification, and major were all self-reported with the results being verified through the
Registrar’s office.
The most frequently used social media devices among the participants were
Facebook™ 45 (61.6%), Twitter 15 (20.5%), while 6 (8.2%) selected Other. Students

85
self-reported accessing social networks through computers 24 (32.9%), mobile devices 10
(13.7%), and a combination of both 33 (45.2%). The participants’ responses to the
variables daily minutes of Facebook™ use, frequency of multitasking and types of
Facebook™ activities used while multitasking included the following mean scores.
Average daily minutes of Facebook™ use, which was verified through the Facebook™
activity file, had a mean score of 353.38 (SD = 195.69). The participants frequency of
multitasking with Facebook™, survey question 9 had a combined mean score of 43.13
(SD = 60.24). The types of Facebook™ activities used while multitasking, survey
questions 13 a-g, had a combined median score of 1.71 (SD = 2.92) based on an eight-
point Likert scale, 0-7. The frequency of the Facebook™ activities, survey question 12 a-
g, had a combined median score of 2.29 (SD = 1.68) based on a six-point Likert scale, 0-
5.

86
Table 4.1 Descriptive Statistics
Variables M/Mdn/n (SD)
Average Daily Minutes of Facebook ™ Use Term GPA HSGPA Credit Hours Age Major SES Class Gender Male Female Schools School of Education School of General Education School of Health Sciences Classification Freshman Sophomore Junior Senior SES Less than $24,000 $25,000-$34,999 $35,000-$49,000 $50,000-$74,999 $75,000-$99,999 $100,000-$149,999 $150,000-$199,999 >$200,000 Social Network Sites Accessed Most Often Facebook™ Twitter LinkedIn Friendster Other
M (SD) 353.38 (195.69) 2.64 ( .75) 3.05 ( .52) 15.49 (2.23) 20.78 (2.10) Mdn (SD) 10.00 (5.89) 4.00 (2.07) 3.00 (1.19) n (%) 43 (58.9%) 30 (41.1%) 6 ( 8.1%) 36 (49.2%) 31 (42.7%) 13 (17.8%) 15 (20.5%) 10 (13.7%) 35 (47.9%) 12 (16.4%) 12 (16.4%) 5 ( 6.8%) 19 (26.0%) 8 (11.0%) 8 (11.0%) 5 ( 6.8%) 4 ( 5.5%) 45 (61.6%) 15 (20.5%) 0 ( 0%) 0 ( 0%) 6 ( 8.2%)

87
Table 4.1 Descriptive Statistics (continued)
Variables M/Mdn/n (SD)
Methods of Accessing Social Networks Computer Mobile Device (cell phone, tablet, e-reader) Both Minutes per day spent on homework Minutes per day spent on Facebook™, while multitasking homework Multitasking with homework while updating my profile Multitasking with homework while downloading/uploading videos and pictures Multitasking with homework while reading and posting messages on my Wall Multitasking with homework while reading and posting on my friends Walls Multitasking with homework reading and posting messages on my News Feed Multitasking with homework while Live Chatting (instant message) with friends Multitasking with homework while getting help/helping others with homework Frequency of Facebook™ activities Updating my profile Downloading/uploading videos and pictures Reading and posting messages on my Wall Reading and posting on my friends Walls Reading and posting messages on my News Feed Live Chatting (instant message) with friends Getting help/helping others with homework
24 (32.9%) 10 (13.7%) 33 (45.2%)
M (SD)
120.42 (81.81) 43.13 (60.24)
Mdn (SD)
.00 (2.89) .00 (2.99) 4.00 (3.01) 4.00 (2.91) 4.00 (2.97) .00 (3.05) .00 (2.59)
3.00 (1.89) 3.00 (1.85) 2.00 (1.42) 2.00 (1.51) 2.00 (1.38) 2.00 (1.75) 2.00 (1.97)
Correlation of Predictor Variables and Semester GPA
Results of the correlation analyses are presented in Table 4.2. The analyses
suggested significant positive and negative relationships between HSGPA and minutes
per day spent on homework with semester GPA. Students with higher HSGPAs were
shown have lower semester GPAs (r =.25, p = .02). Additionally, students who spent
more time on their homework (r = .32, p = .00) showed significantly higher GPA scores
than those who spent shorter periods of time on homework. Gender, academic class,

88
credit hours, major, SES, average daily minutes of Facebook™ use, student multitasking,
and types of Facebook™ activities used while multitasking were not shown to be
significantly correlated to the participants semester GPAs.

89
Table 4.2
Correlation of Predictor and Criterion Variables
1 2 3 4 5 6 7 8 9 10 11 12 13 14 15 16 17 1.Semester GPA - 2.Gender .01 - 3.SES .11 .15 - 4.HSGPA .25* .09 -.24* - 5.Major -.15 -.08 -.11 -.24* - 6.Class -.18 -.11 -.01 -.06 -.10 - 7.Daily Min. spent on HW
.32* -.01 -.11 .23* -.15 -.18 -
8.Credit Hours .09 -06 .07 .09 -.15 .34* -.19 - 9. Facebook™ use (min.)
.03 -.22* -.07 -.10 .17 .04 -.18 .06 -
10. MT Facebook™ & HW
.10 -.03 .04 -.05 .19 .08 -.04 .03 .36* -
11. MT updates & HW
.05 -.07 -.13 .05 -.05 .21* .26* -.02 -.07 -.21* -
12. MT downloads & HW
.03 -.13 -.30* .12 .11 -.19 .21* -.01 -.04 -.04 .70* -
13. MT My Wall & HW
-.04 .03 -.17 .17 .23* .00 .23* .03 -.28* -.48* .44* .38* -
14.MT Friends Wall & HW
-.01 -02 -.30* .16 -.19 .07 .30* .15 -.26* -.49* .58* .42* .77* -
15. MT News Feed & HW
-.12 .01 -.16 .05 -.19 -.02 .31* .10 -.27* -.41* .55* .43* .66* .83* -
16. MT Live Chat & HW
.05 .02 -.13 .15 .20* -.03 .43* .04 -.15 -.22* .59* .37* .57* .61* .54* -
17. MT help/helping HW
.06 -.03 -.26* .17 -.12 -.09 .33* .07 -.16 .00 .49* .56* .56* .57* .49* .49* -
Note: MT = Multitasking; HW = Homework; * p < .05
90
Assumption Testing
Assumption tests were completed to examine the normality, homoscedasticity,
linearity, and extreme outliers for the data set. A histogram revealed an even distribution
of the dependent variable data, which suggested normality of the data set. A probability-
probability plot (p-p plot) revealed a normal distribution of the residuals, which
suggested no significant deviations from normality. A scatterplot showed that the
assumptions homoscedasticity and linearity were tenable and suggested normality of the
data. In addition, a maximum Cook’s distance of .19, suggested no significant problems
with multivariate outliers. A maximum Mahalanobis distance of 45.16 did not exceed the
critical chi-square value, thus suggesting no significant outliers. The variance inflation
factor (VIF) value for all of the variables were significantly below 10 and the tolerance
values were above .10 suggesting collinearity among the variables.
Results of Hierarchical Regression Model
The primary research question sought to identify whether a significant
relationship was present between participants semester GPAs and their Facebook™
activity, while controlling for demographic and academic variables. The variables were
grouped into four blocks so that their significance on the overall model could be
understood. The results of the hierarchical multiple regression used to identify the
significance of the relationship between the variables of interest (semester GPA and
Facebook™ activity) are presented in Table 4.3. The control variables entered into block
1 of the regression, explained 18.7% of the variance in semester GPA, and were
statistically significant, with F (6, 62) = 2.38, p = .04. Survey question 7, “On average,
how many minutes do you work per day on homework” was found to be a statistically

91
significant variable within this block (beta = .28, p = .02). Daily time spent on
Facebook™ was entered into block 2 and accounted for an additional variance of .9% to
the model after controlling for the block 1 variables, R² change (1, 61) = .009, p = .41.
Survey question 7, was also found to be a statistically significant variable within block 2
(beta = .30, p = .02). Block 2 was found to not be statistically significant to the overall
model, F (7, 61) = 2.13, p = .05. Block 3 of the model added the variables, average
minutes per day students spent multitasking Facebook™ and homework, and accounted
for an additional .2% of variance, R² change (1, 60) = .003, p = .62. Survey question 7
was also found to be a statistically significant variable within this block (beta = .29, p =
.03). Block 3 was found to not have a statistically significant contribution to the overall
model, F (8, 60) = 1.87, p = .08. The final block added to the model contained survey
questions 9 and 13 a-g, which dealt with the types of Facebook™ activities, while
multitasking with homework. This block added a variance of 8.7% to the model, R²
change (7, 51) = .09, p = .90, which brought the total variance of all four blocks to
23.9%. Survey question 7 (beta = .31, p = .03) was found to be statistically significant in
the regression model. Block 4 of the model was found to not have a statistically
significant, F (15, 53) = 1.11, p = .37, contribution to the model.
Additional Analyses
It is important to recognize that this study contributed to the literature because it
examined actual use rather than self- report use of Facebook™. A paired samples t-test
was conducted to evaluate the difference between the participants estimated and actual
use of Facebook™, survey question 8 “Estimate how many minutes per day you spend
actively using Facebook™” and their actual use, Facebook™ activity log averages. There

92
was a statistically significant difference between the two variables. Actual Facebook™
use (M =355.03; SD =186.56) was significantly higher than the participants’ reported
self-reported use of Facebook™ (M = 60.03; SD = 79.40). The 95% confidence interval
ranged from -336.21 to -253.79. Although there is a difference, it is important to note that
the Facebook™ variables did not have a statistically significant contribution to the
participants’ semester GPAs.

93
Table 4.3
Hierarchical Regression Model
R² Change F Ratio for R²
Change B SE β t Sig
Block 1 .22 2.15*
Block 2 .01 .46
Block 3 .00 .28
Block 4 .09 .94
Gender .00 .09 .00 -.02 .32
SES .09 .05 .23 1.71 .99
HSGPA .17 .20 .11 .85 .09
Major -.01 .02 -.11 -.79 .40
Classification -.13 .10 -.20 -1.32 .43
Homework per day .00 .00 .31 2.21 .03
Credit Hours .04 .05 .12 .79 .43
Age -.04 .05 -.10 -.73 .17
Average Daily Minutes .00 .00 .08 .56 .47
MT Facebook™ & HW .00 .00 .04 .25 .58
MT Profile & HW -.04 .10 -.09 -.43 .81
MT downloads & HW .08 .11 .15 .76 .67
MT My Wall & HW -.05 .08 -.12 -.55 .45
MT Friends Wall & HW .24 .12 .60 1.97 .58
MT News Feed & HW -.22 .09 -.55 -2.42 .05
MT Live Chat & HW -.02 .08 -.04 -.25 .02
MT help/helping HW -.02 .08 -.04 -.21 .81
Note: MT = Multitasking; HW = Homework; * p < .05; α = .05

94
The descriptive data for this study indicated that Facebook™ was the most
commonly used social media network among the participants. The results suggested that
multitasking Facebook™ activities with homework did not have a statistically significant
influence on students’ semester GPAs. In addition, the amount of time spent studying
was found to be an important predictor of student GPAs. Chapter Five of this study will
discuss the hypotheses, the relationship to similar research, implications of this research,
and limitations and future research to provide a stronger understanding of the results.
This chapter will enable the results to contribute to the current body of literature on this
topic.

95
CHAPTER FIVE: DISCUSSION
Introduction
This non-experimental, regression study examined the relationship between
Facebook™ activity (i.e. daily time spent on Facebook™, multitasking with Facebook™,
and types of Facebook™ activities used while multitasking) and academic performance
for an African American sample population, while controlling for demographic and
academic variables. Based on related literature, this research design and analysis
approach was similar to designs and analyses used in research on this topic (Hanson et.
al., 2011; Junco, 2012b; Junco & Cotten, 2012). The major difference between this study
and similar research was the use of an African American population and the measure of
actual time on Facebook™ using archival data rather than self-report use of Facebook™.
Self-report, however, was utilized for measuring the multitasking variable in this study as
archival data did not reflect this information. African American college students use of
social media has significantly increased, however, previous research utilized limited
African American participants (Junco et. al., 2011; Kirschner & Karpinski, 2010). This
has caused a lack of diversity and reliability for this research topic. A hierarchical
multiple regression was used to analyze if the model could explain the variance of
relationship among African American college students’ semester GPAs. This chapter will
discuss the results of the hypotheses, the relationship of the results to previous research
and theory, the implications of this study, limitations and implications for future research,
and a summary of the results.
96
Results of the Hypotheses
This research study examined the data through a four block hierarchical
regression, so a better understanding of the variables contribution to semester GPA could
be understood. Each block was based on one of the research sub-questions. Block 1
(RQ1a) of the regression examined the relationship of demographic (gender and SES)
and academic (HSGPA, major, classification, semester credit hours, and hours spent
studying) variables on the participants semester GPA. This block suggested a statistically
significant contribution of the academic and demographic variables toward the overall
model. The amount of time students spent studying made the most significant
contribution in the model for block 1 in predicting semester GPA. Approximately 18.7%
of the variance in study time was accounted for by the linear relationship with semester
GPA. The contribution of blocks 2-4 were not significant, therefore I failed to reject the
following null hypotheses, “The amount of daily minutes students use Facebook™ will
not statistically contribute to the model for predicting African American undergraduate
students’ semester GPA,” “Multitasking with Facebook™ will not significantly
contribute to the model for predicting African American undergraduate students’
semester GPA,” and “The types of Facebook™ activities used while multitasking will not
significantly contribute to the model for predicting African American undergraduate
students’ semester GPA.”
The results of the entire model found that there was not a significant relationship
between African Americans’ semester academic performance and Facebook™ activity.
The overall model did suggest that the amount of study time had a statistically significant
contribution on semester GPA; thus, the amount of time spent on studying was shown to

97
influence semester academic performance. It was suggested that students that spent more
time studying, achieved higher semester GPAs. This variable was the most statistically
significant contributor within the entire model and explained 23.9 % of the variance with
semester GPA.
Relationship of the Results to Research and Theory
Similar to this study, previous research that examined the relationship between
Facebook™ use and academic performance considered the influence of demographic and
academic variables (Jones et al., 2009; Junco, 2012b; Junco & Cotten, 2012). Junco and
Cotten (2012) suggested, time spent preparing for class was positively predictive of GPA.
Hanson et al., (2011) suggested, that Facebook™ could be used as a teaching tool, with
time spent focusing on studying resulting in higher GPAs. Roblyer (2010) suggested,
social communications within the classroom, like Facebook™ use, among college
students positively influences their learning. Different from this study, Junco and Cotten
(2011) suggested, that multitasking with Facebook™ was significantly detrimental to
academics. Kirschner and Karpinski (2010) stated, Facebook™ use can result in negative
academic results, but can be used as a positive teaching resource.
The types of Facebook™ activities and the manner in which use has been
measured may be an underlying reason why this current study found Facebook™ use to
have no relationship with semester GPA, while others found that it resulted in positive
and negative consequences (Junco, 2012b; Wood, et al., 2012). Previous research used
self-report measures and limited their study to just estimated Facebook™ time (Junco,
2012a; Junco & Cotten, 2012; Kirschner & Karpinski, 2010). The current study examined
actual usage time via archival Facebook™ data. As additional analysis in this study

98
suggested the students did not accurately estimate their Facebook™ usage time. The
actual usage provided a more accurate measurement of daily minutes for the predictor
variable, Facebook™ use. The Facebook™ activity log provided more accurate data that
differed from other data collection techniques in similar studies (Junco, 2012a; Kirschner
& Karpinski, 2010; Swang, 2011). In addition to daily minutes of Facebook™ usage, the
archival data provided this study with an accurate measurement of the academic and
demographic variables.
This study also examined a diverse population with a sample that was 100%
African American, while previous research lacked diversity (Hanson et. al., 2011; Junco,
2012b; Pempek et al., 2009). This is significant because African Americans use mobile
technology more frequently than any other race, which has contributed to an increase in
their social media use (Lenhart et al., 2010). In addition, research has suggested that
certain student populations, such as African Americans, comprehend knowledge better
when it is presented in a social context (Rovai & Gallien, 2005). As a result of this social
media phenomenon among African Americans, previous research that lacked diversity
recommended future studies address this issue (Junco, 2012b; Junco & Cotten, 2012; Lee
et al., 2011).
Theoretically, this study was grounded in the CLT on the basis that multitasking
or overusing Facebook™ activities could have detrimental results on an individual’s
cognitive capabilities (Sweller, 1994). However, the results of this study indicate that
students were not academically influenced due to the use of Facebook™ during the
academic semester or when multitasking Facebook™ with homework, since their GPAs
were not negatively influenced. This can potentially be explained by the long term

99
relationship that most college students have with technology (Kirschner & Karpinski,
2010). This relationship has caused many students to become dependent on using
Facebook™, which has led to years of constant exposure. Through chronic use and
repetition of technology students cognitive processes are able to increase working
memory capacity as technology use becomes automated (Dingfelder, 2005). Through
repetition Facebook™ use becomes an automated process that uses less working memory,
which potentially explains why the results achieved in this study were not congruent with
the CLT.
Implications of this Study
The results of this study identified future implications of Facebook™ use on
college students. The major implication suggested was the amount of time spent studying
is ultimately the best predictor of GPA. This implication suggested that students who
spent more time preparing for class had an increased likelihood of achieving academic
success. This is consistent with previous research that suggested students could improve
academically if they focus more on their studies (Hanson et al., 2011). This indicated the
need for more emphasis to be placed on academic preparation, since it has been shown to
be an influential factor on student GPAs. The results of this study also suggested the
implication that Facebook™ use with academics does not influence African American
college students’ grades. Previous research stated that African Americans use of social
media was significantly increased due to the availability and popularity of mobile
technology (Jackson et al., 2008). As African Americans increase their use of social
media through mobile technology their ability to multitask academics and social media
becomes easier (Dingfelder, 2005).
100
The results of this study indicated that there was no statistically significant
relationship between Facebook™ activity and semester GPA. This could indicate that the
use of Facebook™ and other social networking technologies may simply be replacing
traditional methods of communication such as the phone. As social media becomes a
commonplace way to communicate, its influence on academics may decrease. As such,
universities that once said technology and media was a detractor from learning may
revisit this philosophy, and recognize social media and technology as a more efficient
way to communicate (Bonk, 2009). Although it is not a direct implication to this study,
previous research has suggested that the use of social media within the college classroom
can positively influence student engagement and grades (Junco et. al., 2011). The use of
social media in class assignments has been shown to provide a motivating factor for
faculty and students to connect (Hanson et. al., 2011). An increase in student motivation
can often result in a positive impact on student engagement, grades, and on personal
psychological aspects (Imhof et al., 2007). By providing more accurate and reliable
results on the impact of Facebook™ use on grades, students and faculty can potentially
positively utilize Facebook™ for academic purposes. Through the incorporation of social
media technology within the academic curriculum the learning environment students
experience and the teaching philosophy of the educators are influenced (Roblyer et al.,
2010). With an online learning environment student populations that typically have high
levels of technology usage or are social learners, like African Americans, could
potentially see positive academic results (Lenhart et al., 2010; Rovai & Gallien, 2005).
This study and previous studies, however, both suggest that further research is needed to
expand the knowledge on this research topic. To understand the influence of utilizing

101
technology in an academic environment future research should examine the influence it
has on student academics and on professors teaching philosophies.
Limitations and Implications for Future Research
Limitations for this study provide ideas for future research. The sample size for
this study was considered small. All African American students enrolled in the College of
General Studies, School of Health Sciences, and School of Education were asked to
participate in the study, however, not everyone responded. Thus nonignorable and
nonresponse was an issue, so care was taken not to make invalid or biased inferences
based on the results (Hausman & Wise, 1979). Further generalizability to a broader
population cannot be extended beyond those sampled. Future research should utilize a
randomly selected population at a Historically Black College or University to ensure a
broader pool of candidates, while adding more diversity to the topic and broader
generalizability.
Omitted variable bias, was considered a threat since, variables that are left out can
be influential on the criterion variable (Hausman & Wise, 1979). To reduce this
limitation necessary variables were included through a thorough review of the literature
on the topic and the addition of variables suggested to be significant in previous models.
However, as research on this topic expands, additional variables may be considered in
model testing.
Errors-in-variables bias, is also considered a threat to internal validity when there
are measurement errors with the predictor variables (Hausman & Wise, 1979).
Attempting to reduce the amount of error within the measurement model was necessary
to allow the results to be more accurate. To reduce the risk for this limitation the study
102
utilized archival data to ensure accurate information for the academic, demographic, and
Facebook™ usage variables. This was the first study to use archival data, so future
research should replicate this study with the use of additional populations. The self-
reported data for Facebook™ multitasking however does not provide accurate
information, since over and under estimates could have occurred. To address these
limitations, future research should incorporate the use of an experimental design with
daily logs or diaries to ensure accurate reporting of Facebook™ multitasking.
Finally, correlational studies are not considered causal research, which limited the
ability of the results to be generalizable. Future research should replicate data collection
procedures for this study and utilize an experimental research design, so the results can
be more generalizable for a larger population. Utilizing control groups is one example of
an experimental study that would increase the generalizability to a broader population.
Within this design approach the treatment group would be exposed to normal
Facebook™ activity, while the control group would have zero exposure for half of the
semester. After switching for the second half of the semester, midterm and final grades
would be compared to identify statistically significant differences between the groups.
Summary
This research study examined the relationship between Facebook™ activities and
semester GPA of African American college students, while controlling for demographic
and academic variables. Through the use of archived Facebook™ data and an African
American student population, this study was unique from others. The results suggested
that the college students were not academically influenced by multitasking Facebook™
and homework. The amount of time spent studying was identified as the best predictor of
GPA within this study, which proves that Facebook™ has the potential to positively
103
influence college students’ academics if it is used in an appropriate manner. Previous
research has identified positive and negative results from Facebook™ use with
academics. Since research on Facebook™ use is still mixed, relatively new, and lacks
diversity, it is important for more research to be conducted so a stronger understanding of
specific influences of Facebook™ use can be understood. The use of Facebook™ and
social media by students will continue to increase yearly, so it is important for institutions
of higher education to be proactive in utilizing social media technology as a positive
academic resource. As future research is conducted, universities and professors need to
identify the positive and negative results of using Facebook™ with academics and
incorporate the beneficial aspects. Through this academic approach future technology
savvy generations will be able to positively benefit from the implemented resources.

104
REFERENCES
Ahmed, A. (2011). Social networking sites and its popularity. International Journal of
Research and Reviews in Computer Science, 2(2), 522-526.
Astin, A. (1984). Student involvement: A developmental theory for higher education.
Journal of College Student Personnel, 25, 297-308.
Bacon, D., & Bean, B. (2006). GPA in research studies: An invaluable but neglected
opportunity. Journal of Marketing Education, 28(1), 35-42.
Baguley, T. (2009). Standardized or simple effect size: What should be reported. British
Journal of Psychology, 100(3), 603-617.
Barnett, E. (2012). Twitter to hit 500 million registered users. Retrieved from
http://www.telegraph.co.uk/technology/twitter/9098557/Twitter-to-hit-500-
million-registered-users.html
Bonk, C. (2009). The world is open: How web technology is revolutionizing education.
San Francisco: Wiley Publishing.
Bowman, L., Levine, L., Waite, B., & Gendron, M. (2010). Can students really
multitask? An experimental study of instant messaging. Computers & Education,
54(4), 927-931.
Boyd, D., & Ellison, N. (2008). Social network sites: Definition, history, and scholarship.
Journal of Computer Mediated Communication, 13, 210-230.
Burak, L. (2012). Multitasking in the university classroom. International Journal for the
scholarship of teaching and learning, 6(2), 1-12.
Chickering, A. W., & Gamson, Z. F. (1987). Seven principles for good practice in
undergraduate education. AAHE Bulletin, 3-7.

105
Chou, C., Condron, L., & Belland, J. (2005). A review of the research on internet
addiction. Educational Psychology Review, 17(4), 363-388.
Cohen, J. (1988). Statistical power analysis for the behavioral sciences. Hillsdale, NJ:
Lawrence Erlbaum Associates.
Cook, D., & Weisberg, S. (1982). Residuals and influence in regression. New York:
Chapman & Hall.
Cotten, S., & Jelenewicz. (2006). A disappearing digital divide among college students.
Social Science Computer Review, 24(4), 497-506.
Dingfelder, S. (2005). A workout for working memory. Monitor on Psychology, 36(8),
48.
Ellis, Y., Daniels, B., & Jauregui, A. (2011). The effect of multitasking on the grade
performance of business students. Research in Higher Education Journal, 1-10.
Ellison, N., Steinford, C., & Lampe, C. (2007). The benefits of Facebook "friends":
Social capital and college students' use of online social network sites. Journal of
Computer Mediated Communication, 12(4), 1143-1168.
Fang, F., Hong, Q., & Shao, J. (2010). Empirical likelihood estimation for samples with
nonignorable nonresponse. Statistica Sinica, 20(1), 263-280.
Gall, M., Gall, J., & Borg, W. (2007). Educational research: An introduction. Boston:
Pearson.
Grasmuck, S., Martin, J., & Zhao, S. (2009). Ethno-racial identity displays on Facebook.
Journal of Computer Mediated Communication, 15, 158-188.

106
Hanson, T., Drumheller, K., Mallard, J., McKee, C., & Schlegel, P. (2011). Cell phones,
text messaging, and Facebook: Competing time demands of today's college
students. College Teaching, 59(1), 23-30.
Hargittai, E. (2008). Whose space? Differences among users and non-users of social
network sites. Journal of Computer Mediated Communication, 13(1), 276-297.
Hargittai, E., & Hinnant, A. (2008). Digital inequality: Differences in young adults' use
of the Internet. Communication Research, 35(5), 602-621.
Hausman, G., & Wise, D. (1979). Attrition bias in experimental and panel data: The Gary
Income Maintenance Experiment. Econometrica, 47(2), 455-473.
Heiberger, G., & Harper, R. (2008). Have you facebooked Astin lately? Using technology
to increase student involvement. New Directions for Student Services(124), 19-35.
Hogg, M., & Hains, S. (1998). Friendship and group identification: A new look at the
role of cohesiveness in groupthink. European Journal of Social Psychology, 323-
341.
Imhof, M., Vollmeyer, R., & Beierlein, C. (2007). Computer use and the gender gap: The
issue of access, use, motivation, and performance. Computers in Human
Behavior, 23(6), 2823-2837.
Jackson, L., Eye, A., Fitzgerald, H., Zhao, Y., & Witt, E. (2010). Self-concept, self-
esteem, gender, race and information technology use. Computers in Human
Behavior, 12(4), 323-328.
Jackson, L., Zhao, Y., Kolenic, A., Fitzgerald, H., Harold, R., & Von Eye, A. (2008).
Race, gender, and information technology use: The new digital divide.
CyberPsychology & Behavior, 11(4), 437-442.
107
Jacobsen, W., & Forste, R. (2011). The wired generation: Academic and social outcomes
of electronic media use among university students. CyberPsychology, Behavior,
and Social Networking, 14(5), 275-280.
Janis, I. (1972). Victims of groupthink. Boston: Houghton Mifflin.
Java, A., Song, X., Finin, T., & Tseng, B. (2007). Why we Twitter: Understanding
microblogging usage and communities. WebKDD (pp. 56-65). New York:
Association for Computing Machinery.
Jones, S., Johnson-Yale, C., & Millermaier, S. (2009). U.S. college students' Internet use:
Race, gender and digital divide. Journal of Computer Mediated communication,
14(1), 244-264.
Jones, S., Johnson-Yale, C., Millermaier, S., & Seoane Perez, F. (2008). Academic work,
the Internet and U.S. college students. The Internet and Higher Education, 11(3-
4), 165-177.
Junco, R. (2012a). The relationship between frequency of Facebook use, participation in
Facebook activities, and student engagement. Computers & Education, 58(1),
162-171.
Junco, R. (2012b). Too much face and not enough books: The relationship between
multiple indices of Facebook use and academic performance. Computers in
Behavior, 28(1), 187-198.
Junco, R., & Cole-Avent, G. (2008). An introduction to technologies commonly used by
college students. New Directions for Student Services, 24, 3-17.
Junco, R., & Cotten, S. (2011). Perceived academic effects of instant messaging use.
Computers & Education, 56(2), 370-378.

108
Junco, R., & Cotten, S. (2012). No A 4 U: The relationship between multitasking and
academic performance. Computers & Education, 59(2), 505-514.
Junco, R., Elavsky, C. M., & Heiberger, G. (2012). Putting Twitter to the test: Assessing
outcomes for student collaboration, engagement, and success. British Journal of
Educational Technology, 1-15.
Junco, R., Loken, E., & Heiberger. (2011). The effect of twitter on college student
engagement and grades. Journal of Computer Assisted Learning, 27(2), 119-132.
Junco, R., Merson, D., & Salter, D. (2010). The effect of gender ethnicity and income on
college students use of communication technologies. CyberPsychology, Behavior
and Social Networking, 13(6), 619-627.
Kalyuga, S. (2011). Cognitive Load Theory: How many types of load does it really need?
Educational Psychology Review, 23(1), 1-19.
Kieras, D., Meyer, D., Ballas, J., & Lauber, E. (2000). Control of cognitive processes:
Attention and performance XVIII. Cambridge: M.I.T. Press.
Kirschner, P., & Karpinski, A. (2010). Facebook and academic performance. Computers
in Human Behavior, 26(6), 1237-1245.
Kuss, D., & Griffiths, M. (2011). Online social networking and addiction: A review of
the psychological literature. International Journal of Environmental Research and
Public Health, 8(9), 3528-3552.
Lee, E. B. (2012). Young, black, and connected: Facebook usage among African
American college students. Journal of Black Studies, 43(3), 336-354.
Lee, J., Lin, L., & Robertson, T. (2011). The impact of media multitasking on learning.
Learning, Media, and Technology, 37(1), 94-104.
109
Lenhart, A., Purcell, K., Smith, A., & Zickuhr, K. (2010). Social media and internet use
among teens and young adults. Washington D.C.: Pew Research Center.
Levine, L., Waite, B., & Bowman, L. (2007). Electronic media use, reading, and
academic distractibility. CyberPsychology & Behavior, 10(4), 560-566.
Lewis, C., & Fabos, B. (2005). Instant messaging, literacies, and social identities.
Reading Research Quarterly, 40(4), 470-501.
Mayer, R., & Moreno, R. (2003). Nine ways to reduce cognitive load in multimedia
learning. Educational Psychologist, 38(1), 43-52.
Mazman, G., & Yasemin, U. (2011). Gender differences in using social networks. The
Turkish Online Journal of Educational Technology, 10(2), 133-139.
Moreno, M., Jelenchick, L., Koff, R., Eikoff, J., Diermyer, C., & Christakis, D. (2012).
Internet use and multitasking among older adolescents: An experience sampling
approach. Computers in Human Behavior, 28(4), 1097-1102.
Pempek, T., Yermolayeva, Y., & Calvert, S. (2009). College students social networking
experiences on Facebook. Journal of Applied Developmental Psychology, 30(3),
227-238.
Ramirez, A., & Broneck, K. (2009). IM me: Instant messaging as relational maintenance
and everyday communication. Journal of Social and Personal Relationships,
26(2-3), 291-314.
Roblyer, M., McDaniel, M., Webb, M., Herman, J., & Witty, J. (2010). Findings on
Facebook in higher education: A comparison of college faculty and student uses
and perceptions of social networking sites. Internet and Higher Education, 13(3),
134-140.

110
Rovai, A., & Gallien, L. (2005). Learning and sense of community: A comparative
analysis of African American and Caucasian online graduate students. The
Journal of Negro Education, 74(1), 53-62.
Rovai, A., & Ponton, M. (2005). An examination of sense of classroom community and
learning among African American and Caucasian graduate students. Journal of
Asynchronous Learning Networks, 9(3), 75-90.
Selwyn, N. (2009). Faceworking: Exploring students' education-related use of Facebook.
Learning, Media, and Technology, 34(2), 157-174.
Spenner, K., Bachmann, C., & Landerman, L. (2004). In the first college year: Evidence
from a new longitudinal case study. Research in Social Stratification and
Mobility, 22, 187-216.
Stollak, M., Vandenberg, A., Burklund, A., & Weiss, S. (2011). Getting social: The
impact of social networking usage on grades among college students. ASBBS
Annual Conference (pp. 859-865). Las Vegas: Sage Publications.
Swang, M. (2011). From Facebook to gradebook: An examination of the relationship
between teen use of social networking sites and academic achievement. Retrieved
from ProQuest Dissertations and Theses.
Sweller, J. (1994). Cognitive load theory, learning difficulty, and instructional design.
Learning and Instruction, 4, 295-312.
Tabachnick, B., & Fidell, L. (2007). Using multivariate statistics. Allyn and Bacon:
Pearson.

111
Tervakari, A.-M., Silius, K., Tebest, T., Marttila, J., Kailanto, M., & Huhtamӓki, J.
(2012). Peer learning in social media enhanced learning environments.
International Journal of Emerging Technologies in Learning, 7(3), 35-42.
Thompson, S., & Lougheed, E. (2012). Frazzled by Facebook? An exploratory study of
gender differences in social networking communication among undergraduate
men and women. College Student Journal, 46(1), 88-98.
Twitter. (2012b). How to use Twitter with Facebook. Retrieved from
http://support.twitter.com/articles/31113-how-to-use-twitter-with-facebook#
van Merriënboer, J., & Sweller, J. (2005). Cognitive load theory and complex learning:
Recent developments and future directions. Educational Psychology Review,
17(2), 147-178.
Warner, R. (2008). Applied statistics. Thousand Oaks: Sage Publications, Inc.
Wickens, C. (2002). Multiple resource and performance prediction. Theoretical Issues in
Ergonomics Science, 3(2), 159-177.
Willingham, D. (2010). Have technology and multitasking rewired how students learn.
American Educator, 34(2), 23-28.
Wood, E., Zivcakova, L., Gentile, P., Archer, K., De Pasquale, D., & Nosko, A. (2012).
Examining the impact of off-task multi-tasking with technology on real-time
classroom learning. Computers & Education, 58(1), 365-374.
Zhao, S., Grasmuck, S., & Martin, J. (2008). Identity construction on Facebook: Digital
empowerment in anchored relationships. Computers in Human Behavior, 24,
1816-1836.

112
APPENDIX
Appendix A
Facebook™ Activity Survey
Student ID#__________________________
Please circle the correct responses:
1. What is your gender? Male Female
2. What is your college level classification?
Freshman Sophomore Junior Senior
3. What is the total number of credit hours you are enrolled in this semester?________
4. What is your major? _______________________
5. What is your age? _____________________
6. What is your race/ethnicity?
Caucasian African American Latino Asian Other
7. On average, how many minutes per day do you work on homework?________
8. After looking at your Facebook™ report, estimate how many minutes per day you spend actively using Facebook™?________
9. After looking at your Facebook™ report, estimate how many minutes per day you
actively participate in Facebook™, while multitasking homework?______
10. Which social networking site do you use most often?
Facebook™ Twitter LinkedIn Friendster Other___________
11. How do you access your social networking site? Computer Mobile Device (cell phone, tablet, e-reader) Both

113
12. On average, how often did you participate in the following activities on Facebook™ this semester?
a. Update my profile: Hourly Daily Weekly Monthly Rarely Never
b. Download/upload videos and pictures:
Hourly Daily Weekly Monthly Rarely Never
c. Read and post messages on my Wall: Hourly Daily Weekly Monthly Rarely Never
d. Read and post messages on my friends Walls:
Hourly Daily Weekly Monthly Rarely Never
e. Read and post messages on my News Feed: Hourly Daily Weekly Monthly Rarely Never
f. Live chat (instant message) with friends:
Hourly Daily Weekly Monthly Rarely Never
g. Get help/help others with homework: Hourly Daily Weekly Monthly Rarely Never
13. On average, how often do you engage in these Facebook™ activities while
multitasking with homework? a. Update my profile:
Once every minute Once every 10 minutes Once every 20 minutes Once every 30 minutes Once every 40 minutes Once every 50 minutes Once every 60 minutes Never
b. Download/upload videos and pictures: Once every minute Once every 10 minutes Once every 20 minutes Once every 30 minutes Once every 40 minutes Once every 50 minutes Once every 60 minutes Never
c. Read and post messages on my Wall: Once every minute Once every 10 minutes Once every 20 minutes Once every 30 minutes Once every 40 minutes Once every 50 minutes Once every 60 minutes Never
d. Read and post messages on my friends Walls: Once every minute Once every 10 minutes Once every 20 minutes Once every 30 minutes Once every 40 minutes Once every 50 minutes Once every 60 minutes Never
e. Read and post messages on my News Feed:

114
Once every minute Once every 10 minutes Once every 20 minutes Once every 30 minutes Once every 40 minutes Once every 50 minutes Once every 60 minutes Never
f. Live chat (instant message) with friends: Once every minute Once every 10 minutes Once every 20 minutes Once every 30 minutes Once every 40 minutes Once every 50 minutes Once every 60 minutes Never
g. Get help/help others with homework: Once every minute Once every 10 minutes Once every 20 minutes Once every 30 minutes Once every 40 minutes Once every 50 minutes Once every 60 minutes Never
14. Does the amount of time you spend on Facebook™ affect your grade point
average (GPA)? a. It helps my GPA b. It hurts my GPA c. It neither helps nor hurts my GPA d. Not Sure
15. What was your unweighted overall high school GPA? ______________
16. What is your parents combined yearly income bracket?
Less than $24,999 $25,000-$34,999 $35,000-$49,999 $50,000- $74,999 $75,000-$99,999 $100,000-$149,999 $150,000- $199,999 >$200,000
Facebook™ File Attachment: (See provided instructions in email) Thank you for completing the Facebook™ Activity Survey.

115
Appendix B
Sample Facebook™ Data Report

116
Appendix C
CONSENT FORM African American College Students Facebook™ Use and It’s Relationship with Academic Outcomes and Gender
Eric Brubaker Liberty University
Department of Education
You are invited to be in a research study on the impact of Facebook™ use on African American college students’ academics. You were selected as a possible participant because you fall within this specific college student population. I ask that you read this form and ask any questions you may have before agreeing to be in the study. This study is being conducted by Eric Brubaker, Department of Education.
Background Information: The purpose of this study is to identify if there is a relationship between African American male and female undergraduate students’ GPAs and Facebook™ use. Procedures: If you agree to be in this study, you will be asked to do the following things: Complete a 5-10 minute survey about your demographics and Facebook™ use. On the survey, you will be asked to provide your student identification number so that current GPA, major, student classification, and demographic information can be obtained from the registrar’s office by the researcher. In addition, you will also be asked to log on to Facebook™ and follow specific steps to request an archived file that includes the times you have logged in and out of Facebook™ over the past 1-2 months. Only the activity time log file will be attached to the survey prior to submission.
Risks and Benefits of Being in the Study:
This study has risks that are no more than you would encounter in everyday life. The survey will contain each participant’s college identification number. This number will only be used for the purposes of retrieving records from the registrar as described above. In addition, the Facebook™ file submitted will have the participant’s name at the top. In order to maintain a level of anonymity each survey will be assigned a random number and the name on the Facebook™ file will be immediately changed to the corresponding survey number. This will help maintain the anonymity of the study and its participants.
The benefits to participation are that university staff and faculty as well as students worldwide will be able to determine the influence of Facebook™ on academic performance. Current research lacks diversity and does not use accurate reporting of GPA records and Facebook™ activity logs. Therefore, this research study would be groundbreaking in providing an increase in diversity and by using never before used methods for collecting data. Compensation:
117
Participants will be entered into a drawing to have the opportunity to win one of several prizes, which include four $25 Amazon gift cards, a Roku, a $50 Wal-Mart gift card, a Samsung DVD/CD player and two 5-pound Hershey chocolate bars. Confidentiality: The researchers will take precautions to protect participant identity by not linking survey information to participant identity. The researcher will not identify participants by name or identify the course number in any of their writings or presentations. The survey will be located on SurveyMonkey, and data will be downloaded and stored on SharePoint. Data stored on the server is kept in a password-protected database and is not shared with anyone. It is conceivable that engineering staff at the web hosting company may need to access the database for maintenance reasons. The information will be stored on this site for the duration of three years and will then be deleted by the researchers. Each survey and Facebook™ profile will be assigned corresponding numbers. Student identification numbers will only be used for the purposes of gaining academic records from the registrar’s office; ID and name will not be linked. The researchers will store all research documentation on a password-protected computer database on their university computers for the duration of three years and will then delete the documentation from the computer database. Data will also be stored on the university secure server via SharePoint for the primary researcher and the dissertation committee to view; it will be deleted 1 year after the finalization of the study. Any hard copies of the data will be stored in a locked filing cabinet and shredded at the end of three years
Voluntary Nature of the Study: Participation in this study is voluntary. Your decision whether or not to participate will not affect your current or future relations with Liberty University. If you decide to participate, you are free to not answer any question or withdraw at any time without affecting those relationships. Contacts and Questions: The researcher conducting this study is Mr. Eric Brubaker. You may ask any questions you have now. If you have questions later, you are encouraged to contact him at (434) 582-7033; [email protected] . You may also contact this student’s advisor with any questions: Dr. Amanda Rockinson-Szapkiw, (434) 582-7423, [email protected]. If you have any questions or concerns regarding this study and would like to talk to someone other than the researcher(s), you are encouraged to contact the Institutional Review Board, Dr. Fernando Garzon, Chair, 1971 University Blvd, Suite 1837, Lynchburg, VA 24515 or email at [email protected]. Due to this being an online consent form a hard copy of this information will be provided to you upon request. Requested copies of the signed consent form will be sent through email.

118
Statement of Consent: I have read and understood the above information. I have asked questions and have received answers. I consent to participate in the study. Electronic Signature (Type name & date): Name:____________________________ Date: ___________
IRB Code Numbers: 1448-111312
IRB Expiration Date: 11-13-2013

119
Appendix D
Instrument Feedback Sheet
Facebook™ Activity Survey Feedback Sheet
For each question please rate its readability, suitability, and intelligibility. Scale scoring will include 1= yes, factors were met within the question, 2= no, these factors were not met and question needs to be revised. Please provide comments at the bottom for questions that received a 2 and need to be advised.
Please select the correct responses:
1. 1 2. 1 3. 1 4. 1 5. 1 6. 1 7. 1 8. 1 9. 1 10. 1 11. 1 12. 1 13. 1 14. 1 15. 1 Comments: 1 applies to all letters within each number. All comments previously given and applied.

120
Appendix E
Facebook™ Application Example
121
Appendix F
Initial Recruitment Email to Participants
Dear Students,
Many experts are seeking to find the impact that Facebook™ use has on college student academics. Research and feedback from African American students is essential in adding diversity to this research topic and finding out the actual impact of Facebook™ use on college students’ grade point averages.
I am requesting your participation in my study in order to help contribute to this research topic by improving knowledge on the impact of Facebook™ use, and providing diversity on this topic.
Students who participate in the study will be entered in a drawing to win one of five $25 Amazon gift cards or one of two 5-pound Hershey chocolate bars. Detailed information about the survey and prizes can be found at the link below.
If you are willing to participate, please read about the study and complete the informed consent located at:
https://www.surveymonkey.com/s/VPFSPF8
Then, complete the survey, which will take 5-10 minutes, and provide me with a copy of your Facebook™ activity log.
Remember that the researcher and the instructor will not be able to directly or through identifiers link the participants to their survey responses.
Thank you for your time and consideration to participate in this study.
Sincerely,
Eric Brubaker, Liberty University

122
Appendix G
Follow Up Recruitment Email to Participants
Dear Students,
This is a follow up to an email you received a few weeks ago requesting your participation in a research study. This study is seeking to find the impact of Facebook™ on African American college students’ academics. Research and feedback from African American students is essential in adding diversity to this research topic and finding out Facebook™’s actual impact on college students’ academics.
Students who participate in the study will be entered in a drawing to win one of five $25 Amazon gift cards or one of two 5-pound Hershey chocolate bars. Detailed information about the survey and prizes can be found at the link below.
If you would be willing to participate in this research, please read about the study and complete the informed consent located at
https://www.surveymonkey.com/s/VPFSPF8
Then, complete the survey, which will take 5-10 minutes, and provide me with a copy of your Facebook™ activity log.
Remember that the researcher and the instructor will not be able to directly or through identifiers link the participants to their survey responses.
Thank you for your time and consideration in participating in this research study.
Sincerely,
Eric Brubaker, Liberty University

123
Appendix H
IRB Approval Letter