the relationship between crime and vacant buildings …
TRANSCRIPT

THE RELATIONSHIP BETWEEN CRIME AND VACANT BUILDINGS IN
THE CITY OF CHICAGO
An Undergraduate Research Scholars Thesis
by
MADISON LEE MOORE
Submitted to the Undergraduate Research Scholars program at
Texas A&M University
in partial fulfillment of the requirements for the designation as an
UNDERGRADUATE RESEARCH SCHOLAR
Approved by Research Advisor: Dr. Cecilia Giusti
May 2017
Major: Urban and Regional Planning

TABLE OF CONTENTS
Page
ABSTRACT .................................................................................................................................. 1
Literature Review.............................................................................................................. 1
Thesis ................................................................................................................................ 2
Theoretical Framework ..................................................................................................... 2
Project Description............................................................................................................ 2
ACKNOWLEDGMENTS ............................................................................................................ 4
NOMENCLATURE ..................................................................................................................... 5
CHAPTER
I. INTRODUCTION ...................................................................................................... 6
Chicago Neighborhoods........................................................................................ 7
Chicago’s Top Five Crimes ................................................................................ 14
II. METHODS ............................................................................................................... 16
III. RESULTS ................................................................................................................. 27
IV. CONCLUSION ......................................................................................................... 30
Policy Implications ............................................................................................. 30
Limitations .......................................................................................................... 31
Future Studies ..................................................................................................... 31
REFERENCES ........................................................................................................................... 32

1
ABSTRACT
The Relationship Between Crime and Vacant Buildings in the City of Chicago
Madison Lee Moore
Department of Landscape Architecture and Urban Planning
Texas A&M University
Research Advisor: Dr. Cecilia Giusti
Department of Landscape Architecture and Urban Planning
Texas A&M University
Literature Review
“Every day, in urban communities across the country, vacant buildings haunt
neighborhoods, blighting the city landscape, lowering surrounding property values, increasing
crime and the risk of fire, and posing hazards for children” (Kraut, 1999). A study at the
University of Pennsylvania in 2013 showed that by greening and improving vacant lots and
buildings led to a decrease in gun crimes and led to a higher perceived safety by residents
(Garvin, Cannuscio, Branas, 2013). In 2012 the City of Chicago’s murder rate had spiked by
over 38% midway through the year and has accounted for at least 59 organized gangs in the city
(Time, 2012). This paper will show the communal impact vacant structures can have. The
significant lack of study in this specific area provides immense opportunity for research but also
does not provide many supporting sources.

2
Thesis
My hypothesis is that vacant buildings help facilitate and promote crime in Chicago. I
also expect that certain crimes and demographics will be more prevalent near abandoned
buildings.
Theoretical Framework
In 1982, James Q. Wilson and George Kelling proposed the broken windows theory. The
theory states that disorder in areas or neighborhoods create fear in citizens and is a gateway for
more serious crimes. The theory was most notably used as the groundwork in the 1990s for New
York City Police Commissioner William Bratton. The commissioner believed that by focusing
on minor crimes and dilapidated areas of the city it would decrease more serious crimes. When
Bratton retired, felonies were down by forty percent and the murder rate was half the previous
count.
Project Description
The City of Chicago is one of the most crime-ridden cities in the United States. It is also
home to a wide range of social disparity and neighborhoods with an abundance of abandoned or
dilapidated structures. My hypothesis is that the abandoned or dilapidated structures have a
correlation to the crime type and rate in their vicinity. My research will prove that abandoned
structures require attention and the importance that should be placed on the rehabilitation and
retrofitting of these structures. To effectively research this project, I will be mapping vacancies
and crimes in Chicago. I also plan to conduct further research into the demographic and
3
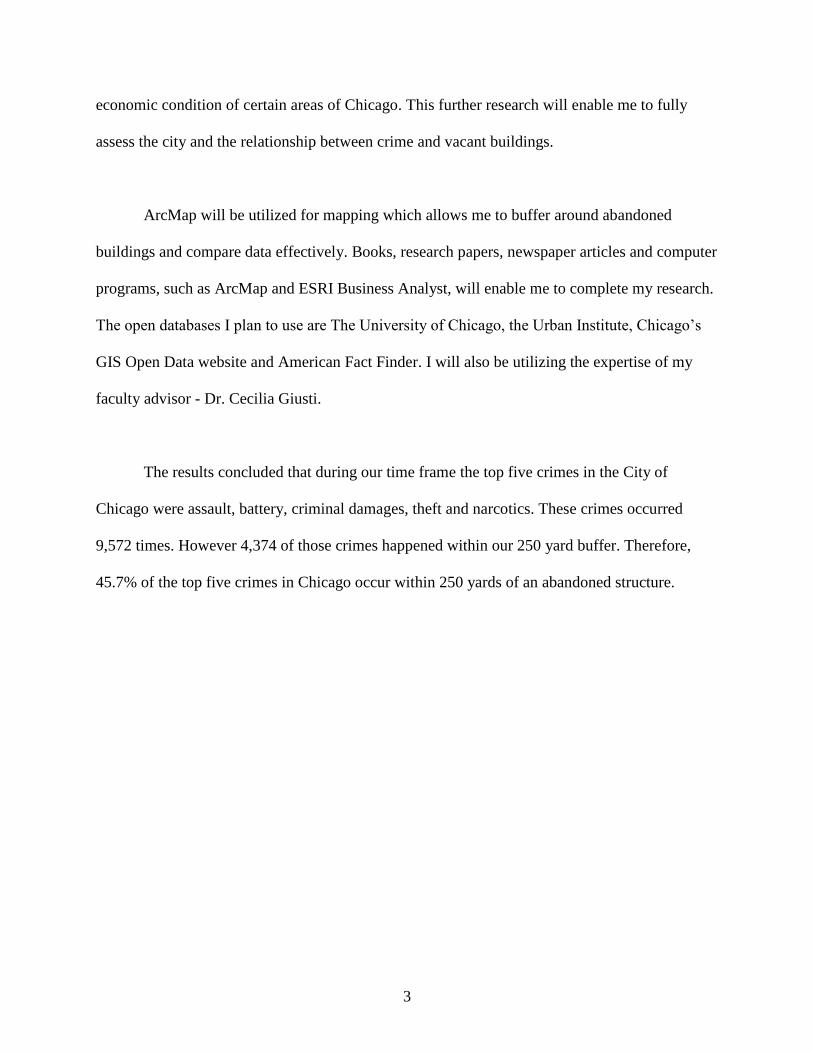
economic condition of certain areas of Chicago. This further research will enable me to fully
assess the city and the relationship between crime and vacant buildings.
ArcMap will be utilized for mapping which allows me to buffer around abandoned
buildings and compare data effectively. Books, research papers, newspaper articles and computer
programs, such as ArcMap and ESRI Business Analyst, will enable me to complete my research.
The open databases I plan to use are The University of Chicago, the Urban Institute, Chicago’s
GIS Open Data website and American Fact Finder. I will also be utilizing the expertise of my
faculty advisor - Dr. Cecilia Giusti.
The results concluded that during our time frame the top five crimes in the City of
Chicago were assault, battery, criminal damages, theft and narcotics. These crimes occurred
9,572 times. However 4,374 of those crimes happened within our 250 yard buffer. Therefore,
45.7% of the top five crimes in Chicago occur within 250 yards of an abandoned structure.
4
ACKNOWLEDGEMENTS
I would like to thank my faculty advisor, Dr. Giusti, and the staff at the Undergraduate
Research Scholars program for their guidance and support throughout the course of this research.
Thanks also go to my classmates and the department faculty and staff for making my
time at Texas A&M University a great experience. Thanks especially go to my classmate, Rene
Schulze, who first started to look at this research topic with me as a class project.
Finally, thank you to my family and friends for their constant encouragement and support
in everything that I do.

5
NOMENCLATURE
GIS Geographic Information Systems
6
CHAPTER I
INTRODUCTION
Cities all across the United States and the world are littered with abandoned buildings and
structures. They have the potential to be abhorrent eyesores that decline not only surrounding
property values but can also promote an increase in crime in the area. While some abandoned
structures are not dilapidated or a hazard they still do not contribute to neighborhoods vibrancy
or sense of place. Some people argue that the presence of an abandoned building does not
promote crime but simply leads to a decreased sense of security for residents. “Every day, in
urban communities across the country, vacant buildings haunt neighborhoods, blighting the city
landscape, lowering surrounding property values, increasing crime and the risk of fire, and
posing hazards for children” (Kraut, 1999). A study at Temple University in 2001 showed that
properties experienced a new loss of value of $7,627 when they were within one-hundred and
fifty feet of an abandoned building in the city of Philadelphia. Also according to Munich RE
over 12,000 fires break out in abandoned structures each year causing over seventy-three million
dollars in damages annually while a study at the University of Pennsylvania in 2013 showed that
greening and improving vacant lots and buildings led to a decrease in gun crimes and led to a
higher perceived safety by residents (Garvin, Cannuscio, Branas, 2013).
There has been very little research in this specific area. However, in 1982 James Q.
Wilson and George Kelling proposed the broken windows theory. The theory states that disorder
in areas or neighborhoods creates fear in citizens and is a gateway for more serious crimes. The
theory was most notably used as the groundwork for New York City Police Commissioner,

7
William Bratton, in the 1990s. The commissioner believed that by focusing on reducing minor
crimes and enhancing dilapidated areas of the city it would decrease more serious crimes. When
Bratton retired felonies were down by forty percent and the murder rate was half of the previous
count. It is widely known and believed that abandoned structures promote crime but there is very
little factual proof or studies to back up that claim.
The purpose of my research is to show the relationship between abandoned buildings and
the crime in an area. My hypothesis is that the abandoned or dilapidated structures have a
correlation to not only the crime rate but also the types of crimes that occur in their vicinity.
I chose Chicago, Illinois because it is one of the most crime ridden cities in the United
States. Chicago sits on Lake Michigan and is known for its bold architecture and art. It is the
third largest U.S. city with a 2014 population of 2,722,380 people while the metro area was
home to nearly ten million people. Chicago is two-hundred and thirty-seven square miles and is
an international hub for finance, commerce, industry, technology, telecommunications, and
transportation.
Chicago Neighborhoods
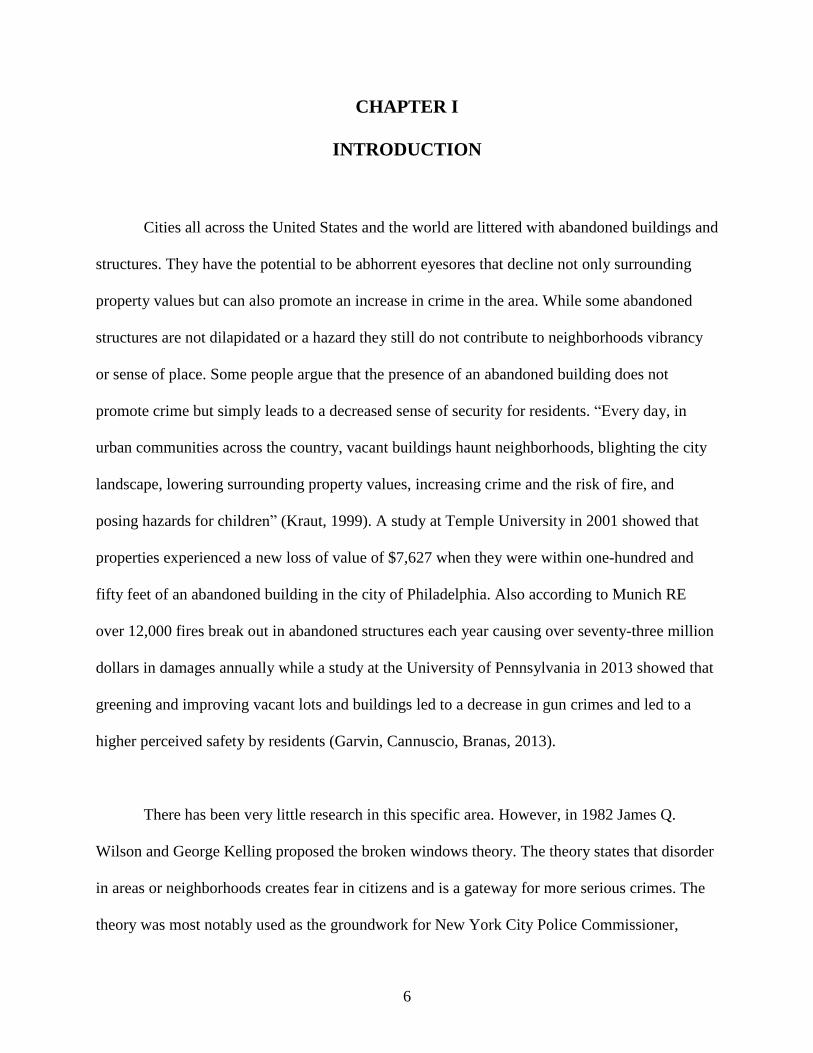
Chicago is divided into seventy seven distinct neighborhoods, shown in the map below.
There are over fifty communities within these neighborhoods with each neighborhood being
distinct, vibrant and proud. The Central Business District, or heart of Chicago business, is shown
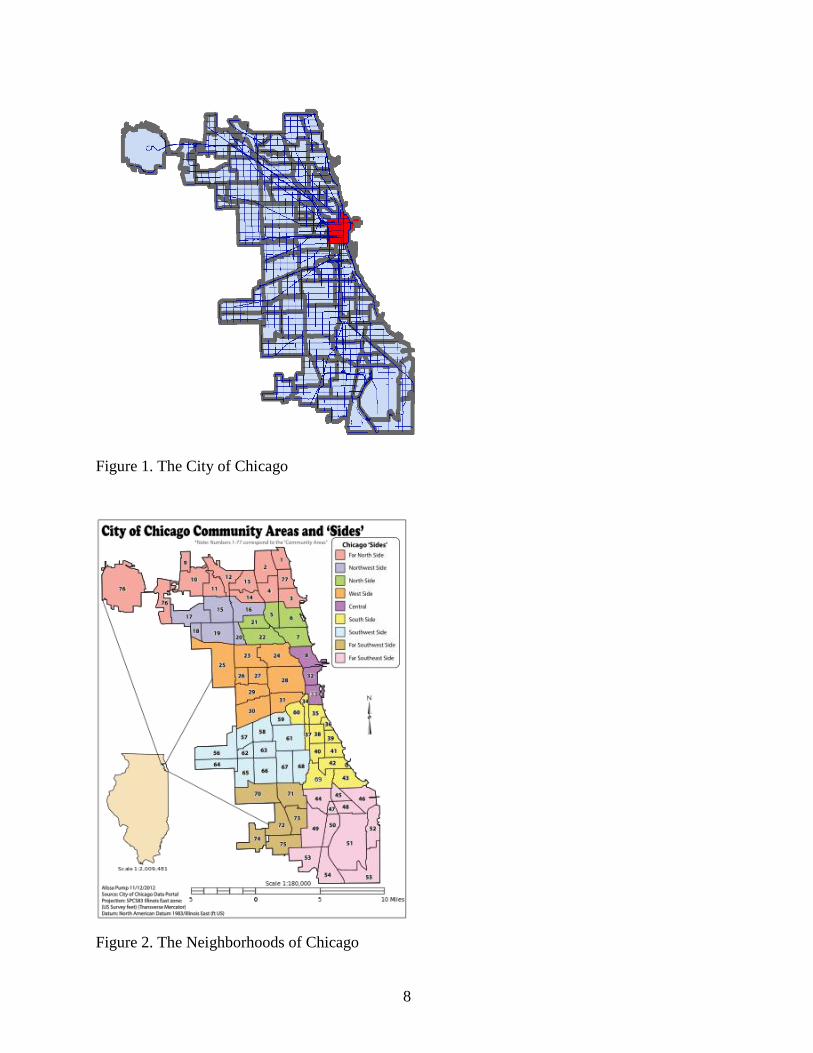
in red on Figure 1. On a much larger scale Chicago is broken down into four districts: North,
South, West and Downtown, as shown in Figure 2.
8
Figure 1. The City of Chicago
Figure 2. The Neighborhoods of Chicago

9
Chicago Neighborhoods:
Albany Park
Andersonville
Avondale
Belmont Cragin
Boystown
Dunning
Edgewater
Galewood
Goose Island
Hermosa
Irving Park
Jefferson Park
Lakeview
Lincoln Park
Lincoln Square
Logan Square
Montclare
North Center
North Park
Norwood Park
Old Town
O’Hare

10
Portage Park
Rogers Park
Roscoe Village
Uptown
West Ridge
Wicker
Park/Bucktown
Wrigleyville
West Chicago Neighborhoods:
Austin
Garfield Park
Humboldt Park
Little Italy/University Village
Little Village
North Lawndale
Pilsen
United Center
West Loop
West Town
Downtown or Central Neighborhoods:
Chinatown

11
Gold Coast
Loop
Magnificent Mile
South Loop
Streeterville
People identify with these neighborhoods. While one person can be from Uptown another
can be from Lincoln Park and while they both reside in the City of Chicago their daily life and
view of the city can be very different. The Boystown neighborhood is home to one of the largest
gay, transgender and bisexual communities in the United States while Chicago’s Humbolt Park
neighborhood is home to a large Latino community. The neighborhood of Chinatown is home to
over sixty-thousand Chinese residents and the neighborhood of Bridgeport is a community of
largely working class people. The neighborhoods of Chicago are the communities that people
live in, identify with and call home.
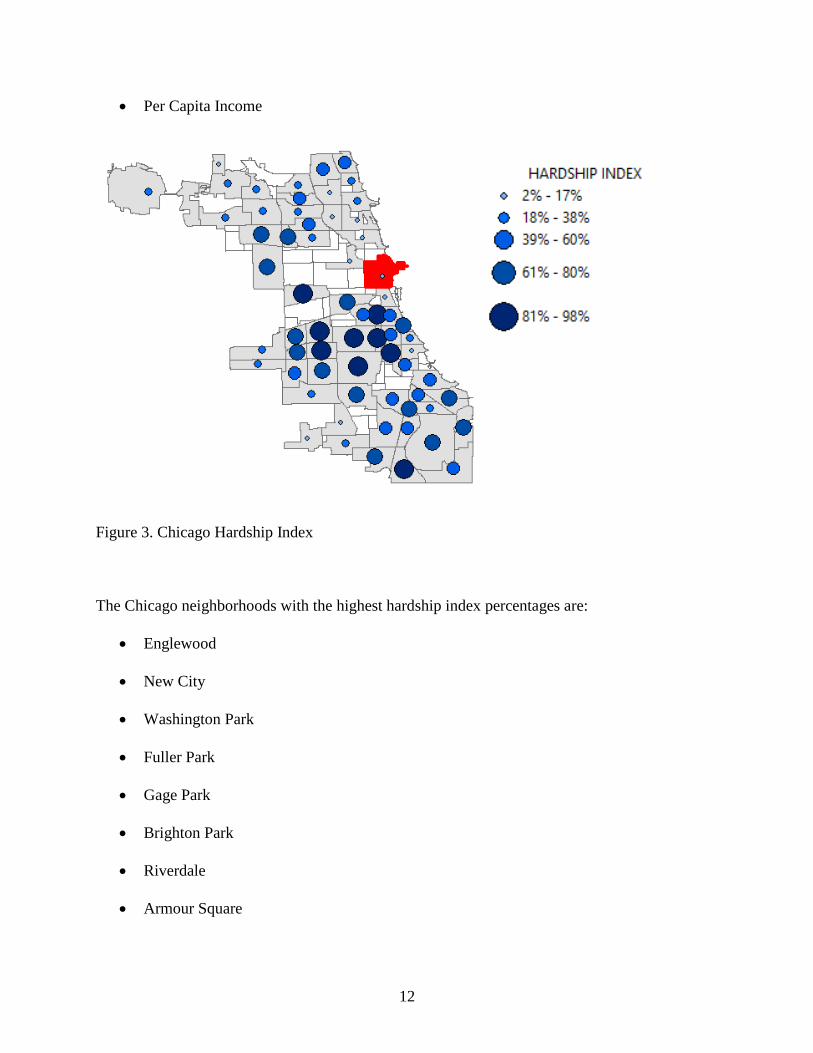
Hardship Index
The Hardship Index takes into account six socioeconomic indicators of public health
(Moser, 2012):
Crowded Housing (%) - More than one person per room
Households Below Federal Poverty Level (%)
Unemployed Age 16+ (%)
Age 25+ Without High School Diploma (%)
Population Under 18 and Above 64 (%)
12
Per Capita Income
Figure 3. Chicago Hardship Index
The Chicago neighborhoods with the highest hardship index percentages are:
Englewood
New City
Washington Park
Fuller Park
Gage Park
Brighton Park
Riverdale
Armour Square

13
This demonstrates that the south and west sides of Chicago have the higher concentration of
poverty.
Poverty and Unemployment
The map below, Figure 4, is representative of the percent of the population that is sixteen
years old or above that is unemployed per neighborhood. This is a factor that contributes to the
hardship index.
Figure 4. Chicago Poverty and Unemployment

14
The Chicago neighborhoods with the highest poverty and unemployment percentages are:
Englewood
Auburn Gresham
Riverdale
Washington Park
Fuller Park
Chicago’s Top Five Crimes
Many crimes plague the City of Chicago. During the time span of this study there were
over 240,469 crimes reported. The top five crimes in the City of Chicago for this studies time
span were:
Theft: 33.6%
Battery: 25.8%
Criminal Damage: 16.2%
Narcotics: 16%
Assault: 8.4%
The Chicago Tribune broke down the neighborhoods with the highest violent crimes,
property crimes and quality of life crime rates.
Violent Crime Rates
1. Fuller Park
2. West Garfield Park

15
3. North Lawndale
4. Greater Grand Crossing
5. East Garfield Park
Property Crime Rates
1. Loop
2. Fuller Park
3. Near North Side
4. Near West Side
5. Washington Park
Quality-of-Life Crime Rates
1. West Garfield Park
2. Fuller Park
3. East Garfield Park
4. North Lawndale
5. Austin
The City of Chicago is a diverse, multicultural city. This research will holistically look at
Chicago, its crime and the contribution vacant and abandoned structures make to the quality and
lifestyle of a community.
16
CHAPTER II
METHODS
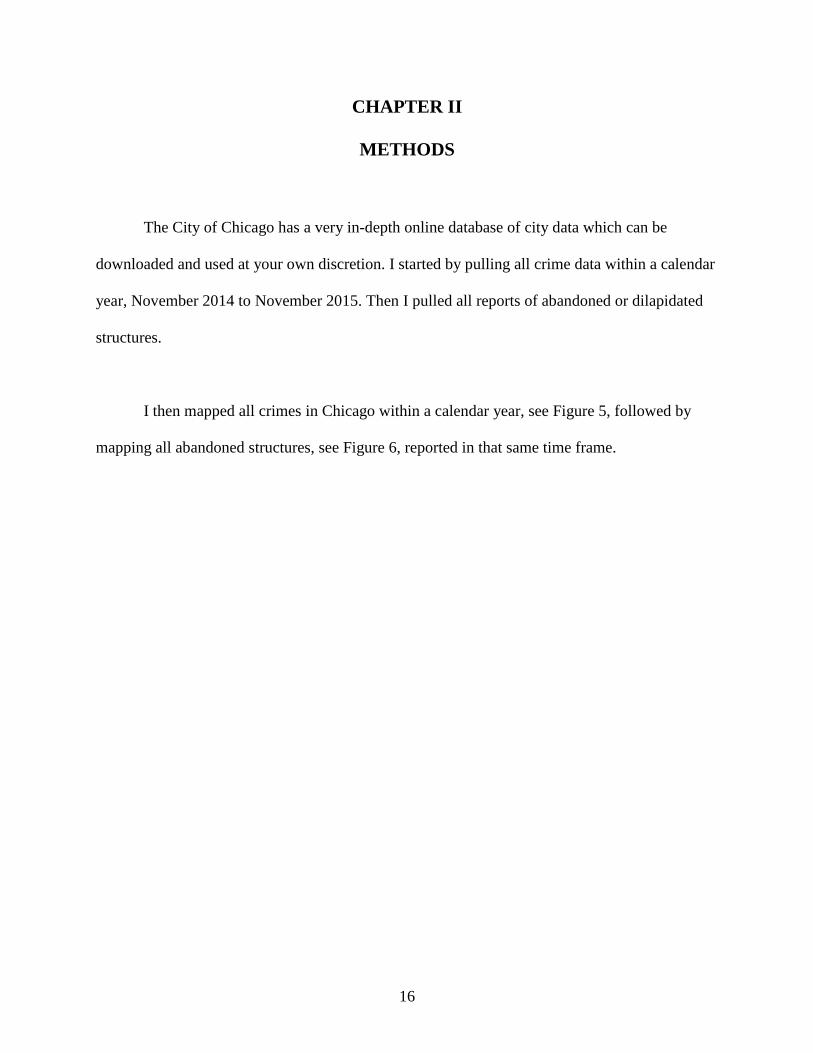
The City of Chicago has a very in-depth online database of city data which can be
downloaded and used at your own discretion. I started by pulling all crime data within a calendar
year, November 2014 to November 2015. Then I pulled all reports of abandoned or dilapidated
structures.
I then mapped all crimes in Chicago within a calendar year, see Figure 5, followed by
mapping all abandoned structures, see Figure 6, reported in that same time frame.
17
Figure 5. Chicago Crimes from November 2014-2015

18
Figure 6. Chicago Vacant Buildings from November 2014-2015
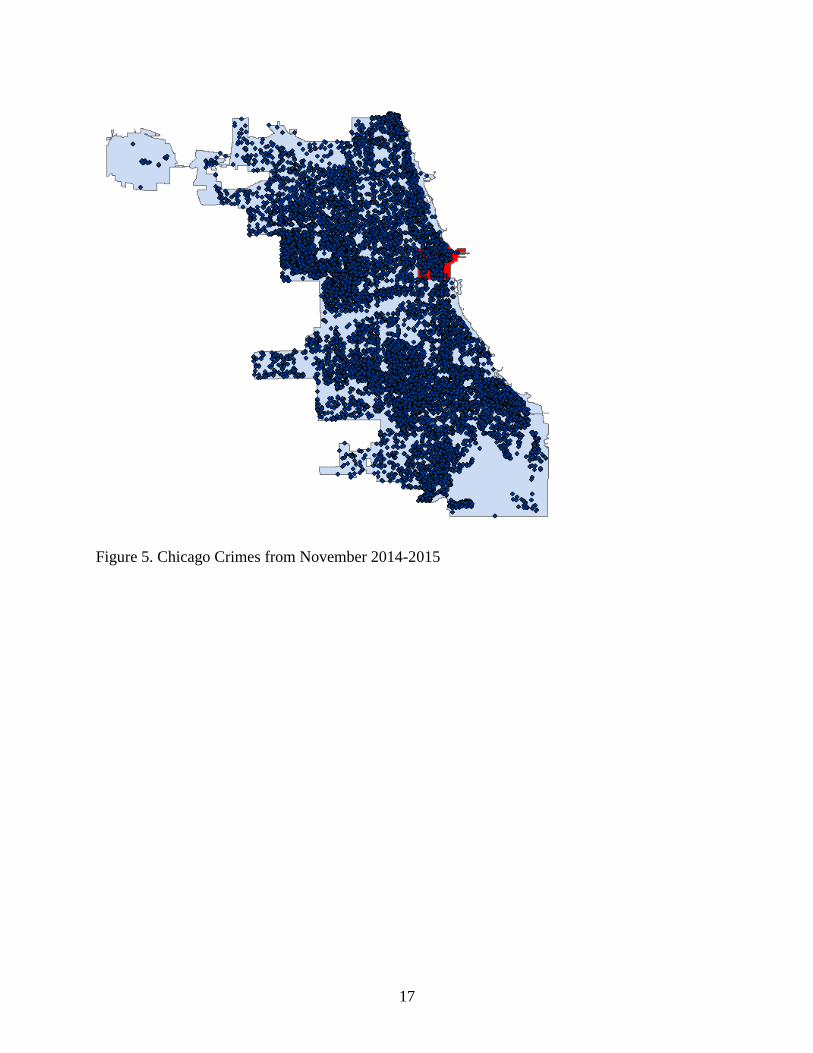
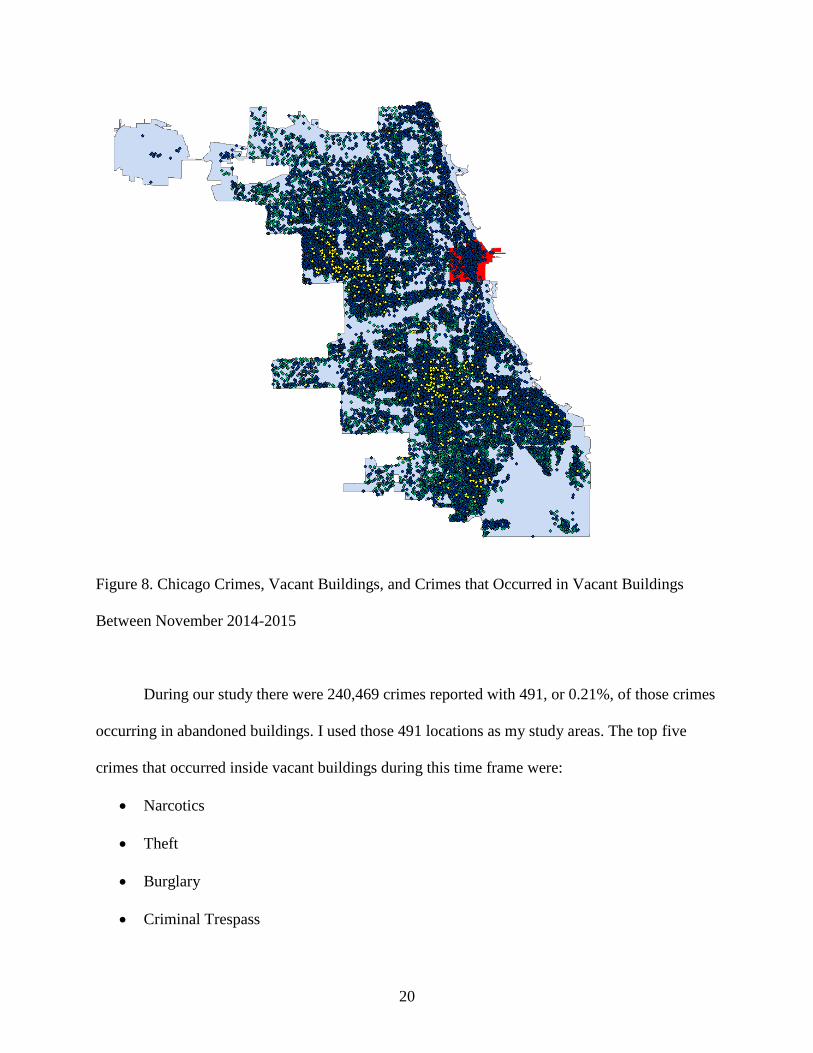
After that I mapped crimes that had taken place in an abandoned structure from
November 2014 to November 2015, see Figure 7. Next I overlaid the map of the crimes that
occurred in abandoned structures over the map displaying all Chicago crimes and vacant
buildings in my time frame, see Figure 8, to see if a pattern emerged.

19
Figure 7. Crimes that Occurred in Vacant Buildings in Chicago from November 2014-2015
20
Figure 8. Chicago Crimes, Vacant Buildings, and Crimes that Occurred in Vacant Buildings
Between November 2014-2015
During our study there were 240,469 crimes reported with 491, or 0.21%, of those crimes
occurring in abandoned buildings. I used those 491 locations as my study areas. The top five
crimes that occurred inside vacant buildings during this time frame were:
Narcotics
Theft
Burglary
Criminal Trespass
21
Criminal Damage
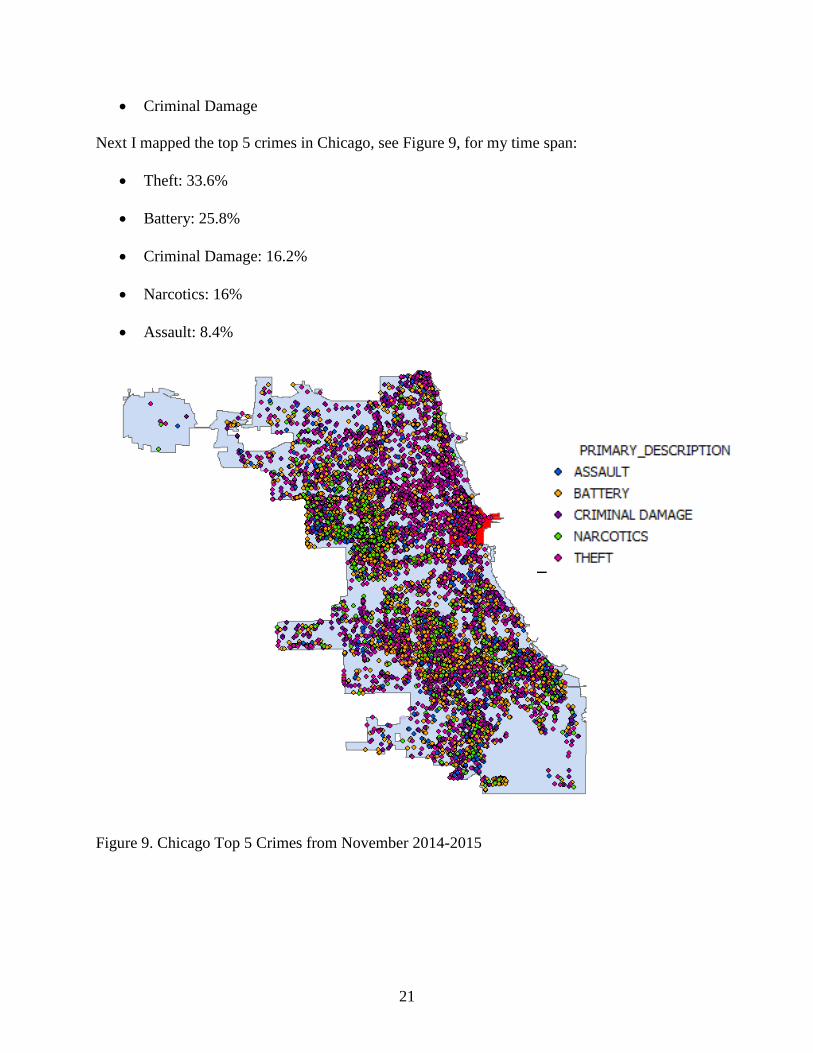
Next I mapped the top 5 crimes in Chicago, see Figure 9, for my time span:
Theft: 33.6%
Battery: 25.8%
Criminal Damage: 16.2%
Narcotics: 16%
Assault: 8.4%
Figure 9. Chicago Top 5 Crimes from November 2014-2015

22
Following that I mapped the top 5 crimes in Chicago and the crimes that occurred in
abandoned buildings together to see if there was any correlation, see Figure 10.
Figure 10. Chicago Top 5 Crimes and the Crimes that Occurred in Vacant Buildings from
November 2014-2015
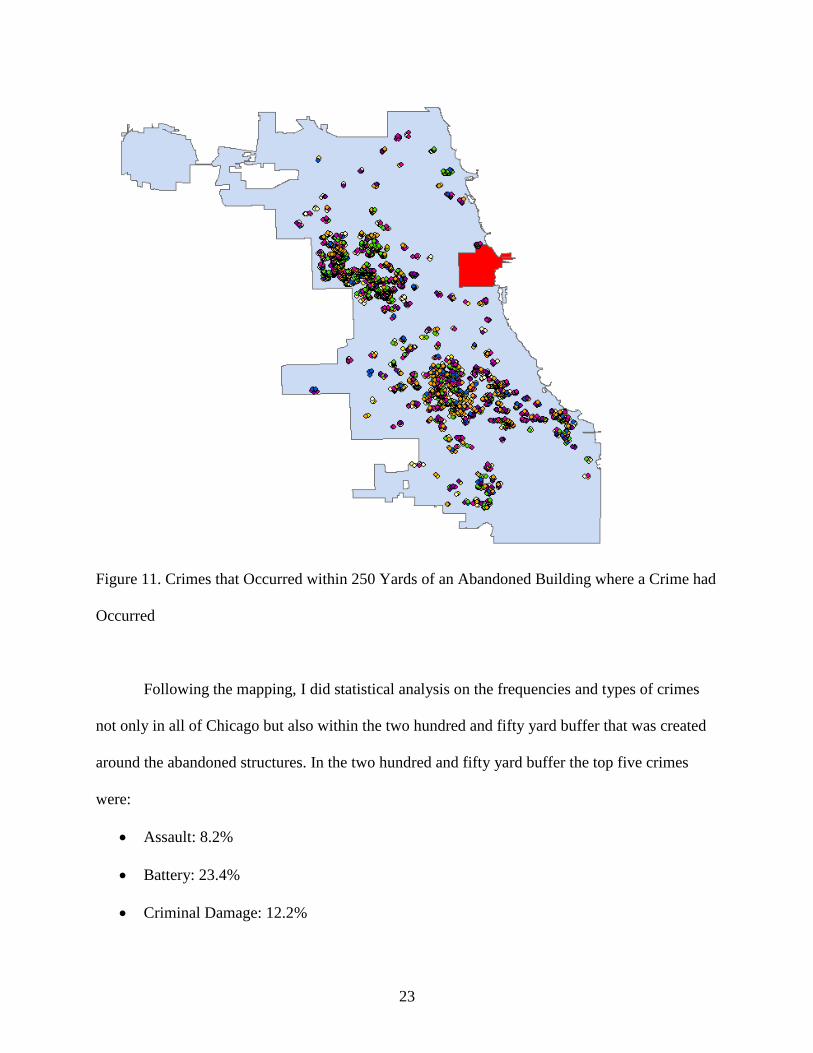
Then I placed a two hundred and fifty yard buffer around each abandoned structure that
was associated with a crime and mapped all of the crimes that fell within that boundary, see
Figure 11.
23
Figure 11. Crimes that Occurred within 250 Yards of an Abandoned Building where a Crime had
Occurred
Following the mapping, I did statistical analysis on the frequencies and types of crimes
not only in all of Chicago but also within the two hundred and fifty yard buffer that was created
around the abandoned structures. In the two hundred and fifty yard buffer the top five crimes
were:
Assault: 8.2%
Battery: 23.4%
Criminal Damage: 12.2%
24
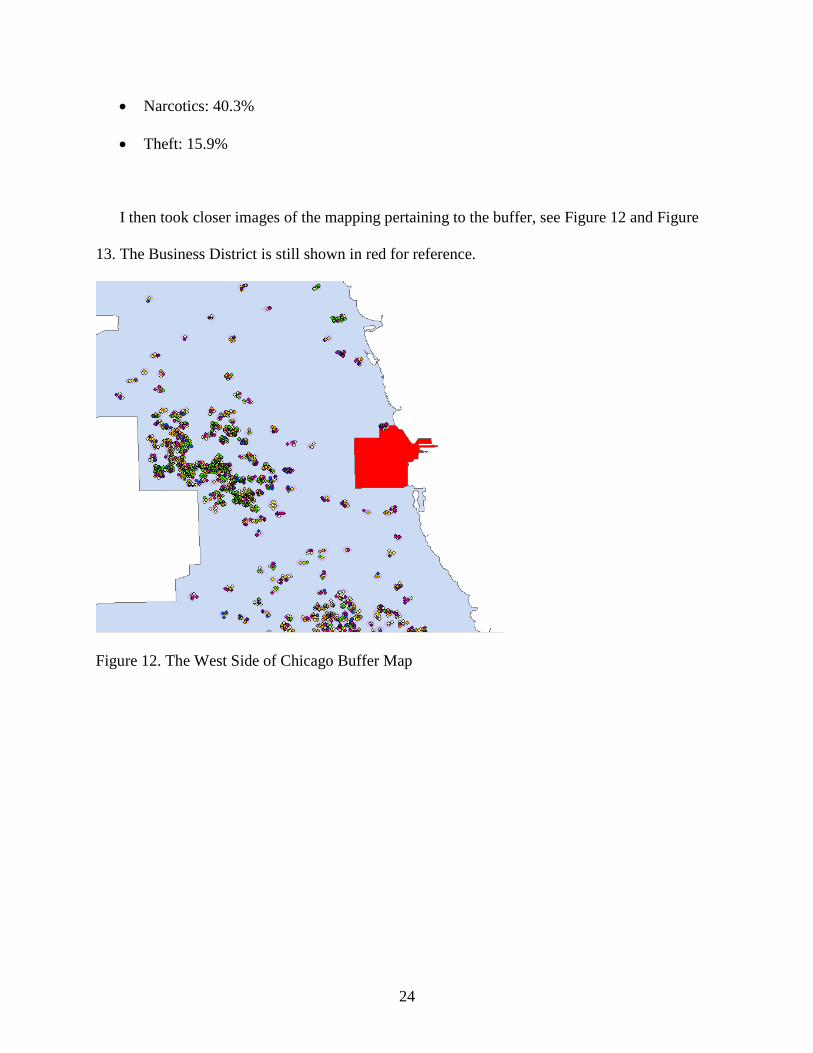
Narcotics: 40.3%
Theft: 15.9%
I then took closer images of the mapping pertaining to the buffer, see Figure 12 and Figure
13. The Business District is still shown in red for reference.
Figure 12. The West Side of Chicago Buffer Map
25
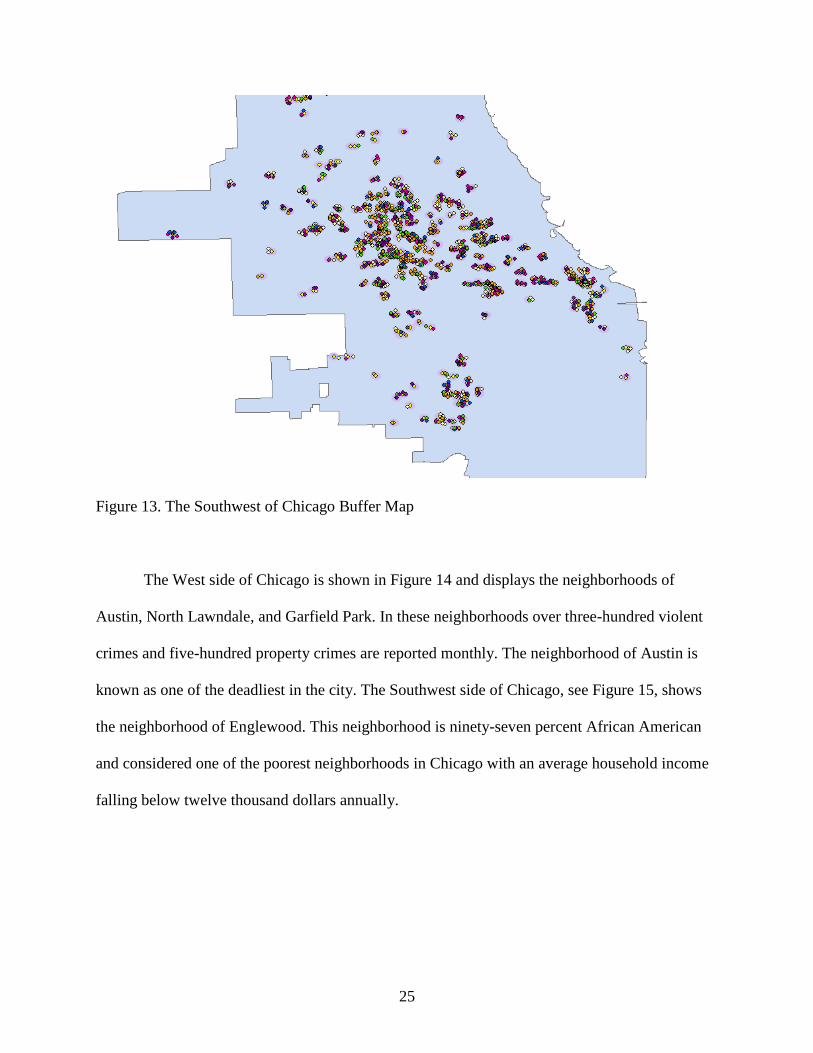
Figure 13. The Southwest of Chicago Buffer Map
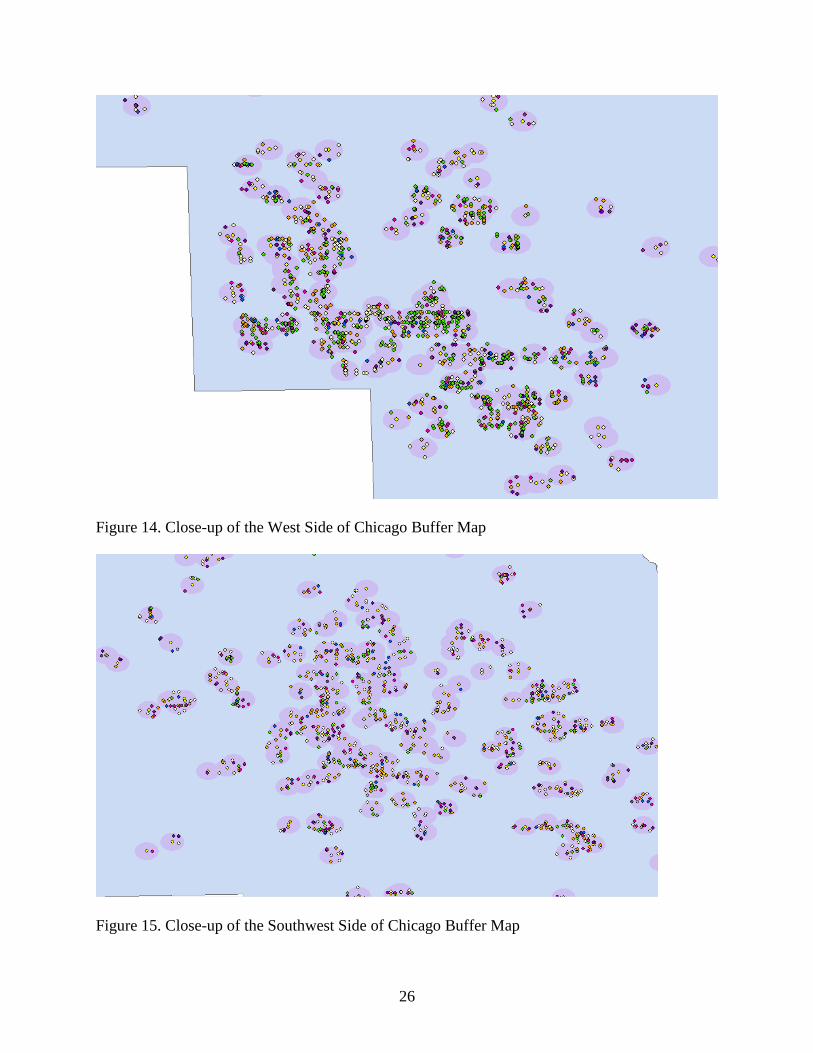
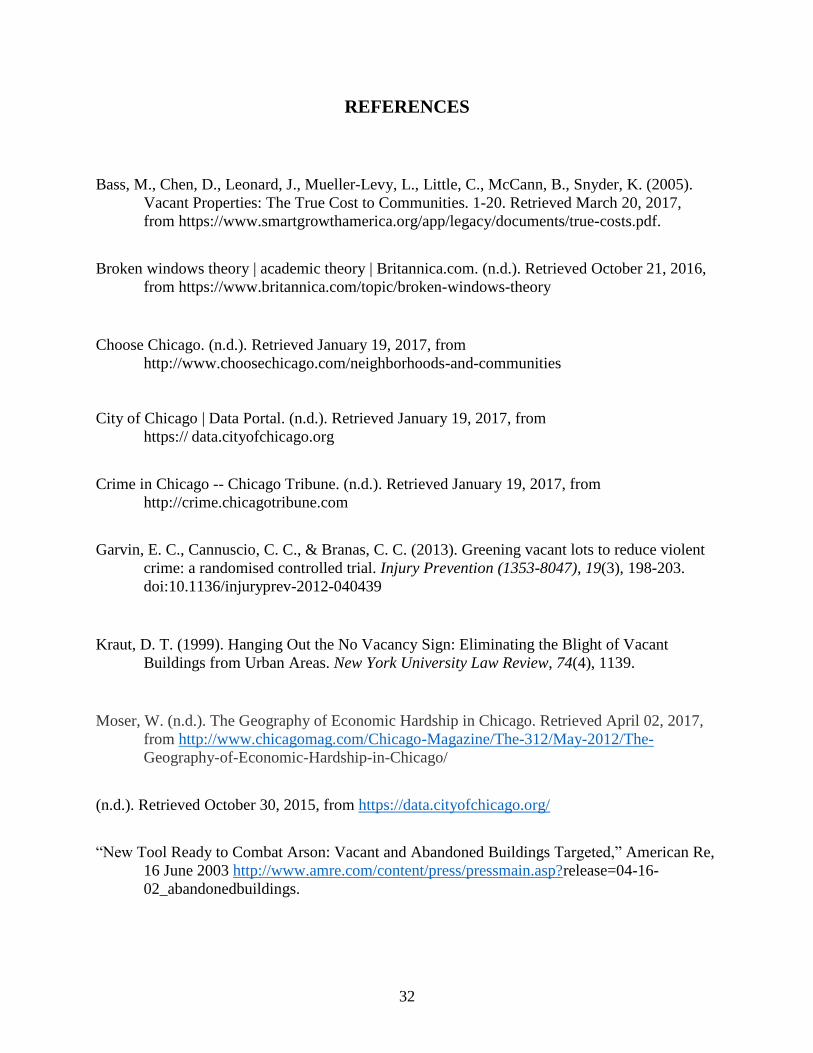
The West side of Chicago is shown in Figure 14 and displays the neighborhoods of
Austin, North Lawndale, and Garfield Park. In these neighborhoods over three-hundred violent
crimes and five-hundred property crimes are reported monthly. The neighborhood of Austin is
known as one of the deadliest in the city. The Southwest side of Chicago, see Figure 15, shows
the neighborhood of Englewood. This neighborhood is ninety-seven percent African American
and considered one of the poorest neighborhoods in Chicago with an average household income
falling below twelve thousand dollars annually.
26
Figure 14. Close-up of the West Side of Chicago Buffer Map
Figure 15. Close-up of the Southwest Side of Chicago Buffer Map

27
CHAPTER III
RESULTS
The city of Chicago is one of the most crime ridden cities in America. In the calendar
year I am studying, November 2014 to November 2015, there were nearly a quarter of a million
crimes committed in the city. Nearly five hundred of those crimes took place in an abandoned
structure. The top five overall crimes in the city of Chicago are:
Assault: 8.4%
Battery: 25.8%
Criminal Damage: 16.2%
Narcotics: 16%
Theft: 33.6%
The top five crimes in Chicago occurred 9,572 times in the calendar year of this study.
The top overall crime committed in Chicago is theft. While the top five crimes Chicago that
occurred in or within two-hundred and fifty yards of an abandoned building where a crime had
already occurred are:
Assault: 8.2%
Battery: 23.4%
Criminal Damage: 12.2%
Narcotics: 40.3%
Theft: 15.9%

28
The top five crimes occurred in the buffer 4,374 times that year. The top crime
committed near or in an abandoned building is narcotics. The comparison of the top five crimes
in Chicago and the top five crimes in or near an abandoned building, Figure 16, is shown below.
Figure 16. Top 5 Crimes in Chicago versus Top 5 Crimes within the 250 yard Buffer
The rate of occurrence for crimes such as assault, battery and criminal damage were
hardly impacted by their proximity to an abandoned building. However the rate of theft and
narcotics were greatly impacted by proximity to abandoned buildings where a crime had already
occurred. The theft rate was cut in half from thirty-four percent to sixteen percent. A possible
explanation for this decrease of theft within the buffer is that there may be little of value to take

29
near or in an abandoned structure and if something was taken from an abandoned structure it is
highly likely it would go unreported.
However within the two-hundred and fifty yard buffer narcotics rose to forty percent of
the crimes while it was only sixteen percent of the top five crimes citywide. This sharp rise in the
use of narcotics within two-hundred and fifty hards of an abandoned structure where a crime had
already occurred is notable and shows a casual relationship between the two. The maps also
displayed very distinct trends of the location of where most crimes occurred in relation to areas
of the city that had the highest hardship index scores. This was to be expected and follows
historic trends of crimes occurring in impoverished areas.
During the time frame, the top five crimes in the City of Chicago occurred 9,572 times.
However, 4,374 of those crimes took place within the 250 yard buffer. Therefore 45.7% of the
top five crimes in Chicago occur within 250 yards of an abandoned structure.

30
CHAPTER IV
CONCLUSION
The assumption that vacant properties have had a crime occur in them which then creates
environments for further crime to occur in the area was evident, especially pertaining to
narcotics. The maps show that the majority of narcotics crimes occur near an abandoned building
that a crime occurred in. When plotting crimes, vacancies, and the hardship index, there is a
direct correlation between these areas.
Policy Implications
Abandoned buildings are not only an issue for the City of Chicago but rather every city in
the United States. Cities can address these buildings by providing incentives for developers to
renovate the property, sell city-owned property at a largely reduced cost, create land banks,
establish demolition funds for high risk properties, and, for qualifying projects, consider historic
preservation and historic tax credits.
Another solution would be for municipalities to create a department or administration
which would oversee all abandoned properties. A successful example of this is the City of
Louisville, Kentucky. Louisville has a city department specifically designated for abandoned
property management and rehabilitation that has greatly impacted not only the city landscape but
the sense of place.

31
Limitations
There are limitations to this study. All of the mapping was done using ESRI ArcMap.
There is the possibility that with such large data sets, some points were mapped incorrectly or
not displayed. Also, not all points on the map accurately depict crime rates since in some
instances multiple crimes occurred at a single location, even at the same time. Therefore, when
multiple crimes occurred in one instance the most offensive crimes were mapped.
Another limitation to this study is that it only focused on vacant properties that had a
crime occur in them within the calendar year of observation. The study did not look at other
properties in the city.
This was only exploratory research to identify the correlation. Therefore more in-depth
analysis would need to be done in order to clarify and solidify the results.
Future Studies
Future studies might research certain neighborhoods more specifically, neighborhoods
with a history of crime, vacant buildings, and a high hardship index score. Those studies should
inquire why the relationship exists. Future studies could also compare the crime - vacancy
correlation of the areas in and around the Central Business District.
All future studies should include a comparison of social demographics and implications
on the neighborhoods.
32
REFERENCES
Bass, M., Chen, D., Leonard, J., Mueller-Levy, L., Little, C., McCann, B., Snyder, K. (2005).
Vacant Properties: The True Cost to Communities. 1-20. Retrieved March 20, 2017,
from https://www.smartgrowthamerica.org/app/legacy/documents/true-costs.pdf.
Broken windows theory | academic theory | Britannica.com. (n.d.). Retrieved October 21, 2016,
from https://www.britannica.com/topic/broken-windows-theory
Choose Chicago. (n.d.). Retrieved January 19, 2017, from
http://www.choosechicago.com/neighborhoods-and-communities
City of Chicago | Data Portal. (n.d.). Retrieved January 19, 2017, from
https:// data.cityofchicago.org
Crime in Chicago -- Chicago Tribune. (n.d.). Retrieved January 19, 2017, from
http://crime.chicagotribune.com
Garvin, E. C., Cannuscio, C. C., & Branas, C. C. (2013). Greening vacant lots to reduce violent
crime: a randomised controlled trial. Injury Prevention (1353-8047), 19(3), 198-203.
doi:10.1136/injuryprev-2012-040439
Kraut, D. T. (1999). Hanging Out the No Vacancy Sign: Eliminating the Blight of Vacant
Buildings from Urban Areas. New York University Law Review, 74(4), 1139.
Moser, W. (n.d.). The Geography of Economic Hardship in Chicago. Retrieved April 02, 2017,
from http://www.chicagomag.com/Chicago-Magazine/The-312/May-2012/The-
Geography-of-Economic-Hardship-in-Chicago/
(n.d.). Retrieved October 30, 2015, from https://data.cityofchicago.org/
“New Tool Ready to Combat Arson: Vacant and Abandoned Buildings Targeted,” American Re,
16 June 2003 http://www.amre.com/content/press/pressmain.asp?release=04-16-
02_abandonedbuildings.

33
Temple University Center for Public Policy and Eastern Pennsylvania Organizing Project,
“Blight Free Philadelphia: A Public-Private Strategy to Create and Enhance
Neighborhood Value,” Philadelphia, 2001.
The Windy City's Crime Conundrum. (2012). Time, 180(2), 13.
Vacant & Public Property Administration. (2016, September 20). Retrieved March 22, 2017,
from https://louisvilleky.gov/government/vacant-public-property-administration
Your Geography Selections. (n.d.). Retrieved October 30, 2015, from
http:/factfinder.census.gov/