the relationship between corporate social responsibility...
TRANSCRIPT
Meditari Accountancy Research
THE RELATIONSHIP BETWEEN CORPORATE SOCIAL
RESPONSIBILITY AND TAX AGGRESSIVENESS FOR LARGE
COMPANIES ON THE JSE
Journal: Meditari Accountancy Research
Manuscript ID MEDAR-02-2016-0032.R1
Manuscript Type: Research Paper
Keywords: ESG, tax aggression, South Africa, Corporate social responsibility, csr
Meditari Accountancy Research

Meditari Accountancy Research
1
THE RELATIONSHIP BETWEEN TAX AGGRESSIVENESS AND CORPORATE SOCIAL
RESPONSIBILITY FOR LARGE COMPANIES ON THE JSE
Structured abstract
Purpose: This study investigates the relationship between tax aggressiveness and corporate social
responsibility (CSR) in the context of large multinational listed companies in South Africa.
Design/methodology/approach: This relationship is tested on a sample of 48 of the largest companies
by market capitalisation on the Johannesburg Stock Exchange (JSE) for the period 2005 to 2014.
Data is from Bloomberg. The statistical procedures applied include: Pearson correlation analysis,
tests for Granger causality and multiple linear regression analysis with fixed effects.
Findings: A statistically significant negative relationship is found between the level of CSR activity
and tax aggressiveness across the companies sampled. Thus, more socially responsible companies
are less tax aggressive. However, a statistically significant positive relationship was found between
the level of CSR activity and tax aggressiveness within individual companies. Thus, as individual
companies become more socially responsible they also become more tax aggressive.
Social implications: These findings suggest that companies do not regard the payment of tax as part
of their social responsibility and optimise for profitability by creating tax aggressive business
structures, yet optimise for company image by engaging in CSR activity. This highlights the need to
include fair tax payment as a relevant consideration in the view of good corporate citizenship in
South Africa.
Originality/value: This paper adds to the literature by analysing a unique sample of large companies
in the African, developing market, context. Additionally, the relationship between CSR and tax
aggressiveness within individual companies over time is analysed providing a unique perspective
since the existing literature focused only on the relationship across companies.
Keywords
ESG, tax aggressiveness, South Africa, corporate social responsibility, CSR
Page 1 of 30 Meditari Accountancy Research
123456789101112131415161718192021222324252627282930313233343536373839404142434445464748495051525354555657585960

Meditari Accountancy Research
2
1. Introduction
Companies like to present themselves as being good corporate citizens that work for the betterment
of society, but to what extent do they walk the talk when their profitability is on the line? This paper
analyses the relationship between tax aggressiveness and corporate social responsibility (CSR) in
South Africa.
CSR has been broadly defined since the 1950s, when Heald (1957) theorised that management in
companies should become more conscious of the effects that their company has on society for the
sake of financial benefit and for the benefit of society. The concept was contested by the likes of
Friedman (1970) who took justification from agency theory, asserting that companies should act
solely for the purposes of shareholder value maximisation. However, since then, the stakeholder
theory (Freeman, 1984) has become a widely accepted view of CSR where companies are expected,
by various stakeholders, to recognise and play their part in ensuring a healthy society (Sethi, 1975;
Carroll, 1979; Lantos, 2001).
The Institute of Directors in Southern Africa (2009) have defined corporate citizenship
synonymously with the stakeholder theory of CSR suggesting that companies have certain
obligations towards the economy, society and the natural environment in which they operate. This is
because they are recognised as citizens within the country in which they are incorporated, and
therefore have both rights and duties like any other citizen. In defining the liberal view on corporate
citizenship, Matten and Crane (2005), suggest that companies should not hinder government’s ability
to provide for the citizens in the country. One way in which companies can be unhelpful towards
government is through tax aggressiveness.
Tax aggressiveness is defined by Braithwaite (2005:16) as “a scheme or arrangement put in place
with the dominant purpose of avoiding tax”. Dowling (2013) suggests that tax payments by
corporates are a clear way to measure CSR. This is contrasted by most companies not incorporating
their tax paying behaviour in their CSR agendas (Jenkins & Newell, 2013). The inclusion of tax
paying behaviour in the definition of CSR implies that tax aggressiveness is considered to be socially
irresponsible. This then begs the question: What is the relationship between tax aggressiveness and
the CSR activity of large companies listed on the JSE?
This paper determines this relationship by analysing data from a sample of 48 of the largest
companies on the JSE, by market capitalisation, for the period 2005 to 2014 using Pearson
correlation analysis, tests for Granger causality and fixed effects and multiple linear regression
analysis. Two measures of effective tax rate (ETR) are used as proxies for tax aggressiveness and
CSR disclosure, as measured by the Bloomberg environment, social and governance (ESG) score, is
used as proxy for CSR activity.
When considering the effects across companies (between-company), a statistically significant
negative relationship was found between the level of CSR activity and tax aggressiveness. Thus,
companies that are more socially responsible are less tax aggressive. When considering the effects
within companies (intra-company), a statistically significant positive relationship was found between
the level of CSR activity and tax aggressiveness. Thus, as companies become more socially
responsible, they become more tax aggressive, suggesting that companies do not consider tax
payment as part of their social responsibility. These results reflect shareholder primacy behaviour of
companies on the JSE where the company aims to maximise shareholders’ returns through the use of
both CSR activities and aggressive tax planning structures (Friedman, 1970). This presents a concern
in a developing country setting where loss of revenue (from corporate tax avoidance) significantly
constrains economic growth and development (Cobham, 2005).
This paper contributes to present research in two key areas. Firstly, this paper uses a more
appropriate sample than the one used in prior research (Lanis & Richardson, 2012A; Hoi, Wu &
Page 2 of 30Meditari Accountancy Research
123456789101112131415161718192021222324252627282930313233343536373839404142434445464748495051525354555657585960

Meditari Accountancy Research
3
Zhang, 2013), in that it uses a smaller sample of the largest companies on the Johannesburg Stock
Exchange. These large companies are mostly multinational corporations that have more opportunity
and ability to engage in aggressive tax planning, often with subsidiaries in other countries. This
sample is drawn from an exchange in a developing market, as opposed to most of the prior research
that was conducted in developed markets. This difference is noteworthy as developing markets,
especially in African countries, are deprived of much needed tax revenue as a result of corporate tax
aggressiveness (Cobham, 2005). Secondly, this paper analyses the relationship between CSR and tax
aggressiveness both within (intra-company) and across companies (between-company) in the
sample. Previous literature (Lanis & Richardson, 2012A; Hoi et al., 2013; Khan, Yousaf, Khan &
Yasir 2014; Laguir, Stagliano & Elbaz, 2015) has tested the relationship across companies and not
within companies. This paper confirms the between-company relationship found in prior literature,
that companies that are more socially responsible are less tax aggressive, and adds to this literature
by considering the intra-company relationship between CSR and tax aggressiveness over time. The
findings should be of interest to: the legislature, as tax aggressiveness affects tax revenues; the
public, as they may be misled by companies that present themselves as good corporate citizens yet
aggressively avoid taxes; and the King Committee on Corporate Governance, as tax behaviour may
be an area that should be explicitly included in an assessment of a company’s responsibility as a
corporate citizen.
The next section will present the literature review, explaining past literature on CSR, corporate
citizenship and tax aggressiveness. The literature review concludes with examples of corporate tax
aggressiveness, comment on the international regulatory clampdown on tax aggressiveness and the
research question. The paper then proceeds to describe the sample selection, the variables included in
the analysis as well as the specification of the regression models. The results are then presented and
this is followed by an analysis of these results. A conclusion is made with an explanation of the
limitations of this paper, followed by a summary of opportunities for further research.
2. Literature review
2.1. Corporate social responsibility
CSR was broadly defined in its earlier years of research and has become more detailed over time.
Heald (1957) initially argued that management should be conscious of its social responsibility for the
purpose of good economic performance as well as for the good of society. Davis (1960) contested
that social responsibility is an individual obligation. He argued that the more power and influence a
businessman has, the more obliged he is to be socially responsible. The CSR definition progressed
towards it being an individual company’s decision rather than the responsibility of all companies or
individuals themselves. This decision is based on the company’s specific characteristics and how it
interacts with society (Heald, 1970). At this point there was still a broad agreement about what CSR
was. Sethi (1975) tried narrowing it down by defining “social obligation,” “social responsibility” and
“social responsiveness” separately. This highlighted the difference between a company's social
obligations and the volunteering of social actions in addition to its obligations. These obligations
were aimed at the prevention of social problems.
Friedman (1970) argued that businesses should act in a way that solely maximises shareholder value
in accordance with agency theory (Jensen & Meckling, 1976), which created a further debate around
the definition of CSR. Carroll (1979) then tried to narrow down the CSR definition even further and
concluded that CSR reflects the expectations that society has of a company according to economic,
legal, ethical, and discretionary factors.
Later, the focus shifted from defining CSR and testing for its significance became more prominent
(Carroll, 1999). Waddock and Graves (1997) found a significant relationship between CSR activity
and financial performance and concluded that companies with poor financial performance were less
likely to spend money on CSR activities as they had less additional resources to spend on what some
Page 3 of 30 Meditari Accountancy Research
123456789101112131415161718192021222324252627282930313233343536373839404142434445464748495051525354555657585960

Meditari Accountancy Research
4
companies may see as ‘over and above’ expenses. This was reaffirmed recently when Wu and Shen
(2013) found a positive relationship between CSR and various financial performance measures such
as return on assets, return on equity, net interest income, and non-interest income.
Carroll (1999) then identified that three of the most common topics under the CSR umbrella that are
researched are corporate social performance, business ethics and the stakeholder theory. This
revealed the direction in which research of this topic was going. In the early 2000s, Lantos (2001)
argued that the debate around CSR occurs because of a lack of understanding of ethical, altruistic
and strategic CSR. He concluded that ethical CSR is the minimum requirement; altruistic CSR is not
within the scope of a company’s responsibility; and strategic CSR is financially beneficial to
companies. Later Glavas and Piderit (2009) argued that because there is no set definition for CSR,
too many companies might be seen as being socially responsible when they probably should not be
seen as such.
In recent times, organisations such as the Institute of Directors of Southern Africa (2009) have
defined aspects of CSR in their definition of corporate citizenship incorporating the economy,
society and the natural environment into its definition.
2.2. Corporate citizenship
Since companies are incorporated as juristic persons and can act as such, they are viewed as citizens
of the country where they are incorporated. They have rights and duties like any other citizen. In
South Africa the leading doctrines on corporate citizenship and governance, endorsed by the
Companies Act and the JSE, are the King reports. The King III Report defines good corporate
citizenship as an ethical relationship of responsibility between a business and the society in which it
operates: “As a responsible corporate citizen, the company should protect, enhance and invest in the
wellbeing of the economy, society and the natural environment” (Institute of Directors in Southern
Africa, 2009:42).
Corporate citizenship has become a topic of great interest in the research environment. There appears
to be a mismatch of intention when it comes to the interpretation of good corporate citizenship. This
mismatch is clear in the shift towards strategic CSR where the objective is to maximise the benefit of
CSR to the company rather than just engage in CSR for the betterment of society (Porter and
Kramer, 2006).
Matten and Crane (2005) have grappled with the definition of corporate citizenship, insisting that the
concept has been misrepresented in business literature. They describe three views of corporate
citizenship. The first is the “limited view” where corporate citizenship is seen in terms of charitable
donations and other forms of community action, driven by self-interest and more of a discretionary
activity and beyond what can be expected of business. This view is consistent with that of Porter and
Kramer (2006).
The second, the “equivalent view,” defines corporate citizenship in a similar way to CSR.
Companies are required to meet the economic, legal, ethical and discretionary responsibilities
imposed on them by their stakeholders. According to this view, corporate citizenship functions as a
new way of presenting existing concepts and there is no focus on what it means to be a citizen.
For the third and final view proposed by Matten and Crane (2005), it is first explained that the state
is a pivotal actor within the “liberal view” of citizenship. It protects civil rights of people, provides
social rights and also constitutes the main area within which political rights are exercised and
decisions are made. Thus it would appear that citizenship is linked to a particular territory, governed
by a sovereign state. Matten and Crane (2005) suggest that states are failing to be the sole guarantor
of these three rights areas (civil, political and social) due to globalisation and the rapid change in
societal structure as economies are becoming increasingly interwoven. This results in the severance
Page 4 of 30Meditari Accountancy Research
123456789101112131415161718192021222324252627282930313233343536373839404142434445464748495051525354555657585960

Meditari Accountancy Research
5
of social, political and economic interaction from national territories. It is becoming more difficult
for regulation to keep up with the societal change that comes with globalisation and for this reason
Matten and Cane (2005) suggest that corporate citizenship implies that companies must step in where
governmental actors fail to fulfil their citizenship obligations. Thus, corporations have a role in
administering the rights of the citizens of the countries in which they operate.
The “liberal view” is different from the first two as it places an obligation on companies to uphold
the rights and political framework of the countries in which they operate, implying that companies
must not hinder a government’s ability to meet its obligations. By hindering a government’s abilities,
companies are indirectly not meeting their corporate citizenship role to administer the rights of
citizens in the countries in which they operate. One instance where companies hinder governments’
ability to provide for the rights of their citizens is through tax aggressiveness, as this puts a strain on
a country’s fiscal resources.
Given the complexity, and often ambiguity, of measuring CSR and corporate citizenship, it would be
useful to find a measure that is easily gauged and fundamental to a company’s citizenship behaviour.
The most convincing monetary metric for this is to assess a company’s tax-paying behaviour
(Dowling, 2013). However, according to Jenkins and Newell (2013), most companies make no
mention of their tax-paying behaviour as part of their corporate responsibility or their corporate
citizenship agendas. This is partly because companies’ CSR agendas are being shaped by the
pressures placed on them by various parties who exclude tax paying behaviour from their main
environmental and social interests and concerns (Dowling, 2013; Jenkins & Newell, 2013). This is
attributed to the complexity of tax systems and a lack of awareness of the negative effects of tax
aggressive behaviour.
2.3. Tax aggressiveness
At this point it is necessary to distinguish between tax aggressiveness and tax evasion. Tax evasion is
the illegal activity of not paying tax when it is clearly stipulated in the legislation that tax is due. Tax
aggressiveness as defined by Braithwaite (2005:16) as: “a scheme or arrangement put in place with
the dominant purpose of avoiding tax.” Tax aggressive companies exploit ‘tax loopholes’ to reduce
their tax bill for the benefit of their shareholders at the government's, and therefore also at society’s,
expense.
Corporate tax aggressiveness is best understood in the context of a country's tax leakages. Cobham
(2005) describes five primary sources of taxation leakages from a country, two of which are
considered as tax aggressiveness: corporate profit-shifting and tax competition. Corporate profit
shifting involves companies artificially pricing goods and services and selling them to offshore
companies in the same group, recognising artificially generated expenses for the company in the high
tax rate country and income for the company in the low tax rate country. Tax competition occurs
when multinational corporations (MNCs) threaten to avoid operating in high tax countries, putting
pressure on the country to lower the corporate tax rate applicable to that particular MNC. Developing
and least developed countries (LDCs) are particularly vulnerable to tax aggressiveness as they do not
have the resources to recover and investigate profit shifting and are reliant on MNCs for much of the
employment of their labour force.
The King III Report does not explicitly deal with tax aggressiveness (The Institute of Directors in
Souther Africa, 2009), and so companies that appear to be good corporate citizens according to the
King III Report definition may indeed not be, according to Matten and Crane’s (2005) liberal view of
corporate citizenship. If companies engage in tax aggressive practices and these practices are deemed
significantly to hinder a government’s ability to provide for the rights of its citizens, these companies
may in fact be bad corporate citizens. In accordance with legitimacy theory these companies may
intend only to appear socially responsible due to the social pressure on them to do so, so that they
may remain legitimate in the public’s eyes (O’Donovan, 2002).
Page 5 of 30 Meditari Accountancy Research
123456789101112131415161718192021222324252627282930313233343536373839404142434445464748495051525354555657585960
Meditari Accountancy Research
6
All stakeholders of corporations need to take note of their corporation’s taxpaying behaviour. Many
companies find no contradiction between claiming to be socially responsible while at the same time
being tax aggressive. Jenkins and Newell (2013) find that this is even the case for companies that
identify themselves as leaders on CSR matters. The question must be asked as to why companies
find this not to be contradictory.
Companies have the following arguments for tax aggressive behaviour:
• It is up to a company to manage its affairs in a way that minimises its taxes as long as the
company remains in line with the letter of the law; it is under no obligation to pay more than
this (Jenkins & Newell, 2013).
• Tax aggressiveness lowers the costs that the company pays and thus increases shareholders
value (Dowling, 2013). In accordance with agency theory, a company must act to maximise
shareholder value through its decision-making (Friedman, 1970; Jensen & Meckling, 1976).
Rego (2003) finds that lower effective tax rates correspond to higher valuations. This is due to
companies having greater capacity to invest in projects that increase their value.
• Companies place little “trust and confidence in the tax system and the government” (Dowling,
2013:181) and elect rather to contribute to society by investing in those CSR activities that they
deem to be beneficial.
The following reasons are provided for the inclusion of corporate tax aggressiveness as a measure of
corporate citizenship:
• A company has a responsibility to contribute as a taxpayer for the activities it conducts in a
country as it is a citizen in the country in which it operates (Jenkins & Newell, 2013).
• In accordance with the stakeholder theory, government is an important stakeholder as are
shareholders, employees and customers (Freeman, 1984). Governments are as entitled to the
tax rate on the operations in their countries as shareholders are to their profits, employees are to
their wages and customers to their goods and services (Jenkins & Newell, 2013).
• Government supplies companies with an environment that facilitates their operations within the
country. This includes basic services, social and physical infrastructure, an educated labour
force, and a legal system (Jenkins & Newell, 2013; Christensen & Murphy, 2004). Therefore,
since the company benefits from this environment, it should pay its fair share of taxes as
required by the government.
• MNCs that are tax aggressive are able to pay a lower effective tax rate than smaller, domestic
competitors. These companies are actively able to avoid taxes because they have more
resources to take advantage of tax havens and are usually big enough to lobby against
governments to reduce the tax rate. Paying this lower tax rate infringes on fair competition and
gives MNCs an unfair advantage over smaller domestic companies (Christensen & Murphy,
2004).
• Tax aggressiveness creates distortions in the market. Someone has to pay in order to keep
public services afloat. Companies failing to pay the tax on their operations within a country
ultimately shift the tax burden to other (often financially worse off) individuals and companies,
thus increasing income disparities within a country (Christensen & Murphy, 2004). Avoiding
tax is therefore transferring money from the government (and indirectly from society) and to
shareholders (Dowling, 2013).
• By not paying the full tax bill due, through tax aggressiveness, companies are dodging their
responsibility as corporate citizens and disempowering government by reducing tax revenues.
Governments can now not meet their responsibility and provide for their people’s citizenship
needs (Matten & Crane, 2005).
The core of the debate between the arguments for and against tax aggressiveness is whether the value
of the tax avoided is owed to shareholders of a company or other stakeholders including the
government (and in turn, society). It is a company’s financial responsibility, in accordance with
Page 6 of 30Meditari Accountancy Research
123456789101112131415161718192021222324252627282930313233343536373839404142434445464748495051525354555657585960

Meditari Accountancy Research
7
agency theory and shareholder primacy, to pay the avoided taxes to their shareholders (Jensen &
Meckling, 1976; Dowling, 2013). It is a company’s social responsibility, in accordance with
stakeholder theory, to pay the avoided taxes to the government (Freeman, 1984; Dowling, 2013).
Christensen and Murphy (2004) argue that avoiding tax encourages companies to be free-riders in
the economy, being able to benefit from the advantages of operating in the country and refusing to
pay the costs that come with it. In the long-term, tax aggressiveness inevitably is to the detriment of
shareholders because of its negative effect on long-term sustainability of the company and the
society in which the company operates (Christensen & Murphy, 2004). Sustainability is a key part of
corporate citizenship and good governance, in accordance with the King III report (IODSA,
2009:10): “The concept of corporate citizenship which flows from the fact that the company is a
person and should operate in a sustainable manner. Sustainability considerations are rooted in the
South African Constitution which is the basic social contract that South Africans have entered into.
The Constitution imposes responsibilities upon individuals and juristic persons for the realisation of
the most fundamental rights.”
2.4. International regulatory clampdown on tax aggressiveness
Tax aggressiveness, particularly extremely aggressive tax management by multinational
corporations, has been an explicit concern for regulators worldwide of late. One particularly extreme
example is tax aggressiveness in the United Kingdom (UK) by Starbucks that paid no corporate tax
in 2012, despite UK sales of £398 million (BBC News, 2012). Following much public outcry and
inquisition into these activities Starbucks has been pressured into being less tax aggressive (Titcomb,
2014). The UK has subsequently introduced a tax on profits diverted overseas to curb tax aggressive
behaviour by MNCs (Lunden, 2015).
Various international coalitions like the OECD and G20 have come together to cooperate and put
measures in place to quell tax aggressiveness through international information sharing on
individuals and corporations and international measures that target tax base erosion and profit
sharing strategies employed to avoid taxes. Presently, in South Africa, the Davis Committee, chaired
by Judge Dennis Davis, is compiling recommendations related to South Africa’s tax framework and
their report will deal explicitly with tax aggressiveness (Steyn, 2014).
2.5. Research question
This paper aims to determine whether companies consider paying fair taxes to be part of their
obligation as corporate citizens or whether such payments are considered to be beyond their
obligation to be socially responsible. This determination is made by analysing the relationship
between tax aggressiveness and CSR activity. The research question is therefore: What is the
relationship between tax aggressiveness and CSR of large companies on the JSE? This is an area that
has been touched on only sparingly in past research (Lanis & Richardson, 2012A:87) and this paper
is in response to the call for research in this area by Sikka (2010).
This paper contributes to a growing body of similar research in the area of tax aggressiveness and
CSR. Two of the most influential papers in this area include research conducted in Australia by
Lanis and Richardson (2012A) and the United States of America by Hoi et al. (2013) on the
between-company relationship between tax aggressiveness and CSR. Lanis and Richardson
conducted a regression analysis on 2008/2009 data of a cross-section of 408 publicly listed
Australian corporations; they found a negative and statistically significant relationship between the
level of corporate tax aggressiveness, as measured by the effective tax rate, and the extent of CSR
disclosure. This indicates that Australian companies that present themselves as socially responsible
are not tax aggressive (Lanis & Richardson, 2012A:88). The latter research by Hoi et al. (2013)
draws largely the same conclusion that companies with irresponsible CSR activities are more
aggressive at avoiding taxes in the United States.
Page 7 of 30 Meditari Accountancy Research
123456789101112131415161718192021222324252627282930313233343536373839404142434445464748495051525354555657585960

Meditari Accountancy Research
8
Other research on the same relationship, conducted by Khan et al. (2014), finds a negative
relationship between tax aggressiveness and CSR practices in Pakistan where companies that have
no or little CSR practices tend to be more tax aggressive. Research by Laguir et al. (2015) finds tax
aggressiveness to be related to different CSR dimensions in different ways. They find that the greater
a company's social activity the lower the level of corporate tax aggressiveness. Overall the research
tends to be consistent with the view that companies involved in more CSR activities tend to be less
tax aggressive.
It is important that this research be conducted in South Africa, which is a developing nation and thus
suffers from relatively low tax revenues; those revenues are intended to redress past inequalities and
to build the infrastructure required in the country for continued growth and development (Cobham,
2005). This research will determine whether it is necessary to focus on tax aggressiveness as a
corporate citizenship issue in South Africa, perhaps through an amendment of the King Code. It is
estimated that tax aggressiveness by individuals and companies cost South Africa R300 billion per
year and South Africa ranks fifth highest in the world in tax leakages through tax aggressive business
practices (Steyn, 2014).
A negative relationship between tax aggressiveness and CSR ratings would be expected given that
Africa is renowned for its communal focus and culture (Ubuntu). South Africa’s history provides a
unique need for corporations to step up and serve as corporate partners for redress.
3. Data and methods
3.1. Sample description
South Africa was chosen to be the entry point of this study of the relationship between tax
aggressiveness and CSR in Africa. The significance of having Africa as a focal point is its
developing status where tax legislation is not as strictly and efficiently enforced and therefore makes
these countries vulnerable to tax avoidance (Cobham, 2005). Cobham (2005) found that “rich”
countries are usually able to obtain between 12% and 18% of GDP as direct tax while developing
countries are only able to obtain between 2% and 6% of GDP as direct tax. This shortfall is
intensified by the need for revenue in these developing countries in order for governments to carry
out their obligations to improve the infrastructure, the social landscapes and natural environments.
South Africa (represented by the Johannesburg Stock Exchange) has the most sophisticated market
and legal systems of any African country (Jefferis & Smith, 2005) and its companies, guided by
comprehensive corporate governance criteria in the King Reports (KPMG, 2014), have to deal with
more stringent financial and integrated reporting criteria than companies in other African countries.
This study opted to analyse companies listed in South Africa because of the availability of data and
focus on social responsibility in the country.
Representing the South African market, this paper has chosen 50 of the largest companies on the
Johannesburg Stock Exchange by market capitalisation, including those in the JSE top 40 at 2
October 2015 (Sharenet, 2015). This paper focuses on analysing larger companies because the
managers of these larger companies have more discretion over matters of tax structure (including
transfer pricing) and CSR activity than in the case of smaller companies that are limited by size and
resources.
The research question was empirically tested using panel data collected from the Bloomberg terminal
for the period 2005 to 2014. For the purposes of this study three of the top 50 companies on the JSE
have been excluded:
• RMB holdings as it is a holding company that only holds shares in FirstRand Ltd, a company
already included in the dataset,
• Reinet due to the lack of data on their Bloomberg ESG score, and
• South32 due to the lack of data on their Bloomberg ESG score.
Page 8 of 30Meditari Accountancy Research
123456789101112131415161718192021222324252627282930313233343536373839404142434445464748495051525354555657585960

Meditari Accountancy Research
9
The final sample consisted of 47 companies with 465 company-year observations of varying detail.
Financial and foreign companies were not excluded from the dataset as in the case of studies by
Lanis and Richardson (2012A:91) and Gupta and Newberry (1997). Financial companies are
included because the panel characteristics of the collected data allow the luxury of isolating company
and sector specific influences when analysing effects within companies (intra-company effects).
Foreign companies are included because most of the largest companies on the JSE have vast foreign
operations regardless of whether they are locally incorporated or not. Thus, those with aggressive tax
management practices will have lower tax rates overall regardless of which country they are
incorporated in. Relative tax aggressiveness will still be captured by viewing a company’s tax rate
relative to its peers on the JSE when considering the relationship between tax aggressiveness and
CSR activity across companies (between-company). A company’s country of origin will not affect
the intra-company relationship analysis.
3.2. Dependent variable
The dependent variable in the empirical analysis is effective tax rate (ETR), chosen as an inverse
proxy for tax aggressiveness, where a higher ETR indicates lower tax aggressiveness and vice versa.
ETR is considered to be an effective inverse proxy for tax aggressiveness for various reasons. Firstly,
there is a body of empirical research that has found that ETR captures a company’s tax
aggressiveness. Slemrod (2004) finds that ETR is an important factor in driving the overall
objectives of a company’s tax departments. Robinson, Sikes and Weaver (2010) find that companies
that view their tax departments as profit centres and actively manage their taxes have lower ETRs, on
average; this finding is similar to findings by Armstrong, Blouin and Larcker (2012). Secondly, ETR
has been widely used as a proxy for tax aggressiveness in previous academic studies, including those
used to compare tax aggressiveness to CSR (Lanis & Richardson, 2012A; Hoi et al., 2013; Laguir et
al., 2015).
ETR is affected by tax aggressiveness in at least two ways. Firstly, companies could choose to
maintain lower ETRs by maintaining temporary and permanent book tax difference between
accounting and tax profits (Rego, 2003). Secondly, corporations can use foreign subsidiaries to
transfer profits to countries with lower tax rates (Rego, 2003).
Two ETR measures have been used in this analysis: accounting effective tax rate (AETR), defined at
the tax expense divided by the accounting income before tax; and cash effective tax rate (CETR)
defined as the cash paid for taxes divided by accounting income before tax. CETR has some
advantages over AETR as it focuses on tax actually paid whereas the accounting tax measure takes
into account items such as deferred tax.
3.3. Independent variable
The independent variable in the analysis is CSR activity. Information that companies disclose on
their environmental, social and governance (ESG) activities is used as a proxy for CSR activity. The
specific measure used is the Bloomberg ESG disclosure score which has been used in prior CSR
research, such as in the work of Mio, Venturelli and Leopizzi (2015). The Bloomberg ESG score is a
proprietary rating between 0 (no disclosure) and 100 (complete disclosure) that Bloomberg gives to a
company based on the extent of its ESG disclosure. Bloomberg takes into account all reports released
by a company when compiling their scores, including the annual reports and additional sustainability
reports (Bloomberg, 2015). This rating is converted into a percentage measure by dividing the scores
by 100.
It would be reasonable for a company engaging in more socially responsible activities to have a
greater level of CSR disclosure as this allows the company to realise the gains from CSR activity by
disclosing this activity to the public. Companies that engage in negative CSR activities that are
hidden from the public eye are likely to disclose less about their ESG activity.
Page 9 of 30 Meditari Accountancy Research
123456789101112131415161718192021222324252627282930313233343536373839404142434445464748495051525354555657585960

Meditari Accountancy Research
10
There has been mixed support for this premise in research with several studies such as Bowman and
Haire (1976) and Ingram and Frazier (1980) suggesting that environmental disclosure is a good
indicator of environmental performance. In contrast, other studies such as one by Cho, Roberts and
Patten (2010), suggest that environmental disclosure is used as a legitimising tool for companies to
offset the effect of negative performance. This view by Cho, Roberts and Patten is consistent with
the legitimacy theory that states that companies use CSR disclosure to retain legitimacy in the
public’s eyes, especially when the company’s legitimacy is at threat because of actions that the
public disapproves of (O’Donovan, 2002).
More recent research has confirmed the positive relationship between environmental performance
and environmental disclosure. Clarkson, Li, Richardson and Vasvari (2008) find a positive
association between the level of discretionary environmental disclosures and the environmental
performance of 191 US companies in the most polluting industries. This suggests a positive
association between CSR disclosure and performance.
As far as the authors of the paper are aware there is no evidence that the use of CSR disclosure is a
poor measure for CSR performance in South Africa. The South African King III Report requires
companies’ audit committees to verify all sustainability related information reported in the
companies’ integrated reports (IODSA, 2009). This coupled with evidence that the assurance of CSR
disclosurein South Africa is growing (Ackers & Eccles, 2009) suggests that, at least, the quality of
sustainability information reported is high.
Two terms relating to CSR disclosure have been considered in the intra-company regression model.
The first of these is disclosures for the present year and the second is a measure for disclosures of the
previous year (lagged). Because tax planning is an intricate process and requires generation and
alteration of tax planning structures, a lagged effect of CSR measures on tax planning is anticipated,
with this lagged variable capturing this relationship should it exist.
3.4. Control variables
The four control variables used in this study are profitability, leverage, size and market-to-book ratio.
These control variables have been included to account for theoretical justification and empirical
evidence suggesting that these variables have a significant effect on ETR (Kim & Limpaphayom,
1998; Gupta & Newberry, 1997; Adhikari, Derashid & Zhang, 2006; Lanis & Richardson, 2007).
Return on assets, measured as pre-tax income divided by total assets, has been included as a
profitability measure. Profitability has been shown by Kim and Limpaphayom (1998) significantly
and positively to affect ETR. Theoretically a lower ETR would imply a higher ROA, ceteris paribus.
Leverage, measured as long-term debt divided by total assets, is likely to affect ETR as companies
employ debt as a means of optimising their capital structure to exploit the interest tax shield
(Modigliani & Miller, 1958). Gupta and Newberry (1997) and Adhikari et al. (2006) find a
significant negative relationship between leverage and ETR. Size, measured as the natural log of
market capitalisation, is included as a control to account for the size effect on ETR. Companies that
are larger tend to have more resources and thus pay less taxes, as they may have the ability to employ
dedicated tax management divisions within their own businesses (Gupta & Newberry, 1997). Lanis
and Richardson (2007) find that company size has a significant effect on ETRs, with smaller
companies paying higher rates than larger companies. Market-to-book ratio, as the ratio of a
company's market value to book value of its equity, has been included in the analysis as a company’s
growth status is likely to affect its tax payments. This could have a positive or negative effect on a
company’s ETR. Growing companies are likely to have greater new capital acquisitions, thus more
tax deductions for capital assets and relatively lower ETRs. Companies that are experiencing a
period of stability may be able to manage their sales flows more effectively, potentially through
international transfer pricing mechanisms. Kim and Limpaphayom (1998) find that the relationship
Page 10 of 30Meditari Accountancy Research
123456789101112131415161718192021222324252627282930313233343536373839404142434445464748495051525354555657585960

Meditari Accountancy Research
11
between ETR and market-to-book ratio is variable between countries and time periods and moves
from being significant and positive to significant and negative.
As control variables in addition to those four described above, dummy variables have been assigned
to companies to account for different sectors’ effect on ETR, since different sectors have different
tax rules and allowances (World Bank, 2015). Each company has been assigned either to the retail,
industrial, financial or resources sector. These sector dummy variables are only used in the between-
company regression models that do not apply fixed effects. The application of fixed effects in the
intra-company models account for such time invariant characteristics (de Jager, 2008).
In contrast to the approach of Lanis and Richardson (2012A:91), no governance control variables
have been included in the analysis because of the unique listing requirements of the JSE companies
that require companies to apply the King III Code on corporate governance. Governance scores of all
companies are likely to be high and very similar as companies are required to report various
governance facts as specified by the King III code. Governance control variables are thus likely to be
independent of ETR. Governance disclosure is also included as a consideration in the Bloomberg
ESG disclosure score; therefore, such governance considerations are already accounted for and any
inclusion of further measures could lead to double counting.
3.5. Data preparation
In order to prepare the data for analysis a 5% winsorisation was applied to ROA and both ETR
measures: this resulted in 23 observations being altered per variable. Winsorisation has been applied
to account for extreme outliers that are present in the ROA and ETR variables. Prior literature has
accounted for such outliers in tax measures by truncating the measure to between zero and one
(Lanis & Richardson, 2012A:96; Laguir et al., 2015).
3.6. Regression procedure
The regression procedure followed in this study aims to test both between- and intra-company
relationships between ETR and CSR. Previous studies on this topic such as those by Lanis and
Richardson (2012A), Wu and Shen (2013) and Laguir et al. (2015) have all tested the between-
company relationship between ETR and CSR by making use of a cross-sectional regression model.
In a manner consistent with these studies, the between-company effect of CSR on ETR will be tested
using a multiple linear regression model on a cross-section of the averaged variable values between
2005 and 2014.
In accordance the suggestion by de Jager (2008), on allowing for heterogeneity between companies
by using panel data, a fixed effects regression has been applied on the panel data to test the intra-
company effect of CSR disclosure on ETR. This application of fixed effects regression allows the
relationship between CSR disclosure and tax aggressiveness to be studied in more detail given that
the effects of time invariant data are removed.
3.7. Regression models
To examine the relationship between CSR and ETR the following base regression models are used:
Model 1 (cross-sectional model)
AETRi = β1CSROVERALLi + β2ROAi + β3LEVERAGEi + β4MTBi + β5RETAILi +
β6INDUSTRIALi + β7FINANCIALSi + β8RESOURCESi + εi
Model 2 (cross-sectional model)
CETRi = β1CSROVERALLi + β2ROAi + β3LEVERAGEi + β4MTBi + β5RETAILi +
β6INDUSTRIALi + β7FINANCIALSi + β8RESOURCESi + εi
Page 11 of 30 Meditari Accountancy Research
123456789101112131415161718192021222324252627282930313233343536373839404142434445464748495051525354555657585960

Meditari Accountancy Research
12
Model 3 (fixed effects model)
AETRi,t = C +β1CSROVERALLi,t + β2CSROVERALLi,t-1 + β3ROAi,t + β4LEVERAGEi,t + β5SIZEi,t
+ β6MTBi,t + αi + εi,t
Model 4 (fixed effects model)
CETRi,t = C +β1CSROVERALLi,t + β2CSROVERALLi,t-1 + β3ROAi,t + β4LEVERAGEi,t + β5SIZEi,t
+ β6MTBi,t + αi + εi,t
Where:
i: Refers to the company in question. t: Refers to the time period in question. C: Represents the
shared constant among companies. AETR: Represents accounting ETR. CETR: Represents cash
ETR. CSROVERALL: Represents overall Bloomberg ESG disclosure ratio. ROA: Represents the
Return on Assets ratio. LEVERAGE: Represents the long-term debt over total assets ratio. SIZE:
Represents the natural log of market capitalisation. MTB: Represents the Market-to-Book ratio.
RETAILi, INDUSTRIALSi, FINANCIALSi, RESOURCESi: Dummy variables classifying
companies into sectors. αi: Represents the intercept term of each company (fixed effect regression). ε:
Represents the error term.
In the above four models, size has been included in models 3 and 4 (fixed effects models), but has
been excluded from models 1 and 2 (cross-sectional models). In previous studies it has been found
that size is highly correlated with overall CSR disclosure (Lanis & Richardson, 2012A:99), which
poses the potential problem of multicollinearity. This problem is further confirmed by the
insignificant coefficient of both size and overall CSR disclosure when both size and overall CSR
disclosure are included in model 2. Size has thus been dropped from both models 1 and 2 to account
for this problem of multicollinearity and to ensure consistency. Due to the relatively larger sample
size in the fixed effects regression models this is not such a problem, therefore size has been kept in
these models (models 3 and 4). A summary table for the dependent variable, independent variable
and control variables is available in table 10 in the appendix.
4. Results
4.1. Descriptive statistics
The descriptive statistics for the original, unwinsorised data are provided in table 5 in the appendix.
Table 1 details the descriptive statistics of all the variables collected for the companies in the sample
during the period 2005 to 2014, using the dataset with 5% winsorisation on ROA and tax rate
measures.
Page 12 of 30Meditari Accountancy Research
123456789101112131415161718192021222324252627282930313233343536373839404142434445464748495051525354555657585960

Meditari Accountancy Research
13
Table 1: Descriptive statistics for data after 5% winsorisation
AETR CETR CSROVERALL ROA LEVERAGE SIZE MTB
Mean 0.262 0.246 0.369 0.098 0.140 4.692 3.285
Median 0.284 0.266 0.378 0.090 0.103 4.654 2.443
Maximum 0.667 0.813 0.645 0.344 0.611 6.262 33.069
Minimum -0.112 -0.268 0.099 -0.046 0.000 3.030 -23.112
Std. Dev. 0.135 0.181 0.135 0.088 0.138 0.583 3.293
Skewness -0.215 0.113 -0.089 0.930 1.205 0.144 1.992
Kurtosis 5.138 5.461 2.320 3.757 3.980 3.046 32.047
Jarque-Bera 92.166 118.339 7.031 76.968 129.674 1.578 16046.240
Probability 0.000 0.000 0.030 0.000 0.000 0.454 0.000
Sum 121.752 114.389 126.121 44.834 64.410 2102.009 1471.716
Sum Sq. Dev. 8.446 15.245 6.210 3.527 8.743 152.142 4846.121
Observations 465 465 342 458 460 448 448
Data Source: Bloomberg
AETR: Represents accounting ETR ratio. CETR: Represents cash ETR ratio. CSROVERALL: Represents overall
Bloomberg ESG disclosure ratio. ROA: Represents the Return on Assets ratio. LEVERAGE: Represents the long-term
debt over total assets. SIZE: Represents the natural log of market capitalisation. MTB: Represents the market-to-book
ratio.
The winsorisation of the data results in a reduction in the mean of the values as expected, by
approximately 1-2% in each instance. Accounting effective tax rate (AETR) has a mean (median) of
26.20% (28.40%) with 465 observations. This is encouraging if one considers that the median AETR
is above the South African company’s tax rate of 28% with 465 observations. Cash effective tax rate
(CETR) has a mean (median) of 24.60% (26.60%). CETR’s mean and median are overall below the
South African company’s tax rate of 28%, implying (by this measure) that overall, companies are tax
aggressive. Nine companies were classified as RETAIL, seventeen companies were classified as
INDUSTRIALS, fifteen companies were classified as FINANCIALS and seven companies were
classified as RESOURCES. The analysis going forward will use the winsorised dataset.
4.2. Correlation results
Table 2: Correlation results
Variable AETR CETR CSROVERALL ROA LEVERAGE SIZE MTB
AETR 1.000
CETR 0.618*** 1.000
CSROVERALL 0.119** 0.097* 1.000
ROA 0.046 0.012 -0.015 1.000
LEVERAGE -0.188*** -0.015 0.07 -0.204*** 1.000
SIZE 0.001 0.064 0.510*** -0.051 0.151*** 1.000
MTB 0.228*** 0.077 0.015044 0.475*** -0.138*** 0.001 1.000
*Significant at the 10% level, **Significant at the 5% level, ***Significant at the 1% level
Data Source: Bloomberg
AETR: Represents accounting ETR ratio. CETR: Represents cash ETR ratio. CSROVERALL: Represents overall
Bloomberg ESG disclosure ratio. ROA: Represents the Return on Assets ratio. LEVERAGE: Represents the long-term
debt over total assets ratio. SIZE: Represents the natural log of market capitalisation. MTB: Represents the market-to-
Page 13 of 30 Meditari Accountancy Research
123456789101112131415161718192021222324252627282930313233343536373839404142434445464748495051525354555657585960

Meditari Accountancy Research
14
book ratio.
The Pearson pairwise correlation results are presented in table 2. These correlation results are of the
full, pooled, cross-sectional dataset from 2005 to 2014 and do not take into account the panel
characteristics of the data (observations that cross between cross-sections are allowed simply to
overlap). Considering the dependent and independent variable and its constituents, the correlations
show that there is a small significant (p<0.05) positive correlation of 0.119 between accounting
effective tax rate (AETR) and overall ESG disclosure score. There is also a small significant positive
correlation (p<0.10) of 0.097 between cash effective tax rate (CETR) and ESG disclosure score.
These results suggest that the higher the level of a company’s overall ESG disclosure score the
greater a company’s ETR will be.
When considering the correlation between the tax measures and control variables, a significant
negative correlation is found (p<0.01) between long-term debt over total assets (LEVERAGE) and
AETR and a significant positive correlation (p<0.01) between market-to-book ratio (MTB) and
AETR. All the control variables are significantly (p<0.01) correlated to each other, except for MTB
and LEVERAGE and return on assets (ROA) and the natural log of market capitalisation (SIZE).
ROA is negatively correlated with MTB and LEVERAGE. LEVERAGE is positively correlated with
SIZE and negatively correlated with MTB. The most correlated control variables are MTB and ROA.
4.3. Tests for Granger causality
Prior research suggests that a company’s attitude towards CSR causes a change in its tax activity
(Watson, 2015). A test for Granger causality was conducted to evaluate whether movements in
lagged CSR activity affect tax figures and vice versa. The results for the tests are given in table 3.
It is found at the 5% significance level that overall ESG disclosure score Granger causes AETR, with
this result repeated with the CETR measure. These results have taken into account the panel
characteristics of the data (observations that cross between cross-sections are not allowed simply to
overlap) and the findings confirm evidence from prior studies that CSR activity affects a company’s
tax behaviour.
Table 3: Tests for Granger causality
Null Hypothesis: F-Statistic P-Value
CSROVERALL does not Granger Cause AETR 4.3559 0.0139
AETR does not Granger Cause CSROVERALL 0.08868 0.9152
CSROVERALL does not Granger Cause CETR 5.86801 0.0033
CETR does not Granger Cause CSROVERALL 0.88063 0.4159
Data Source: Bloomberg
AETR: Represents accounting ETR ratio. CETR: Represents cash ETR ratio. CSROVERALL: Represents overall
Bloomberg ESG disclosure ratio.
4.4 Fixed effects regression statistical procedures
For both models 3 and 4, the test for significant fixed effects (see tables 6 and 7 in the appendix)
reveals significant cross-sectional (company level) effects at the 1% significance level. This finding
indicates that company level factors exist, that must be held constant when conducting estimations.
Period effects are not significant at the 5% level and are thus not held constant when conducting the
fixed effects regression analysis.
The results for the Wald test for group wise heteroscedasticity, for models 3 and 4, are presented in
table 8 in the appendix. The results show evidence of heteroscedasticity in the residuals of both
Page 14 of 30Meditari Accountancy Research
123456789101112131415161718192021222324252627282930313233343536373839404142434445464748495051525354555657585960

Meditari Accountancy Research
15
models at the 1% significance level. The presence of heteroscedasticity can be confirmed by
observing the residuals plots, figure 1 and figure 2 in the appendix, for models 3 and 4. White cross-
section standard-errors and covariance are applied to models 3 and 4 to account for this
heteroscedasticity in the estimation of the regression parameters.
The Durbin-Watson test results, presented in table 9 in the appendix, indicate slight autocorrelation
among residuals in both models 3 and 4. As noted by Wooldridge (2001), in the presence of
heteroscedasticity or autocorrelation, a generalised method of moment’s procedure of estimating
regression parameters is more efficient for estimation. In order to account further for the presence of
heteroscedasticity and any autocorrelation in the errors in the model, cross-section weighting has
been applied to models 3 and 4, weighting companies that better fit the model as more important for
estimation than those that do not fit the model as well.
4.5 Regression parameters
Table 4 details the results of the regression procedures on models 1 to 4.
Page 15 of 30 Meditari Accountancy Research
123456789101112131415161718192021222324252627282930313233343536373839404142434445464748495051525354555657585960

Meditari Accountancy Research
16
Table 4: Between- and intra-company regression results
Between-company effects Intra-company effects
Model 1 2 Model 3 4
Dependent
Variable(across) AETR CETR
Dependent
Variable(across) AETR CETR
CSROVERALLi 0.185** 0.234**
C 0.369*** 0.566***
(2.358) (2.121) (11.404) (4.864)
ROAi -0.349* -0.365*
CSROVERALLi,t 0.022 -0.002
(-1.791) (-2.01) (0.877) (-0.041)
LEVERAGEi -0.298*** -0.159
CSROVERALLi,t-1 -0.067** -0.072***
(-2.896) (-1.154) (-2.460) (-3.106)
MTBi 0.017*** 0.009
ROAi,t -0.158*** -0.227***
(2.936) (1.333) (-2.616) (-3.806)
RETAILi 0.216*** 0.247***
LEVERAGEi,t -0.084*** 0.377***
(5.008) (4.363) (-2.844) (11.484)
INDUSTRIALSi 0.257*** 0.242***
SIZEi,t -0.015 -0.07***
(5.973) (4.671) (-1.609) (-2.765)
FINANCIALSi 0.171*** 0.109
MTBi,t 0.002 0.001
(4.674) (1.515) (1.130) (0.919)
RESOURCESi 0.201*** 0.161**
(2.996) (2.254) R-squared 0.495 0.363 R-squared 0.955 0.907
R-squared Adjusted 0.405 0.248 R-squared Adjusted 0.946 0.887
White Standard Errors Yes Yes Cross-Section Fixed
Effects Yes Yes
Period Fixed Effects No No
White Cross Section Yes Yes
Cross-Section Weights Yes Yes
*Significant at the 10% level, **Significant at the 5% level, ***Significant at the 1% level
Data source: Bloomberg
i: Refers to the company in question. t: Refers to the time period in question. C: Represents the shared constant
among companies. AETR: Represents accounting ETR as a ratio. CETR: Represents cash ETR as a ratio.
CSROVERALL: Represents overall Bloomberg ESG disclosure ratio. ROA: Represents the Return on Assets
ratio. LEVERAGE: Represents the long-term debt over total assets ratio. SIZE: Represents the natural log of
market capitalisation. MTB: Represents the market-to-book ratio. RETAILi, INDUSTRIALSi, FINANCIALSi,
RESOURCESi: Dummy variables classifying companies into sectors.
4.5.1. AETR: Model 1
The results obtained from model 1 appear in Table 4. Model 1 is the cross-section regression model,
depicting the between-company relationship, applied on accounting effective tax rate (AETR) with
white robust standard errors applied. With an R-squared of 0.495 and adjusted R-squared 0.405, the
model has a reasonably good fit.
The regression coefficient on overall ESG disclosure is found to be positive and significantly
associated with AETR, at the 5% significance level. Overall ESG disclosure has a regression
coefficient of 0.185, which is economically significant as it implies that a 1% increase in ESG
disclosure will result in a 0.185% increase in AETR, ceteris paribus.
Page 16 of 30Meditari Accountancy Research
123456789101112131415161718192021222324252627282930313233343536373839404142434445464748495051525354555657585960

Meditari Accountancy Research
17
All the control variables have also been found to have a significant effect on AETR. Return on assets
(ROA) has a significant effect on AETR at the 10% significance level. Long-term debt over total
assets (LEVERAGE), market-to-book ratio (MTB) and all the sector dummies have significant
regression coefficients at the 1% significance level. ROA and LEVERAGE both have negative
coefficients that are economically significant. MTB has a positive coefficient that is only marginal
and is thus not economically significant.
The sector dummies all have positive coefficients, with companies in the financial sector paying the
least tax relative to all the other sectors and companies in the industrial sector paying the greatest tax
relative to all other sectors.
4.5.2. CETR: Model 2
The results obtained from model 2 appear in Table 4. Model 2 is the cross-section regression model,
depicting the between-company relationship, applied on cash effective tax rate (CETR) with white
robust standard errors applied. With an R-squared of 0.363 and adjusted R-squared 0.248, the model
does not fit as well as the other models estimated.
It is found that the regression coefficient of overall ESG disclosure is positive and significantly
associated with CETR, at the 5% significance level, confirming the result obtained, applied on
AETR. Overall ESG disclosure has a regression coefficient of 0.234, which is economically
significant as it implies that a 1% increase in CSR disclosure will result in a 0.234% increase in
CETR, ceteris paribus. This confirms the above-mentioned result that companies with higher relative
CSR activity will be less tax aggressive.
Only four control variables have been found to have a significant effect on CETR. Return on assets
(ROA) has a significant effect on CETR at the 10% significance level. The dummy variables for the
retail (RETAIL) and industrial (INDUSTRIALS) sectors have a significant effect on CETR at the
1% significance level. The dummy variable for the resources sector (RESOURCES) has a significant
effect on CETR at the 5% significance level.
As in the case of AETR, the sector dummies all have positive coefficients, with companies in the
financial (FINANCIALS) sector paying the least tax relative to all the other sectors. In the case of
CETR, companies in the retail sector pay the greatest tax relative to all other sectors.
ROA and long-term debt over total assets (LEVERAGE) both have negative coefficients that are
economically significant. Market-to-book (MTB) ratio has a positive coefficient that is only marginal
and is not economically significant.
4.5.3. AETR: Model 3
The results obtained from model 3 appear in Table 4. Model 3 is the fixed effects regression model,
depicting the intra-company relationship, applied on accounting effective tax rate (AETR). Cross-
section weights and robust standard errors have been applied when estimating these regression
coefficients. With an R-squared of 0.955 and adjusted R-squared of 0.946 the model has an overall
good fit, which is to be expected given that cross-section weighting has been applied. The model’s F-
statistic is also significant at the 1% significance level indicating that the overall model is significant.
There are three variables that have a statistically significant effect on AETR at the 5% significance
level: lagged overall ESG disclosure (CSROVERALLi,t-1), return on assets (ROAi,t) and long-term
debt over total assets (LEVERAGEi,t). CSROVERALLi,t-1, ROAi,t and LEVERAGEi,t have a
negative effect on AETR. The coefficient on CSROVERALLi,t-1 is -0.067. This is economically
significant as a 1% increase in ESG disclosure in period t on average causes a 0.067% decrease in
Page 17 of 30 Meditari Accountancy Research
123456789101112131415161718192021222324252627282930313233343536373839404142434445464748495051525354555657585960

Meditari Accountancy Research
18
AETR in period t+1. This indicates that companies with higher CSR activity in a particular period
are, generally speaking, more tax aggressive in the following period.
Current year ESG disclosure is positively related to AETR, but this is not significantly different from
nil.
4.5.4. CETR: Model 4
The results obtained from model 4 appear in Table 4. Model 4 is the fixed effects regression model,
depicting the intra-company relationship, applied on cash effective tax rate (CETR). Cross-section
weights and robust standard errors have been applied when estimating these regression coefficients.
With an R-squared of 0.90 and adjusted R-squared of 0.88 the model has a good overall fit, which is
to be expected given that cross-section weighting has been applied. The model’s F-statistic is also
significant at the 1% significance level indicating that at least some variables in the model are
significant.
Four variables have a statistically significant effect on CETR at the 1% significance level. These are
lagged overall ESG disclosure (CSROVERALLi,t-1), return on assets (ROAi,t) and long-term debt
over total assets (LEVERAGEi,t) and the natural log of market capitalisation (SIZEi,t). The
coefficient on CSROVERALLi,t-1 is -0.072: this is economically significant as a 1% increase in ESG
disclosure in period t on average causes a 0.072% decrease in CETR in period t+1. This suggests
that companies with higher CSR activity in a particular period are more tax aggressive generally
spealking, in the following period. ROAi,t and SIZEi,t have a negative effect on CETR.
LEVERAGEi,t has a positive effect on CETR.
Current year ESG disclosure is positively related to CETR, but this is not significantly different from
nil.
5. Discussion
In this study it is found that there is a positive and significant correlation between overall ESG
disclosure and effective tax rate (ETR) both in the case of cash ETR (CETR) and accounting ETR
(AETR). This gives reason to believe that companies that are more socially responsible, by engaging
in more socially responsible activity, are less tax aggressive.
The tests for Granger causality indicate that overall ESG disclosure Granger causes AETR, with
these results repeated with CETR. This indicates that a movement in CSR activity precedes a
movement in cash and accounting ETRs. To investigate this relationship further the intra-company
relationship (within companies), that includes a lagged ESG disclosure term, is analysed later.
Upon considering the between-company effects (across companies), a positive relation is found
between tax aggressiveness and ESG disclosureand this is both economically and statistically
significant. This confirms the finding in the correlation table. Model 1 shows that an increase in ESG
disclosure by 1% will on average increase AETR by 0.185%. Model 2 displays an even stronger
relationship with the same move in ESG disclosure resulting in a 0.234% increase in CETR. This
finding shows that companies that are more socially responsible are less tax aggressive (tend to pay
higher taxes) relative to companies that are less socially responsible. This result confirms the
findings in prior literature that more socially responsible companies are less tax aggressive (Lanis &
Richardson, 2012A; Laguir et al., 2015; Hoi et al., 2013).
These results appear to be consistent with the expectations laid out prior to this study. It is expected
that more socially responsible companies in South Africa should be less tax aggressive given the
strong corporate governance culture in South Africa and the need for redress in the country. This
result seems to suggest that large companies in South Africa consider fair tax payment as a part of
Page 18 of 30Meditari Accountancy Research
123456789101112131415161718192021222324252627282930313233343536373839404142434445464748495051525354555657585960

Meditari Accountancy Research
19
their social responsibility, subscribing to Matten and Cane’s (2005) liberal view on corporate
citizenship, in terms of which, companies should not prevent government from meeting its
obligations. However, this only reveals a company’s tax paying behaviour relative to other
companies on the stock exchange but does not show changes in their tax paying behaviour. This
change reveals the company’s intent and attitude toward fair tax payment. Thus, to interrogate South
African companies’ attitudes further, concerning the relationship between social responsibility and
tax aggressiveness in a given company, the intra-company relationship is observed.
Contrasting results are found when considering the intra-company effects of CSR on tax
aggressiveness. In the fixed effects models, a statistically significant negative relationship is found
between lagged ESG disclosure and ETR. In the case of CETR, it was found that for every 1%
increase in ESG disclosure, the ETR of the following year decreases by 0.072%. This might seem
small, but when a company’s CSR score as measured by the Bloomberg ESG score increases by
10%, the tax paid will on average decrease by 0.72%. A 0.72% decrease in the tax rate of a company
translates into millions of Rand in the case of these companies, which usually have large income
before tax figures. This negative relationship is consistent when looking at both AETR and CETR.
These results indicate that while companies involved in more CSR activity will generally be less tax
aggressive, an incremental increase in CSR activity results in an incremental increase in tax
aggressiveness in the following year. This incremental increase, considering intra-company effects,
indicates that South African companies do not consider their tax behaviour to be a part of their social
responsibility. This result is contrary to the expectations of companies subscribing to Matten and
Cane’s (2005) liberal view on social responsibility, suggesting that companies optimise for their
image using CSR behaviour and optimise for profit by being tax aggressive. This finding is in
contrast to the suggestions of prior literature to the effect that companies consider tax payment as a
part of their CSR obligation (Lanis & Richardson, 2012A; Laguir et al., 2015).
The positive intra-company relationship between tax aggressiveness and CSR activity could also
indicate that South African companies follow the shareholder primacy view on CSR when it comes
to tax payments; according to that view, a company’s top priority is to maximise returns to its
shareholders (Friedman, 1970). By optimising for both CSR image and profit, companies are able to
market themselves as socially responsible (thus appealing to a wider range of socially conscious
investors, customers and suppliers) and maximise their profits through reducing their tax burden over
time. Both these actions add value to shareholders through an improved corporate image and reduced
costs. The focus here is that companies that are more motivated by profit are more likely to report
CSR activities better, as well as practice tax aggressiveness.
6. Opportunities for further research
There are multiple opportunities for further research that can build on this study. The first of these
arises from observation of the information presented in table 11 in the appendix: this details the
ETRs and overall ESG scores of the sample companies by sector. Here, the companies that are the
most tax aggressive in their respective sectors can be identified; companies with lower tax rates tend
to be more tax aggressive. These companies with the lowest tax rates present good candidates for
further case-study research, especially if these tax rates are low relative to their ESG scores.
Secondly, this study identifies a novel manner to study the relationship between tax and CSR in the
analysis of the relationship within companies. There is an opportunity for the within company
relationship to be studied with the same sample companies used in prior research such as the studies
conducted by Lanis and Richardson (2012A), Laguir et al. (2015) and Hoi et al. (2015). This will
determine whether this paper’s within company findings are consistent internationally. Thirdly, due
to making use of proxies for tax aggressiveness and CSR activity mentioned above, there is an
opportunity to test the above findings with other proxies.
Page 19 of 30 Meditari Accountancy Research
123456789101112131415161718192021222324252627282930313233343536373839404142434445464748495051525354555657585960

Meditari Accountancy Research
20
7. Conclusion
The paper began with a review of past literature on CSR and corporate citizenship. After describing
tax aggressiveness, the paper presented a case for tax aggression to be included in both the definition
of CSR as well as corporate citizenship. It did this in the context of South Africa’s developing
country status and the country’s present focus on corporate citizenship through the King Reports on
Corporate Governance. The research question is therefore: What is the relationship between tax
aggressiveness and the CSR activity of large companies on the JSE? The paper presented past
literature on this topic conducted outside of South Africa where it found that more socially
responsible companies were less tax aggressive.
This paper proceeded to test the relationship between effective tax rate and ESG disclosure across
companies (between) and within (intra) companies with a sample of 47 of the top companies by
market capitalisation on the Johannesburg Stock Exchange (JSE). In the case of the between-
company effects, CSR activity was found to be negatively related to tax aggressiveness. Thus, when
comparing companies to each other, those that are more involved in CSR activities are better tax-
paying corporate citizens. A positive intra-company relationship was found between ESG disclosure
and tax aggressiveness, contrary to the between-company findings. Therefore, as companies invest in
more CSR activities over time, they are likely during this same time to pay less tax, hence becoming
more tax aggressive. This intra-company relationship reveals that companies in South Africa take a
shareholder primacy view when considering their tax liability and social responsibility. They act to
maximise returns to shareholders by improving their social appearance through increased CSR
activities and minimising costs through tax efficiency.
This study contributes to present research by analysing a more appropriate sample of larger
companies in the developing market context, including corporations that can exercise discretion over
both their tax liability and CSR activity by virtue of their size. This paper is an entry point of
empirical analysis into the relationship between CSR and tax behaviour in South Africa. The results
are found to be significant and valuable for a range of stakeholders in the South African context,
including the King Committee and members of the public. This paper expands on prior literature by
analysing the intra-company relationship between CSR activity and tax aggressiveness; that prior
literature focused only on analysing the between-company relationship. Analysing the intra-company
relationship makes it possible to make inferences on company level behaviour.
8. Limitations
Because most prior literature describes studies conducted in developed markets, the intra-company
contradictory findings could well be an indication of the developing country status of South Africa.
The companies in these developed markets are under more public scrutiny with regard to tax
aggressiveness; this is because of the sophistication of the investors and customers in developed
markets as well as stricter and better enforced tax regulation when compared to developing markets
(IMF, 2015). Companies in developed markets that prioritise their CSR statuses therefore take tax
aggressiveness into consideration. In South Africa, it would seem that companies do not consider not
being tax aggressive as part of their social responsibility.
Another potential limitation to this study is that the JSE is unique in its structure given that it is an
exchange dominated by a few large companies with a very high concentration (Raubenheimer,
20010. This could mean that the findings are a mere artefact of the uniqueness of the JSE. Thirdly,
this study only considers listed companies in South Africa because of the availability of data;
information on large unlisted corporations operating in South Africa is not readily available.
Fourthly, the effective tax rate (measuring tax aggressiveness) is calculated using financial statement
data because company tax submissions are private and not released to the public. Plesko (2003) finds
that tax measures calculated based on accounting data are significantly different from actual relative
Page 20 of 30Meditari Accountancy Research
123456789101112131415161718192021222324252627282930313233343536373839404142434445464748495051525354555657585960

Meditari Accountancy Research
21
tax figures. Last, CSR disclosure, as measured by the Bloomberg ESG disclosure score, was used as
a proxy for CSR activity in this study. Perhaps the choice of proxy unduly influenced the results.
Page 21 of 30 Meditari Accountancy Research
123456789101112131415161718192021222324252627282930313233343536373839404142434445464748495051525354555657585960

Meditari Accountancy Research
22
References
Ackers, B. and Eccles, N.S. (2015), "Mandatory corporate social responsibility assurance practices.
The case of King III in South Africa", Accounting, Auditing and Accountability Journal, Vol.
28, No. 4, pp. 515-550.
Adhikari, A., Derashid, C. and Zhang, H. (2006), "Public policy, political connections, and effective
tax rates: Longitudinal evidence from Malaysia", Journal of Accounting and Public Policy, Vol.
25, No. 5, pp. 574-595.
Armstrong, C.S., Blouin, J.L. and Larcker, D.F. (2012), "The incentives for tax planning", Journal of
Accounting and Economics, vol. 53, no. 1, pp. 391-411.
BBC News, (2012). “Starbucks, Google and Amazon grilled over UK tax avoidance (BBC News
Coverage)”, available at: https://www.youtube.com/watch?v=VcZF_DxQ5cU (accessed: 4 April
2015).
Bowman, E.H. and Haire, M. (1976), "Social impact disclosure and corporate annual reports",
Accounting, Organizations and Society, Vol. 1, No. 1, pp. 11-21.
Braithwaite, J. (2005), Market in vice, markets in virtue, Oxford University Press, Sydney, Australia.
Carroll, A.B. (1979), "A three-dimensional conceptual model of corporate performance", Academy of
Management Review, Vol. 4, No. 4, pp. 497-505.
Carroll, A.B. (1999), "Corporate social responsibility evolution of a definitional construct", Business
& Society, Vol. 38, No. 3, pp. 268-295.
Cho, C.H., Roberts, R.W. and Patten, D.M. (2010), "The language of US corporate environmental
disclosure", Accounting, Organizations and Society, Vol. 35, No. 4, pp. 431-443.
Christensen, J. and Murphy, R. (2004), “The social irresponsibility of corporate tax avoidance:
taking CSR to the bottom line”, Development, Vol. 47, No. 3, pp 37-44.
Clarkson, P.M., Li, Y., Richardson, G.D. and Vasvari, F.P. (2008), "Revisiting the relation between
environmental performance and environmental disclosure: An empirical analysis", Accounting,
Organizations and Society, Vol. 33, No. 4, pp. 303-327.
Cobham, A. (2005), “Tax evasion, tax avoidance and development finance”, working paper [129],
University of Oxford, Oxford, September 2005.
Davis, K. (1960), "Can business afford to ignore social responsibilities?", California Management
Review, Vol. 2, No. 3, pp. 70-76.
De Jager, P. (2008), "Panel data techniques and accounting research", Meditari Accountancy
Research, Vol. 16, No. 2, pp. 53-68.
Dowling, G. (2013), “The curious case of corporate tax avoidance: Is it socially irresponsible?”,
Journal of Business Ethics, Vol. 124, No. 1, pp. 173-184.
Freeman, R.E. (1984), Strategic management: a stakeholder approach, Pitman, Boston,
Massachusetts.
Friedman, M. (1970), "The social responsibility of business is to increase its profits", New York
Times Magazine, Vol. 13, pp. 32-33.
Glavas, A. and Piderit, S.K. (2009), "How does doing good matter?", Journal of Corporate
Citizenship, Vol. 2009, No. 36, pp. 51-70.
Gupta, S. and Newberry, K. (1997), “Determinants of the variability in corporate effective tax rates:
Evidence from longitudinal data”, Journal of Accounting and Public Policy, Vol. 16, No. 1, pp.
1-34.
Heald, M. (1957), "Management's responsibility to society: The growth of an idea", The Business
History Review, Vol. 31, No. 4, pp. 375-384.
Heald, M. (1970), The social responsibilities of business: company and community 1900-1960,
Transaction Publishers, New Jersey.
Hoi, C.K., Wu, Q. and Zhang, H. (2013), “Is corporate social responsibility (CSR) associated with
tax avoidance? Evidence from irresponsible CSR activities”, The Accounting Review, Vol. 88,
No. 6, pp. 2025-2059.
Ingram, R.W. and Frazier, K.B. (1980), "Environmental performance and corporate disclosure",
Journal of Accounting Research, Vol. 18, No. 2, pp. 614-622.
Page 22 of 30Meditari Accountancy Research
123456789101112131415161718192021222324252627282930313233343536373839404142434445464748495051525354555657585960

Meditari Accountancy Research
23
International Monetary Fund (2015), “Current challenges in revenue mobilization: Improving tax
compliance”, available at: https://www.imf.org/external/np/pp/eng/2015/020215a.pdf (accessed
11 October 2015).
Jefferis, K. and Smith, G. (2005), "The changing efficiency of African stock markets", South African
Journal of Economics, Vol. 73, No. 1, pp. 54-67.
Jenkins, R. and Newell, P. (2013), “CSR, tax and development”, Third World Quarterly, Vol. 34,
No. 3, pp. 378-396.
Jensen, M.C. and Meckling, W.H. (1976), “Theory of the firm: Managerial behavior, agency costs
and ownership structure”, Journal of Financial Economics, Vol. 3, No. 4, pp. 305-360.
Johannesburg Stock Exchange (2015), “The JSE socially responsible investment (SRI) index”,
available at: https://www.jse.co.za/services/market-data/indices/socially-responsible-
investment-index (accessed 15 April 2015).
Khan, M., Yousaf, Z., Khan, Z.A. and Yasir, D.M. (2014), "Analysis of the relationship between
CSR and tax avoidance: An evidence from Pakistan", The International Journal of Business &
Management, Vol. 2, No. 7, pp. 53-57.
KPMG, (2014), “WEG voted South Africa no 1 for auditing and reporting standards”, available at:
http://www.sablog.kpmg.co.za/2014/09/wef-voted-south-africa-1-auditing-reporting-standards/
(accessed 3 October 2015).
Kim, K.A. and Limpaphayom, P. (1998), "Taxes and firm size in Pacific-Basin emerging
economies", Journal of International Accounting, Auditing and Taxation, Vol. 7, No. 1, pp. 47-
68.
Laguir, I., Stagliano, R. and Elbaz, J. (2015), "Does corporate social responsibility affect corporate
tax aggressiveness?", Journal of Cleaner Production, Vol. 107, pp. 662-675.
Lanis, R. and Richardson, G. (2007), "Determinants of the variability in corporate effective tax rates
and tax reform: Evidence from Australia", Journal of Accounting and Public Policy, Vol. 26,
No. 6, pp. 689-704.
Lanis, R. and Richardson, G. (2012A), "Corporate social responsibility and tax aggressiveness: An
empirical analysis", Journal of Accounting and Public Policy, Vol. 31, No. 1, pp. 86-108.
Lanis, R. and Richardson, G. (2012B), "Corporate social responsibility and tax aggressiveness: A
test of legitimacy theory", Accounting, Auditing and Accountability Journal, Vol. 26, No. 1, pp.
75-100.
Lantos, G.P. (2001), "The boundaries of strategic corporate social responsibility", Journal of
Consumer Marketing, Vol. 18, No. 7, pp. 595-632.
Lunden, I. (2015), “UK chancellor says ‘Google tax’ on diverted profits will come into effect next
month”, available at: http://techcrunch.com/2015/03/18/budget-google-tax/ (accessed 4 April
2015).
Matten, D. and Crane, A. (2005), “Corporate citizenship: toward an extended theoretical
conceptualization”, Academy of Management Review, Vol. 30, No. 1, pp. 166-179.
Mio, C., Venturelli, A., and Leopizzi, R. (2015), “Management by objectives and corporate social
responsibility disclosure: First results from Italy”, Accounting, Auditing and Accountability
Journal, Vol. 28, No. 3, pp. 325-364.
Modigliani, F. and Miller, M.H. (1958), "The cost of capital, corporation finance and the theory of
investment", The American Economic Review, Vol. 48, No. 3, pp. 261-297.
O’Donovan, G. (2002), “Environmental disclosures in the annual report: Extending the applicability
and predictive power of legitimacy theory”, Accounting, Auditing and Accountability Journal,
Vol. 15, No. 3, pp. 344-371.
Plesko, G. (2003), “An evaluation of alternative measures of corporate tax rates”, Journal of
Accounting and Economics, Vol. 35, No. 2, pp. 201-226.
Porter, M.E. and Kramer, M.R. (2006), "The link between competitive advantage and corporate
social responsibility", Harvard Business Review, Vol. 84, No. 12, pp. 78-92.
Raubenheimer, H. (2010), “Concentration in the South African equity market and its implied
restrictions on the long only equity fund manager's opportunity set”, South African Journal of
Business Management, Vol. 41, No. 4, pp. 1-10.
Page 23 of 30 Meditari Accountancy Research
123456789101112131415161718192021222324252627282930313233343536373839404142434445464748495051525354555657585960

Meditari Accountancy Research
24
Rego, S.O. (2003), "Tax-avoidance activities of US multinational corporations", Contemporary
Accounting Research, Vol. 20, No. 4, pp. 805-833.
Robinson, J.R., Sikes, S.A. and Weaver, C.D. (2010), "Performance measurement of corporate tax
departments", The Accounting Review, Vol. 85, No. 3, pp. 1035-1064.
Sethi, S.P. (1975), "Dimensions of corporate social performance: An analytical framework",
California Management Review, Vol. 17, No. 3, pp. 58-64.
Sharenet, (2015), “Top 100 Companies by market capital: 2015/10/02”, available at:
http://www.sharenet.co.za/index.phtml?content=/free/topco.phtml (accessed on 3 October
2015).
Sikka, P. (2010), “Smoke and mirrors: corporate social responsibility and tax avoidance”,
Accounting Forum, Vol. 34, No. 3-4, pp.153-168.
Slemrod, J. (2004), "The economics of corporate tax selfishness", working paper [10858], National
Bureau of Economic Research, Cambridge, October 2004.
Steyn, L. (2014), “Clampdown on tax avoidance”, available at:
http://mg.co.za/article/2014-11-20-clampdown-on-tax-avoidance (accessed 4 April 2015).
The Institute of Directors in Southern Africa, (2009), “The King code of corporate governance for
South Africa”, available at: http://african.ipapercms.dk/IOD/KINGIII/kingiiireport/ (accessed 4
April 2015).
Titcomb, J. (2014), “Starbucks to pay corporations tax on profits in the UK after HQ move”,
available at:
http://www.telegraph.co.uk/finance/newsbysector/retailandconsumer/10769497/Starbucks-to-
pay-corporation-tax-on-profits-in-the-UK-after-HQ-move.html (accessed 4 April 2015).
Waddock, S.A. and Graves, S.B. (1997), "The corporate social performance-financial performance
link", Strategic Management Journal, Vol. 18, No. 4, pp. 303-319.
Watson, L. (2015), "Corporate social responsibility, tax avoidance, and earnings performance",
Journal of the American Taxation Association, Vol. 37, No. 2, pp. 1-21.
Wooldridge, J.M. (2001), "Applications of generalized method of moments estimation", Journal of
Economic Perspectives, Vol. 15, No. 4, pp. 87-100.
World Bank. (2015), “South Africa country-level fiscal policy notes”, available at:
http://www.taxcom.org.za/docs/Sector%20Study%20of%20Effective%20Tax%20Burden%20in
%20South%20Africa%20-%20Part%201%20-%20June%202015.pdf (accessed 3 October
2015).
Wu, M. & Shen, C. (2013), "Corporate social responsibility in the banking industry: Motives and
financial performance", Journal of Banking and Finance, Vol. 37, No. 9, pp. 3529-3547.
Page 24 of 30Meditari Accountancy Research
123456789101112131415161718192021222324252627282930313233343536373839404142434445464748495051525354555657585960

Meditari Accountancy Research
25
Appendix
Table 5: Descriptive statistics for original dataset before winzorisation
CETR AETR CSROVERALL ROA LEVERAGE SIZE MTB
Mean 0.269 0.260 0.369 0.099 0.140 4.692 3.285
Median 0.266 0.284 0.378 0.090 0.103 4.654 2.443
Maximum 7.333 3.236 0.645 0.872 0.611 6.262 33.069
Minimum -1.708 -1.847 0.099 -0.294 0.000 3.030 -23.112
Std. Dev. 0.482 0.282 0.135 0.108 0.138 0.583 3.293
Skewness 10.261 0.994 -0.089 1.622 1.205 0.144 1.992
Kurtosis 143.984 42.906 2.320 11.649 3.980 3.046 32.047
Jarque-Bera 393264.90 30930.80 7.03 1628.29 129.67 1.58 16046.24
Probability 0.000 0.000 0.030 0.000 0.000 0.454 0.000
Sum 125.121 120.925 126.121 45.335 64.410 2102.009 1471.716
Sum Sq. Dev. 107.999 36.811 6.210 5.284 8.743 152.142 4846.121
Observations 465 465 342 458 460 448 448
Data Source: Bloomberg
AETR: Represents accounting ETR as a ratio. CETR: Represents cash ETR as a ratio. CSROVERALL: Represents
overall Bloomberg ESG disclosure ratio. ROA: Represents the Return on Assets ratio. LEVERAGE: Represents the long-
term debt over total assets ratio. SIZE: Represents the natural log of market capitalisation. MTB: Represents the market-
to-book ratio.
Table 5 details the descriptive statistics of all the variables collected for the companies in the sample
during the period 2005 to 2014, using the original dataset before winsorisation.
Table 6: AETR fixed effects test
Redundant Fixed Effects Tests
Equation: Untitled
Test cross-section and period fixed effects
Effects Test Statistic d.f. Prob.
Cross-section F 3.827 (46,269) 0.000
Cross-section Chi-square 166.134 46 0.000
Period F 0.754 (9,269) 0.659
Period Chi-square 8.226 9 0.512
Cross-Section/Period F 3.494 (55,269) 0.000
Cross-Section/Period Chi-square 177.869 55 0.000
Table 6 details the fixed effects diagnostics for Model 3, the fixed effects model with AETR as its
dependent variable. Cross-section fixed effects are significant at the 1% significance level, indicating
that there is time invariant data affecting the relationship between the dependent, independent and
control variables. Period fixed effects are not statistically significant. Thus fitting model 3 taking
cross-section fixed effects into account is statistically valid and provides for a better fit model.
Page 25 of 30 Meditari Accountancy Research
123456789101112131415161718192021222324252627282930313233343536373839404142434445464748495051525354555657585960
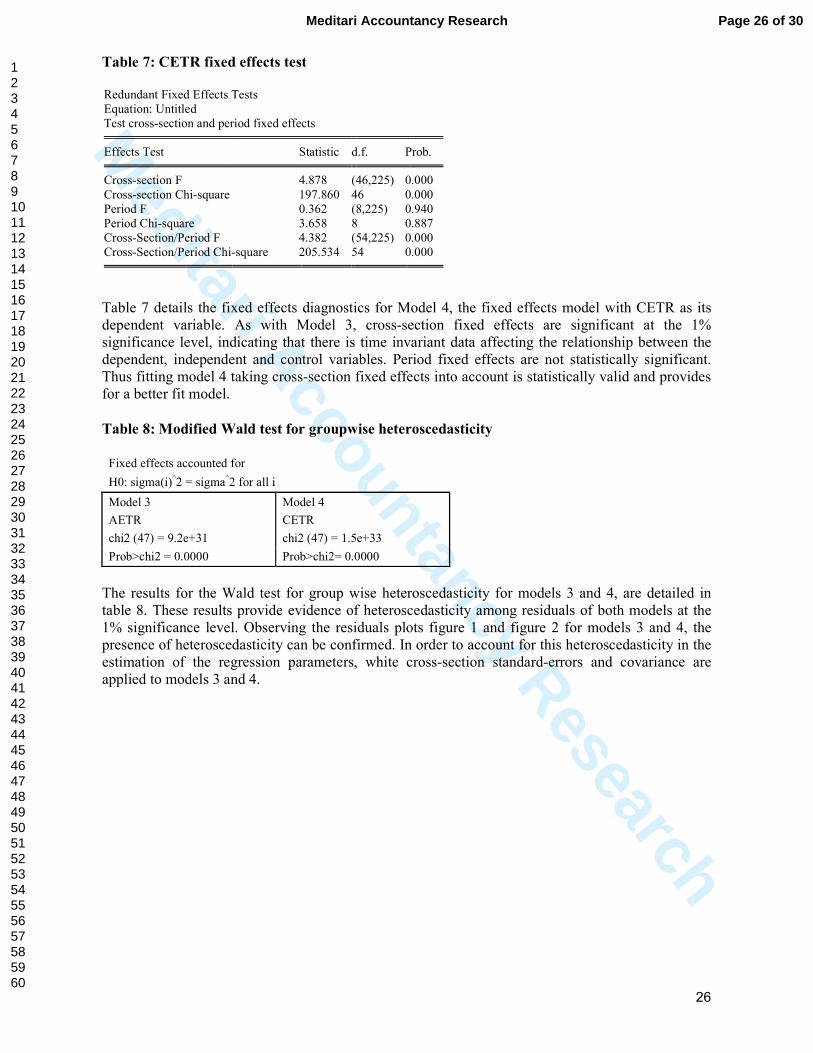
Meditari Accountancy Research
26
Table 7: CETR fixed effects test
Redundant Fixed Effects Tests
Equation: Untitled
Test cross-section and period fixed effects
Effects Test Statistic d.f. Prob.
Cross-section F 4.878 (46,225) 0.000
Cross-section Chi-square 197.860 46 0.000
Period F 0.362 (8,225) 0.940
Period Chi-square 3.658 8 0.887
Cross-Section/Period F 4.382 (54,225) 0.000
Cross-Section/Period Chi-square 205.534 54 0.000
Table 7 details the fixed effects diagnostics for Model 4, the fixed effects model with CETR as its
dependent variable. As with Model 3, cross-section fixed effects are significant at the 1%
significance level, indicating that there is time invariant data affecting the relationship between the
dependent, independent and control variables. Period fixed effects are not statistically significant.
Thus fitting model 4 taking cross-section fixed effects into account is statistically valid and provides
for a better fit model.
Table 8: Modified Wald test for groupwise heteroscedasticity
Fixed effects accounted for
H0: sigma(i)^2 = sigma
^2 for all i
Model 3 Model 4
AETR CETR
chi2 (47) = 9.2e+31 chi2 (47) = 1.5e+33
Prob>chi2 = 0.0000 Prob>chi2= 0.0000
The results for the Wald test for group wise heteroscedasticity for models 3 and 4, are detailed in
table 8. These results provide evidence of heteroscedasticity among residuals of both models at the
1% significance level. Observing the residuals plots figure 1 and figure 2 for models 3 and 4, the
presence of heteroscedasticity can be confirmed. In order to account for this heteroscedasticity in the
estimation of the regression parameters, white cross-section standard-errors and covariance are
applied to models 3 and 4.
Page 26 of 30Meditari Accountancy Research
123456789101112131415161718192021222324252627282930313233343536373839404142434445464748495051525354555657585960

Meditari Accountancy Research
27
Table 9: Durbin-Watson statistics for models 3 & 4 Durbin-Watson statistic
Model 3 (AETR) 2.659252
Model 4 (CETR) 2.192424
The Durbin-Watson test in table 9 indicates slight autocorrelation among residuals in both models 3
and 4. To account further for the presence of heteroscedasticity and any autocorrelation in the errors
in the model, cross-section weighting is applied to the models 3 and 4, weighting companies that fit
the model relatively well as being more important for estimation than those that do not fit the model
as well. As noted by Wooldridge (2001), in the presence of heteroscedasticity or autocorrelation, a
generalised method of moment’s procedure of estimating regression parameters is more efficient for
estimation.
Table 10: Model variables, descriptions and supporting papers
Variables Description
Papers that find significant
relationships with ETR
AETRi,t Accounting Effective Tax Rate:
Tax Expense/Profit before tax
Hoi et al. (2013)
Lanis and Richardson (2012)
Laguir et al. (2015)
CETRi,t Cash Effective Tax Rate: Cash paid for
taxes/Profit before tax
CSROVERALLi,t Overall Bloomberg ESG disclosure score for
company i in year t
CSROVERALLi,t-1 Overall Bloomberg ESG disclosure score for
company i in year t-1
ROAi,t Return on Assets for company i in year t. Kim and Limpaphayom (1998)
LEVERAGEi,t Long-term debt over total assets for company
i in year t
Gupta and Newberry (1997)
Adhikari et al. (2006)
SIZEi,t Natural log of market capitalisation for
company i in year t
Lanis and Richardson (2007)
Gupta and Newberry (1997)
MTBi,t Market-to-book value for company i in year t Kim and Limpaphayom (1998)
RETAILi Dummy variable representing whether a
company is a retail company.
INDUSTRIALSi Dummy variable representing whether a
company is an industrial company.
FINANCIALSi Dummy variable representing whether a
company is a financial company.
RESOURCESi Dummy variable representing whether a
company is a resources company.
Page 27 of 30 Meditari Accountancy Research
123456789101112131415161718192021222324252627282930313233343536373839404142434445464748495051525354555657585960

Meditari Accountancy Research
28
Table 11: Table of effective tax rates and ESG disclosure scores by sector
Average values for the period 2005 to 2014
Accounting ETR Cash ETR Overall Bloomberg ESG
disclosure score
RESOURCES
BHP Billiton PLC 0.31 0.31 60.54
Glencore Ltd 0.09 0.15 41.82
Anglo American PLC 0.33 0.32 45.21
Anglo American Platinum Ltd 0.24 0.22 49.11
Kumba Iron Ore Ltd 0.30 0.22 51.24
Impala Platinum Holdings Ltd 0.30 0.27 49.71
AngloGold Ashanti Ltd 0.28 0.18 47.25
FINANCIALS
FirstRand Ltd 0.25 0.26 35.23
Old Mutual PLC 0.31 0.38 33.48
Standard Bank Group Ltd 0.28 0.30 44.02
Barclays Africa Group Ltd 0.28 0.31 36.06
Remgro Ltd 0.06 0.05 30.52
Nedbank Group Ltd 0.24 0.24 51.17
Sanlam Ltd 0.27 0.29 36.90
Intu Properties PLC 0.00 0.06 41.42
Investec Ltd 0.22 0.19 41.60
Rand Merchant Insurance Holdings Ltd 0.17 0.18 15.94
Capital & Counties Properties PLC 0.05 -0.03 22.15
Growthpoint Properties Ltd 0.22 0.22 21.44
Discovery Ltd 0.32 0.18 36.34
Capitec Ltd 0.30 -0.20 26.14
Brait SE Ltd 0.08 0.04 11.51
INDUSTRIALS
British American Tobacco PLC 0.28 0.28 50.83
SABMiller PLC 0.28 0.25 39.67
MTN Group Ltd 0.31 0.26 28.77
Sasol Ltd 0.33 0.29 55.83
Compagnie Financiere Richemont SA 0.14 0.14 33.37
Vodacom Group Ltd 0.37 0.37 35.89
Naspers Ltd 0.28 0.30 20.51
Bidvest Group Ltd 0.28 0.27 35.29
Mondi Ltd 0.41 0.29 45.41
Tiger Brands Ltd 0.28 0.32 28.05
Telkom Ltd 0.29 0.34 41.46
Aspen Pharmacare Holdings Ltd 0.26 0.22 39.83
Life Healthcare Group Holdings Ltd 0.30 0.29 11.16
Imperial Holdings Ltd 0.30 0.32 41.37
Netcare Ltd 0.15 0.32 22.37
Mediclinic International Ltd 0.28 0.25 30.17
Distell Ltd 0.31 0.30 17.44
Page 28 of 30Meditari Accountancy Research
123456789101112131415161718192021222324252627282930313233343536373839404142434445464748495051525354555657585960

Meditari Accountancy Research
29
Average values for the period 2005 to 2014
Accounting ETR Cash ETR Overall Bloomberg ESG
disclosure score
RETAIL
Shoprite Holdings Ltd 0.34 0.32 28.23
Steinhoff International Holdings Ltd 0.12 0.12 30.53
Woolworths Holdings Ltd 0.30 0.31 50.31
Truworths Ltd 0.31 0.32 35.68
Pick n Pay Ltd 0.34 0.36 34.72
Foschini Ltd 0.32 0.34 41.15
Spar Ltd 0.31 0.31 12.92
Mr Price Group Ltd 0.30 0.31 31.90
**Tables arranged in descending order by average market capitalisation for the period 2005 to 2014
Figure 1: AETR residual plot for fixed effects regression
Figure 2: CETR residual plot for fixed effects regression
-.6
-.4
-.2
.0
.2
.4
.6
AGL - 06
AMS - 09
APN - 11
BGA - 10
BIL - 11
BTI - 12
CCO - 14
CPI - 08
DSY - 09
FSR - 11
GRT - 12
INL - 10
IPL - 12
KIO - 10
MDC - 09
MND - 11
MSM - 13
NED - 09
NPN - 12
OML - 08
PIK - 12
SAB - 08
SBK - 10
SHP - 10
SLM - 13
SPP - 11
TBS - 14
TRU - 10
WHL - 09
AETR Residuals
Page 29 of 30 Meditari Accountancy Research
123456789101112131415161718192021222324252627282930313233343536373839404142434445464748495051525354555657585960

Meditari Accountancy Research
30
Figure 2: CETR residual plot for fixed effects regression
-.6
-.4
-.2
.0
.2
.4
.6
.8
AGL - 06
AMS - 09
APN - 11
BGA - 10
BIL - 11
BTI - 12
CCO - 14
CPI - 08
DSY - 09
FSR - 11
GRT - 12
INL - 10
IPL - 12
KIO - 10
MDC - 09
MND - 11
MSM - 13
NED - 09
NPN - 12
OML - 08
PIK - 12
SAB - 08
SBK - 10
SHP - 10
SLM - 13
SPP - 11
TBS - 14
TRU - 10
WHL - 09
CETR Residuals
Page 30 of 30Meditari Accountancy Research
123456789101112131415161718192021222324252627282930313233343536373839404142434445464748495051525354555657585960