the relationship between corporate governance and …
TRANSCRIPT

Page | i
THE RELATIONSHIP BETWEEN CORPORATE GOVERNANCE AND FIRM
PERFOMANCE IN SOUTH AFRICA
By
TINASHE BASIL MASHONGANYIKA
A research report submitted to the University of the Witwatersrand Faculty of Commerce,
Law and Management, in partial fulfillment of the requirements for the degree of Master of
Management in Finance and Investment
JOHANNESBURG
SUPERVISOR: DR THABANG MOKOALELI-MOKOTELI
MARCH 2015

Page | ii
DECLARATION
I, Tinashe Basil Mashonganyika, declare that the research study reported in this paper is my
work, except where otherwise indicated and acknowledged. This paper has not, either in
whole or part, been submitted at any other University or institution for degree purposes.
……………………………………….
Tinashe Basil Mashonganyika
Signed at …………………………………..On the……………….. Day of …………. 2015

Page | iii
ABSTRACT
This study examines the impact of corporate governance reforms on performance of publicly
listed firms on the Johannesburg Stock Exchange (JSE) in South Africa from 2009 to 2013.
The study examines the King III reform in detail, and previous reforms before King III. The
variables employed in this study to measure firm performance are return on asset (ROA),
return on common equity (ROE) as proxies for accounting based performance measures and
Tobin’s Q as a proxy for market based measure of performance.
The results do indicate that corporate governance does have an effect on a firm’s
performance. Evidence is presented that suggests that the level of compliance has increased
over the period in question from 2009, when King III was assumed. Overall the conclusions
are that board size has no impact on firm performance. The hypothesis that board
independence impacts on firm performance was rejected among other findings. That being
said, there is also significant deviations from the framework that leave room to further
develop and/or improve policy. The sample size of 99 is large enough to make inferences
about the population.

Page | iv
DEDICATION
This work is made possible by the Grace of God.
I dedicate this research report to my girlfriend and future wife, Chabota “Shugu” Haankuku.
You have been truly God sent and the joy of my life - The late nights we spent together
studying and sometimes pretending to study!
To my late father, John “Jomo/Joe” Mashonganyika, it is truly sad that you are not here to
witness my achievements.
To my mother, Faith “fae fae” Mashonganyika, for your support, encouragement and, most
importantly, your prayers.
To my sister, Natasha Mashonganyika-Dube, I was a difficult brother to have during this time
with the sleepover and meal requests, but you never once showed it.
To my family and friends, thank you all.

Page | v
ACKNOWLEDGEMENTS
I would like to thank my family, friends and colleagues for their support over the past year of
my studies. A special thank you goes to my supervisor, Doctor Thabang Mokoaleli-Mokoteli,
for her support and guidance, without which I would not have been able to complete this
research report.

Page | vi
TABLE OF CONTENTS
TITLE PAGE i
DECLARATION ii
ABSTRACT iii
DEDICATION iv
ACKNOWLEDGEMENTS v
TABLE OF CONTENTS vi
REFERENCES viii
APPENDICES viii
LIST OF TABLES viii
LIST OF FIGURES viii
CHAPTER 1: INTRODUCTION
1.1 Introduction 1
1.2 context of study 1
1.3 Research problems 2
1.4 Research objectives 3
1.5 Research questions 4
1.6 Research gap 4
1.7 Research methodology 5
1.8 Research structure 5
Chapter summary 6
CHAPTER 2: LITERATURE REVIEW
2.1 Introduction 7
2.2 Corporate governance and firm performance 9
2.3 Definition of Corporate Governance 9
2.4 Evolution of corporate governance in different countries 10
2.5 Importance of Corporate Governance 12
2.6 Theoretical underpinning 12
2.5.1 Agency theory 13
2.5.2 Stewardship theory 13
2.5.3 Resource-dependence theory 14
2.5.4 Managerial signalling theory 14
2.7 Corporate Governance Models 14
Page | vii
2.7.1 Frequency of the board meetings 15
2.7.2 Composition of the board 15
2.7. 2.1 Board Size 15
2.7.2.2 Independence of directors 16
2.7.2.3 Board gender, age and diversity 16
2.7.2.4 CEO non duality 17
2.7.2.5 Key board Committees 18
Chapter summary 20
CHAPTER 3: RESEARCH METHODOLOGY
3.1 Introduction 21
3.2 Data 21
3.3 Research design 22
3.3.1 Dependent variables 22
3.3.2 Independent variables 23
3.3.3 Control variables 23
3.4 Equation and modeling 24
3.5 Hypothesis development 24
3.5.1 Frequency of the board meetings and firm performance 24
3.5.2 Board size and firm performance 25
3.5.3 Independence of executives and firm performance 25
3.5.4 Board gender and diversity and firm performance 26
3.5.5 CEO non-duality and firm performance 26
3.5.6 Committees and firm performance 27
Chapter summary 27
CHAPTER 4: DATA PRESENTATION AND ANALYSIS OF RESULTS
4.0 Introduction 28
4.1 Descriptive statistics 28
4.1.1 Frequency of the board meetings 30
4.1.2 Board Size 30
4.1.3 Independence of directors 31
4.1.4 Board diversity (gender and age) 31
4.1.5 CEO non-duality 32

Page | viii
4.1.6 Key board Committees 33
4.2 Regression diagnostic testing 33
4.3 Impact of governance on accounting based measures of performance 37
4.4 Impact of governance on market based measures of performance 40
Chapter summary 41
CHAPTER 5: CONCLUSIONS AND RECOMMENDATIONS
5.1 Introduction 42
5.2 Discussion 42
5.2 Conclusion and recommendations 44
REFERENCES 45
APPENDICES 48
Appendix A1 Industry classification for the sample 48
Appendix A2 List of suspended or delisted securities from the JSE in 2010 49
Appendix A3 List of suspended or delisted securities from the JSE in 2011 49
Appendix A4 List of suspended or delisted securities from the JSE in 2012 50
Appendix A5 List of suspended or delisted securities from the JSE in 2013 50
LIST OF TABLES
Table 4.1 Descriptive statistics for the period 29
Table 4.2 Descriptive statistics year on year 29
Table 4.3 Correlation Matrix 34
Table 4.4 Summary of the hypothesis tests results 35
Table 4.5 ROA and ROE Regression Results 38
Table 4.6 Tobin Q Regression Results 40
LIST OF FIGURES
Figure 4.1 Mean of board meetings year on year 30
Figure 4.2 Mean of board size year on year 30
Figure 4.3 Mean of independence of directors year on year 31
Figure 4.4 Mean of number of non-executives on board year on year 31
Figure 4.5 Mean of women on board year on year 32
Figure 4.6 Mean of board age year on year 32
Figure 4.7 Mean of CEO non duality year on year 32

Page | 1
CHAPTER 1: INTRODUCTION
1.1 Introduction
South Africa is the continent’s economic hub and, accordingly, provides a great testing
environment to examine this study on corporate governance and firm performance. Unlike all
its African counterparts, South Africa boasts sound financial and corporate regulatory
frameworks that mirror western standards. The Johannesburg Stock Exchange is highly
regulated and unrivaled in Africa, competes with those of western economies like the London
Stock Exchange and the New York Stock Exchange. Despite its highly accredited association
and international recognition, the South African stock exchange has seen a decline in ethical
management behaviours and practices that vary from fraudulent transactions, serious insider
lending and inadequate capitalisation or market manipulation (Mangena & Chamisa, (2008)).
Though not exhaustive, these few examples highlight the extent of dishonorable corporate
governance. Following related cases of corporate scandals and failures, the study examines
both good and bad corporate governance. The study further addresses the effects of corporate
governance on an organisation’s financial performance with a focus on economic efficiency
and sustainability.
This chapter is organized as follow: Section 1.2 presents the context of the study. Section 1.3
presents the research problems, followed by the research objectives in section 1.4. In section
1.5 the research questions are presented. Section 1.6 discusses the research gap and finally
the research methodology in section 1.7.
1.2 Context of study
At its most basic level, corporate governance deals with issues that result from the separation
of ownership and control (Jensen & Meckling, (1979)), (Fama & Jensen, (1983)). This sheds
light on an agency theory phenomenon or problem that concerns conflicts of interest between
owners and managers (Eisenhardt, 1989). Studies by various authors including (Douma
(1997)); (Jacoby (2000)); (Bhagat and Bolton (2008)), (Maignan and Ferrell (2004)) looked
into the governance models addressing independence of executives, board size, gender and
diversity etc. Failures in these model aspects were studied in an attempt to evaluate their
effect on firm performance (Agrawal & Knoeber, (1996)).

Page | 2
South Africa is no exception to this. It adopted corporate governance in 1994 with the King
Report, (Mallin, (2007)), that drew a lot of its fundamentals from the Cadbury report of 1992,
(Mangena & Chamisa, (2008)). The specific task that the study seeks to address is the
question of compliance and/or the lack thereof to set frameworks (for example, the JSE
listing requirements and the institute of directors, King I, II and III on corporate governance
and the Companies Act 2008) and their collective effect on a firm’s performance. Examples
of governance failures are the increasing number of firms suspended or delisted from the JSE.
Statistics data from the JSE customer relations department provide evidence and reveal that a
sum total of 24 firms were delisted in 2010, 20 firms in 2011, 22 in 2012 and finally 31 in
2013. Tables A3, A4, A5, and A6 in the appendices provide a list of the suspended or delisted
firms. Further examples are seen in the construction industry that saw eight of the big players
admit to fixing prices and collusion for the 2010 soccer world cup development and
infrastructure projects leading to hefty fines being passed across the industry to the sum of
R143million by the SA competition commission (FIN24, 25 June 2014). FIN24 (25 June
2014) further revealed that some firms like Stefanutti’s borrowed, to pay off their fines,
while larger firms like Murray and Roberts, Basil Read, Aveng paid their fines from the
contingencies set aside for this purpose. Following the discovery of these scandals, many of
these companies saw their stock valuations and prices slide dramatically, the Financial Mail
reported, “The share price of the Financial Mail's 2013 pick, Wilson Bayley Holmes-Ovcon
(WBHO), fell 6% during the year. The damage to the reputation of the once well-respected
company will take longer to reverse after it was slapped with the highest penalty of R311m
for bid-rigging. Other share price losers include Basil Read (-20%) and Aveng (-13, 6%).”
1.3 Research problems
Domestic and international cases of bad corporate governance have highlighted current
regulatory framework inadequacies or gaps that are continually exploited by both private and
public companies. The level of confidence in the abilities and structures in place to monitor
and assess compliance has raised concerns within the global financial industry. Limited
knowledge and empirical reviews on the subject in an African context, particularly South
Africa, has led to the limited and narrow understanding of the matter locally. Despite being
adopted from a combined view of the UK Cadbury report in 1994 and the American Sarbanes
Oxley Act of 1997, there still exists clear gaps in the framework of corporate governance in
South Africa (Mangena & Chamisa, 2008).

Page | 3
In light of this, the introduction of the King III report in September 2009 came into being in
order to circumvent these challenges. It consists of two main documents, namely, the code of
governance (The Code), which is a set of principles and the Report, in which it stipulates and
makes recommendations of best practices for each principle. This was accompanied by the
Companies Act No 71 of 2008. An assessment that provides the understanding of the
fundamental link and relationship between governance and performance of publicly listed
enterprises post King III implementation is important. As investors are concerned about the
effect that these corporate governance structures have on their investments, there is increased
pressure on the need for regulatory reforms. The problem is establishing the link between
corporate governance and performance as contrasting conclusions exist in current literature.
Khatab, Masood, Zaman, Saleem, and Saeed (2011) conclude that firms that have good
corporate governance practices outperform their counterparts with bad corporate governance.
In contrast, (P. Klein, Shapiro, and Young (2005) finds that there is no substantial evidence
that good corporate governance enhances firm performance.
1.4 Research objectives
The study investigates the relationship between corporate governance measures and firm
performance within the South African context. The study contributes to ongoing studies
within an African emerging context, providing significant information that will help in the
formulation of a comprehensive framework from a pro-active preventative nature,
encouraging good corporate governance practices and enforcing law reforms for the firm and
its board members.
The prevalence of corporate misconduct is sufficient evidence to support the need of studies
of that give clarification to this problem. This study endeavours to institute practices that
robustly safeguard fair returns on investments and the wider economy in which these
corporations operate. The study isalso of importance in creating a platform for defining and
demonstrating the effectiveness of firm internal corporate governance structures, models and
frameworks as discussed in the King III (2009) report.
The specific objectives are therefore:
To determine the effect of internal corporate governance structures on firm
performance of publicly listed firms

Page | 4
To establish the effectiveness of King III internal corporate governance requirements
for listing firms.
To compare the levels of corporate governance adherence across publicly listed firms
on the JSE main board.
1.5 Research questions
This research study seeks to answer the following questions:
Does corporate governance affect a firm’s performance?
What is the level of adherence to King III provisions of corporate governance among
firms listed on the Johannesburg stock exchange?
Is the practice of good corporate governance essential in enhancing performance and
financial stability of a firm?
1.6 Research gap
Accounting standardisation, along with increased regulatory requirements and disclosures,
have proven inadequate. The prevalence of corporate scandals due to bad governance is
justification for the study. Significant attempts are made to furnish stakeholders with
information on governance and their effect on performance. This study helps add some
insights into the workings of corporate governance on a firm’s performance and contributes
to the already existing literature around the subject matter.
Earlier studies in this area have focused primarily on developed economies or developing
non-African economies ((Vafeas & Theodorou, 1998). While they have argued that corporate
governance is universal, the uniqueness of the African context should be considered. Previous
studies by (Mangena and Chamisa (2008) focused specifically on listed South African firms
that have been suspended due to non-compliance with various corporate governance codes
and practice. A limitation of this study was its focus. It excluded those that were not
suspended. The current study takes a more universal approach, focusing on all publicly listed
firms over a 5 year period from 2009 to 2013. A similar study by (Ntim, Opong, Danbolt, and
Thomas (2012) looked at post-apartheid corporate governance disclosures, along with the
impact of corporate governance on firm performance. This study however, also looked at a
sample of firms across the exchange. The sample used is a basis for criticism. This is because

Page | 5
samples can look at particular industries or sectors and the findings maybe sector specific.
Therefore the inferences made are limiting for the wider economy. This study however
examines a sample of firms equally representative of the JSE over a 5 year period in order to
produce richer inferences and conclusions.
This study sheds more light into the situation on the ground. Looking at 10 key internal
corporate governance measures against five performance measures, the study aims to
ascertain the relationship between corporate governance and performance. The research
problems articulated above are pursued against the research objectives for the purpose of
providing a deeper and thorough understanding of the matter from a South African
perspective.
1.7 Research methodology
This study uses panel data analysis of the industry over the period from 2008 to 2013. The
study also follows a similar path as previous studies, using the fixed effect panel Least
Squares (LS) regression technique to investigate the relationship between firm performance
as the dependent variable and internal corporate governance structures as the independent
variable to the regression analysis.
Measures such as Return on Assets (ROA), Return on Equity (ROE), are used as proxies for
accounting based performance measures and the market based measure, Tobin’s Q is used as
a market measure. This allows for solid results and inferences. These dependent variables
used as proxies for performance were chosen for their universal use and global acceptance as
measures of a firm’s performance, alongside their ease to calculate. The independent
governance measures considered and used in the regression model are board composition,
diversity, size, and frequency of board meetings, CEO duality or non-duality and many more
factors.
1.8 Research structure
A comprehensive literature review in Chapter two outlines evidence of the disintegration of
good corporate governance practices. The corporate governance structures as detailed in the
JSE listing requirements and recommendations by the King III report of 2009 are also
discussed. It progresses to address the fundamental issues underpinning the study of
corporate governance, being the agency theory and problem. Additionally, the study explores

Page | 6
corporate governance models, structures and practices that encompass the ownership
structure, frequency of the board, executive compensation, board size, independence, gender
and diversity, to mention but a few variables.
Chapter three shifts focus to address study methodology with particular attention given to
financial indicators or matrices of a firm’s performance along with corporate governance
structures and practices. Then, chapter four presents the descriptive statistics and the
findings. Chapter five discusses the findings and concludes the thesis and makes
recommendations for further research.
Chapter summary
The background of the study is looked at in this chapter. This chapter outlines and
emphasizes the research problem, research objectives and the reasoning behind conducting
this study. The following chapter addresses the extant literature.

Page | 7
CHAPTER 2: LITERATURE REVIEW
2.1 Introduction
This chapter explores the extensive literature on corporate governance practices and their
effect on firm performance and sustainability. There has been extensive academic work
presented on the relationship or correlation of corporate governance and firm performance,
with an emphasis on its effect performance or lack thereof. The chapter is organized as
follows. Section 2.2 discusses corporate governance and firm performance; Section 2.3
presents a few definitions, followed by the evolution of corporate governance in section 2.4;
Section 2.5 looks at its importance and section 2.6 addresses the theory behind this study.
Finally section 2.7 looks at the various corporate governance structures.
Gaps in the fundamentals of corporate governance, namely, legislature as providers of rules
and regulatory frameworks, audit and accounting as independent assurers to financial
statement reporting and disclosures, banking as providers of funding and credit and, lastly,
the society in which they operate, has seen South African firms decline in ethical
management behaviours and practices, from fraudulent transactions, serious insider lending
and inadequate capitalization or market manipulation ((Machold, Ahmed, & Farquhar, 2008).
The study by (G. J. Rossouw, Watt, and Malan (2002) focuses on internal corporate
governance structures addressing the governance effects on a firm’s performance with a view
to assessing its economic effect, efficiency and sustainability. Institutions such as
HealthSouth, Tyco, and WorldCom, Parmalat, Enron took center stage to highlight that man
cannot be trusted to do right or act with integrity when personal gain and greed is in their
hearts (Hamilton & Micklethwait, 2006). This gave birth to the Sarbanes-Oxley Bill (also
known as the Corporate Oversight Bill) passed into law in July 2002 (Rockness & Rockness,
2005). This type of improvement was meant to impose penalties and restrictions on firms and
the individuals running them so that individuals would be held responsible in their personal
capacity, along with their capacity as representatives of the firm.
The scandals concerning bad governance structures and practices, and the subsequent
corporate failures led to ramifications in the accounting and auditing industry. Firms like
Anderson ceased operations completely, for the role they played to enable corporate giants
Enron misrepresent their financial statements (Imhoff, 2003). Anderson was a firm among
the big 5 accounting and auditing firms and today does not exist.

Page | 8
The problem however, occurs in the existence of multiple definitions and views of corporate
governance: an economist’s interpretation of sustainability may relate to an accountant’s
opinion of assurance, which, in turn, may differ from the views of regulators and views of
protectors of public interest. To resolve this paradox of conflicting views and definitions as
well as attempt to address the shortcomings, the South Africa market proactively sanctioned
the King I, II and III reports that gave stringent guidelines on corporate governance with the
aim of curtailing immoral hazardous behaviours. This would also set a framework that all
players would abide by that conforms to business, industry and with a view of economic
sustainability. Its intent was to curb the immoral self-fulfilling behaviour of agents acting on
behalf of the principal and was apparently successful.
Firms going public have to comply with the listing requirements set out in the King III report
as an entry criterion. It is important to exercise caution with such statements as registration
standards do not in themselves automatically lead to good governance. Mangena and
Chamisa (2008)’s study of the 81 listed companies that were suspended between 1999 and
2005 alone supports the need for further inspection of the industry. Fidentia, Regal Treasury
Bank and Master Bond were among the firms that brought the limelight onto South Africa
and its structural corporate governance weaknesses (Sarra, 2004). For example, in the
Fidentia case, evidence was produced and chartered accountant, Graham Maddock, testified
that investment money was used to pay employee salaries. This Fidentia case is a good
example revealing evidence of the effect of failing to adhere to the requirements of having an
audit committee and the risk and compliance functions of corporate governance (Mangena &
Chamisa, 2008). This was then misrepresented in the financial statements, a key failing on
the audit committee function of assurance in their reporting and disclosure. This is a
requirement of both the King III report and the Companies Act.
A more recent governance issues was that of Nedbank (attempting to enter the African
markets to compete with counterpart’s Standard Bank and Barclays-ABSA group) and its
deal with Ecobank smeared with undisclosed reciprocal rights to buy shares in each other’s
company. This would affect shareholder interest by diluting their holdings and affect the
ownership structure (Fin 24, 25 June 2014). These dealings did not appear in the financials
nor were they disclosed to shareholders (Firer & Meth, 1986), (Williams, 1999).
Page | 9
2.2 Corporate governance and firm performance
Vafeas and Theodorou (1998); (Zaman, Hudaib, and Haniffa (2011) linked positive firm
performance to good corporate governance, while (A. Klein (2002) argued that it was
attributed to earnings management. This delves further into the competing issues of economic
performance versus analyst projective performance. Another angle that has been focal to the
South African context on corporate governance is around competition (Khemani & Leechor,
2001) and reward/remuneration (Main & Johnston, 1993). A positive relationship was found
to exist between corporate governance and share or price performance (Kosnik, 1990).
Barratt and Korac-Kakabadse (2002) conducted an experiment on corporate governance
effects on and for the economy. They focused on defining the functionality and role corporate
governance played in economic efficiency. They concluded that a good corporate governance
system is positively correlated to financial performance from an association perspective (high
revenues and profitability). Hence the aim of this study to further investigate the link and
ascertain the extent of the linkage and bring this to the surface by answering questions like,
“Is it corporate governance or other factors that affect a firm’s performance?”
The underlying tones in all failures point to the above effects and lead to (G. J. Rossouw et al.
(2002)) recommendation of improving corporate governance (Governance & Directors,
2002). The non-synchronistic element of these arenas has seen man take advantage of the
loopholes in order to profiteer and in so doing, give rise to these scandals. To bridge that gap,
this study shall focus on the various structures in an aim to uncover reasons and/or early
warning signals along with determining the extent to which they affect a firm’s performance.
2.3 Definition of Corporate Governance
There are different definitions put forward to describe the term corporate governance (CG).
These definitions vary depending on the study being conducted or the scholar conducting the
study. The definition also seems to differ depending on the country in question. The South
African view as presented in the King report and derived from the Cadbury report, defines
corporate governance as “a system by which companies are directed and controlled” how the
corporate objectives are set, how the corporate activities and expectations of stakeholders are
aligned. It is the way in which the affairs of corporations are handled by their Corporate
Boards and officers (G. J. Rossouw et al., 2002).

Page | 10
The organization for Economic Co-operation and Development (2004) defines corporate
governance as: “the system by which business corporations are directed and controlled. The
corporate governance structure specifies the distribution of rights and responsibilities among
different participants in the corporation, such as the board, managers, shareholders and other
stakeholders, and spells out the rules and procedures for making decisions on corporate
affairs. By doing this, it also provides the structure through which the company objectives are
set, and the means of attaining those objectives and monitoring performance.
Blair (1995) defines corporate governance as “the whole set of legal, cultural and institutional
arrangements that determine what publicly traded corporations can do, who controls them,
how that control is exercised, and how the risks and return from the activities they undertake
are allocated”.
On the other hand, (Hendry and Kiel (2004) add the aspect of corporate governance as
emanating from interactions among senior management, shareholders, boards of directors,
and other corporate stakeholders.
Jesover and Kirkpatrick (2005) sum up the views taken by the above and forge their
comprehensive view that states that corporate governance involves a set of relationships
between a company’s management, its board, its shareholders and other stakeholders.
Corporate governance also provides the structure through which the objectives of the
company are set, and the means of attaining those objectives and monitoring performance are
determined.
From the above broad definitions and for the purpose of this study, corporate governance can
be viewed as being concerned with issues that include effectiveness and efficiency of
operations, reliability of financial reporting, compliance with laws and regulations, as well as
safeguarding company assets. Corporate governance, in this study, is viewed as a set of rules
that define the relationship between stakeholders, management, and the board of directors of
a company and influence how that company is operating.
2.4 Evolution of corporate governance in different countries
The academic views useful and key to any study of corporate governance are the Cadbury
and Greenbury theories. Williams (1999) noted that under the Cadbury proposals, a Code of
Best Practices embodying underlying principles of openness, integrity, and accountability are

Page | 11
articulated and need to be adhered to. This theory states that, public trust in the corporate
system is meant to be maintained by increasing disclosure to support successful shareholder
and stakeholder interest-checks against managers (Meek, Roberts & Gray, (1995).
On the other hand, the Greenbury report focused mainly on a small section of the Cadbury
report and called for the disclosure of directors’ remuneration by detailing each individual
director’s remuneration. The Cadbury framework proposed to put forward practical ways of
raising financial control and reporting standards, which could be put into effect without
waiting for legislation. The increased disclosure requirements aimed to instill public trust,
which was also seen as a cornerstone and key component to raising and maintaining
standards. High Quality Financial Disclosure was seen as a means of encouraging effective
shareholder and stakeholder interest and would facilitate checks and balances against
professional managers (Aguilera, Williams, Conley, & Rupp, 2006).
Cadbury requires the board to meet as often as possible and retain full and effective control
over the company, as well as monitor the executive management. The report additionally
states that there should be clear division of roles and responsibilities at the head of the
company, for example, the chairman should not and cannot also hold the position of the CEO
(Chief Executive Officer). The board is required to have a majority of non-executive directors
who bring an independent judgment.
This mandate has worked very well in the United Kingdom, However it has not been as
successful in other European countries, a good example being Parmalat in Italy (Rockness &
Rockness, (2005). In the USA, after a series of much publicized corporate failures in 2000
involving Enron, Tyco and WorldCom, the Cadbury report was reinforced by the Securities
Exchange Commission in an attempt to protect investors and society. Laws that have serious
corporate governance implications were introduced including Sarbanes-Oxley Act of 2002.
According to (Puttick, Van Esch, and Van Esch (2008), the Institute of Directors in South
Africa came up with the King report as a result of a decline in ethical business standards. The
report advocates an integrated approach to good governance in the best interest of all
stakeholders. It considered the fundamental principles of good social, financial, ethical, and
environmental practice of good corporate governance (Governance & Directors, 2002). In
March 2002, a Code of Corporate Practices and Conduct was put forward and applied to all
companies listed on the Johannesburg Securities Exchange, South Africa. This included

Page | 12
banking institutions, financial and insurance entities as well as public sector enterprises. The
current study focuses on the South African context of corporate governance, which arguably
is an adaptation of the UK and USA, Cadbury and Sarbanes-Oxley Act.
2.5 Importance of Corporate Governance
The social and economic costs of corporate failures are significant. This includes high job
losses, the loss of public confidence and the ripple effect a single failure may have in a
particular market, industry and economy. Poor corporate governance has an impact on
stakeholders who stand to lose out as a result of mismanagement by directors and managers.
Good corporate governance needs to be maintained at all times to ensure transparency and
efficiency in the day-to-day activities of the corporations. This will lead to better access to
capital, aid economic growth, promote fairness and translates to transparency and
accountability. Weak corporate governance, on the other hand, translates to waste,
mismanagement and corruption (Donaldson & Davis, (1991). The following sections will
outlined this.
2.6 Theoretical underpinning
Professional managers and directors are employed to handle the affairs of an organization on
behalf of the owners. In discharging their responsibilities, directors must exercise their
business judgment in a manner that they believe is in good faith and is in the best interests of
all stakeholders investors, debt holders, creditors, the board, employees and society in
general.
However, conflict of interest often arises between the entities and individuals entrusted as
caretakers. Therefore, there is a heavy reliance on corporate governance structures and
practices to attempt to alleviate and/or eradicate conflict (Cremers & Nair, (2005).
Corporate governance goes beyond simply establishing a clear reciprocal relationship
between shareholders and managers. This shall be dealt with further and a deeper look at
theories, including the agency problem, and supporting theories, in the next section.

Page | 13
2.6.1 Agency theory
At its most basic level, corporate governance deals with issues that result from the separation
of ownership and control (Fama & Jensen, 1983) and the contractual view first developed by
Coase (1937). The Agency theory forges the theoretical framework upon which the current
study and many others of this nature are based. It proposes that due to information
opaqueness, the agent is tempted to pursue self-interests to the detriment of the firm and the
shareholders. This sheds light on a phenomenon called agency problem that speaks to
conflicts of interest between owners and managers (Eisenhardt, 1989) and the separation of
decision making in the firm and its security holders. The theory is applicable in various
aspects of the business, including accounting.
Agrawal and Knoeber (1996) define an agency relationship as a contract under which one or
more persons (the principal(s)) engage another person (the agent) to perform some service on
their behalf which involves delegating some decision making authority to the agent. If both
parties to the relationship are utility maximizers, however, the agent will not always act in the
best interests of the principal. The theory is concerned with scenarios where the goals of the
principal and agent are not aligned and the difficulty of the principal to validate this
misalignment, thus giving rise to agency cost; examples of these are the monitoring
expenditures by the principal, the bonding expenditures by the agent and the residual loss.
Agency cost is the expense incurred by the providers of funds to keep the board and its
management acting in good faith. Agency theory and cost are the focal and starting point of
this study of corporate governance as it underpins the concept of corporate governance.
2.6.2 Stewardship theory
Contrary to agency theory, stewardship theory states that executive management is
intrinsically upright (Hendry & Kiel, 2004). It further states that management should be
entrusted fully to run firms as they are good stewards of the resources entrusted to them. This
theory assumes that because executive management spend most of their time in the
companies that they take care of, they have superior information about both the environment
they operate in and are more suited to understanding the firms they run, therefore have
superior decision making capabilities (Donaldson & Davis, (1991).
Page | 14
2.6.3 Resource-dependence theory
The resource dependency theory states that corporate governance mechanisms function as a
critical connection between the firm and the scarce resources needed to maximise
performance. This theory is instituted to monitor the effective and efficient governance of the
board and management, through corporate governance mechanisms like separation of board
chairperson and the role of Chief executive officer (Strange, Filatotchev, Buck, & Wright,
(2009). Expert advice, experience, independence and knowledge are necessary skill sets and
resources the board and its directors should have. Through this experience comes a reputable
association vital to business continuity. All these connections impact a firm’s performance.
2.6.4 Managerial signalling theory
Managerial signalling theory is the concluding theory of corporate governance on which this
study draws. Due to information asymmetry, it is assumed the board and its management
have access to more and non-public information (Jensen & Meckling, (1979). In support of
the agency theory, managerial signalling theory is faced with the moral hazard problem that
the board and its management with their superior information do not use it to the peril of the
firm. Adoption and compliance to good corporate governance set guidelines signals
credibility and safety of investment (Shleifer & Vishny, (1997). One example is seen in the
appointment of majority independent non-executive directors to the board. This has the effect
of signalling to investors, both current and potential, its intention of treating them fairly and
safeguarding their wealth.
2.7 Corporate governance models
The establishment of roles of the board and senior executives is fundamental to any corporate
governance structure or model. The board and executive team should present a balance of
independence, experience and skills on the board in line with the extent and nature of the
company operations (Maury, (2006).
Douma (1997)); (Jacoby (2000); (Maignan and Ferrell (2004) looked into the governance
models addressing independence of executives, board size, gender and diversity and other
factors. The first references of corporate governance were in the 19th century, in response to
the separation of ownership and control as a result of the formation of joint stock companies,
which had owners who did not take part in the day-to-day operational issues. They required
assurances that those entrusted (the directors and managers) were safeguarding their

Page | 15
investments and accurately reporting the financial outcome of their business activities.
Hereto, shareholders were the original center of attention on corporate governance. However,
contrary to initial schools of thought, current thinking acknowledges a corporation’s
obligations to the wider society generally, in the form of stakeholders.
2.7.1 Frequency of the board meetings
This speaks to the number of times the board meets or has meetings. The level of activity of
the board determines the number of times they should meet. One would be of the view that
more frequent meetings of the board would allow them to appraise managerial performance,
review the financial performance of a firm and set strategic direction to ensure its operations
translate into the financial performance desired of a firm. This is particularly of concern for
policy makers because of the contrasting views from past research studies. (Lipton and
Lorsch (1992)) found significance in more frequent meeting translating to higher
performance as it allows boards to set strategy and appraise management performance
((Vafeas & Theodorou, (1998). However in a follow up research paper, (Vafeas and
Theodorou (1998)) contended this view purporting a negative association with more frequent
board meetings, measured against the intensity of board’s activity and/or effectiveness of its
monitoring function.
According to the King III code of governance, the board should meet at least four times per
year, once each quarter. The Companies Act and the JSE listing rules, however, leave this to
the discretion of the firm to formulate a framework that looks at the number of times they
meet and the agenda.
2.7.2 Composition of the board
2.7.2.1 Board Size
Board size comprises the optimum number of board members. Lipton and Lorsch (1992)
suggested optimal board sizes of about seven to nine directors stating that this enhances time
taken to make decisions. Their results suggested smaller boards were more efficient than
larger boards due to processing, control and co-ordinating activities, however arguments have
been posed that smaller boards can be manipulated (Yermack, (1996); (Kyereboah-Coleman
& Biekpe, (2007)
Page | 16
According to the King III code of governance every board should consider whether its size,
diversity and demographics make it effective. The framework does not specify a number
however. The South African Companies Act suggests that all companies must have a
minimum of three directors and the JSE listing requirements stipulate four members.
Minimum number of board members are stated or recommended but provide no indication of
a maximum number of members.
2.7.2.2 Independence of directors
King III requires boards to be comprised of a majority of non-executive directors of whom
the majority should be independent. Independence of directors is assessed by the board
yearly. For the purpose of this study, independence of directors within the board looks at non-
executive board members. It is a balance of executive and non-executive directors, preferably
with a majority of non-executive directors (John & Senbet, (1998). A sufficient number of
these should be independent of management so that shareowner interests can be protected
(Rhoades, Rechner, & Sundaramurthy, (2000). The Companies Act prescribes that a
minimum of three non-executive independent directors should exist.
The Board’s independence is maintained by:
Non-executive directors not holding service contracts and their remuneration not
being tied to the financial performance of the Group; and
All the directors having access to the advice and services of the company secretary
and, with prior agreement of the chairman, being entitled to seek independent
professional advice on the affairs of the Group at the Group’s expense.
Non-executive directors are those that bring a strong contingent of diversity of experience,
insight, and independent judgement to bear on issues of strategy, performance, resources and
standards of conduct.
2.7.2.3 Board gender, age and diversity
Variations in the members of the boards of directors in connection with characteristics such
as managerial background, expertise, age, personality, gender, education and nationality can
be used to define board gender and diversity (Firer & Meth, (1986). Bhagat and Black (1999)

Page | 17
postulate that diversity of the board and its management is essential in order to ensure all
stakeholders are considered in decision making and its effects on firm performance. Prior
studies on the effect of board composition had generally adopted one of two approaches. The
first approach involves the study of how board composition affects the board's behavior on
discrete tasks, such as replacing the CEO, awarding golden parachutes, or making or
defending against a takeover bid. This approach can involve tractable data, which makes it
easier for researchers to find statistically significant results. But it does not give any
indication of how board composition affects overall firm performance. For example, there is
evidence that firms with majority independent boards perform better on particular tasks, such
as replacing the CEO (Hermalin & Weisbach, (1988) and making takeover bids (Byrd &
Hickman, (1992).
According to the King III code of governance every board should consider whether its size,
diversity and demographics make it effective. While no prescriptions are set by all or any of
the governing bodies here, the statement above ensures they carefully consider the
composition of the board, based on attributes such as experience, age, gender, in carrying out
their duties.
2.7.2.4 CEO non duality
To ensure a balance of power and authority, firms need a well-articulated and accepted
division of responsibilities at the head of the company (Boyd, (1995). Therefore, no one
individual has unregulated power to make decisions. This is essentially the separation of the
position of chairperson from that of CEO and is ultimately meant to reduce any agency costs
associated. The function of chairperson should be completely disconnected from that of the
Chief Executive Officer. Duality presents profound issues in that the individuals responsible
for the firm’s performance are the same as those that evaluate its efficiency. Abor and
Biekpe (2005) found that firms that separated these two positions are more able to maintain
an optimal capital structure with debt being used as a control instrument for moral hazard. In
contrast to these findings, (Donaldson and Davis (1991) found that returns were enhanced
when there was duality. They further went on to state that combining these roles is more
suitable in the case of small emerging firms. However, they reasoned that an independent
non-executive director is to serve as deputy chairman or a strong independent non-executive
director element on the board. On the other hand, other studies have shown preference is

Page | 18
always given to a chairperson being an independent non-executive director (Dalton &
Kesner, (1987) and these sentiments are shared by many scholars (Boyd, (1995).
According to the King III code of governance, the board should elect a chairman of the board
who is an independent non-executive director. The CEO of the company is not permitted fill
the position of chairman of the board. This is corroborated by the JSE listing requirements
that indicate that the positions must be held by different individuals and that the chairperson
must be independent. The board should elect a chairperson on an annual basis; however this
is not a requirement for the position of CEO. The chairman should be an independent
appointment and justified, if not, in the integrated reports. Section 2.16.7 is of importance and
states that the CEO should not become the chairman until 3 years have lapsed. The
chairperson is in charge for the efficient functioning of the board while the CEO is liable for
running the company's business.
2.7.2.5 Key board Committees
Key board committees are the audit, remuneration and nomination committees. These
committees are required to be present by most literature in governance (King III Report, IoD
(2009). Depending on the firm the risk committee, information technology and governance
committees are additional committees that could be considered. Because board committees
are mainly made up of independent non-executive directors (or outside specialist in
extraordinary cases) the committees are more suited at protecting shareholders’ interests. The
committees aid in the effective workings of the board.
Audit committees have a major role to play, according to international practice. The
Sarbanes-Oxley Act in the USA along with the UK’s Smith Report is the leading governance
frameworks on audit committees. King III requires an independent and suitably skilled audit
committee. Furthermore audit committees have sanctuary duties in terms of the Companies
Act 71 of 2008, apart from the board. They are set up to give oversight and assurance of
integrity of the firm’s disclosures of their financial statements and the firms' performance.
The accuracy of their reporting affects the perceptions of the firm for stakeholders and
prospective investors. Very little has been covered on the effect of audit committees in the
literature. The views expressed and recommendations made in the Cadbury report are that
there should be a small group of non-executive directors to uphold the no conflict of interest.

Page | 19
This is the recommendations of the JSE listing requirements. There is very little literature
exploring this variable and its link to performance.
According to the King III code of governance, the board should delegate other functions to
well-structured committees but without abdicating their responsibilities. Committees, other
than the risk committee, should comprise a majority of nonexecutive directors of which the
majority should be independent.
Section 3.1 of The King III code of governance for South Africa 2009, states that the board
should ensure that the company has an effective and independent audit committee that should
meet as often as possible with terms of reference approved by the board. This committee
should be chaired by an independent non-executive member of the board as this forms part of
the integral factor of the risk management process. Further, all members of the audit
committee should be independent non-executive directors. In contract to this, the JSE listing
requirements state that at least two must be independent non-executive directors.
According to the King III code of governance for South Africa 2009, section 2.25, companies
should remunerate directors and executives fairly and responsibly. However, there are no
regulations on what constitutes fair compensation. Further, section 2.25.2 states that the
remuneration committee should assist the board in setting and administering remuneration
policies addressing pay basis, bonuses, employment contracts, long term incentive schemes
and share-based benefits. These should be disclosed in the integrated report and shareholders
should pass a non-binding advisory vote on the firm’s policy. The committee should consist
solely of independent non-executive directors.
The King III code of governance for South Africa 2009, section 2.19.1 further states that a
nomination committee should assist with the process of identifying suitable members of the
board. This entails conducting background and reference checks and assists in employing
competent personnel. This requirement has only recently been adopted in South Africa. The
structures of the nomination committee are similar to those of the audit and remuneration
committee, requiring at least three independent non-executive directors, led by an
independent director as chair.

Page | 20
Ntim, Opong, and Danbolt (2012) focused on compliance and disclosure of good corporate
governance post South African independence. However this was prior to the global financial
meltdown of 2008. They found that corporate governance standards and practices were
generally improved and positively correlated to financial performance. Their findings echoed
the same sentiments by (Love (2010). Their research also had practical implication for policy
makers and regulators that monitor corporate behaviour. Strong measures of enforcement
need to be put in place and strengthened.
Chapter summary
The chapter addressed the fundamental issue, namely, agency theory then went further to
highlight the key corporate governance variables in accordance to King III recommendations
and the Company’s Act 71 of 2008. The next chapter looks at how the research was
conducted.

Page | 21
CHAPTER 3: RESEARCH METHODOLOGY
3.1 Introduction
This chapter presents the data used in this research; data sources and research design to
determine the extent to which corporate governance measures influence the performance
indicators of firms listed on the Johannesburg Stock Exchange (JSE). Similar to (Tshipa
(2012) who investigated a sample of 137 firms listed on the JSE, this study will investigate a
sample of 99 firms listed on the JSE evenly distributed across the industries, table A1 in the
appendices shows this. Though different in many respects, it will follow a combined and
similar approach of governance measures and performance measures as Mangena and
Chamisa (2008), Gedeon J Rossouw, Van der Watt, and Rossouw (2002) and Tshipa (2012).
The chapter is organized as follows: Section 3.2 presents data and data sources. Section 3.3
looks at the research design, while section 3.4 looks at the regression equation. Section 3.5
develops the hypothesis.
3.2 Data
The performance data, market capitalization and book value of all different types of stocks
are obtained from Bloomberg Professional databases and Inet Bridge for the research period
from January 2009 to December 2013. The first data source, the internal corporate
governance variables and performance variables are obtained from the firm’s annual reports
published as part of their listing requirements.
The use of panel data analysis should provide a link as to the observed corporate governance
structures against firm performance over the period 2009 to 2013. The period, though short,
still allows for robust analytical inferences. The period is from 2009 to 2013, a time that
allows all firms to fully incorporate and comply with the King III recommendation enforced
in 2009 or provide some insight and reasoning as to its non-adoption, the ‘apply or explain’
philosophy. The research period ends in 2013 which is the most recent period for data
required and allows for newness and relevance.
For the purpose of this study, the sample comprised firms listed for four or five years
consistent of the five year period from 2009 to 2013. The final sample of 99 was reached
solely due to data availability and time constraints.

Page | 22
3.3 Research design
Panel data is used widely in market research to study firm performance, test new products,
and evaluate promotional campaigns. Panel data analyses data comprising corporate
governance to the same or similar firms listed on the JSE over more than one time period. A
panel data study of a sample of JSE listed firms is followed. To put this into perspective, the
panel data research study attempts to determine whether there is a relationship between a
firm's performance and internal corporate governance structures over a 5 year time interval. It
is believed that firms that do better are well governed compared to those that do not. The
study aims to give evidence of this. Panel data is used to measure changes in firm
performance of JSE listed firms over time, particularly useful for understanding trends. Panel
data was used as it allows us to control for variables we cannot observe or measure, like
differences in business practices across firms. With panel data, we can include variables at
different levels of analysis (i.e. the corporate governance measures of independence, CEO
non duality). This is not a perfect modeling technique as it comes with some drawbacks.
These include data collections issues or, more specific to this study, correlation between
governance variables.
3.3.1 Dependent variables
Three measures of firm performance are used as dependent variables and these are
accounting based measures, market based measure, the risk adjusted measure as performance
proxies. First, it will apply accounting based measures, return on assets (ROA) and return on
equity or return on common equity (ROE) as per (Bhagat and Bolton (2008). Second, it will
employ a market based valuation measure - Tobin’s Q as in Carvalhal da Silva and Leal
(2005). Net asset Value per share (NAV per share) is used as risk adjusted stock measure of
performance.
ROA is measured as net income divided by total assets at end of any reporting period. ROA
is an indicator of how profitable a company is relative to its total assets, as a percentage. It
shows how efficient management and/or the firm’s efficiency is in using its assets to generate
income. The ROA measure is consistent with other studies such as Erhardt, Werbel, and
Shrader (2003).
𝑅𝑂𝐴 =𝑁𝑒𝑡 𝐼𝑛𝑐𝑜𝑚𝑒
𝐴𝑣𝑒𝑟𝑎𝑔𝑒 𝑇𝑜𝑡𝑎𝑙 𝐴𝑠𝑠𝑒𝑡𝑠× 100

Page | 23
ROE is measured as net income divided by shareholders equity. It measures a firm’s
profitability by revealing how much profit a company generates with the money shareholders
have invested in the firm.
𝑅𝑂𝐸 = 𝑁𝑒𝑡 𝐼𝑛𝑐𝑜𝑚𝑒
𝑆ℎ𝑎𝑟𝑒ℎ𝑜𝑙𝑑𝑒𝑟 ′𝑠 𝐸𝑞𝑢𝑖𝑡𝑦(𝑑𝑜𝑒𝑠 𝑛𝑜𝑡 𝑖𝑛𝑐𝑙𝑢𝑑𝑒 𝑝𝑟𝑒𝑓𝑒𝑟𝑟𝑒𝑑 𝑠ℎ𝑎𝑟𝑒𝑠) × 100
Tobin’s Q is calculated as total market value of a firm divided by the total replacement value
of a firm’s asset. Tobin’s Q is the ratio of the market value of a firm to the replacement cost
of the firm's assets. The Q ratio is useful for the valuation of a company. It is based in the
hypothesis that, in the long run, the market value of a company should roughly equal the cost
of replacing the company's assets. Tobin’s Q has been used to explain a number of corporate
phenomena, for example, managerial compensation and firm performance (Shleifer &
Vishny, (1997). Tobin’s Q has not been used alone as a measure of performance for its non-
real world decision analysis, because of its limited availability of timeous and accurate data
in comparison to other performance variables like ROA.
𝑇𝑜𝑏𝑖𝑛′𝑠 𝑄 = 𝑚𝑎𝑟𝑘𝑒𝑡 𝑣𝑎𝑙𝑢𝑒 𝑜𝑓 𝑓𝑖𝑟𝑚
𝑡𝑜𝑡𝑎𝑙 𝑟𝑒𝑝𝑙𝑎𝑐𝑒𝑚𝑒𝑛𝑡 𝑣𝑎𝑙𝑢𝑒 𝑜𝑓 𝑎𝑠𝑠𝑒𝑡𝑠
It is because of all the shortcomings of each measure of the performance measures described
above that more than one is used to enrich the findings of the study and account for each
variables’ shortcoming.
3.3.2 Independent variables
The corporate governance structures or measures used are board size, frequency of board
meetings, independence of board members and diversity of board membership along with
CEO duality and committees.
3.3.3 Control variables
The control variables that may influence the performance of the firm are size of the firm and
firm leverage which is measured as debt to equity ratio. Alongside this is its age and
reputation built over the years. There may be other variables omitted that could either affect

Page | 24
corporate governance or firm performance. Taylor, Miller, and Gray (2012) states that there
will always be omitted variables with a causal effect on the output desired or being tested and
summed it up by going further to state that there is little that can be done.
3.4 Equation and modeling
According to the King III recommendations for good corporate governance, the companies
Act 2008 and the JSE listing requirements combined with information from earlier studies,
this study derives a practical design offered in the regression model:
𝑚𝑏𝑡 = 𝛽0 + 𝛽1𝑇1𝑏𝑡 + 𝛽2𝑇2𝑏𝑡 + 𝛽3𝑇3𝑏𝑡 + 𝛽4𝑇4𝑏𝑡 + 𝛽5𝑇5𝑏𝑡 + 𝛽6𝑇6𝑏𝑡 + 𝜀𝑏𝑡
Where;
Mbt represents; Return on Asset (ROA), Return on Equity (ROE), Tobin’s Q, and
NAV per share for firm i at time t.
T1bt represents Frequency of the board meetings for firm i at time t
T2bt represents board size for firm b at time t
T3bt represents Independence of executives for firm b at time t
T4bt represents Board gender, age and diversity for firm b at time t
T5bt represents CEO non duality for firm b at time t
T6bt represents Key board Committees for firm b at time t
Ɛ bt represents the error term
3.5 Hypothesis development
3.5.1 Frequency of the board meetings and firm performance
This is the total number of corporate board meetings held in the year. The time used in board
meetings, determines the performance effect. The agenda, issues raised, discussed and
reviewed all have an effect on the performance of a firm. If these meetings have no
meaningful agenda then the outcome will be useless. However if they are well-structured and
organized, then meaningful decision and strategies will be laid down for the future and help
keep the firms’ ship on course.
Board meetings are costly in terms of time and money (travel costs, conferencing costs, etc.)
and, as such, a balance should be reached between the number of times the board meets and

Page | 25
the cost inherent with the benefits of a successful meeting. A study by (Lipton and Lorsch
(1992) revealed that more frequent meetings boards are able to lead the organization from a
strategic direction point along with review performance as it stands, in order to realign any
variances. As a result, this is tested here.
Hypothesis 1: A statistically positive relationship exists between the frequency of board
meetings and the performance of a firm
3.5.2 Board size and firm performance
For the purpose of this study, board size is the number of directors serving or the number of
Directors on the company's board, as reported by the company (Full time Directors only).
Deputy members of the Board will not be counted. The board’s capacity for monitoring
increases as more directors are added, however the benefits may be engulfed by the
incremental cost of poorer communication and decision making associated with larger
boards. Yermack (1996) found that Tobin’s Q deteriorates with board size. In the same light,
(Kyereboah-Coleman and Biekpe (2007) refutes the earlier findings, stating that large boards
have a more positive effect on firm performance than smaller ones. As a result of these
conflicting views, this has been included in the variables of this study to examine its case
from a South African perspective.
Hypothesis 2: A statistically negative relationship exists between the board size and the
performance of a firm.
3.5.3 Independence of executives and firm performance:
The number of non-executive directors on the company board of directors reflects
independence. It includes outside directors in those markets where applicable. Where the
company has a two-tier board, this field refers to shareholder representatives on the
supervisory board. Further, the number of Independent Directors on the company's board, as
reported by the company, is addressed here. Independence is defined according to the
company's own criteria. An effective board that can both lead and control the company is
recommended (King III report, (2009). The non-executive directors act as overseers of good
behaviour and owner’s interest, while the executive directors are better suited to monitor
business and enhance performance. Independence addresses the issue of associations and how
these are supposed to be managed with respect to family ties, business connection or past and

Page | 26
present colleagues. These members offer the requisite reputable business experience, both
academic and working expertise and business contacts to ensure the reviewing and
monitoring mandate is adhered to efficiently and effectively.
Hypothesis 3: A statistically positive relationship exists between the independence of
directors and the performance of a firm
3.5.4 Board gender and diversity and firm performance:
For the purpose of this study, gender is looked at as binomial, either male or female.
Diversity turns to all other factors such as board average age, ethnicity, religion, race,
professional and technical experience, academic background, life orientation and cultural.
Here the study will look at the number of female executives and/or female directors on the
company board, as of the fiscal year. Executives are as defined by the company, or those
individuals that form the company executive committee/board or management
committee/board or equivalent. A board can either be diverse or homogeneous. Diversity has
the ripple effect of sending a positive signal of inclusive behaviour. This gives the impression
that all stakeholders in a community and society are fully represented and accommodated.
However, diversity means embracing differences and listening to all views, opinions,
interests and prejudices before making decisions which may constrain its efforts
tremendously. To date, the findings on the relationships between gender diversity and
performance are inconclusive. For example, (Williams (1999) found a significant positive
relationship between gender diversity and firms’ performance. In contrast, (Firer and Meth
(1986) reported a significant negative relationship between gender diversity and firms’
performance. As a result of these varying findings, this variable was included in this study.
Hypothesis 4: A statistically positive relationship exists between the board gender, age and
diversity and the performance of a firm
3.5.5 CEO non duality and firm performance:
CEO non duality is measured as the separation of the company's position of Chief Executive
Officer and Chairmanship of the Board, as reported by the company. ‘0' indicates the two
roles are separate. For the purpose of this study, binomial output will be used with either a '1'
- Yes or '0' - No. If for any reason the position of CEO is vacant while the chairperson is in
place, it is assumed that the chairperson assumes the responsibilities of the CEO and in this

Page | 27
case, duality would exist. Furthermore, if the position of chairperson is vacant while a CEO
exists, it is assumed that the CEO takes on the responsibilities of the chairperson until the
vacancy is filled. Yermack (1996) concluded that the value of the firm and its performance is
enhanced when there is a separation of these roles. This shall be tested in the South African
emerging market context.
Hypothesis 5: A statistically positive relationship exists between the CEO non duality and
the performance of a firm
3.5.6 Committees and firm performance:
Board effectiveness may not necessarily be affected by its size or composition but by its
internal administration structure. It can be argued that committees hinder the board and
management from carrying out their duties freely and affect a firm’s performance negatively.
Further, they impose an additional cost in terms of time, remuneration and other expenses
that impact a firm’s performance negatively. An evaluation by (Klein (2002) focused on the
directors roles within these committees and concluded by proposing committees be filled
with specialized roles to enhance effectiveness and monitoring. This is tested by the study
using the following hypothesis.
Hypothesis 6: A statistically negative relationship exists between the presence of all
committees and the performance of a firm
Chapter summary
The chapter focused on the data and research design. The study draws inferences based on
data on internal corporate governance variables and financial performance variables. Detailed
description and in depth explanations on the corporate governance environment in South
Africa follows. Further, that chapter addresses this environment’s translation to firm’s
performance.

Page | 28
CHAPTER 4: PRESENTATION OF RESULTS
4.0 Introduction
The previous chapter detailed the research design. The hypotheses were introduced and
discussed in Section 3.6. This chapter presents the research findings and is organized as
follows: Section 4.1 presents descriptive statistics; Section 4.2 presents the diagnostic process
followed for the regression which is then followed by presentation of the regression results in
section 4.3; This is then followed by the discussion of results in relation to hypothesis
introduced in section 3.6.
4.1 Descriptive statistics
Table 4.1 and Table 4.2 present the descriptive analysis of our independent and dependent
variables for the entire period and for the year on year from 2009 to 2013. Most of our
variables are close to being normally distributed except for CEO duality, committees and firm
performance, ROE, ROA and Tobin Q which have skewness of 22.249, 7.697, 14.171, 8.369
and 13.959 respectively.
The summary statistics for the period are displayed in the tables below, table 4.1 and 4.2. A
comprehensive description and discussion of the individual variables follows the summary
statistics for the period and year on year.

Page | 29
Table 4.1 shows descriptive statistics of the specific dependent and independent variables for the entire period for the sample.
MEETINGS SIZE INDEP NON_EXEC WOMEN AGE CEO COMM ROA ROE TOBIN_Q
Mean 5.921 12.077 6.632 8.836 1.962 55.552 0.002 0.016 0.092 0.208 1.949
Std Error 0.092 0.152 0.108 0.126 0.057 0.166 0.002 0.006 0.015 0.018 0.199
Median 5.000 12.000 6.000 9.000 2.000 55.454 0.000 0.000 0.059 0.165 1.313
Mode 5.000 9.000 5.000 10.000 2.000 54.000 0.000 0.000 0.007 0.092 2.609
Std Dev 2.039 3.387 2.412 2.794 1.265 3.689 0.045 0.126 0.329 0.405 4.426
Sample Var 4.158 11.472 5.816 7.805 1.600 13.606 0.002 0.016 0.108 0.164 19.593
Kurtosis 6.584 0.033 0.070 0.144 0.042 0.915 495.000 57.483 232.266 106.610 206.860
Skewness 1.951 0.592 0.485 0.537 0.332 -0.130 22.249 7.697 14.171 8.369 13.959
Range 16.000 18.000 13.000 16.000 6.000 27.670 1.000 1.000 6.293 7.474 68.684
Min 3.000 6.000 2.000 3.000 0.000 40.000 0.000 0.000 -0.302 -1.376 0.149
Max 19.000 24.000 15.000 19.000 6.000 67.670 1.000 1.000 5.992 6.098 68.834
Sum 2,931 5,978 3,283 4,374 971 27,498 1 8 46 103 965
Count 495 495 495 495 495 495 495 495 495 495 495
Table 4.2 shows descriptive statistics of the specific dependent and independent variables year on year from 2009 to 2013
2009 2010 2011 2012 2013
Mean std dev Mean std dev Mean std dev Mean std dev Mean std dev
MEETINGS 6.000 2.241 6.162 2.498 5.737 1.747 5.737 1.782 5.970 1.826
SIZE 12.242 3.597 12.263 3.573 12.051 3.403 11.848 3.189 11.980 3.201
INDEP 6.323 2.519 6.586 2.611 6.636 2.314 6.717 2.304 6.899 2.306
NON_EXEC 8.737 2.940 8.838 2.958 8.818 2.837 8.848 2.712 8.939 2.555
WOMEN 1.798 1.245 1.859 1.254 2.071 1.303 2.030 1.273 2.051 1.248
AGE 54.696 3.659 55.195 3.821 55.404 3.492 56.062 3.608 56.405 3.674
CEO - - - - - - 0.010 0.101 - -
COMM 0.051 0.220 0.010 0.101 0.010 0.101 0.010 0.101 - -
ROA 0.105 0.348 0.137 0.602 0.096 0.199 0.069 0.101 0.053 0.094
ROE 0.224 0.393 0.267 0.631 0.225 0.370 0.184 0.236 0.139 0.268
TOBIN_Q 2.375 6.751 2.295 6.796 1.692 1.315 1.785 1.983 1.600 0.907
Page | 30
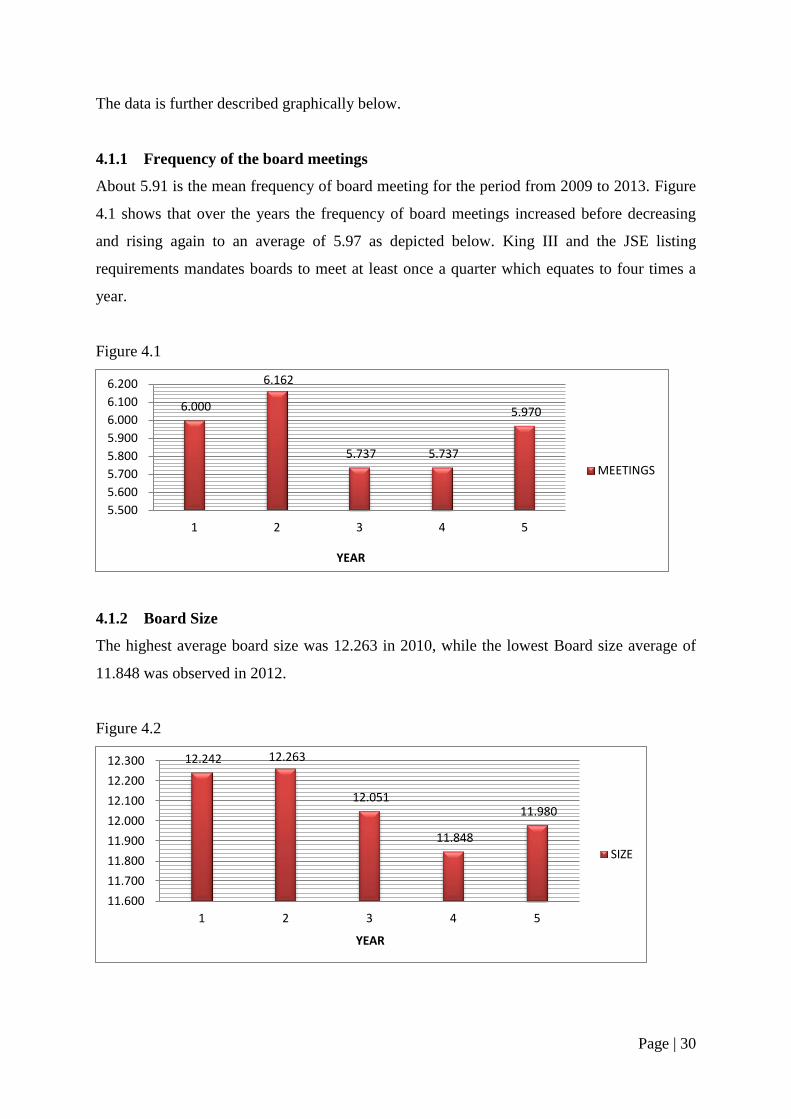
The data is further described graphically below.
4.1.1 Frequency of the board meetings
About 5.91 is the mean frequency of board meeting for the period from 2009 to 2013. Figure
4.1 shows that over the years the frequency of board meetings increased before decreasing
and rising again to an average of 5.97 as depicted below. King III and the JSE listing
requirements mandates boards to meet at least once a quarter which equates to four times a
year.
Figure 4.1
4.1.2 Board Size
The highest average board size was 12.263 in 2010, while the lowest Board size average of
11.848 was observed in 2012.
Figure 4.2
6.000
6.162
5.737 5.737
5.970
5.500
5.600
5.700
5.800
5.900
6.000
6.100
6.200
1 2 3 4 5
YEAR
MEETINGS
12.242 12.263
12.051
11.848
11.980
11.600
11.700
11.800
11.900
12.000
12.100
12.200
12.300
1 2 3 4 5
YEAR
SIZE

Page | 31
4.1.3 Independence of directors
Figure 4.3 shows that independent board membership increased progressively year on year
from 6.323 in year 2009 to 6.899 in 2013. This reflects a linear increase of 9.1% over the
period. Similarly, figure 4.4 shows that non-executive membership increased from 8.737 to
8.939 on average across the sample period. It is particularly interesting that more than half
the board membership is filled by non-executive directors with the majority being
independent.
Figure 4.3
Figure 4.4
4.1.4 Board diversity (gender and age)
Figure 4.5 and 4.6 show that both average board age and gender matrix increased. A main
contribution to this is the aging population on the board and the general adoption of BBBEE
6.323
6.586 6.636
6.717
6.899
6.000
6.200
6.400
6.600
6.800
7.000
1 2 3 4 5
YEAR
INDEP
8.737
8.838 8.818
8.848
8.939
8.600
8.650
8.700
8.750
8.800
8.850
8.900
8.950
9.000
1 2 3 4 5
YEAR
NON_EXEC

Page | 32
codes of good practice. For this study, diversity looks at age and gender. However, boards are
to ensure diversity in terms of skills, experience and qualification and demographics.
Figure 4.5
Figure 4.6
4.1.5 CEO non duality
Figure 4.7 shows that, with the exception of year 2012 there was generally, no duality over
the sample period
Figure 4.7
1.798 1.859
2.071 2.030 2.051
1.600
1.700
1.800
1.900
2.000
2.100
1 2 3 4 5
YEAR
WOMEN
54.696
55.195 55.404
56.062 56.405
53.500
54.000
54.500
55.000
55.500
56.000
56.500
57.000
1 2 3 4 5
YEAR
AGE
-
0.005
0.010
0.015
1 2 3 4 5
CEO
CEO

Page | 33
4.1.6 Key board Committees
King III and the Companies Act 71 of 2008 together require listed firms to set up audit, risk,
remuneration and nomination committees. This has almost been applied in totality by all
firms in the sample. The decrease reflects this as presence of all was 0 while 1 was
representative of a missing committee.
4.2 Regression diagnostic testing
In order to run any least squares regression analysis, a few assumptions had to be met and
corrected for in the panel data. The assumptions were linearity, normality, multicollinearity
and homoscedasticity. A series of tests were conducted and the data corrected for the least
squares assumption before running the final regression and presenting the findings.
Firstly, the individual variables are tested for significance. A squatter plot of each individual
variable was developed and outliers were eliminated, that left us with a sample of 99 listed
firms, from a pool of 380 in the listed firm’s population. Further, the correlation matrix below
was done repeatedly removing outliers in the data sets that required extra modelling and
fixing in order to be included. The presence of negative values and/or extreme deviations to
norm based on either economic specific condition like the long mining strike and scandals in
the construction industry would yield abnormal returns or results and as a result, inferences
could not be made on the population at large. This of course means the study might omit
important explanatory variables. This is noted and ignored for the purpose of this study. As a
development to this study, one could assess the impact of eliminating such variables. Once
this is done the study looks at the key features of a good regression model.
Table 4.3 shows the correlation matrix of the independent variables included in the model.
The table shows a very low correlation coefficient of the independent variables after firstly
removing the outliers and then first differencing with only Non-Executive and firm size
having a correlation 0.872, indicating there is a marginally insignificant multicollinearity
issue with the data (that same variables are correlated). The correlation statistic of 0.872
which is greater that the test statistic of 0.8 can safely be ignored as long as there is no
autocorrelation, something that is corrected for by using first differencing of the data.

Page | 34
Important to note in the matrix is that the key board committees are negatively related to all
the other independent variables.
Table 4.3 Correlation Matrix of the variables used in the regression analysis
MEETINGS SIZE INDEP NON_EXEC WOMEN AGE CEO COMM
MEETINGS 1.000
SIZE -0.006 1.000
INDEP 0.064 0.708 1.000
NON_EXEC 0.072 0.872 0.774 1.000
WOMEN 0.020 0.470 0.462 0.470 1.000
AGE 0.053 0.157 0.322 0.205 0.016 1.000
CEO 0.002 0.052 0.044 0.083 0.037 0.047 1.000
COMM -0.089 -0.117 -0.127 -0.130 -0.047 -0.019 -0.006 1.000
To do away with multicollinearity, the study looked at the first differences of all our variables
and regressed them using panel fixed effect and not panel random effect regression modeling
analysis. The obvious solution would have been to log the data, however, due to presence of
non-positive values, this was not possible. Because the random effect regression model failed
to produce a test statistic that can be accepted at the 5 percent confidence level, we went
ahead with the fixed effect panel regression model at first differences. I performed the
Hausman specification test on our random effect panel regression to differentiate between the
fixed effects model and the random effect. Because the random effect model had a “p” value
greater than 0.05, (0.7123), we reject the null which states that the random effects model fits
well with the data. The study found a statistically insignificant “p” value test showing that we
reject the favoured null hypothesis of random effects and concluded that fixed effects model
is the most appropriate for our data. The study uses the fixed cross section specification for
our regression to remove the autocorrelation and the multicollinearity that may arise due to
time invariant repeat independent values.
We tested for a unit root using the Augmented Dickey Fuller test and all our independent
variables had a t statistic which was far more negative than the critical values, indicating that
they all had no unit root and that they are all stationary and the regression can proceed.
We used the Durbin Watson test and the correlogram to test for autocorrelation and found no
autocorrelation in our error terms except for CEO non-duality which we corrected for by first

Page | 35
differencing. To check for correctness of the data using this test, the results must yield a
statistic above 1.5 and as close as possible to 2, which was observed in the final regression
and allowed for interpretation of the data. The regression results are presented below.

Page | 36
Table 4.4 Summary of the hypothesis tests results
ROE ROA TOBIN'S Q
Hypothesis Regression Statistical Hypothesis Regression Statistical Hypothesis Regression Statistical Hypothesis
sign result significance Decision result significance Decision result significance Decision
of results of results of results
BOARD_MEETINGS + - INSIG Reject + SIG Accept + SIG Accept
PER_YR
BOARD SIZE - + INSIG Reject - INSIG Reject + INSIG Reject
INDEPENDENT + - INSIG Reject - INSIG Reject - SIG Reject
DIRECTORS
# NON + - SIG Reject - SIG Reject - SIG Reject
EXECUTIVE
# WOMEN + + INSIG Reject + SIG Accept + SIG Accept
ON_BOARD
BOARD + - INSIG Reject - INSIG Reject - INSIG Reject
AVE_AGE
CEO NON + + SIG Accept + SIG Accept + SIG Accept
DUALITY
COMMITTEES - - INSIG Reject - INSIG Reject - INSIG Reject
*INSIG = Insignificant
**SIG= Significant at either 1%, 5% or 10%
Hypothesis 1: A statistically positive relationship exists between the frequency of board meetings and the performance of a firm
Hypothesis 2: A statistically negative relationship exists between the board size and the performance of a firm.
Hypothesis 3: A statistically positive relationship exists between the independence of directors and the performance of a firm
Hypothesis 4: A statistically positive relationship exists between the board gender, age and diversity and the performance of a firm
Hypothesis 5: A statistically positive relationship exists between the CEO non-duality and the performance of a firm
Hypothesis 6: A statistically negative relationship exists between the presence of all committees and the performance of a firm

Page | 37
As revealed in table 4.5 and 4.6, in order for us to successfully make inferences of the
results, the regressions needed to meet certain features for a good regression model. These
included the regression line being strongly fitted to the data represented by an R squared
value greater than 60 percent. This is the case for my outputs and allows me to proceed. The
second feature is that the independent variables should be individually significant to explain
the dependent variable observed in the t test. This was already tested for prior to running the
regression. The third feature is that the independent variables should be jointly significant to
explain the dependent variables and this is observed in the f test. The residuals must not be
autocorrected, a feature already corrected for in the preliminary tests above using the
Breusch-Godfrey serial correlation LM test. Lastly, the variances of the residuals are
homoscedastic and not heteroscedastic. This is confirmed using the Breusch-Pegan-Godfrey
test. With all these features observed, the data is normally distributed and as such indicates
that the regression is a good model where the independent variables can explain the
dependent variables to the regression model. The results are presented and discussed below.
4.3 Impact of governance on accounting based measures of performance
Table 4.5 shows the explanatory value of the independent variables to the variation of the
dependent variables, ROE and ROA is 67.86% and 78.87% respectively seen by the R
squared value. The dependent variables ROA and ROE are explained 67.86% and 78.87%
accurately by the independent variables in the model.
Table 4.4 shows us that the number of board meetings (MEETINGS) per year has a
statistically positive relationship to the performance of a company as shown by our results
with a p-value of 0.0448 which is statistically significant at the 5%. We therefore accept the
null hypothesis that there exist a statistically positive relationship between the frequency of
board meetings and the performance of a firm. Despite this being the case for ROA, ROE
reveals the opposite result. The relationship is not positive and the p-value is not significant at
0.2316. In this case, we therefore reject the null in this case.
Using ROA as our proxy for performance, the board size (SIZE) has a negative relationship to
a firm’s performance as indicated by the negative co-efficient of -0.000508. Although the
relationship is in tandem with the hypothesis, the results are not statistically significant as
shown by a p-value of 0.9688. This suggests that we therefore reject the hypothesis that a
statistically positive relationship exists between the board size and the performance of a firm.

Page | 38
On the other hand, the relationship observed using ROE as a proxy is positive and the p-value
insignificant, 0.6262, we therefore reject both the null hypothesis.
Table 4.5 shows a negative relationship between the number of independent directors
(INDEP) and the performance of a firm, as shown by a p-value of 0.127 and 0.5418 which is
not statistically significant for ROA and ROE respectively. We therefore reject the null
hypothesis that there exists a positive relationship between the independence of directors and
the performance of a firm. These finding are in sync with the findings of (Zaman et al. (2011)
and (Tshipa (2013), but goes against the findings of Williams (1999), Mangena and Chamisa
(2008) which found a positive relationship existing between the number of independent
directors and the performance of a firm. Similarly the p-values are significant for non-
executive director membership (NON_EXEC) which is 0.0004 and 0.0081 for ROA and ROE
respectively. Despite the statistically significant p-value, the relationship is negative; we
therefore fail to accept the hypothesis that there is a statistically positive relationship.
The results for the number of women (WOMEN) on boards and its relationship to
performance is highly positive and statistically significant as shown by a p-value of 0.0016
for ROA but insignificant statistic for ROE, 0.2309. As a result we accept the hypothesis for
ROA and reject for ROE. The board average age’s (AGE) relationship with a firms’
performance is negatively related for both ROA and ROE. With p-values of 0.2365 and
0.2942 respectively, this indicates statistical insignificance. The hypothesis is therefore
rejected in both instances. These findings are in line with studies by (Erhardt et al. (2003) that
found a negative relationship between board diversity and a firms’ performance.
CEO non-duality’s (CEO) relationship with a firm’s performance is positive and statistically
significant for both accounting measures ROA and ROE, as shown by a p-value of 0.0142
and 0.0757. We therefore fail to reject this hypothesis. Unlike CEO non duality (CEO), the
presence of all committees (COMM) has a negative relationship with a firms’ performance.
Though the negative relationship is observed that fits the assumptions of this study, the p-
values are not statistically significant at 0.268 and 0.4153 for ROA and ROE respectively.
While the results capture the relationship correctly, the p-values are insignificant and
therefore we reject the hypothesis.

Page | 39
Table 4.5 Relationship between firm performance and governance
Panel A: Dependent Variable: ROA
Method: Panel Least Squares
Variable Coefficient Std. Error t-Statistic Prob.
INTERCEPT 1.493414 1.177653 1.268127 0.2058
MEETINGS 0.00422 0.002094 2.015662 0.0448**
SIZE -0.000508 0.012948 -0.039202 0.9688
INDEP -0.01608 0.010331 -1.556418 0.1207
NON_EXEC -0.017739 0.004928 -3.599334 0.0004***
WOMEN 0.018167 0.005693 3.191382 0.0016***
AGE -0.021378 0.018021 -1.186298 0.2365
CEO 0.081012 0.032838 2.467016 0.0142**
COMM -0.027481 0.024762 -1.109807 0.268
R-squared 0.678597
Adjusted R-squared 0.560712
S.E. of regression 0.241547
Sum squared resid 16.86163
Log likelihood 63.06227
F-statistic 5.75644
Prob(F-statistic) 0
Durbin-Watson stat 1.980443
Panel B: Dependent Variable: ROE
Method: Panel Least Squares
Variable Coefficient Std. Error t-Statistic Prob.
INTERCEPT 1.351293 1.045499 1.292485 0.1972
MEETINGS -0.004271 0.003563 -1.198761 0.2316
SIZE 0.007733 0.01586 0.487581 0.6262
INDEP -0.008882 0.014541 -0.61081 0.5418
NON_EXEC -0.028656 0.010746 -2.666699 0.0081***
WOMEN 0.018031 0.015019 1.200584 0.2309
AGE -0.016603 0.0158 -1.050863 0.2942
CEO 0.136412 0.076518 1.782748 0.0757*
COMM -0.025069 0.030732 -0.815712 0.4153
R-squared 0.788797
Adjusted R-squared 0.711331
S.E. of regression 0.231652
Sum squared resid 15.50849
Log likelihood 79.62559
F-statistic 10.18256
Prob(F-statistic) 0
Durbin-Watson stat 2.131463
***significant at 1%
**significant at 5%
*significant at 10%

Page | 40
4.4 Impact of governance on market based measures of performance
The explanatory value of the independent variables explaining the variation of the dependent
variable is 70.30% seen by the R squared value. The dependent variable, Tobin’s Q is
explained 70.30% accurately by the independent variables in the model.
Table 4.6 shows the relationship between governance measures and the market based
measure of performance that reveals a statistically significant positive relationship between a
firm’s frequencies of board meetings and a firm’s performance with a p-value of 0.077. The
hypothesis which states that there is a positive relationship between the frequency of board
meetings (MEETINGS) and the performance of a firm is supported empirically by these
findings and as such is accepted. The statistically significant positive relationship between the
number of board meetings (MEETINGS) and the firm’s performance is seen in the studies by
(Mangena and Tauringana (2006), (Vafeas and Theodorou (1998), (Arora (2011), (Fich and
Shivdasani (2006) and (Carcello, Hermanson, Neal and Riley (2002). A positive coefficient is
in agreement with the King III report that there should be a significant number of board
meetings in a year. Tshipa (2013) found a positive relationship between the number of board
meetings (MEETINGS) and the firm’s performance, although his findings were statistically
insignificant.
There is a statistically insignificant positive relationship between a firm’s board size (SIZE)
and the market performance with a p-value of 0.5476. Though the findings are not
statistically significant the positive coefficient is in conflict with the negative link stipulated
in the hypothesis as was found by (Kyereboah-Coleman and Biekpe (2007) and (Lipton and
Lorsch (1992). We therefore reject the null hypothesis that there is a negative relationship
between the board size and the performance of a firm (Table 4.6).
The results reveal a negative relationship exists between the independent of directors
(INDEP) and market based performance. Although it is statistically significant with a p-
value of 0.0006, it is against the framework set out in the King III on best practice. This result
questions the practices of firms in the South African economy and allows for improvement in
policy. The number of non-executive (NON_EXEC) directors on a board has a statistically
significant negative relationship with a firm’s performance. Therefore we reject the forth
hypothesis that states that there exists a positive relationship between the independence of

Page | 41
directors and the performance of a firm. This is against the findings of Dalton and Kesner
(1987) and Boyd (1995).
The number of women (WOMEN) on boards has a statistically significant positive
relationship with a firm’s performance, p-value of 0.0147. Similarly this was revealed in the
study by (Firer and Meth (1986) and (Bhagat and Bolton (2008). Therefore the hypothesis
that states that there is a positive relationship between board diversity and performance is
accepted. In total contrast to this hypothesis are the findings on board age, that revealed a
negative relationship but with an insignificant p-value of 0.441. In this case the hypothesis is
rejected.
Our study finds a statistically significant positive relationship between CEO non-duality and
a firm’s market performance in line with the studies of (Kyereboah-Coleman and Biekpe
(2007), (Dalton and Kesner (1987) and (Boyd (1995). We therefore accept our null
hypothesis number 5 (See Table 4.6). The relationship between the boards Committees
(COMM) has a negative relationship to a firm’s performance with a high p value of 0.192
showing high insignificancy statistically. This finding is consistent to major studies showing
an empirically statistically negative relationship between Tobin Q and board committees
(Vafeas & Theodorou, (1998).
Table 4.6 Relationship between firm performance and governance
Dependent Variable: TOBIN's Q
Method: Panel Least Squares
Variable Coefficient Std. Error t-Statistic Prob.
INTERCEPT 12.42384 12.91775 0.961765 0.337
MEETINGS 0.074022 0.041713 1.774533 0.077*
SIZE 0.125181 0.207936 0.602016 0.5476
INDEP -0.245297 0.070336 -3.487496 0.0006***
NON_EXEC -0.275857 0.138783 -1.987686 0.0478**
WOMEN 0.165543 0.067425 2.455237 0.0147**
AGE -0.155664 0.201748 -0.771579 0.441
CEO 0.426494 0.121361 3.514249 0.0005***
COMM -0.287396 0.219785 -1.307626 0.192
R-squared 0.703036
Adjusted R-squared 0.594116
F-statistic 6.45456
Prob(F-statistic) 0
Durbin-Watson stat 1.520467
***significant at 1%
**significant at 5%
*significant at 10%

Page | 42
Chapter summary
A presentation of the descriptive statistics depicting the level of compliance to frameworks
set and then a discussion of corporate governance measures in relation to various
performance measures was followed with a look at the hypothesis test results. The next
chapter discusses these findings in relation to theory.

Page | 43
CHAPTER 5: CONCLUSIONS AND RECOMMENDATIONS
5.1 Introduction
This chapter is organized as follows: section 5.2 discusses the results in relation to existing
literature; Section 5.3 concludes and highlights some recommendations that can be explored
for future studies.
5.2 Discussion
The purpose of this paper is to evaluate the current situation in the South African market, of
the relationship of corporate governance and a firm’s performance of a sample of listed firms
on the JSE. The extant literature on corporate governance has not adequately covered several
aspects on compliance with guidelines set out by the Companies Act and the King III report.
One of the most important questions in corporate governance is whether or not the current
governance framework is sufficient to ensure ethical and moral behavior. More importantly,
it is not whether or not governance contributes to financial performance, but rather to what
extent it contributes to financial performance.
Our ROA, ROE and Tobin Q results are in tandem with accepting the null hypothesis that
there is a statistically significant relationship between CEO non-duality and a firm’s
performance in relation to the findings by (Arora (2011) and (Tshipa (2013). The opposite
view to this study were seen in the study by (Mangena and Chamisa (2008). The positive
coefficient of CEO non-duality strengthens the idea and recommendation of the King III
report that the role of CEO and Chairperson should be separated. This allows division of
responsibilities and aids in accountability and reporting fairly on operations. Donaldson and
Davis (1991) posit that returns are enhanced when there is no separation of roles of CEO and
chairperson but this is in contrast to resulting behaviours observed as in the Parmalat case.
The ROA and Tobin’s Q measure of performance are in agreement with the hypothesis and
proved empirically to be statistically significant. The results also revealed a positive
relationship between the frequency of board meetings (MEETINGS) and the performance of
a firm. This is in total conformity with the King III report that there should be a significant
number of board meetings in a year. This allows for review of performance and realignment
of variances if any accordingly during the financial period in question. Studies by (Mangena

Page | 44
& Tauringana (2006)), (Karamanou and Vafeas (2005)) and (Arora (2011)), (Vafeas
(1999a)), (Fich and Shivdasani (2006)) and (Carcello, Hermanson, Neal and Riley, (2002))
agree with this framework and, as such, from a policy perspective, this seems to be working.
However, if one looks at the case of African Bank Investment limited, that had more
meetings but still yielded poor or negative performance results, clearly one can see that in
times of crisis, these theoretical norms do not apply. Although (Tshipa (2013) found a
positive relationship between the number of board meetings and the firm’s performance, his
findings were statistically insignificant. This could be explained by the time difference in
study periods. This paper mainly looks at the time period post King III in 2009 while (Tshipa
(2013) mainly focused on the 10 years leading up to 2009.
In agreement with (Lipton and Lorsch (1992), this study found empirical evidence to reject
the null hypothesis that a statistically positive relationship exists between the board size and
the company performance. This study’s results were not statistically significant and the
positive coefficient is in contrasting view to the findings of the market based measure,
Tobin’s Q, that revealed a statistically significant negative link between board size
(Kyereboah-Coleman & Biekpe, (2007).
The study by (Adler (2001) suggests that that board diversity impacts positively on
accounting measures of performance, but this study’s ROE results reveals that we reject our
null hypothesis that a statistically positive relationship exists between board gender, age and
diversity and the performance of a firm. In contrast, the study by (Erhardt et al. (2003) found
a negative relationship between board diversity and a firms’ performance corroborating our
findings.
In conjunction with studies by (Boyd (1995), this study also rejects the null hypothesis of a
statistical positive relationship between the independence of directors and the performance.
However this is in contrast to the view of policy makers that govern the way firms are
monitored and operate, as seen in King III. Of course, scholars like (Dalton and Kesner
(1987) are in agreement with the King III recommendation that favours a situation where a
Chairperson be an Independent Non – Executive Director. This might be accounted for in the
differences in geographic location and or economic environments the firms operate in.

Page | 45
This study supports a few of the studies already done in an African context but differ mostly
in that South Africa is a developing economy, yet other scholars looked at developed
economies and this has a key role to play in the different results observed.
5.3 Conclusion and recommendations
This paper makes a significant contribution by addressing these key factors post
implementation of the King III guidelines that imposed stricter disclosure measures and
governance of public listed firms on the JSE. It is the first to explore the situation on the
ground with regards to compliance and adoption of frameworks imposed, along with an
assessment of their effect on performance. However, time and data availability limited the
depth of the study; As a result, the regression model had only six fundamental governance
factors, yet the corporate governance spectrum has several other factors that could be
explored.
Our study will add value to the existing literature in the findings of corporate governance
factors and support a significant frequency of board meetings, board gender, age, diversity,
CEO Non Duality to aid and improve performances through good corporate governance of
South African based corporations and the world over.
An interesting future research agenda would be to find possible explanations for these
contrasting results, starting with why we get positive relationships in one economy and
negative relationships in the next or between sectors or industries. Put differently, an
explanation why some factors are significant in one context and insignificant in another. A
similar study can be carried out in Southern African countries like Zimbabwe, Botswana,
Zambia, Angola and Mozambique to aid the literature of Corporate Governance factors in
developing countries.

Page | 46
REFERENCES:
Abor, J., & Biekpe, N. (2005). What determines the capital structure of listed firms in Ghana?
African Finance Journal, 7(1), p. 37-48.
Agrawal, A., & Knoeber, C. R. (1996). Firm performance and mechanisms to control agency
problems between managers and shareholders. Journal of financial and quantitative
analysis, 31(03), 377-397.
Aguilera, R. V., Williams, C. A., Conley, J. M., & Rupp, D. E. (2006). Corporate
Governance and Social Responsibility: a comparative analysis of the UK and the
US*. Corporate Governance: An International Review, 14(3), 147-158.
Barratt, R., & Korac-Kakabadse, N. (2002). Developing reflexive corporate leadership: the
role of the non executive director. Corporate governance, 2(3), 32-36.
Bhagat, S., & Black, B. (1999). The uncertain relationship between board composition and
firm performance. The Business Lawyer, 921-963.
Bhagat, S., & Bolton, B. (2008). Corporate governance and firm performance. Journal of
Corporate Finance, 14(3), 257-273.
Boyd, B. K. (1995). CEO duality and firm performance: A contingency model. Strategic
Management Journal, 16(4), 301-312.
Byrd, J. W., & Hickman, K. A. (1992). Do outside directors monitor managers?: Evidence
from tender offer bids. Journal of Financial Economics, 32(2), 195-221.
Carvalhal da Silva, A. L., & Leal, R. P. C. (2005). Corporate governance index, firm
valuation and performance in Brazil. Brazilian Review of Finance, 3(1), pp. 1-18.
Coase, R. H. (1937). The nature of the firm. economica, 4(16), 386-405.
Cremers, K., & Nair, V. B. (2005). Governance mechanisms and equity prices. The Journal
of Finance, 60(6), 2859-2894.
Dalton, D. R., & Kesner, I. F. (1987). Composition and CEO duality in boards of directors:
An international perspective. Journal of International Business Studies, 18(3), 33-42.
Donaldson, L., & Davis, J. H. (1991). Stewardship theory or agency theory: CEO governance
and shareholder returns. Australian Journal of management, 16(1), 49-64.
Douma, S. (1997). The two-tier system of corporate governance. Long Range Planning,
30(4), 612-614.
Eisenhardt, K. M. (1989). Agency theory: An assessment and review. Academy of
management review, 14(1), 57-74.
Erhardt, N. L., Werbel, J. D., & Shrader, C. B. (2003). Board of director diversity and firm
financial performance. Corporate Governance: An International Review, 11(2), 102-
111.
Fama, E. F., & Jensen, M. C. (1983). Agency problems and residual claims. Journal of law
and Economics, 327-349.
Firer, C., & Meth, G. (1986). Information disclosure in annual reports in South Africa.
Omega, 14(5), 373-382.
Governance, K. C. o. C., & Directors, I. o. (2002). King Report on Corporate Governance for
South Africa, 2002: Institute of Directors in Southern Africa.
Hamilton, S., & Micklethwait, A. (2006). Greed and corporate failure. The Lessons from
Recent.
Hendry, K., & Kiel, G. C. (2004). The role of the board in firm strategy: integrating agency
and organisational control perspectives. Corporate Governance: An International
Review, 12(4), 500-520.
Hermalin, B. E., & Weisbach, M. S. (1988). The determinants of board composition. The
RAND Journal of Economics, 589-606.
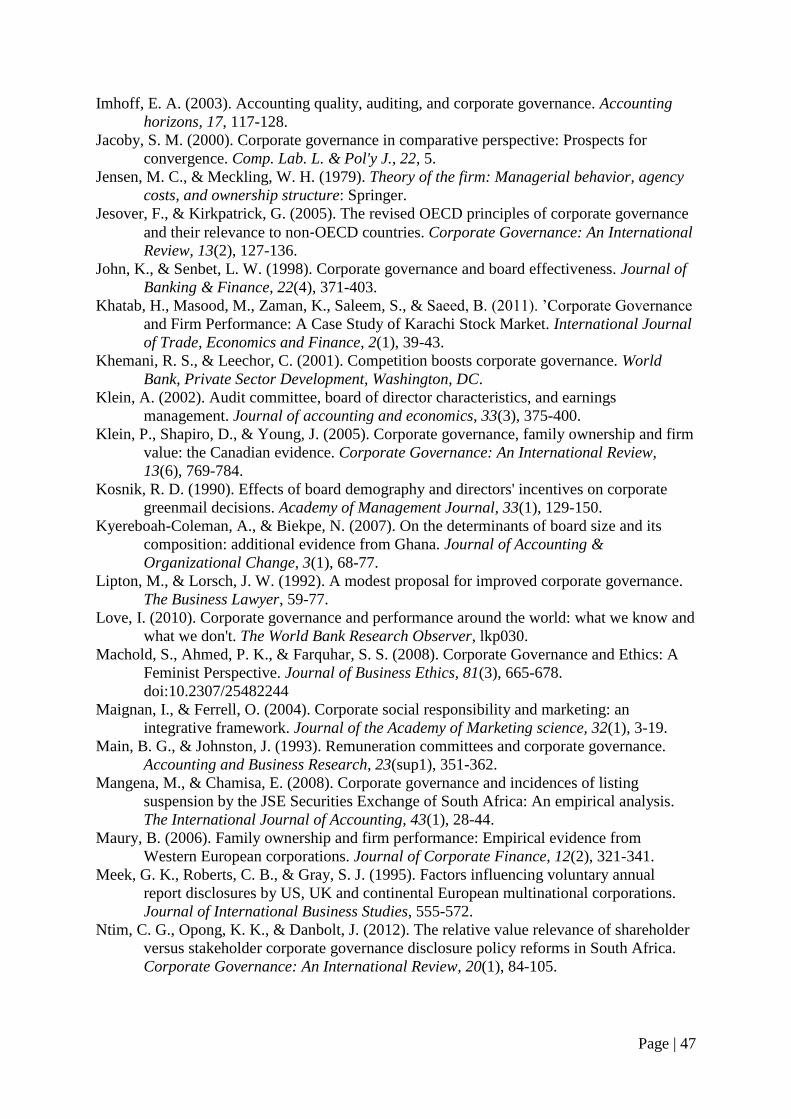
Page | 47
Imhoff, E. A. (2003). Accounting quality, auditing, and corporate governance. Accounting
horizons, 17, 117-128.
Jacoby, S. M. (2000). Corporate governance in comparative perspective: Prospects for
convergence. Comp. Lab. L. & Pol'y J., 22, 5.
Jensen, M. C., & Meckling, W. H. (1979). Theory of the firm: Managerial behavior, agency
costs, and ownership structure: Springer.
Jesover, F., & Kirkpatrick, G. (2005). The revised OECD principles of corporate governance
and their relevance to non‐OECD countries. Corporate Governance: An International
Review, 13(2), 127-136.
John, K., & Senbet, L. W. (1998). Corporate governance and board effectiveness. Journal of
Banking & Finance, 22(4), 371-403.
Khatab, H., Masood, M., Zaman, K., Saleem, S., & Saeed, B. (2011). ’Corporate Governance
and Firm Performance: A Case Study of Karachi Stock Market. International Journal
of Trade, Economics and Finance, 2(1), 39-43.
Khemani, R. S., & Leechor, C. (2001). Competition boosts corporate governance. World
Bank, Private Sector Development, Washington, DC.
Klein, A. (2002). Audit committee, board of director characteristics, and earnings
management. Journal of accounting and economics, 33(3), 375-400.
Klein, P., Shapiro, D., & Young, J. (2005). Corporate governance, family ownership and firm
value: the Canadian evidence. Corporate Governance: An International Review,
13(6), 769-784.
Kosnik, R. D. (1990). Effects of board demography and directors' incentives on corporate
greenmail decisions. Academy of Management Journal, 33(1), 129-150.
Kyereboah-Coleman, A., & Biekpe, N. (2007). On the determinants of board size and its
composition: additional evidence from Ghana. Journal of Accounting &
Organizational Change, 3(1), 68-77.
Lipton, M., & Lorsch, J. W. (1992). A modest proposal for improved corporate governance.
The Business Lawyer, 59-77.
Love, I. (2010). Corporate governance and performance around the world: what we know and
what we don't. The World Bank Research Observer, lkp030.
Machold, S., Ahmed, P. K., & Farquhar, S. S. (2008). Corporate Governance and Ethics: A
Feminist Perspective. Journal of Business Ethics, 81(3), 665-678.
doi:10.2307/25482244
Maignan, I., & Ferrell, O. (2004). Corporate social responsibility and marketing: an
integrative framework. Journal of the Academy of Marketing science, 32(1), 3-19.
Main, B. G., & Johnston, J. (1993). Remuneration committees and corporate governance.
Accounting and Business Research, 23(sup1), 351-362.
Mangena, M., & Chamisa, E. (2008). Corporate governance and incidences of listing
suspension by the JSE Securities Exchange of South Africa: An empirical analysis.
The International Journal of Accounting, 43(1), 28-44.
Maury, B. (2006). Family ownership and firm performance: Empirical evidence from
Western European corporations. Journal of Corporate Finance, 12(2), 321-341.
Meek, G. K., Roberts, C. B., & Gray, S. J. (1995). Factors influencing voluntary annual
report disclosures by US, UK and continental European multinational corporations.
Journal of International Business Studies, 555-572.
Ntim, C. G., Opong, K. K., & Danbolt, J. (2012). The relative value relevance of shareholder
versus stakeholder corporate governance disclosure policy reforms in South Africa.
Corporate Governance: An International Review, 20(1), 84-105.

Page | 48
Ntim, C. G., Opong, K. K., Danbolt, J., & Thomas, D. A. (2012). Voluntary corporate
governance disclosures by post-apartheid South African corporations. Journal of
Applied Accounting Research, 13(2), 122-144.
Puttick, G., Van Esch, S., & Van Esch, S. D. (2008). The principles and practice of auditing:
Juta and Company Ltd.
Rhoades, D. L., Rechner, P. L., & Sundaramurthy, C. (2000). Board composition and
financial performance: A meta-analysis of the influence of outside directors. Journal
of Managerial Issues, 76-91.
Rockness, H., & Rockness, J. (2005). Legislated ethics: From Enron to Sarbanes-Oxley, the
impact on corporate America. Journal of Business Ethics, 57(1), 31-54.
Rossouw, G. J., Van der Watt, A., & Rossouw, D. M. (2002). Corporate governance in South
Africa. Journal of Business Ethics, 37(3), 289-302.
Sarra, J. P. (2004). Strengthening domestic corporate activity in global capital markets: a
Canadian perspective on South Africa's corporate governance. GWU Law School
Public Law Research Paper(118).
Shleifer, A., & Vishny, R. W. (1997). A survey of corporate governance. The Journal of
Finance, 52(2), 737-783.
Strange, R., Filatotchev, I., Buck, T., & Wright, M. (2009). Corporate Governance and
International Business. MIR: Management International Review, 49(4), 395-407.
doi:10.2307/40658323
Taylor, A. H., Miller, R., & Gray, R. D. (2012). New Caledonian crows reason about hidden
causal agents. Proceedings of the National Academy of Sciences of the United States
of America, 109(40), 16389-16391. doi:10.1073/pnas.1208724109
Vafeas, N., & Theodorou, E. (1998). The relationship between board structure and firm
performance in the UK. The British Accounting Review, 30(4), 383-407.
Williams, S. M. (1999). Voluntary environmental and social accounting disclosure practices
in the Asia-Pacific region: An international empirical test of political economy theory.
The International Journal of Accounting, 34(2), 209-238.
Yermack, D. (1996). Higher market valuation of companies with a small board of directors.
Journal of Financial Economics, 40(2), 185-211.
Zaman, M., Hudaib, M., & Haniffa, R. (2011). Corporate Governance Quality, Audit Fees
and Non‐Audit Services Fees. Journal of Business Finance & Accounting, 38(1‐2),
165-197.
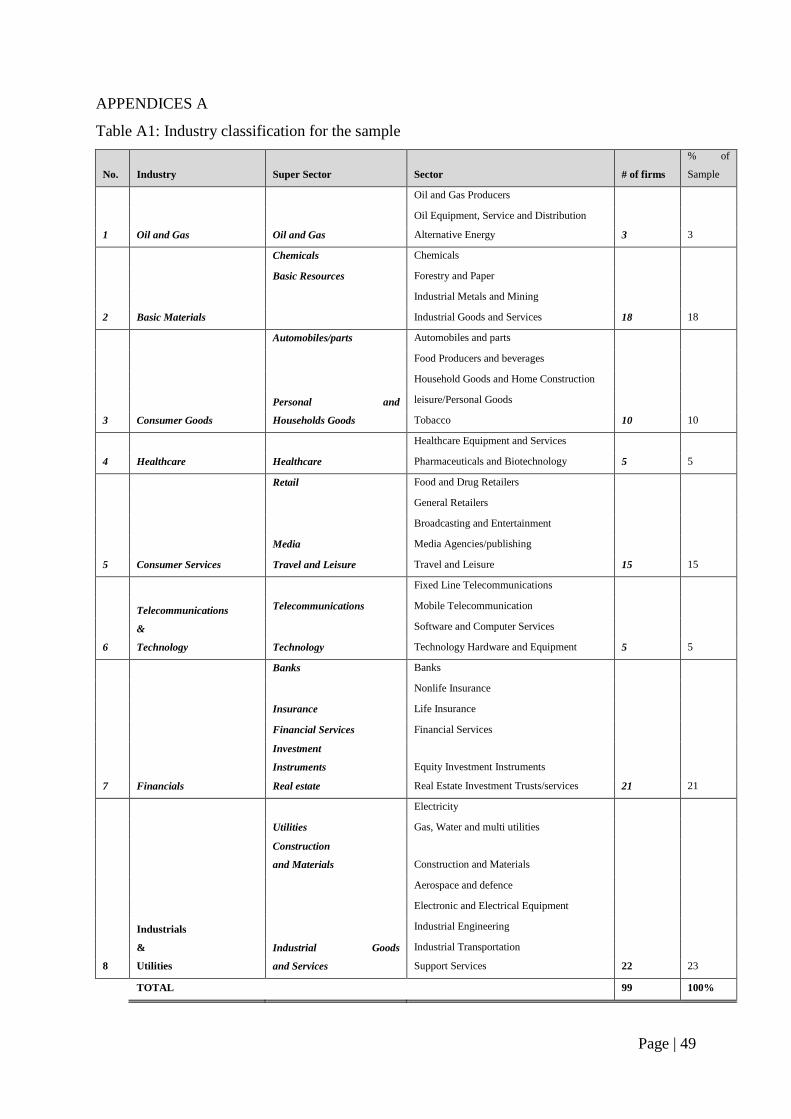
Page | 49
APPENDICES A
Table A1: Industry classification for the sample
No. Industry Super Sector Sector # of firms
% of
Sample
1 Oil and Gas Oil and Gas
Oil and Gas Producers
3 3
Oil Equipment, Service and Distribution
Alternative Energy
2 Basic Materials
Chemicals Chemicals
18 18
Basic Resources Forestry and Paper
Industrial Metals and Mining
Industrial Goods and Services
3 Consumer Goods
Automobiles/parts Automobiles and parts
10 10
Food Producers and beverages
Personal and
Households Goods
Household Goods and Home Construction
leisure/Personal Goods
Tobacco
4 Healthcare Healthcare
Healthcare Equipment and Services
5 5 Pharmaceuticals and Biotechnology
5 Consumer Services
Retail Food and Drug Retailers
15 15
General Retailers
Media
Broadcasting and Entertainment
Media Agencies/publishing
Travel and Leisure Travel and Leisure
6
Telecommunications
&
Technology
Telecommunications
Fixed Line Telecommunications
5
Mobile Telecommunication
Technology
Software and Computer Services
5 Technology Hardware and Equipment
7 Financials
Banks Banks
21 21
Insurance
Nonlife Insurance
Life Insurance
Financial Services Financial Services
Investment
Instruments Equity Investment Instruments
Real estate Real Estate Investment Trusts/services
8
Industrials
&
Utilities
Utilities
Electricity
22 23
Gas, Water and multi utilities
Construction
and Materials Construction and Materials
Industrial Goods
and Services
Aerospace and defence
Electronic and Electrical Equipment
Industrial Engineering
Industrial Transportation
Support Services
TOTAL 99 100%

Page | 50
Table A2: List of suspended or delisted securities from the JSE in 2010
ELEMENTONE LIMITED 2010/01/11
FIRSTRAND LIMITED 2010/01/11
AQUARIUS PLATINUM LIMITED 2010/01/19
MUTUAL & FEDERAL INSURANCE COMP LD 2010/02/08
KIWARA PLC 2010/02/10
EUREKA INDUSTRIAL LIMITED 2010/03/08
EMERGENT PROPERTIES LIMITED 2010/03/08
IMPERIAL BANK LIMITED 2010/03/12
S&J LAND HOLDINGS LIMITED 2010/04/26
SET POINT GROUP LIMITED 2010/05/25
MAKALANI HOLDINGS LIMITED 2010/06/01
CAPE EMPOWERMENT TRUST LIMITED 2010/06/01
DTH DYNAMIC TECHNOLOGY HOLDINGS LTD 2010/09/14
ABE CONSTRUCTION CHEMICALS LIMITED 2010/09/28
GOODHOPE DIAMONDS (KIMBERLEY) LTD 2010/10/04
BEIGE HOLDINGS LIMITED 2010/10/26
KIMBERLEY CONSOLIDATED MINING LTD 2010/11/08
CIC HOLDINGS LIMITED 2010/11/16
WOOLTRU LIMITED 2010/11/16
WOOLTRU LIMITED 2010/11/16
WOOLTRU LIMITED 2010/11/22
PBT GROUP LIMITED 2010/11/29
DIMENSION DATA HOLDINGS PLC 2010/12/14
HEALTH STRATEGIC INVESTMENTS LTD 2010/12/20
Table A3: List of suspended or delisted securities from the JSE in 2011
BARNARD JACOBS MELLET HOLDINGS LD 2011/01/04
SPESCOM LIMITED 2011/01/25
MARSHALL MONTEAGLE PLC 2011/02/28
INDUSTRIAL CREDIT COMP AFR HLDGS LD 2011/03/22
PANGBOURNE PROPERTIES LIMITED 2011/04/05
GLENRAND MIB LIMITED 2011/04/28
MVELAPHANDA RESOURCES LIMITED 2011/06/07
BEGET HOLDINGS LIMITED 2011/06/13
BEST CUT LIMITED 2011/06/13
HYPROP INVESTMENTS LIMITED 2011/10/17
UCS GROUP LIMITED 2011/10/25
PALADIN CAPITAL LIMITED 2011/10/25
UNIVERSAL INDUSTRIES CORP LTD 2011/11/01
VOX TELECOM LIMITED 2011/11/15
MERCHANT & INDUSTRIAL PROP LIMITED 2011/11/22
PARACON HOLDINGS LIMITED 2011/12/06

Page | 51
SALLIES LIMITED 2011/12/20
ANGLORAND HOLDINGS LIMITED 2011/12/20
SAAMBOU HOLDINGS LIMITED 2011/12/28
FREEWORLD COATINGS LIMITED 2011/12/29
Table A4: List of suspended or delisted securities from the JSE in 2012
PLATMIN LIMITED 2012/01/03
MVELAPHANDA GROUP LIMITED 2012/01/04
AFRICAN BRICK CENTRE LIMITED 2012/01/10
METOREX LIMITED 2012/01/17
KAIROS INDUSTRIAL HOLDINGS LIMITED 2012/02/13
DIALOGUE GROUP HOLDINGS LIMITED 2012/02/13
REAL AFRICA HOLDINGS LIMITED 2012/03/14
INTERTRADING LIMITED 2012/03/19
MERCANTILE BANK HOLDINGS LIMITED 2012/05/22
O-LINE HOLDINGS LIMITED 2012/07/03
OPTIMUM COAL HOLDINGS LIMITED 2012/07/09
MINE WASTE SOLUTIONS (PTY) LTD 2012/08/01
CAPEVIN INVESTMENTS LIMITED 2012/08/13
PRESCIENT LIMITED 2012/08/20
AVUSA LTD 2012/09/26
BEIGE HOLDINGS LIMITED 2012/10/03
EXCELLERATE HOLDINGS LIMITED 2012/10/09
M CUBED HOLDINGS LIMITED 2012/11/19
IQUAD GROUP LIMITED 2012/11/27
CERAMIC INDUSTRIES LIMITED 2012/11/27
S A FRENCH LIMITED 2012/12/03
REDEFINE PROP INTERNATIONAL LTD 2012/12/03

Page | 52
Table A5: List of suspended or delisted securities from the JSE in 2013
SALLIES LIMITED 2013/01/02
NEW AFRICA INVESTMENT LIMITED 2013/01/30
NEW AFRICA INVESTMENT LIMITED 2013/01/30
QUEENSGATE HOTELS & LEISURE LIMITED 2013/02/18
HARDWARE WAREHOUSE LIMITED 2013/02/26
SIMMER AND JACK MINES LIMITED 2013/04/16
JCI LIMITED 2013/04/16
ZAPTRONIX LIMITED 2013/04/30
CAPE EMPOWERMENT LIMITED 2013/05/14
ELB GROUP LIMITED 2013/05/14
NEW BOND CAPITAL LIMITED 2013/06/04
CLOVER INDUSTRIES LIMITED 2013/06/04
AMALGAMATED APPLIANCE HOLDINGS LD 2013/07/02
REUNERT LIMITED 2013/07/02
THABEX LIMITED 2013/07/09
CIPLA MEDPRO SOUTH AFRICA LIMITED 2013/07/16
MOBILE INDUSTRIES LIMITED 2013/07/16
RGT SMART MARKET INTELLIGENCE LTD 2013/07/30
MUVONI TECHNOLOGY GROUP LTD 2013/07/30
LONRHO PLC 2013/08/05
ALLIED TECHNOLOGIES LIMITED 2013/08/20
AG INDUSTRIES LIMITED 2013/08/27
SABLE HOLDINGS LIMITED 2013/09/03
IFA HOTELS AND RESORTS LIMITED 2013/09/10
BUSINESS CONNEXION GROUP LIMITED 2013/10/08
URANIUM ONE INC 2013/10/22
REDEFINE PROP INTERNATIONAL LTD 2013/11/04
RACEC GROUP LIMITED 2013/11/05
MVELASERVE LIMITED 2013/11/12
KAGISO MEDIA LIMITED 2013/12/10
FIRST URANIUM CORPORATION 2013/12/24