the relationship between capital structure …chss.uonbi.ac.ke/sites/default/files/chss/msc... ·...
TRANSCRIPT

THE RELATIONSHIP BETWEEN CAPITAL STRUCTURE AND
FINANCIAL PERFORMANCE OF INVESTMENT FIRMS LISTED AT
THE NAIROBI SECURITIES EXCHANGE
BY
MWAURA, PAUL MBUGUA
D63/61261/2013
A RESEARCH PROJECT PRESENTED IN PARTIAL FULFILLMENT
FOR THE AWARD OF MASTER OF SCIENCE IN FINANCE OF THE
SCHOOL OF BUSINESS, UNIVERSITY OF NAIROBI
OCTOBER 2014

ii
DECLARATION
I declare to the best of my knowledge that this is my original work and has not been presented
for a degree in this or any other university. To the best of my knowledge and belief, the research
project contains no material previously published or written by another person except where
due reference is made. No part of this project may be reproduced without prior permission of
the author and / or University of Nairobi.
Signature: …… …… Date: 6TH NOVEMBER 2014
MWAURA, PAUL MBUGUA
D63/61261/2013
DECLARATION BY SUPERVISOR:
This is to declare that this research project has been presented for examination with my
approval as the appointed University supervisor.
Signature: …… …… Date: 6TH NOVEMBER 2014
MR. HERICK ONDIGO
LECTURER, DEPARTMENT OF FINANCE AND ACCOUNTING
SCHOOL OF BUSINESS
UNIVERSITY OF NAIROBI

iii
ACKNOWLEDGEMENTS
Achieving success in academics including research projects rides on tremendous contributions
from both human and divine support. First of all is the loving care we are accorded by our
heavenly father, The Almighty God. He has granted me favour that saw me through course
work and research project.
I acknowledge the various scholars and the academic family for providing information and
enabling environment in which I have managed to carry out my research project with the intent
of enriching what has been studied as well as giving a chance to other scholars to carry out
further studies.
To my supervisor Mr. Herick Ondigo, whose constant corrections immensely contributed to
the shaping of this research project. Your suggestions prompted me back to books several a
time over to ensure the success of the project. The whole team of lecturers at UON thank you
and may God bless you all.
My immediate family members gave me the crucial support I needed in order to concentrate
on the research project. Thanks to my work colleagues, classmates and everyone else, thanks
and may our loving Heavenly Father continue to guide you in all your endeavours.

iv
DEDICATION
This research project is dedicated to my family my dad Simon Mwaura, mum Jacinta Nduta,
sisters Mercy Wanjiku & Faith Wanjiru; for giving me the invaluable support to concentrate
on this research. God bless you all. I thank Almighty God who is my source of all inspiration
in allowing me to undertake this project that is too involving in terms of time and resources.

v
TABLE OF CONTENTS
DECLARATION...................................................................................................................... ii
ACKNOWLEDGEMENTS .................................................................................................. iii
DEDICATION ......................................................................................................................... iv
LIST OF ABBREVIATIONS ............................................................................................... vii
LIST OF TABLES ............................................................................................................... viii
ABSTRACT ............................................................................................................................. ix
CHAPTER ONE ...................................................................................................................... 1
INTRODUCTION.................................................................................................................... 1
1.1 Background of the Study .................................................................................................. 1
1.1.1 Capital Structure ........................................................................................................ 2
1.1.2 Financial Performance ............................................................................................... 2
1.1.3 Relationship between Capital Structure and Financial Performance ........................ 4
1.1.4 Investment Firms Listed at Nairobi Securities Exchange ......................................... 5
1.2 Research Problem ............................................................................................................. 6
1.3 Objective of the Study ...................................................................................................... 8
1.4 Value of the Study ............................................................................................................ 8
CHAPTER TWO ................................................................................................................... 10
LITERATURE REVIEW ..................................................................................................... 10
2.1 Introduction .................................................................................................................... 10
2.2 Theoretical Review ........................................................................................................ 10
2.3 Determinants of Financial Performance ......................................................................... 12
2.4 Empirical Review ........................................................................................................... 17
2.5 Summary of Literature Review ...................................................................................... 19
CHAPTER THREE ............................................................................................................... 21
RESEARCH METHODOLOGY ......................................................................................... 21
3.1 Introduction .................................................................................................................... 21
3.2 Research Design ............................................................................................................. 21
3.3 Target Population ........................................................................................................... 21
3.4 Data Collection ............................................................................................................... 21
3.5 Data Analysis ................................................................................................................. 22

vi
CHAPTER FOUR .................................................................................................................. 24
DATA ANALYSIS, RESULTS AND DISCUSSION .......................................................... 24
4.1 Introduction .................................................................................................................... 24
4.2 Regression Analysis ....................................................................................................... 24
4.3 Regression Results ......................................................................................................... 29
4.5 Non-parametric Correlation ........................................................................................... 31
4.4 Interpretation of the Findings ......................................................................................... 32
CHAPTER FIVE ................................................................................................................... 34
SUMMARY, CONCLUSION AND RECOMMENDATIONS ......................................... 34
5.1 Introduction .................................................................................................................... 34
5.2 Summary ........................................................................................................................ 34
5.3 Conclusion ...................................................................................................................... 35
5.4 Recommendations for Policy ......................................................................................... 35
5.5 Limitations of the Study ................................................................................................. 36
5.6 Areas for Further Research ............................................................................................ 36
REFERENCES ....................................................................................................................... 37
APPENDICES ........................................................................................................................ 41
Appendix I: Investment Firms listed at the NSE as at 30th June 2014 ................................. 41
Appendix II: Data Collection Template ............................................................................... 42
Appendix III: Work Plan ...................................................................................................... 43

vii
LIST OF ABBREVIATIONS
CIS: Collective Investment Schemes
CMA: Capital Markets Authority
DPO: Dividend Payout Ratio
NSE: Nairobi Securities Exchange
ROA: Return on Assets ratio
SPSS: Statistical Package for Social Science
TANG: Total Assets Ratio as Indictor of Firms’ Tangibility
USA: United States of America

viii
LIST OF TABLES
Table 4.1: Model Summary for 2010 ....................................................................................... 24
Table 4.2: Coefficients for 2010 .............................................................................................. 25
Table 4.3 Model Summary for 2011 ........................................................................................ 25
Table 4.4 Coefficients for 2011 ............................................................................................... 26
Table 4.5 Model Summary for 2012 ........................................................................................ 26
Table 4.6 Coefficients for 2012 ............................................................................................... 27
Table 4.7 Model Summary for year 2013 ................................................................................ 28
Table 4.8 Coefficients for year 2013 ....................................................................................... 28
Table 4.9 Model Summary ...................................................................................................... 29
Table 4.10 ANOVA Results .................................................................................................... 30
Table 4.11 Coefficients of Determination ............................................................................... 30
Table 4.12 Correlations ............................................................................................................ 31

ix
ABSTRACT
A firm has to issue various securities in a countless mixture to come across particular
combinations that can maximise its overall value which means optimal capital structure. If a
wrong mix of finance is employed; the performance and survival of the business enterprise
may be seriously affected. The study’s general objective was to evaluate the relationship
between capital structure and financial performance of investment firms listed at the Nairobi
Securities Exchange. A descriptive survey research design was employed in this study. The
target population of the study comprised of the three investment companies which were listed
under the investment sector of the market segment of the Nairobi Securities Exchange (NSE)
as at June 2014. A census approach method was used in the study where the three companies
were selected without sampling. The study utilised panel data which consist of time series and
cross-sections. The data for all the variables in the study were extracted from published reports
and financial statements of the listed investment companies in the NSE covering the years 2010
to 2013 where quarterly reports were used. Quantitative method of data analysis and inferential
analysis were used as analysis techniques. A general model for panel data that allowed the
study to be estimated using panel data with great flexibility and formulate the difference in the
behaviour of the cross-section elements was adopted. From the findings on the Adjusted R
squared, the study revealed that there was variation of financial performance of investment
firms listed in the NSE due to variations in long-term debt, total debt and size. The study
revealed that long term and total debt were the major factors influencing the financial
performance of investment firms listed in the NSE. From the findings on the correlation
analysis the study revealed that there was a strong relationship between capital structure and
financial performance. The study concludes that total debt has a negative impact on financial
performance of the firms listed in the NSE. The higher the total debt, the less the return on
equity as well as reduced shareholders wealth which indicates a need to increase more capital
injection rather than borrowing. The total loans in these firms could lead to high interest
expense hence lowering the profitability of the firm. The firms should therefore fund
investments from internal sources in order to enhance their financial performance. The study
also recommends that there is need for the firms to adopt strategies that would increase their
size base and utilize the profits generated from the operations to acquire more assets and
improve their financial performance. There is need for the firms to have a strong capital
structure which provides them strength to withstand financial crises and offers shareholders a
better safety net in times of depressions.

1
CHAPTER ONE
INTRODUCTION
1.1 Background of the Study
Capital refers to structure as the way in which a firm finances its operations which can either,
be through debt or equity capital or a combination of both (Brigham and Houston, 2005).
Financial Performance is the blue print of the financial affairs of a concern and it reveals the
organization’s ability to translate its financial resources into mission related activities. The
importance of financing decisions cannot be over emphasised since many of the factors that
contribute to business failure can be addressed using strategies and financial decisions that
drive growth and the achievement of organizational objectives (Majumdar, 2009). The finance
factor is the main cause of financial distress. Financing decisions result in a given capital
structure and suboptimal financing decisions can lead to firm’s failure. A great dilemma for
management and investors alike is whether there exists an optimal capital structure. The
objective of all financing decisions is wealth maximisation and the immediate way of
measuring the quality of any financing decision is to examine the effect of such a decision on
the firm’s performance.
High performance is more than high returns. It is the ability to generate high returns for the
level of risk assumed by a firm (Kester, 2006). Credit risk, liquidity risk, market risk and so on
are some of the risks firms assume in order to earn optimal returns. High performing institutions
are those that manage and control their risk the best by employing effective trade-off between
risk and returns. Firms are constantly looking for ways to achieve high performance and
therefore a lot of theories have been formulated and studies conducted by firms in efforts to
determine the factors that influence performance of firms. A set of these theories and studies
identify capital structure as one of the factors affecting a firm’s performance on one hand and
on the other hand these theories and studies contradict the view that Capital structure does
affect a firm’s performance arguing that capital structure is irrelevant to a firm’s performance.
The capital structure of a firm is basically the way a firm finances its assets through some
combination of debt and equity that a firm deems as appropriate to enhance its operations
(Stewart, 2011).

2
1.1.1 Capital Structure
The term capital structure represents the proportionate relationship between the different forms
of long term financing (Varaiya, Kerin and Weeks, 2007). It refers to the way a corporation
finances its assets through some combination of equity, debt, or hybrid securities. A firm’s
capital structure is then the composition or ‘structure’ of its liabilities. For example, a firm that
sells $20 billion in equity and $80 billion in debt is said to be 20% equity-financed and 80%
debt- financed (Holmes, 2003). The firm’s ratio of debt to total financing, 80% in this example
is referred to as the firm’s on leverage. Gearing ratio is the proportion of the capital employed
of the firm which come from outside of the business finance, e.g. by taking a short term loan.
Funds used for firms operations may be generated internally or externally. When raising funds
externally, firms choose between equity and debt. Most of the effort of financial decision
making process is centered on the determination of the optimal capital structure of a firm.
Kochhar (2006) defines capital structure as a mixture of financial liabilities (debt and equity)
that is used to finance the operations of a firm. Different theories have been proposed to explain
the optimal mix of debt and equity. The theories suggest that firms select their capital structure
depending on attributes that determine the various costs and benefits associated with debt and
equity financing. Explanations vary from the irrelevancy hypothesis to the optimal capital
structure where the cost of capital is minimized and the value of the firm maximized
(Narayanan, 2008).
1.1.2 Financial Performance
Financial measures are regarded as “lag” indicators of performance whereas Intellectual capital
measures (like non-financial measures) are regarded as “lead” indicators since they are mainly
intended to generate future earnings power. While all future earnings are uncertain, it is greater
for intellectual capital than for tangible assets. Hamilton (2010) asserts that fund managers in
forecasting the valuation of firms use financial information. Traditionally, firms relied on their
tangible assets to drive their performance and firm-level strategy. The performance of business
organizations is affected by their strategies and operations in market and non-market
environments. Sizable, long-term investments in tangible and intangible assets have long term
consequences. An investment today will determine the firm’s strategic position many years.
They further state that these investments also have a considerable impact on the organization’s
future cash flows and the risk associated with those cash flows. A business' cost of capital

3
provides both a benchmark to evaluate its performance and a discount rate for evaluating
capital investments (Klammer, 2011). Inadequate evaluation and decision tools risk the
possibility of applying scarce resources to areas, which promote a return less than the cost of
capital.
The limitations on financial statements in explaining firm value underline the fact that the
source of economic value is no longer the production of material goods, but the creation of
intellectual capital. Intellectual capital includes human capital and structural capital wrapped
up in customers, processes, databases, brands, and systems (Modigliani and Miller, 2003), and
has been playing an increasingly important role in creating corporate sustainable competitive
advantages. The use of financial ratios for business analysis is common, and hence, almost
cliché. Ratio analysis techniques can be considered a business analysis paradigm as an
established point of view (Kennerley, 2002). Considering these facts, encouraging industry
operators to apply the techniques of ratio analysis to assess their performance requires a simple
framework that compresses a large amount of data into a small set of performance indicators.
These performance indicators must include intangible, non-financial elements that are often
critically important to operators.
The firm’s debt ratio is the proportion of the firm’s debt in relation to the total equity finance
in the company’s capital structure (Michael, 1992). This key ratio is famously known as an
indicator of the company’s long term solvency position and 8 also indicator of the financial
risk position of the company. It’s obtained by dividing the total company debt with the total
shareholders’ funds. Gross profit is the difference between revenue and cost of goods sold.
Gross Margin is the ratio of gross profit to revenue. Depends on situation or decision analysed
both or one of these two performance indicators can be more suitable. For merchandising
decisions in company with large assortment of products gross profit expressed in money terms
needs to be used when measuring financial result on the level of all product assortments or on
the level of big product group (Block and McMillan, 2005). This allows seeing what the overall
financial result without digging into details is.
Gross profits are the cleanest accounting measure of true economic profitability. The farther
down the income statement one goes, the more polluted profitability measures become, and the
less related they are to true economic profitability (Pandey, 2005). For example, a firm that has
both lower production costs and higher sales than its competitors is unambiguously more
profitable. Even so, it can easily have lower earnings than its competitors. The Return on Assets

4
ratio (ROA), also called return on investment, is an important profitability ratio because it
measures the efficiency with which the company is managing its investment in assets and using
them to generate profit. It measures the amount of profit earned relative to the firm's level of
investment in total assets. The return on assets ratio is related to the asset management category
of financial ratios. The calculation for the return on assets ratio is: Net Income/Total Assets. In
MIX definition the return on asset ratio is: (Net Operating Income – Taxes) / Average Assets.
The higher the percentage, the better, as a high percentage means that the company is
succeeding in using its assets to generate sales (Pandey, 2006).
1.1.3 Relationship between Capital Structure and Financial Performance
Hutchinson (1995) in his scholarly works argued that, financial leverage had a positive effect
on the firm’s return on equity provided that earnings’ power of the firm’s assets exceeds the
average interest cost of debt to the firm. Tong and Ning (2004) also found significantly positive
relationship between debt ratio and measures of profitability. Donaldson (2005) also identified
positive association between debt and profitability but for industries. In their study of leveraged
buyouts, Brigham and Houston (2005) established a significantly positive relation between
profitability and total debt as a percentage of the total buyout-financing package.
The capital structure theory is premised on the idea that the interests of the company’s
managers and its shareholders are not perfectly aligned. According to Majumdar (2009)
emphasis is placed on the importance of the agency costs of equity in corporate finance arising
from the separation of ownership and control of firms whereby managers tend to maximize
their own utility rather than the value of the firm. Agency costs can also exist from conflicts
between debt and equity investors. These conflicts arise when there is a risk of default. The
risk of default may create what Short (2002) referred to as an “underinvestment” or “debt
overhang” problem. In this case, debt will have a negative effect on the value of the firm.
Alternatively, there may be instances where managers have incentives to take excessive risks
as part of risk shifting investment strategies. This leads us to Zeckhauser and Pound (1990)
free cash flow theory where as stated by Kester (2006) the problem is how to motivate
managers to disgorge the cash rather than investing it below the cost of capital or wasting it on
organizational inefficiencies. Thus a higher level of leverage may be used as a disciplinary
device to reduce managerial cash flow waste through the threat of liquidation or through
pressure to generate cash flows to service debt (Short et al., 2002). In these situations, debt will
have a positive effect on the value of the firm.

5
John and Williams (2005) develops a model in which debt financing is shown to mitigate
overinvestment problems but aggravate the underinvestment problem. This model predicts that
debt can have both a positive and a negative effect on firm performance and presumably both
effects are present in all firms. According to McConnell and Servaes (1995) the common
element in the models of Myers, Jensen and Stulz is their focus on the link between the firm’s
investment opportunity set and the effects of debt on the value of the firm. Thus a reasonable
conjecture will be that for firms with few growth opportunities the positive effect of debt on
firm performance will be more dominant whereas the opposite effect will apply for firms with
high growth opportunities (Stewart, 2011).But firm performance may also affect the capital
structure choice. This reverse causality effect is in essence a feature of theories linking agency
costs, corporate control issues, and in particular, asymmetric information and taxation with the
value of the firm.
1.1.4 Investment Firms Listed at Nairobi Securities Exchange
The Nairobi Securities Exchange formerly Nairobi Stock Exchange was constituted as a
voluntary association of stock brokers under the society act. In 1990, a trading floor and
secretariat was setup at the IPS building, before moving to the Nation Centre Nairobi in 1994
(Gachoka, 2005). Over the past decade, the securities exchange has witnessed numerous
changes, automating its trading in September2006 and in 2007 making it possible for
stockbrokers to trade remotely from their offices, doing away with the need for dealers to be
physically present on the trading floor. Trading hours were also increased from two to six.
Moving to Westlands in the environs of Nairobi symbolically marked the end of an era where
the market was owned and run by stockbrokers (Ruto and Rueben, 2010).
Nairobi Securities Exchange aims at supporting trading clearing settlement of equities debt
derivatives and other associated instruments (Owolabi and Inyang, 2013). It is mandated to list
companies on the securities exchange and enables investor’s to trade in securities of companies
thus its charged with the health of Securities Exchange. It’s regulated by Capital Markets
Authority.
Over the years the investment companies have continued to play a critical role in Kenya’s
economic growth. Investment stocks are projected to continue lag in performance at the NSE
with most investors expected to continue going after liquid counters, whose business is not
affected by uncontrollable factors like the weather. External factors such as the fluctuation of

6
the local currency, economic downturns in export markets, and high costs of inputs affect the
profits of investment firms and by extension the dividends they pay out (Gachoka, 2005).
In Kenya, the establishment and licensing of Investment Companies is done by the Capital
Markets Authority (CMA). These firms are registered as Collective Investment Schemes (CIS)
each mandated to operate investment based on the license granted. Kenya represents over 50%
of the economic power of the East African countries, with the most active securities exchange,
Nairobi Securities Exchange (Ruto and Rueben, 2010). Even with the growth in the number of
investment firms, the uptake of these investment opportunities has been wanting. The volume
of funds channelled to funds in comparison to other securities, questions the knowledge of the
operations of funds, investor confidence and knowledge of the different investment vehicles
available. The listed collective schemes are managed by investment companies. In Kenya there
are three investment companies listed in the Nairobi Securities Exchange. This indicates that
such investments are professionally managed and the returns derived should mimic the market
trends. The Investment companies listed at are Centum Investment, Olympia Capital Holdings
and Trans Century Ltd.
The three investment firms are considered among the largest listed Investment Companies in
the East African region and together with their subsidiaries are engaged in the business of
investment across private equity, construction industry and infrastructure and quoted private
equity asset classes. The Nairobi Securities Exchange has also enabled the investment
companies to engage local participation in their equity, thereby giving Kenyans a chance to
own shares. Companies can also raise extra finance essential for expansion and development.
To raise funds, a new issuer publishes a prospectus, which gives all pertinent particulars about
the operations and future prospects and states the price of the issue. NSE also enhances the
inflow of international capital. They can also be useful tools for privatization programmes. It
is generally accepted that investment firms declaring stock distributions of 25 per cent or
greater consider them as stock splits which, therefore, have no effect on retained earnings.
Stock distributions of less than 25 per cent are considered as stock dividends that reduce the
retained earnings account (Owolabi and Inyang, 2013).
1.2 Research Problem
Financial managers find it difficult to exactly determine the optimal capital structure (Noreen,
2013). A firm has to issue various securities in a countless mixture to come across particular

7
combinations that can maximise its overall value which means optimal capital structure. If a
wrong mix of finance is employed; the performance and survival of the business enterprise
may be seriously affected. Survival and growth needs resources but financing of these
resources has limitation. The investment sector is expected to play a key role in the growth and
in an attempt to achieve the government’s vision 2030. Investment has remained important to
the Kenya’s economic growth, accounting for 27% of real GDP, 40% of the total earnings and
45% of government revenue. Some 45% of Kenyans are employed in the investment sector
(Kitaka, 2013). When institutional investors are making investment decisions, they tend to
evaluate various stocks and securities which they perceive will optimize their returns.
Capital structure is one of the main determinants of firm performance. The tax benefit of debt
financing lead firms to borrow excessively. In doing so firms very often ignore the bankruptcy
costs stemming from declining returns to excessive debt. Therefore, when profit maximizing
firms diverge from an appropriate capital structure their bankruptcy or financing costs
outweigh the tax benefits related with the trade-off between debt and equity. Zeitun and Tian
(2007) finds that capital structure has a significant and negative impact on firm’s performance
and underestimation of bankruptcy costs may lead firms to borrow excessively and carry high
debt in their capital structure. However, others find mixed results regarding the impact of
capital structure on firm’s performance (Abor, 2007).
The government and the private sector have invested heavily in creating an enabling
environment for doing business in Kenya and, indeed, some companies have performed
exceedingly well as a result this companies include Equity Bank and Safaricom limited. Several
companies, however, are experiencing declining performance and some have even been
delisted from the NSE in the last decade CMC motors and Access Kenya. Momentous efforts
to revive the ailing and liquidating companies have focused on financial restructuring. However
managers and practitioners still lack adequate guidance for attaining optimal financing
decisions (Hall et al., 2008) yet many of the problems experienced by the companies put under
statutory management were largely attributed to financing (Michaelas, Chittenden and
Poutziouris, 2009). This situation has led to loss of investors’ wealth and confidence in the
stock market. Studies on the relationship between various financing decisions and performance
have produced mixed results. It is against this background that this study was carried out.
Locally, many researchers have reviewed various aspects of capital structure in the Kenyan
context Gachoki (2005) reviewed the capital structure choice in the empirical testing of the

8
pecking order theory among firms quoted on the NSE, Wandeto (2005) carried out an empirical
investigation of the relationship between dividend changes and earnings, cash flows and capital
structure for the firms listed in the NSE, while Nyaboga (2008) researched on the relationship
between capital structure and agency cost. This study attempts to answer; is there a relationship
between capital structure and financial performance of investment firms listed at the Nairobi
Securities Exchange?
1.3 Objective of the Study
To investigate the relationship between capital structure and financial performance of
investment firms listed at the Nairobi Securities Exchange.
1.4 Value of the Study
The findings of this study will benefit Investors in the listed investment firms, shareholders of
the listed investment firms, academicians and financial researchers and the management of
investment firms.
The more the knowledge about a phenomena one has the better equipped they are to face the
challenges of the future. Effects of capital structure, how it is affected by a firms return and
how a change on it can affect the firm’s value will be a welcome weapon to facing the
challenges of better management, capital appreciation and shareholder wealth maximization.
Current and prospective investors in these firms will be able to understand better the capital
structure of the firms they have invested in or seek to invest in and its impact on the firm’s
financial performance, how its change impacts on the firm’s value and if the firms return can
cause it to change its capital structure and what the consequences of such a choice would be.
This will further inform their investment decisions lowering the risks of investing blindly. The
researcher hopes that the findings from the study shall be useful to the business community
since it will throw more light on the role that capital structure has in determining financial
performance.
Shareholders will understand more about the capital structure, firm’s value and firm’s returns
and how they are related and in turn affect each other. This will help them in making informed
decisions at the Annual General Meetings while being faced with issues of capital structure
changes and firms value determination.

9
Capital structure is a wide study where a lot of research had been done. Yet, there is no
empirical evidence that it has been exhaustively covered and that all options that relate to it
have been researched and reviewed. Thus, additional information based on concrete evidence
will be a welcome additive to the existing scope of knowledge.

10
CHAPTER TWO
LITERATURE REVIEW
2.1 Introduction
This chapter presents the literature review on the relationship between capital structure and
financial performance. It summarized the information from other researchers who have studied
the field. The review covered both the theoretical and empirical reviews of the existing
literature. The theoretical review helps in understanding of the current body of knowledge on
the research topic while the empirical review helped in understanding what other related studies
found and suggested. The reviews were used to develop a conceptual frame work.
2.2 Theoretical Review
This study was underpinned on three theories that are relevant to capital structure and financial
performance. These theories were Modigliani Miller Theory, Trade off Theory and Pecking
Order Theory and are described below;
2.2.1 Modigliani Miller Capital Structure Theory
Modigilliani and Miller (1963) theorem is considered the greatest breakthrough in theory of
optimal capital structure. The theorem specifies the financial decisions by firms that are
irrelevant to the firm’s value. Its prepositions include; the value of a firm is the same regardless
of whether it finances itself with debt or equity. The weighted average cost of capital is
constant. The assumptions of Modigliani- Miller theorem are; Perfect and frictionless markets,
no transaction costs, no default risk, no taxation, both firms and investors can borrow at the
same interest rate; there is homogeneous expectation homogeneous risk and equal access to all
of relevant information.
The rate of return on equity grows linearly with the debt ratio implying that the higher the debt
equity ratio the higher the expected return on equity. The distribution of dividends does not
change the firm’s market value it only changes the mix of Equity and Debt in the financing of
the firm. In order to decide an investment, a firm should expect a rate of return at least equal to
cost of capital no matter where the finance would come from (Mahrt, 2005). Hence the
marginal cost of capital should be equal to the average cost of capital. The constant cost of
capital is sometimes called the “hurdle rate” (the rate required for capital investment). In

11
summary the theory states that the value of a firm is invariant with respect to its leverage policy
in an arbitrage-free market when there is no corporate income tax and no bankruptcy cost:
whether firm is financed through debt or equity, its value remains the same (Wald, 1999).
2.2.2 Trade off Theory
According to Elliott (1972), the firm is viewed as setting a target debt-equity ratio and gradually
moving towards it. The firms seek debt levels that balance the tax advantages of additional debt
against the costs of possible financial distress. In particular, capital structure moves towards
targets that reflect tax rates, assets type, business risk, profitability and bankruptcy costs. The
firm is balancing the costs and benefits of borrowings, holding its assets and investment plans
constant (Adedeji, 1995). The firm’s optimal capital structure will involve the trade-off
between the tax advantage of debt and various leverage-related costs. Due to the distinctions
in firm-specific characteristics, target leverage ratios will vary from firm to firm. Institutional
differences, such as different financial systems, tax rate and bankruptcy law etc., will also lead
the target ratio to differ across countries.
The theory predicts that firms with more tangible assets and more taxable income to shield
should have high debt ratios (Elliott, 1972). Firms with more intangible assets, whose value
will disappear in case of liquidation, should rely more on equity financing. In terms of
profitability, trade-off theory predicts that more profitable firms should mean more debt-
serving capacity and more taxable income to shield, thus a higher debt ratio will be anticipated.
Under trade-off theory, the firms with high growth opportunities should borrow less because
they are more likely to lose value in financial distress.
2.2.3 Pecking Order Theory
Pecking order theory of capital structure by Myers (1984) states that, firms have a preferred
hierarchy for financing decisions. Firms will borrow instead of issuing equity when internal
cash flow is not sufficient to fund capital expenditure. The highest preference is to use internal
financing before resorting to any form of external funds. Internal funds incur no floatation costs
and require no additional disclosure of financial information that may lead to a possible loss of
competitive advantage. If a firm must use external funds, the preference is to follow a certain
order of financing sources: debt, convertible securities, preferred stock, and common stock,
(Miller, 1977). This order reflects the motivations of the financial manager to retain control of
the firm, reduce the agency costs of equity, and avoid negative market reaction to an

12
announcement of a new equity issue. The amount of debt will reflect the firms’ cumulative
need for external funds. The theory has two key assumptions about financial managers. The
first of these is the likelihood that a firm’s managers know more about the company’s current
earnings and future growth opportunities than outside investors. There is a strong desire to keep
such information proprietary. The use of internal funds prevents managers from having to make
public disclosures about the company’s investment opportunities and potential profits to be
realized from investing in them.
The second assumption is that managers will act in the best interests of the company’s existing
shareholders. The managers may even forgo a positive-NPV project if it would require the
issue of new equity, since this would give much of the project’s value to new shareholders at
the expense of the old, (Fischer, Heinkel and Zechner, 2009). However the theory has some
limitations since it does not explain the influence of taxes, financial distress, security issuance
costs, agency costs, or the set of investment opportunities available to a firm upon that firm’s
actual capital structure. It ignores the problems that can arise when a firm’s managers
accumulate so much financial slack that they become immune to market discipline. As such
the theory is offered as a complement to, rather than a substitution for, the traditional trade-off
model.
2.3 Determinants of Financial Performance
This section presents the financial performance determinants which includes; capital structure,
leverage, profitability, risk management, growth options, firm size, financial constraints and
their relationship is discussed below;
2.3.1 Capital Structure
Bhaduri (2002) suggests that if a firm can credibly signal its quality to outsiders, it can avoid
an information premium and so may gain access to external sources of funds, mainly the equity
market. John and Williams (2005) argue that a firm with a reputation for paying a constant
stream of dividends face less asymmetric information when entering the equity market. Thus,
if dividend payments represent a signal of sound financial health and hence of higher debt-
issuing capacity, one would expect a positive relationship between dividend payments and
leverage. In addition, firms with a reputation for paying a stream of dividends will be monitored
by the capital market (Short et al., 2002).

13
Institutional ownership may act as alternative monitoring device, and so this will reduce the
need for capital markets as external monitoring system (Zeckhauser and Pound, 1990). Thus,
according to Modigliani Miller theory, there is a positive relationship between dividend
payments and institutional ownership. However, the existence of institutional ownership
mitigates the need for dividends to signal good performance (Short, 2002). Therefore, Trade
off theory suggests a trade-off between dividends and institutional ownership, i.e. a negative
relationship. According to the pecking order theory in the presence of asymmetric information,
a firm would prefer internal finance over other sources of funds, but would issue debt if internal
finance was exhausted. The least attractive alternative for the firm would be to issue new
equity. Profitable firms are likely to have more retained earnings. Thus, a negative relationship
is expected between leverage and past profitability (Donaldson, 2005).
Institutional investors prefer to invest in profitable firms. This is because the more profitable
the firm is, the lower the likelihood of default and of having to face financial difficulties and
bankruptcy. Therefore, a positive relationship is expected between profitability and
institutional ownership. However, Tong and Ning (2004) find that there is limited evidence
that institutional investors prefer to invest in profitable firms. They find that profitability
(measured as the return on equity) is negatively related to average shares held by institutional
investors. The return on equity is used as an index for firm profitability in this study (return on
equity ratio (ROE).
Business risk is considered to be one of the key factors that can affect the capital structure of
the firm. Bhaduri (2002) states that: Since debt involves a commitment of periodic payment,
highly leveraged firms are prone to financial distress costs. Therefore, firms with volatile
incomes are likely to be less leveraged (Bhaduri, 2002). Thus, according to the Trade-off
theory, there is a negative relationship between business risk and capital structure. Institutional
investors tend to invest in firms with low business risks because firms with high volatility in
their returns are likely to have a high probability to default and to become bankrupt. Therefore,
a negative relationship is expected between firm’s business risk and the firm’s institutional
ownership.
According to the pecking order theory, the shareholders of a leveraged firm have an incentive
to invest sub-optimally (Titman and Wessels, 2008). However, the more tangible the firm’s
assets are, the more such assets can be used as collateral. Collateralized assets can restrict such
opportunistic behaviour. Therefore, a positive relationship between tangible assets and debt is

14
expected. In addition, Modigliani Miller theory suggests that the optimal capital and ownership
structures may be used to minimize agency costs (Jensen, 2006). Thus, a negative relationship
between asset tangibility and ownership structure is expected. This is because tangible assets
can act as collateral for higher levels of debt. Therefore, institutional investors prefer to invest
in firms with low tangible assets. The current study uses the fixed assets to total assets ratio as
indicator of firms’ tangibility (TANG).
Liquidity ratios have both a positive and a negative effect on the capital structure decision, and
so the net effect is unknown (Long and Malitz, 2005). First, firms with high liquidity ratios
may have relatively higher debt ratios due to their greater ability to meet short-term obligations.
This argument suggests a positive relationship between a firm’s liquidity and its debt ratio.
Alternatively, firms with more liquid assets may use such assets as sources of finance to fund
future investment opportunities. Thus, a firm’s liquidity position would have a negative impact
on its leverage ratio.
2.3.2 Leverage
Higher financial leverage, generally associated with high asset base, means lower average cost
of capital and hence higher performance (Kiogora, 2000). As such businesses can command a
respectable price if a cash flow lender can be found, or if the Seller is willing to finance the
transaction. Business with low financial leverage (generally associated with a low asset base,
or an asset base with low borrowing capacity, or a tight lending market) will command a lower
price due to lack of low cost borrowing. If there is a tax shield with relation to the payment of
interest, or the debt soothes the dispute between shareholders manager and creditor, the impact
is positive. If an increase in the leverage presents an increase in the likelihood of incurring
payment of bankruptcy costs, the impact is negative (Omondi, 1995).
According to free cash flow hypothesis, debt decreases the amount of cash available to
managers, hence reducing their possibilities for wasting corporate resources (Myers, 1998). In
such way leverage serves as a commitment and incentive mechanism it induces managers to
pay out cash to firm’s investors and basically minimizes agency costs of external equity
(consumption of perquisites, shirking from duties and undertaking negative NPV projects).
Eventually, issuing debt instead of equity lowers agency costs and therefore increases firm
performance (Mahrt, 2005).

15
2.3.3 Profitability
According to pecking order theory, more profitable companies are likely to have low debt
levels because they generate cash internally. Consequently, the relationship between debt and
profitability will be negative as concluded by (Tufano, 2005). Profitability is the primary goal
of all business ventures. Without profitability the business will not survive in the long run.
Profitability results from the excess of income over expenses. A firm that is highly profitable
has the ability to reward its owners with a large return on their investment. The firms therefore
trade at a premium and are likely to generate a higher valuation (Hovakimian et al., 2004).
Financial leverage has a positive effect on the firm's profitability. Omondi (1995) found a
positive relationship between capital structure and profitability of the firm. In addition,
Hamilton (2010) found a positive relationship between profitability and total debt. Klammer
(2011) describes that the use of leverage is one way to improve the performance of the firm.
Kennerley (2002) argue that companies prefer debt financing because they anticipate higher
returns.
2.3.4 Risk Management
Risk management entails assessing and managing the corporation’s exposure to various
sources of risk through the use of financial derivatives, insurance and other activities. Business
risks can impact a company’s cash flows as well as its general health (Tong and Ning, 2004).
In the event of corporations successfully managing its foreign exchange risks the benefits
received from such effective execution will have a long-term positive impact in creating value
for the corporations’ shareholders.
Management of foreign exchange risk increases shareholders value through enhanced business
performance and the reduction of the firms’ cost of capital. Since market value is conditioned
by the company results, the level of risk exposure can cause changes in its market value
(Bhaduri, 2002).
2.3.5 Growth Options
Rajan (2008) argued that future investment affect firm performance. A firm with higher growth
options will have a higher performance as it’s favourable to investors who have higher
prospects of recovering their investment. If a firm has lower growth options it is likely to be
erased by competitors leading to eventual collapse hence lower performance.

16
Growth opportunities may be considered assets that add value to a firm, but cannot be
collateralized and are not subject to taxable income. The agency problem suggests a negative
relationship between capital structure and a firm's growth. Hutchinson (1995) argued that high-
growth firms might have more options for future investment than low-growth firms. Thus,
highly leveraged firms are more likely to pass up profitable investment opportunities, because
such an investment will effectively transfer wealth from the firm's owners to its debt holders.
As a result, firms with high growth opportunities may not issue debt in the first place, and
leverage is expected to be negatively related to growth opportunities.
2.3.6 Firm Size
Although no clear definition of firm size can be found, it can be measured by the size of
corporate book value or the amount of revenue. It is believed there is a high correlation between
firm size and cash flow which is the foundation for calculating market capitalization
(Majumdar, 2009). The size of a company can have a positive effect on financial performance
because larger firms can use that advantage to get some financial benefits in business relations.
Large organizations can obtain cheap funding hence a lower rate of capital. This generates a
higher market capitalization rate. Kester (2006) observed that ERM usage is positively related
to firm size. The larger the organization, the more complex its operations will probably be and
the more its exposure to threatening events.
2.3.7 Financial Constraints
Firms facing financial constraints are unlikely to meet their investment obligations. The firm
may be paying out more than it is receiving and more likely to go bankrupt (Stewart, 2011).
This implies that in the long run the chances of survival of the company are low and this would
yield a lower valuation. On the contrary firms with adequate cash flow are likely to meet their
financial obligations on time and hence improved performance.
Noreen (2013) indicates that because small sized firms bear high costs of new equity and long
term debt issuance, they may prefer to rely on short term debt and more leverage than larger
sized firms. Owolabi and Inyang (2013) argue that larger firms tend to disclose more
information to outsiders, operate under less asymmetric information and may tend to use more
equity than debt. Overall, these arguments suggest a negative relationship between leverage
and firm size.

17
2.4 Empirical Review
This section reviews the study variable as studied by other scholars in other parts of world. The
findings helped to compare their findings and the current study findings. The section presents
contains both the international evidence and the local evidence.
2.4.1 International Evidence
Empirical supports for the relationship between capital structure and firm performance from
the agency perspective are many and in support of negative relationship. Majumdar and
Chhibber (1999) also confirm negative relationship between financial leverage and
performance. Their results further suggest that liquidity, age and capital intensity have
significant influences on financial performance. Many determinants of the corporate capital
structure were nominated and empirically examined in the US.
Maksimovic (2001) discuss role of managerial self-interest in making capital structure
decisions. They find that there exist negative relationship between leverage ratio and
management’s shareholding. This indicates that in the absence of any outsider principal
stockholder the tendency of low debt to equity ratio will continue which will lead to higher non
diversifiable risk of debt to management.
Long and Maltiz (2005) observed that the financial leverage of firms is positively related to a
firm’s profitability. Given that a firm must seek an outside source of funds, its choice between
debt and equity will depend in part on the magnitude of potential agency costs of debt.
Titman and Wessels (2008), analyses the explanatory power of some of the recent theories of
optimal capital structure and extended empirical work on capital structure theory. It examines
a much broader set of capital structure theories, implications in regard to different types of debt
instruments, the authors analyse measures of short-term, long-term, and convertible debt rather
than an aggregate measure of total debt and uses a factor-analytic technique that mitigates the
measurement problems encountered when working with proxy variables. The results also
indicate that transaction costs may be an important determinant of capital structure choice.
Short-term debt ratios were shown to be negatively related to firm size, possibly reflecting the
relatively high transaction costs small firms face when issuing long-term financial instruments.
Since transaction costs are generally assumed to be small relative to other determinants of
capital structure, their importance in this study suggests that the various leverage-related costs

18
and benefits may not be particularly significant. In this sense, although the results suggest that
capital structures are chosen systematically, they are in line with Miller's argument that the
costs and benefits associated with this decision are small. Additional evidence relating to the
importance of transaction costs is provided by the negative relation between measures of past
profitability and current debt levels scaled by the market value of equity.
Uwalomwa and Uadiale (2012) did a study to basically investigate the relationship between
capital structure and the financial performance of listed firms in Nigeria. The study considered
a total sample of 31 listed firms on the floor of the Nigerian stock exchange. The annual reports
for the period 2005-2009 were analysed using the Ordinary Least Squares (OLS) technique of
model estimation to test the research propositions stated in this study. The study observed that
two of the explanatory variables in the study (i.e. short-term debt and shareholders’ funds) have
a significant positive impact on the financial performance of listed firms in Nigeria. In addition,
the study observed that long-term debt has a significant negative impact on the financial
performance of firms. The study concludes that employing high proportion of long-term debt
in firms’ capital structure will invariably result in a low financial performance of a firm.
2.4.2 Local Evidence
Gachoki (2005) reviewed the capital structure choice in the empirical testing of the pecking
order theory among firms quoted on the NSE, The study used shy am-sunder and Myers (1999)
POT model, to test whether firms listed on NSE follow the pecking order theory of capital
structure in their financing choices. The POT model predicts external debt financing driven by
the internal financing deficit. The study used 31 firms listed on NSE for the period between
1998 and 2003. He concluded that NSE firms do not follow the pecking theory of capital
structure in their financing choices. There is therefore, a need to test other theories explaining
financing choices in an attempt to determine the one applicable to NSE firms.
Wandeto (2005) carried out an empirical investigation of the relationship between dividend
changes and earnings, cash flows and capital structure for the firms listed in the NSE, The study
was carried out with the aim of examining the presence and strength of the relationship between
dividends changes with variables such as earnings, cash flows and capital structure (leverage)
among firms listed in the Nairobi Stock Exchange (NSE). A sample of 43 Firms was used to
bring out the relationship between dividends and certain variables namely earnings cash flows
and capital structure or leverage. A regression of dividends against the three variables indicates
19
that earnings were the most important variable among the studied variables. The conclusion
was that dividend change is most sensitive to Earnings, then cash flows from operating from
operating activities and finally to debt in that order. Those firms with high debt to equity ratios
pay low amounts of dividends.
Okoth and Gemechu (2013) showed that capital adequacy, asset quality and management
efficiency significantly affect the performance of commercial banks in Kenya. However, the
effect of liquidity on the performance of commercial banks is not strong. The relationship
between bank performance and capital adequacy and management efficiency was found to be
positive and for asset quality the relationship was negative. The study used linear multiple
regression model and Generalized Least Square on panel data to estimate the parameters. The
findings showed that bank specific factors significantly affect the performance of commercial
banks in Kenya, except for liquidity variable. Thus, it can was concluded that the financial
performance of commercial banks in Kenya is driven mainly by board and management
decisions, while macroeconomic factors have insignificant contribution.
Maniagi et.al, (2013) in the study of the relationship between a firms capital structure and
performance among a sample of 30 companies listed on NSE whose data for 5yrs period 2007-
2011: concluded that firms listed on NSE have adopted pecking order hypothesis due to
undeveloped debt market and the restrictive covenants associated with long term debt, this
makes long term debts expensive hence making firms borrow less. Most firms prefer to finance
their activities by using short term debt. From the results the total assets was positively
correlated to capital structure proxies which was significant. This indicates that long term debts
was utilized by large firms that had large assets which could be used to act as collateral for
securing the loans.
2.5 Summary of Literature Review
The studied theories predict different relations between the corporate profitability and its
capital structure. The trade-off theory suggests that taxation and deadweight bankruptcy costs
are important for the capital structure. The pecking order theory developed by Myers (1984)
suggests that the financing order of firms, such as retained earnings, debt, and then equity, are
important for the corporate capital structure. Further, the recent notion of the market timing
hypothesis suggests that the timing of corporate financing based on the capital market
conditions is the key for the capital structure. Also, Modigliani Miller theory suggests that the

20
free cash flow problems and being disciplined by debts are important for the corporate capital
structure.
This chapter clearly reviewed the relevant literature in relation to the research question
presented in this study. It revealed that there exists a positive relation between a firm’s capital
structure and its financial performance. However the firm’s profitability may not have a direct
impact to change the capital structure due largely to information asymmetry and the agency
conflicts. On the other hand, it has shown that the capital structure can help in upping or
bringing down the firm value due to the kind of leverage the firm holds and where it sources
its finances. In Kenya, few empirical studies have been done to establish the relationship
between capital structure and financial performance. This study therefore came in to fill the
void by establishing whether there was a relationship between capital structure and financial
performance among investment firms listed at the Nairobi securities exchange.

21
CHAPTER THREE
RESEARCH METHODOLOGY
3.1 Introduction
This chapter sets out various stages and phases that were followed in completing the study. It
involves a blueprint used for the collection, measurement and analysis of data. The research
identified the procedures and techniques that were used in the collection, processing and
analysis of data. Specifically the following subsections of research methodology were
included; research design, target population, sample, data collection instruments and
procedures and finally data analysis.
3.2 Research Design
A descriptive survey research design was employed in this study. Descriptive research is the
investigation in which quantitative data is collected and analysed in order to describe the
specific phenomenon in its current trends, current events and linkages between different factors
at the current time. Descriptive research design has been chosen because it will enable the
researcher to generalize the findings to a larger population. Kyereboah -Coleman (2007) and
Bogan (2008) used similar designs successfully in their studies on performance of firms listed
in the stock exchange in Ghana and across six continents respectively.
3.3 Target Population
The target population of the study comprised of the three investment companies which were
listed under the investment sector of the market segment of the Nairobi Securities Exchange
(NSE) as at June 2014 (Appendix I). A census approach method was used in the study where
the three companies were selected without sampling.
3.4 Data Collection
The study utilised panel data which consist of time series and cross-sections. The data for all
the variables in the study were extracted from published reports and financial statements of the
listed investment companies in the NSE covering the years 2010 to 2013 where quarterly
reports were used. Earning data were obtained from the NSE hand books for the period of
reference. The Secondary Data which include size of the firm, total debt, long-term debt were

22
extracted from the income statement, statement of financial position, and notes to the accounts
using a document review guide.
3.5 Data Analysis
This study used Statistical Package for Social Science (SPSS Version 20.0) program. The study
being descriptive in nature, the quantitative method of data analysis and inferential analysis
were used as analysis techniques. The data collected was run through various models so as to
clearly bring out the effect of change in capital structure on firms financial performance.
3.5.1 Analytical Model
Panel data Methodology was used which involved pooling of observation on the firms over
several times periods. A general model for panel data that allowed the study to be estimated
using panel data with great flexibility and formulate the difference in the behaviour of the cross-
section elements was adopted. The relationship between debt and profitability performance
was estimated using the following regression model:
ROEit = β1+ β2LDAit +β3DAit +β4Sizeit +ei
ROEit is Earning (EBIT) divided by Equity for firm i in time t
LDAit is long-term debt divided by the market value capital of Equity for firm i
in time t
DAit is total debt divided by the market value capital of Equity for firm i in time t
Sizeit is natural logarithm of firms’ total assets
ei is the error term
Variable used for the analysis included profitability and leverage ratios. Performance used
accounting-based measure; profitability measures as the ration of earnings before interest and
taxes (EBIT) to Equity. The leverage ratios used included:
a) Long-term debt to total capital and
b) Total debt to total capital
Size was included as control variable.

23
3.5.2 Test of Significance
The model helped in determining if there was a relationship between capital structure and
financial performance of the investment firms. Collected data was subjected to the analysis
tools SPSS version 20.0.
The data was collected from the secondary sources and analysis done; the ANOVA test was
used to determine the impact independent variables have on the dependent variable in a
regression analysis. ANOVA provides a statistical test of whether or not the means of several
groups are equal. ANOVAs are useful in comparing (testing) three or more means (groups or
variables) for statistical significance.

24
CHAPTER FOUR
DATA ANALYSIS, RESULTS AND DISCUSSION
4.1 Introduction
This chapter presents the research findings to investigate the relationship between capital
structure and financial performance. The study was conducted on investment firms listed at the
NSE where secondary quarterly data from the period of 2010 to 2013 was used in the analysis.
Regression analysis was used in analysis the data.
4.2 Regression Analysis
4.2.1 Year 2010
Table 4.1: Model Summary for 2010
Model R R Square Adjusted R
Square
Std. Error of the
Estimate
1 .886a .785 .752 .632
Source: Research Findings
Adjusted R squared is coefficient of determination which tell us the variation in the dependent
variable due to changes in the independent variable, from the findings in the above table the
value of adjusted R squared was 0.752 an indication that there was variation of 75.2% on
financial performance of investment companies listed in the NSE due to changes in the
independent variables which are long-term debt, total debt and size at 95% confidence interval.
This shows that 75.2% of changes in financial performance of investment companies listed in
the NSE could be attributed to their long-term debt, total debt and size. R is the correlation
coefficient which shows the relationship between the study variables, from the findings shown
in the table above there was a strong positive relationship between the study variables as shown
by 0.886.
25
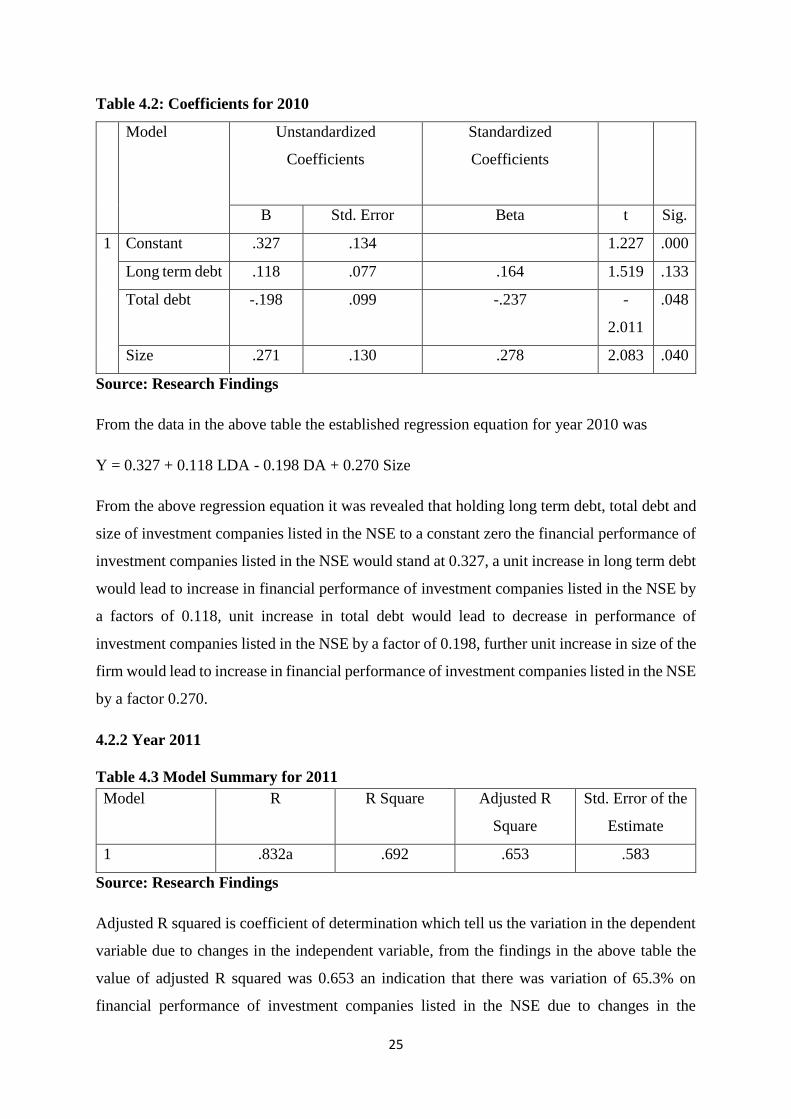
Table 4.2: Coefficients for 2010
Model Unstandardized
Coefficients
Standardized
Coefficients
B Std. Error Beta t Sig.
1 Constant .327 .134 1.227 .000
Long term debt .118 .077 .164 1.519 .133
Total debt -.198 .099 -.237 -
2.011
.048
Size .271 .130 .278 2.083 .040
Source: Research Findings
From the data in the above table the established regression equation for year 2010 was
Y = 0.327 + 0.118 LDA - 0.198 DA + 0.270 Size
From the above regression equation it was revealed that holding long term debt, total debt and
size of investment companies listed in the NSE to a constant zero the financial performance of
investment companies listed in the NSE would stand at 0.327, a unit increase in long term debt
would lead to increase in financial performance of investment companies listed in the NSE by
a factors of 0.118, unit increase in total debt would lead to decrease in performance of
investment companies listed in the NSE by a factor of 0.198, further unit increase in size of the
firm would lead to increase in financial performance of investment companies listed in the NSE
by a factor 0.270.
4.2.2 Year 2011
Table 4.3 Model Summary for 2011
Model R R Square Adjusted R
Square
Std. Error of the
Estimate
1 .832a .692 .653 .583
Source: Research Findings
Adjusted R squared is coefficient of determination which tell us the variation in the dependent
variable due to changes in the independent variable, from the findings in the above table the
value of adjusted R squared was 0.653 an indication that there was variation of 65.3% on
financial performance of investment companies listed in the NSE due to changes in the
26
independent variables which are long term debt, total debt and size at 95% CI. This shows that
65.3% of changes in financial performance of investment companies listed in the NSE could
be attributed to their long term debt, total debt and size. R is the correlation coefficient which
shows the relationship between the study variables, from the findings shown in the table above
there was a strong positive relationship between the study variables as shown by 0.832.
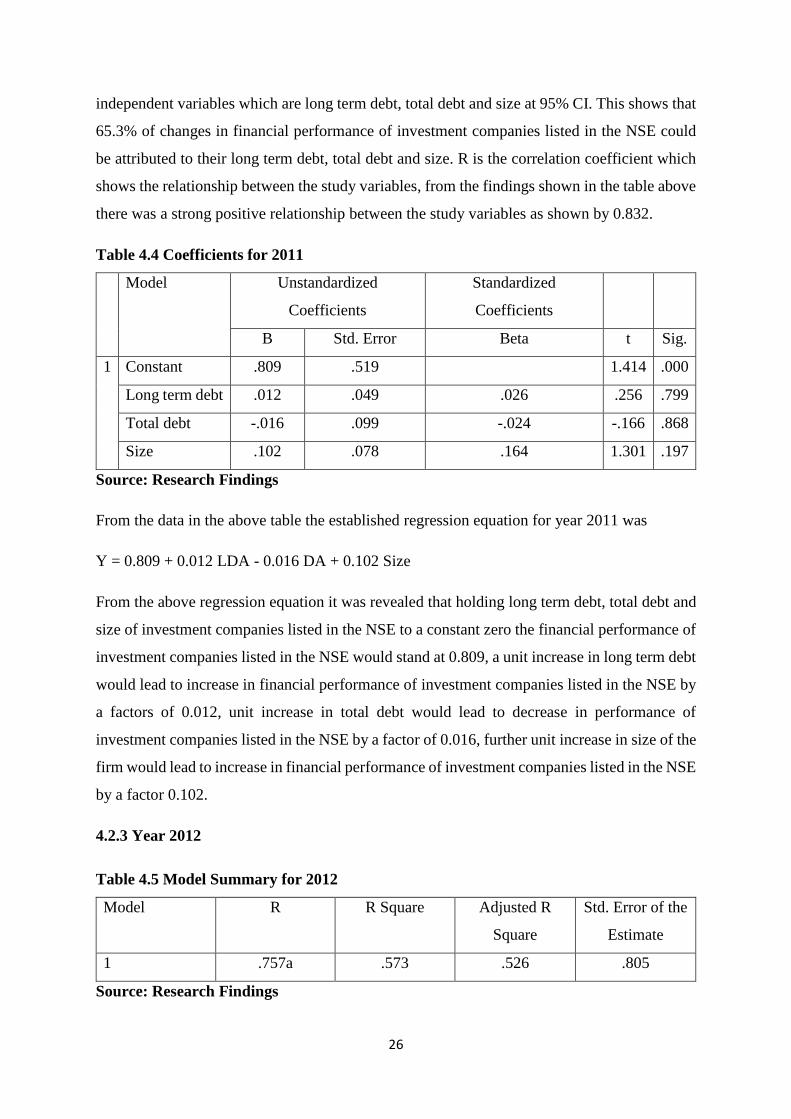
Table 4.4 Coefficients for 2011
Model Unstandardized
Coefficients
Standardized
Coefficients
B Std. Error Beta t Sig.
1 Constant .809 .519 1.414 .000
Long term debt .012 .049 .026 .256 .799
Total debt -.016 .099 -.024 -.166 .868
Size .102 .078 .164 1.301 .197
Source: Research Findings
From the data in the above table the established regression equation for year 2011 was
Y = 0.809 + 0.012 LDA - 0.016 DA + 0.102 Size
From the above regression equation it was revealed that holding long term debt, total debt and
size of investment companies listed in the NSE to a constant zero the financial performance of
investment companies listed in the NSE would stand at 0.809, a unit increase in long term debt
would lead to increase in financial performance of investment companies listed in the NSE by
a factors of 0.012, unit increase in total debt would lead to decrease in performance of
investment companies listed in the NSE by a factor of 0.016, further unit increase in size of the
firm would lead to increase in financial performance of investment companies listed in the NSE
by a factor 0.102.
4.2.3 Year 2012
Table 4.5 Model Summary for 2012
Model R R Square Adjusted R
Square
Std. Error of the
Estimate
1 .757a .573 .526 .805
Source: Research Findings
27
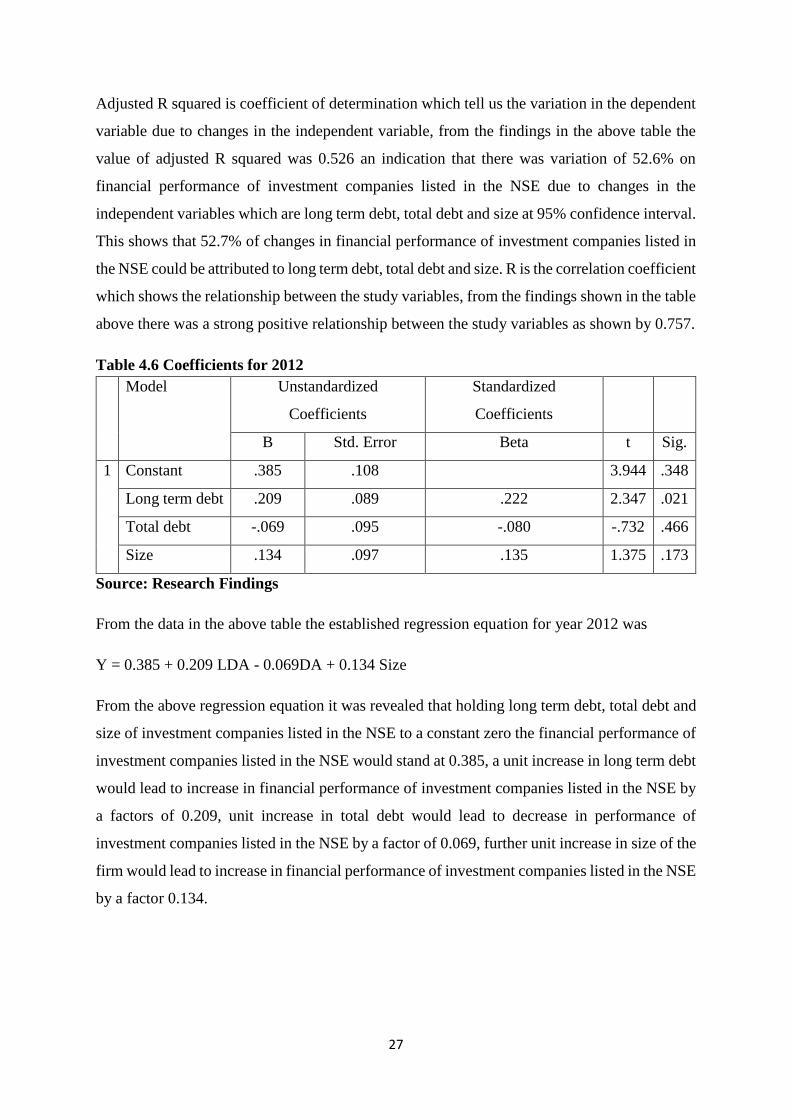
Adjusted R squared is coefficient of determination which tell us the variation in the dependent
variable due to changes in the independent variable, from the findings in the above table the
value of adjusted R squared was 0.526 an indication that there was variation of 52.6% on
financial performance of investment companies listed in the NSE due to changes in the
independent variables which are long term debt, total debt and size at 95% confidence interval.
This shows that 52.7% of changes in financial performance of investment companies listed in
the NSE could be attributed to long term debt, total debt and size. R is the correlation coefficient
which shows the relationship between the study variables, from the findings shown in the table
above there was a strong positive relationship between the study variables as shown by 0.757.
Table 4.6 Coefficients for 2012
Model Unstandardized
Coefficients
Standardized
Coefficients
B Std. Error Beta t Sig.
1 Constant .385 .108 3.944 .348
Long term debt .209 .089 .222 2.347 .021
Total debt -.069 .095 -.080 -.732 .466
Size .134 .097 .135 1.375 .173
Source: Research Findings
From the data in the above table the established regression equation for year 2012 was
Y = 0.385 + 0.209 LDA - 0.069DA + 0.134 Size
From the above regression equation it was revealed that holding long term debt, total debt and
size of investment companies listed in the NSE to a constant zero the financial performance of
investment companies listed in the NSE would stand at 0.385, a unit increase in long term debt
would lead to increase in financial performance of investment companies listed in the NSE by
a factors of 0.209, unit increase in total debt would lead to decrease in performance of
investment companies listed in the NSE by a factor of 0.069, further unit increase in size of the
firm would lead to increase in financial performance of investment companies listed in the NSE
by a factor 0.134.

28
4.2.4 Year 2013
Table 4.7 Model Summary for year 2013
Model R R Square Adjusted R
Square
Std. Error of the
Estimate
1 .925a .855 .815 .535
Source: Research Findings
Adjusted R squared is coefficient of determination which tell us the variation in the dependent
variable due to changes in the independent variable, from the findings in the above table the
value of adjusted R squared was 0.815 an indication that there was variation of 81.5% on
financial performance of investment companies listed in the NSE due to changes in the
independent variables which are long term debt, total debt and size at 95% confidence interval.
This shows that 81.5% of changes in financial performance of investment companies listed in
the NSE could be attributed to long term debt, total debt and size. R is the correlation coefficient
which shows the relationship between the study variables, from the findings shown in the table
above there was a strong positive relationship between the study variables as shown by 0.925.
Table 4.8 Coefficients for year 2013
Model Unstandardized
Coefficients
Standardized
Coefficients
B Std. Error Beta t Sig.
1 Constant .614 .394 2.098 .000
Long term debt .263 .067 .385 3.911 .000
Total debt -.111 .056 -.207 -
1.991
.050
Size .233 .079 .317 2.940 .004
Source: Research Findings
From the data in the above table the established regression equation for year 2013 was
Y = 0.614 + 0.263 LDA - 0.111DA + 0.233 Size
From the above regression equation it was revealed that holding long term debt, total debt and
size of investment companies listed in the NSE to a constant zero the financial performance of
investment companies listed in the NSE would stand at 0.614, a unit increase in long term debt

29
would lead to increase in financial performance of investment companies listed in the NSE by
a factors of 0.263, unit increase in total debt would lead to decrease in performance of
investment companies listed in the NSE by a factor of 0.111, further unit increase in size of the
firm would lead to increase in financial performance of investment companies listed in the NSE
by a factor 0.233.
4.3 Regression Results
A multiple regression analysis was conducted to study the relationship between independent
variables and the dependent variable. Regression method is useful for its ability to test the
nature of influence of independent variables on a dependent variable. Regression is able to
estimate the coefficients of the linear equation, involving one or more independent variables,
which best predicted the value of the dependent variable. Coefficient of determination explains
the extent to which changes in the dependent variable can be explained by the change in the
independent variables or the percentage of variation in the dependent variable (profitability
indicated by ROE) that is explained by all the three independent variables (long-term debt, total
debt and size). The study sought to establish the relationship between capital structure and
financial performance of investment firms listed at the Nairobi Securities Exchange.
Table 4.9 Model Summary
Model R R Square Adjusted R
Square
Std. Error of the
Estimate
1 0.902 0.813604 0.754 0.157
Source: Research Findings
The three independent variables (profitability factors) that were studied, explain only 81.4% of
the profitability of investment firms listed at the Nairobi Securities Exchange as represented
by the adjusted R2. This therefore means the three profitability factors (long-term debt, total
debt and size) explains 81.4% of liquidity factors influencing profitability of investment firms
listed at the Nairobi Securities Exchange, while other factors not studied in this research
contributes 18.6% of profitability of investment firms listed at the Nairobi Securities Exchange.
Therefore, further research should be conducted to investigate the other (18.6%) factors
influencing profitability of investment firms listed at the Nairobi Securities Exchange.

30
Table 4.10 ANOVA Results
Model Sum of Squares Df
Mean Square F Sig.
1
Regression 2.652 1 .204 8.752 .009
Residual 1.239 2 .008
Total 3.891 3
Source: Research Findings
The significance value is 0.009 which is less than 0.05 thus the model is statistically significant
in predicting how long-term debt, total debt and log of natural logarithm of assets influences
profitability of investment firms listed at the Nairobi Securities Exchange. The F critical at 5%
level of significance was 2.46568. Since F calculated (value = 8.752) is greater than the F
critical (2.46568) this shows that the overall model was significant.
Table 4.11 Coefficients of Determination
Model Unstandardized
Coefficients
Standardized
Coefficients
t Sig.
B Std. Error Beta
1
(Constant) 0.732 0.864 2.089 0.035
Long-term debt 0.550 0.110 0.376 3.539 0.016
Total debt -0.633 0.958 -0.398 -3.461 0.025
Size 0.387 0.736 0.267 2.886 0.033
Dependent Variable: ROE
Source: Research Findings
The coefficient of regression in table 4.11 above was used in coming up with the model below:
ROE=0.732+ 0.550 LDA-0.633 DA+ 0.387 SIZE
Where ROE is Earning (EBIT) divided by Equity, LDA is long-term debt & DA is total debt
both divided by market value capital of Equity, while SIZE is natural logarithm of assets. The
study established that all the variables were significant as their significance value was less than
0.05. The three variables (long-term debt, total debt, size) were correlated with profitability of
investment firms listed at the Nairobi Securities Exchange. With long-term debt and natural
logarithm of assets having a positive correlation and total debt having a negative correlation.

31
From the regression model, taking all factors (long-term debt, total debt, and size) constant at
zero, profitability of investment firms listed at the Nairobi Securities Exchange was 0.732. The
data findings analysed also shows that taking all other independent variables at zero, a unit
increase in long-term debt will lead to a 0.550 increase in profitability of investment firms
listed at the Nairobi Securities Exchange, a unit increase in total debt will lead to a 0.633
decrease in profitability of investment firms listed at the Nairobi Securities Exchange, while a
unit increase in log of natural logarithm of assets will lead to a 0.387 increase in profitability
of investment firms listed at the Nairobi Securities Exchange. This infers that total debt
influences the profitability of investment firms listed at the Nairobi Securities Exchange the
most.
4.5 Non-parametric Correlation
A Spearman correlation is used when one or both of the variables are not assumed to be
normally distributed. The values of the variables were converted in ranks and then
correlated. The study correlated ROE, LDA, DA and the firm size under the assumption that
these variables are normal.
Table 4.12 Correlations
ROE LDA DA Firm
size
Spearman’s
rho
ROE Correlation
Coefficient
Sig. (2-tailed) N
1.000
.
3
.617
.000
3
.547
.000
3
.667
.000
3
LDA Correlation
Coefficient
Sig. (2-tailed) N
.617
.000
3
1.000
.
3
.437
.000
3
.235
.001
3
DA Correlation
Coefficient
Sig. (2-tailed) N
.547
.000
3
.437
.000
3
1.000
.
3
.441
.002
3
Firm size Correlation
Coefficient
Sig. (2-tailed) N
.667
.000
3
.235
.000
3
.441
.000
3
1.000
.
3
Source: Research Findings
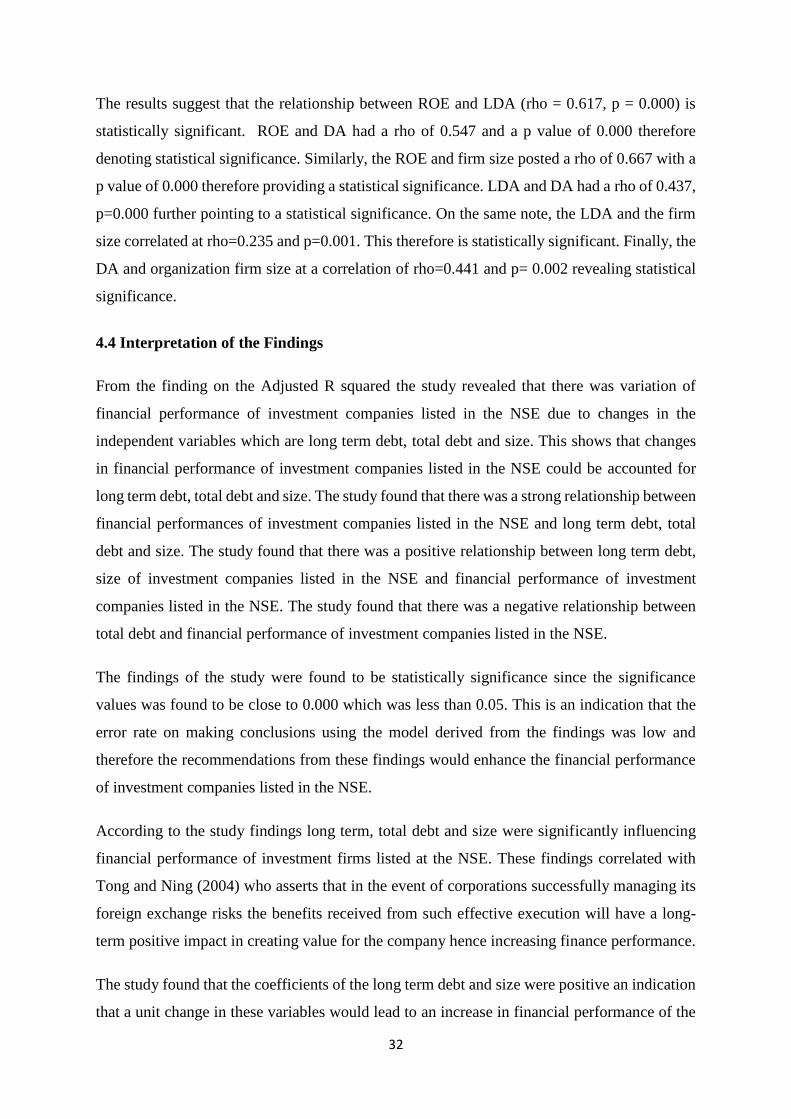
32
The results suggest that the relationship between ROE and LDA (rho = 0.617, p = 0.000) is
statistically significant. ROE and DA had a rho of 0.547 and a p value of 0.000 therefore
denoting statistical significance. Similarly, the ROE and firm size posted a rho of 0.667 with a
p value of 0.000 therefore providing a statistical significance. LDA and DA had a rho of 0.437,
p=0.000 further pointing to a statistical significance. On the same note, the LDA and the firm
size correlated at rho=0.235 and p=0.001. This therefore is statistically significant. Finally, the
DA and organization firm size at a correlation of rho=0.441 and p= 0.002 revealing statistical
significance.
4.4 Interpretation of the Findings
From the finding on the Adjusted R squared the study revealed that there was variation of
financial performance of investment companies listed in the NSE due to changes in the
independent variables which are long term debt, total debt and size. This shows that changes
in financial performance of investment companies listed in the NSE could be accounted for
long term debt, total debt and size. The study found that there was a strong relationship between
financial performances of investment companies listed in the NSE and long term debt, total
debt and size. The study found that there was a positive relationship between long term debt,
size of investment companies listed in the NSE and financial performance of investment
companies listed in the NSE. The study found that there was a negative relationship between
total debt and financial performance of investment companies listed in the NSE.
The findings of the study were found to be statistically significance since the significance
values was found to be close to 0.000 which was less than 0.05. This is an indication that the
error rate on making conclusions using the model derived from the findings was low and
therefore the recommendations from these findings would enhance the financial performance
of investment companies listed in the NSE.
According to the study findings long term, total debt and size were significantly influencing
financial performance of investment firms listed at the NSE. These findings correlated with
Tong and Ning (2004) who asserts that in the event of corporations successfully managing its
foreign exchange risks the benefits received from such effective execution will have a long-
term positive impact in creating value for the company hence increasing finance performance.
The study found that the coefficients of the long term debt and size were positive an indication
that a unit change in these variables would lead to an increase in financial performance of the

33
investment companies listed in the NSE. There was a strong relationship between financial
performances of investment companies listed in the NSE and long term debt, total debt and
size. These findings were similar with a study done by Rajan (2008) who found that future
investment prospects affect firm performance. A firm with higher growth options will have a
higher performance as it’s favourable to investors who have higher prospects of recovering
their investment. If a firm has lower growth options it’s likely to be erased by competitors
leading to eventual collapse hence lower performance.
From the findings the study revealed long term debt, total debt and size influence financial
performance of investment firms listed at the NSE. This clearly shows that capital structure
affect financial performance of firms listed at NSE. The total loans in these firms could lead to
high interest expense hence lowering the size of the firm as well as reduced shareholders
wealth. The shareholders can decide to withdraw their investment in terms of shares in the
company if the managers make decision to continue increasing the total debt and these can lead
to financial crisis of the firms listed in NSE. The same findings concurred with Hutchinson
(1995) as well as Wandeto (2005) who found that high-growth firms might have more options
for future investment than low-growth firms. Thus, highly leveraged firms are more likely to
pass up profitable investment opportunities, because such an investment will effectively
transfer wealth from the firm's owners to its debt holders. As a result, firms with high growth
opportunities may not issue debt in the first place, and leverage is expected to be negatively
related to growth opportunities.

34
CHAPTER FIVE
SUMMARY, CONCLUSION AND RECOMMENDATIONS
5.1 Introduction
From the analysis and data collected, the following discussions, conclusion and
recommendations were made. The responses were based on the objectives of the study. The
researcher had intended to determine the relationship between capital structure and financial
performance of investment firms listed at the NSE.
5.2 Summary
From the findings on the Adjusted R squared, the study revealed that there was variation of
financial performance of investment firms listed in the NSE due to variations in long term debt,
total debt and size. The study revealed that long term and total debt were the major factors
influencing the financial performance of investment firms listed in the NSE. From the findings
on the correlation analysis the study revealed that there was a strong relationship between
capital structure and financial performance.
The study further revealed that the analysed data is ideal for making a conclusion on the
influence of long term debt, total debt and size on financial performance of investment firms
listed at the NSE. The study revealed that long term debt, total debt and size were significantly
influencing the financial performance of investment firms listed at the NSE
The study found that the coefficients of the long term debt and size were positive an indication
that a unit change in these variables would lead to an increase in financial performance of the
investment companies listed in the NSE. There was a strong relationship between financial
performance of investment companies listed in the NSE and long term debt, total debt and size.
The coefficient on total debt was negative an indication that there existed a negative
relationship between total debt and financial performance of investment companies listed in
the NSE. An increase in the total debt would therefore lead to a decrease in the financial
performance of investment companies listed in the NSE
35
5.3 Conclusion
From the findings the study revealed long term debt, total debt and size influence financial
performance of investment firms listed at the NSE. This clearly shows that capital structure
affect financial performance of firms listed at NSE. The study concludes that long term debt of
investment firms listed in the NSE is positively related to financial performance of firms listed
at NSE, this is attributed to the fact that the long term debt is utilized to run the operations of
these companies and by doing so reduce the losses that the firm would have undergone if there
was shortage of the long term funds.
The study concludes that total debt affects financial performance of the firms listed in the NSE.
The higher the total debt, the less the return on equity as well as reduced shareholders wealth
which indicates a need to increase more capital injection rather than borrowing. The total loans
in these firms could lead to high interest expense hence lowering the profitability of the firm.
The firms should therefore fund investments from internal sources in order to enhance their
financial performance. This is also supported by Maniagi et.al, (2013) who says that the
benefits of debt financing are less than its negative aspects.
5.4 Recommendations for Policy
It is critical for the Chief Executive Officers and Chief Finance Officers of the Investment firms
when seeking to fund the firm’s assets to understand the impact of capital structure on their
organization’s financial performance as well the cost of funds.
There is need for the firms listed in the NSE to have a strong capital structure which provides
them strength to withstand financial crises and offers shareholders a better safety net in times
of depressions. In addition the capital market analysts as well investment analysts should advise
the investment firms on the optimal capital structure based on capital structure analysis.
The study recommends that there is need for the firms to increase their size by growing their
assets as it was revealed that size positively impacts on the financial performance of the firms.
The study also recommends that there is need for the firms to adopt strategies that would
increase their size base and utilize the profits generated from the operations to acquire more
assets and improve their financial performance.

36
5.5 Limitations of the Study
There were challenges uncounted during the study. Some companies had not submitted their
annual financial result to CMA and managers of this firm were reluctant to release information
required for the study. That reluctance delayed the completion of the data collection.
All the data was collected from secondary sources and any error in the original data could not
be avoided however all data was from reliable source only.
The study was based on a four year study period from the year 2010 to 2013 since some of the
firms like TransCentury listed in 2011. A longer duration of the study will have captured
periods of various economic significances such as booms and recessions. This may have
probably given a longer time focus hence given a broader dimension to the problem.
5.6 Areas for Further Research
The study recommends that a study should be undertaken on the factors affecting the size of
firms listed in the NSE.
The study was confined to Investment firms listed in the Nairobi Securities Exchange; further
study should be undertaken on other firms in other sectors of the economy such as; industrial,
banking, manufacturing and other sectors.
A study should also be undertaken on the effect of capital structure on the other companies
which have not yet been listed in the NSE.

37
REFERENCES
Abor, J. (2007). Debt policy and performance of SMEs. Journal of Risk Finance, 8(4), 364-
379.
Bhaduri, S. (2002), Determinants of corporate borrowing: some evidence from the Indian
corporate structure, Journal of Economic and Finance, 26, 200-15.
Block, Z. & McMillan, D. (2005), “Milestone for Successful Planning”, Harvard Business
Review, 63, 5, 184-196 Business Journal, 30, 301-313.
Brigham, E. & Houston, F. (2005), Fundamentals of Financial Management, 9th ed.,
Harcourt Brace College, San Diego, CA.
Brigham, E. (2007). Fundamentals of financial management: Cengage Learning.
Chen, C. (2004). Managerial ownership and agency conflicts: a nonlinear simultaneous
equation analysis of managerial ownership, risk taking, debt policy, and dividend
policy, Financial Review, 34, 119-36.
Donaldson, K. (2005). Delay of ripening of ‘Pedro Sato’ guava with1-methylcyclopropene.
Postharvest Biology and Technology 35: 303–308.
Fischer, O., Heinkel, R. & Zechner, J. (2009). Dynamic capital structure choice: Theory and
tests. Journal of Finance 44(1), 19-40.
Gachoka K. (2005). Capital structure choice, an empirical testing of the pecking order theory
among firms quoted on the NSE, unpublished MBA project, University of Nairobi.
Gachoki, B. (2005).The Relationship between Financial Structure and Performance of
Micro and Small Interprises in Nairobi. Unpublished MBA project, University of
Nairobi.
Gachoki, F. (2005). The Relationship between dividend payout and firm performance: a
study of listed companies in Kenya, European Scientific Journal, edition (8).
Hall, C., Hutchinson, J. & Michaelas, N. (2008). Determinants of the capital structures of
European Stock Market. Journal of Business Finance and Accounting, 31(5-6), 711-
728.
Hamilton, B. (2010), Does entrepreneurship pay? An empirical analysis of the returns to self-
employment, Journal of Political Economy, 108, 604-31.
Holmes, S. 2003). “Capital structure and financing of SMEs: Australian evidence”. Journal
of Accounting and Finance, (43), 123–147.

38
Hovakimian, A., Hovakimian, G. & Tehranian, H. (2004). Determinants of target capital
structure: The case of dual debt and equity issues* 1. Journal of Financial Research,
71(3), 517-540.
Hutchinson, P. (1995). Small firm growth, access to capital markets and financial structure:
review of issues and an empirical investigation. 8(1), 59-67.
Jensen, M. (2006). Agency Cost of Free Cash Flow, Corporate Finance and Takeovers,
American Economic Review, Papers and Proceedings, vol.76 (1).
John, K. & Williams, J. (2005), Dividends, dilution, and taxes: a signalling equilibrium The
Journal of Finance, Vol. 40, pp. 1053-70.
Kennerley, M. (2002). The Performance Prism: The Scorecard for Measuring and Managing
Business Success, Financial Times/Prentice Hall, London.
Kester, W. (2006). Capital and ownership structure: a comparison of United States and
Japanese manufacturing corporations, Financial Management.
Kitaka, P. (2013)A survey of use of Financial Performance Indicators By Microfinance
Institutions in Kenya, Unpublished MBA project, University of Nairobi
Klammer, T. (2003). The Association of Capital Budgeting Techniques with Firm
Performance; The Accounting Review, 48, 353-364.
Kochhar, R. (2006). Explaining firm capital structure: the role of agency theory vs
transaction cost economics, Strategic Management Journal (17).
Long, M. & Malitz, B. (2005). The investment-financing nexus: Some empirical evidence.
Midland Corporate Finance Journal (3).
Mahrt, J. (2005), The interaction of capital structure and ownership structure, The Journal of
Business, Vol. 78 pp. 787-816.
Majumdar, S. & Chhibber, P. (1999). Capital structure and performance: evidence from a
transition economy on an aspect of corporate governance. Public Choice 98,
Majumdar, S. (2009). Capital structure and performance: evidence from a transition
economy on an aspect of corporate governance.
Maksimovic, V. (2001). Capital Structures in Developing Countries. The Journal of Finance,
56
Musienga, Maniagi G. et al. (2013) Corporate Governance, Dividend Policy and Performance.
International Journal of Innovative Research and Development, 25
Michael, P. (1992). Financial policy and capital structure choice in UK SMEs: empirical
evidence from company panel data, Small Business Economics, Vol. 12, pp. 113-30.

39
Michaelas, N., Chittenden, F., &Poutziouris, P. (2009). Financial policy and capital structure
choice in UK SMEs: empirical evidence from company panel data. Small Business
Economics, 12(2), 113-130.
Modigliani, F. & Miller, M. (2003). Corporate income taxes and the cost of capital: a
correction, American Economic Review, 53, 433-43.
Modigliani, F., & Miller, M. H. (1963). Corporate income taxes and the cost of capital: A
correction. 53(3), 433-443.
Myers, S. (1998). The capital structure puzzle. Journal of Finance, Vol.39
Narayanan, M. (2008). Debt versus equity under asymmetric information. Journal of
Financial and Quantitative Analysis Vol. 2, No.6
Noreen, K. (2013), Capital Structure and Financial Performance: Evidence from Pakistan
(Kse 100 Index), Journal of Basic and Applied Scientific Research, Vol. 3(4)
Nyaboga E. (2008). Relationship between capital structure and agency cost, unpublished
MBA project, University of Nairobi.
Okoth, V., Ongore, N. & Gemechu, B. (2013). Determinants of Financial Performance of
Commercial Banks in Kenya, International Journal of Economics and Financial
Issues, (3).
Omondi W. (1995). A study of Capital structure in Kenya. Unpublished MBA project,
University of Nairobi
Owolabi, S. & Inyang, U. (2013). International Pragmatic Review and Assessment of Capital
Structure Determinants. Kuwait Chapter of Arabian Journal of Business and
Management Review.
Pandey, I. (2005). Financial Management (Vol. Ninth Edition): Vikas Publishing HousePVT
LTD.
Rajan, R. (2008), The paradox of liquidity, Quarterly Journal of Economics, Vol. 113, pp.
733-71.
Ruto, G. & Rueben, K. (2013). Capital Structure and Performance: Evidence from Listed
Non-Financial Firms on Nairobi Securities Exchange (NSE) Kenya”, International
Journal for Management Science and Technology (IJMST).
Short, H. (2002), ‘Ownership, Control, Financial Structure and Performance of Firms’,
Journal of Economic Surveys, vol. 8, pp.209-249.
Stewart, G. (2011). The Quest for Value: A Guide for Senior Managers, First Ed., New York:
Harper Business.

40
Titman, S. & Wessels, R. (2008). The determinants of capital structure choice. Journal of
Finance, (43).
Tong, S. &Ning, Y. (2004), Does capital structure affect institutional investor choices?, The
Journal of Investing, Vol. 28, pp. 53-66.
Tufano, P. (2005). Securities innovations: a historical and functional perspective, Journal of
Applied Corporate Finance, 7, 90-113.
Uwalomwa, U. & Olayinka M. (2012). An Empirical Examination of the Relationship
between Capital Structure and the Financial Performance of Firms in Nigeria, Euro
Economica Journal Issue 1(31)
Varaiya, N. Kerin, R., Weeks, R. (2007). The Relationship between Growth, Profitability,
and Company Value”, Strategic Management Journal, 44- 98.
Wald, J. (2009). How firm characteristics affect capital structure: an international
comparison. Journal of Financial Research 22(2), 161.
Wandeto P. (2005). An empirical investigation of the relationship between dividend changes
& earning, cash flows& capital structure for firms listed in the NSE. Unpublished
MBA project University of Nairobi
Zeckhauser, R. & Pound, J. (1990). Are large shareholders effective monitors? An
investigation of share ownership and corporate performance, in Hubbard, R.G. (Ed.),
Asymmetric Information, Corporate Finance and Investment, University of Chicago
Press, Chicago, IL, pp. 149-80.
Zeitun, R. & Tian, G. (2007). Capital Structure and Firm Performance: Evidence from
Jordan, Australia. Accounting Business and Finance Journal 1 (4).

41
APPENDICES
Appendix I: Investment Firms listed at the NSE as at 30th June 2014
No. Firm Year Listed 1. Centum Investment
1967
2. Olympia Capital Holdings
1976
3. Trans Century Ltd
2009
Source; NSE Hand book
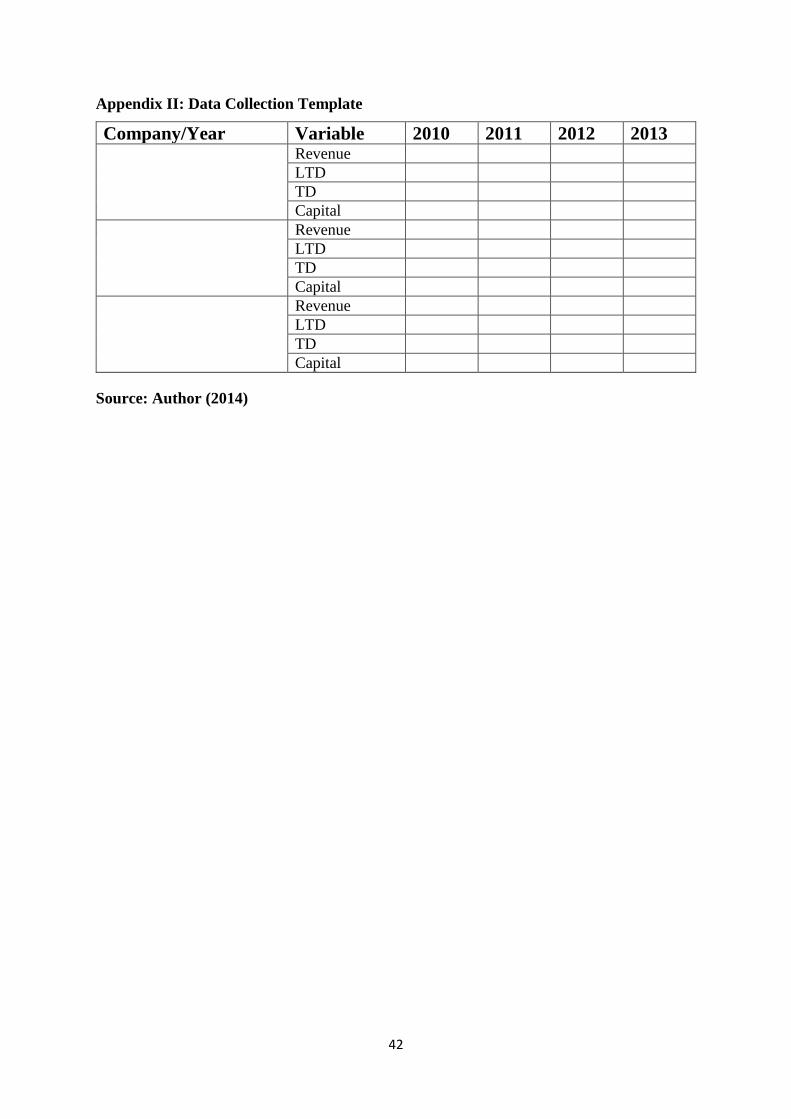
42
Appendix II: Data Collection Template
Company/Year Variable 2010 2011 2012 2013 Revenue
LTD
TD
Capital
Revenue
LTD
TD
Capital
Revenue
LTD
TD
Capital
Source: Author (2014)

43
Appendix III: Work Plan
The table below shows the schedule of all the events, it indicates the month each particular
activity took place.
Source: Author (2014)
ACTIVITY PERIOD
Jun Jul Aug Sep Oct
Preliminary literature
review
Consultations with
supervisor
Thesis proposal
writing
Developing
instruments
Thesis proposal
defence
Data Collection,
Analysis and thesis
completion