the relations between solar wind variations and the north atlantic oscillation rasheed al-nuaimi and...
TRANSCRIPT
The Relations Between Solar Wind Variations and
the North Atlantic Oscillation
Rasheed Al-Nuaimi and Kais Al-Jumily
Department of Atmospheric SciencesCollege of Science, Al-Mustansiriyah University
Baghdad, Iraq,

INTRODUCTION
Heat radiation from the Sun is believed to be the primary factor for the Earth’s climate condition.
This phenomenon is not sufficient to explain the observed global climate fluctuations on Earth during the last century.
Several attempts have been made over the last decade to clarify if variations in the solar activity could, to some extent, be responsible for these climate fluctuations.
AIM OF WORK
Investigate the possible relation between solar wind variations and the North Atlantic Oscillation (NAO).
THE NORTH ATLANTIC OSCILLATION (NAO) The NAO is the dominant mode of winter
climate variability in the North Atlantic region ranging from central North America to Europe and much into Northern Asia.
The NAO is a large scale seesaw in atmospheric mass between the subtropical high (the Azores High) and the polar low (the Icelandic Low) in the North Atlantic region.
The corresponding index varies from year to year, but also exhibits a tendency to remain in one phase for intervals lasting several years.
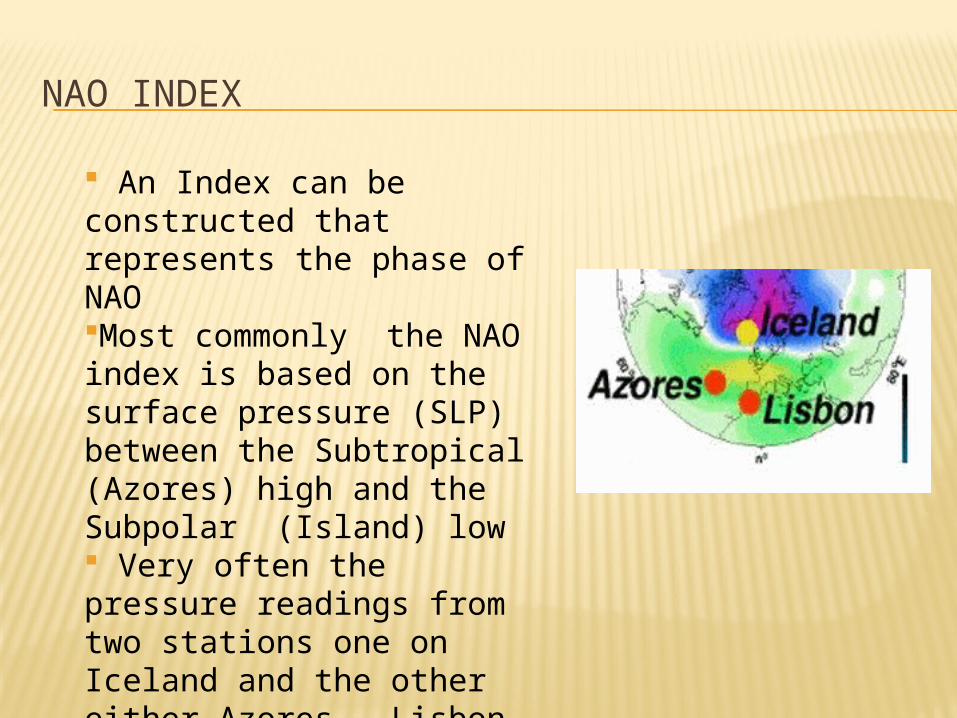
NAO INDEX
An Index can be constructed that represents the phase of NAOMost commonly the NAO index is based on the surface pressure (SLP) between the Subtropical (Azores) high and the Subpolar (Island) low Very often the pressure readings from two stations one on Iceland and the other either Azores , Lisbon or Gibraltar are used to construct the NAO index
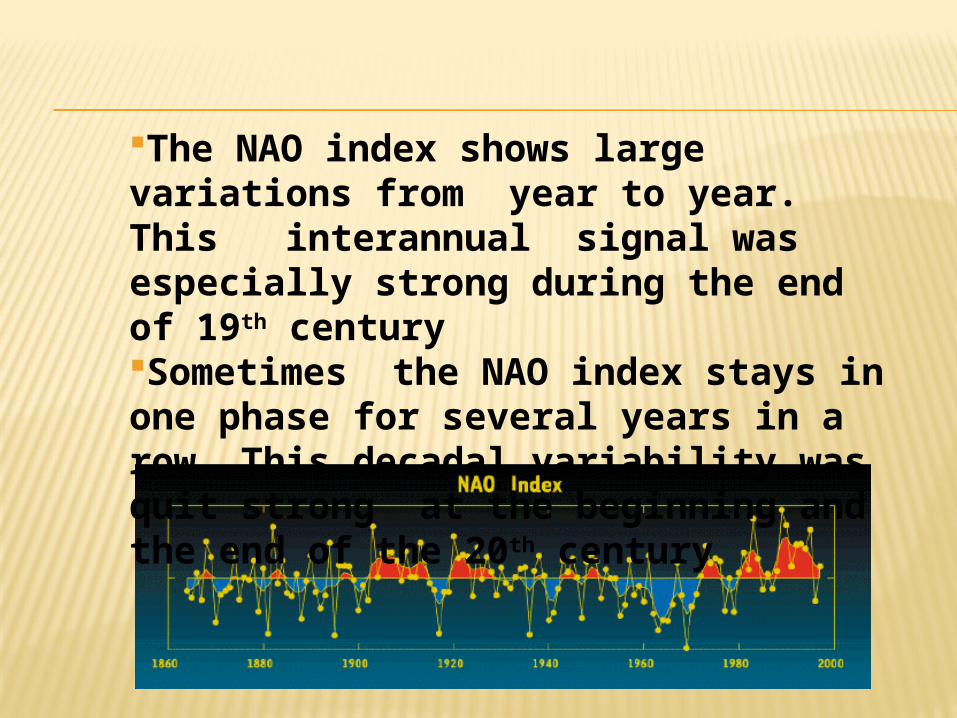
The NAO index shows large variations from year to year. This interannual signal was especially strong during the end of 19th century Sometimes the NAO index stays in one phase for several years in a row. This decadal variability was quit strong at the beginning and the end of the 20th century
THE POSITIVE NAO INDEX PHASE
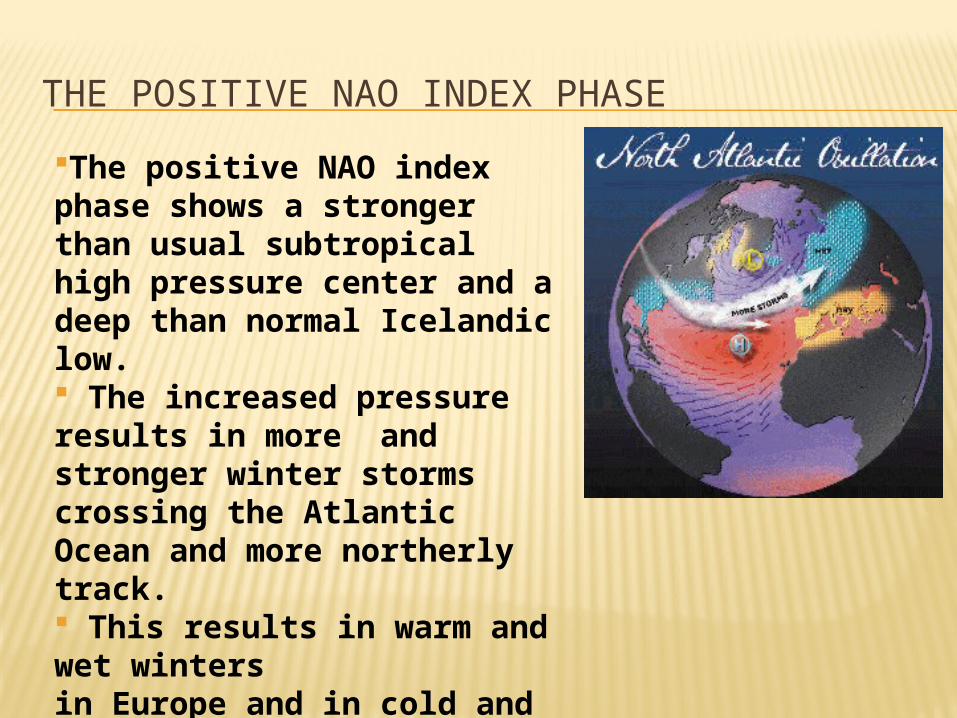
The positive NAO index phase shows a stronger than usual subtropical high pressure center and a deep than normal Icelandic low. The increased pressure results in more and stronger winter storms crossing the Atlantic Ocean and more northerly track. This results in warm and wet wintersin Europe and in cold and dry winters in northern Canada and Greenland.The eastern US experiences mild and wet
winter conditions.
THE NEGATIVE NAO INDEX PHASE
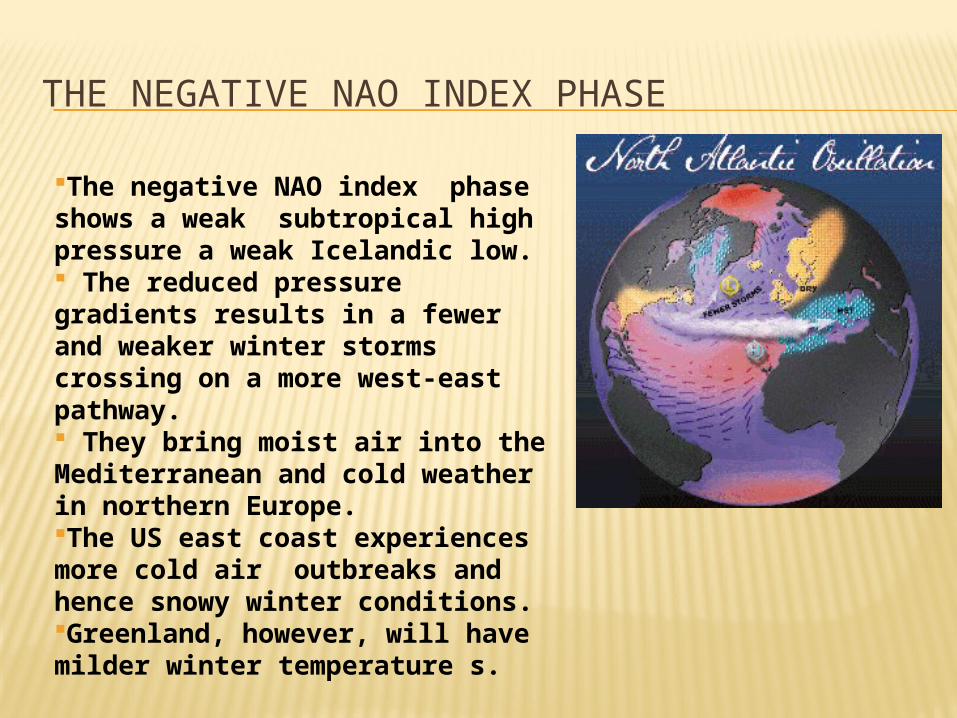
The negative NAO index phase shows a weak subtropical high pressure a weak Icelandic low. The reduced pressure gradients results in a fewer and weaker winter storms crossing on a more west-east pathway. They bring moist air into the Mediterranean and cold weather in northern Europe.The US east coast experiences more cold air outbreaks and hence snowy winter conditions.Greenland, however, will have milder winter temperature s.
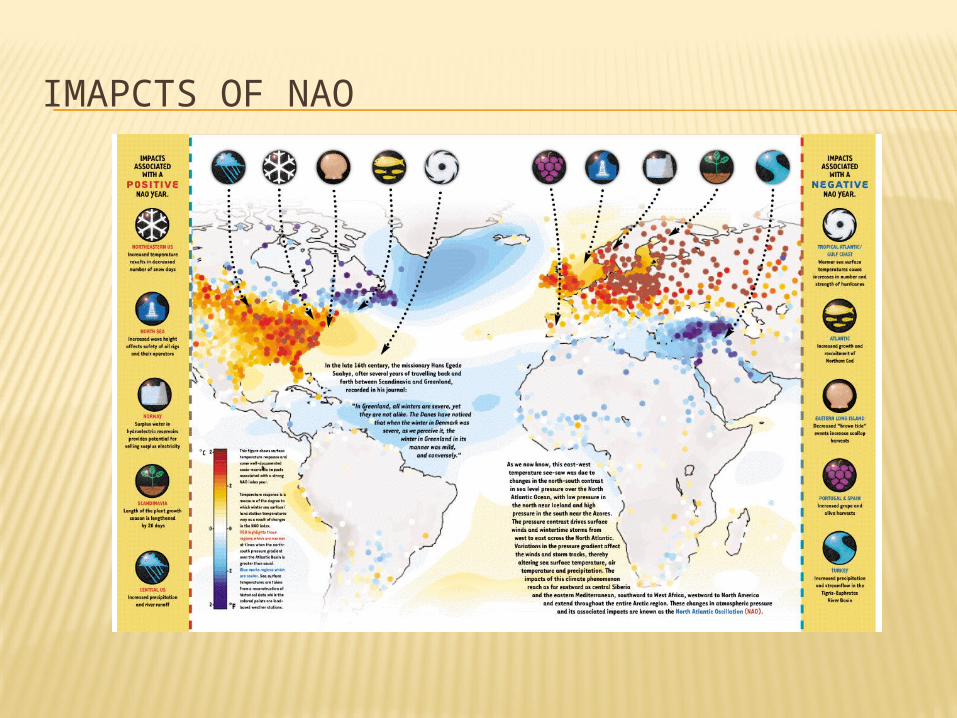
IMAPCTS OF NAO
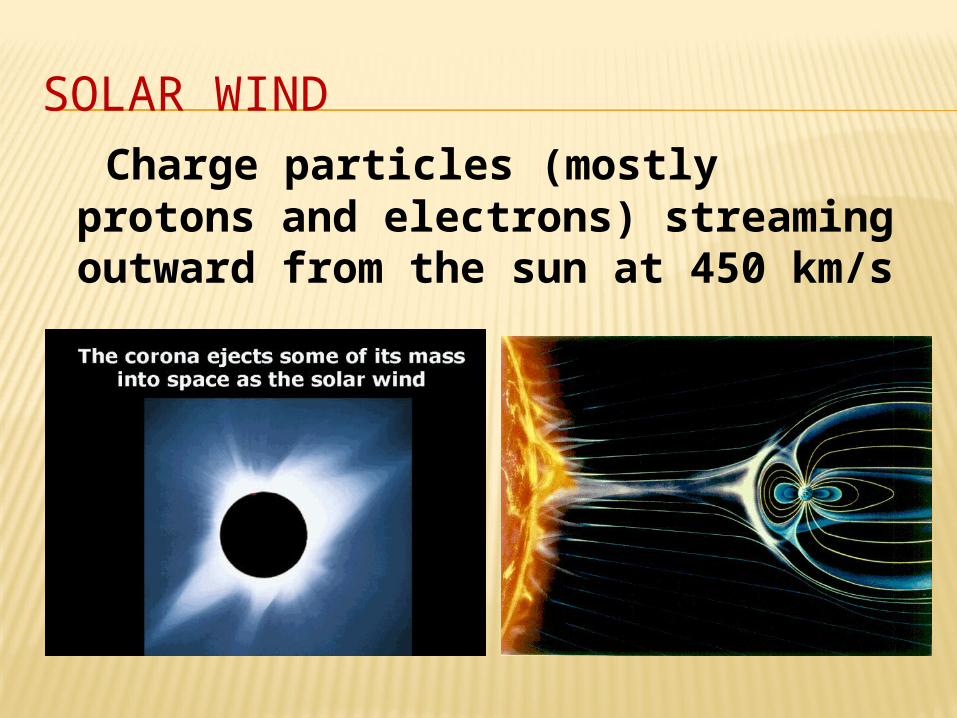
SOLAR WIND Charge particles (mostly protons and electrons) streaming outward from the sun at 450 km/s
SOLAR WIND PARAMETERS
Some of the most geoeffective solar wind parameters are: • Flow speed (V)• Proton density (n)• Southward component (Bs
)of the interplanetary magnetic field
Bs is equal to -Bz when Bz < 0 and equal to 0 when Bz ≥0, where Bz is the interplanetary magnetic field component parallel to the Earth’s magnetic dipole.

By using these three parameters one can construct proxies for:•The dynamical pressure (P) •The electric field strength (E) of the
solar wind. •The pressure (P) exerted on the Earth’s magnetosphere is best represented by
(nV2 ) whereas the electric field (E) can be described by (Bs V).

A widely used measure of the overall geomagnetic activity is the planetary magnetospheric (Kp ) index.
The Kp index is evaluated using the amplitude of the variation of the horizontal magnetic components X and Y at the Earth’s surface at geomagnetic latitudes between 48o and 63o.

DATA SOURCES
The NAO indices were obtain from http://www.ncdc.noaa.gov/paleo/pubs/cook2002/cook2002.html
The solar wind data and the planetary magnetospheric Kp index were obtained from
http://omniweb.gsfc.nasa.gov/html/ The group sunspot numbers were
obtained from: http://spidr.ngdc.noaa.gov/spidr/dataset.do
RESULTS AND DISCUSSION
Annual averages of E, P, and Kp for the period of 1967-2000 were used to investigate the possibility of solar wind relation with the NAO.
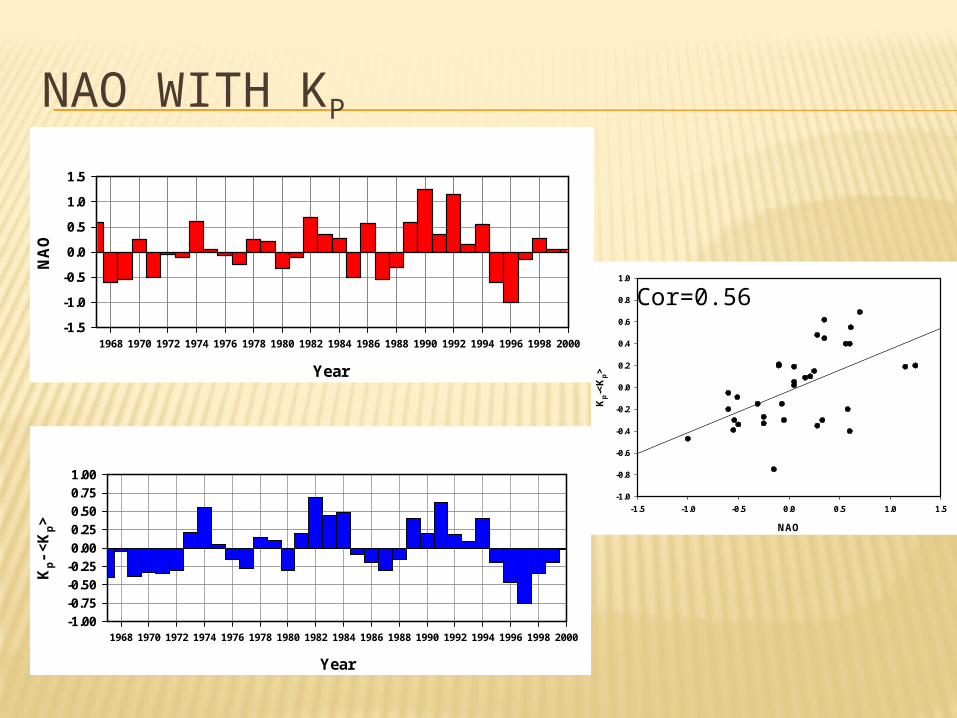
NAO WITH KP
Year
1968 1970 1972 1974 1976 1978 1980 1982 1984 1986 1988 1990 1992 1994 1996 1998 2000
NA
O
-1.5
-1.0
-0.5
0.0
0.5
1.0
1.5
Year
1968 1970 1972 1974 1976 1978 1980 1982 1984 1986 1988 1990 1992 1994 1996 1998 2000
Kp-
<K
p>
-1.00
-0.75
-0.50
-0.25
0.00
0.25
0.50
0.75
1.00
NAO
-1.5 -1.0 -0.5 0.0 0.5 1.0 1.5
Kp-<
Kp>
-1.0
-0.8
-0.6
-0.4
-0.2
0.0
0.2
0.4
0.6
0.8
1.0
Cor=0.56
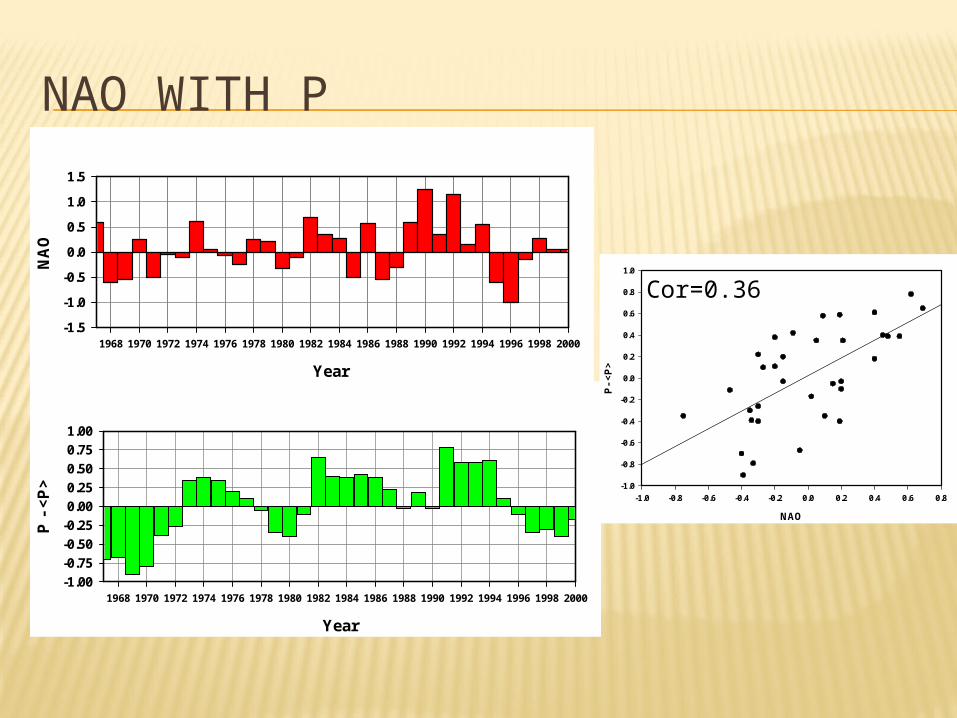
NAO WITH P
Year
1968 1970 1972 1974 1976 1978 1980 1982 1984 1986 1988 1990 1992 1994 1996 1998 2000
NA
O
-1.5
-1.0
-0.5
0.0
0.5
1.0
1.5
Year
1968 1970 1972 1974 1976 1978 1980 1982 1984 1986 1988 1990 1992 1994 1996 1998 2000
P -
<P
>
-1.00
-0.75
-0.50
-0.25
0.00
0.25
0.50
0.75
1.00
NAO
-1.0 -0.8 -0.6 -0.4 -0.2 0.0 0.2 0.4 0.6 0.8
P-
<P
>
-1.0
-0.8
-0.6
-0.4
-0.2
0.0
0.2
0.4
0.6
0.8
1.0
Cor=0.36
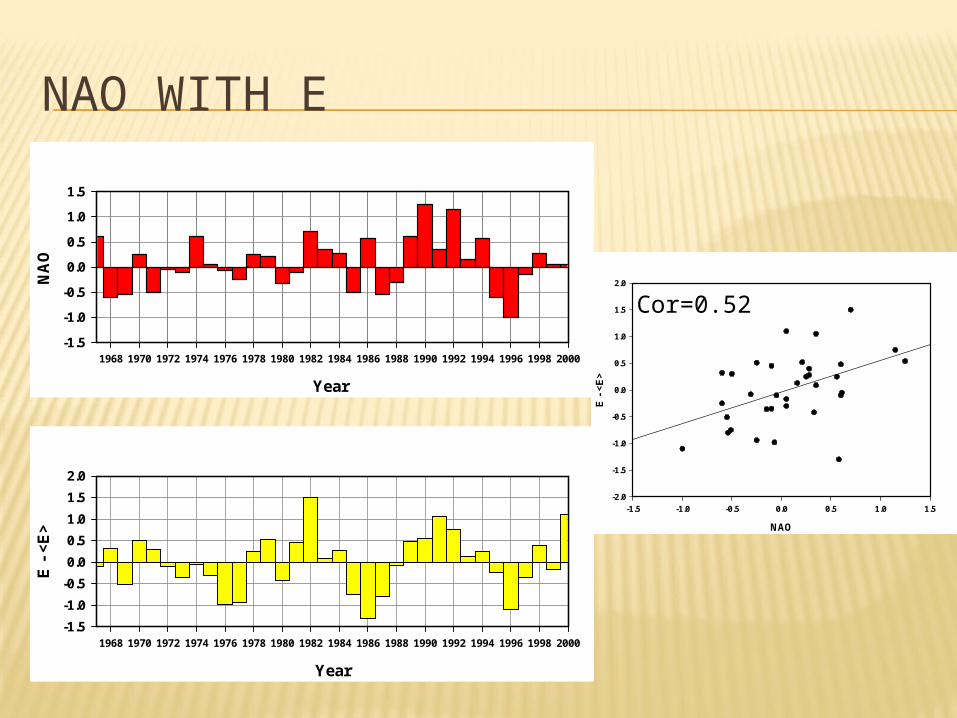
NAO WITH E
Year
1968 1970 1972 1974 1976 1978 1980 1982 1984 1986 1988 1990 1992 1994 1996 1998 2000
NA
O
-1.5
-1.0
-0.5
0.0
0.5
1.0
1.5
Year
1968 1970 1972 1974 1976 1978 1980 1982 1984 1986 1988 1990 1992 1994 1996 1998 2000
E -
<E
>
-1.5
-1.0
-0.5
0.0
0.5
1.0
1.5
2.0
NAO
-1.5 -1.0 -0.5 0.0 0.5 1.0 1.5
E -
<E
>
-2.0
-1.5
-1.0
-0.5
0.0
0.5
1.0
1.5
2.0
Cor=0.52
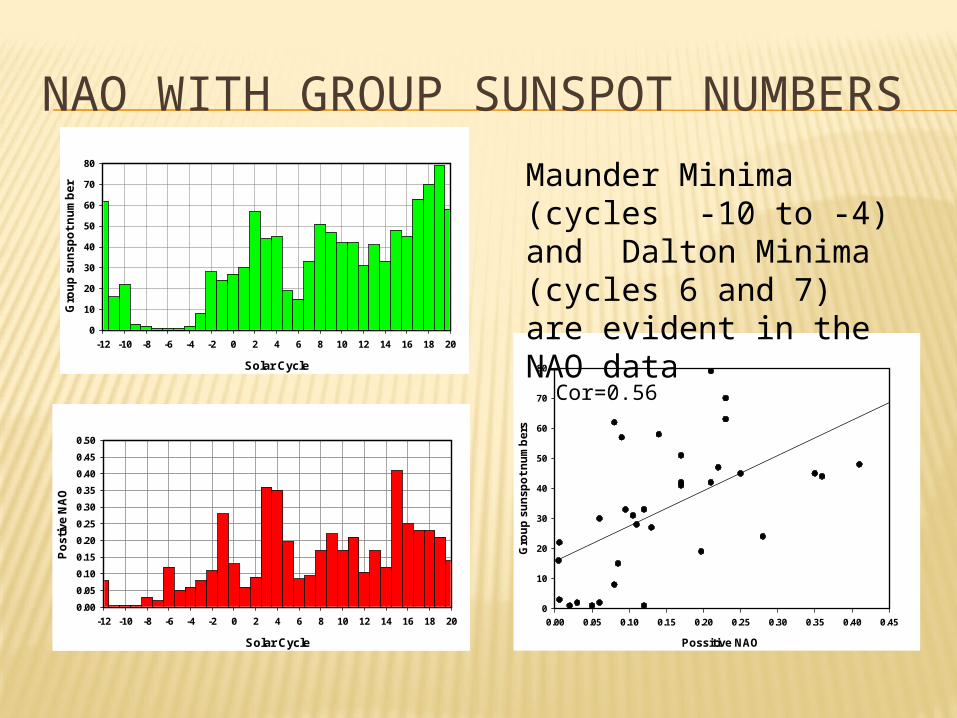
NAO WITH GROUP SUNSPOT NUMBERS
Solar Cycle
-12 -10 -8 -6 -4 -2 0 2 4 6 8 10 12 14 16 18 20
Po
stiv
e N
AO
0.00
0.05
0.10
0.15
0.20
0.25
0.30
0.35
0.40
0.45
0.50
Solar Cycle
-12 -10 -8 -6 -4 -2 0 2 4 6 8 10 12 14 16 18 20
Gro
up
su
nsp
ot
nu
mb
er
0
10
20
30
40
50
60
70
80
Possitive NAO
0.00 0.05 0.10 0.15 0.20 0.25 0.30 0.35 0.40 0.45
Gro
up
su
ns
po
t n
um
be
rs
0
10
20
30
40
50
60
70
80
Cor=0.56
Maunder Minima (cycles -10 to -4) and Dalton Minima (cycles 6 and 7)are evident in the NAO data
CONCLUSIONS
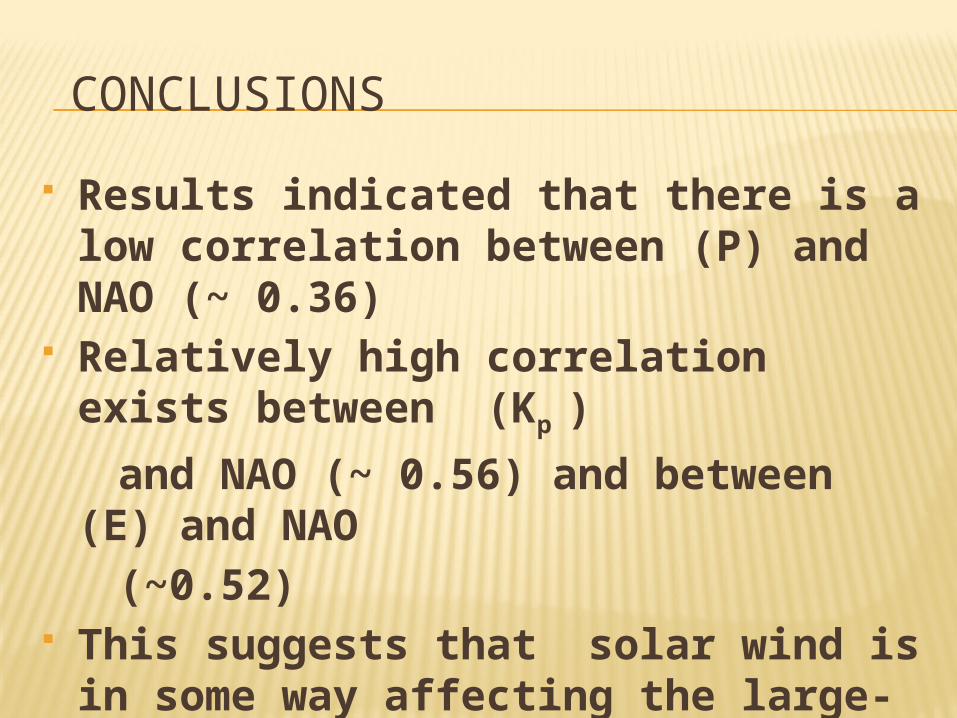
Results indicated that there is a low correlation between (P) and NAO (~ 0.36)
Relatively high correlation exists between (Kp
)
and NAO (~ 0.56) and between (E) and NAO
(~0.52) This suggests that solar wind is in
some way affecting the large-scale pressure systems in Earth.

A more in depth study is needed through analysis of monthly means of data.

Thank You