the relation between economic growth and foreign direct
TRANSCRIPT

Mihaela Simionescu • The relation between economic growth and foreign direct... Zb. rad. Ekon. fak. Rij. • 2016 • vol. 34 • no. 1 • 187-213 187
Review articleUDC: 330.35:339.727.22(4-67 EU)
doi: 10.18045/zbefri.2016.1.187
The relation between economic growth and foreign direct investment during the economic crisis in the
European Union*
Mihaela Simionescu1
Abstract
The goal of this research is to investigate the relationship between economic growth and foreign direct investment inflows in the European Union (EU-28) in the period of the recent economic crisis. Panel data approach and Bayesian techniques are employed to solve the problem of a short set of data (2008–2014). The panel data approaches (panel vector-autoregressive model and Bayesian random effect models) identified a reciprocal and positive relationship between FDI and economic growth in EU-28 starting with 2008. The individual approach based on Bayesian linear regressions identified this tendency as being specific for most of the EU-28 countries. However, there are some countries for which higher FDI did not generate economic growth and some countries where higher GDP did not attract more FDI and FDI did not bring economic growth. According to cluster analysis, the disparities among countries regarding the FDI distribution according to GDP growth and GDP rate distribution according to FDI diminished in 2014 compared to 2008. The basic conclusion is that on overall in the European Union there was a reciprocal relationship between economic growth and FDI since the beginning of the crisis with a tendency of reducing disparities between countries in attracting FDI.
Key words: economic growth, foreign direct investment, panel data, Bayesian model, crisis
JEL classification: C51, C53, F21
* Received: 05-10-2015; accepted: 17-06-2016 1 PhD in Economic Cybernetics and Statistics, Habilitated Doctor in Economics, Senior
Researcher, Romanian Academy, Institute for Economic Forecasting, Bucharest, Calea 13 Septembrie, no. 13, District 5, ZIP code 050711, Bucharest, Romania. Scientific affiliation: statistics, econometrics. Phone: +402 13 188 148. E-mail: [email protected].
Mihaela Simionescu • The relation between economic growth and foreign direct... 188 Zb. rad. Ekon. fak. Rij. • 2016 • vol. 34 • no. 1 • 187-213
1. Introduction
The relationship between economic growth and foreign direct investment (FDI) has been a subject of discussion for many researchers, economists, and policy analysts in time mainly in Developing countries. It is important to know if FDI inflows really generate economic growth and if a country with higher GDP rate attracts more FDI inflows.
Foreign direct investment (FDI) represents a vehicle for transferring tangible assets, but also intangible assets like technology (for example, innovative product designs and managerial skill). The positive effect of FDI on economic growth is ensured by FDI transferring assets regarding FDI spillover effect and productivity improvement (Lechman and Kaur, 2015).
On the other hand, the empirical studies regarding the relationship between FDI and economic growth showed mixed influences. Few studies, like those of Chakraborty and Basu (2002) for India, found little or no evidence for FDI contributing to economic growth. Actually, a faster economic growth attracts more FDI inflows (Choi, 2004; Carkovic and Levine, 2002, Kherfi and Soliman, 2005, Fidrmuc and Kostagianni, 2015, Cichy and Gradoń, 2016).
Most studies were interested in the FDI influence on economic growth in Central and European countries, an overall image for EU-28 not being provided yet. None of the researches employed the Bayesian techniques that are very useful in the context of a short period corresponding to the economic crisis.
The empirical literature that studies the FDI in the context of the recent economic crisis is still young. It is clearly that an economic crisis has negative consequences on FDI increase (Clowes and Bilan, 2014), but a careful attention should be accorded to the relationship between growth and FDI in this unstable period. There are only few researches that focused on the impact of financial crisis on FDI level. In this context, Ucal et al. (2010) showed the high impact of economic crisis on FDI. In the year(s) before crisis, FDI registered a maximum level, but then FDI decreased fast. Some researchers analysed if the recent economic crisis affected more the FDI compared to the previous global economic crisis. Poulsen and Hufbauer (2011) compared the recent FDI recession with the response of FDI to the past financial crisis and they found that the financial crisis started in 2008 was the biggest one.
The hypothesis of this research refers to the identification of the relationship type between economic growth and FDI in the European Union countries (it could be a bidirectional relationship, a unidirectional relationship or no relation could be between GDP rate and FDI in the European Union).
In this paper, after the description of the methodological background (panel data models and Bayesian models), the bidirectional relationship between FDI inflows and economic growth is analysed. In the end, some conclusions are drawn.
Mihaela Simionescu • The relation between economic growth and foreign direct... Zb. rad. Ekon. fak. Rij. • 2016 • vol. 34 • no. 1 • 187-213 189
2. Literature review
There are economic, social and political factors that affect FDI inflows. A considerable attention was accorded in literature to the relationship between FDI and economic growth.
The economic growth depends on sustained growth of productive capacity, consisting in investment and saving. The low levels in investment and saving implies low economic growth. Being a source of economic growth, the need of FDI inflows had increased in the last years. Several determinants of the linkage between FDI and economic growth were identified by Anwara and Nguyen (2010): learning by doing, exports, human capital, macroeconomic stability, public investment, level of financial development. Using these determinants, Neuhause (2006) showed that there are three principal channels through which FDI influences economic growth:
– direct transmission through Greenfield investments;
– indirect transmission trough ownership participation;
– second round transmission trough technology spillover.
The effect of FDI on GDP growth differs in conventional models and in actual growth models. In the case of the neo-classical approach, FDI influences only the output level, but FDI has no impact on long-run growth rate. The FDI exogenous increase would raise the capital quantity and per capita GDP only temporarily because diminishing returns would limit the growth on long-run. The labour growth and technological progress, as exogenous factors, determine the effects of FDI on long-term economic growth. The studies based on neoclassical model of Solow (1957) integrated investment as a fixed proportion of output. However, the determinants of technological progress were not included in the neoclassical models. On the other hand, the models based on new growth theory consider that FDI influences economic grow through human capital and research and development. The spillovers in technology from FDI ensure long-term economic growth.
The most part of empirical studies analysed FDI and trade interaction on economic growth (Karbasi et al., 2005) or the relationship between economic growth and FDI inflows (Lipsey, 2000). The results indicated that FDI inflows have a positive influence on economic growth. On the other hand, these studies did not provide an explanation regarding the general relationship and the causality sense for a large number of developing countries. The influence of FDI inflows on economic growth is variable from a country to another. For example, Xu (2000) showed that in the case of some countries FDI has a negative impact on GDP growth. Balasubramanyam et al. (1996) explained that FDI had a positive impact on growth in host countries with export promoting strategy, but not in states with import substitution strategy. Baliamoune-Lutz (2004) found a direct and bilateral relationship between FDI and
Mihaela Simionescu • The relation between economic growth and foreign direct... 190 Zb. rad. Ekon. fak. Rij. • 2016 • vol. 34 • no. 1 • 187-213
economic growth in Morocco. Alaya (2006) made the analysis for Morocco, Turkey and Tunisia, finding that economic growth is determined by exports and domestic investments, but there is a significant negative effect of FDI inflow on economic growth.
For Argentina, Brazil and Mexico, Hsiao T. and Hsiao M. (2006) built a panel vector autoregressive model to show a unidirectional relationship between GDP and exports, and a bidirectional relationship between exports and GDP. Panel vector autoregressive models were also estimated by Won et al. (2008) for Asian newly industrializing economies in order to show that inward FDI determined fast economic growth in these countries.
A dynamic panel was employed by Baharumshah and Thanoon (2006) to reflect a positive contribution of FDI on economic growth for East Asian countries. Bhandari et al. (2007) constructed panel GLS models and they explained that an increase in the inflow of FDI positively affects the economic growth in East European countries. For Gulf Cooperation Council (GCC) countries, Faras and Ghali (2009) proposed OLS panel models to justify the weak causal impact of FDI inflows on GDP growth. 45 countries were analyzed by Wijeweera et al. (2010) in the period 1997–2004. Only for highly skilled labour FDI inflows have a positive impact on economic growth.
The panel data approach was used by Darrat et al. (2005) to identify time and country specific effects when studying the relationship between FDI and economic growth in MENA regions and Central and Eastern Europe. In MENA and non-EU accession states the impact of FDI on economic growth is negative or in some cases it does not exist. On the other hand, in EU accession countries the imposed reforms are applied and FDI inflows positively influenced the GDP growth. The huge concentration of FDI in primary sector determined, in general, a negative impact of FDI on economic growth in 14 MENA countries over the period 1980–2003, as Meschi (2006) showed. Nicet-Chenaf and Rougier (2009) analysed the relationship between FDI and economic growth in some MENA countries using a panel data model. FDI did not directly influence economic growth, but they play an important role in economic growth having positive influence on the international integration and the formation of human capital. Tintin (2012) estimated a fixed effects model for 125 countries over 1980–2010 and showed that there are not uniform effects across groups of countries of FDI on economic growth.
A unidirectional causal effect from FDI to GDP rate was observed by Alalaya (2010) for Jordan over 1990–2008. The author applied an ARDL model for co-integration. A relatively high and significant speed of adjustment was computed. A negative impact of FDI on economic growth was obtained by Marc (2011) for seven south Mediterranean countries (Turkey, Jordan, Syria, Algeria, Egypt, Morocco, and Tunisia) in the period 1982–2009 by employing a structural model.
Mihaela Simionescu • The relation between economic growth and foreign direct... Zb. rad. Ekon. fak. Rij. • 2016 • vol. 34 • no. 1 • 187-213 191
There are some studies that showed that the relationship between economic growth and FDI is conditioned by other factors like: small technological gap between local companies and foreign firms (Li and Li (2005)), education level (Lipsey (2000)), trade openness (Balasubramanyam et al., 1996, Fitzová and Žídek, 2015), financial development (Alfaro et al., 2004), export diversification (Nicet-Chenaf and Rougier, 2009) and a stable and efficient institutional and legal environment (Bengoa and Sanchez-Robles, 2003).
Some past researches that investigated the relationship between FDI inflows and GDP growth had some empirical limitations. Many econometric models were built in order to study the effects of FDI on economic growth in developing countries. On the other hand, there are only few researches that analyzed the causality relationship between these variables. Many of these studies employed cointegration techniques using Engle-Granger cointegration test or maximum likelihood test. These cointegration techniques are not suitable for small sets of data. Therefore, Odhiambo (2009) employed the bounds testing cointegration method of Pesaran et al. (2001) that is more robust in case of small sample. Country-specific issues are not revealed by using cross-sectional data (Casselli et al., 1996; Ghirmay et al., 2001). Most of the researches considered longer periods for analyzing the impact of FDI on economic growth in the EU (Angelopoulou and Liargovas, 2014; Blomkvist, 2011).
For the European Union, before the crisis (1989-2008), Angelopoulo and Liargovas (2014) did not find a robust relationship between GDP rate and FDI. On the other hand, the relation was studied after crisis beginning by Dornean and Oanea (2013) who used a regression with a dummy variable for crisis to show a positive influence of FDI on economic growth during 2008–2012. There are few studies in literature that focus on FDI and economic growth causality only after crisis start in the entire European Union.
3. Methodology
More types of econometric models are employed in this research in order to test the hypothesis regarding the relationship between economic growth and FDI in the EU:
– Bayesian random effects models;
– Bayesian linear regression models;
– Panel vector-autoregressive models (panel VAR models).
Bayesian random effects models and panel VAR models are built on panel data. Bayesian linear regression models are constructed on cross-section data. The main advantage of all this models is the fact that they could be used on short

Mihaela Simionescu • The relation between economic growth and foreign direct... 192 Zb. rad. Ekon. fak. Rij. • 2016 • vol. 34 • no. 1 • 187-213
data sets like in the case of this research. There is a small number of years, from 2008 to 2014, and panel data approach or Bayesian time series regressions are recommended. Bayesian linear regression models on time series are more suitable than a traditional linear regression that works under the incidence of law of large number.
In this study, Bayesian random effects models are estimated in two varieties. The baseline model considers that the cross-sectional intercept has a conjugate normal distribution. In the second version, the positive random effects model considers a cross-sectional intercept with exponential prior that leads to a truncated normal posterior.
The model for Bayesian panel data random effect with cross-sectional intercepts has the following form:
Yit = β · Xit + (eit + ui)
eit ~ N(0, s2e)
ui ~ N(0, s2u)
where: Y – dependent variable (nT × 1 vector); X – regressors (nT × k matrix); β – vector of k parameters; ui – individual effects; eit – idiosyncratic error; s2
u – errors’ variances; k – number of parameters; n – number of cross-sections; T – number of time periods; ui is not correlated with Xit.
The estimation algorithm is Gibbs sampler with proper priors, where:
β ~ N(mu, V)
s2e ~ IG(a1, b1)
s2u ~ IG(a2, b2)
So, β follows a normal distribution of average mu and covariance matrix V. The errors’ variances follow an inverse-gamma distribution of parameters a1, b1 and, respectively a2, b2.
All the conditional posteriors take conjugate forms.
The model for Bayesian panel data random effect with positive cross-sectional intercepts has the following form:
Yit = β · Xit + (eit + ui)
eit ~ N(0, s2e)
ui ~ exp(λ)

Mihaela Simionescu • The relation between economic growth and foreign direct... Zb. rad. Ekon. fak. Rij. • 2016 • vol. 34 • no. 1 • 187-213 193
where: Y – dependent variable (nT × 1 vector); X – regressors (nT × k matrix); β – vector of – parameters, ui – individual effects; eit – idiosyncratic error; s2
e – errors’ variance; λ – parameter of exponential distribution; k – number of parameters; n – number of cross-sections; T – number of time periods; ui is not correlated with Xit.
The estimation algorithm is Gibbs sampler with proper priors, where:
β ~ N(mu, V)
s2e ~ IG(a1, b1)
λ ~ IG(a2, b2)
So, β follows a normal distribution of average mu and covariance matrix V. The errors’ variance s2
e follows an inverse-gamma distribution of parameters a1, b1, while λ follows an inverse-gamma distribution of parameters a2, b2.
Conditional posteriors of β, s2e and λ take conjugate forms. Conditional posterior of
latent Ui has truncated normal distribution.
On panel data, a panel VAR model will also be estimated in order to capture the potential effects of past values of the variables on current variables. The general form of a panel vector-autoregressive model is:
yit = ui + Ai( j) · Yi(t – 1) + e'it
Yit = (y1t', y2t', ..., y'nt), contains data for all cross-sections, i = 1, 2, …, n
yit – vector of variables for each cross-section; ui – specific-intercept of cross-section; Ai(L) – lag polynomial including VAR coefficients; e'it – errors (null average, cross-section – specific variance σ2
i); k – number of variables.
If the model has no restrictions, n × k × n coefficients are included in matrix An.
The coefficients in Ai(L) vary randomly across cross-sections under the hypothesis of mean group estimator. The standard element ap
ijm in Ai(L) is: apijm = ap
jm + μpijm,
where p is the lag order of VAR model, p = 1, 2,…, P and i is the cross-section index, j,m = 1, 2, …, K.
The reduced-form of the VAR model is:
yit = u + Ai(L) · yit + e'it
Panel VAR models solve issues regarding macroeconomic policies, because their specific advantages: the capacity to capture both dynamic and static interdependencies, the relationships across units are viewed in an unrestricted manner, the easy inclusion of parameters’ and shocks’ time variations and the inclusion of units’ dynamic heterogeneities.
Mihaela Simionescu • The relation between economic growth and foreign direct... 194 Zb. rad. Ekon. fak. Rij. • 2016 • vol. 34 • no. 1 • 187-213
In this research, a panel VAR model with two variables will be estimated (real GDP rate and FDI) and k will be 2. The number of cross-sections is 28, each country being a cross-section. The time period refers to 2008-2014 (7 years, t = 2008, …, 2014).
Using time series for each country, some Bayesian regressions will be built. For Bayesian linear regression model, the following form is used:
Yt = β · Xt + et
β ~ N(mu, V)
s2e ~ IG(a, b)
Y – dependent variable; X – regressors; β – vector of parameters; eit – error; s2e – errors’
variance; mu, V – parameters of normal distribution; a, b – parameters of inverse-gamma distribution.
Conditional posterior of β follows a normal distribution. Conditional posterior of s2e
follows an inverse-gamma distribution: IG ~n2
a, )2b
b · RSS + 2+( RSS is the sum of
square residuals, n is the number of observations and a andb are the parameters of prior inverse-gamma distribution.
In our research, each variable (GDP rate and FDI) will become by turn dependent variable. Each model will be run for each country on 7 years (period is 2008–2014).
4. Data and empirical analysis
In this study, data refer to real GDP rate and foreign direct investment (FDI) as net inflows (% of GDP) in EU-28 states as destination countries, the foreign capital belonging to the rest of the world. The data series are analysed from the beginning of the recent economic crisis (2008) for the EU-28 countries. Croatia was also included in the analysis, even if it entered EU in 2013, in order to have a complete picture of the phenomenon. The data for GDP rate are provided by Eurostat, while World Bank calculated the FDI as net inflows in the economy over GDP. FDI is composed by: short-run capital, equity capital, earnings reinvestment and other long-run capital. The net inflows are computed by subtracting disinvestment from new investment inflows.
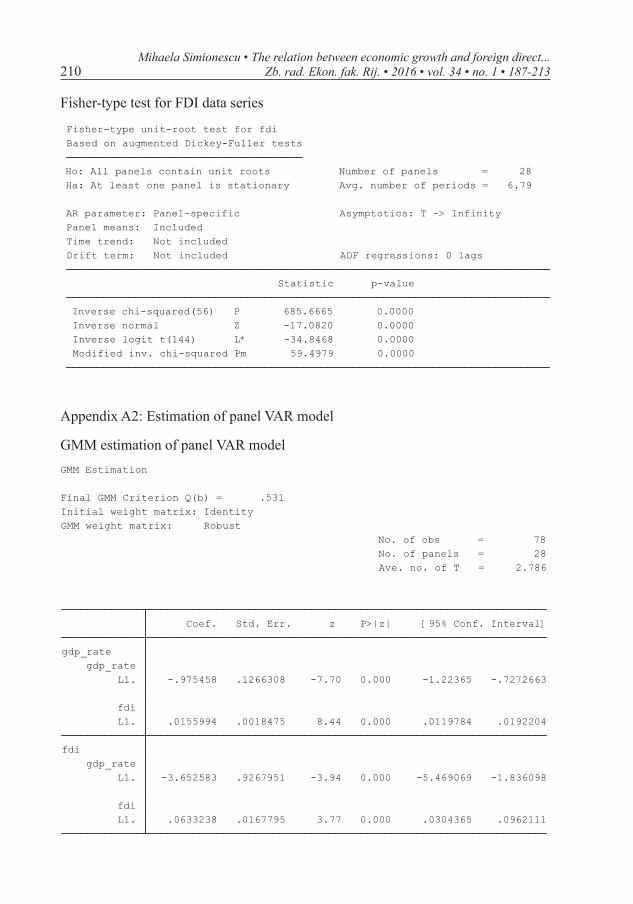
For estimating the panel data models the presence of unit roots in panel data is checked before. According to different versions of Harris-Tzavalis test, the panels are stationary for GDP rate at a significance level of 5%. Moreover, stationary data was detected for FDI (see Appendix A1). A panel VAR model of order 1 (PVAR

Mihaela Simionescu • The relation between economic growth and foreign direct... Zb. rad. Ekon. fak. Rij. • 2016 • vol. 34 • no. 1 • 187-213 195
(1)) was built for EU-28. FDI in the previous had a positive and significant impact on actual economic growth. On the other hand, real GDP rate in the previous negatively influenced the FDI in the current period (Appendix A2).
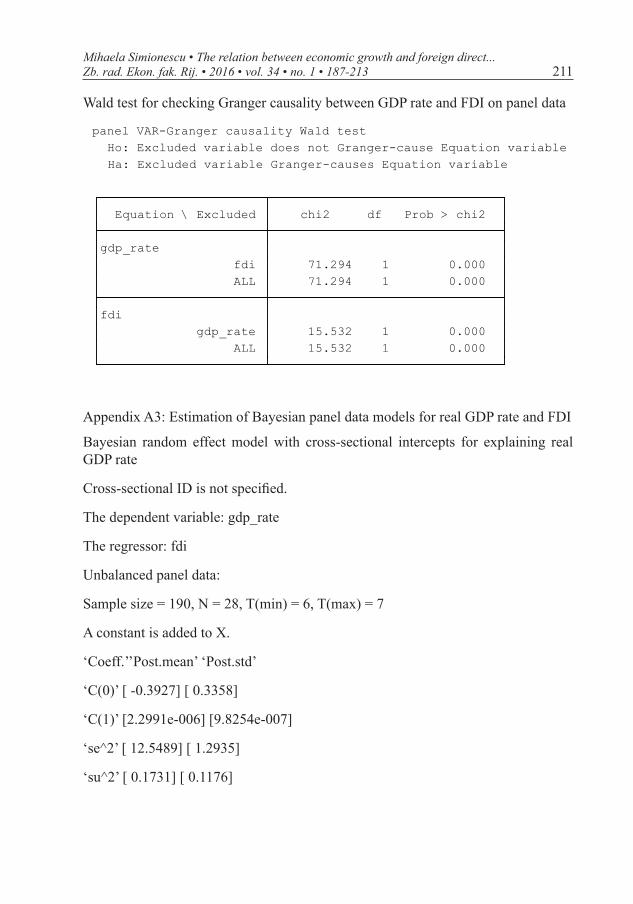
Table 1: Panel VAR Granger causality test
Equation Excluded variables Chi-square Prob.GDP rate FDI 71.294 0.000GDP rate All 71.294 0.000FDI GDP rate 15.532 0.000FDI All 15.532 0.000
Source: Author’s calculation
The Granger causality test on panel data indicated a bi-directional causal relationship between GDP rate and FDI at a significance level of 5%.
Both types of Bayesian random effect models that explain real GDP rate using FDI as explanatory variables indicated that, in average, FDI had a positive and quite slow impact on economic growth in EU-28 in the period 2008-2014 (Appendix A3).
Table 2: Bayesian random effect models for explaining economic growth in EU-28
Parameters Bayesian panel data random effect
with cross-sectional intercepts
Bayesian panel data random effect with positive cross-sectional
intercepts
Posterior mean Posterior standard deviation Posterior mean Posterior standard
deviationConstant -0.3927 0.3358 -0.7489 0.3759β 2.2991e-006 9.8254e-007 2.3034e-006 9.8539e-007s2
e 12.5489 1.2935 12.5927 1.3065s2
u, respectively ë
0.1731 0.1176 0.3651 0.1888
Source: Author’s calculation
According to Bayesian random effect model with cross-sectional intercepts, the economic growth had a positive impact on economic growth in EU-28 in the period 2008-2014. On the other hand, when positive cross-sectional intercepts are considered, FDI had a negative impact on economic growth.

Mihaela Simionescu • The relation between economic growth and foreign direct... 196 Zb. rad. Ekon. fak. Rij. • 2016 • vol. 34 • no. 1 • 187-213
Table 3: Bayesian random effect models for explaining FDI in EU-28
Parameters
Bayesian panel data random effect with cross-sectional intercepts
Bayesian panel data random effect with positive cross-sectional
intercepts
Posterior mean Posterior standard deviation Posterior mean Posterior standard
deviationConstant -0.0118 10.0322 0.0518 9.9985β 0.0301 9.9792 -0.0247 9.9983s2
e 6.5499e+010 7.3858e+009 1.0877e+011 1.1082e+010s2
u, respectively ë
3.5346e+010 1.1917e+010 0.4721 0.3781
Source: Author’s calculation
Moreover, it is important to analyse the relationship between real GDP growth and FDI for each country in EU. The short length of data series imposes the application of Bayesian techniques. Therefore, Bayesian linear regressions will be estimated for each country in order to explain the GDP rate evolution and the FDI evolution after the start of global economic crisis.
The posterior means for the coefficients associated to explanatory variables are computed. Two types of models are estimated: first one explains GDP rate using FDI and the second one considers FDI as dependent variable.
Table 4: Posterior means of the coefficients for explanatory variables in Bayesian linear regressions
Country Posterior mean (dependent variable: real GDP rate)
Posterior mean (dependent variable: FDI)
Belgium 0.0221 2.7563Bulgaria 0.2432 0.8596Czech Republic 0.2750 0.0517Denmark -0.2398 -0.2406Germany 0.9565 0.0682Estonia -1.1686 -0.2192Ireland -0.1501 -0.7047Greece 4.4701 0.1000Spain 0.7852 0.3298France 0.5233 0.1459Croatia 0.0765 0.0655Italy 0.4967 0.0356Cyprus -0.4275 -1.1983Latvia 2.7905 0.2053

Mihaela Simionescu • The relation between economic growth and foreign direct... Zb. rad. Ekon. fak. Rij. • 2016 • vol. 34 • no. 1 • 187-213 197
Table 4 (continuation)
Lithuania 2.7950 0.1243Luxembourg 0.0146 11.3888Hungary 0.0286 1.0309Malta -0.0020 0.6534Netherlands -2.1424e-004 0.0908Austria -0.1411 -0.3898Poland 0.6694 0.9278Portugal -0.5573 -0.2745Romania 0.7435 0.1995Slovenia 2.4833 0.2939Slovakia 0.3781 0.2218Finland 0.5229 0.5521Sweden -0.4189 -0.2560United Kingdom -0.0214 -0.0301
Source: Author’s calculation
The analysis of the Bayesian regression estimations allows the identification of several groups of countries:
- Countries where FDI positively influence economic growth and GDP rate has a positive impact on FDI (Belgium, Bulgaria, Czech Republic, Germany, Greece, Spain, France, Croatia, Italy, Latvia, Lithuania, Luxembourg, Hungary, Poland, Romania, Slovenia, Slovakia, Finland);
- Countries where FDI negatively influence economic growth and GDP rate has a negative impact on FDI (Austria, Denmark, Estonia, Cyprus, Portugal, Sweden, United Kingdom);
- Countries where FDI negatively influence economic growth and GDP rate has a positive impact on FDI (Malta and the Netherlands).
So, in most countries of EU-28 (19 out of 28), FDI is an engine of economic growth and a high GDP rate attracts more FDI.
A cluster analysis was conducted for 2018 and 2014 in order to identify some groups of countries with common characteristics.
Mihaela Simionescu • The relation between economic growth and foreign direct... 198 Zb. rad. Ekon. fak. Rij. • 2016 • vol. 34 • no. 1 • 187-213
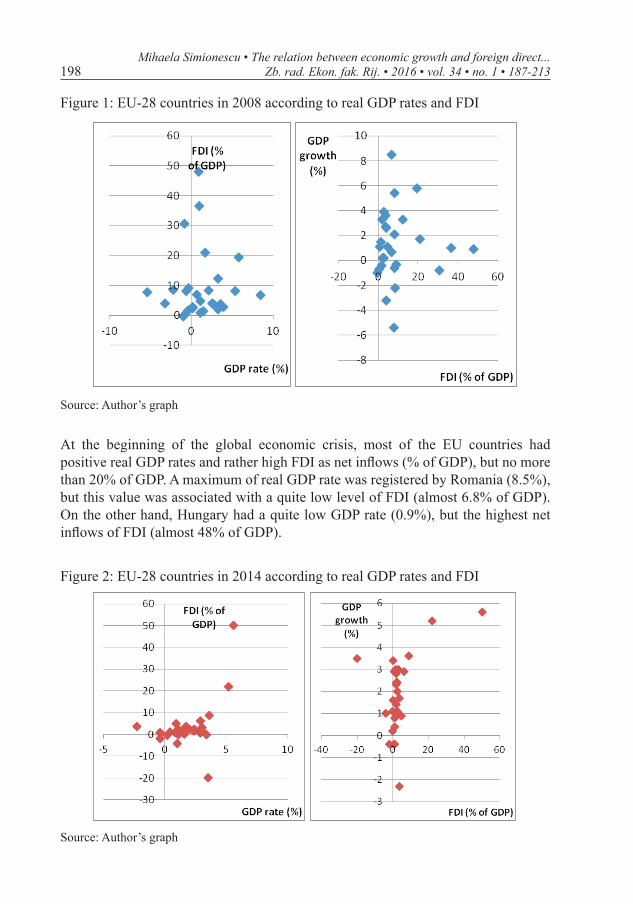
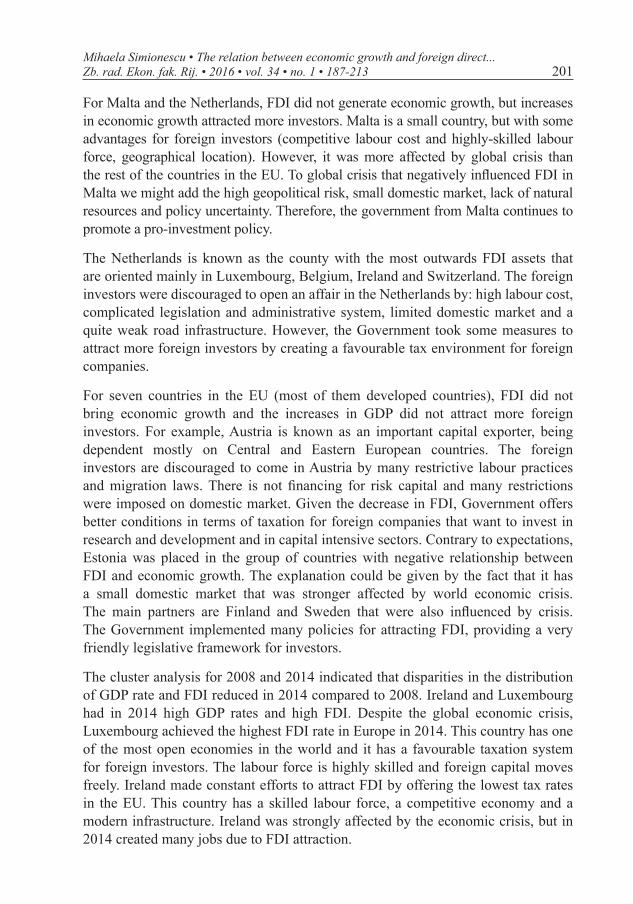
Figure 1: EU-28 countries in 2008 according to real GDP rates and FDI
Source: Author’s graph
At the beginning of the global economic crisis, most of the EU countries had positive real GDP rates and rather high FDI as net inflows (% of GDP), but no more than 20% of GDP. A maximum of real GDP rate was registered by Romania (8.5%), but this value was associated with a quite low level of FDI (almost 6.8% of GDP). On the other hand, Hungary had a quite low GDP rate (0.9%), but the highest net inflows of FDI (almost 48% of GDP).
Figure 2: EU-28 countries in 2014 according to real GDP rates and FDI
Source: Author’s graph

Mihaela Simionescu • The relation between economic growth and foreign direct... Zb. rad. Ekon. fak. Rij. • 2016 • vol. 34 • no. 1 • 187-213 199
In 2014, the disparities between EU-28 countries regarding real GDP rates and FDI diminished. Some outliers can be observed in the above graph. Ireland and Luxembourg registered high GDP rates and high FDI as percent of GDP. On the other hand, Cyprus registered a negative real GDP rate and a low amount of FDI. A quite high economic growth associated with high decrease in FDI was observed for Malta.
Table 5: Clusters of EU-28 countries according to real GDP rates and FDI values
Country 2008 2014Belgium 2 2Bulgaria 2 2Czech Republic 1 2Denmark 1 2Germany 1 2Estonia 1 2Ireland 1 1Greece 1 2Spain 1 2France 1 2Croatia 1 2Italy 1 2Cyprus 1 2Latvia 1 2Lithuania 1 2Luxembourg 2 1Hungary 2 2Malta 1 2Netherlands 2 2Austria 1 2Poland 1 2Portugal 1 2Romania 1 2Slovenia 1 2Slovakia 1 2Finland 1 2Sweden 1 2United Kingdom 1 2
Source: Author’s calculation

Mihaela Simionescu • The relation between economic growth and foreign direct... 200 Zb. rad. Ekon. fak. Rij. • 2016 • vol. 34 • no. 1 • 187-213
Most countries are placed in cluster 1. In the second cluster, there are countries with quite low GDP rates, but high FDI (Belgium, Bulgaria, Luxembourg, Hungary, the Netherlands). While most countries are located in the same cluster in 2014, only Ireland and Luxembourg are placed inside the cluster with high GDP rates and high FDI.
5. Results and discussion
The study of the relationship between FDI and economic growth was conducted at two levels: an overall perspective on the entire EU-28 using panel data approach and an individual analysis for each country based on Bayesian linear regressions and cluster analysis. At aggregate level, there was a positive and bidirectional relationship between GDP rate and FDI in the period from 2008 to 2014. Since 2008, in the context of world crisis, FDI decreased fast, but also the economic growth of the EU countries was negatively affected. Actual FDI had a positive, but very slow impact on actual economic growth in the EU-28 countries during 2008-2014. The global decline brought weak economic performance in EU and other world regions. The financial capabilities of trans-national firms had also diminished. The profit reduction brought less reinvested earnings and more intra-companies loans in developed countries. In 2008, the developing countries did not feel so much the global turmoil as developed ones. The effects of economic crisis on GDP and FDI were observed in developing countries later, starting with 2009 and, in general, the developed countries were more affected by world economic crisis during 2008-2014. On the other hand, the Bayesian panel data models showed that economic growth had also a slow influence on FDI. Moreover, a negative impact of GDP in the previous period on actual FDI was detected by panel VAR model. Indeed, the foreign investors’ decision of investing in a certain country is taken also by analysing if that country registered economic growth in the previous year. In the context of an unstable economic environment the GDP in the previous year might provide a good orientation for foreign investors that tend to be more cautious in periods of world economic crisis.
The individual analysis of the relation FDI-economic growth allowed for a classification of countries in the EU-28. The Bayesian analysis based on time series identified three groups of countries regarding the correlation between the two macroeconomic variables: a positive and reciprocal dependence for 19 countries of the EU, a negative and reciprocal relationship for seven countries in the EU and a specific group with negative relationship from FDI to economic growth and positive influence from GDP rate to FDI.
Except for Malta and the Netherlands, the rest of the EU countries had a positive/negative and reciprocal influence between FDI and real GDI rate during 2008–2014.
Mihaela Simionescu • The relation between economic growth and foreign direct... Zb. rad. Ekon. fak. Rij. • 2016 • vol. 34 • no. 1 • 187-213 201
For Malta and the Netherlands, FDI did not generate economic growth, but increases in economic growth attracted more investors. Malta is a small country, but with some advantages for foreign investors (competitive labour cost and highly-skilled labour force, geographical location). However, it was more affected by global crisis than the rest of the countries in the EU. To global crisis that negatively influenced FDI in Malta we might add the high geopolitical risk, small domestic market, lack of natural resources and policy uncertainty. Therefore, the government from Malta continues to promote a pro-investment policy.
The Netherlands is known as the county with the most outwards FDI assets that are oriented mainly in Luxembourg, Belgium, Ireland and Switzerland. The foreign investors were discouraged to open an affair in the Netherlands by: high labour cost, complicated legislation and administrative system, limited domestic market and a quite weak road infrastructure. However, the Government took some measures to attract more foreign investors by creating a favourable tax environment for foreign companies.
For seven countries in the EU (most of them developed countries), FDI did not bring economic growth and the increases in GDP did not attract more foreign investors. For example, Austria is known as an important capital exporter, being dependent mostly on Central and Eastern European countries. The foreign investors are discouraged to come in Austria by many restrictive labour practices and migration laws. There is not financing for risk capital and many restrictions were imposed on domestic market. Given the decrease in FDI, Government offers better conditions in terms of taxation for foreign companies that want to invest in research and development and in capital intensive sectors. Contrary to expectations, Estonia was placed in the group of countries with negative relationship between FDI and economic growth. The explanation could be given by the fact that it has a small domestic market that was stronger affected by world economic crisis. The main partners are Finland and Sweden that were also influenced by crisis. The Government implemented many policies for attracting FDI, providing a very friendly legislative framework for investors.
The cluster analysis for 2008 and 2014 indicated that disparities in the distribution of GDP rate and FDI reduced in 2014 compared to 2008. Ireland and Luxembourg had in 2014 high GDP rates and high FDI. Despite the global economic crisis, Luxembourg achieved the highest FDI rate in Europe in 2014. This country has one of the most open economies in the world and it has a favourable taxation system for foreign investors. The labour force is highly skilled and foreign capital moves freely. Ireland made constant efforts to attract FDI by offering the lowest tax rates in the EU. This country has a skilled labour force, a competitive economy and a modern infrastructure. Ireland was strongly affected by the economic crisis, but in 2014 created many jobs due to FDI attraction.
Mihaela Simionescu • The relation between economic growth and foreign direct... 202 Zb. rad. Ekon. fak. Rij. • 2016 • vol. 34 • no. 1 • 187-213
In the EU, FDI flows are essential for consolidating the Single Market. Investments from the rest of the countries in the world in the EU will bring a better position of Europe in global markets and the advantage of technology flows.
Since the financial crisis, the FDI attraction from the rest of the countries is a main challenge for the EU. Therefore, the EU policies should direct on the following directions: the extension of the unique market, making more competitive and more open markets in the EU, improving the regulations, ensuring a modern infrastructure.
6. Conclusions
The hypothesis regarding the type of relationship between economic growth and FDI for the EU-28 was tested and the results of panel data analysis stated that there was a reciprocal and positive relationship between FDI and economic growth starting with 2008 in the EU-28. However, time series analysis identified several countries for which FDI did not generate economic growth. The personal contribution in the economic research is giving by the empirical study of the relation between FDI and economic growth on a short period, since the beginning of the world economic crisis. Even if the FDI decrease was observed in the EU in the context of recent economic crisis, few studies in literature focused on the type of relation between the two macroeconomic variables in this specific period. Most of the researches considered longer periods for analyzing the impact of FDI on economic growth in the EU. The short time series used in this research allow the use of specific methods that were not employed yet in literature in analyzing the dependence between FDI and GDP rate. Despite other studies that identified a positive impact of FDI on economic growth, this research showed that higher GDP rates attract more foreign investors in the most EU countries. The limit of the research is given by the fact that for Bayesian linear model on longer data series and for other priors the results might slightly change. On the other hand, the research is limited to the relationship between FDI and economic growth, but other macroeconomic variables might be added. It is possible for some of them to have a higher impact on FDI than GDP growth. It is important to continue this research by adding other variables, like exports and imports, in order to identify more FDI and economic growth determinants. Moreover, this research could be developed by analyzing the FDI-economic growth relationship for the Euro area countries. This analysis is important for developing suitable economic policies for ensuring a higher economic growth by attracting more FDI. For countries where FDI did not generate economic growth, specific policies should be developed to provide a friendly legislative environment and reductions in taxes for foreign investors. However, the EU remains the highest recipient of FDI in the world, but constant efforts should be made to improve its position, mainly in this period of high uncertainties. The EU policies should follow key points like the extension of

Mihaela Simionescu • The relation between economic growth and foreign direct... Zb. rad. Ekon. fak. Rij. • 2016 • vol. 34 • no. 1 • 187-213 203
the single European market, increasing the degree of openness and competitiveness outside and inside the European Union, an attractive tax system and a modern infrastructure in all of the EU countries.
References
Alalaya, M. M. (2010) “ARDL models applied for Jordan trade, FDI and GDP series”, European Journal of Social Sciences, Vol. 13, No. 4, pp. 605–616.
Alfaro, L. et al. (2004) “FDI and economic growth: the role of local financial markets”, Journal of International Economics, Vol. 64, No. 1, pp. 89–112, doi: 10.1016/s0022-1996(03)00081-3.
Angelopoulou, A., Liargovas, P. (2014) “Foreign Direct Investment and Growth: EU, EMU and Transition Economies”, Journal of Economic Integration, Vol. 29, No. 3, pp. 470–495, doi: 10.11130/jei.2014.29.3.470.
Anwar, S., Nguyen, L. P. (2010) “Absorptive capacity, foreign direct investment-linked spillovers and economic growth in Vietnam”, Asian Business & Management, Vol. 9, No. 4, pp. 553–570, doi: 10.1057/abm.2010.28.
Audi, M. (2011) “Is foreign direct investment a cure for economic growth in developing countries? Structural model estimation applied to the case of the south shore Mediterranean countries”, Journal of International Business and Economics, Vol. 11, No. 4, pp. 32–51.
Baharumshah, A., Thanoon, M. (2006) “Foreign capital flows and economic growth in East Asian countries”, China Economic Review, Vol. 17, No. 1, pp. 70–83, doi: 10.1016/j.chieco.2005.09.001.
Balasubramanyam, V. N., Salisu, M. A., Sapsford, D. (1996) “Foreign direct investment and growth in EP and IS countries”, Economic Journal, Vol. 106, No. 434, pp. 92–105, doi: 10.2307/2234933.
Bengoa, M., Sanchez-Robles, B. (2003) “FDI, economic freedom and growth: new evidence from Latin America”, European Journal of Political Economy, Vol. 19, No. 3, pp. 529–545, doi: 10.1016/s0176-2680(03)00011-9.
Bhandari, R. et al. (2007) “Foreign Aid, FDI and Economic Growth in East European Countries”, Economics Bulletin, Vol. 6, No. 13, pp. 1–9.
Blomkvist, K. (2011) “The impact of a common EU FDI approach on individual member states and overall EU competitiveness”. In Proceedings of the 13th Annual SNEE European Integration Conference, 17-20 May, Grand Hotel, Mölle, Sweden: SNEE Press, pp. 2–22.
Carkovic, M., Levine, R. (2002) Does foreign direct investment accelerate economic growth? In Does Foreign Direct Investment Promote Development? (Eds.) T. Moran, E. Graham and M. Blomstrom, Washington, DC, pp. 195–220.
Mihaela Simionescu • The relation between economic growth and foreign direct... 204 Zb. rad. Ekon. fak. Rij. • 2016 • vol. 34 • no. 1 • 187-213
Casselli, F., Esquivel, G., Lefort, F. (1996) “Reopening the convergence debate: a new look at cross-country growth empirics”, Journal of Economic Growth, Vol. 1, No. 3, pp. 363–389, doi: 10.1007/bf00141044.
Chakraborty, C., Basu, P. (2002) “Foreign direct investment and growth in India: a cointegration approach”, Applied Economics, Vol. 34, No. 9, pp. 1061–1073, doi: 10.1080/00036840110074079.
Choi, C. (2004) “Foreign direct investment and income convergence”, Applied Economics, Vol. 36, No. 10, pp. 1045–1049, doi: 10.1080/0003684042000246759.
Cichy J., Gradoń W. (2016) “Innovative economy, and the activity of financial market institutions. Case of Poland”, Journal of International Studies, Vol. 9, No 1, pp. 156–166.
Clowes, D., Bilan, Y. (2014) “Tracking income per head in central-southern Europe: Country responses to the global downturn (2008–2012)”, Economic Computation and Economic Cybernetics Studies and Research, Vol. 48, No. 2, pp. 1–14.
Dornean, A., Oanea, D. C. (2013) “Foreign direct investment and post crisis economic growth. Evidence from European Union”, Revista Economica, Vol. 65, No. 6, pp. 46–60.
Faras, R., Ghali, K. (2009) “Foreign Direct Investment and Economic Growth: The Case of the GCC Countries”, International Research Journal of Finance and Economics, Vol. 29, No. 1, pp. 134–145.
Fidrmuc, J., Kostagianni, S. (2015) “Impact of IMF Assistance on Economic Growth Revisited”, Economics & Sociology, Vol. 8, No. 3, pp. 32–40, doi: 10.14254/2071-789x.2015/8-3/2.
Fitzová, H., Žídek, L. (2015) “Impact of Trade on Economic Growth in the Czech and Slovak Republics”, Economics & Sociology, Vol. 8, No. 2, pp. 36–50, doi: 10.14254/2071-789x.2015/8-2/4.
Ghirmay, T., Grabowski, R., Sharma, S. C. (2001) “Exports, investment, efficiency and economic growth in LDCs: an empirical investigation”, Applied Economics, Vol. 33, No. 6, pp. 689–700, doi: 10.1080/00036840122027.
Hsiao, F., Hsiao, M. C. (2006) “FDI, exports, and GDP in East and Southeast Asia – Panel data versus time-series causality analyses”, Journal of Asian Economics, Vol. 17, No. 6, pp. 1082–1106, doi: 10.1016/j.asieco.2006.09.011.
Karbasi, A., Mahamadi, E., Ghofrani, S. (2005) “Impact of foreign direct investment on economic growth”. In Proceedings of the 12th Economic Research Forum’s Annual Conference, 19–21 December, Cairo, Egypt: ERF, pp. 15–28.
Kherfi, S., Soliman, M. (2005) “FDI And Economic Growth In CEE And MENA Countries: A Tale Of Two Regions”, International Business & Economics Research Journal, Vol. 4, No. 12, pp. 113–120, doi: http://dx.doi.org/10.19030/iber.v4i12.3649.
Mihaela Simionescu • The relation between economic growth and foreign direct... Zb. rad. Ekon. fak. Rij. • 2016 • vol. 34 • no. 1 • 187-213 205
Lechman, E., Kaur, H. (2015) “Economic growth and female labor force participation – verifying the U-feminization hypothesis. New evidence for 162 countries over the period 1990-2012”, Economics & Sociology, Vol. 8, No. 1, pp. 246–257, doi: 10.14254/2071-789x.2015/8-1/19.
Li, X., Liu, X. (2005) “Foreign direct investment and economic growth: an increasingly endogenous relationship”, World Development, Vol. 93, No. 3, pp. 393–407, doi: 10.1016/j.worlddev.2004.11.001.
Meschi, E. (2006) “FDI and growth in MENA countries: an empirical analysis”. In Proceedings of the Fifth International Conference of the Middle East Economic Association, 10–12 March, Sousse, Tunisia: MEEA, pp. 100–112.
Neuhaus, M. (2006) The impact of FDI on economic growth: an analysis for the transition countries of Central and Eastern Europe, Berlin: Springer Science & Business Media.
Nicet-Chenaf, D., Rougier, E. (2009) “FDI and growth: A new look at a still puzzling issue”, Groupe de Recherche en Economie Théorique et Appliquée, Vol. 5113, No. 2009–13, pp. 1–26.
Nunnenkamp, P., Spatz, J. (2003) “Foreign direct investment and economic growth in developing countries: how relevant are host-country and industry characteristics?”, KielerArbeitspapiere, No. 1176, pp. 1–44, doi: 10.2139/ssrn. 425260.
Odhiambo, N. M. (2009) “Energy consumption and economic growth in Tanzania: an ARDL bounds testing approach”, Energy Policy, Vol. 37, No. 2, pp. 617–622, doi: 10.1016/j.enpol.2008.09.077.
Pesaran, M. H., Shin, Y., Smith, R. J. (2001) “Bounds testing approaches to the analysis of level relationship”, Journal of Applied Economics, Vol. 16, No. 3, pp. 289–326, doi: 10.1002/jae.616.
Poulsen, L. S., Hufbauer, G. C. (2013) “Foreign direct investment in times of crisis”, Transnational Corporations, Vol. 20, No. 1, pp. 19–37, doi: 10.18356/138883a0-en.
Solow, R. (1957) “Technical change and the aggregate production function”, Review of Economics and Statistics, Vol. 39, No. 3, pp. 312–320, doi: 10.2307/1926047.
Tintin, C. (2012) “Does foreign direct invest spur economic growth and development? A comparative study”. In Proceedings of the 14th Annual European Trade Study Group Conference, 13–15 September, Leuven, Belgium: TSG Press, pp. 3–53.
Ucal, M. et al. (2010) “Relationship between financial crisis and foreign direct investment in developing countries using semi-parametric regression approach”, Journal of Business Economics and Management, Vol. 11, No. 1, pp. 20–33, doi: 10.3846/jbem.2010.02.
Wijeweera, A., Villano, R., Dollery, B. (2010) “Economic Growth and FDI Inflows: A Stochastic Frontier Analysis”, The Journal of Developing Areas, Vol. 43, No. 2, pp. 143–158, doi: 10.1353/jda.0.0059.

Mihaela Simionescu • The relation between economic growth and foreign direct... 206 Zb. rad. Ekon. fak. Rij. • 2016 • vol. 34 • no. 1 • 187-213
Odnos između ekonomskog rasta i izravnih stranih investicija u vrijeme ekonomske krize u Europskoj uniji
Mihaela Simionescu1
Sažetak
Cilj ovog istraživanja je ispitati odnos između ekonomskog rasta i priljeva izravnih stranih investicija (ISI) u Europskoj uniji (EU-28) u razdoblju nedavne gospodarske krize. Panel analize podataka i Bayesove tehnike koriste se za rješavanje problema malog skupa podataka (u razdoblju između 2008. i 2014.). Panel analize podataka (panel vektorski auto-regresijski model i Bayesovi modeli slučajnih učinaka) potvrđuju recipročno pozitivan odnos između ISI-a i gospodarskog rasta u EU-28, počevši s 2008. godinom. Individualni pristup temeljen na Bayesovoj linearnoj regresiji ukazuje na tu tendenciju specifičnu za većinu zemalja EU-28. Međutim, u nekim zemljama viši ISI nije generirao gospodarski rast, u nekim zemljama viši BDP nije privukao veća izravna ulaganja, kao što u nekim zemljama veći ISI nije donio veći gospodarski rast. Prema klaster analizi, u 2014. godini u usporedbi s 2008. godinom smanjena je nejednakost među zemljama u svezi raspodijele ISI-a u odnosu na stopu rasta BDP-a i stopa raspodjele BDP-a u odnosu na ISI. Iz navedenog proizlazi temeljni zaključak da je u Europskoj uniji sveukupan odnos recipročan između gospodarskog rasta i privlačenja izravnih stranih investicija.
Ključne riječi: ekonomski rast, izravna strana investicija, panel podaci, Bayesov model, kriza
JEL klasifikacija: C51, C53, F21
1 Doktorica ekonomske kibernetike i statistike, docentica, znanstvena istraživačica, Romanian Academy, Institute for Economic Forecasting, Bukurešt, Calea 13 Septembrie, No. 13, District 5, 050711 Bukurešt, Rumunjska. Znanstveni interes: statistika, ekonometrija. Tel.: +402 13 188 148. E-mail: [email protected].

Mihaela Simionescu • The relation between economic growth and foreign direct... Zb. rad. Ekon. fak. Rij. • 2016 • vol. 34 • no. 1 • 187-213 207
Appendices


Mihaela Simionescu • The relation between economic growth and foreign direct... Zb. rad. Ekon. fak. Rij. • 2016 • vol. 34 • no. 1 • 187-213 209
Appendix A1: Unit root tests on panel data
Harris-Tzavalis test for real GDP rate data series (no time trend for the test)
rho -0.0319 -9.3341 0.0000 Statistic z p-value Time trend: Not includedPanel means: Included T FixedAR parameter: Common Asymptotics: N -> Infinity
Ha: Panels are stationary Number of periods = 7Ho: Panels contain unit roots Number of panels = 28 Harris-Tzavalis unit-root test for gdp_rate
Harris-Tzavalis test for real GDP rate data series (with time trend for the test)
rho -0.3256 -5.7897 0.0000 Statistic z p-value Time trend: IncludedPanel means: Included T FixedAR parameter: Common Asymptotics: N -> Infinity
Ha: Panels are stationary Number of periods = 7Ho: Panels contain unit roots Number of panels = 28 Harris-Tzavalis unit-root test for gdp_rate
. xtunitroot ht gdp_rate, trend
Harris-Tzavalis test for FDI data series (without time trend for the test)
rho 0.4835 -10.5861 0.0000 Statistic z p-value Small-sample adjustment to T appliedTime trend: Not included Cross-sectional means removedPanel means: Not included T FixedAR parameter: Common Asymptotics: N -> Infinity
Ha: Panels are stationary Number of periods = 7Ho: Panels contain unit roots Number of panels = 28 Harris-Tzavalis unit-root test for gdp_rate
Mihaela Simionescu • The relation between economic growth and foreign direct... 210 Zb. rad. Ekon. fak. Rij. • 2016 • vol. 34 • no. 1 • 187-213
Fisher-type test for FDI data series
Modified inv. chi-squared Pm 59.4979 0.0000 Inverse logit t(144) L* -34.8468 0.0000 Inverse normal Z -17.0820 0.0000 Inverse chi-squared(56) P 685.6665 0.0000 Statistic p-value Drift term: Not included ADF regressions: 0 lagsTime trend: Not includedPanel means: IncludedAR parameter: Panel-specific Asymptotics: T -> Infinity
Ha: At least one panel is stationary Avg. number of periods = 6.79Ho: All panels contain unit roots Number of panels = 28 Based on augmented Dickey-Fuller testsFisher-type unit-root test for fdi
Appendix A2: Estimation of panel VAR model
GMM estimation of panel VAR model
L1. .0633238 .0167795 3.77 0.000 .0304365 .0962111 fdi L1. -3.652583 .9267951 -3.94 0.000 -5.469069 -1.836098 gdp_rate fdi L1. .0155994 .0018475 8.44 0.000 .0119784 .0192204 fdi L1. -.975458 .1266308 -7.70 0.000 -1.22365 -.7272663 gdp_rate gdp_rate Coef. Std. Err. z P>|z| [95% Conf. Interval]
Ave. no. of T = 2.786 No. of panels = 28 No. of obs = 78GMM weight matrix: RobustInitial weight matrix: IdentityFinal GMM Criterion Q(b) = .531
GMM Estimation
Mihaela Simionescu • The relation between economic growth and foreign direct... Zb. rad. Ekon. fak. Rij. • 2016 • vol. 34 • no. 1 • 187-213 211
Wald test for checking Granger causality between GDP rate and FDI on panel data
ALL 15.532 1 0.000 gdp_rate 15.532 1 0.000 fdi ALL 71.294 1 0.000 fdi 71.294 1 0.000 gdp_rate Equation \ Excluded chi2 df Prob > chi2
Ha: Excluded variable Granger-causes Equation variable Ho: Excluded variable does not Granger-cause Equation variable panel VAR-Granger causality Wald test
Appendix A3: Estimation of Bayesian panel data models for real GDP rate and FDI
Bayesian random effect model with cross-sectional intercepts for explaining real GDP rate
Cross-sectional ID is not specified.
The dependent variable: gdp_rate
The regressor: fdi
Unbalanced panel data:
Sample size = 190, N = 28, T(min) = 6, T(max) = 7
A constant is added to X.
‘Coeff.’’Post.mean’ ‘Post.std’
‘C(0)’ [ -0.3927] [ 0.3358]
‘C(1)’ [2.2991e-006] [9.8254e-007]
‘se^2’ [ 12.5489] [ 1.2935]
‘su^2’ [ 0.1731] [ 0.1176]
Mihaela Simionescu • The relation between economic growth and foreign direct... 212 Zb. rad. Ekon. fak. Rij. • 2016 • vol. 34 • no. 1 • 187-213
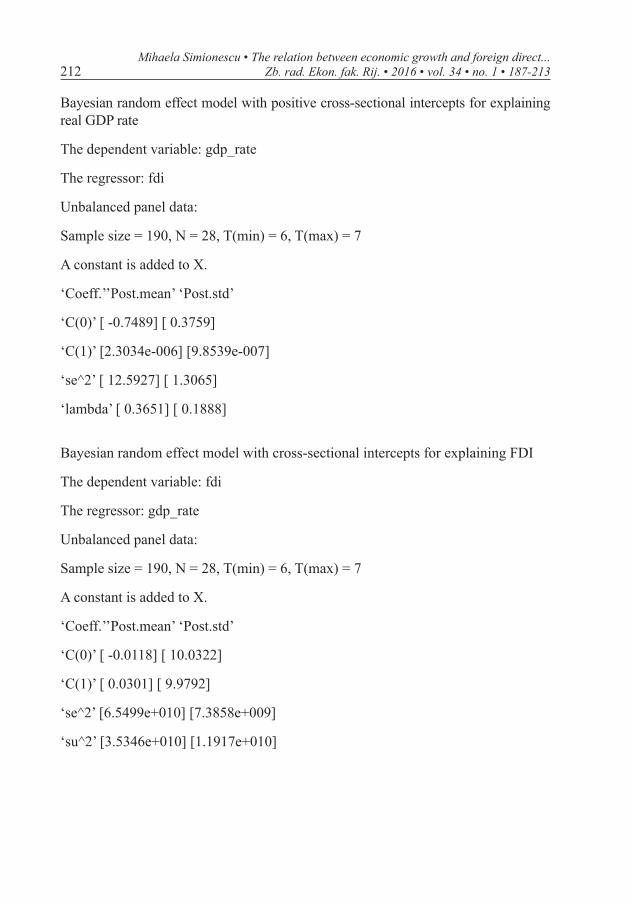
Bayesian random effect model with positive cross-sectional intercepts for explaining real GDP rate
The dependent variable: gdp_rate
The regressor: fdi
Unbalanced panel data:
Sample size = 190, N = 28, T(min) = 6, T(max) = 7
A constant is added to X.
‘Coeff.’’Post.mean’ ‘Post.std’
‘C(0)’ [ -0.7489] [ 0.3759]
‘C(1)’ [2.3034e-006] [9.8539e-007]
‘se^2’ [ 12.5927] [ 1.3065]
‘lambda’ [ 0.3651] [ 0.1888]
Bayesian random effect model with cross-sectional intercepts for explaining FDI
The dependent variable: fdi
The regressor: gdp_rate
Unbalanced panel data:
Sample size = 190, N = 28, T(min) = 6, T(max) = 7
A constant is added to X.
‘Coeff.’’Post.mean’ ‘Post.std’
‘C(0)’ [ -0.0118] [ 10.0322]
‘C(1)’ [ 0.0301] [ 9.9792]
‘se^2’ [6.5499e+010] [7.3858e+009]
‘su^2’ [3.5346e+010] [1.1917e+010]
Mihaela Simionescu • The relation between economic growth and foreign direct... Zb. rad. Ekon. fak. Rij. • 2016 • vol. 34 • no. 1 • 187-213 213
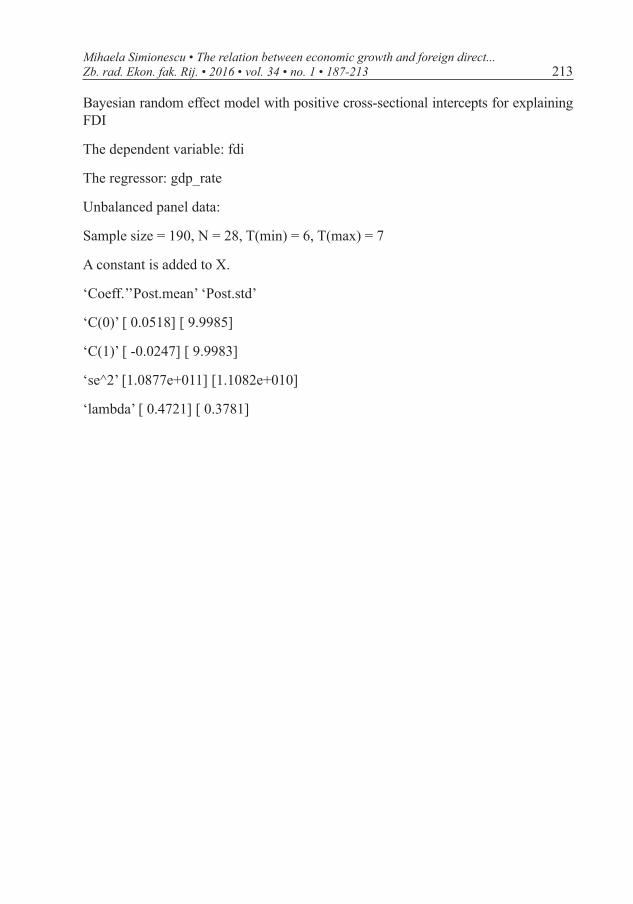
Bayesian random effect model with positive cross-sectional intercepts for explaining FDI
The dependent variable: fdi
The regressor: gdp_rate
Unbalanced panel data:
Sample size = 190, N = 28, T(min) = 6, T(max) = 7
A constant is added to X.
‘Coeff.’’Post.mean’ ‘Post.std’
‘C(0)’ [ 0.0518] [ 9.9985]
‘C(1)’ [ -0.0247] [ 9.9983]
‘se^2’ [1.0877e+011] [1.1082e+010]
‘lambda’ [ 0.4721] [ 0.3781]