the regulation of skeletal muscle mass and mitochondrial
TRANSCRIPT

University of South CarolinaScholar Commons
Theses and Dissertations
2014
The Regulation of Skeletal Muscle Mass andMitochondrial Biogenesis by gp130/STAT3Signaling during Cancer CachexiaMelissa PuppaUniversity of South Carolina - Columbia
Follow this and additional works at: https://scholarcommons.sc.edu/etd
Part of the Sports Sciences Commons
This Open Access Dissertation is brought to you by Scholar Commons. It has been accepted for inclusion in Theses and Dissertations by an authorizedadministrator of Scholar Commons. For more information, please contact [email protected].
Recommended CitationPuppa, M.(2014). The Regulation of Skeletal Muscle Mass and Mitochondrial Biogenesis by gp130/STAT3 Signaling during CancerCachexia. (Doctoral dissertation). Retrieved from https://scholarcommons.sc.edu/etd/2720

THE REGULATION OF SKELETAL MUSCLE MASS AND MITOCHONDRIAL
BIOGENESIS BY GP130/STAT3 SIGNALING DURING CANCER CACHEXIA
by
Melissa Puppa
Bachelor of Science
Roanoke College, 2008
Submitted in Partial Fulfillment of the Requirements
For the Degree of Doctor of Philosophy in
Exercise Science
Norman J. Arnold School of Public Health
University of South Carolina
2013
Accepted by:
James Carson, Major Professor
Angela Murphy, Committee Member
Greg Hand, Committee Member
Raja Fayad, Committee Member
Lacy Ford, Vice Provost and Dean of Graduate Studies

ii
© Copyright by Melissa Puppa, 2013
All Rights Reserved.

iii
DEDICATION
This dissertation is dedicated in loving memory of Robin Cameron.

iv
ACKNOWLEDGEMENTS
I need to first thank my husband Benjamin without whom I may not have finished
this degree. I would like to extend a special thank you to my parents Robert and Elaine
for their inspiration and always knowing what to say, even if I didn’t want to hear it. I
would like to thank Dr. James Carson whose patience and guidance have helped me
achieve more than I could have imagined. I would like to thank my dissertation
committee members Dr. Greg Hand, Dr. Angela Murphy, and Dr. Raja Fayad who have
given their time and expertise to better my work. I thank them for their contribution and
their good-natured support. I would like to thank the members both past and present of
the IMB lab who have assisted me throughout my time: James White, Shu Sato, Kandy
Velazquez, Aditi Narsale, Song Gao, Justin Hardee, Kimbell Hetzler, Sonia Thomas,
Johannes Aartun, Josh Mangum, and Dennis Fix and any not specifically mentioned here.
I would like to thank my coaches and family at CFR and CCF for their unfailing love and
support.
Funding for this dissertation was primarily provided by Dr. James Carson and the IMB
Laboratory: NIH Grant 1 R01 CA121249-01.

v
ABSTRACT
Cachexia affects nearly 70% of all cancer patients depending on the cancer, and
decreases cancer survival. Cachexia is associated with muscle mass loss that is
accompanied by a loss in muscle oxidative capacity, a decrease in protein synthesis and
an increase in protein degradation. While progress has been made in understanding some
of the mechanisms underlying the cachectic condition, there are currently no approved
pharmaceutical interventions to slow or stop cachexia progression. The purpose this study
was to determine the role of skeletal muscle gp130 and STAT3 signaling in the regulation
of cachexia induced muscle atrophy and mitochondrial loss. Specific aim 1 examined the
regulation of cachexia-induced mitochondrial loss by IL-6 trans signaling, systemic
STAT3 signaling and muscle specific gp130 signaling. Inhibition of systemic
inflammatory signaling attenuated muscle and body weight loss; while, muscle gp130
inhibition did not. Inhibition of inflammatory signaling at all levels attenuated skeletal
muscle mitochondrial loss and while systemic STAT3 and muscle gp130 inhibition
relieved cachexia-suppression of mitochondrial fusion, only inhibition of trans IL-6
signaling blocked cachexia-induction of mitochondrial fission protein. Specific aim 2
examined the regulation of muscle protein turnover by skeletal muscle gp130/STAT3
during cancer cachexia. Inhibition of muscle gp130 attenuated muscle loss during LLC-
induced cachexia. This was associated with suppression of protein degradation pathways
without relieving the inhibition of muscle protein synthesis. The third specific aim was to

vi
determine if acute contraction could activate mitochondrial biogenesis in severely
cachectic muscle. Contraction alone was unable to up regulate muscle mTOR signaling
and mitochondrial proteins in cachectic muscle; however, STAT/NFκB inhibition
relieved cachexia-suppression of contraction-induced mTOR signaling and up-regulated
markers of mitochondrial biogenesis. In summary, inflammatory signaling through
STAT3 and muscle gp130 regulate the suppression mitochondrial content and the
induction of muscle protein degradation; however, it does not mediate the cachexia
suppression of muscle protein synthesis. These findings provide insight of potential
targets for pharmacological therapies for the treatment of cancer cachexia. Additionally,
combination therapies involving inflammation inhibition with exercise may be most
beneficial for the treatment of cancer cachexia.

vii
TABLE OF CONTENTS
DEDICATION ................................................................................................................... iii
ACKNOWLEDGEMENTS .................................................................................................... iv
ABSTRACT ....................................................................................................................... v
LIST OF TABLES ............................................................................................................... x
LIST OF FIGURES ............................................................................................................. xi
LIST OF ABBREVIATIONS ............................................................................................... xiii
CHAPTER 1: INTRODUCTION ............................................................................................ 1
CHAPTER 2: REVIEW OF LITERATURE ................................................................................ 8
2.1 CACHEXIA ......................................................................................................... 9
2.2 MODELS OF CACHEXIA .................................................................................... 10
2.3 INFLAMMATION ............................................................................................... 16
2.4 SKELETAL MUSCLE MITOCHONDRIA ................................................................ 22
2.5 CACHEXIA AND MITOCHONDRIAL LOSS ........................................................... 25
2.6 PROTEIN TURNOVER ........................................................................................ 27
2.7 A ROLE FOR EXERCISE WITH CACHEXIA ........................................................... 30
2.8 CONCLUSION ................................................................................................... 36
CHAPTER 3: THE ROLE OF SYSTEMIC AND MUSCLE IL-6 SIGNALING ON MITOCHONDRIAL
LOSS DURING THE PROGRESSION OF CANCER CACHEXIA IN THE APCMIN/+ MOUSE ......... 38
3.1 ABSTRACT ...................................................................................................... 39
3.2 INTRODUCTION ................................................................................................ 40
viii
3.3 METHODS ....................................................................................................... 43
3.4 RESULTS ......................................................................................................... 47
3.5 DISCUSSION .................................................................................................... 51
3.6 FIGURE LEGEND .............................................................................................. 57
CHAPTER 4: THE ROLE OF PYRROLIDINE DITHIOCARBAMATE ON THE REGULATION OF
SKELETAL MUSCLE MASS DURING CANCER-INDUCED CACHEXIA ....................................... 64
4.1 ABSTRACT ...................................................................................................... 65
4.2 INTRODUCTION ................................................................................................ 66
4.3 METHODS ....................................................................................................... 69
4.4 RESULTS ......................................................................................................... 73
4.5 DISCUSSION .................................................................................................... 76
4.6 FIGURE LEGEND .............................................................................................. 81
CHAPTER 5: SKELETAL MUSCLE GLYCOPROTEIN 130’S ROLE IN LEWIS LUNG CARCINOMA
INDUCED CACHEXIA ....................................................................................................... 91
5.1 ABSTRACT ...................................................................................................... 92
5.2 INTRODUCTION ................................................................................................ 93
5.3 METHODS ....................................................................................................... 96
5.4 RESULTS ....................................................................................................... 100
5.5 DISCUSSION .................................................................................................. 106
5.6 FIGURE LEGEND ............................................................................................ 115
CHAPTER 6: CACHECTIC SKELETAL MUSCLE RESPONSE TO A NOVEL BOUT OF LOW
FREQUENCY STIMULATION ........................................................................................... 142
6.1 ABSTRACT .................................................................................................... 143
6.2 INTRODUCTION .............................................................................................. 144
6.3 METHODS ..................................................................................................... 147

ix
6.4 RESULTS ....................................................................................................... 151
6.5 DISCUSSION .................................................................................................. 156
6.6 FIGURE LEGEND ............................................................................................ 164
CHAPTER 7: OVERALL DISCUSSION ............................................................................... 177
REFERENCES ................................................................................................................ 188
APPENDIX A – SUPPLEMENTAL DATA ........................................................................... 211
APPENDIX B – DETAILED METHODS ............................................................................. 220
APPENDIX C – PROPOSAL ............................................................................................. 249
APPENDIX D – RAW DATA ............................................................................................ 287
APPENDIX E – PERMISSIONS TO REPRINT ...................................................................... 343

x
LIST OF TABLES
Table 2.1 Characterization of rodent models of cancer cachexia .................................... 16
Table 3.1 The effect of trans IL-6 and muscle gp130 inhibition on cachexia
development ................................................................................................................. 56
Table 4.1 effect of pyrrolidine dithiocarbamate on cachexia development in ApcMin/+
mice .............................................................................................................................. 81
Table 5.1 Changes in body weight, fat mass, and muscle mass with LLC-induced
cachexia ...................................................................................................................... 113
Table 5.2 Body weight, fat mass, and muscle mass in LLC induced cachexia with acute
IL-6r Ab or PDTC administration ................................................................................ 114
Table 6.1 Cachexia in ApcMin/+
(Min) mice is associated with muscle mass loss .......... 162
Table 6.2 Grip strength in the Min mouse is decreased during severe cachexia ............ 163
Table 7.1 Summary of gp130/STAT3 regulation of muscle mass during cachexia ....... 186

xi
LIST OF FIGURES
Figure 1.1 Working model ............................................................................................... 7
Figure 3.1 The effect of trans IL-6 and muscle gp130 inhibition on the development of
cachexia ....................................................................................................................... 58
Figure 3.2 The effect of trans IL-6 and muscle gp130 inhibition on signaling regulating
muscle mass .................................................................................................................. 60
Figure 3.3 The effect of trans IL-6 and muscle gp130 inhibition on mitochondrial
biogenesis and dynamics during cancer cachexia ........................................................... 61
Figure 3.4 The effect of trans IL-6 and muscle gp130 inhibition on mitochondrial content
during cancer cachexia .................................................................................................. 63
Figure 4.1 Effect of pyrrolidine dithiocarbamate on the progression of cachexia in
ApcMin/+
(Min) mice ...................................................................................................... 84
Figure 4.2 Effect of pyrrolidine dithiocarbamate on cachexia-induced muscle
inflammatory signaling .................................................................................................. 85
Figure 4.3 Effect of pyrrolidine dithiocarbamate on the regulation of muscle protein
turnover ......................................................................................................................... 86
Figure 4.4 Effect of pyrrolidine dithiocarbamate on muscle mitochondrial content ........ 88
Figure 4.5 Effect of pyrrolidine dithiocarbamate on the regulation of muscle
mitochondria ................................................................................................................. 90
Figure 5.1 Mouse tissue expression of gp130 ............................................................... 119
Figure 5.2 The effect of skm-gp130 on development of cancer induced cachexia ........ 121

xii
Figure 5.3 The effect of skm-gp130 on LLC induced signaling.................................... 123
Figure 5.4 The effect of LLC conditioned media on Myosin Heavy Chain levels, STAT3
signaling and protein turnover regulation in C2C12 myotubes ..................................... 128
Figure 5.5 The effect of IL-6 inhibition of LLC induced signaling ............................... 131
Figure 5.6 The effect of gp130/STAT signaling inhibition on LLC induced signaling .. 136
Figure 6.1 Cage activity during severe cachexia .......................................................... 167
Figure 6.2 Metabolic gene response to a novel bout of low frequency stimulated
contraction .................................................................................................................. 168
Figure 6.3 Expression of PGC-1α targets in response to a novel bout of low frequency
stimulated contraction ................................................................................................. 170
Figure 6.4 LoFS regulation of protein expression ........................................................ 171
Figure 6.5 Effects of pyrrolidine dithiocarbamate on cachectic muscle response to
LoFS .......................................................................................................................... 173
Figure 6.6 LoFS mediated regulators of mTOR ........................................................... 175
Figure A.1 Effect of inflammation inhibition on the regulation of muscle oxidative
capacity in LLC-induced cachexia ............................................................................... 214
Figure A.2 Effect of skm-gp130 inhibition on mitochondrial content in LLC-induced
cachexia ...................................................................................................................... 215
Figure A.3 Effects of LLL12 on LLC-induced muscle signaling .................................. 216
Figure A.4 Effect of skm-gp130 inhibition on LoFS induced PGC-1α and GLUT4 mRNA
in LLC-induced cachexia ............................................................................................. 217
Figure A.5 Effect of skm-gp130 inhibition on LoFS induced PGC-1α targets in LLC-
induced cachexia ......................................................................................................... 218

xiii
LIST OF ABBREVIATIONS
AH-130 ....................................................................... Yoshida ascites hepatoma AH 130
AKT ....................................................................................................... Protein Kinase B
AMP ....................................................................................... Adenosine monophosphate
AMPK ................................................................................ AMP-activated protein kinase
Apc ...................................................................................... Adenomatous polyposis coli
ATP ............................................................................................ Adenosine triphosphate
BL-6....................................................................................................................C57BL/6
BW .............................................................................................................. Body Weight
C/EBPβ ................................................................. CCAAT/enhancer binding protein beta
C-26 ...................................................................................... C-26 colon adenocarcinoma
CNTF ..................................................................................... Ciliary Neurotrophic Factor
Con ....................................................................................................................... Control
COPD ................................................................... Chronic obstructive pulmonary disease
Cre .......................................................................................................... Cre recombinase
DNA .............................................................................................. Deoxyribonucleic acid
DRP-1 ...................................................................................... Dynamin-related protein 1
EDL ......................................................................................... extensor digitorum longus
ELISA ..................................................................... Enzyme-linked immunosorbent assay
ERK ......................................................................... Extracellular signal-regulated kinase
FIS1 .................................................................................. Mitochondrial fission protein 1

xiv
FNIII ................................................................................................... Fibronectin type III
FOXO .................................................................................. forkhead transcription factor
GAPDH ........................................................ Glyceraldehyde 3-phosphate dehydrogenase
Gas ............................................................................................................. Gastrocnemius
GLUT4............................................................................................. Glucose transporter 4
gp130 ....................................................................................... Glycoprotein 130 receptor
HFD ............................................................................................................. High Fat Diet
HIV-AIDS ......... Human immunodeficiency virus- acquired immune deficiency syndrome
Hz ............................................................................................................................ Hertz
IL-1 ............................................................................................................... Interleukin 1
IL-11 ........................................................................................................... Interleukin 11
IL-6 .............................................................................................................. Interleukin 6
IL-6KO ......................................................................................... Interleukin-6 Knockout
IL-6R .............................................................................................. Interleukin-6 receptor
IMF .......................................................................................................... Intermyofibrilar
INFγ ...................................................................................................... Interferon gamma
IOD ............................................................................................ Integrated optical density
JAK ............................................................................................................... Janus Kinase
kDa .................................................................................................................. Kilodalton
LIF ......................................................................................... Leukemia Inhibitory Factor
LLC ..............................................................................................Lewis Lung Carcinoma
LoFS ...................................................................... Low Frequency Electrical Stimulation

xv
MAC 16 .................................................................................. murine adenocarcinoma 16
MAPK ............................................................................ Mitogen-activated protein kinase
MFN1 ............................................................................................................. mitofusin 1
MFN2 ............................................................................................................. mitofusin 2
Min ...................................................................................................................... ApcMin/+
mRNA ......................................................................................................messenger RNA
ms .................................................................................................................. Millisecond
mtDNA ..............................................................................................Mitochondrial DNA
mTOR .............................................................................. mammalian target of rapamycin
MuRF-1 ............................................................................. Muscle RING-finger protein-1
NFκB ............................................................................................ Nuclear Factor-kappaB
NRF1 ..................................................................................... Nuclear respiratory factor 1
NRF2 ..................................................................................... Nuclear respiratory factor 2
NUGEMPs ............................................... Nuclear genes encoding mitochondrial proteins
OPA1 ....................................................................................................... Optic Atrophy 1
OSM ............................................................................................................ Oncostatin M
PBS ........................................................................................... Phosphate buffered saline
PDTC ..................................................................................... Pyrrolidine dithiocarbamate
PGC-1 ........................................ peroxisome proliferator-activated receptor coactivator-1
PI3K......................................................................................... Phosphoinositide 3-kinase
Pla ........................................................................................................................ plantaris
PPAR ............................................................. peroxisome proliferator-activated receptors
PROb-BDIX ............................................................................... Berlin–Druckrey IX Rats

xvi
PVDF ........................................................................................... Polyvinylidene fluoride
Quad ............................................................................................................... Quadriceps
RNA........................................................................................................ Ribonucleic acid
SDH .......................................................................................... Succinate Dehydrogenase
SDS ...............................................................................................Sodium dodecyl sulfate
sgp130Fc .............................................................. soluble glycoprotein 130 fusion protein
sIL-6R .............................................................................................. soluble IL-6 receptor
skm-gp130 ........................................ skeletal muscle specific glycoprotein 130r knockout
Sol........................................................................................................................... Soleus
SS ........................................................................................................... Subsarcolemmal
STAT3 ............................................... Signal Transducer and Activator of Transcription 3
Stim .............................................................................................................. Stimmulated
TA........................................................................................................... Tibialis Anterior
TBST ...............................................................................Tris Buffered Saline and Tween
TFAM ....................................................................... Mitochondrial transcription factor A
TNFα .................................................................................. Tumor Necrosis Factor alpha
V ..............................................................................................................................Volts

1
CHAPTER 1
INTRODUCTION
2
Cancer cachexia accounts for approximately 20% of all cancer related deaths and
about 40% of deaths related to colon cancer (Bruera, 1997; Tisdale, 2002). Cachexia is
defined as the unintentional loss of body weight with an underlying disease present
(Evans et al., 2008; Fearon et al., 2011; Muscaritoli et al., 2010). While cachexia consists
of the loss of both skeletal muscle and adipose tissue, maintenance of skeletal muscle
mass has proven to be of importance. A potential mediator of skeletal muscle mass
during cachexia is the inflammatory cytokine interleukin 6 (IL-6). Inflammation is a
prominent feature during the promotion and progression of colon cancer cachexia, and
high IL-6 levels are correlated with cachexia in late stage cancer patients (Iwase et al.,
2004). Over-expression of IL-6 in tumor bearing mice can decrease skeletal muscle mass
in a dose dependent manner (White et al., 2012a). Inhibition of IL-6 signaling via an IL-6
receptor antibody or by knocking out IL-6 attenuates skeletal muscle wasting in the
ApcMin/+
(Min) mouse model of cachexia; however it is unclear whether these actions are
from the systemic inhibition of IL-6 signaling or whether they are dependent on the local
inhibition of IL-6 signaling in the muscle itself (Baltgalvis et al., 2008b; White et al.,
2011b).
IL-6 is a pleotropic cytokine secreted from many different tissues including
skeletal muscle. IL-6 has both pro-inflammatory and anti-inflammatory properties as well
as the ability to activate target genes for cell proliferation, differentiation, and apoptosis
(Heinrich et al., 2003). During cachexia, IL-6 may act on the tumors, stimulating growth
and differentiation, or IL-6 may act directly on peripheral tissues, such as skeletal muscle,
that are atrophying. The initiation and progression of cachexia in the Min mouse is
directly related to tumor burden and circulating IL-6 levels (Baltgalvis et al., 2008b;

3
White et al., 2011b). IL-6 signals through glycoprotein 130 (gp130/CD130) to activate
downstream signaling. This occurs by binding with either the soluble IL-6 receptor (trans
signaling) or the membrane IL-6 receptor (classical signaling) and forming a complex
with gp130 to activate downstream signaling including the JAK/STAT, RAS/ERK, and
MAPK pathways during classical signaling (Ernst and Jenkins, 2004). Trans signaling
can activate downstream signaling in tissues that do not express the IL-6 receptor, or
express IL-6 receptor in very low levels such as the kidney (Nechemia-Arbely et al.,
2008). Trans signaling can also enhance the actions of IL-6 on tissues that express the IL-
6 receptor. The role of trans IL-6 signaling during the progression of cachexia is
unknown. Additionally the role of the skeletal muscle specific IL-6 signaling through
gp130 is unknown. Bonetto et. al. showed that muscle STAT3 signaling, a downstream
mediator of inflammatory and IL-6-gp130 signaling, is necessary for inflammation and
cancer-induced muscle wasting in some tumor bearing mice (Bonetto et al., 2012;
Bonetto et al., 2011). STAT3 inhibition can attenuate muscle loss through suppression of
muscle atrophy signaling, suggesting that the JAK/STAT pathway is an important
downstream mediator of IL-6-gp130 signaling in skeletal muscle during cachexia. The
role of classical and trans IL-6 signaling and whether IL-6 is acting through local or
systemic STAT3 activation during cancer cachexia remains uninvestigated.
Mitochondrial biogenesis and function, is associated with a muscle’s metabolic
capacity and substrate utilization flexibility (Chomentowski et al.). Muscle mitochondrial
function is related to muscle apoptosis, autophagy, and protein turnover thus mediating
skeletal muscle mass (Romanello and Sandri, 2010). We have shown that IL-6 is
sufficient to induce atrophy in C2C12 myotubes by decreasing protein synthesis,
4
increasing degradation, and altering mitochondrial dynamics and content (White et al.,
2012c). Mitochondria are dysregulated in the skeletal muscle of rodents with cancer
cachexia (White et al., 2011a; White et al., 2012c). Many studies have shown that the
dysregulation of muscle mitochondrial signaling, including decreased mitochondrial
biogenesis, altered dynamics, and decreased function, can lead to muscle loss (Romanello
et al., 2010). These results have been extended to the cachexia field by our experiments in
the ApcMin/+
mouse which show a loss of mitochondrial content with the progression of
cachexia and IL-6 overexpression (White et al., 2011a; White et al., 2012c). We have
shown that systemic inhibition of IL-6 signaling after the initiation of cachexia can
attenuate mitochondrial dysfunction in the ApcMin/+
mouse (White et al., 2012c), however
it is unknown whether these actions were due to suppression of classical or trans IL-6
signaling and whether systemic or muscle specific signaling IL-6 signaling was
responsible. Exercise training, which is known to increase mitochondrial plasticity, can
prevent mitochondrial dysfunction even in the presence of elevated circulating IL-6
(Puppa et al., 2011d). While IL-6 signaling appears to be a regulator of mitochondrial
function during cachexia, it is unclear whether these actions involve direct signaling in
the muscle through the muscle gp130 or if IL-6 action on alternative tissues leads to
dysregulation of skeletal muscle mitochondria.
Inhibition of either STAT3 or IL-6 attenuates muscle loss with cancer (Baltgalvis
et al., 2008b; Bonetto et al., 2012; Bonetto et al., 2011; White et al., 2011b; White et al.,
2012c). While there is evidence showing that IL-6 inhibition preserves skeletal muscle
quality related to mitochondrial biogenesis and function, and suppresses skeletal muscle
protein degradation, it is unclear if these actions are from local inhibition at the level of
5
the skeletal muscle or if systemic inhibition of IL-6 signaling is important for the
protection of muscle quality during cachexia. STAT3 inhibition preserves skeletal muscle
mass during cancer cachexia, however, STAT3 regulation of muscle protein synthesis
and mitochondrial plasticity during cancer cachexia remains to be established. The
overall goal of this proposal is to determine the regulation of skeletal muscle mass and
mitochondrial biogenesis by gp130/STAT3 signaling and muscle contraction during
cancer cachexia. Our central hypothesis is that IL-6 signaling through gp130 and STAT3
will mediate muscle mass and suppression of mitochondrial biogenesis/function during
cachexia, and inhibition of inflammatory signaling will increase mitochondrial plasticity
and enhanced cachectic muscle’s response to contraction.
Specific Aim #1 will determine if attenuation of systemic trans IL-6 signaling, STAT3 or
local IL-6 signaling through gp130 can prevent mitochondrial loss and altered
mitochondrial dynamics during cancer cachexia.
Specific Aim #2 will determine if IL-6 signaling through muscle gp130 receptor/ STAT3
regulates the disruption of muscle mass in the cachectic muscle.
Specific Aim #3 will determine if the transcription and translation of proteins regulating
mitochondrial biogenesis are altered with acute contraction during cachexia.

6
Working Model: Initially the proposal will examine if the inhibition of IL-6 trans
signaling, global STAT/NFκB signaling, or muscle gp130 signaling can prevent
decreases in skeletal muscle mitochondrial biogenesis and dynamics after the initiation of
cancer cachexia in tumor bearing mice (AIM 1). Next the proposal will examine if gp130
receptor signaling, global STAT/NFκB signaling, or global IL-6 signaling can prevent the
decreased cachexia induced muscle mass loss in the Lewis lung carcinoma (LLC)
implantable tumor model of cachexia (AIM 2). The ApcMin/+
and LLC models differ in
rate of cachexia progression, and overall tumor burden relative to body size, but IL-
6/STAT3 has a documented role for muscle wasting in both models. Next the proposal
will proceed to examine the contraction mediated regulation of mitochondrial biogenesis
in response to acute contractions (AIM 3). Understanding the role of the gp130 receptor
and STAT3 signaling regulation of muscle mass will provide a guide for developing
specific pharmaceutical and therapeutic targets for the prevention and treatment of
cachexia.

7
Figure 1.1 Working Model

8
CHAPTER 2
LITERATURE REVIEW

9
2.1 Cachexia
Cachexia is a severe condition associated with many chronic diseases that leads to
body weight loss comprised of skeletal muscle mass and adipose tissue loss. From the
greek root “kakos” meaning bad and “hexis” meaning condition, cachexia leads to
increased mortality and morbidity. Cachexia is defined as the unintentional loss of 5% of
body weight including muscle and fat mass given an underlying disease. The progression
of the disease is classified based on the amount of body weight that has been lost, and
body weight loss is positively correlated with mortality (Evans et al., 2008). Many
diseases are associated with cachexia including HIV-AIDS, renal failure, diabetes,
chronic heart failure, and many cancers (Deans and Wigmore, 2005). Cachexia accounts
for approximately 20% of cancer deaths and approximately 40% of colon cancer related
deaths (Tan and Fearon, 2008; Tisdale, 2003). Although it is a growing field of research
the molecular mechanisms causing the loss of skeletal muscle with cachexia are poorly
understood.
The cachectic condition is associated with altered metabolism, chronic
inflammation, impaired immune function, and overall weakness, ultimately leading to
increased morbidity and mortality (Tisdale, 2009). Although some patients experience
anorexia associated with the cachexia, studies have shown nutritional interventions to be
ineffective in preventing further weight loss (Grosvenor et al., 1989). Approximately
50% of patients with advanced cancer experience anorexia (Walsh et al., 2000). Several
factors may contribute to the decreased appetite in some cachexia patients. Decreases in
taste, early satiety, increased brain tryptophan, and increased cytokine production may all
lead to anorexia associated cachexia (Tisdale, 2001).

10
Not all forms of cancer lead to cachexia; however, patients who develop cachexia
are more susceptible to a decreased response to chemotherapy, prolonged recovery time,
increased risk of infection, and decreased survival after chemotherapy (Esper and Harb,
2005; Evans et al., 2008; Tisdale, 2009; von Haehling et al., 2009). The loss of muscle
mass including the diaphragm leads to impaired muscle function, and work capacity
ultimately leading to reduced mobility, respiratory function, and a quality of life
(O'Gorman et al., 1998; Persson and Glimelius, 2002; Saini et al., 2006; Scott et al.,
2003). Therapies and treatments for cancer cachexia are limited due to the lack of
knowledge of the causes. While there are currently no approved therapies or treatments
for cachexia, the use of animal models has provided valuable insight into the mechanisms
of muscle wasting and the development of potential therapeutic targets.
2.2 Models of Cachexia
There are many models of cancer cachexia currently being utilized to understand
the condition. Both genetic and tumor implantation models are being used to explore the
mechanisms behind skeletal muscle and fat mass atrophy with cancer. As well, cell
culture models have also been utilized to further understand the direct impact of specific
factors including several different cytokines on muscle mass regulation. While human
studies have been conducted, it is difficult to control for tumor burden and rate of
cachexia development so many investigators use rodent models of cachexia to minimize
confounders while trying to understand the mechanisms of the condition.
ApcMin/+
11
The ApcMin/+
(Min) mouse is a widely used model of colon cancer cachexia that is
bred on the C57BL/6 background. The Min mouse has a naturally occurring nonsense
mutation at codon 850 in the Adenomatous polyposis coli (Apc) gene predisposing the
animals to multiple intestinal adenomas (Moser et al., 1990). Cachexia is initiated around
16 weeks of age, and the average lifespan of these mice is approximately 20 to 26 weeks
(Puppa et al., 2011c). The initiation and progression of cachexia in this mouse is directly
related to the intestinal tumor burden and circulating IL-6 levels (Baltgalvis et al., 2009a;
Baltgalvis et al., 2008b; Baltgalvis et al., 2010; White et al., 2012a; White et al., 2011a;
White et al., 2012c). While many models of cancer cachexia involve rapid development
of large tumors, the Min mouse more closely mimics the human condition with a slower
development of cachexia and a smaller tumor burden than some of the tumor
implantation models.
The Min mouse develops an IL-6 dependent cachexia as demonstrated by
Baltgalvis et al, who crossed the Min mouse with the IL-6 knockout mouse (IL-6 KO).
The Min IL-6 KO mouse did not develop cachexia; however, when IL-6 was over-
expressed in these mice they quickly developed cachexia (Baltgalvis et al., 2008b). The
Min mouse has been shown to have a decrease in body weight that corresponds both to
tumor burden and to circulating IL-6 levels (Puppa et al., 2011c). Although nobody has
identified the exact source of the IL-6, data suggest that the tumor may be secreting large
amounts of IL-6. The Min mouse has also been shown to respond to an IL-6 receptor
antibody therapy which when given after the initiation of cachexia, after 5% body weight
loss, was able to attenuate further muscle and body weight loss without rescuing the
decrease in muscle protein synthesis rate (White et al., 2011b). Other work has shown

12
that exercise training can impair the development of polyps in the intestines and exercise
can attenuate muscle loss in the Min mouse in spite of high circulating IL-6 levels (Puppa
et al., 2011d). While data show that IL-6 mediates muscle loss in the Min mouse the
direct effects of IL-6 signaling on skeletal muscle in the Min mouse remain to be
established.
C-26 adenocarcinoma
Another commonly used model is the C-26 adenocarcinoma model of cancer
cachexia. In this model C-26 cells are implanted subcutaneously in Balb/c mice. Tumors
develop within 14 days and the mice become cachectic very rapidly. While the Min
model develops many small intestinal polyps over the course of the first 12 weeks, the C-
26 model develops one large tumor that can encompass more than 15% of the animal’s
total body weight. The C-26 model of cachexia is associated with increases in circulating
IL-6 and insulin resistance (Aulino et al., 2010). Inhibition of IL-6 signaling can attenuate
wasting and reduce tumor burden in this model of cachexia as seen with the
administration of an IL-6 receptor antibody and inhibition of STAT3 signaling in skeletal
muscle (Bonetto et al., 2012; Bonetto et al., 2011; Soda et al., 1995; Strassmann et al.,
1993; Strassmann et al., 1992; Strassmann and Kambayashi, 1995). Several studies have
shown that exercise can slow tumor growth in this model of cancer cachexia and
attenuate wasting (al-Majid and McCarthy, 2001). Studies have also shown that
pharmaceutical agents to treat insulin resistance associated with muscle wasting,
including metformin and rosaglidazone, can attenuate muscle loss and improve overall
health of the animals (Asp et al., 2010). While this model is used often and provides
many of the hallmarks of the human condition it is a rapid model taking 15-30 days to
13
develop a 10% loss in body weight and 24% loss in muscle mass (Aulino et al., 2010;
Bonetto et al., 2012; Bonetto et al., 2011). The accelerated model taken in combination
with the large tumor burden makes this model less like the human condition; but still a
valid model to study the mechanisms of cancer cachexia.
Lewis Lung Carcinoma
Another commonly used model is the Lewis Lung Carcinoma (LLC) model of
cancer cachexia. Similar to the C-26 model, tumor cells are implanted subcutaneously
and allowed to develop into a tumor. These tumors are generally fast growing and can
secrete IL-6 and/or TNFα (Wang et al., 2012). Inhibition of TNFα receptor-1 is effective
in attenuating muscle wasting in this model (Carbo et al., 2002; Llovera et al., 1998);
however, when LLC cells over-expressing IL-6 are transplanted into the C57BL/6 mouse
it induces body weight loss without producing detectable levels of TNFα in the plasma
(Ohe et al., 1993). Additionally STAT3 has been shown to be elevated in the skeletal
muscle of mice implanted with LLC tumor cells (Bonetto et al., 2012). Because the
Lewis Lung Carcinoma develops on a C57BL/6 background it makes it a widely used
model of cachexia, as many transgenic mice are available on the C57BL/6 background.
Inhibition of potential cachectic mediators such as myostatin (Busquets et al., 2012;
Murphy et al., 2011), FOXO (Reed et al.), and C/EBPβ (Zhang et al., 2011) have been
shown to attenuate muscle mass loss through suppression of protein catabolism pathways
demonstrating the complexity of the cachectic condition. In the LLC mouse model of
cachexia ATP generation is suppressed and mitochondrial uncoupling is increased (Tzika
et al., 2013). However, increasing mitochondrial biogenesis through PGC-1α alone does
not prevent the development of cancer cachexia (Wang et al., 2012). Interestingly, PGC-

14
1α4 transgenic mice have attenuated LLC-induced muscle mass loss that is associated
with increases in IGF-1 mRNA and decreases in protein degradation markers (Ruas et al.,
2012). These data suggest a potential role for mitochondrial dysregulation in the
progression of LLC-induced cachexia. The LLC model of cachexia has been shown to be
a reliable model for identifying potential mechanisms in the progression of cancer
cachexia.
Mac 16
The murine adenocarcinoma 16 (Mac 16) has been used as a dependable model of
cancer cachexia without inducing anorexia (Monitto et al., 2001). The Mac16 tumor
model of cachexia uses NMRI nude Balb/c mice as a host (Bing et al., 2000; Bing et al.,
2001). Over the course of a month, mice develop a 20-30% loss in body weight after
tumor implantation. Associated with the decreased muscle mass and body weight is a
decrease in blood glucose levels that is unrelated to food consumption (Bing et al., 2001).
While many models of cachexia have been shown to be dependent on cytokine
production, the Mac16 model appears to be dependent on a 24kDa glycopeptide and other
lipolitic and proteolytic factors (Beck et al., 1990; Lorite et al., 1997; Monitto et al.,
2001; Mulligan et al., 1992). Circulating levels of IL-6 are not detectable in this model of
cachexia and anti-TNFα antibody therapy was ineffective in preventing the muscle mass
loss (Mulligan et al., 1992), suggesting other proteolytic factors are driving disease
progression in this model of cachexia.
AH-130

15
The Yoshida AH-130 cell line has been used to induce cancer cachexia in rats.
The AH-130 cell line is derived from hepatoma cells. Cachexia develops very rapidly in
this model inducing body weight and muscle mass loss after only seven days of tumor
implantation (Costelli et al., 1993; Costelli et al., 2006; Figueras et al., 2005; Tessitore et
al., 1987). As well as showing rapid weight loss this model has been widely used to
establish altered protein turnover in skeletal muscle with increases in protein degradation
without alterations in protein synthesis (Tessitore et al., 1987). Inhibition of the cytokine
TNFα, which is constantly secreted by the tumor (Catalano et al., 2003), improves muscle
mass through decreases in protein degradation, but does not offer complete protection
from cachexia, once again suggesting other mechanisms are involved (Costelli et al.,
1993; Costelli et al., 2006).
PROb-BDIX
The PROb BDIX model of cancer cachexia is a rat model that uses cancer cells
derived from pancreatic cancer. As well as an increased inflammatory profile the PROb
BDIX model develops anorexia (Dumas et al., 2010; Julienne et al., 2012). Because of
the development of anorexia associated with the cachexia, this model is widely used to
study nutritional interventions. Fish oil can delay the occurrence of anorexia/cachexia in
this model but does not completely prevent the muscle mass loss (Dumas et al., 2010).
Recently, this model has been used to show a decrease in mitochondrial capacity in
skeletal muscle that is not associated with a decrease in the efficiency of the mitochondria
to produce energy. As with many of the other models of cachexia, muscle proteolysis
appears to be driven by increases in the muscle ubiquitin E3-ligases, MURF-1 and
Atrogin (Julienne et al., 2012). While this model is not widely utilized, it develops a rapid

16
cachexia that is not dependant on the anorexia. More work is required for characterizing
this model to use in cachexia research.
Table 2.1. Characterization of rodent models of cancer cachexia. Muscle loss is
represented by the % loss in gastrocnemius muscle weight compared to control animals at
the same time point.
2.3 Inflammation
Chronic inflammation is a problem commonly associated with many disease
states. Acute exposure to inflammatory mediators is thought to be beneficial as it aids in
the recovery from tissue injury; however long term exposure to inflammation is seen as
detrimental to the host and can lead to metabolic dysregulation and protein degradation.
Inflammation during cachexia is regulated by pro and anti-inflammatory cytokines.
Interleukin-6 (IL-6), IL-1β, Interferon gamma (INFγ), and tumor necrosis factor alpha
(TNFα) are the most commonly studied cytokines related to cachexia and muscle wasting
(Agustsson et al., 2007; Batista et al., 2012; Grossberg et al., 2010; Kalra and Tigas,
2002; Saini et al., 2006; Tisdale, 2005). Exposure to high levels of either IL-6 or TNFα
Model Background Tumor origin Muscle Loss Cytokines Time to develop
cachexia
ApcMin/+
C57BL/6 Intestine/colon ~32-43%
(White et al.,
2011b)
IL-6 16-20 weeks
C26 Balb/c Colon ~25-30%
(Bonetto et al.,
2011) IL-6 14-21days
LLC C57BL/6 Lung ~25-36%
(Das et al.,
2011; Penna et al.)
IL-6, TNFα
13-30days
MAC16 NMRI Colon ~14-20%
(Bing et al.,
2000)
- 12-30days
AH-130 Wistar rats Liver ~37-40%
(Tessitore et
al., 1987)
TNFα 7-14days
PROb BDIX rats Colon ~14-22%
(Julienne et al.,
2012)
TNFα 35 days

17
has been shown to induce skeletal muscle atrophy in vitro and in vivo without an
underlying disease state (De Larichaudy et al., 2012; Dehoux et al., 2007; Frost et al.,
1997; Haddad et al., 2005). Both IL-6 and TNFα contribute to muscle mass loss by
inducing the ubiquitin proteasome pathway through increases in the muscle specific E3-
ligases, atrogin/MAFbx and MuRF-1 (De Larichaudy et al., 2012; Dehoux et al., 2007;
Haddad et al., 2005).
Inflammation is increased in the cachectic state and is associated with increased
mortality (Deans and Wigmore, 2005). When inflammation is reduced through the use of
anti-inflammatory agents improvements in body weight and lean tissue mass have been
seen (Solheim et al., 2013). The two predominant inflammatory pathways associated with
cancer cachexia are the JAK/STAT pathway activated through the IL-6/gp130 receptor
complex, and TNFα acting through the TRAF/TRADD and NFκB pathway. Plasma
concentrations of interleukin-6 are correlated with the progression of cachexia in late-
stage cancer patients (Iwase et al., 2004) and anti-cytokine therapies have proven to be
moderately effective in rodent models of cancer cachexia (Deans and Wigmore, 2005;
Jones et al., 2011; Strassmann and Kambayashi, 1995).
Glycoprotein 130 receptor
The glycoprotein 130 (gp130) receptor is the IL-6 signal transducer and is a
transmembrane receptor for the IL-6 family of cytokines. Found on chromosome 5q11,
gp130 is ubiquitously expressed in tissues throughout the body and systemic deletion of
the receptor is embryonic lethal (Rodriguez et al., 1995; Saito et al., 1992; Yoshida et al.,
1996). Several different cytokines signal through the gp130 receptor forming either a

18
heterodimer or homodimer with the cytokine, its receptor and gp130. Some of these
cytokines include interleukin-11 (IL-11), ciliary neurotrophic factor (CNTF), leukemia
inhibitory factor (LIF), oncostatin M (OSM), and interleukin-6 (Heinrich et al., 2003;
Kishimoto et al., 1995). Upon dimerization, gp130 leads to the downstream activation of
the JAK/STAT pathway.
The gp130 receptor is composed of an Ig-like binding domain and five fibronectin
type III (FNIII) repeats on the extracellular portion of the receptor. The first two FNIII
repeats form the cytokine binding module. The transmembrane domain is followed by the
box1 and box2 regions and the leucine motif where Jak/STAT3 activation occurs on
tyrosine residues (Heinrich et al., 2003). Mutations in the intracellular region of the
gp130 receptor leads to inactivation of the Jak/STAT pathway and IL-6 receptor
signaling (Haan et al., 2002; Stahl et al., 1994).
Gp130 is a potential therapeutic target for diseases involving chronic
inflammation such as insulin resistance and obesity (Febbraio, 2007). Early increases of
gp130 have been observed in the skeletal muscle of diabetic mice (Toledo-Corral and
Banner). Activation of the gp130 receptor through binding of CNTF or IL-6 has been
shown to activate AMP-activated protein kinase (AMPK), a regulator of metabolism, and
enhance glucose uptake and fatty acid oxidation (Kelly et al., 2004; Watt et al., 2006).
Watt et al showed that gp130 in the presence of IL-6R is sufficient for AMPK activation
and is not dependent on STAT3 activation. Additionally, gp130 is necessary for the
CNTFR and IL-6R activation of AMPK (Watt et al., 2006). These data suggests that
gp130 may be a key regulator of ATP turnover and AMPK activity; however, the specific
role of skeletal muscle gp130 in the regulation of cancer cachexia is unknown.

19
Interleukin 6
Interleukin 6 (IL-6) is a pleiotropic cytokine expressed throughout the body. IL-6
is a 26 kDa protein mainly secreted from T cells and macrophages to produce an immune
response; however, other tissues can also secrete the cytokine. Although very
controversial in its role, IL-6 can operate as both a pro-inflammatory cytokine and an anti
inflammatory cytokine. IL-6 acts through binding the IL-6 receptor which binds the
gp130 receptor forming a homodimer complex that activates downstream signaling
(Schwantner et al., 2004). Several intracellular signaling pathways can be activated by
the IL-6-gp130 interaction including JAK/STAT, RAS/ERK, and PI3K/Akt (Ernst and
Jenkins, 2004; Heinrich et al., 1998). IL-6 binds the IL-6r either in its soluble form or it
binds membrane bound IL-6r. The IL-6 receptor and the gp130 are both type 1 membrane
proteins meaning that they have one transmembrane domain and an extracellular N-
terminus. The IL-6 receptor then binds with the gp130 on the membrane causing gp130-
homodimerization. Once the homodimer is formed it autophosphorylates tyrosine
residues of the gp130 allowing for STAT3 to bind, phosphorylate, and dimerize leading
to nuclear translocation and up regulation of STAT3 activated genes.
IL-6 also acts as a myokine that is it is secreted from skeletal muscle to work in
an autocrine/paracrine fashion signaling skeletal muscle responses. As well as being
secreted from skeletal muscle IL-6 is secreted from adipose tissue and as part of the
innate immune response. IL-6 is elevated in skeletal muscle during contraction and may
activate usage of extracellular substrates for fuel during contraction (Febbraio and
Pedersen, 2005; Petersen and Pedersen, 2005); however, chronic exposure to IL-6 can

20
lead to skeletal muscle atrophy through induction of protein degradation and alterations
in mitochondrial dynamics (Haddad et al., 2005; White et al., 2012c).
IL-6 is elevated in many different cachectic conditions including obesity, arthritis,
HIV/AIDS, COPD, and cancer; however; a complete knockout of IL-6 may also be
detrimental as shown by the fact that IL-6 knockout mice develop mature onset insulin
resistance and obesity (Wallenius et al., 2002). The initiation and progression of some
cachexia models is directly related to tumor burden and circulating IL-6 levels (Baltgalvis
et al., 2008b; White et al., 2011b). Our lab has shown that IL-6 is directly related to
cachexia severity in the Min mouse (Baltgalvis et al., 2008b; Puppa et al., 2011c) and
inhibition of IL-6 through use of an IL-6 receptor antibody or IL6KO mice
attenuates/prevents the development of cachexia (Baltgalvis et al., 2008b; White et al.,
2011b). During cachexia, IL-6 may act on the tumors, stimulating growth and
differentiation, or IL-6 may act directly on peripheral tissues, such as skeletal muscle,
that are atrophying. Skeletal muscle is one target of IL-6 that may be contributing to the
overall decline in health with the progression of cachexia and muscle loss. IL-6 is known
to decrease muscle protein synthesis and increase degradation leading to a loss in skeletal
muscle. Recent studies have demonstrated that inhibition of downstream signaling,
STAT3, or of the IL-6 receptor attenuated muscle mass loss in animal models of cachexia
(Bonetto et al., 2012; Bonetto et al., 2011). Over expression of IL-6 and IL-6 family
members can induce cachexia in animal models and can induce atrophy in C2C12
myotubes, but exercise in the presence of increase IL-6 is able to attenuate the cachectic
condition (Baltgalvis et al., 2008b; Bonetto et al., 2012; Bonetto et al., 2011; Puppa et al.,

21
2011d). These data indicate a need for further investigation on the mechanisms of IL-6
action during cancer cachexia.
Classical vs. Trans IL-6 signaling
Unlike the gp130 that is ubiquitously expressed the IL-6 receptor is limited in its
expression (Jones et al., 2001). IL-6 can act on tissues in two ways. Classical signaling of
IL-6 occurs when IL-6 binds the membrane bound IL-6Rα, this causes dimerization of
the gp130 receptor allowing for the activation of downstream targets. The second way
that IL-6 can act on tissues is through trans signaling. In trans signaling circulating IL-6
binds to the soluble IL-6 receptor. Soluble IL-6r is formed through one of two
mechanisms. The ectodomain of the IL-6 receptor can be cleaved from T cells by
ADAM17 resulting in the shedding of soluble IL-6r or it can be produced through
translation of alternatively spliced IL-6r mRNA (Briso et al., 2008; Rose-John, 2012).
Once IL-6 is bound to the soluble IL-6r it can bind to gp130 on any tissue type and
activate IL-6 target genes in tissues that would normally be unresponsive to IL-6.
The roles for classical and trans signaling are still relatively unexplored; however,
there is some evidence showing a potential for targeting trans signaling to alleviate
symptoms of arthritis and cancer. Furthermore, IL-6 trans signaling has been implicated
in a more pro-inflammatory response to stimuli, whereas, classical signaling is thought to
have more anti-inflammatory properties (Rose-John, 2012). Dr. Rose-John has
successfully developed a fusion protein to inhibit IL-6 trans signaling both in vitro and in
vivo (Atreya et al., 2000; Barkhausen et al.; Jones et al., 2011; Lo et al., 2011; Nechemia-
Arbely et al., 2008; Nowell et al., 2003; Rose-John, 2012; Waetzig and Rose-John, 2012).

22
Inhibition of the soluble IL-6r and IL-6 trans signaling in experimental models of arthritis
and colitis lead to improvements in disease outcomes (Atreya et al., 2000; Klover et al.,
2003; Nowell et al., 2003). We have shown that inhibition of both classical and trans IL-6
signaling together prevents the loss of muscle mass in the Min mouse partially through
improvements in muscle mitochondrial content and dynamics and attenuation of protein
degradation without alterations in protein synthesis (White et al., 2012c). The role of IL-6
trans signaling in the regulation of skeletal muscle mass and mitochondrial biogenesis
during cachexia requires further investigation.
2.4 Skeletal Muscle Mitochondria
The mitochondria are vital to the proper function of skeletal muscle. Many people
consider the mitochondria to be the powerhouse of the cell, being in charge of ATP
generation; however this is not its only function. The mitochondria also regulate
signaling related to apoptosis, autophagy, and protein turnover (Romanello and Sandri,
2010). Despite the textbook images of mitochondria looking like a nice rounded almost
kidney bean shape, the mitochondria actually form a complex network weaving
throughout the muscle and is constantly undergoing dynamic changes. Skeletal muscle
mitochondria are divided into two distinct populations each having specific functions.
The subsarcolemma fraction (SS), located directly under the plasma membrane, accounts
for approximately 20% of the muscle’s mitochondria (Hoppeler, 1986). SS mitochondria
are mainly responsible for providing energy for transport of substrates and signaling that
occurs at the plasma membrane. The intermyofibrillar fraction (IMF) of mitochondria is
located between the myofibrils, closer to the contractile elements. The main function of
the IMF fraction is providing ATP for muscle contraction. Skeletal muscle has a high

23
energy demand so without either of these two populations of mitochondria the muscle is
unable to properly function.
Mitochondria are highly plastic and adapt readily to changes in the surrounding
environment. Up regulation of mitochondria is required for muscle to adapt to additional
energy demands that are placed on the muscle such as that from exercise. Mitochondrial
biogenesis occurs through several signaling pathways. Mitochondrial biogenesis occurs
when stress, from exercise for example, is placed on the muscle. This stress activated the
energy sensor AMPK to signal for decreases in energy consuming processes such as
protein synthesis and increases in processes to produce energy including mitochondrial
biogenesis. AMPK up regulates the peroxisome-proliferator gamma-activated receptor
coactivator (PGC)-1α (Jager et al., 2007; Zong et al., 2002), a well accepted control
protein for mitochondrial biogenesis. PGC-1α has been shown to up regulate nuclear
encoded mitochondrial proteins (NUGEMPs) through translocation to the nucleus and
association with transcription factors (Wu et al., 1999). Not only does PGC-1α help to up
regulate mitochondrial protein transcription, it can act in a positive feedback to up
regulate itself. Recent literature has shown that mTOR is important in the regulation of
PGC-1α and can operate with PGC-1α to activate the transcription of many oxidative
genes (Cunningham et al., 2007). When the mTOR complex is inhibited there is a severe
decrease in muscle oxidative capacity and function (Schieke et al., 2006) suggesting that
mTOR is an important mediator for the maintenance of mitochondria.
As well as playing a role in protein synthesis the mitochondria play a vital role in
protein degradation, apoptosis, and autophagy. One way in which the mitochondria can
work to regulate protein degradation is through regulation of FOXO3. Mitochondrial

24
fission can induce phosphorylation and activation of AMPK which regulates FOXO3 and
atrogenes independently of activation of Akt. When FOXO is blocked even in the
presence of mitochondrial fission, muscle atrophy is prevented (Romanello et al.). When
FOXO3 is blocked in healthy skeletal muscle hypertrophy and growth of the muscle
occur (Reed et al.).
Mitochondrial Dynamics
As mentioned previously, mitochondria are quite dynamic, constantly undergoing
morphological changes to adapt to the cellular conditions. The processes regulating these
mitochondrial dynamics are called mitochondrial fission and fusion (Yaffe, 1999).
Mitochondrial fission is the process of a mitochondrion separating into two, similar to
cellular division, whereas mitochondrial fusion is the process of two mitochondria
coming together to form one larger mitochondrion. Fission is regulated through the
expression of dynamin related protein-1 (DRP1) and Fis1. DRP1 locates on the outer
mitochondrial membrane where it is thought to associate with Fis1 to signal for fission of
the mitochondria (Benard and Karbowski, 2009; Romanello and Sandri). The exact
mechanisms of mitochondrial fission are unclear; however the inhibition of Fis1 can
reduce autophagy in skeletal muscle (Romanello et al.). Fission may be important for the
maintenance of healthy mitochondrial function by targeting dysfunctional mitochondria
for autophagy/degradation. Fusion of the mitochondria is regulated by mitochondrial
fusion proteins, mitofusin 1 and 2 (Mfn1/Mfn2), and optic atrophy protein 1 (OPA1).
Mfn1/2 localize on the outer mitochondrial membrane and act to tether the two fusing
mitochondria together (Koshiba et al., 2004) whereas OPA1 is found on the inner
mitochondrial membrane and may act as an anchor during the fusion process and may

25
assist in the fusion of the inner mitochondrial membranes (Benard and Karbowski, 2009).
Mitochondrial fusion has been shown to help regulate mitochondrial DNA stability.
MFN2 is decreased in skeletal muscle of obese individuals and may have a role in the
regulation of skeletal muscle metabolism (Mingrone et al., 2005). Inhibition of
mitochondrial fusion in mice leads to decreases in mitochondrial DNA and ultimately
muscle atrophy (Chen et al., 2010). While tightly regulated by many genes MFN2 has
been shown to be regulated by both PGC-1α and PGC-1β (Liesa et al., 2008; Soriano et
al., 2006). The expression of mitochondrial fission and fusion proteins are tightly
correlated with mitochondrial enzyme activity and levels of PGC-1α (Garnier et al.,
2005). Disruption of mitochondrial dynamic can lead to many diseases such as insulin
resistance and mitochondrial myopathies (Liesa et al., 2009).
2.5 Cachexia and Mitochondrial Loss
Loss of muscle mass in cancer cachexia is in part due to loss and dysregulation of
mitochondria, which is a prominent feature of many wasting conditions (Li et al., 2007;
Romanello et al.; White et al.). Both oxidative and gylcolytic hindlimb muscles have
reduced mitochondrial content, and oxidative protein expression in severe cachexia
(White et al., 2011a; White et al., 2012c). The loss of muscle oxidative capacity in the
later stages of cachexia also corresponds with severe insulin resistance as seen by the
inability to clear glucose during a glucose tolerance test late in cachexia (Puppa et al.,
2011c). The loss of mitochondria and increase in fission appear to be pivotal in the
regulation of skeletal muscle mass with the progression of cachexia directly relating to
disease state. Recently, cachexia was shown to decrease skeletal muscle oxidative
capacity; however this decrease was not associated with alterations in mitochondrial ATP
26
production efficiency (Julienne et al., 2012). The overall ability of skeletal muscle to
produce ATP is decreased in tumor bearing mice, which could be contributing the
increased fatigue in the cachectic patient (Tzika et al., 2013). Interestingly, PGC-1α
transgenic mice are not protected from muscle mass loss despite increased mitochondrial
content (Wang et al., 2012); however, overexpression of PGC-1α4 can prevent cancer
induced muscle mass loss and is shown to regulate skeletal muscle hypertrophy (Ruas et
al., 2012). The regulation of muscle hypertrophy by the mitochondria is relatively
unexplored and required further investigation.
Inhibition of systemic and skeletal muscle inflammatory signaling may be one
approach to decreasing muscle wasting. Inhibition of systemic IL-6 signaling after the
initiation of cachexia can increase mitochondrial biogenesis, decrease mitochondrial
fission, and increase mitochondrial fusion (White et al., 2012c). Additionally inhibition
of other inflammatory signaling including NFκB and MAPK can restore muscle mass,
increase muscle force, and improve mitochondrial complex activity in cachectic rodents
(Fermoselle et al., 2013). Inhibition of IL-6, NFκB, and MAPK in these experiments
leads to decreased tumor burden making it difficult to understand if the effects on muscle
mitochondria are directly related to the tumor burden. Other therapeutic interventions
such as the administration of nutraceuticals, anti-oxidants, or exercise are shown to have
beneficial effects on muscle wasting (Fermoselle et al., 2013; Siddiqui et al., 2009). Anti-
oxidant therapy can increase mitochondrial function without altering the tumor burden;
however, there was no improvement in muscle mass suggesting that improvements in
mitochondrial capacity alone are not sufficient to prevent muscle wasting (Fermoselle et
al., 2013).

27
2.6 Skeletal Muscle Protein turnover
Skeletal muscle comprises about 40% total body weight in humans and is vital for
all movement (Zhang et al., 2007) and loss of skeletal muscle mass can lead to decreased
quality of life. Not only is skeletal muscle vital to moving the body, but it is also the main
amino acid reservoir of the body for other tissues. Skeletal muscle mass is maintained by
a balance of protein synthesis and protein degradation. Alterations in the balance will
result in muscle growth (increased synthesis or decreased degradation) or muscle mass
loss (decreased synthesis or increased degradation). Skeletal muscle loss is a potent factor
in the progression of the cachexia and therapies to attenuate muscle loss are being
investigated.
Protein synthesis
Skeletal muscle protein synthesis is regulated by several factors. Nutrient status,
hormones, use, and inflammatory signaling can all impact the rates of protein synthesis.
The common regulatory point of the different pathways that controls protein synthesis is
the mammalian target of rapamyocin (mTOR). Increases in nutrient availability will lead
to the up-regulation of protein synthesis through increases in insulin signaling through the
IGF-1/PI3K/AKT pathway. Nutrient availability can further increase protein synthesis by
relieving the AMPK inhibition of mTOR. This occurs by preventing AMPK from
phosphorylating TSC2, an inhibitor of mTOR activity (Bolster et al., 2002). The exact
mechanism of hormones on the regulation of protein synthesis is not fully understood;
however, androgen depletion induces suppressed protein synthesis associated with
increased expression of REDD1, an inhibitor of mTOR, and decreased IGF-1 (White et

28
al., 2013a). Contraction is another stimulus that can regulate skeletal muscle protein
synthesis. Contraction is thought to act through both the IGF-1/AKT pathway to up-
regulate mTOR as well as through MAPK/ERK signaling cascade. Once mTOR is
activated it phosphorylates p70S6 kinase, leading to increase S6 ribosomal protein, and
4EPB1 which relieves the repression of eIF-4E and increases translation initiation (Glass,
2005).
Cancer cachexia is associated with decreased skeletal muscle protein synthesis
and anabolic resistance (Tisdale, 2009). During cancer cachexia an increase in AMPK
activity as well as a suppression of IGF-1 is observed and contributes to the suppressed
protein synthesis (White et al., 2011b; White et al., 2013b). While IL-6 can directly
decrease protein synthesis in C2C12 myotubes, the inhibition of IL-6 after the initiation
of cachexia has no effects on skeletal muscle protein synthesis (White et al., 2011b).
Additionally, IL-6 in the presence of insulin is able to increase markers of protein
synthesis in C2C12 myotubes, but this anabolic plasticity is lost in cachectic mice.
Inhibition of AMPK through the administration of Compound C can also relieve IL-6
inhibition of protein synthesis marker in cell culture (White et al., 2013b). Interestingly
exercise, even under conditions of inflammation, can increase markers of protein
synthesis in skeletal muscle of Min mice, while treadmill exercise displayed no
improvements in protein synthesis were seen in a mouse model of chronic kidney disease,
however the duration of this exercise was significantly less than in the Min model (Wang
et al., 2009; White et al., 2011b). Overloading the plantaris muscle during chronic kidney
failure-induced cachexia does result in improvements in muscle protein synthesis (Wang

29
et al., 2009). These data suggest exercise may be able to override the cachexia-
suppression of muscle protein synthesis despite increased systemic inflammation.
Protein Degradation
While the multiple pathways that regulate protein synthesis seem to converge at
mTOR, signals regulating protein degradation appear to converge at FOXO. FOXO
activation allows proteins to be targeted for degradation by the ubiquitin proteasome
pathway and evidence shows that FOXO is important for degradation through autophagy.
Phosphorylation of FOXO causes FOXO to be sequestered in the cytosol making it
inactive. Upon dephosphorylation FOXO enters the nucleus to up-regulate transcription
of several E3 ligases including MURF and Atrogin-1 (Ramaswamy et al., 2002). The E3
ligases then tag the proteins for degradation by placing a ubiquitin tag on the protein.
Once tagged the protein is degraded by the proteasome.
The role of protein degradation during cancer cachexia has been well established.
Both ATP dependant and independent degradation is increased during cancer cachexia
(White et al., 2011b). Inflammatory signaling appears to be a potent mediator of
cachexia-induced muscle proteolysis. Administration of IL-6 to C2C12 myotubes
increases atrogin-1 protein expression (White et al., 2013b). Inhibition of systemic IL-6
signaling can attenuate ATP dependant protein degradation in cachectic mice (White et
al., 2011b). Skeletal muscle inhibition of STAT3 and FOXO3 have both been shown to
decrease muscle degradation pathways and improve overall skeletal muscle mass
(Bonetto et al., 2012; Bonetto et al., 2011; Reed et al., 2012). While inhibition of muscle
protein degradation can attenuate skeletal muscle mass during the cachectic condition, the

30
long term ramifications of suppressed protein degradation are unknown. Inhibition of
protein degradation alone may lead to muscle dysfunction through the accumulation of
damaged proteins; however, this remains to be investigated.
2.7 A Role for Exercise with Cachexia
In healthy individuals, mitochondrial protein content of PGC-1α, citrate synthase,
and mitochondrial creatine kinase are directly correlated with mitochondrial fusion, and
fusion and are associated with increased exercise capacity (Garnier et al., 2005). Exercise
training can successfully attenuate the cachectic condition when started prior to the onset
of cachexia, even in the presence of high circulating cytokines (Puppa et al., 2011a). One
possible mechanism for the protective effects of exercise is the increase in mitochondrial
capacity. Exercise training has a large impact on mitochondrial capacity in skeletal
muscle. One of the main changes in skeletal muscle with exercise training is the increase
in mitochondrial capacity and content (Holloszy and Coyle, 1984). Repeated bouts of
exercise show progressive and sustained increases in several mitochondrial proteins such
as PGC-1α, mitochondrial transcription factor A (Tfam), and nuclear respiratory factors
(NRF) (Baar et al., 2002; Gordon et al., 2001; Hood et al., 2006) which allow for
mitochondrial biogenesis and increased mitochondrial function. As well as increasing
mitochondrial biogenesis exercise training can increase expression of mitochondrial
fusion proteins and decrease mitochondrial fission proteins (White et al., 2012c). Such
changes may increase mTOR and reduce the chronic activation of AMPK and FOXO
seen in cachexia thus suppressing protein degradation and inducing synthesis.

31
It is widely accepted that cancer cachexia affects glycolytic muscle prior to
affecting the more oxidative muscles. By increasing the mitochondrial capacity of
skeletal muscle, making it more oxidative, the muscle may be protected. Exercise may be
one potential therapeutic approach to combat this issue. The affects of exercise after the
onset of cachexia and muscle loss are unknown. Exercise induces expression of fission
related proteins immediately post; however, there is up regulation of mitochondrial fusion
proteins and biogenesis after exercise. Although the cachectic muscle already has
increases in fission and decreased mitochondrial content, exercise may be able to reverse
this condition and return the muscle to a state in which fully functional mitochondria are
present. Several studies have shown that SS mitochondrial are more susceptible to change
than the IMF mitochondria (Menshikova et al., 2006). Research still needs to be done to
determine if the loss of mitochondria in cancer cachexia is specific to the SS population
or if it extends to the IMF population. It is reasonable to assume that IMF mitochondria
are decreased with severe cachexia considering the fact that the SS population only
accounts for approximately 20% of muscle mitochondria and a decrease in IMF
mitochondria would correlate with the decrease in muscle mass and force production.
Once the muscle mass has been lost and the muscle is in a catabolic state it may not be
able to be returned to the pre catabolic state, however exercise may be able to prevent
further loss of muscle mass. More research needs to be done to examine the effects of
exercise on muscle after the initiation of cachexia and if exercise after onset of cachexia
is able to restore normal mitochondrial dynamics and function. Research investigating the
effects of resistance exercise on cachectic patients’ ability to hypertrophy muscle is
lacking and is an area for further investigation.

32
Few studies have looked at the effect of an acute bout of exercise on the
regulation of mitochondrial fission and fusion. What research has been conducted
demonstrates that mitochondria fission is increased after an acute bout of exercise while
mitochondrial fusion is suppressed (Bo et al.; Cartoni et al., 2005; Ding et al.). Although
there is little research available about the changes in mitochondrial dynamics with an
acute bout of exercise, a wide body of literature shows that exercise, even an acute bout,
up-regulates mitochondrial biogenesis, partially through the activation of AMPK. After
an acute bout of exercise PGC-1α is rapidly up-regulated leading to a subsequent increase
in mitochondrial associated gene transcription and mitochondrial biogenesis (Baar et al.,
2002; Pilegaard et al., 2003). Up-regulation of these genes persists for up to 4 hours
before returning to baseline levels (Pilegaard et al., 2000). Since the effects are short
lived it shows the importance of regular physical activity to increase mitochondrial
capacity. As well as increases in mitochondrial capacity, insulin sensitivity is increased
immediately following an acute bout of exercise, in part due to the up-regulation of genes
regulating glycolysis and fatty acid oxidation and overall improvements of metabolic
flexibility.
Exercise is well known to help improve insulin sensitivity, and is commonly used
to treat insulin resistance in various disease states including diabetes (Hawley, 2004),
cachexia, and obesity (Bradley et al., 2008; Duncan et al., 2003). In healthy rodents,
exercise improves both glucose tolerance (James et al., 1983) and insulin sensitivity
(James et al., 1984). The exact mechanism is still unclear, however potential mechanisms
by which exercise can improve insulin resistance are to reduce inflammation (Kondo et
al., 2006; Mattusch et al., 2000), improve muscle respiratory capacity (Holloszy, 1967;
33
Mole et al., 1971; Oscai and Holloszy, 1971) and improve insulin signaling (Houmard et
al., 1999). Both acute bouts of exercise and exercise training can have positive effects on
insulin sensitivity. After an acute bout of exercise insulin sensitivity is increased for at
least 16 hours and the effects can last up to 48 hours. These improvements in insulin
sensitivity most likely stem from increases in skeletal muscle glucose transporter type 4,
GLUT4, protein content and increased translocation of GLUT 4 to the plasma membrane.
GLUT4 is a glucose transporter protein that is spread throughout the cytoplasm in the
rested state. After ingestion of glucose or after exercise, GLUT4 moves from the cytosol
and associates with the plasma membrane to take up glucose into the cell to be used as
energy. GLUT4 can be stimulated both by insulin and by contraction. In the insulin
resistant individual GLUT4 expression is not decreased in the skeletal muscle, but insulin
stimulated signaling is suppressed (Handberg et al., 1990; Kahn, 1992) . The acute effects
of exercise on glucose uptake occur in an insulin independent manner and rely mainly on
the contraction stimulated increase in GLUT4 translocation (Brozinick et al., 1992; King
et al., 1993). As mentioned previously these effects are short lived and if another bout of
exercise or muscle contraction is not conducted the cells will return to the pre exercise
state.
Improvements in lipid metabolism are important for the maintenance of insulin
sensitivity. When there is an accumulation of lipid in the body it can inhibit insulin signal
transduction. Exercise up regulates lipid oxidation and improves mitochondrial capacity
to perform beta oxidation. While mitochondrial capacity is decreased in cancer cachexia
(White et al., 2011a) exercise training is able to up regulate mitochondrial capacity even
in conditions when cancer and inflammation are present (Puppa et al., 2011a). Skeletal

34
muscle mitochondrial function plays a pivotal role in muscle glucose uptake, and
impairments in the oxidative capacity have been associated with insulin resistance (Lanza
and Nair, 2009; Morino et al., 2006). Altered mitochondria content is also related to a
diminished ability of muscle to efficiently oxidize fatty acids, leading to decreased
muscle metabolic flexibility (Chomentowski et al.). The loss of muscle oxidative capacity
in cancer cachexia corresponds with severe insulin resistance as seen by the inability to
clear glucose during a glucose tolerance test late in cachexia (Puppa et al., 2011c).
Training maintains the increased levels of mitochondria and improves metabolic
flexibility. As metabolic flexibility is improved, insulin sensitivity is also improved.
Exercise training can result in long term improvements on insulin sensitivity.
Insulin acts through the PI3K signaling pathway to up regulate protein synthesis and
muscle glucose uptake. PI3K has been shown to be decreased in insulin resistant
individuals (Goodyear et al., 1995) and is one reason for the decrease in insulin
stimulated translocation of GLUT4 with insulin resistance. Exercise increases PI3K
signaling potentially through increases in the insulin receptor substrate; however the
evidence is variable as reviewed by Hawley et al (Hawley and Lessard, 2008). PI3K
activates downstream signaling to enhance glucose uptake and improve insulin
sensitivity. As well as increasing the ability of insulin to activate its signaling cascade
directly exercise training causes an increase in the activation of AMPK. As mentioned
earlier AMPK is an energy sensor for the cell and can regulate lipid metabolism, protein
synthesis, mitochondrial biogenesis and glucose uptake, which are all dysregulated in
cancer. Exercise training increases protein levels of AMPK, but despite the increase in
AMPK exercise training induced an increase in muscle protein synthesis even in the
35
cachectic condition. The increased muscle protein synthesis rates are due to activation of
the IGF-1 Akt/mTOR pathway that is suppressed in cancer cachexia (White et al.,
2011b). Exercise is also able to attenuate the chronic activation of AMPK that is seen
with severe muscle wasting (Puppa et al., 2011a; White et al., 2011b). The improvements
in the regulation of AMPK activity may be due to the improvements in glucose uptake
which could alleviate the energy stress that is placed on the muscle due to the cancer and
metabolic inflexibility.
Exercise and IL-6
Exercise benefits have been well documented in patients with many chronic
diseases, and exercise is widely recommended for obese and insulin resistant patients.
Exercise has the potential to challenge systemic disorders and local intracellular signaling
that regulates muscle homeostasis. The potential beneficial effects of exercise are
dependent on many variables, including exercise type (i.e., endurance or resistance), and
whether the muscle responses are induced by a single acute bout of exercise, or an
adaptation occurring because of repeated exercise bouts. We have published that
treadmill exercise trained cachectic mice over-expressing IL-6 are not susceptible to body
weight and muscle mass loss despite elevated muscle inflammatory signaling (Puppa et
al., 2011d). IL-6 is known to be a key player in the adaptations to skeletal muscle
contraction. Skeletal muscle is known to be an endocrine organ that can secrete IL-6 after
contraction and plays a role in muscle metabolism. IL-6KO mice have been used to study
the necessity of IL-6 for exercise and load induced adaptations, and IL-6KO mice have
been shown to have altered adaptations. IL-6KO mice that have undergone synergistic
ablation have been shown to have decreased myonuclei number and decreased satellite

36
cell activation (Serrano et al., 2008) and have been shown to have an increase in
extracellular matrix remodeling and non contractile tissue (White et al., 2009) after
overload. It has also been reported that IL-6KO mice have a decreased endurance
capacity, an increased fat mass, and decreased oxygen consumption during exercise by 8
months of age (Faldt et al., 2004). Related to muscle protein and mitochondrial responses
to exercise, Kelly et al. demonstrated that activation of AMPK is suppressed in IL-6KO
mice and there was lower activation of AMPK after exercise compared with the wild type
controls (Kelly et al., 2004). After a bout of exercise, high fat diet (HFD) fed IL-6KO
mice showed decreased glucose uptake in the EDL and these mice with access to wheels
still developed a decreased systemic insulin sensitivity (Benrick et al., 2012). Since
AMPK is a key player in mitochondrial biogenesis and regulating protein synthesis these
data suggest that there will be alterations in these parameters; however, this remains to be
examined. While these studies have shown that a systemic IL-6 knockout has alterations
in skeletal muscle adaptations some of which could be induced by the lack of IL-6 on
other tissues such as the liver and adipose tissue where IL-6 is known to play a vital role,
the direct role of IL-6 signaling on skeletal muscle remains to be examined in healthy or
diseased models.
2.8 Conclusion
Taken together the current body of literature displays many gaps in understanding
the regulation of muscle mass during cancer cachexia and the direct role of IL-6 family
signaling on muscle protein turnover and mitochondrial biogenesis and function in
skeletal muscle. While we understand that mitochondrial biogenesis and content are
suppressed during cachexia, we do not know what is causing the loss. It could be that

37
decreases in substrate availability lead to degradation of dysfunctional mitochondria in an
attempt to preserve the tissue, or inflammation could be directly targeting the
mitochondria leading to dysfunction and loss. A wide body of literature shows up
regulation of mitochondrial content with exercise and contraction. Exercise, which
induces an acute inflammatory response, prior to the development of severe cachexia is
able to attenuate the condition and is associated with improved skeletal muscle
homeostasis. The current proposal aims to understand the role of inflammation in
dysregulation of the mitochondria during cachexia and if an acute bout of contraction can
induce mitochondrial changes in severely cachectic animals.

38
CHAPTER 3
THE ROLE OF SYSTEMIC AND MUSCLE IL-6 SIGNALING ON MITOCHONDRIAL
LOSS DURING THE PROGRESSION OF CANCER CACHEXIA IN THE APCMIN/+
MOUSE1
1 Melissa Puppa, Aditi Narsale, Stefan Rose-John, Angela Murphy, Greg Hand, Raja
Fayad, and James Carson. To be submitted.
39
3.1 Abstract
The interleukin-6 (IL-6) family of cytokines and their associated signaling is
implicated in cachexia development and progression. IL-6 activates gp130/STAT by
signaling through either classical or trans IL-6 signaling. The ApcMin/+
(Min) mouse
develops an IL-6 dependent cachexia. We have previously demonstrated that systemic
inhibition IL-6 signaling after the initiation of cachexia attenuates progression of
cachexia and improves signaling regulating mitochondrial dysfunction. We have also
demonstrated that inhibition of muscle gp130 in LLC implanted mice attenuates
cachexia. Therefore, the purpose of this study was to examine the role of IL-6 trans
signaling and local gp130 signaling on skeletal muscle mitochondrial regulation during
cachexia. To inhibit trans signaling Min mice were administered sgp130Fc (150ug, 1/wk)
for two weeks after the initiation of cachexia, and skeletal muscle knockout of gp130
(skm-gp130) in the Min mouse was used to examine the muscle gp130. Administration
sgp130Fc attenuated body weight and muscle mass loss in Min mice, while skm-gp130
did not attenuate muscle mass loss. STAT3 and AMPK which were elevated with
cachexia were suppressed with sgp130Fc and in skm-gp130 Min mice. Loss of
mitochondrial oxidative capacity was attenuated with sgp130Fc and skm-gp130. While
mitochondrial fission was inhibited by sgp130Fc, skm-gp130 attenuated cachexia-
induced MFN loss. These data point to differential roles of IL-6 trans signaling and
muscle gp130 signaling for the regulation of skeletal muscle mitochondrial loss during
cancer cachexia in the ApcMin/+
mouse. Further work is necessary to delineate the
contribution of IL-6 trans signaling on other tissues to the pathogenesis of cachexia.
Key Words: Muscle, Trans IL-6, Cancer Cachexia, ApcMin/+

40
3.2 Introduction
Chronic inflammation is a hallmark of cachexia. IL-6 is elevated in many
different cachectic conditions including obesity, arthritis, HIV/AIDS, COPD, and cancer;
however; a complete knockout of IL-6 may also be detrimental as shown by the fact that
global IL-6 knockout mice develop mature onset insulin resistance and obesity
(Wallenius et al., 2002). The initiation and progression of cachexia in the ApcMin/+
(Min)
mouse is directly related to tumor burden and circulating IL-6 levels (Baltgalvis et al.,
2008b; White et al., 2011b). Our lab has shown that IL-6 is directly related to cachexia
severity in the Min mouse (Baltgalvis et al., 2008b; Puppa et al., 2011c) and inhibition of
IL-6 through use of an IL-6 receptor antibody or IL6KO mice attenuates/prevents the
development of cachexia (Baltgalvis et al., 2008b; White et al., 2011b). During cachexia,
IL-6 may act on the tumors, stimulating growth and differentiation, or IL-6 may act
directly on peripheral tissues, such as skeletal muscle, that are atrophying. Skeletal
muscle is one target of IL-6 that may be contributing to the overall decline in health with
the progression of cachexia and muscle loss. Recent studies have demonstrated that
inhibition of STAT3 or of the IL-6 receptor attenuated muscle mass loss in animal
models of cachexia (Bonetto et al., 2012; Bonetto et al., 2011). Over expression of IL-6
and IL-6 family members can induce cachexia in animal models, but exercise in the
presence of increase IL-6 is able to attenuate the cachectic condition (Baltgalvis et al.,
2008b; Bonetto et al., 2012; Bonetto et al., 2011) leaving the direct role of IL-6 on
skeletal muscle function during cachexia unexplored.
Unlike the gp130 that is ubiquitously expressed the IL-6 receptor is limited (Jones
et al., 2001). IL-6 can act on tissues in two ways. Classical signaling of IL-6 occurs when

41
IL-6 binds the membrane bound receptor, this causes dimerization of the gp130 receptor
allowing for the activation of downstream targets. In trans signaling the soluble IL-6
receptor can bind to gp130 on any tissue type and activate IL-6 target genes since gp130
is ubiquitously expressed. The roles for classical and trans signaling are still relatively
unexplored; however, there is evidence showing a potential for targeting trans signaling
to alleviate symptoms in arthritis and cancer. Furthermore, IL-6 trans signaling has been
implicated in a more pro-inflammatory response to stimuli, whereas, classical signaling is
thought to have more anti-inflammatory properties (Rose-John, 2012). Dr. Rose-John has
successfully developed a fusion protein to inhibit IL-6 trans signaling both in vitro and in
vivo (Atreya et al., 2000; Barkhausen et al.; Jones et al., 2011; Lo et al., 2011; Nechemia-
Arbely et al., 2008; Nowell et al., 2003; Rose-John, 2012; Waetzig and Rose-John, 2012).
We have demonstrated that inhibition of classical and trans IL-6 signaling
together prevents the loss of muscle mass in the Min mouse partially through
improvements in muscle mitochondrial content and dynamics and decreases in protein
degradation without improvements in muscle protein synthesis (White et al., 2011b;
White et al., 2012c). The role of IL-6 trans signaling in the regulation of skeletal muscle
mass and during cachexia requires further investigation. Inhibition of skeletal muscle
gp130 in the LLC tumor implanted mice and in C2C12 myotubes treated with LLC
conditioned medium attenuated muscle atrophy without improvements in protein
synthesis (Puppa et al., 2013b). It is unknown how skeletal muscle gp130 signaling
regulates muscle loss in an IL-6 dependent model of cachexia. Skeletal muscle inhibition
of STAT3 can prevent cancer-induced muscle wasting through inhibition of muscle E3
ligases, however the effects of STAT3 inhibition on mitochondrial dysregulation and the

42
regulation of protein synthesis are unknown. There is a lack of understanding how IL-6
through gp130/STAT3 signaling regulates skeletal muscle mitochondria. Therefore, the
purpose of this study was to examine the role of IL-6 trans signaling and muscle gp130
signaling on skeletal muscle mitochondrial regulation during cachexia. We hypothesized
that inhibition of either skeletal muscle gp130 or IL-6 trans signaling will attenuate
cachexia suppression of mitochondrial loss during cachexia through improvements in
altered mitochondrial dynamics.
43
3.3 Methods
Animals. Male mice on a C57BL/6 background were bred with the gp130 fl/fl mice
provided by Dr. Colin Stewart’s lab in collaboration with Dr. Hennighausen (NCI) (Zhao
et al., 2004). Gp130 fl/fl female mice were bred with male ApcMin/+
mice from our colony
at the University of South Carolina. The resulting male gp130 fl/fl ApcMin/+
mice were
bred with female cre-expressing mice driven by myosin light chain from Dr. Steven
Burden (NYU) (Bothe et al., 2000). The resulting fl/fl cre/cre (skm-gp130) and fl/fl
cre/cre ApcMin/+
(skm-gp130 Min) mice have a skeletal muscle deletion of the gp130
protein. Offspring were genotyped for ApcMin/+
as previously described (Mehl et al.,
2005), cre recombinase (forward 5’ AAG CCC TGA CCC TTT AGA TTC CAT TT 3’,
reverse 5’ AAA ACG CCT GGC GAT CCC TGA AC 3’, wild type 5’ GCG GGC TTC
TTC ACG TCT TTC TTT 3’), floxed gp130 (forward 5’ ACG TCA CAG AGC TGA
GTG ATG CAC 3’, reverse 5’ GGC TTT TCC TCT GGT TCT TG 3’), by taking tail
snips at the time of weaning. All mice were group housed and provided standard rodent
chow (Harlan Teklad Rodent Diet, #8604) and water ad libitum. The room was
maintained on a 12:12 light:dark cycle with the light period starting at 0700. All animal
experimentation was approved by the University of South Carolina’s Institutional Animal
Care and Use Committee.
IL-6 trans signaling inhibition: A subset of animals was aged to 16 weeks when Min
mice had initiated body weight loss. Mice were treated by weekly IP injections with a
soluble gp130 fusion protein, sgp130Fc, (150ug/mouse, a generous gift from Dr. Rose-
John). sgp130Fc has previously been shown to inhibit IL-6 trans signaling (Nowell et al.,
2003; Rose-John, 2003)
44
Western Blot analysis: Western blot analysis was performed as previously described
(Puppa et al., 2011d). Briefly, frozen gastrocnemius muscle was homogenized in Mueller
buffer and protein concentration was determined by the Bradford method (Bradford,
1976). Muscle homogenates (20-40 µg protein) were fractionated on SDS-
polyacrylamide gels (6% to 12%). The gels were transferred to PVDF membrane and
stained with ponceau to ensure equal loading. Membranes were blocked in 5% Tris-
buffered saline with 0.1% Tween 20 (TBST) milk for 1 h at room temperature. Primary
antibodies for p-AMPK, total AMPK, p-S6RP, total S6RP, p-STAT3, total STAT3,
atrogin-1, cytochrome C (cell signaling, PGC-1α (Santa Cruz), FIS (Sigma), and
Mfn1(Novus Biologicals) were incubated at dilutions of 1:1000 to 1:4000 overnight at
4°C in 1% TBST milk. Secondary anti-rabbit or anti-mouse IgG-conjugated secondary
antibodies were incubated with the membranes at 1:2000 to 1:5000 dilutions for 1 h in
1% TBST milk. Enhanced chemiluminescence (Bio Express) was used to visualize the
antibody-antigen interactions and developed by autoradiography. Digitally scanned blots
were analyzed by measuring the integrated optical density (IOD) of each band using
digital imaging software (ImageJ).
mtDNA: Mitochondrial capacity was performed as previously described (White et al.,
2012b). DNA was isolated using DNAzol® Reagent (Invitrogen). Briefly, muscle (20 to
30 mg) was homogenized in 1 ml DNAzol, pelleted with 100% ethanol, and re-suspended
in 8 mM NaOH. Quantitative real-time PCR analysis was carried out in 25 μl reactions
consisting of 2x SYBR green PCR buffer (AmpliTaq Gold DNA Polymerase, Buffer,
dNTP mix, AmpErase UNG, MgCl2) (Applied Biosystems), 0.150 μg DNA, DI water,
45
and 60 nM of each primer. PCR was run with the DNA sample with Cytochrome B
Forward, 5′ - ATT CCT TCA TGT CGG ACG AG −3′; Cytochrome B Reverse, 5′ - ACT
GAG AAG CCC CCT CAA AT - 3′, Gapdh Forward, 5′ - TTG GGT TGT ACA TCC
AAG CA - 3′; Gapdh Reverse, 5′ - CAA GAA ACA GGG GAG CTG AG - 3′. Samples
were analyzed on an ABI 7300 Sequence Detection System. Reactions were incubated
for 2 minutes at 50°C and 10 minutes at 95°C, followed by 40 cycles consisting of a 15-s
denaturing step at 95°C and 1-minute annealing/extending step at 60°C. Data were
analyzed by ABI software (Applied Biosystems) using the cycle threshold (CT). The
ratio between mtDNA and nuclear DNA genes was normalized to wild-type mice and
used as an index of mitochondrial content.
Succinate dehydrogenase staining (SDH): SDH staining was conducted as previously
described (Nachlas et al., 1957). Briefly, 10 µm thick sections from the mid-belly of the
tibialis anterior muscle were cut at −20°C on a cryostat and slides were stored at −80°C
until staining was performed. The sections air dried for 10 minutes then incubated in a
solution of 0.2 M phosphate buffer (pH 7.4), 0.1 M MgCl2, 0.2 M succinic acid and 2.4
mM nitroblue tetrazolium (NBT, Sigma) at 37°C for 45 minutes. The sections were
washed three minutes in water and then dehydrated in 50% ethanol. Stained slides were
mounted with Permount (Calbiochem). Digital photographs were taken from each section
at 25X magnification and fibers were quantified with imaging software (Image J, NIH).
Fibers were considered SDH positive if they were 2 standard deviations above
background. SDH-positive fibers were counted in each section in a blinded fashion.
RNA Isolation/PCR: RNA isolation, cDNA synthesis and real-time PCR were performed
as previously described (White et al., 2013b) , using reagents from Applied Biosystems.
46
Gp130 (forward 5’ CAG CGT ACA CTG ATG AAG GTG GGA AA 3’, reverse 5’ GCT
GAC TGC AGT TCT GCT TGA 3’) , IGF-1(White et al., 2013a), REDD1 (White et al.,
2013a), IL-6 (Washington et al., 2011), and GAPDH primers were purchased from IDT
(Coralville, Iowa, USA). Data were analyzed by ABI software using the cycle threshold
(CT).
Plasma IL-6: Blood was collected at sacrifice via a retro-orbital sinus puncture and
centrifuged at 10,000×g for 10 min. Plasma was collected and stored at −80°C until
analysis. Using commercial ELISA kits for IL-6 (Invitrogen) according to the
manufacturer’s instructions, circulating levels of fasting IL-6 were measured.
Tumor Count: Intestinal polyp number and distribution was determined as previously
described (REF). Intestinal sections from mice were fixed with 4% PFA, stained briefly
in 0.1% methylene blue, and then placed under a dissecting microscope. The polyp
number was counted by using tweezers to pick through the intestinal villi and identify
polyps. Polyp sizes were categorized based on size (<1, 1-2, >2mm).
Statistics: A one-was ANOVA was used to determine the effect cachexia on soluble IL-
6R levels. A two-way ANOVA was used to determine the effect of treatment (IL-6 trans
inhibition and skeletal muscle gp130 deletion) X genotype. A one-way ANOVA was
used to determine the effects of IL-6 trans inhibition and skm-gp130 loss on body weight
and muscle mass loss in min mice. Post-hoc analyses were performed with Student-
Newman-Keuls method. Pre-planned t-test was used to look at the effect of the ApcMin/+
genotype within the control group and is indicated by a single asterisk. Significance was
set at p<0.05.

47
3.4 Results
IL-6 trans signaling and muscle gp130 regulation of body weight during cachexia
The ApcMin/+
(Min) mouse is an IL-6 dependent model of cancer cachexia. IL-6
can act through membrane bound IL-6 receptor as well as the soluble IL-6 receptor, sIL-
6R. Plasma levels of sIL-6R were elevated in Min mice prior to body weight loss (Fig
3.1A). In mice demonstrating severe cachexia, greater than 10% body weight loss, sIL-
6R was elevated further (Fig 3.1A). We sought to determine if inhibition of trans IL-6
signaling or muscle specific gp130 loss (skm-gp130) could attenuate cachexia. Min mice
demonstrated a loss of body weight (Table 3.1). Inhibition of IL-6 trans signaling through
the administration of a soluble gp130 fusion protein (sgp130Fc) after the initiation of
cachexia attenuated further body weight loss whereas the loss of muscle gp130 (skm-
gp130) did not protect from body weight loss (Fig 3.1B). The attenuation of body weight
loss was associated with improved muscle mass and fat mass in Min mice that was not
seen with skm-gp130 loss (Fig 3.1C/Table3.1). While Min mice demonstrated elevated
IL-6 levels, inhibition of IL-6 trans signaling trended to decrease plasma IL-6 levels,
p=0.12, and skm-gp130 loss had no effect on plasma IL-6 levels (Table 3.1). Neither
trans IL-6 inhibition or skm-gp130 inhibition had an effect on cachexia induced
spleenomegaly or on total tumor number. These data suggest that inhibition of IL-6 trans
signaling may attenuate the cachectic condition independently of muscle gp130 signaling.
IL-6 trans signaling and muscle gp130 regulation of muscle mass during cachexia
To determine how inhibition of IL-6 trans signaling may be acting to attenuate
muscle mass loss we measured regulators of cancer-induced muscle mass loss (Fig 3.-2).

48
Cachexia induced a 6 fold increase in skeletal muscle STAT3 phosphorylation which was
blocked by both sgp130Fc administration and in skm-gp130 mice (Fig 3.2A).
Additionally, the 2 fold induction of AMPK phosphorylation induced by cancer-cachexia
was attenuated by sgp130Fc and skm-gp130 (Fig 3.2A). Cachexia suppressed mTOR
signaling through ribosomal protein S6 by 57% (Fig 3.2B). The suppression of skeletal
muscle mTOR signaling was unaltered by sgp130Fc or skm-gp130. Cachexia induced the
E3 ligase, atrogin, expression. This induction was attenuated by both trans signaling
inhibition and muscle gp130 inhibition (Fig 3.2B). These data demonstrate that IL-6
signaling during caner cachexia act through the muscle gp130 receptor to activate protein
degradation pathways, but signaling through IL-6 trans pathways or muscle gp130 is not
responsible for the suppression of muscle protein synthesis.
IL-6 trans signaling and muscle gp130 regulation of mitochondrial biogenesis during
cachexia
Because muscle mitochondrial content has been shown to be decreased with
cachexia and inhibition of systemic IL-6 signaling can attenuate mitochondrial
dysfunction, we sought to determine whether inhibition of trans IL-6 signaling or muscle
gp130 loss would prevent the cachexia-induced loss of mitochondrial biogenesis and
dynamics. Cachexia suppressed PGC-1α and cytochrome c protein content (Fig 3.3A).
Inhibition of skm-gp130 or IL-6 trans signaling attenuated the cachexia-suppression of
PGC-1α protein (Fig 3.3A); however the cachexia suppression of PGC-1α mRNA was
unaltered by either sgp130Fc or skm-gp130 (Fig 3.3B). There was a main effect of
sgp130Fc to increase cytochrome c protein content regardless of cachexia; however, skm-
gp130 was unable to prevent the cachexia suppression of cytochrome c protein (Fig

49
3.3A). There was no effect of cachexia on TFAM mRNA levels; however, sgp130Fc
increased TFAM mRNA regardless of cancer (Fig 3.3B).
We next examined the effects of skm-gp130 and trans IL-6 inhibition on
mitochondrial dynamics. Cachexia suppressed protein and mRNA levels of mitochondrial
fusion marker MFN1 (Fig 3.3C/D). Inhibition of trans IL-6 signaling increased MFN
protein levels in wild type mice; however, it was unable to attenuate the cachexia
suppression of MFN1 protein (Fig 3.3C), and there was no effect of sgp130Fc on MFN1
mRNA levels (Fig 3.3D). Skm-gp130 was able to attenuate the cachexia suppression of
MFN1 protein (Fig 3.3C) and there was a main effect of skm-gp130 to increase MFN1
mRNA levels despite cachexia (Fig 3.3D). Mitochondrial fission protein FIS was
increased by cachexia (Fig 3.3C). Interestingly, skm-gp130 increased FIS1 protein
regardless of cachexia. Pre-planned t-test revealed that sgp130Fc attenuated the cachexia
induction of FIS protein. Additionally, the cachexia induction of FIS mRNA levels was
attenuated by both skm-gp130 and sgp130Fc (Fig 3.3D). These data demonstrate that IL-
6 signaling through gp130 and trans signaling may differentially regulate mitochondrial
dynamics.
IL-6 trans signaling and muscle gp130 regulation of mitochondrial content during
cachexia
We have previously described a loss of skeletal muscle mitochondrial content
during the progression of cachexia in Min mice (White et al., 2011a). Suppression of
mitochondrial content, measured by mitochondrial DNA and SDH staining, was evident
in Min mice (Fig 3.4). There was a trend, p=0.09, for skm-gp130 mice to have elevated
50
mitochondrial DNA content regardless of cachexia (Fig 3.4A). Coinciding with this
finding muscle oxidative capacity measure by SDH staining was increased with skm-
gp130 loss regardless of cachexia (Fig 3.4B). The cachexia suppression of SDH dark
stained fibers was attenuated by sgp130Fc administration (Fig 3.4B). These data
demonstrate that IL-6 signaling through muscle gp130 may be responsible for the
suppression of muscle oxidative capacity with cachexia.
51
3.5 Discussion
Cancer cachexia, associated with muscle mass loss, directly impacts patient
survival and quality of life (Evans et al., 2008; Fearon et al., 2011; Muscaritoli et al.,
2010). While the mechanisms underlying the condition are complex and can differ based
on the type and severity of cancer. The progression of cachexia is directly associated with
increased morbidity and mortality and account for 20% of all cancer deaths (Bruera,
1997; Tisdale, 2002). Muscle oxidative capacity has been associated with susceptibility
to muscle wasting (Tisdale, 2009), and muscle mitochondria loss has been well
documented in many cachectic conditions (Li et al., 2007; Romanello et al.; White et al.,
2011a). Inflammation has been indicated as a potential regulator of muscle mitochondrial
loss during cachexia (White et al., 2012b). However, the role of systemic inflammation
and muscle specific signaling on mitochondrial loss during cachexia remains to be
investigated. To our knowledge this is the first study to examine the effects of trans IL-6
signaling and signaling through the muscle gp130 receptor on the regulation of
mitochondrial loss during cachexia. Interestingly, we show differential regulation of
mitochondrial dynamic by IL-6 trans signaling and skm-gp130 signaling; however,
inhibition of either was able to prevent the loss of mitochondria with cachexia. Further
work is necessary to determine if mitochondria remain functional when these signaling
pathways are inhibited.
We have previously shown that inhibition of systemic IL-6 signaling through the
administration of an IL-6r antibody attenuated the loss of body weight and muscle mass
after the initiation of cachexia, and this was associated with suppression of muscle
STAT3, increased muscle mitochondrial content, and suppression of muscle protein
52
degradation pathways (White et al., 2013b; White et al., 2012b). Others have
demonstrated that inhibition of muscle STAT3 can attenuate muscle protein degradation
pathways (Bonetto et al., 2012; Bonetto et al., 2011); however, STAT3 regulation of
muscle mitochondria was not examined. STAT3 not only has well defined transcriptional
functions, but can also translocate to the mitochondria where it increases oxidative
phosphorylation (Qiu et al., 2011). We demonstrate that suppression of muscle STAT3
phosphorylation through inhibition of muscle IL-6 signaling increased muscle oxidative
capacity. Further work is needed to the role of STAT3 on the regulation of muscle
mitochondrial content and the regulation of mitochondrial associated STAT3 during
cancer cachexia.
We demonstrate that increased mitochondrial content was not sufficient to
attenuate muscle mass loss during IL-6 dependent cachexia. While inhibition of trans IL-
6 signaling was sufficient to attenuate muscle loss and prevent mitochondrial loss, muscle
specific inhibition of gp130 signaling was not sufficient to prevent wasting despite
increased mitochondrial content. These findings are similar to those of Wang et al. who
demonstrated that increased mitochondrial content through over-expression of PGC-1α
was not sufficient to prevent cancer-induced muscle loss (Wang et al., 2012). Presumably
the increase in mitochondrial content would be functional as it has been shown that the
decrease in mitochondrial oxidative capacity with cachexia is not associated with
decreases in the ability of the remaining mitochondria to produce ATP (Julienne et al.,
2012). Further work is necessary to determine if the increased mitochondrial content is
functional or if there is a buildup of dysfunctional mitochondria.

53
Recent literature has shown that mTOR is important in the regulation of PGC-1α
and can operate with PGC-1α to activate the transcription of many oxidative genes
(Cunningham et al., 2007). When the mTOR complex is inhibited there is a severe
decrease in muscle oxidative capacity and function (Schieke et al., 2006) suggesting that
mTOR is an important mediator for the maintenance of mitochondria. We show that
oxidative capacity and PGC-1α were increased with inhibition of IL-6 trans signaling and
muscle gp130; however, muscle signaling related to mTOR remained suppressed. These
data suggest that the increase in oxidative capacity may not be sufficient to relieve the
cachexia suppression of mTOR signaling. Further work is necessary to determine the
mechanism behind mTOR suppression with cancer cachexia.
Interestingly gp130 may be a negative regulator of mitochondrial as we have
demonstrated that gp130 is more highly expressed in glycolytic fibers (Puppa et al.,
2013b) and inhibition of muscle gp130 signaling increased mitochondrial oxidative
capacity. The increase in oxidative capacity skm-gp130 mice was also associated with an
increase in FIS protein expression and inhibition of mitochondrial fusion was attenuated
in skm-gp130 mice. Inhibition of trans IL-6 signaling was unable to prevent the
suppression of mitochondrial fusion, but attenuated the increase in fission. Mitochondrial
remodeling and increased mitochondrial fission has been associated with muscle atrophy
following fasting or denervation, and contributes to activation of protein degradation
(Romanello et al., 2010; Romanello and Sandri, 2010). The overall increase in
mitochondrial remodeling seen in skm-gp130 mice may lead to increased autophagy
which can act independently of atrogin to suppress muscle mass, while trans IL-6 may be
suppressing atrophy through inhibition of fission. There may be higher mitochondrial

54
turnover in skm-gp130 mice. Further work is necessary to determine gp130 regulation of
mitochondria and autophagy pathways during cachexia.
In summary we demonstrate that inhibition of trans IL-6 signaling is sufficient to
attenuate muscle mass loss however it may be through more systemic effects as muscle
gp130 inhibition is not sufficient to attenuate cachexia-induced muscle mass loss.
Inhibition of both muscle gp130 and trans IL-6 signaling were sufficient to attenuate the
loss of mitochondria associated with cancer cachexia. Trans IL-6 and muscle gp130
differentially regulated muscle mitochondrial dynamics. Further work is necessary to
understand the differential regulation of mitochondrial dynamics by systemic and local
IL-6 signaling. While inhibition of IL-6 signaling at the muscle was sufficient to prevent
mitochondrial loss systemic IL-6 inhibition appears to be more beneficial for the
treatment of cachexia.
Acknowledgements
The authors thank Ms. Tia Davis and Dr. Marj Peña for technical assistance with the
animal breeding. The skeletal muscle-specific cre-expressing mice were a gift from Dr.
Steven Burden. The gp130 fl/fl mice were a gift from Dr. Colin Stuart & Dr.
Hennighausen, NCI. The research described in this report was supported by research
grant R01 CA121249 to JAC from the National Cancer Institute.

55
Table 3.1. The effect of trans IL-6 and muscle gp130 inhibition on cachexia
development. Body weight was measured throughout the duration of the study and at
sacrifice (SAC). Tibia length, spleen, epidydimal (Epi) fat, intestines and plasma were
collected at the time of sacrifice. All values are mean ±sem. Two-way ANOVA was used
to determine the effects of genotype x treatment (trans IL-6 inhibition, sgp130Fc, and
muscle gp130 loss, skm-gp130). # Main effect of Min, ^ compared to control group
within genotype, p<0.05.
BL-6 control sgp130Fc skm-gp130
N 9 4 5
Peak BW (g) 27.3 ± 0.5 27.5 ± 0.6 27.8 ± 1.2
SAC BW (g) 27.3 ± 0.5 27.2 ± 0.8 27.8 ± 1.2
Tibia Length (mm) 17.1 ± 0.0 17.1 ± 0.1 17.1 ± 0.1
Spleen (mg) 89 ± 8 84 ± 2 98 ± 13
Epi Fat (mg) 465 ± 49 365 ± 35 399 ± 33
Min
N 11 6 6
Peak BW (g) 24.2 ± 0.4# 24.1 ± 0.5
# 23.2 ± 2.2
#
SAC BW (g) 19.7 ± 0.6# 22.8 ± 0.8
#^ 20.3 ± 1.0
#
Tibia Length (mm) 16.7 ± 0.1# 16.6 ± 0.1
# 16.5 ± 0.1
#
Spleen (mg) 452 ± 48# 453 ± 60
# 507 ± 43
#
Epi Fat (mg) 5 ± 5# 121 ± 48
#^ 4 ± 3
#
Tumor Number 80 ± 13 49 ± 11 87 ± 8
IL-6 (pg/ml) 106 ± 62 10 ± 4 74 ± 22

56
3.6 Figure Legends
Figure 3.1. The effect of trans IL-6 and muscle gp130 inhibition on the development
of cachexia. A) Circulating plasma soluble IL-6 receptor, sIL-6R, was measured in
control BL-6 mice, weight stable Min mice, WS, and in severely cachectic min mice,
>10%BW loss. B) The percentage of body weight loss from peak body weight in Min
mice treated with sgp130Fc or lacking muscle gp130 (skm-gp130). C) Gastrocnemius
was measured at the time of sacrifice in BL-6 and Min mice with sgp130Fc or skm-
gp130. All values are Mean ± SEM. One-way ANOVA was used to analyze changes in
sIL-6R and the percent body weight loss. * significantly different from BL-6, ∞
significantly different from WS Two-way ANOVA was used to determine the effects of
genotype x treatment on gastrocnemius mass. # Main effect of Min, † significantly
different from all other comparisons. p<0.05.
Figure 3.2. The effect of trans IL-6 and muscle gp130 inhibition on the signaling
regulating skeletal muscle mass during cachexia. A) Western blot analysis of the ratio
of phosphorylation to total STAT3 and AMPK were measured in the gastrocnemius
muscle of BL-6 and Min mice lacking gp130 (skm-gp130) or treated with sgp130Fc for
two weeks (Fc). B) Western blot analysis of atrogin and the ratio of phosphorylation to
total S6 were measured in the gastrocnemius. All values are Mean ± SEM. Two-way
ANOVA was used to determine the effects of genotype x treatment. # Main effect of
Min, † significantly different from all other comparisons. p<0.05.
Figure 3.3. The effect of trans IL-6 and muscle gp130 inhibition on mitochondrial
biogenesis and dynamics during cancer cachexia. A) Western blot analysis of the ratio
57
of PGC-1α and cytochrome c (Cyto C) were measured in the gastrocnemius muscle of
BL-6 and Min mice lacking gp130 (skm-gp130) or treated with sgp130Fc for two weeks
(Fc). B) Skeletal muscle mRNA levels of PGC-1α and TFAM were measured in
gastrocnemius of mice using real time PCR. C) Protein expression and D) mRNA levels
of markers of mitochondrial fusion (MFN1) and fission (FIS). All values are Mean ±
SEM. Two-way ANOVA was used to determine the effects of genotype x treatment. #
Main effect of Min, & Main effect of sgp130Fc, @ Main effect of skm-gp130, †
significantly different from all other comparisons. * significant compared with BL-6
control based on pre-planned t-test. p<0.05.
Figure 3.4. The effect of trans IL-6 and muscle gp130 inhibition on mitochondrial
content during cancer cachexia. Mitochondrial content was measured as A) the ratio of
mitochondrial DNA:nuclear DNA and B) the percentage of fibers stained after succinate
dehydrogenase staining. All values are Mean ± SEM. Two-way ANOVA was used to
determine the effects of genotype x treatment @ Main effect of skm-gp130 * significant
compared with BL-6 control based on pre-planned t-test. p<0.05.

58
A)
Figure 3.1.
B)
†
*∞
*

59
†
#
C)
Figure 3.1. The effect of trans IL-6 and muscle gp130 inhibition on the
development of cachexia. A) Circulating plasma soluble IL-6 receptor, sIL-6R, was
measured in control BL-6 mice, weight stable Min mice, WS, and in severely
cachectic min mice, >10%BW loss. B) The percentage of body weight loss from peak
body weight in Min mice treated with sgp130Fc or lacking muscle gp130 (skm-
gp130). C) Gastrocnemius was measured at the time of sacrifice in BL-6 and Min
mice with sgp130Fc or skm-gp130. All values are Mean ± SEM. One-way ANOVA
was used to analyze changes in sIL-6R and the percent body weight loss. *
significantly different from BL-6, ∞ significantly different from WS Two-way
ANOVA was used to determine the effects of genotype x treatment on gastrocnemius
mass. # Main effect of Min, † significantly different from all other comparisons..
p<0.05.

60
A)
P-STAT3
P-AMPK
STAT3
AMPK
BL-6 skm-
gp130Min
skm-
gp130Min
BL/6 FcMinFc+
Min
BL-6
skm-
gp130Min
skm-
gp130Min
Atrogin
P-S6
S6
BL/6 FcMinFc+
Min
††
B)
#
†
Figure 3.2. The effect of trans IL-6 and muscle gp130 inhibition on the signaling regulating
skeletal muscle mass during cachexia. A) Western blot analysis of the ratio of phosphorylation to total STAT3 and AMPK were measured in the gastrocnemius muscle of BL-6 and Min mice
lacking gp130 (skm-gp130) or treated with sgp130Fc for two weeks (Fc). B) Western blot
analysis of atrogin and the ratio of phosphorylation to total S6 were measured in the gastrocnemius. All values are Mean ± SEM. Two-way ANOVA was used to determine the
effects of genotype x treatment. # Main effect of Min, † significantly different from all other
comparisons. p<0.05.

61
A)
Figure 3.3.
B)
PGC-1α
Ponceau
Cyto C
BL-6
skm-
gp130Min
skm-
gp130
Min BL/6 FcMinFc+
Min
†
&&
*
&
&
#

62
C)
D)†
MFN
FIS
BL-6
skm-
gp130Min
skm-
gp130
Min BL/6 FcMin
Fc+
Min
Ponceau
**
#†@
@
#
#
@
@
Figure 3.3. The effect of trans IL-6 and muscle gp130 inhibition on mitochondrial
biogenesis and dynamics during cancer cachexia. A) Western blot analysis of the ratio of PGC-1α and cytochrome c (Cyto C) were measured in the gastrocnemius muscle of BL-6 and
Min mice lacking gp130 (skm-gp130) or treated with sgp130Fc for two weeks (Fc). B) Skeletal
muscle mRNA levels of PGC-1α and TFAM were measured in gastrocnemius of mice using real
time PCR. C) Protein expression and D) mRNA levels of markers of mitochondrial fusion (MFN1) and fission (FIS). All values are Mean ± SEM. Two-way ANOVA was used to
determine the effects of genotype x treatment. # Main effect of Min, & Main effect of sgp130Fc,
@ Main effect of skm-gp130, ** significant compared with min control, † significantly different from all other comparisons. * significant compared with BL-6 control based on pre-planned t-
test. p<0.05.
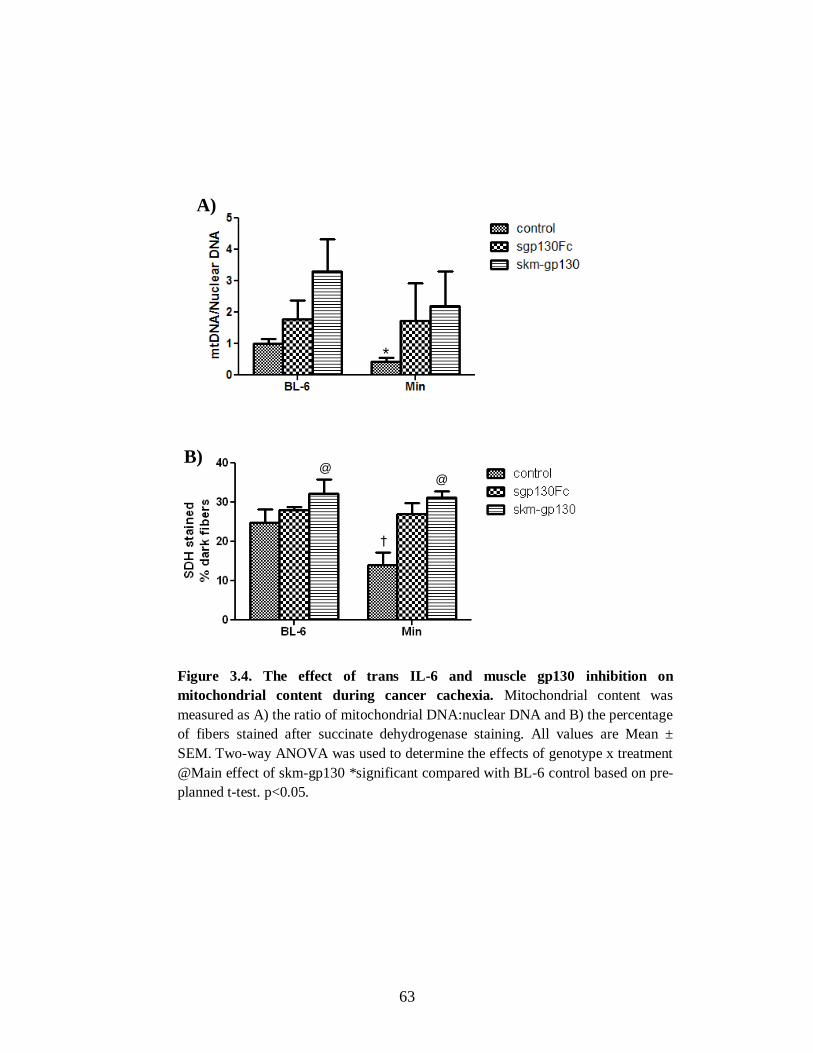
63
A)
B)
*
†
@@
Figure 3.4. The effect of trans IL-6 and muscle gp130 inhibition on
mitochondrial content during cancer cachexia. Mitochondrial content was
measured as A) the ratio of mitochondrial DNA:nuclear DNA and B) the percentage
of fibers stained after succinate dehydrogenase staining. All values are Mean ±
SEM. Two-way ANOVA was used to determine the effects of genotype x treatment
@Main effect of skm-gp130 *significant compared with BL-6 control based on pre-
planned t-test. p<0.05.

64
CHAPTER 4
THE ROLE OF PYRROLIDINE DITHIOCARBAMATE ON THE REGULATION OF
SKELETAL MUSCLE MASS DURING CANCER-INDUCED CACHEXIA2
2 Melissa Puppa, Aditi Narsale, Angela Murphy, Greg Hand, Raja Fayad, and James
Carson. To be submitted
65
4.1 Abstract
Cancer cachexia is associated with significant loss of muscle mass. Increases in
inflammation play a key role in the dysregulation of skeletal muscle proteostasis. During
cachexia there is a significant loss in skeletal muscle protein synthesis and an increase in
muscle protein degradation. While much attention has been paid to combating cachexia-
induced increases in protein degradation, researching is lacking in treatments for the
inflammation-suppression of muscle protein synthesis during cachexia. Therefore the
purpose of this study was to determine if the anti-inflammatory compound, pyrrolidine
dithiocarbamate (PDTC), could alter cachexia induced dysregulation of skeletal muscle
proteostasis. ApcMin/+
mice were administered PDTC daily for two weeks after the
initiation of cachexia. PDTC attenuated cachexia-induced body weight and muscle mass
loss. Two weeks of PDTC administration suppressed cachexia-induced inflammatory
signaling related to STAT3 and AMPK phosphorylation. Inhibition of inflammatory
signaling was associated with a suppression of muscle Atrogin-1 protein expression. The
cachexia suppression of mTOR target, S6, was blocked by PDTC and this corresponded
with an increase in skeletal muscle protein synthesis. PDTC blocked the cachexia-
induced decrease in skeletal muscle mitochondrial content and suppression of
mitochondrial fusion protein MFN1; however PDTC and cachexia both resulted in
increases in mitochondrial FIS expression. These data demonstrate that administration of
PDTC after the induction of cachexia can improve skeletal muscle proteostasis and
mitochondrial capacity. Further work is required to understand the long term effects of
PDTC administration in cachectic muscle.
Keywords: cachexia, protein synthesis, mitochondria, skeletal muscle, inflammation

66
4.2 Introduction
Cachexia, a condition associated with muscle mass and adipose tissue loss,
accounts for 40% of colon cancer related deaths (Fox et al., 2009; Tisdale, 2002).
Although there are several clinical features present that may aid in diagnosing the
cachectic patient including inflammation, insulin resistance, anorexia, altered
metabolism, and muscle proteolysis, ~80% of patients with gastrointestinal cancers have
already experienced significant weight loss at the time of diagnosis (Bruera, 1997).
Cachexia significantly impairs patient quality of life and patients who develop cachexia
are more susceptible to a decreased response to chemotherapy, prolonged recovery time,
increased risk of infection, and decreased survival after chemotherapy (Esper and Harb,
2005; Evans et al., 2008; Tisdale, 2009; von Haehling et al., 2009). There are currently
no approved pharmaceutical therapies for the treatment of cancer cachexia; however,
several likely therapies including anti-cytokine therapies and appetite stimulants are in
development (Ando et al., 2013; Murphy and Lynch, 2009).
The ApcMin/+
(Min) mouse is an IL-6 dependent model of cancer cachexia that
displays many of the hallmarks of cachexia such as increased inflammation and
alterations in skeletal muscle proteostasis. The Min mouse has a naturally occurring
mutation the Adenomatous polyposis coli (Apc) gene predisposing the animals to multiple
intestinal neoplasias (Moser et al., 1990). Similar to the human condition the Min mouse
has a slow progression of body weight and muscle mass loss that is accompanied by
inflammation, fatigue, increases in muscle protein breakdown, and suppression of muscle
protein synthesis (Gallagher et al., 2012; White et al., 2011b; White et al., 2013b). Anti-
IL-6 therapy after the initiation of cachexia is able to attenuate further muscle mass loss

67
through suppression of protein degradation and mitochondrial fission and, improvements
in mitochondrial fusion and oxidative capacity; however, there was not release of the
suppression of muscle protein synthesis with anti-IL-6 therapy (White et al., 2011b;
White et al., 2012b). Other models have also demonstrated that inhibition of
inflammatory signaling through gp130 and STAT3 can attenuate muscle mass loss
through suppression of protein degradation without alterations in the suppression of
protein synthesis (Bonetto et al., 2012; Bonetto et al., 2011; Puppa et al., 2013b).
The small thiol compound, pyrrolidine dithiocarbamate (PDTC) has been shown
to have both anti-inflammatory and antioxidant properties (Chabicovsky et al., 2010; He
et al., 2006; Shi et al., 2000). PDTC can inhibit activation of the IL-6 target, STAT3, and
its association with transcriptional co-activators FOXO and C/EBPβ (He et al., 2006).
Additionally PDTC has been shown to suppress inflammatory processes through NFκB
inhibition (Cuzzocrea et al., 2002; La Rosa et al., 2004; Schreck et al., 1992); however
this has not been seen in all studies (Huang et al., 2008). It has recently been shown that
PDTC can up regulate ribosomal protein genes that are down-regulated by IL-6, and
PDTC can increase the protein biosynthetic capacity of HepG2 cells in a rapamycin-
independent manner (Song et al., 2011).
PDTC has been shown to attenuate muscle mass loss in several different models
of cancer cachexia (Nai et al., 2007; Puppa et al., 2013b); however the role of PDTC on
the regulation of muscle mass during cachexia is unknown. Therefore the purpose of this
study was to determine if pyrrolidine dithiocarbamate (PDTC) could alter cachexia
induced dysregulation of skeletal muscle proteostasis. We hypothesized that PDTC
administration after the initiation of cachexia would rescue muscle mass through both

68
inhibition of protein degradation pathways and increases in muscle protein synthesis. To
test this hypothesis, ApcMin/+
mice were monitored until they had initiated body weight
loss. PDTC or PBS was administered for two weeks and hindlimb muscle was harvested.
The regulation of muscle protein synthesis and degradation was investigated.

69
4.3 Methods
Animals. ApcMin/+
(Min) male mice, purchased from Jackson Laboratories, were crossed
with C57BL/6 female mice at the Animal Resource Facilities at the University of South
Carolina. Using a tail snip taken at the time of weaning, mice were genotyped for
heterozygous expression of the Apc gene. Male mice were housed four to five per cage,
with Min mice kept in separate cages from control C57BL/6 mice. All mice were group
housed and provided standard rodent chow (Harlan Teklad Rodent Diet, #8604) and
water ad libitum. The room was maintained on a 12:12 light:dark cycle with the light
period starting at 0700. All animal experimentation was approved by the University of
South Carolina’s Institutional Animal Care and Use Committee.
Pyrrolidine dithiocarbamate (PDTC): Animals were aged to 16 weeks when Min mice
had initiated body weight loss. Mice were randomly assigned to receive PBS or PDTC.
Mice were treated by daily IP injections with 10mg/kg of PDTC in PBS (Nai et al.,
2007). PDTC has been shown to decrease STAT3 activity through alterations in the
stability of STAT3-Hsp90 complex (He et al., 2006). Mice were sacrificed after 2 weeks
of treatment and tissues were harvested.
Western Blot analysis: Western blot analysis was performed as previously described
(Puppa et al., 2011d). Briefly, frozen gastrocnemius muscle was homogenized in Mueller
buffer and protein concentration was determined by the Bradford method (Bradford,
1976). Muscle homogenates (20-40 µg protein) were fractionated on SDS-
polyacrylamide gels (6% to 12%). The gels were transferred to PVDF membrane and
stained with ponceau to ensure equal loading. Membranes were blocked in 5% Tris-

70
buffered saline with 0.1% Tween 20 (TBST) milk for 1 h at room temperature. Primary
antibodies for p-AMPK, total AMPK, , p-STAT3, total STAT, pP65, total P65, atrogin-1,
and cytochrome C (cell signaling), anti-puromycin (Millipore), FIS (Sigma), and
MFN1(Novus Biologicals) were incubated at dilutions of 1:2000 to 1:6,000 overnight at
4°C in 1% TBST milk. Secondary anti-rabbit or anti-mouse IgG-conjugated secondary
antibodies were incubated with the membranes at 1:2,000 to 1:5,000 dilutions for 1 h in
1% TBST milk. Enhanced chemiluminescence (Bio Express) was used to visualize the
antibody-antigen interactions and developed by autoradiography. Digitally scanned blots
were analyzed by measuring the integrated optical density (IOD) of each band using
digital imaging software (ImageJ).
mtDNA: Mitochondrial capacity was performed as previously described (White et al.,
2012b). DNA was isolated using DNAzol® Reagent (Invitrogen). Briefly, muscle (20 to
30 mg) was homogenized in 1 ml DNAzol, pelleted with 100% ethanol, and re-suspended
in 8 mM NaOH. Quantitative real-time PCR analysis was carried out in 25 μl reactions
consisting of 2x SYBR green PCR buffer (AmpliTaq Gold DNA Polymerase, Buffer,
dNTP mix, AmpErase UNG, MgCl2) (Applied Biosystems), 0.150 μg DNA, DI water,
and 60 nM of each primer. PCR was run with the DNA sample with Cytochrome B
Forward, 5′ - ATT CCT TCA TGT CGG ACG AG −3′; Cytochrome B Reverse, 5′ - ACT
GAG AAG CCC CCT CAA AT - 3′, Gapdh Forward, 5′ - TTG GGT TGT ACA TCC
AAG CA - 3′; Gapdh Reverse, 5′ - CAA GAA ACA GGG GAG CTG AG - 3′. Samples
were analyzed on an ABI 7300 Sequence Detection System. Reactions were incubated
for 2 minutes at 50°C and 10 minutes at 95°C, followed by 40 cycles consisting of a 15-s

71
denaturing step at 95°C and 1-minute annealing/extending step at 60°C. Data were
analyzed by ABI software (Applied Biosystems) using the cycle threshold (CT). The
ratio between mtDNA and nuclear DNA genes was normalized to wild-type mice and
used as an index of mitochondrial content.
Succinate dehydrogenase staining (SDH): SDH staining was conducted as previously
described (Nachlas et al., 1957). Briefly, 10 µm thick sections from the mid-belly of the
tibialis anterior muscle were cut at −20°C on a cryostat and slides were stored at −80°C
until staining was performed. The sections air dried for 10 minutes then incubated in a
solution of 0.2 M phosphate buffer (pH 7.4), 0.1 M MgCl2, 0.2 M succinic acid and 2.4
mM nitroblue tetrazolium (NBT, Sigma) at 37°C for 45 minutes. The sections were
washed three minutes in water and then dehydrated in 50% ethanol. Stained slides were
mounted with Permount (Calbiochem). Digital photographs were taken from each section
at 25X magnification and fibers were quantified with imaging software (Image J, NIH).
Fibers were considered SDH positive if they were 2 standard deviations above
background. A minimum of 120 fibers were counted from each animal. SDH-positive
fibers were counted in each section in a blinded fashion.
RNA Isolation/PCR: RNA isolation, cDNA synthesis and real-time PCR were performed
as previously described (White et al., 2013b) , using reagents from Applied Biosystems.,
and GAPDH primers were purchased from IDT (Coralville, Iowa, USA). Data were
analyzed by ABI software using the cycle threshold (CT).
Plasma IL-6: Blood was collected at sacrifice via a retro-orbital sinus puncture and
centrifuged at 10,000×g for 10 min. Plasma was collected and stored at −80°C until

72
analysis. Using commercial ELISA kits for IL-6 (Invitrogen) according to the
manufacturer’s instructions, circulating levels of fasting IL-6 were measured.
Tumor Count: Intestinal polyp number and distribution was determined as previously
described (Puppa et al., 2011d). Intestinal sections from mice were fixed with 4% PFA,
stained briefly in 0.1% methylene blue, and then placed under a dissecting microscope.
The polyp number was counted by using tweezers to pick through the intestinal villi and
identify polyps. Polyp sizes were categorized based on size (<1, 1-2, >2mm).
Statistics: A two-way ANOVA was used to determine the effect of PDTC administration
x genotype. Pre-planned t-test was used to look at the effect of PDTC administration
within the ApcMin/+
genotype and is indicated by an asterisk. Post-hoc analyses were
performed with Student-Newman-Keuls method. Significance was set at p<0.05.

73
4.4 Results
Body weight and muscle mass changes
STAT3 is a downstream target of IL-6 signaling. Pyrrolidine dithiocarbamate
(PDTC) has been shown to inhibit STAT3 and NFκB signaling during cancer cachexia
(Puppa et al., 2013b). Two weeks of PDTC administration increased body weight in both
Min and BL-6 mice (Table 4. 1). While cachexia decreased body weight, PDTC
administration after the initiation of cachexia attenuated body weight loss (Fig 4.1A).
Similarly, muscle mass loss was decreased by 34% with cachexia. There was a main
effect of PDTC to increase gastrocnemius muscle mass regardless of cachexia and Min
mice treated with PDTC had a 17% increase in gastrocnemius mass (Fig 4.1B). Cachexia
decreased epidydimal fat mass 75%. There was a main effect of PDTC to increase fat
mass regardless of cachexia (Table 4.1).
Although there was an attenuation of body weight loss, PDTC did not affect
overall tumor number in min mice. However, there was a decrease in percentage of large
tumors >2mm with PDTC administration (Table 4.1). Cachexia was associated with an
increase in plasma IL-6 and the decrease in large tumors with PDTC was not associated
with a change in plasma IL-6. Cachexia induced spleenomegaly which was further
accentuated by PDTC administration (Table 4.1). These data demonstrate that
administration of PDTC can attenuate caner-induced body weight and muscle mass loss
independent of reductions in plasma IL-6 levels.

74
Cachexia mediated muscle signaling
We next sought to determine if PDTC treatment could attenuate cachexia-induced
inflammatory signaling in skeletal muscle. Cachexia increased the phosphorylation of
STAT3 2.8 fold and P65 2.7 fold (Fig 4.2A). PDTC administration decreased the
phosphorylation of STAT3 in both wild type and cachectic mice; however, there was a
trend for PDTC to decrease P65 phosphorylation in Min mice, p=0.12 (Fig 4.2A).
Additionally, AMPK phosphorylation was increased 11 fold in the cachectic mice. PDTC
administration blocked cachexia-induced AMPK phosphorylation (Fig 4.2A). These data
demonstrate that PDTC administration after the initiation of cachexia can block the
cachexia-induction of skeletal muscle inflammatory signaling.
Cachexia is associated with alterations in skeletal muscle protein turnover, with
increases in protein degradation and suppression of muscle protein synthesis. The
expression of skeletal muscle E3 ligase, atrogin-1, was increased 73% with cachexia.
There was a main effect of PDTC to decrease atrogin expression regardless of cachexia
(Fig 4.3A). Cachexia suppressed mTOR target ribosomal protein S6. PDTC increased
muscle S6 phosphorylation regardless of cachexia (Fig 4.3A). As is seen in the human
condition, cachexia decreased muscle protein synthesis, which was measured by
puromycin incorporation into the muscle, by 52%. PDTC blocked cachexia suppression
of muscle protein synthesis in Min mice. Additionally PDTC increased muscle protein
synthesis in wild type by 20% (Fig 4.3B). These data demonstrate that inhibition of
STAT3/NFκB signaling may attenuate cachexia in part through a decrease in muscle
protein degradation signaling and through increases in muscle protein synthesis.

75
Regulation of mitochondrial content
Cachexia is associated with increases in fatigue and decreased skeletal muscle
mitochondrial content. Cachexia caused a 33% reduction in skeletal muscle oxidative
capacity, measured by the percentage of succinate dehydrogenase positive fibers (Fig
4.4A). Inhibition of STAT3/NFκB signaling blocked the cachexia-suppression of muscle
oxidative capacity. As we have previously published (White et al., 2011a), cachexia
decreases skeletal muscle mitochondrial content (Fig 4.4B). There was a main effect of
PDTC to increase mitochondrial content in the gastrocnemius muscle. The cachexia-
suppression of mitochondrial content measured by the ratio of mitochondrial to nuclear
DNA was blocked by PDTC administration (Fig 4.4B).
Mitochondria are regulated by the processes of mitochondrial fission and fusion
termed mitochondrial dynamics. Cachexia decreased mitochondrial fusion protein MFN1
in Min mice (Fig 4.5A), as has been previously described (White et al., 2012c). There
was a main effect of PDTC administration to increase MFN1, regardless of cachexia.
Cachexia increased mitochondrial fission protein, FIS1; however, the cachexia-induced
increase in FIS1 was unaltered by PDTC administration (Fig 4.5A). Coinciding with a
decrease in mitochondrial content and increase fission, skeletal muscle Cytochrome C
content was suppressed 31% with cachexia, and PDTC attenuated this suppression (Fig
4.5A). Skeletal muscle MFN1 mRNA levels were decreased 76% with cachexia, and
PDTC attenuated this suppression (Fig 4.5B). Similar to the protein levels, both PDTC
and cachexia increased FIS1 mRNA. These data demonstrate that systemic signaling
through STAT/NFκB may regulate cachexia suppression of mitochondrial capacity and
regulate mitochondrial fusion without suppressing mitochondrial fission.

76
4.5 Discussion
Chronic inflammation, a hallmark of cancer cachexia, is a potential therapeutic
target to combat the condition. Although there are currently no approved treatments for
cancer cachexia, two separate case studies in patients with cancer cachexia demonstrate
improved symptoms with Tocilizumab, an IL-6r Ab, administration (Ando et al., 2013;
Hirata et al., 2013). Inflammatory signaling through IL-6 and muscle gp130/STAT3
signaling are shown to regulate muscle protein degradation in tumor-bearing mice
(Bonetto et al., 2012; Puppa et al., 2013b; White et al., 2011b; White et al., 2013b).
However, significant gaps remain in our understanding of how cancer-induced systemic
inflammation regulates the disruption of skeletal muscle protein turnover. We report that
the small molecule pyrrolidine dithiocarbamate was able to suppress markers of muscle
protein degradation, but also increased skeletal muscle protein synthesis and
mitochondrial content without suppressing plasma IL-6 levels.
STAT3 and NFκB have well documented roles in the pathogenesis of skeletal
muscle atrophy during cancer cachexia (Bonetto et al., 2012; Bonetto et al., 2011; Cai et
al., 2004b; Guttridge et al., 2000); however, the focus of muscle loss with cachexia has
been placed on the inhibiting the cachexia-induced muscle proteolysis. Long term
inhibition of muscle proteolysis without release of protein synthesis inhibition may not be
beneficial in the cachectic patient as it may lead to the accumulation of dysfunctional
proteins increasing cellular stress. We demonstrate that PDTC can both inhibit protein
degradation signaling and increase muscle protein synthesis without alterations in
circulating IL-6 levels, suggesting that IL-6 may not be the main suppressor of protein
synthesis during cancer cachexia. This is further supported by the fact that neither IL-6r

77
Ab administration nor muscle gp130 inhibition are able to alleviate the cachexia-
suppression of muscle protein synthesis; but appear to regulate muscle catabolism
(Bonetto et al., 2012; Puppa et al., 2013b; White et al., 2013b).
One potential mechanism through which PDTC may be attenuating skeletal
muscle loss is through the suppression of inflammation induced protein degradation.
Chronic IL-6 exposure is documented to induce skeletal muscle protein breakdown
(Fujita et al., 1996; White et al., 2011b). IL-6 activates STAT3 which in turn leads to
activation of several signaling pathways implicated in the regulation of cachexia-induced
protein degradation including FOXO and C/EBPβ (Bonetto et al., 2012; Reed et al.,
2012; Zhang et al., 2011). STAT3 can directly regulate IL-6 induced transcription of
C/EBPβ (Niehof et al., 2001), and STAT3 can directly bind to the FOXO promoter as
well as interact with cytoplasmic FOXO to regulate targeted transcription (Oh et al.,
2012). PDTC decreased STAT3 activation which could be responsible for the overall
suppression of muscle protein degradation signaling.
Few therapies have been shown to increase muscle protein synthesis in the
cachectic patient. We demonstrate that PDTC can increase muscle protein synthesis in
both healthy and cachectic mice. PDTC has been shown to increase protein biosynthetic
capacity in HepG2 cells through a rapamycin independent mechanism (Song et al., 2011).
PDTC may work through the rapamycin insensitive mTORC2 complex to up regulate
muscle protein synthesis. mTOR2 requires ribosomes for signaling; however, little is
known about the independent regulation of protein synthesis through mTORC2 (Zinzalla
et al., 2011). Another mechanism by which PDTC could increase muscle protein
synthesis is through decreased cachexia-induced AMPK phosphorylation. We have

78
recently demonstrated that inhibition of AMPK can attenuate IL-6 suppression of protein
synthesis in C2C12 myotubes (White et al., 2013b). Additionally exercise training can
suppress cachexia-induced AMPK activation and prevented decreases in protein
synthesis (Puppa et al., 2011d; White et al., 2013b). PDTC inhibited cachexia-induced
AMPK phosphorylation potentially relieving inhibition of protein synthesis.
As well as increasing muscle protein synthesis PDTC increased muscle
mitochondrial content. Recent literature has shown that mTOR signaling is important in
the regulation of many oxidative genes (Cunningham et al., 2007). When the mTOR
complex is inhibited there is a decrease in muscle oxidative capacity and function
(Schieke et al., 2006) suggesting that mTOR is an important mediator for the
maintenance of mitochondria. As previously reported we demonstrate cachexia
suppression of skeletal muscle mitochondria content (Bing et al., 2000; Fermoselle et al.,
2013; Julienne et al., 2012; Tisdale, 2002; White et al., 2011a; White et al., 2012b). As
well as playing a role in protein synthesis the mitochondria play a vital role in protein
degradation, apoptosis, and autophagy. One way in which the mitochondria can work to
regulate protein degradation is through regulation of FOXO. When FOXO is blocked
even in the presence of mitochondrial fission, muscle atrophy is prevented (Romanello et
al.). We demonstrate increased mitochondrial fission and fusion with PDTC. Cachexia
induction of fission was unaltered by PDTC; however, cachexia suppression of fusion
was attenuated with PDTC. Further work is needed to determine the regulation of FOXO
by PDTC.
In conclusion we demonstrate that two weeks of PDTC treatment after the
initiation of cachexia was able to prevent further body weight and muscle mass loss.

79
Cachexia induced activation of skeletal muscle STAT3 and AMPK were suppressed with
PDTC. Interestingly, the suppression of muscle inflammatory signaling was independent
of systemic IL-6. We report that PDTC could attenuate both activation of muscle protein
degradation and suppression of muscle protein synthesis. Additionally, PDTC released
cachexia suppression of muscle mitochondrial content that was associated with
suppressed mitochondrial fusion, but not fission. Further work is needed to determine
how PDTC attenuates the cachexia suppression of protein synthesis and mitochondrial
content. These data suggest that PDTC may be of therapeutic value for the treatment of
cachexia.

80
Table 4.1. The effect of pyrrolidine dithiocarbamate on cachexia
development in ApcMin/+
mice. Body weight (BW) was measured throughout the
duration of the study. Tibia length, spleen, epidydimal fat, intestines and plasma
were collected at the time of sacrifice. All values are mean ±sem. Two-way
ANOVA was used to determine the effects of genotype x treatment (PDTC). #
Main effect of Min, & Main effect PDTC. * compared to control group within
genotype, † significant from all other comparisons, p<0.05.
BL-6
ApcMin/+
PBS PDTC
PBS PDTC
N 5 5
5 6
Peak BW (g) 25.7 ± 1.2 27.8 ± 1.1
24.0 ± 0.5 25.4 ± 0.4
16wk BW (g) 25.3 ± 1.1 27.2 ± 1.1
22.4 ± 0.3# 23.8 ± 0.5
#
18wk BW (g) 25.7 ± 1.2 27.8 ± 1.1&
20.7 ± 0.5# 24.6 ± 0.2
&#
Tibia Length (mm) 16.7 ± 0.1 17.2 ± 0.1
16.6 ± 0.2 16.9 ± 0.1
Epididymal Fat 287 ± 41 429 ± 48&
41 ± 41# 135 ± 43
#,&
Spleen (mg) 106 ± 13 88 ± 8
424 ± 67† 661 ± 14†
Tumor Number - -
46 ± 11 56 ± 7
Tumors >2mm (%) - -
93 ± 5 69 ± 3*
IL-6 (pg/ml) 0.0 ± 0.0 0.0 ± 0.0
71 ± 24# 46 ± 8
#

81
4.6 Figure Legends
Figure 4.1. The effect of pyrrolidine dithiocarbamate on the progression of cachexia
in ApcMin/+
mice. Mice were aged to 16 weeks when body weight loss was initiated and
received two weeks of PDTC treatment. A) The percent body weight loss from the peak
body weight to the time of sacrifice was calculated. B) Gastrocnemius muscle mass was
measured at the time of sacrifice. T-test was used to analyze the effect of PDTC within
the min, * Significant from Min control. Two-way ANOVA was used to analyze the
effects of genotype and PDTC administration. & Main effect of PDTC, # Main effect of
Min. Significance was set at p<0.05.
Figure 4.2. The effect of pyrrolidine dithiocarbamate on cachexia-induced muscle
inflammatory signaling. Western blot analysis of cachexia induced muscle
inflammatory signaling including P-STAT3 and P-AMPK was measure in the
gastrocnemius of mice with and without PDTC administration for two weeks. Two-way
ANOVA was used to analyze the effects of genotype and PDTC administration. & Main
effect of PDTC, † Significantly different from all other comparisons. Significance was set
at p<0.05.
Figure 4.3. The effect of pyrrolidine dithiocarbamate on the regulation of muscle
protein turnover. A) Regulation of muscle protein turnover was measured using western
blot analysis of Atrogin-1 as a marker of protein degradation and P-S6 as a marker of
muscle mTOR signaling. B) Muscle protein synthesis was measured by the incorporation

82
of puromycin into skeletal muscle. Two-way ANOVA was used to analyze the effects of
genotype and PDTC administration. & Main effect of PDTC, # Main effect of Min, †
Significantly different from all other comparisons. Significance was set at p<0.05.
Figure 4.4. The effect of pyrrolidine dithiocarbamate on muscle mitochondrial
content. A) Skeletal muscle mitochondrial oxidative capacity was measured by the
percentage of dark succinate dehydrogenase (SDH) stained fibers. B) Mitochondrial
content was measured as the ratio of mitochondrial Cytochrome B gene expression to
nuclear GAPDH gene expression in gastrocnemius muscle. Pre-planned t-test was used to
analyze the effect of PDTC within the min, * Significant from Min control. Two-way
ANOVA was used to analyze the effects of genotype and PDTC administration. & Main
effect of PDTC, # Main effect of Min. † Significantly different from all other
comparisons. Significance was set at p<0.05.
Figure 4.5. The effect of pyrrolidine dithiocarbamate on the regulation of muscle
mitochondria. A) Skeletal muscle protein content of mitochondrial fusion protein,
MFN1, mitochondrial fission protein, FIS, and mitochondrial content marker cytochrome
c was measured by Western blot analysis. B) Gastrocnemius muscle mRNA expression
of mitochondrial dynamic regulators MFN1 and FIS, and mitochondrial biogenesis
marker PGC-1α. Pre-planned t-test was used to analyze the effect of cachexia *
Significant from BL-6 control. Two-way ANOVA was used to analyze the effects of

83
genotype and PDTC administration. & Main effect of PDTC, # Main effect of Min. †
Significantly different from all other comparisons. Significance was set at p<0.05.
.

84
*
A)
B)
#,&
&
#
*
Figure 4.1. The effect of pyrrolidine dithiocarbamate on the progression of
cachexia in ApcMin/+
(Min) mice. Mice were aged to 16 weeks when body weight loss
was initiated and received two weeks of PDTC treatment. A) The percent body weight loss from the peak body weight to the time of sacrifice was calculated. B)
Gastrocnemius muscle mass was measured at the time of sacrifice. T-test was used to
analyze the effect of PDTC within the min, * Significant from Min control. Two-way
ANOVA was used to analyze the effects of genotype and PDTC administration. & Main
effect of PDTC, # Main effect of Min. Significance was set at p<0.05.

85
BL-6 BL-6+
PDTC ApcMin/+ApcMin/+ +
PDTC
P-STAT3
P-AMPK
STAT3
AMPK
†
†
& &
P-P65
P65
##
Figure 4.2. The effect of pyrrolidine dithiocarbamate on cachexia-induced muscle
inflammatory signaling. Western blot analysis of cachexia induced muscle inflammatory signaling including P-STAT3 and P-AMPK was measure in the
gastrocnemius of mice with and without PDTC administration for two weeks. Two-
way ANOVA was used to analyze the effects of genotype and PDTC administration. &
Main effect of PDTC, † Significantly different from all other comparisons. Significance was set at p<0.05.

86
#,&
&
#
Figure 4.3
A)
Atrogin
BL-6 BL-6+
PDTC ApcMin/+ApcMin/+ +
PDTC
P-S6
Total S6
#,&
&
#

87
Puromycin
BL-6 BL-6+
PDTC ApcMin/+ApcMin/+ +
PDTC
B)N
†
†
Ponceau
Figure 4.3. The effect of pyrrolidine dithiocarbamate on the regulation of muscle
protein turnover. A) Regulation of muscle protein turnover was measured using western blot analysis of Atrogin-1 as a marker of protein degradation and P-S6 as a
marker of muscle mTOR signaling. B) Muscle protein synthesis was measured by the
incorporation of puromycin into skeletal muscle. Two-way ANOVA was used to analyze the effects of genotype and PDTC administration. & Main effect of PDTC, #
Main effect of Min, † Significantly different from all other comparisons. Significance
was set at p<0.05.

88
Figure 4.4
Control PDTC
BL-6
Min
25X
†
Figure 4-4
A)

89
B)
#,&
&
#
*
Figure 4.4. The effect of pyrrolidine dithiocarbamate on muscle mitochondrial
content. A) Skeletal muscle mitochondrial oxidative capacity was measured by the
percentage of dark succinate dehydrogenase (SDH) stained fibers. B) Mitochondrial content was measured as the ratio of mitochondrial Cytochrome B gene expression to
nuclear GAPDH gene expression in gastrocnemius muscle. Pre-planned t-test was
used to analyze the effect of PDTC within the min, * Significant from Min control.
Two-way ANOVA was used to analyze the effects of genotype and PDTC
administration. & Main effect of PDTC, # Main effect of Min. † Significantly
different from all other comparisons. Significance was set at p<0.05.

90
††
#,&
&
#
BL-6 BL-6+
PDTC ApcMin/+ApcMin/+ +
PDTC
MFN1
FIS
Cyto C
†
# #& &
A)
B)
*
Figure 4.5. The effect of pyrrolidine dithiocarbamate on the regulation of muscle mitochondria. A) Skeletal muscle protein content of mitochondrial fusion protein, MFN1,
mitochondrial fission protein, FIS, and mitochondrial content marker cytochorme c was
measured by Western blot analysis. B) Gastrocnemius muscle mRNA expression of mitochondrial dynamic regulators MFN1 and FIS, and mitochondrial biogenesis marker
PGC-1α. Pre-planned t-test was used to analyze the effect of cachexia * Significant from
BL-6 control. Two-way ANOVA was used to analyze the effects of genotype and PDTC
administration. & Main effect of PDTC, # Main effect of Min. † Significantly different from all other comparisons. Significance was set at p<0.05.
91
CHAPTER 5
SKELETAL MUSCLE GLYCOPROTEIN 130’S ROLE IN LEWIS LUNG CARCINOMA
INDUCED CACHEXIA3.
3 Melissa Puppa, Song Gao, Aditi Narsale, and James Carson Accepted by FASEBJ.
Reprinted here with permission of publisher.

92
5.1 Abstract
Chronic inflammation is associated with cancer cachexia-induced skeletal muscle mass
loss. IL-6 cytokine family members are increased during cancer cachexia, and induce
intracellular signaling through glycoprotein130 (gp130). While muscle STAT3 and
circulating IL-6 are implicated in cancer-induced muscle wasting, there is limited
understanding of muscle gp130's role in this process. Therefore, we investigated the role
of skeletal muscle gp130 for cancer-induced alterations in the regulation of muscle
protein turnover. Lewis lung carcinoma (LLC) cells were injected into 8-wk old mice
with a skeletal muscle gp130 knockout, or wild-type mice. Skeletal muscle loss was
attenuated by 16% in gp130 KO mice, which coincided with attenuated LLC-induced
phosphorylation of muscle STAT3, p38, and FOXO3. The gp130 KO did not rescue
mTOR inhibition or alter AMPK activation. The induction of atrogin expression and p38
phosphorylation in C2C12 myotubes administered LLC media was attenuated by gp130
inhibition, while mTOR inhibition was not rescued. STAT signaling inhibition in LLC
treated myotubes did not attenuate the induction of p38 or AMPK phosphorylation.
During LLC induced cachexia the skeletal muscle gp130 regulates muscle mass signaling
through STAT3 and p38 for the activation of FOXO3 and atrogin, but does not directly
regulate the suppression of mTOR.
KEYWORDS: cachexia, inflammation, skeletal muscle, gp130, Lewis Lung Carcinoma.

93
5.2 Introduction
Cachexia, the unintentional loss of body weight including muscle and fat mass, is
associated with many cancer types (Evans et al., 2008; Fearon et al., 2011; Muscaritoli et
al., 2010). Cachexia occurs in approximately 20% of all cancer patients and is responsible
for 40% of colon cancer related deaths (Bruera, 1997; Tisdale, 2002). Chronic
inflammation is associated with diseases that induce muscle wasting, including cancer
(Tisdale, 2009). Several cytokines are up regulated with cachexia in both human cancer
cachexia and animal models of cachexia such as the ApcMin/+
, the C26 adenocarcinoma,
and the Lewis Lung carcinoma (LLC), including IL-6, TNFα, IL-1β, LIF, CNTF, IFN-γ,
and IL-10 (Argiles et al., 2003; Bonetto et al., 2011; Fortunati et al., 2007; Tazaki et al.,
2011). It is clear that cytokines play a vital role in the development of muscle atrophy
with cachexia. The use of anti-cytokine therapies to combat muscle wasting during
cancer induced cachexia has been widely used (Baltgalvis et al., 2008b; Matthys et al.,
1991; White et al., 2011b). However, further research is required to understand if
inflammatory cytokines exert direct or indirect effects on skeletal muscle to alter protein
turnover and induce wasting.
Circulating levels of the IL-6 family cytokines are associated with cancer
cachexia (Barton and Murphy, 2001; Bonetto et al., 2011; Kamoshida et al., 2006; Mori
et al., 1991; Puppa et al., 2011b; Tisdale, 2009). IL-6 can signal via the classical pathway,
through the membrane receptor, or trans pathway, utilizing soluble IL-6 receptor, to
induce signaling; however gp130 is required for this signaling (Rose-John, 2012). IL-6
family cytokines signal through the gp130 by forming either a heterodimer or homodimer
with the cytokine, its receptor and gp130. Gp130 dimerization leads to activation of

94
several intracellular signaling pathways including JAK/STAT, p38/MAPK, and PI3K/Akt
(Ernst and Jenkins, 2004; Heinrich et al., 1998). In skeletal muscle these signaling
pathways have been associated with the regulation of growth and atrophy (Bonetto et al.,
2012; Schiaffino and Mammucari, 2011; Stitt et al., 2004). While studies have examined
the role of STAT3 and IL-6 specifically, the role of gp130 in skeletal muscle wasting
during cachexia has not been examined.
Skeletal muscle mass is regulated by a balance of protein synthesis and protein
degradation, termed protein turnover. Altered protein turnover is an established
regulatory point of both skeletal muscle mass loss and muscle growth. During cancer
cachexia there is an increase in skeletal muscle protein degradation and suppression in
muscle protein synthesis (MPS) (Tisdale, 2009). Muscle STAT3 signaling is sufficient to
induce skeletal muscle atrophy both in vitro and in vivo, and STAT3 inhibition can
attenuate cancer induced muscle atrophy (Bonetto et al., 2012; Bonetto et al., 2011).
P38/MAPK and C/EBPβ also mediate cancer induced muscle atrophy through the
inhibition of FOXO1/3 phosphorylation and activation of atrogin-1 (Zhang et al., 2011;
Zhang and Li, 2012). While there is strong evidence that gp130 mediated signaling
regulates cancer – induced protein degradation, its role in suppression of protein
synthesis during cancer cachexia remains poorly defined.
Our lab and the work of others have defined important roles for IL – 6, muscle
STAT3 and p38/MAPK signaling in cancer-induced muscle wasting (Bonetto et al.,
2012; White et al., 2013b; Zhang et al., 2011), yet significant gaps remain in our
understanding of the relationship of these signaling pathways to the IL-6 family of
cytokines and their ability to regulate cachexia suppression of MPS. Gp130 is a common

95
regulatory point for the IL-6 family of cytokines, STAT3 and p38 signaling; however,
STAT3 and p38 can be activated by other signaling cascades. Additionally, the gp130
regulates pathways other than STAT3 and p38/MAPK such as PI3K/Akt (Ernst and
Jenkins, 2004). The purpose of this study was to examine the role of the skeletal muscle
gp130 for the regulation of muscle protein turnover during LLC-induced cachexia. We
hypothesize that skeletal muscle gp130 is necessary for muscle STAT3 mediated
inhibition of mTOR signaling and FOXO3a activation during LLC-induced cachexia. We
examined a muscle specific knockout of gp130 during LLC-induced cachexia. The role
of systemic IL-6 and STAT signaling were investigated with administration of PDTC or
IL-6r antibody to mice with LLC tumors.

96
5.3 Methods
Animals. Male mice on a C57BL/6 background were bred with the gp130 fl/fl mice
provided by Dr. Colin Stewart’s lab in collaboration with Dr. Hennighausen (NCI) (Zhao
et al., 2004). Gp130 fl/fl male mice were bred with cre-expressing mice driven by myosin
light chain (MLC) from Dr. Steven Burden (NYU) (Bothe et al., 2000). The resulting fl/fl
cre/cre (skm-gp130) mice have a skeletal muscle deletion of the gp130 protein. Offspring
were genotyped using tail snips for cre recombinase (forward 5’ AAG CCC TGA CCC
TTT AGA TTC CAT TT 3’, reverse 5’ AAA ACG CCT GGC GAT CCC TGA AC 3’,
wild type 5’ GCGGGCTTCTTCACGTCTTTCTTT 3’), floxed gp130 (forward 5’ ACG
TCA CAG AGC TGA GTG ATG CAC 3’, reverse 5’ GGC TTT TCC TCT GGT TCT
TG 3’). All animal experimentation was approved by the University of South Carolina’s
Institutional Animal Care and Use Committee.
IL-6 over-expression: A cohort of skm-gp130 and C57BL/6 mice were electroporated at
12wk of age with either an empty vector or an IL-6 plasmid (n=3-4/group) as previously
described (Baltgalvis et al., 2008b). Muscle was taken at the time of sacrifice at 14 weeks
of age
Lewis Lung Carcinoma implantation: C57BL/6 and skm-gp130 mice were injected with
1x10⁶ Lewis lung carcinoma cells (LLC) on the right flank subcutaneously at 8 weeks of
age (Hariri et al., 2010). Body weights were measured weekly starting at 8 weeks of age.
Tumors were allowed to grow for ~30 days and mice were sacrificed at 13 weeks of age.
IL-6/STAT3 inhibition in vivo: A separate cohort of C57BL/6 mice (n=17) were
implanted with LLC tumor cells at 8 weeks of age. At 12 weeks of age animals were

97
randomized to receive IL-6 receptor antibody or PDTC for one week. No mice died
during the one week of treatment; however, prior to randomization, 5 mice died or had to
be euthanized due to excessive tumor burden or ulcerated tumors.
IL-6 receptor Antibody administration: After four weeks of tumor growth a subset of
mice were treated with 100ug of IL-6 receptor (IL-6r) antibody (Chugai Pharmaceuticals)
as previously described (White et al., 2012b) with modifications. Animals were treated
with IP injections every three days for 1 week receiving IL -6r antibody once every three
days.
Pyrrolidine dithiocarbamate (PDTC): After four weeks of tumor growth a subset of mice
were treated by daily IP injections with 10mg/kg of PDTC in PBS (Nai et al., 2007) for 1
week.
Tissue sampling. At study end points mice were anesthetized with a ketamine/ xylazine/
acepromazine cocktail, and tissues were removed, weighed, and frozen at -80 °C until
further analysis. Blood samples were collected in heparinized capillary tubes from the
retro-orbital sinus.
C2C12 cells. C2C12 myoblasts (American Type Culture Collection, Manassas, VA) were
cultured in Dulbecco’s modified Eagle’s medium (DMEM), supplemented with 10%
FBS, 50U/ml penicillin and 50µg/ml streptomycin. Myoblast differentiation was induced
as previously described (White et al., 2013b). Fully differentiated myotubes were treated
with LLC conditioned media (LCM) for 4h or 72h replacing the media every 24h for
control and treatment groups as previously described (Zhang et al., 2011). IL-6r Ab
(Chugai Pharmaceuticals) and gp130 Ab (Santa Cruz, dialyzed in PBS at 4°C overnight)

98
were administered in the LCM for 72h at a 1: 1000 dilution. PDTC, 50µM (Sigma) and
LLL12 (Bio-Vision), a STAT3 inhibitor (100nM) was administered in the LCM for the
duration of the study (White et al., 2013b). To measure rate of protein synthesis, 1µM
puromycin was added to culture medium 30min before protein collection (Goodman et
al., 2011a). Cells were harvested as previously described (White et al., 2013b).
Myotube Diameter Measurement:
C2C12 myotubes diameter was quantified as previously published (White et al., 2013b).
All measurements were conducted blindly.
Plasma IL-6: Plasma IL-6 was quantified as previously published (Puppa et al., 2011b).
Briefly, blood samples centrifuged at 10,000×g for 10 min at 4°C. Plasma was collected
and stored at −80°C until analysis. An ultra-sensitive mouse IL-6 ELISA (Invitrogen)
was performed according to manufacturer’s instructions.
RNA Isolation/PCR. RNA isolation, cDNA synthesis and real-time PCR were performed
as previously described (White et al., 2013b) , using reagents from Applied Biosystems.
Gp130 (forward 5’ CAG CGT ACA CTG ATG AAG GTG GGA AA 3’, reverse 5’ GCT
GAC TGC AGT TCT GCT TGA 3’) , IGF-1(White et al., 2013a), REDD1 (White et al.,
2013a), IL-6 (Washington et al., 2011), and GAPDH primers were purchased from IDT
(Coralville, Iowa, USA). Data were analyzed by ABI software using the cycle threshold
(CT).

99
Western Blot analysis: Western blot analysis was performed as previously described
(Puppa et al., 2011d). Briefly, gastrocnemius muscle was homogenized and protein
concentration was determined by the Bradford method (Bradford, 1976). Homogenates
were fractionated on SDS-polyacrylamide gels and transferred to PVDF membrane. After
blocking, antibodies for phosphorylated and total 4EBP1, AMPK, S6RP, STAT3, Akt, ,
ubiquitin, GAPDH (Cell signaling), p38 (Santa Cruz), FOXO3a, anti-puromycin
(Millipore), and atrogin-1 (ECM Biosciences)were incubated at dilutions of 1:2000 to
1:6,000 overnight at 4°C in 1% TBST milk. Anti-rabbit or anti-mouse IgG-conjugated
secondary antibodies (Cell signaling) were incubated with the membranes at 1:2,000 to
1:5,000 dilutions for 1 h in 1% TBST milk. Enhanced chemiluminescence was used to
visualize the antibody-antigen interactions and developed by autoradiography. Blots were
analyzed by measuring the integrated optical density (IOD) of each band using ImageJ
software.
Statistical analysis. A two-way ANOVA was used to examine the effects of LLC and
genotype. Post-hoc analyses were performed with Student-Newman-Keuls methods.
Pre-planned t-tests were used examine the effect of gp130 loss in control mice to define
the phenotype. One-way ANOVA was used to analyze all C2C12 experiments.
Significance was set at p<0.05.
100
5.4 Results
Expression of gp130 in C57BL/6 mice
Gp130 mRNA expression was examined in adult C57BL/6 mice. Although gp130
is expressed in all cell types, muscle had significantly greater expression than the liver or
kidney (Fig 5.1A). Skeletal muscle has the greatest expression level and heart expression
was 67% lower than gastrocnemius skeletal muscle. Expression was greatest in the
glycolytic TA muscle, and the lowest expression was found in the oxidative soleus
muscle (Fig 5.1B). These data indicate that while gp130 is ubiquitously expressed, there
is differential expression in tissues and amongst skeletal muscle phenotypes.
Characterization of skm-gp130 mice
The cre-loxP approach was used to generate a muscle specific knockout of the
gp130 in C57BL/6 mice (Fig 5.1C & D) using MLC cre-expressing mice (Bothe et al.,
2000), and gp130 fl/fl mice (Zhao et al., 2004). In skm-gp130 mice, the gp130 mRNA
expression was significantly reduced in all hindlimb muscles examined and the heart, but
not altered in the liver or kidney (Fig 5.1C). Heart CRE activity has been previously
reported with this CRE mouse (Bothe et al., 2000). Since all cell types express gp130,
cells in skeletal muscle other than myofibers will continue to express gp130. There was
no effect of genotype on overall body size measured by tibia length (Table 5.1). There
was a body weight increase in skm-gp130 mice (Table 5.1), which was associated with an
increase in lean mass. This may be partially attributable to increased organ mass, for
example skm-gp130 mice had significantly larger heart, and testes mass (Table 5.1).
There was no effect of genotype on gastrocnemius muscle and epidydimal fat mass
(Table 5.1).

101
Skeletal muscle gp130 loss attenuated Il-6 –induced STAT3 phosphorylation
IL-6 was systemically over expressed to examine gp130 function. Circulating IL-
6 was not detectable in vector control mice, but was increased by over-expression in all
genotypes (skm-gp130+/+ 86.2±12.1pg/mL; skm-gp130 +/- 70.2±14.2 pg/mL; skm-
gp130 -/- 71.0±25.9 pg/mL). Skeletal muscle STAT3 phosphorylation (Y705) in mouse
quadriceps increased 5 fold by IL-6 over-expression in wild-type mice. This induction
was suppressed in skm-gp130 heterozygous mice and blocked in skm-gp130
homozygous mice (Fig 5.1D).
LLC induced body weight loss in skm-gp130 mice
We examined the role of the muscle gp130 in cancer-induced muscle loss using
LLC implanted wild-type and skm-gp130 mice (Table 5.1, Fig 5.2). LLC-induced
cachexia decreased muscle gp130 mRNA expression 50% (Fig 5.2A). We did not detect
gp130 mRNA expression in control or LLC implanted skm-gp130 mice. Loss of muscle
gp130 had no effect on tumor mass (Fig 5.2B). LLC decreased body weight 11% in wild-
type mice, and this loss of body weight was not attenuated in skm-gp130 mice (Fig 5.2C).
Cachexia-related lean body mass loss, measured by DEXA scanning, was attenuated in
skm-gp130 mice when compared to wild-type-mice (Table 5.1). LLC induced a 20%
reduction in gastrocnemius muscle mass, which was attenuated in skm-gp130 mice (Fig
5.2D). LLC implantation decreased epidydimal fat mass 36% and induced
spleenomegaly in wild-type mice. Muscle gp130 loss had no effect on LLC-induced
epidydimal fat mass loss or spleen size (Table 5.1). Plasma IL-6 was increased by LLC
implantation and there was no effect of gp130 loss on circulating IL-6 levels (BL/6
0.0±0.0pg/ml; BL/6 LLC 38.7±13.9pg/ml; skm-gp130 0.0±0.0pg/ml; skm-gp130 LLC

102
16.7±8.1pg/ml). LLC had no effect on heart mass. However, skm-gp130 mice had heart
enlargement that was not affected by the LLC tumor (Table 5.1). LLC implantation
decreased bone mineral density in wild-type mice but not in skm-gp130 mice, suggesting
a muscle bone interaction (Table 5.1).
LLC-induced muscle signaling pathways in skm-gp130 knockout mice
Signaling regulating muscle mass was examined in the gastrocnemius muscle of
wild-type and skm-gp130 mice (Fig 5.3). LLC implantation increased muscle STAT3
phosphorylation and p65 phosphorylation, which were attenuated by skm-gp130 loss (Fig
5.3A). LLC-implantation induced muscle AMPK phosphorylation regardless of
genotype, suggesting LLC-induced AMPK phosphorylation does not require muscle
gp130. The phosphorylation of p38 was induced by LLC implantation in wild-type mice
and skm-gp130 loss ablated this induction (Fig 5.3A). Basal STAT, AMPK, and p38
phosphorylation in muscle were not altered by gp130 loss, while Akt phosphorylation
(Fig 5.3B). LLC induced Akt (T308) phosphorylation in wild-type mice, but
phosphorylation of Akt (S473) was unaltered. The LLC induction of Akt (T308) was not
affected by skm-gp130 loss.
The regulation of LLC-induced signaling mediating protein turnover through
mTOR and FOXO3a was examined in the gastrocnemius (Fig 5.3C). In wild-type mice
LLC suppressed the phosphorylation of mTOR substrates p-4EBP-1 and p-S6RP, and this
suppression was not affected by skm-gp130 loss (Fig 5.3C). LLC implantation reduced
FOXO3a phosphorylation, which was attenuated by skm-gp130 loss. LLC also induced
atrogin-1 expression and the abundance of ubiquitinated proteins, which were attenuated
by skm-gp130 loss (Fig 5.3C, 5.3D). We measured mRNA levels of IGF-1 and REDD1,

103
which are established regulators of muscle anabolic signaling through mTOR (Fig 5.3E).
LLC cachexia decreased muscle IGF-1 mRNA expression and gp130 loss did not rescue
this suppression. Basal REDD1 expression was suppressed in skm-gp130 mice. However,
during LLC-induced cachexia REDD1 expression was induced regardless of genotype
(Fig 5.3E). LLC-induced cachexia increased muscle IL-6 mRNA expression in both
wild-type and skm-gp130 gastrocnemius muscle (Fig 5.3E).
The effect of LLC conditioned media on the regulation of C2C12 myotube growth
To examine the direct role of LLC secreted factors on the regulation of C2C12
myotube growth, myotubes were administered 15% or 25% LLC conditioned media
(LCM). LCM decreased myosin heavy chain expression (Fig 5.4A), while only the higher
dosage of LCM (25%) was sufficient (p ≤ 0.01) to reduce myotube diameter (Control:
32.3 ± 0.7µM; 15% LCM 30.9±0.7µM; 25% LCM 29.0 ± 0.6µM). High dose LCM
administration increased IL-6 mRNA levels, while 15% LCM had no effect on IL-6
mRNA levels (Control: 1.00 ± 0.10; 15% LCM 1.04±0.11; 25% LCM 1.52 ± 0.16 fold
change from control). LCM induced p-STAT3 at 4h, which returned to baseline by 72h
(Fig 5.4B). The phosphorylation of Akt (S473) was unaffected by LCM; however, LCM
decreased mTOR phosphorylation and phosphorylation of substrates 4EBP1 and S6RP in
a dose dependent manner (Fig 5.4C). AMPK was induced after 72h exposure to LCM
(Fig 4C). LCM administration suppressed FOXO3a phosphorylation, while atrogin-1
protein expression was induced (Fig 5.4D).
IL-6 inhibition in LLC mediated C2C12 and in vivo atrophy
We have previously demonstrated that IL-6 can induce C2C12 myotube atrophy
(White et al., 2013b), and we found circulating IL-6 to be significantly elevated (p=0.03)
104
with LLC-induced cachexia (C57BL/6 0.0±0.0pg/ml versus C57BL/6 LLC
38.07±13.9pg/ml). C2C12 myotubes were treated with either IL-6 or LCM and then
administered IL-6 receptor antibody (IL-6r Ab). As previously reported p-STAT3 was
induced by IL-6 administration (White et al., 2013b). IL-6r Ab blocked IL-6-induced
STAT3 phosphorylation, but had no effect on LCM induced STAT3 phosphorylation (Fig
5A). LCM reduced the rate of protein synthesis in C2C12 myotubes 31%, and IL-6r Ab
treatment was not sufficient to rescue this repression (Fig 5.5B). IL-6r Ab had no effect
on LLC induced AMPK or Akt phosphorylation, or suppression of 4-EBP-1 (Fig 5.5C).
LLC activation of protein degradation pathways, measured by FOXO3a phosphorylation
and atrogin-1 expression were unaffected by IL-6r Ab administration (Fig 5.5C).
We examined the role of systemic IL-6 signaling during LLC induced cancer
cachexia in vivo. Acute administration of IL-6r Ab to LLC implanted mice (Table 5.2)
did not rescue the induction of p-STAT3, p-p38, or atrogin-1 (Fig 5.5D). Systemic IL-6
inhibition resulted in a reduction in mTOR substrate S6RP from the already suppressed
levels of LLC implanted mice (Fig 5.5D). LLC decreased protein synthesis, and IL-6r
Ab had no effect on this suppression (Fig 5.5E).
IL-6 signaling inhibition in LLC mediated C2C12 and in vivo atrophy
The effects of STAT3 inhibition on LLC induced myotube signaling was
examined by Pyrrolidine dithiocarbamate (PDTC, a STAT3 and NFκB inhibitor), LLL12
(a STAT specific inhibitor) or gp130 antibody (gp130 Ab) administration. LLC induced
STAT3 phosphorylation was blocked by PDTC, LLL12, and gp130 Ab (Fig 5.6A).
Myotube diameter was decreased with LLC treatment (Fig 5.6B). Inhibition of gp130
attenuated LLC induced myotube atrophy, while IL-6 inhibition did not rescue myotube

105
diameter (Fig 5.6B). LLC suppressed protein synthesis was not rescued by PDTC, LLL12
and gp130 Ab administration (Fig 5.6C). Increased p65 phosphorylation was blocked by
gp130 antibody administration and p38 phosphorylation attenuated. LCM-induced
AMPK phosphorylation was not affected by gp130 Ab administration (Fig 5.6D).
Inhibition of gp130 did not rescue inhibition of mTOR target, 4-EBP1 (Fig 5.6D), but did
suppress the induction of atrogin-1 expression (Fig 5.6D). Specific STAT3 inhibition by
LLL12 did not prevent LLC induced NFκB phosphorylation, p38 activation, or activation
of AMPK (Fig 5.6E). LLL12 was unable to preserve mTOR signaling through 4EBP1;
however, it suppressed LLC-induced atrogin-1 (Fig 5.6E). LCM activation of NFκB was
blocked by PDTC (Fig 6F). PDTC had no effect on LLC induced AMPK activation, p38
phosphorylation, or 4-EBP1, but attenuated atrogin-1 expression (Fig 5.6F).
We examined acute administration of PDTC in vivo (Table 5.2) in cachectic mice bearing
LLC tumors. PDTC reduced muscle STAT3 and p65 phosphorylation (Fig 5.6G). PDTC
administration did not alter LLC induced AMPK or Akt phosphorylation. Interestingly,
phosphorylation of p38 showed a trend (p=0.07) for increasing with PDTC treatment.
Taken together these results demonstrate a role for gp130/STAT3 in LLC-induced
cachexia for the regulation of muscle protein degradation; however the regulation of
LLC-induced suppression of MPS requires further investigation.

106
5.5 Discussion
Chronic inflammation, a hallmark of cancer cachexia, is also a potential
therapeutic target for the devastating condition. IL-6 and muscle JAK/STAT signaling
can regulate muscle mass in tumor-bearing mice (Bonetto et al., 2012; White et al.,
2011b; White et al., 2013b). Although no treatments for cancer cachexia currently are
approved, 2 separate clinical case studies recently published demonstrate improved
cancer patient cachexia symptoms with IL-6r Ab administration (Ando et al., 2013;
Hirata et al., 2013). However, significant gaps remain in our understanding of how
cancer-induced systemic inflammation regulates the disruption of skeletal muscle protein
turnover. To this end our study provides novel information on the role of the skeletal
muscle gp130 for the regulation of muscle protein turnover during LLC-induced
cachexia. We report that skeletal muscle gp130 signaling is an important mediator of
LLC-induced skeletal muscle mass loss, as skm-gp130 mice have attenuated skeletal
muscle mass loss without altered tumor size or fat mass loss. We also report that loss of
gp130 signaling attenuates the LLC- activation of both STAT3 and p38, while activating
Akt phosphorylation. Although LLC-induced gp130 signaling is associated with
activation of FOXO3 / Atrogin signaling, we also provide in vivo and cell culture data
indicating that cancer-induced protein synthesis suppression is independent of these
signaling pathways.
Several IL-6 family cytokines are elevated during cancer cachexia and have a
potential regulatory role for LLC-induced muscle mass loss in the mouse (Kim et al.,
2009; Matthys et al., 1991). Although the gp130 is ubiquitously expressed, our current
study reports that gp130 mRNA expression is higher in skeletal muscle than the liver or
107
kidney. Interestingly, we also demonstrate differential expression of the gp130 mRNA in
the oxidative and glycolytic muscle. Muscle gp130 mRNA expression also demonstrated
plasticity, decreasing with the progression of cachexia. Contrasting with cancer, elevated
skeletal muscle gp130 expression has been reported in diabetic mice (Toledo-Corral and
Banner) , and the gp130 has been identified as a potential therapeutic target for obesity
(Febbraio, 2007). Intracellular signaling initiated by gp130 can regulate growth,
differentiation, and apoptosis (Ernst and Jenkins, 2004). Additionally, gp130 activation
can phosphorylate AMPK, enhance glucose uptake and fatty acid oxidation independent
of STAT3 (Kelly et al., 2004; Watt et al., 2006). This points to the potential for gp130 to
have a dynamic role in the muscle response to the cancer environment. Further work is
needed to determine if the gp130 alters muscle metabolic regulation during different
stages of cachexia and muscle phenotype has a role in the response.
STAT3 has a role in the regulation of muscle protein degradation during wasting
with cancer (Bonetto et al., 2012; Bonetto et al., 2011) and can regulates atrogin-1
expression in C-26 tumor bearing mice (Bonetto et al., 2012). However, the mechanism
by which the cachectic environment and/or circulating IL-6 activate muscle STAT3 is not
well understood. STAT3 can be activated by pro-inflammatory cytokines in the IL-6
family, but also can be activated by leptin (Baeza-Raja and Muñoz-Cánoves, 2004), IFN
γ (Akimoto et al., 2005b) and epidermal growth factor signaling (Widegren et al.,
1998).We have extended these findings to demonstrate a role for muscle gp130 signaling
for the induction of FOXO3 activation and the atrogin-1 expression both in vivo and in
vitro. LLC-induced muscle STAT3 phosphorylation was attenuated by muscle specific
loss of gp130, and gp130 antibody administration blocked LLC media induced STAT3

108
phosphorylation in cultured myotubes. Our data suggest muscle STAT3 induction during
LLC-induced cachexia may be at least in part independent of circulating IL-6. IL-6r
antibody administration to LLC tumor bearing mice and LCM-treated myotubes was not
sufficient to attenuate STAT3 phosphorylation, as in ApcMin/+
mice (White et al., 2011b).
While STAT3 has been closely linked with muscle mass loss through regulation of
degradation pathways, there may be redundancy in the activation of protein degradation
cachectic mediators such as myostatin (Murphy et al.), FOXO (Reed et al.), and C/EBPβ
(Zhang et al., 2011). Interestingly, we have shown previously that chronically activated
STAT3 does not lead to muscle mass loss in treadmill exercising mice (Puppa et al.,
2011d), suggesting that STAT3 regulation of skeletal muscle mass can be circumvented
by other signaling pathways.
p38, a member of mitogen-activated protein kinases, serves as a nexus for signal
transduction and is involved in a large variety of cellular processes. In skeletal muscle,
p38 can be activated by many stress signals including oxidative stress, inflammatory
cytokines and exercise. Activation of this pathway can regulate many functions in muscle
including myogenesis (Wu et al., 2000), exercise induced PGC-1α transcription (Akimoto
et al., 2005b) and exercise induced glucose uptake (Widegren et al., 1998). However,
chronic p38 activation in skeletal muscle has been implicated in pathologies, such as
muscle wasting by activating the FOXO3/ atrogin-1 protein degradation pathway (Zhang
et al., 2011; Zhang and Li, 2012). p38 MAPK signaling may participate in local
activation of NFκB (Baeza-Raja and Muñoz-Cánoves, 2004), which is another upstream
activator of atrogin-1/MAFbx expression and muscle wasting (Cai et al., 2004a). We
report that LLC-induced muscle p38 phosphorylation is dependent on the presence of the
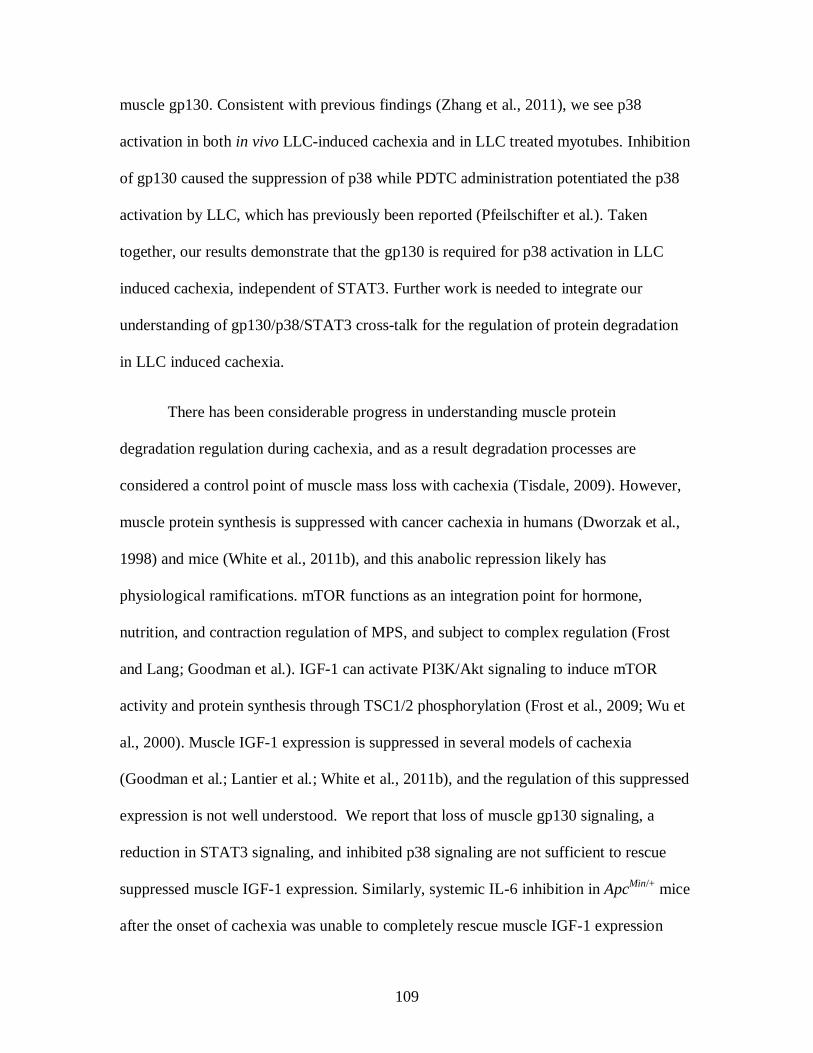
109
muscle gp130. Consistent with previous findings (Zhang et al., 2011), we see p38
activation in both in vivo LLC-induced cachexia and in LLC treated myotubes. Inhibition
of gp130 caused the suppression of p38 while PDTC administration potentiated the p38
activation by LLC, which has previously been reported (Pfeilschifter et al.). Taken
together, our results demonstrate that the gp130 is required for p38 activation in LLC
induced cachexia, independent of STAT3. Further work is needed to integrate our
understanding of gp130/p38/STAT3 cross-talk for the regulation of protein degradation
in LLC induced cachexia.
There has been considerable progress in understanding muscle protein
degradation regulation during cachexia, and as a result degradation processes are
considered a control point of muscle mass loss with cachexia (Tisdale, 2009). However,
muscle protein synthesis is suppressed with cancer cachexia in humans (Dworzak et al.,
1998) and mice (White et al., 2011b), and this anabolic repression likely has
physiological ramifications. mTOR functions as an integration point for hormone,
nutrition, and contraction regulation of MPS, and subject to complex regulation (Frost
and Lang; Goodman et al.). IGF-1 can activate PI3K/Akt signaling to induce mTOR
activity and protein synthesis through TSC1/2 phosphorylation (Frost et al., 2009; Wu et
al., 2000). Muscle IGF-1 expression is suppressed in several models of cachexia
(Goodman et al.; Lantier et al.; White et al., 2011b), and the regulation of this suppressed
expression is not well understood. We report that loss of muscle gp130 signaling, a
reduction in STAT3 signaling, and inhibited p38 signaling are not sufficient to rescue
suppressed muscle IGF-1 expression. Similarly, systemic IL-6 inhibition in ApcMin/+
mice
after the onset of cachexia was unable to completely rescue muscle IGF-1 expression

110
(White et al., 2011b). Despite suppressed IGF-1, Akt phosphorylation can increase during
cachexia (White et al., 2011b), and cachexia-induced mTOR suppression is independent
of Akt activation in the ApcMin/+
mouse and the LLC implant model (White et al., 2011b).
We demonstrate that gp130 / STAT3 signaling is not a direct regulator of cachexia-
induced suppression of protein synthesis.
AMP-activated protein kinase (AMPK) is a cellular sensor of nutrient stress and
can negatively regulate skeletal muscle mass (Goodman et al., 2011b). AMPK inhibits
mTORC1 formation through phosphorylation of raptor and TSC1/2, resulting in
suppressed protein synthesis. Additionally, AMPK 1 & 2 knockouts produce skeletal
muscle and cultured myotube hypertrophy (Lantier et al.). As it relates to the cachectic
condition, AMPK can be activated by IL-6 in cultured myotubes and suppress protein
synthesis (White et al., 2013b) and gp130 in the presence of IL-6r is sufficient for STAT3
independent AMPK activation (Watt et al., 2006). During LLC-induced cachexia muscle
AMPK phosphorylation increased and LCM induced AMPK phosphorylation in C2C12
myotubes. However, inhibition of gp130, IL-6, or STAT3 signaling was not sufficient to
attenuate LLC induction of AMPK. This suggests gp130/STAT3 independent
mechanisms regulating AMPK during LLC-induced cancer cachexia. We have
previously shown that treatment of C2C12 myotubes with compound C, an AMPK
inhibitor, can alleviate IL-6 suppression of protein synthesis (White et al., 2013b).
REDD1 is a potent suppressor of mTOR, which is increased in the cachectic condition
(White et al., 2011b). REDD1 can suppress mTORC1 through the dissociation of
TSC2/14-3-3 complex (Ho et al., 2005) and REDD1 can suppress mTOR independently
of AMPK (Frost and Lang). The inhibition of skeletal muscle gp130 signaling did not

111
alter LLC-induced REDD1 expression. A better understanding of the mechanistic
relationship between the regulation of protein degradation and synthesis in cachectic
muscle is needed.
In summary this is the first study to examine the role of skeletal muscle gp130
regulation on protein turnover during cachexia. Inhibition of skeletal muscle gp130
attenuated LLC induced muscle atrophy. Additionally, activation of STAT3, p38, and
NFκB were suppressed with skeletal muscle gp130 inhibition. The LLC-induced
activation of FOXO3a protein degradation signaling was suppressed by gp130/STAT3
inhibition both in vivo and in vitro. Interestingly, inhibition of IL-6 was not sufficient to
repress LLC-induced atrophy signaling. We report a gp130/STAT3 independent
suppression of mTOR signaling. Further work is necessary to determine the LLC
inhibition of protein synthesis during cachexia. Additionally, LLC tumor appears to not
be an IL-6 dependent cachexia model, consequently further work is needed to establish
the role of muscle gp130 on the regulation of cachexia that is more IL-6 dependent.
Targeted gp130 therapies may be useful in combination with treatments that alleviate the
suppression of mTOR signaling.

112
ACKNOWLEDGEMENTS
The authors thank Ms. Tia Davis and Dr. Marj Peña for technical assistance with the
animal breeding. The skeletal muscle-specific cre-expressing mice were a gift from Dr.
Steven Burden. The gp130 fl/fl mice were a gift from Dr. Colin Stuart & Dr.
Hennighausen, NCI. The research described in this report was supported by research
grant R01 CA121249 to JAC from the National Cancer Institute.

113
Table 5.1. Changes in body weight, fat mass, and muscle mass with LLC induced
cachexia. At 8 weeks of age skm-gp130 mice were implanted with LLC cells (1X10⁶).
All muscle, epidydimal (Epi) fat, and organs were excised and weighted at the time of
sacrifice. Mice received a DEXA scan at the time of sacrifice. Bone mineral density
(BMD) and tumor free lean mass were measured. All values are represented as Mean ±
SEM. * different from control within genotype, † different from all other comparisons,
#
main effect of skm-gp130, $ main effect of LLC p<0.05.
BL/6 skm-gp130
Control LLC Control LLC
(n=5) (n=6) (n=5) (n=6)
Body Weight
BW @ Sac (g) 25.2 ± 0.4 24.4 ± 1.1 27.2 ± 0.4#
27.5 ± 0.8#
BW-tumor (g) 25.2 ± 0.5 22.4 ± 0.5†
27.2 ± 0.4 24.7 ± 0.5*
Lean mass (g) 18.8 ± 0.3 17.3 ± 0.4†
20.2 ± 1.2#
19.3± 0.6#
Tibia Length (mm) 16.7 ± 0.1 16.8 ± 0.1
16.9 ± 0.1 16.8 ± 0.0
Epi Fat (mg) 376 ± 32 239 ± 55$
372 ± 25 258 ± 26$
Gastrocnemius
(mg) 133.5 ± 2.4 106.8 ± 5.3
†
125.8 ± 4.9 120.6 ± 5.6
Organs
Heart (mg) 96.8 ± 0.9 99.2 ± 6.1.6 117.0 ± 4.6#
105.7 ± 2.6#
Testes (mg) 182 ± 3 178 ± 7 215 ± 6#
210 ± 5#
Spleen (mg) 87.6 ± 3.7 247.0 ± 58.4$
91.8 ± 1.8 244.0 ± 44.2$
BMD (g/cm
2
) 0.0514 ± 0.001 0.0467 ±
0.001*
0.0482 ±
0.001
0.0493 ±
0.001

114
Table 5.2. Body weight, fat mass, and muscle mass in LLC induced cachexia with
acute IL-6r-Ab or PDTC administration. At 8 weeks of age a separate group of mice
were implanted with LLC cells (1X10⁶). After 4 weeks of tumor growth mice were
randomized and treated with PBS, IL-6r-Ab, or PDTC for one week. Body weights were
measured. Muscles and fat were excised and weighed at the time of sacrifice. All values
are represented as Mean ± SEM. One-way ANOVA was used to compare data across
treatments. *Significant compared with control, †Significantly different from all other
comparisons p<0.05.
Control LLC
LLC +
IL-6r Ab
LLC +
PDTC
(n=5) (n=4) (n=4) (n=4)
BW @ Sac (g) 27.3±1.2 23.4±2.4 26.2±0.9 24.4±1.3
BW - tumor (g) 27.3±1.2 20.1±1.4* 23.1±0.6* 22.1±0.8*
Tumor (g) - 3.27±1.20 3.08±0.94 2.26±0.98
Epi Fat (mg) 429±48 111±16* 166±46* 165±47*
Gastrocnemius (mg) 141.6±7.2 92.5±6.8* 113.3±5.8* 99.3±5.3*
Spleen (mg) 104±22 397±59* 354±87* 277±70*
Tibia Length (mm) 16.9±0.2 16.5±0.1 16.6±0.1 16.5±0.1

115
5.6 Figure Legends
Figure 5.1. Mouse tissue expression of gp130. A) gp130 is differentially expressed in
tissues. B) Differential expression of gp130 mRNA in the soleus (Sol), gastrocnemius
(Gastroc), Tibialis anterior (TA) muscles of C57BL/6 mice. C) PCR analysis of gp130
mRNA (643bp product size) in the gastrocnemius (Gas), soleus (Sol),Tibialis anterior
(TA) muscles, liver, kidney and heart of skm - gp130 +/+, skm-gp130+/-
mice and skm-
gp130-/-
mice. D) STAT3 protein phosphorylation in heterozygous and homozygous
skm- gp130 knockout after two weeks of IL-6 over-expression. All values are
represented as Mean ± SEM. †Significantly different from all other comparisons.
*Significantly different form genotype vector control, p<0.05.
Figure 5.2. The effect of skm-gp130 on development of cancer induced cachexia. At
8 weeks of age wild-type BL/6 mice and skm-gp130-/-
(skm-gp130) mice were implanted
with LLC tumor cells. Tumors were allowed to grow until 13 weeks of age. A) Skeletal
muscle gp130 expression changes with LLC induced cachexia in wild-type and skm-
gp130 mice in the gastrocnemius (ND:not detected). B) Tumor mass was measured at the
time of sacrifice C) Percent change in body weight (BW) from genotype control and D)
percent change in gastrocnemius muscle mass were calculated from weights collected at
the time of sacrifice. All values are represented as Mean ± SEM .***significantly
different from BL/6 p<0.05.
Figure 5.3. The effect of skm-gp130 on LLC induced signaling. A) Western blot
analysis of p-STAT3, total STAT3, p-AMPK, total AMPK, p-p38, total p38 and p – NF -
B, total NF - B protein expression. Ponceau stain was used to verify equal loading.

116
B.) Western blot analysis of p-Akt(T308), p-Akt(S473), and total Akt, Graphical analysis
of western blots are expressed as a ratio of phosphorylated to total protein levels. C)
Western blot analysis of mTOR signaling proteins p-4EBP1, total 4EPB1, p-S6, total S6,
p-FOXO3, total FOXO3, and Atrogin. Ponceau stain was used to ensure equal loading.
Graphical analysis of phospho- proteins is expressed as a ratio of phosphorylated to total
protein levels. D) Levels of ubiquinated proteins were quantified by western blot
analysis. Dashed line indicates different sections of same gel. E) Skeletal muscle mRNA
expression of IGF-1, REDD1, and IL-6 was measured in the gastrocnemius. All values
are represented as Mean ± SEM. Two-way ANOVA was used to analyze the effect of
skm-gp130 and LLC. †significantly different from all other comparisons, **significantly
different from BL/6 LLC, *significantly different BL/6 control p<0.05.
Figure 5.4. The effect of LLC conditioned media on Myosin Heavy Chain level,
STAT3 signaling and protein turnover regulation in C2C12 myotubes. A) Myotube
atrophy induced by 72h LCM was measured with protein levels of Myosin Heavy Chain.
B) Inflammatory signaling, STAT3 induced by administration of LCM for 4 or 72h. C)
Protein expression of p-AKT, total Akt, p-AMPK, total AMPK, p-mTOR, total mTOR,
p-S6, total S6, p-4EBP1, and total 4EPB1 after 72h incubation with LCM was measured
by western blots. Graphical analysis of mTOR signaling proteins are expressed as a ratio
of phosphorylated to total protein levels. D) Protein expression of p-FOXO3, total
FOXO3, Atrogin, and GAPDH was measured by western blots. Graphical analysis of
AMPK and FOXO3 is expressed as a ratio of phosphorylated to total protein levels..
Values are the means ± SEM. Data were analyzed with one-way ANOVA. *:p ≤ 0.05, **:
p ≤ 0.01, ***: p ≤ 0.005, significant different from control group.

117
Figure 5.5. The effect of IL-6 inhibition on LLC induced signaling. A) p-STAT3 and
total STAT3 protein expression was measured via western blot analysis in fully
differentiated C2C12 cells treated with IL-6 (100ng/ml) or LCM (25%) with or without
IL-6r Ab (1:1000) for 4h. B) Protein synthesis was measured by the incorporation of
puromycin into proteins in C2C12 cells treated with LCM (25%) with or without IL-6r
Ab (1:1000) for 72h. C) Protein expression of p-Akt, total Akt, p-AMPK, total AMPK, p-
4EBP1, total 4EBP1, p-FOXO3, total FOXO3, Atrogin and GAPDH was measured by
western blots in C2C12 cells treated with LCM (25%) with or without IL-6r Ab (1:1000)
for 72h. Graphical analysis of Akt, AMPK, 4EBP1, and FOXO3 is expressed as a ratio of
phosphorylated to total protein levels. D) IL-6r Ab was administered acutely in vivo in
mice with LLC tumors for 1 week after tumor development. Western blot analysis of
LLC associated signaling including STAT3, p38, Akt, S6RP, and atrogin-1 were
measured. E) Protein synthesis was measured by incorporation of puromycin into the
proteins 30 minutes after injection and measured by western blot. Dashed line indicates
different sections of same gel. Values are the means ± SEM. Cell culture data were
analyzed with one-way ANOVA and in vivo data analyzed with t-test. *:p ≤ 0.05, **: p ≤
0.01, ***: p ≤ 0.005, significant different from control group.
Figure 5.6. The effect of gp130/STAT signaling inhibition on LLC induced signaling.
Fully differentiated C2C12 cells were treated with LCM with or without PDTC
(STAT/NFκB inhibitor, 50µM), LLL12 (STAT3 specific inhibitor, 100nM) and gp130
receptor antibody (1:1000) for 4h (A) or 72h (B, C, D, E,F) A) p-STAT3 and total
STAT3 protein expression was measured via western blot analysis after 4 hour treatment.
B) Diameter of C2C12 myotubes after 72h of LLC, PDTC, LLL12 or gp130 antibody

118
administration. C) Relative protein synthesis rates were measured by the incorporation of
puromycin into proteins after 72 hours of PDTC, LLL12 or gp130 antibody
administration. D-F) C2C12 signaling proteins was measured after 72h of D), gp130
antibody, E) LLL12, or F) PDTC administration in the presence of LCM by western blot
analysis. G) PDTC was administered for 1 week to mice bearing LLC tumors. Western
blot analysis of LLC associated signaling including STAT3, P65, AMPK, P38, and Akt,
were measured. Graphical representation is displayed as the ratio of phosphorylate to
total protein levels. Values are the means ± SE. Cell culture data were analyzed with one-
way ANOVA and in vivo data analyzed with t-test *:p ≤ 0.05, **: p ≤ 0.01, ***: p ≤
0.005, significant different from control group, #:p ≤ 0.05, significant different from LLC
group.
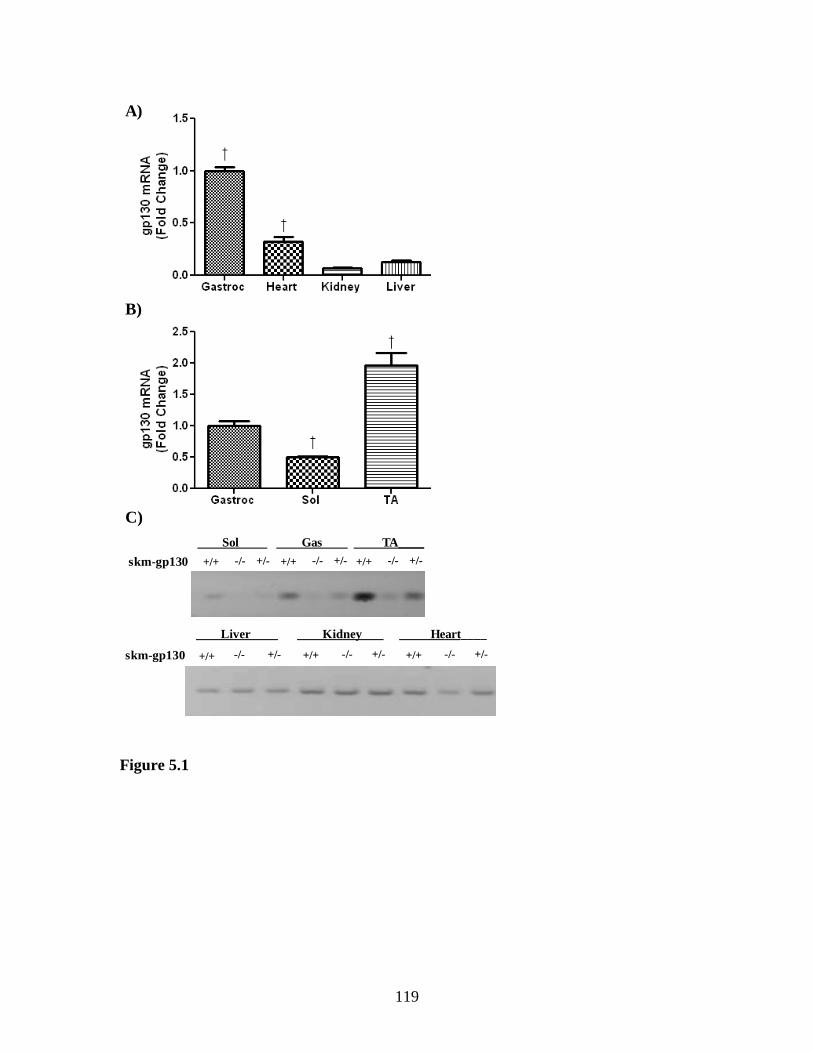
119
Figure 5.1
Figure 5-1.
A)
C)
B)
Liver Kidney Heart____
Sol Gas TA____
-/- +/-+/+skm-gp130 -/- +/-+/+ -/- +/-+/+
-/- +/-+/+skm-gp130 -/- +/-+/+ -/- +/-+/+

120
D)
-/--/--/--/-+/-+/-+/-+/-+/+ +/+ +/+ +/+
- - + + - - + + - - + +
p-STAT3
skm-gp130
IL-6
STAT3
Figure 5.1. Mouse tissue expression of gp130. A) gp130 is differentially expressed in tissues. B) Differential expression of gp130 mRNA in the soleus
(Sol), gastrocnemius (Gastroc), Tibialis anterior (TA) muscles of C57BL/6
mice. C) PCR analysis of gp130 mRNA (643bp product size) in the gastrocnemius (Gas), soleus (Sol),Tibialis anterior (TA) muscles, liver, kidney
and heart of skm - gp130 +/+, skm-gp130+/-
mice and skm-gp130-/-
mice. D)
STAT3 protein phosphorylation in heterozygous and homozygous skm- gp130
knockout after two weeks of IL-6 over-expression. All values are represented as Mean ± SEM.
†Significantly different from all other comparisons. *Significantly
different form genotype vector control, p<0.05.

121
Figure 5.2
Figure 5-2.
A)
B)

122
C)
***
D)
Figure 5.2. The effect of skm-gp130 on development of cancer induced cachexia.
At 8 weeks of age wild-type BL/6 mice and skm-gp130-/-
(skm-gp130) mice were implanted with LLC tumor cells. Tumors were allowed to grow until 13 weeks of age.
A) Skeletal muscle gp130 expression changes with LLC induced cachexia in wild-type
and skm-gp130 mice in the gastrocnemius (ND:not detected). B) Tumor mass was
measured at the time of sacrifice C) Percent change in body weight (BW) from genotype control and D) percent change in gastrocnemius muscle mass were
calculated from weights collected at the time of sacrifice. All values are represented as
Mean ± SEM .***significantly different from BL/6 p<0.05.

123
Figure 5.3.
A)
P-STAT3(Y705)
STAT3
P-AMPK(T172)
AMPK
P-P38(T182)
P38
P-P65(S468)
P65
BL/6 BL/6+LLC skm-gp130 skm-gp130+LLC
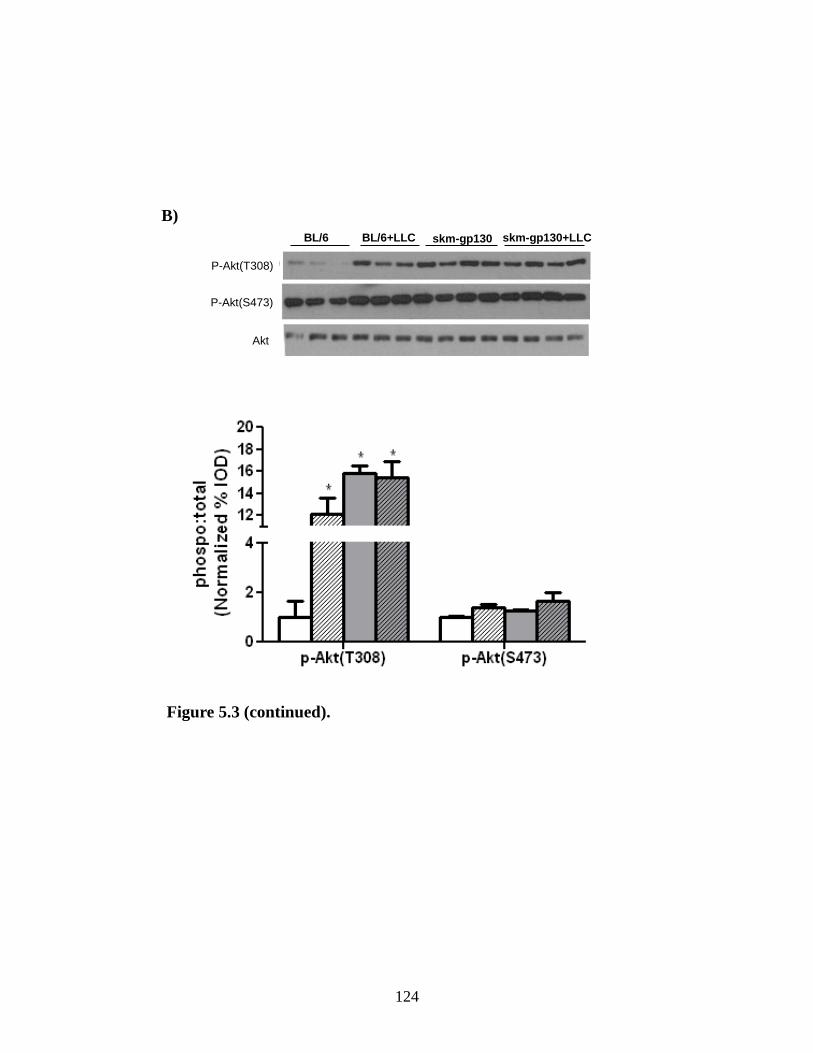
124
B)
P-Akt(T308)
P-Akt(S473)
Akt
BL/6 BL/6+LLC skm-gp130 skm-gp130+LLC
Figure 5.3 (continued).
125
C)
P-4EBP1(T37/46)
4EBP1
P-S6RP(S235/236)
S6RP
Atrogin-1
P-FOXO3a(S253)
FOXO3a
BL/6 BL/6+LLC skm-gp130 skm-gp130+LLC
Figure 5.3. (continued)

126
Ubiquitin
Ponceau
BL/6 BL/6+LLC skm-gp130
skm-gp130
+LLC
Figure 5-3 (continued).
D)
Figure 5.3 (continued).

127
E)
Figure 5.3. The effect of skm-gp130 on LLC induced signaling. A) Western blot
analysis of p-STAT3, total STAT3, p-AMPK, total AMPK, p-p38, total p38 and p
– NF - B, total NF - B protein expression. Ponceau stain was used to verify equal loading. B.) Western blot analysis of p-Akt(T308), p-Akt(S473), and total
Akt, Graphical analysis of western blots are expressed as a ratio of phosphorylated to total protein levels. C) Western blot analysis of mTOR signaling proteins p-
4EBP1, total 4EPB1, p-S6, total S6, p-FOXO3, total FOXO3, and Atrogin.
Ponceau stain was used to ensure equal loading. Graphical analysis of phospho- proteins is expressed as a ratio of phosphorylated to total protein levels. D) Levels
of ubiquinated proteins were quantified by western blot analysis. Dashed line
indicates different sections of same gel. E) Skeletal muscle mRNA expression of
IGF-1, REDD1, and IL-6 was measured in the gastrocnemius. All values are represented as Mean ± SEM. Two-way ANOVA was used to analyze the effect of
skm-gp130 and LLC. †significantly different from all other comparisons,
**significantly different from BL/6 LLC, *significantly different BL/6 control p<0.05.

128
A)
Figure 5.4.
B)

129
Figure 5-4 (continued).
C)
Figure 5.4 (Continued).

130
D)
Figure 5.4. The effect of LLC conditioned media on Myosin Heavy Chain level,
STAT3 signaling and protein turnover regulation in C2C12 myotubes. A) Myotube atrophy induced by 72h LCM was measured with protein levels of Myosin
Heavy Chain. B) Inflammatory signaling, STAT3 induced by administration of LCM
for 4 or 72h. C) Protein expression of p-AKT, total Akt, p-AMPK, total AMPK, p-
mTOR, total mTOR, p-S6, total S6, p-4EBP1, and total 4EPB1 after 72h incubation with LCM was measured by western blots. Graphical analysis of mTOR signaling
proteins are expressed as a ratio of phosphorylated to total protein levels. D) Protein
expression of p-FOXO3, total FOXO3, Atrogin, and GAPDH was measured by western blots. Graphical analysis of AMPK and FOXO3 is expressed as a ratio of
phosphorylated to total protein levels.. Values are the means ± SEM. Data were
analyzed with one-way ANOVA. *:p ≤ 0.05, **: p ≤ 0.01, ***: p ≤ 0.005, significant different from control group.
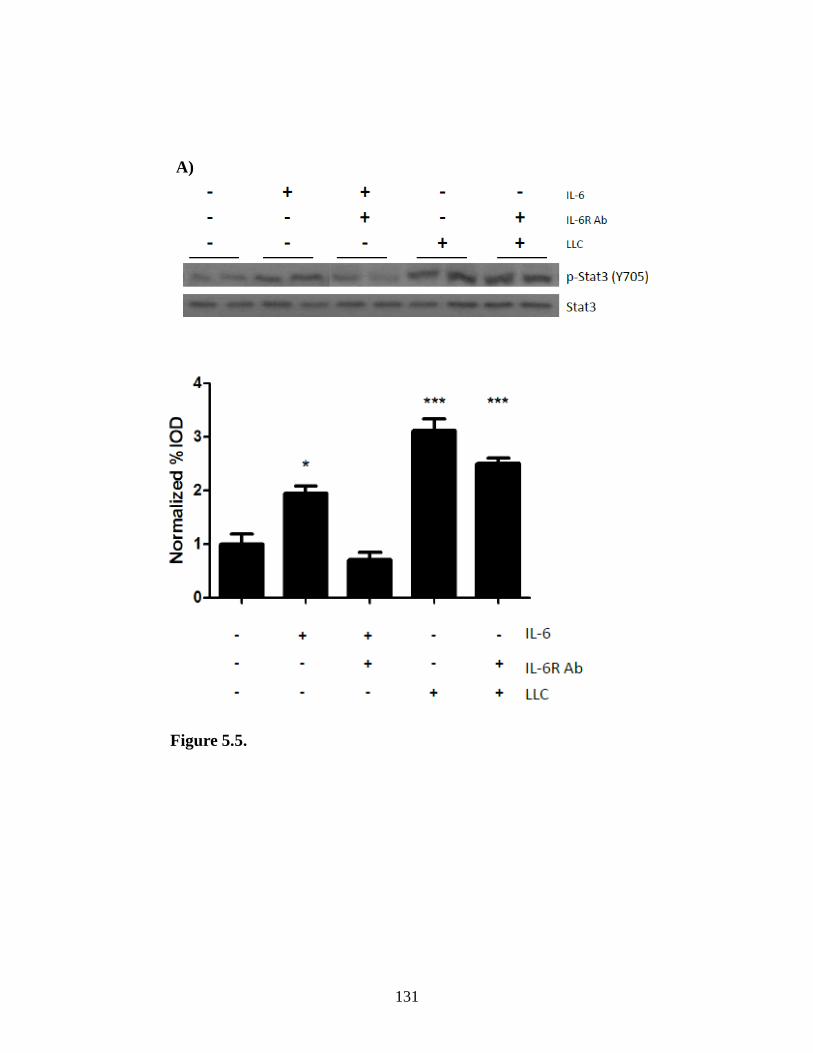
131
A)
Figure 5.5.
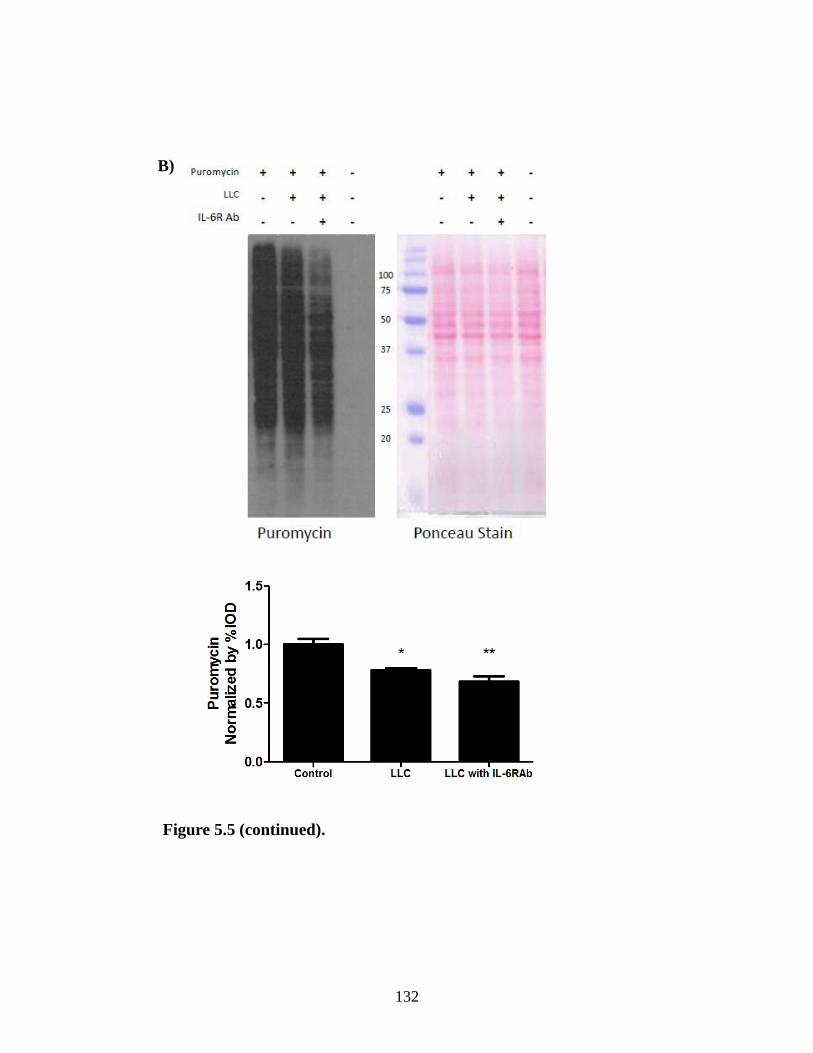
132
Figure 5.5 (continued).
B)

133
Figure 5.5 (continued).
C)

134
D)
LLC LLC+IL-6R Ab
Figure 5-5 (continued).
Figure 5.5 (continued).
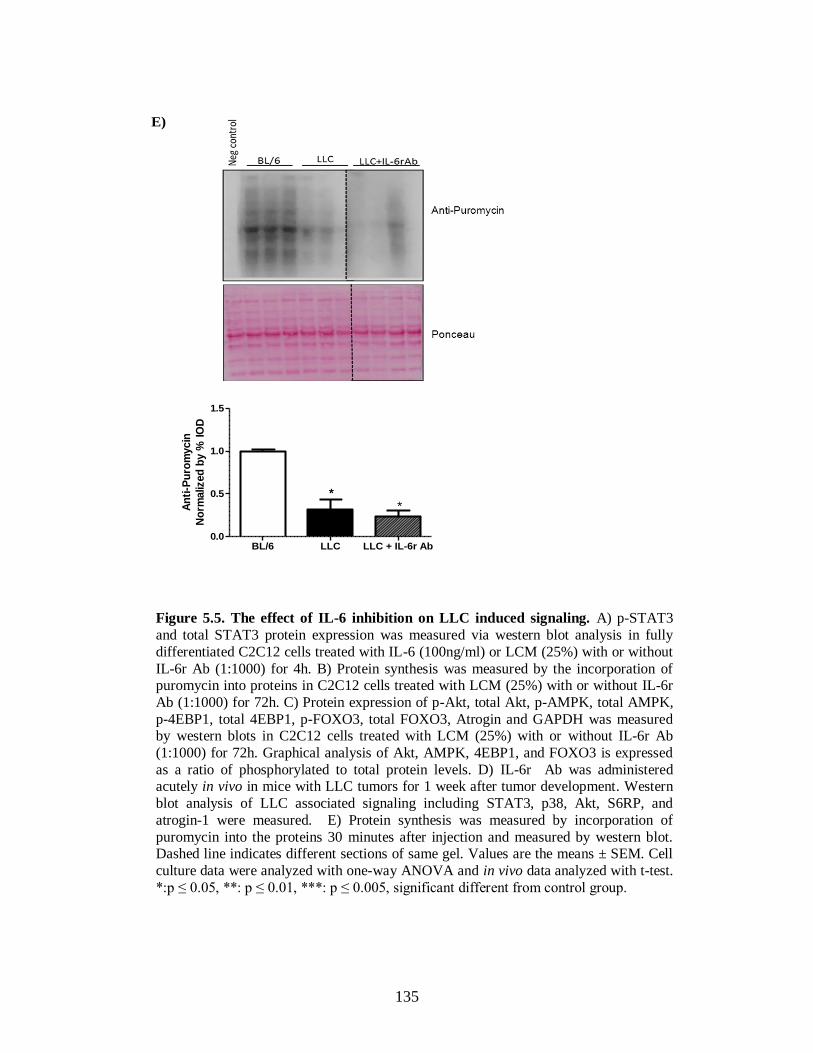
135
E)
BL/6 LLC LLC + IL-6r Ab0.0
0.5
1.0
1.5
***A
nti
-Pu
rom
ycin
No
rmaliz
ed
by %
IO
D
Figure 5.5. The effect of IL-6 inhibition on LLC induced signaling. A) p-STAT3
and total STAT3 protein expression was measured via western blot analysis in fully
differentiated C2C12 cells treated with IL-6 (100ng/ml) or LCM (25%) with or without
IL-6r Ab (1:1000) for 4h. B) Protein synthesis was measured by the incorporation of puromycin into proteins in C2C12 cells treated with LCM (25%) with or without IL-6r
Ab (1:1000) for 72h. C) Protein expression of p-Akt, total Akt, p-AMPK, total AMPK,
p-4EBP1, total 4EBP1, p-FOXO3, total FOXO3, Atrogin and GAPDH was measured by western blots in C2C12 cells treated with LCM (25%) with or without IL-6r Ab
(1:1000) for 72h. Graphical analysis of Akt, AMPK, 4EBP1, and FOXO3 is expressed
as a ratio of phosphorylated to total protein levels. D) IL-6r Ab was administered acutely in vivo in mice with LLC tumors for 1 week after tumor development. Western
blot analysis of LLC associated signaling including STAT3, p38, Akt, S6RP, and
atrogin-1 were measured. E) Protein synthesis was measured by incorporation of
puromycin into the proteins 30 minutes after injection and measured by western blot. Dashed line indicates different sections of same gel. Values are the means ± SEM. Cell
culture data were analyzed with one-way ANOVA and in vivo data analyzed with t-test.
*:p ≤ 0.05, **: p ≤ 0.01, ***: p ≤ 0.005, significant different from control group.

136
A)
B)
Figure 5.6 (continued).

137
C)
Figure 5-6 (continued).

138
D)
Figure 5-6 (continued).

139
E)
Figure 5-6 (continued).

140
F)
Figure 5.6 (continued).

141
P-S
TAT3(
Y70
5)
P-P
65 (S
468)
P-A
MPK
(T17
2)
P-P
38 (Y
182)
P-A
KT (T
308)
0.0
0.5
1.0
1.5LLC LLC + PDTC
*
*
ph
osp
o:t
ota
l
(No
rmalized
% IO
D)P-STAT3(Y705)
STAT3
P-P38(T182)
P38
P-Akt(T308)
Akt
P-AMPK(T172)
AMPK
P-P65(S468)
P65
LLC LLC+ PDTC
G)
Figure 5.6. The effect of gp130/STAT signaling inhibition on LLC induced
signaling. Fully differentiated C2C12 cells were treated with LCM with or without
PDTC (STAT/NFκB inhibitor, 50µM), LLL12 (STAT3 specific inhibitor, 100nM) and gp130 receptor antibody (1:1000) for 4h (A) or 72h (B, C, D, E,F) A) p-STAT3 and
total STAT3 protein expression was measured via western blot analysis after 4 hour
treatment. B) Diameter of C2C12 myotubes after 72h of LLC, PDTC, LLL12 or gp130 antibody administration. C) Relative protein synthesis rates were measured by the
incorporation of puromycin into proteins after 72 hours of PDTC, LLL12 or gp130
antibody administration. D-F) C2C12 signaling proteins was measured after 72h of D), gp130 antibody, E) LLL12, or F) PDTC administration in the presence of LCM by
western blot analysis. G) PDTC was administered for 1 week to mice bearing LLC
tumors. Western blot analysis of LLC associated signaling including STAT3, P65,
AMPK, P38, and Akt, were measured. Graphical representation is displayed as the ratio of phosphorylate to total protein levels. Values are the means ± SE. Cell culture
data were analyzed with one-way ANOVA and in vivo data analyzed with t-test *:p ≤
0.05, **: p ≤ 0.01, ***: p ≤ 0.005, significant different from control group, #:p ≤ 0.05, significant different from LLC group.

142
CHAPTER 6
CACHECTIC SKELETAL MUSCLE RESPONSE TO A NOVEL BOUT OF LOW
FREQUENCY STIMULATION4
4 Melissa Puppa, Angela Murphy, Greg Hand, Raja Fayad, and James Carson. Submitted
for publication in Journal of Applied Physiology.

143
6.1 Abstract
While exercise benefits have been well documented in patients with chronic
diseases, the mechanistic understanding of contraction in cachectic muscle induced by
cancer is largely unknown. We previously demonstrated that treadmill exercise training
attenuates the initiation of cancer cachexia. However, the metabolic signaling response to
a novel, acute bout of low frequency contraction in a muscle that is already cachectic is
unknown. Therefore, the purpose of this study was to determine if severe cancer cachexia
disrupts the acute contraction-induced response to low frequency muscle contraction
(LoFS). The induction of metabolic genes and signaling was examined 3h after a novel
30-minute bout of contraction (10Hz) in cachectic ApcMin/+
(Min) and C57BL/6 (BL-6)
mice. Min mice exhibited cachexia at the time of stimulation that included body weight
loss, decreased gastrocnemius muscle mass, decreased volitional strength, and decreased
cage activity. Although Glut4 mRNA was decreased by cachexia, LoFS increased muscle
Glut4 mRNA in both BL-6 and Min mice. LoFS also induced muscle PPARγ and PGC-
1α mRNA. However, in Min mice LoFS was not able to induce muscle PGC-1α targets
NRF-1 and TFAM mRNA. Muscle contraction induced P-S6 in BL-6 mice, but this
induction was blocked by cachexia. Administration of PDTC for 24h, a general STAT
and NFκB inhibitor, rescued contraction- induced P-S6 in cachectic muscle. Stimulation
increased muscle p-AMPK and p38 in BL-6 and Min mice. These data demonstrate that
cachexia alters the muscle metabolic response to acute low frequency muscle contraction;
and inflammation-induced inhibition of protein translation may be important for this
altered response.
KEY WORDS: Cachexia, contraction, low frequency stimulation, skeletal muscle,
mitochondria

144
6.2 Introduction
Cachexia, an unintentional loss of 5% of body weight including muscle and fat
mass given an underlying disease, is associated with many conditions including HIV-
AIDS, renal failure, diabetes, chronic heart failure, and many cancers (Deans and
Wigmore, 2005). The progression of the cachexia is associated with the degree of body
weight loss, and is positively correlated with mortality (Evans et al., 2008). Cachexia
accounts for approximately 20% of cancer deaths and approximately 40% of colon cancer
related deaths (Tan and Fearon, 2008; Tisdale, 2003). Modeling cachexia in rodents has
lead to a better understanding of the regulation of the wasting (Dianliang, 2009).
However, an approved treatment for cachexia remains elusive. The lack of treatment
options may relate to the underlying disease ultimately controlling the mechanisms
regulating the initiation and progression of wasting (Carson and Baltgalvis, 2010).
The ApcMin/+
mouse is an established model of intestinal cancer that develops a
slowly progressing cachexia when compared to many other cancer cachexia models, and
provides physiologic relevance to the human condition. A nonsense mutation in the
Adenomatous polyposis coli (Apc) gene predisposes mice to intestinal adenomas (Moser
et al., 1990). Cachexia is initiated around 14 weeks of age, and the average lifespan of
these mice is approximately 20 weeks. Elevated circulating IL-6 levels are associated
with the development of cachexia in ApcMin/+
mice. Global knockout of IL-6 in ApcMin/+
mice blocks cachexia development and IL-6 over-expression accelerates cachexia
progression in ApcMin/+
mice (Baltgalvis et al., 2008b). Exercise has shown to be
beneficial for attenuating the initiation and progression of cachexia in ApcMin/+
mice. With
the progression of cachexia, there is an inverse relationship between voluntary wheel
145
running distance and cachexia development in ApcMin/+
mice (Baltgalvis et al., 2010).
However, regular treadmill exercise can reduce tumor growth in these mice (Mehl et al.,
2005) and also prevent the initiation of cachexia even under conditions of chronically
elevated IL-6 (Puppa et al., 2011d). While there are currently no approved
pharmaceutical therapies for cachexia our laboratory and others have demonstrated the
potential for exercise training to prevent muscle mass loss in the cachectic environment
(Puppa et al., 2011d).
An acute bout of exercise alters skeletal muscle signaling and has been shown to
benefit patients with many chronic diseases (Fentem, 1994). Contraction can regulate
several signaling cascades including fatty acid oxidation (Vavvas et al., 1997), glucose
transport (Hayashi et al., 1998), mitochondrial biogenesis (Bergeron et al., 2001; Hood et
al., 2006), and protein synthesis (Nader and Esser, 2001). Many exercise responses in
muscle have been related to AMPK activation; however, chronically elevated AMPK
activation, as seen during the progression of cachexia in the ApcMin/+
mouse, can
suppress protein synthesis (White et al., 2013b). After an acute bout of exercise, PGC-1α
is rapidly upregulated leading to a subsequent increase in mitochondrial associated gene
transcription and mitochondrial biogenesis (Baar et al., 2002; Pilegaard et al., 2003).
Upregulation of these genes can persist for up to 4 hours before returning to baseline
levels (Pilegaard et al., 2000). Additionally, S6-kinase (S6K1), a target of mTOR
signaling to increase protein translation, is suppressed in cachectic skeletal muscle (White
et al., 2011b), and has been shown to be upregulated 3 hours after a bout of low
frequency contraction in rodent skeletal muscle (Nader and Esser, 2001). However, it is

146
not known if severely cachectic skeletal muscle maintains the capacity to respond to
acute contraction.
We have previously demonstrated that treadmill exercise training attenuates the
initiation of cancer cachexia-induced muscle and body weight loss (Puppa et al., 2011d).
Low frequency electrical stimulation (LoFS) has been shown to alter local metabolic
signaling pathways in vivo, without altering the systemic environment as whole body
exercise does (Nader and Esser, 2001). However, the metabolic signaling response to a
novel, acute bout of low frequency contraction in a muscle that is already cachectic is
unknown. Muscle contraction induces several signaling pathways that are suppressed
with the progression of cancer cachexia, such as PGC-1α, and ribosomal protein S6 (Baar
et al., 2002; Nader and Esser, 2001; White et al., 2011b; White et al., 2012b). Therefore,
the purpose of this study was to determine if severe cancer cachexia disrupts the acute
contraction response induced by low frequency muscle contraction. We hypothesized
that an acute bout of low frequency contraction would stimulate metabolic signaling
regulating mitochondrial biogenesis in cachectic skeletal muscle. To test this hypothesis,
ApcMin/+
mice were monitored until they had developed sustained weight loss. Mice then
underwent an acute 30 minute bout of low-frequency electrical stimulation in which one
leg was stimulated and the other served as an internal control. Hindlimb muscles were
harvested three hours after the completion of the contraction and changes in mRNA
expression levels and protein expression were measured in both BL-6 and ApcMin/+
mouse
muscle.

147
6.3 Materials and Methods
Animals. C57BL/6 (BL-6) and ApcMin/+
(Min) mice were originally purchased
from Jackson Laboratories. Mice were bred at the Animal Resource Facility at the
University of South Carolina and genotyped for heterozygosity of the Apc gene. All
animals were kept on a 12:12 light:dark cycle. Animals had ad libitum access to food and
water during the course of the study. All animals were fasted for 5 hours prior to
sacrifice. At 18-20 weeks of age male mice underwent an acute contraction stimulus. A
subset of 18-20wk old Min mice received pyrrolidine dithiocarbamate (PDTC), 10mg/kg
BW, a STAT3/NFκB inhibitor, 24h prior to acute low frequency stimulation. Three hours
after the completion of the contraction protocol animals were anesthetized with a
ketamine/ xylazine/ acepromazine cocktail, and tissues were removed, weighed, and
frozen in liquid nitrogen. Tissues were stored at -80 °C until further analysis. All animal
experimentation was approved by the University of South Carolina’s Institutional Animal
Care and Use Committee.
Grip strength. Combined hindlimb and forelimb rodent grip strength was measured prior
to low frequency stimulation with the Grip Tester (Columbus Instruments, Columbus,
OH). Mice were placed with all 4 limbs on a metal grid mounted at a 45° angle connected
to a force transducer. Mice were pulled by the tail until they let go of the grid and the
force was recorded. Each mouse went through a series of 2 sets of 5 repetitions of force
measurements, with a 2-3 minute rest period between each set.
148
Cage activity monitoring. Two nights prior to stimulation, mice were single housed and
placed in activity monitor cages (Opto-M3 Activity Meter, Columbus Instruments,
Columbus, OH). Activity was measured for 12 hours during the dark cycle (7 PM -7
AM); the number of beams crossed in an X-Y plane was recorded for two consecutive
nights. Food consumption was also recorded during this time given that the mice were
single housed.
Low Frequency Stimulation: Low frequency stimulation was conducted as described by
Nader and Esser (Nader and Esser, 2001) with slight modifications. Briefly, all animals
were fasted for 5 hours prior to stimulation and food was restricted for the remainder of
the study. Animals were anesthetized with Isoflurane in a chamber at 2-5% and remained
anesthetized for the procedure via a nose cone that was connected tothe
isoflurane/oxygen. Animals were placed on a heat pad and the left hind limb was shaved
free of hair and cleaned with alcohol followed by betadine. Electrodes were placed on
both sides of the peroneal nerve and stimulated via subcutaneous needle. Proper electrode
position was confirmed by observing plantarflexion at the ankle joint. This protocol
elicited an overall effect of plantar flexion resulting in tapping of the foot. The voltage
was applied by a Grass S88 stimulator (Grass technologies). Stimulation was delivered at
a frequency of 10 Hz, 5 V, 10-ms duration, 90-ms delay for a total time of 30 min.
During the recovery period, animals remained on a heat pad. The right leg served as the
control for each animal.
149
Western Blot analysis: Western blot analysis was performed as previously described
(Puppa et al., 2011d). Briefly, gastrocnemius muscle was homogenized and protein
concentration was determined by the Bradford method (Bradford, 1976). Homogenates
were fractionated on 8-15% SDS-polyacrylamide gels and transferred overnight to PVDF
membrane. Primary antibodies for P-S6, S6, P-AMPK, AMPK, TFAM, P-P65, P65, P-
STAT3 and STAT3 (cell signaling), and PCG-1α (Santa Cruz) were incubated 1:1000 to
1:2000 for 1h at RT. Secondary antibodies were used at a concentration of 1:2000-
1:5000. Enhanced chemiluminescence was used to visualize the antibody-antigen
interactions and developed by autoradiography. Blots were analyzed by measuring the
integrated optical density (IOD) of each band using ImageJ software. All Western blots
were normalized to BL-6 controls run on the same gel unless otherwise noted.
RNA Isolation/PCR. RNA isolation, cDNA synthesis and real-time PCR were performed
as previously described (White et al., 2013b) , using reagents from Applied Biosystems.
GLUT4, PGC-1α, PGC-1β, PPARγ, NRF1/2, TFAM, Cytochrome B, and GAPDH
primers were purchased from IDT. Real time PCR analysis was conducted using an ABI
7300 Sequence Detection System. Data were analyzed using the cycle threshold. All gene
expression data were normalized to GAPDH.
Statistical analysis. All data are represented as mean ± SEM. A student t-test was used to
determine systemic and baseline differences between BL-6 and Min mice and also
between Min and PDTC treated mice. A repeated measure two-way ANOVA (LoFS &
Genotype) was used to determine the effects of contraction and cachexia. To determine

150
the effects of PDTC on muscle mRNA expression a repeated measure two-way ANOVA
was used (LoFS & PDTC). An intra-animal comparison of muscles from control and
contracted legs from the same mouse was used as the repeated measure. Bonforroni post
hoc analysis was used to examine interactions. Significance was set at p≤0.05.

151
6.4 Results
Cachexia in ApcMin/+
mice.
ApcMin
mice (Min) lose body weight, skeletal muscle, and fat mass as cachexia
progresses. As with our previous studies these Min mice had a 13.8% loss in body
weight, while BL-6 mice did not demonstrate any weight loss. Body weight loss
corresponded with a 35% decrease in gastrocnemius muscle mass and a 93% decrease in
epidydimal fat mass when compared with BL-6 mice (Table 6.1). Body weight loss was
not associated with alterations in food intake measured during the week prior to sacrifice
(BL-6: 1.8±0.2 g/d Min: 1.6±0.4 g/d).
Human cancer patients exhibit decreased physical activity and increased fatigue
with cachexia (Maddocks et al.; Mustian et al., 2007). We have previously reported that
Min mice also demonstrate decrements in functional status and physical activity with the
initiation and progression of cachexia (Baltgalvis et al., 2010). We extend these
observations to demonstrate that Min mice have dramatically reduced cage activity with
severe cachexia. There was a significant reduction in XY plane cage activity (Fig 6.1A)
and a decrease in rearing activity (Fig 6.1B) during the active dark cycle. Volitional grip
strength was decreased 27% in severely cachectic Min mice; however, the decrease in
force may be attributed to an overall loss in body mass as no differences were seen when
values are normalized with body weight (Table 6.2). These data demonstrate that with
severe cachexia, the loss in body mass is accompanied by a dramatic decrease in activity
level and voluntary force production. However, the capacity to contract skeletal muscle
remains intact.

152
LoFS regulation of metabolic genes in cachectic mice
To examine if cachexia altered the capacity of LoFS to induce muscle expression
of metabolic genes, mRNA expression was examined 3 hours after a novel bout of
contraction (Fig 6.2). Contraction induced a 3-fold increase in GLUT4 mRNA levels in
BL-6 mice (Fig 6.2A). Similarly, contraction induced a 4.7-fold increase in GLUT4
mRNA in cachectic skeletal muscle despite having basal expression suppressed by
cachexia (Fig 6.2A). Peroxisome proliferator-activated receptor gamma (PPARγ), a
regulator of lipid metabolism, was increased 3-fold by contraction in BL-6, and a similar
increase was seen in cachectic muscle (Fig 6.2B). Contraction did not induce PGC-1α
mRNA expression in BL-6 mice; however, it induced a 6-fold increase in PCG-1α
mRNA in cachectic muscle despite suppressed basal expression (Fig 6.2C). Contraction
suppressed PGC-1β mRNA expression 45% in wild type mice. Cachexia inhibited
muscle PGC-1β expression 78% and contraction did not change PGC-1β in cachectic
muscle (Fig 6.2D). These data demonstrate that cachectic skeletal muscle maintains the
capacity for contraction-induction of some metabolic genes.
PGC-1α is known to upregulate the transcription of mitochondrial associated
genes. To determine if the increase in PGC-1α leads to subsequent increases in
mitochondrial associated gene transcription, we measured mRNA expression of PGC-1α
target genes NRF-1, TFAM, and cytochrome B (Fig 6.3). Cachexia suppressed
expression of NRF-1, TFAM, and cytochrome B mRNA (Fig 6.3). Contraction elicited a
2.2-fold increase in NRF-1mRNA expression in BL-6 mice; however, contraction was
153
unable to stimulate NRF-1 mRNA in cachectic muscle (Fig 6.3A). Similar to NRF-1,
TFAM expression was induced 90% by contraction in BL-6 mice, whereas contraction
was unable to induce TFAM expression in cachectic muscle (Fig 6.3B). We also
measured the expression of a mitochondrial encoded gene, cytochrome B. Contraction
induced a 2.4-fold increase in cytochrome B mRNA expression in BL-6 mice, which was
inhibited by cachexia (Fig 6.3C). These data demonstrate that cachectic skeletal muscle
displays altered induction of mitochondrial associated genes with acute contraction.
LoFS regulation of protein expression in cachectic mice
We examined if cachexia altered the capacity for LoFS contraction to increase
signaling regulating protein synthesis. We measured the phosphorylation of S6 ribosomal
protein as an indicator of mTOR signaling (Fig 6.4). Contraction induced an 8-fold
increase in BL-6 muscle S6 phosphorylation; however, there was no contraction induced
phosphorylation of S6 in cachectic muscle (Fig 6.4A). We next examined if cachexia
altered contraction-induced expression of mitochondrial proteins (Fig 6.4). TFAM
protein expression was not altered by cachexia (Fig 6.4B); however, cachexia suppressed
the expression of muscle cytochrome c and PGC-1α protein expression (Fig 6.4C/D).
Contraction induced a 30% increase in TFAM expression in BL-6 mice (Fig 6.4B), but
there was no contraction-induced increase in cachectic muscle. Similarly, contraction
increased cytochrome c expression 40% in BL-6 mice, but cachexia blocked the
contraction-induction of cytochrome c protein (Fig 6.4C). PGC-1α protein expression
was suppressed by cachexia (Fig 6.4D). Unlike TFAM and cytochrome c, there was a

154
main effect of contraction to increase muscle PGC-1α protein expression in both BL-6
and cachectic muscle (Fig 6.4D). These data demonstrate that cachectic muscle lacks
contraction-induction of mTOR signaling. Although contraction did not induce
mitochondrial protein expression in cachectic muscle, it did induce protein expression of
the upstream regulator, PGC-1α.
Effect of Pyrrolidine dithiocarbamate on cachectic muscle response to LoFS
We next examined if the acute suppression of systemic inflammation altered
cachectic muscle’s response to contraction. Inflammation was suppressed by
administration of pyrrolidine dithiocarbamate (PDTC), a STAT3/NFκB inhibitor, 24h
prior to contraction. The phosphorylation of STAT3 was elevated in cachectic muscle
(Fig 6.5A). There was a main effect of contraction to induce muscle STAT3
phosphorylation in all groups, regardless of cachexia and PDTC treatment. Contraction
increased p65 phosphorylation in BL-6 mice, but not cachectic mice. However, the
phosphorylation of p65 was increased by cachexia. PDTC administration blocked basal
STAT3 and P65 phosphorylation in cachectic muscle. However, contraction-induced
STAT3 and P65 phosphorylation was not altered by PDTC (Fig 6.5A). The
administration of PDTC increased basal levels of PGC-1α target mRNAs NRF-1, TFAM,
and cytochrome b in cachectic muscle; however, contraction did not increase PGC-1α
target mRNAs (Fig 6.5B). The inability of contraction to induce p-S6 in cachectic muscle
was rescued by the PTDC treatment (Fig 6.5C). Interestingly, PDTC treatment increased
protein expression of TFAM and cytochrome c in cachectic muscle; however, the

155
contraction-induced increased in S6 phosphorylation was not associated with contraction-
induced increases in protein levels of cytochrome c or TFAM with PDTC (Fig 6.5C).
These data demonstrate that inhibition of inflammatory signaling in cachectic muscle
recues the suppression of contraction-induced mTOR signaling, and reverses the
cachexia-induced suppression of mitochondrial associated genes.
LoFS mediated regulation of mTOR
Finally, we examined if the induction of AMPK, p38 and Akt phosphorylation by
contraction was altered in skeletal muscle from cachectic mice. These signaling pathways
are known regulators of mTOR signaling. Cachexia increased muscle AMPK
phosphorylation (Fig 6.6A), which has been previously reported (White et al., 2013b).
The ability for contraction to increase muscle AMPK phosphorylation was not altered by
cachexia. Contraction induced an 80% increase in muscle AMPK phosphorylation in BL-
6 mice and a 50% increase in cachectic mice (Fig 6.6A). Neither basal nor contraction-
induced muscle P38 phosphorylation was changed by cachexia (Fig 6.6B). Akt
phosphorylation was elevated 4-fold in cachectic muscle (Fig 6.6C). Increases in Akt
phosphorylation with cachexia have been previously reported (White et al., 2011b).
Contraction elicited a 60% increase in Akt phosphorylation in BL-6 mice; however,
contraction did not alter the phosphorylation in cachectic muscle (Fig 6.6C). These data
demonstrate that the interaction of cachexia and contraction differentially regulate several
signaling pathways that have the potential to control the muscle’s metabolic response.

156
6.5 Discussion
While the development and progression of cachexia has a well-documented
impact on cancer patient survival, there are currently no approved treatments that can
block or attenuate this condition (Murphy and Lynch, 2012). Muscle contraction may
have therapeutic value for the treatment and management of cachexia. Exercise has
recognized benefits for the prevention of some cancers (Murphy and Lynch, 2012), and
electrical muscle stimulation has beneficial effects in critically ill patients (Gerovasili et
al., 2009). Several studies have suggested the use of exercise training to resolve muscle
wasting in conditions of cachexia as reviewed by Zinna and Yarasheski (Zinna and
Yarasheski, 2003). However, few studies to date have examined if severely cachectic
skeletal muscle retains the metabolic plasticity to respond to exercise. Because many
patients are not diagnosed until significant muscle and body mass have been lost (Tisdale,
2002), it is imperative that we understand the cachectic muscle response to therapeutic
interventions in order to develop viable treatments. While we have demonstrated that
treadmill exercise training in mice is beneficial for attenuating the initiation of cachexia,
to our knowledge we present the first study to demonstrate that severely cachectic
skeletal muscle has an altered metabolic response to a novel bout of contraction. While
contraction was able to elicit expression of some metabolic genes and signaling
pathways, there were deficiencies in the activation of mitochondrial biogenesis and
mTOR signaling. The contraction induction of muscle PGC-1α gene targets was also
inhibited by cachexia, even though PGC-1-α mRNA and protein expression was induced
by contraction. Interestingly, chronic inflammation may have a role in the altered
response of skeletal muscle to contraction, as administration of pyrrolidine

157
dithiocarbamate (PDTC) restored mTOR signaling in cachectic muscle. Further work is
needed to determine the interaction between muscle inflammatory signaling and
contraction-induced metabolic regulation.
Skeletal muscle contraction is widely considered advantageous for offsetting
metabolic dysfunction, as it stimulates signaling pathways involved with glucose uptake,
intra-cellular energy status, and calcium signaling (Hood et al., 2006). Activation of these
signaling pathways can result in increased protein synthesis and enhanced mitochondrial
biogenesis. AMPK and P38 are examples of signaling pathways activated by contraction
that can regulate muscle metabolism, and we report that these pathways maintain the
ability to be activated in severely cachectic muscle. Although AMPK and P38 MAPK are
acutely regulated by contractile activity (Fernandez-Marcos and Auwerx, 2011), chronic
activation of these pathways has been reported with muscle wasting (McClung et al.,
2010; White et al., 2013b; Zhang et al., 2011). Acute activation of AMPK and P38 can
induce post-translational modifications of proteins that regulate contraction-induced gene
expression through the activity of nuclear transcription factors and transcriptional co-
activators (Hood et al., 2006). Chronic activation of AMPK and P38 signaling are
associated with muscle wasting (White et al., 2013b; Zhang and Li, 2012). Contraction-
induced P38 activation increases the transcription of ATF2 and PGC-1α. Additionally,
mice with constitutively active P38 demonstrate increased PGC-1α and cytochrome
oxidase IV protein expression (Akimoto et al., 2005a). Chronic P38 activation is also
associated with increased atrogene expression, which is involved in protein degradation
(Zhang et al., 2011; Zhang et al., 2013). Prolonged AMPK activation is associated with
decreased muscle protein synthesis through the suppression of mTOR (White et al.,

158
2013b). Contraction-induced activation of AMPK is associated with increased PGC-1α
protein expression after low frequency contraction (Atherton et al., 2005). Contraction-
induced metabolic homeostasis includes the regulation of GLUT4 for increased muscle
glucose uptake in an insulin independent manner (Brozinick et al., 1992; King et al.,
1993). We found that cachexia suppressed baseline skeletal muscle expression of GLUT4
mRNA. Translocation of AMPK into the nucleus is associated with increased GLUT4
mRNA expression and this is enhanced under conditions of low glycogen as seen after
exercise (Steinberg et al., 2006). Similar to what is seen in type 2 diabetes (Kennedy et
al., 1999), we demonstrate that acute contraction maintains the ability to increase GLUT4
mRNA expression despite the presences of severe cachexia.
PGC-1α is involved in the regulation of mitochondrial biogenesis. Both acute
contraction and exercise training stimulate transcriptional co-activator PGC-1α
expression (Baar et al., 2002). While PGC-1α gene expression can be increased after
acute exercise in humans, the duration and intensity of the exercise may play a role in its
induction (Russell et al., 2005). We found that LoFS contraction increased PGC-1α
mRNA expression in cachectic mice, while there was only a trend for a change in wild
type mice. However, contraction was able to increase PGC-1α protein expression
independent of cachexia. The relative exercise intensity, the muscle’s intrinsic oxidative
capacity, and the fatigue-ability of the muscle may be responsible for the large
contraction induction of PGC-1 α mRNA in cachectic mice. Interestingly, despite the
contraction increase in PGC-1 α mRNA and protein in cachectic muscle there was not a
corresponding induction of TFAM and NRF-1 mRNA levels, which are transcriptional
targets of PGC-1 α. Cachexia is associated with preferential atrophy of glycolytic muscle

159
fibers (Julienne et al., 2012), and all fiber types have a reduction in muscle oxidative
metabolism (White et al., 2011a). It is possible that the induction of PGC-1α expression
without any changes in its target genes is related to mRNA stability;many important
regulators of mitochondrial biogenesis such as PGC-1 and TFAM have relatively short
mRNA half lives (D'Souza et al., 2012). Lai et al. have demonstrated accelerated mRNA
turnover of PGC-1α and TFAM after chronic contraction (Lai et al., 2010). Recently
D’souza et al. demonstrated that inherent muscle oxidative capacity could affect mRNA
stability resulting in changes in mRNA turnover (D'Souza et al., 2012). The
phosphorylation of PGC-1α by P38 has been shown to increase PGC-1 protein half life
(Fernandez-Marcos and Auwerx, 2011). A decrease in the half life of PGC-1α protein
during cachexia could explain why we did not observe any increases in PGC-1α targets
that are known to induce mitochondrial biogenesis. Further work is necessary to identify
why cachexia had a selective regulation of contraction sensitive gene expression related
to regulators of mitochondria biogenesis and oxidative metabolism.
The process of mRNA translation related to protein synthesis is a necessary
component of muscle metabolic plasticity. Muscle protein synthesis is regulated by many
stimuli including; hormonal, nutrient, mechanical, and inflammatory inputs. mTOR
signaling has an acknowledged role for the integration of stimuli regulating muscle
protein synthesis (Dickinson et al., 2011; Hayashi and Proud, 2007; Lee and Hung, 2007;
Parkington et al., 2003). Additionally, the regulation of skeletal muscle mitochondria and
oxidative metabolism through PGC-1α and NRF1/2 has been shown to involve mTOR
signaling (Cunningham et al., 2007; Risson et al., 2009). Dysregulation of mTOR has
been identified in humans and in animal models during cancer cachexia (Tisdale, 2002;

160
Tisdale, 2009; White et al., 2013b; White et al., 2012b). We demonstrate that cachexia
suppresses the ability of contraction to induce mTOR signaling. The phosphorylation of
mTOR target S6 or NRF-1 mRNA levels was not induced by contraction in cachectic
muscle. Interestingly, cachexia did not suppress the contraction-induction of PGC-1α or
mechanical signaling through p38 phosphorylation. Further work is needed to determine
the ramification of mTOR suppression and its relationship to the loss of oxidative
capacity in cachectic muscle.
There is evidence to suggest that the inflammation associated with cachexia may
be a potent mTOR suppressor, as IL-6 over-expression accelerates muscle atrophy and
decreases mTOR signaling in ApcMin/+
mice and C2C12 myotubes (White et al., 2013b).
We now report that the acute suppression of systemic inflammatory signaling in ApcMin/+
mice by PDTC administration can rescue contraction-induced S6 phosphorylation. This is
an interesting finding since we have previously found in Lewis Lung Carcinoma-induced
muscle wasting that inhibition of skeletal muscle gp130 and STAT3 is not sufficient to
rescue mTOR signaling and muscle protein synthesis (Puppa et al., 2013a). Additionally,
2 weeks of systemic IL-6 inhibition during the initiation of cachexia in ApcMin/+
mice did
not rescue mTOR signaling and muscle protein synthesis (White et al., 2011b). These
data question the role of IL-6 and STAT3 in the suppression of mTOR in cachectic
muscle. However, PDTC is an inhibitor of both STAT3 and NFκB (He et al., 2006; Nai et
al., 2007). NFκB may have a role in suppression of mTOR, as IL-6 overexpression in
ApcMin/+
mice and the progression of cachexia activate NFκB signaling (Puppa et al.,
2011d). Although the induction of NFκB signaling with cachexia is commonly
associated with protein catabolism, it is also induced by muscle contraction and has a role
161
in the regulation of muscle metabolism (Acharyya and Guttridge, 2007; Bakkar et al.,
2008; Peterson and Guttridge, 2008). Further work is needed to identify the mechanisms
by which inflammation may be mediating contraction-induced mTOR signaling in
cachectic muscle.
To our knowledge we are the first to report that severe cancer cachexia can alter
the metabolic plasticity of skeletal muscle to an acute bout of contraction. We report that
acute low frequency stimulated contraction was able to induce PGC-1α and PPARγ
mRNA expression in cachectic muscle. However, cachexia blocked contraction induced
NRF-1 and TFAM mRNA expression, which are PGC-1α transcriptional targets.
Coinciding with these findings, contraction-induced S6 phosphorylation, a target of
mTOR signaling, was inhibited by cachexia. Inhibition of systemic inflammation related
to NFκB and STAT3 signaling was sufficient to rescue contraction stimulated S6
phosphorylation in cachectic muscle, but not TFAM or cytochrome c protein expression.
These data suggest that the response of cachectic muscle to a novel, acute bout of low
frequency contraction is disrupted, and combinatorial therapeutic approaches involving
exercise may prove beneficial for cachectic patients. Additionally, further research is
needed to determine if multiple bouts of exercise or contraction improve the metabolic
response of cachectic muscle to an acute bout of contraction.
Acknowledgements
The authors thank Ms. Tia Davis for technical assistance with the animal breeding.

162
Table 6.1. Cachexia in ApcMin/+
(Min) mice is associated with muscle mass loss. There
was no difference between the stimulated and non stimulated legs three hours post
contraction. Body weight (BW) was monitored throughout the course of the study. Mass
of gastrocnemius, epididymal fat (Epi fat), and spleen was weighed at the time of
sacrifice. * Significantly different from BL-6, p<0.05
BL-6 Min
(n=5) (n=5)
Max BW (g) 28.0±0.4 25.2±0.9
BW at Sacrifice (g) 28.0±0.4 21.7±.09*
% change BW 0.0±0.0 -13.8±2.9*
Gastrocnemius (mg) 137.0±3.0 88.3±5.4*
Epi Fat (mg) 468.5±40.9 29.6±12.2*
Spleen (mg) 85.8±3.0 437.8±54.0
Tibia Length (mm) 16.9±0.1 16.9±0.1

163
Table 6.2. Grip Strength in the Min mouse is decreased during severe cachexia.
Volitional grip strength was measured in mice prior to stimulation. Grip strength was
normalized to body weight (BW) taken at the time of testing. *Significantly different
from BL-6, p<0.05
BL-6 Min
(n=5) (n=5)
Avg Grip Strength (N) 2.27±0.07 1.66±0.19*
Max Grip Strength (N) 2.80±0.08 2.16±0.09*
Avg Grip Strength/BW (N/g) 0.079±0.002 0.068±0.006
Max Grip Strength/BW (N/g) 0.097±0.003 0.090±0.005
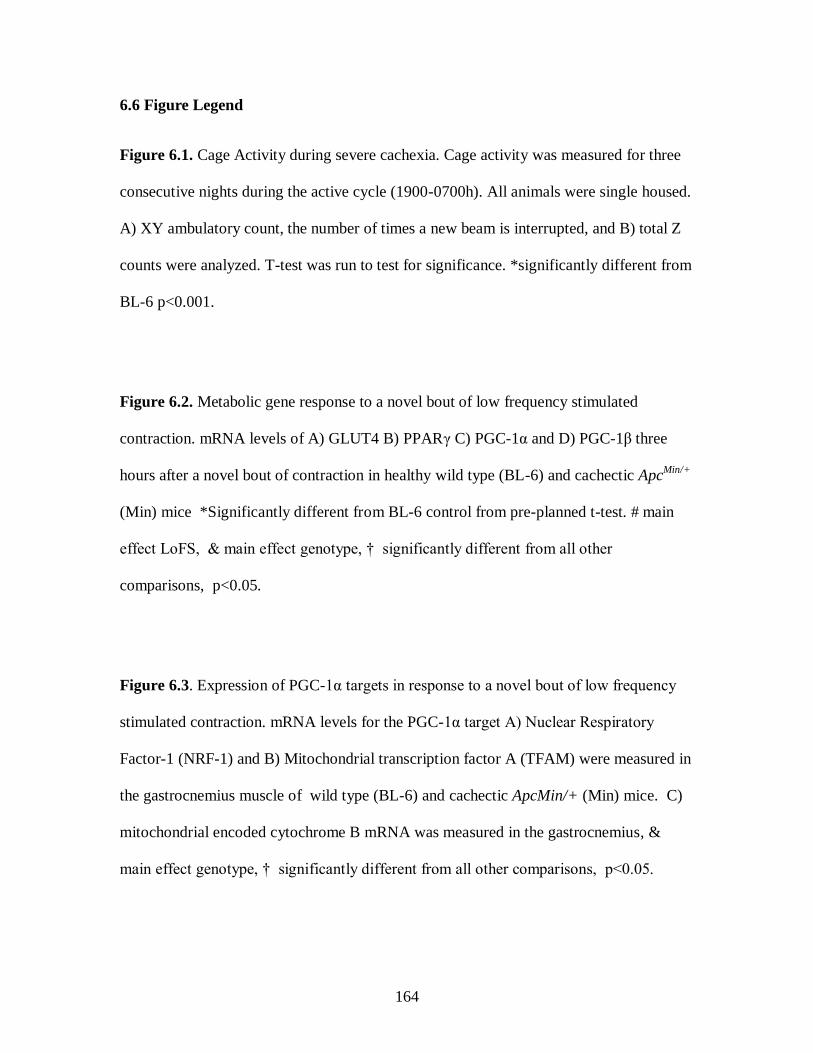
164
6.6 Figure Legend
Figure 6.1. Cage Activity during severe cachexia. Cage activity was measured for three
consecutive nights during the active cycle (1900-0700h). All animals were single housed.
A) XY ambulatory count, the number of times a new beam is interrupted, and B) total Z
counts were analyzed. T-test was run to test for significance. *significantly different from
BL-6 p<0.001.
Figure 6.2. Metabolic gene response to a novel bout of low frequency stimulated
contraction. mRNA levels of A) GLUT4 B) PPARγ C) PGC-1α and D) PGC-1β three
hours after a novel bout of contraction in healthy wild type (BL-6) and cachectic ApcMin/+
(Min) mice *Significantly different from BL-6 control from pre-planned t-test. # main
effect LoFS, & main effect genotype, † significantly different from all other
comparisons, p<0.05.
Figure 6.3. Expression of PGC-1α targets in response to a novel bout of low frequency
stimulated contraction. mRNA levels for the PGC-1α target A) Nuclear Respiratory
Factor-1 (NRF-1) and B) Mitochondrial transcription factor A (TFAM) were measured in
the gastrocnemius muscle of wild type (BL-6) and cachectic ApcMin/+ (Min) mice. C)
mitochondrial encoded cytochrome B mRNA was measured in the gastrocnemius, &
main effect genotype, † significantly different from all other comparisons, p<0.05.

165
Figure 6.4. LoFS regulation of protein expression. A) The ratio of phosphorylated to
total S6 in the gastrocnemius muscle was used as a marker of protein synthesis. The
translational response of B) TFAM C) Cytochrome C and D) PGC-1α three hours after a
novel bout of contraction in healthy wild type (BL-6) and cachectic ApcMin/+
(Min) mice.
Lanes connected by a bar in the representative western blots represent the control (C) and
LoFS (L) leg from the same animal. All comparisons were run on the same gel. # main
effect LoFS, & main effect genotype, † significantly different from all other
comparisons, p<0.05.
Figure 6.5. Effect of Pyrrolidine dithiocarbamate on cachectic muscle response to LoFS.
Inflammatory signaling was blocked 24h prior to stimulation by acute PDTC
administration A) The ratio of phosphorylation:total STAT3 and P65 were measured 3h
after acute contraction. B) mRNA targets of PGC-1α, Nuclear Respiratory Factor-1
(NRF-1) and Mitochondrial transcription factor A (TFAM), and cytochrome B (Cyto B)
were measured in mice administered PDTC. Data were normalized to the levels seen in
the control leg of ApcMin/+
mice. The dotted line represents BL-6 control levels. C) The
ratio of phosphorylated: total S6 was used as a marker of protein synthesis, and the
protein levels of TFAM and cytochrome c (Cyto C) were measured by western blot
analysis and normalized to Min controls run on the same gel. Lanes connected by a bar
in the representative western blots represent the control (C) and LoFS (L) leg from the
same animal. All comparisons were run on the same gel. * significantly different from
Min based on pre-planned t-test. $ main effect PDTC, # main effect LoFS, & main effect
genotype, ** significantly different from control leg within group, ^^ significantly

166
different from all other control groups, ∞ significantly different from all other LoFS
comparisons, p<0.05.
Figure 6.6. LoFS mediated regulators of mTOR. Known activators and suppressors of
mTOR were measured in gastrocnemius of BL-6 and Min mice 3 hours after LoFS. A)
AMPK B) P-38 and C) Akt phosphorylation was measured and graphed as a ratio of
phosphorylated to total protein. Lanes connected by a bar in the representative western
blots represent the control (C) and LoFS (L) leg from the same animal. All comparisons
were run on the same gel. # main effect LoFS, & main effect genotype, † significantly
different from all other comparisons, p<0.05.

167
A)
B)
Figure 6.1. Cage Activity during severe cachexia. Cage activity was
measured for three consecutive nights during the active cycle (1900-0700h).
All animals were single housed. A) XY ambulatory count, the number of
times a new beam is interrupted, and B) total Z counts were analyzed. T-test
was run to test for significance. *significantly different from BL-6 p<0.001.

168
Figure 6.2.
A)
B)

169
C)
D)
Figure 6.2. Metabolic gene response to a novel bout of low frequency
stimulated contraction. mRNA levels of A) GLUT4 B) PPARγ C) PGC-1α
and D) PGC-1β three hours after a novel bout of contraction in healthy wild
type (BL-6) and cachectic ApcMin/+
(Min) mice *Significantly different from
BL-6 control from pre-planned t-test. # main effect LoFS, & main effect
genotype, † significantly different from all other comparisons, p<0.05.
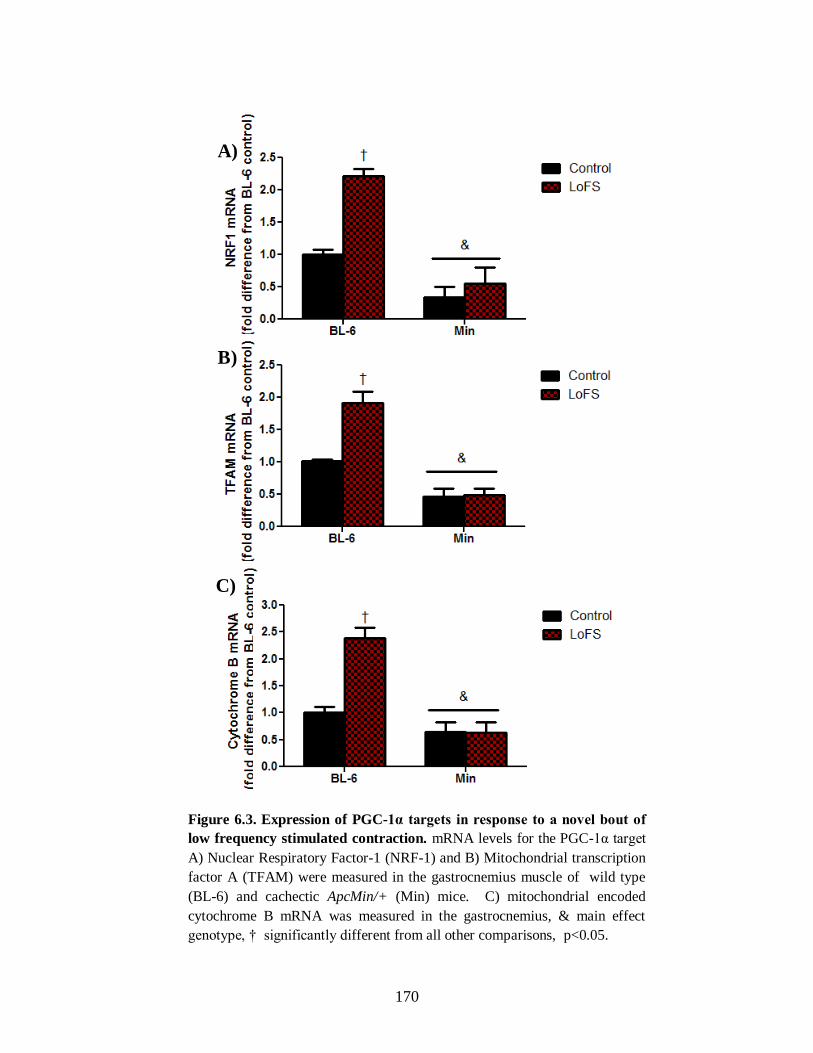
170
A)
B)
C)
Figure 6.3. Expression of PGC-1α targets in response to a novel bout of
low frequency stimulated contraction. mRNA levels for the PGC-1α target
A) Nuclear Respiratory Factor-1 (NRF-1) and B) Mitochondrial transcription
factor A (TFAM) were measured in the gastrocnemius muscle of wild type
(BL-6) and cachectic ApcMin/+ (Min) mice. C) mitochondrial encoded
cytochrome B mRNA was measured in the gastrocnemius, & main effect
genotype, † significantly different from all other comparisons, p<0.05.

171
A)
B)
Figure 6.4.

172
D)
C)
Figure 6.4. LoFS regulation of protein expression. A) The ratio of
phosphorylated to total S6 in the gastrocnemius muscle was used as a marker of protein synthesis. The translational response of B) TFAM C) Cytochrome
C and D) PGC-1α three hours after a novel bout of contraction in healthy
wild type (BL-6) and cachectic ApcMin/+
(Min) mice. Lanes connected by a bar in the representative western blots represent the control (C) and LoFS (L)
leg from the same animal. All comparisons were run on the same gel. # main
effect LoFS, & main effect genotype, † significantly different from all other
comparisons, p<0.05.
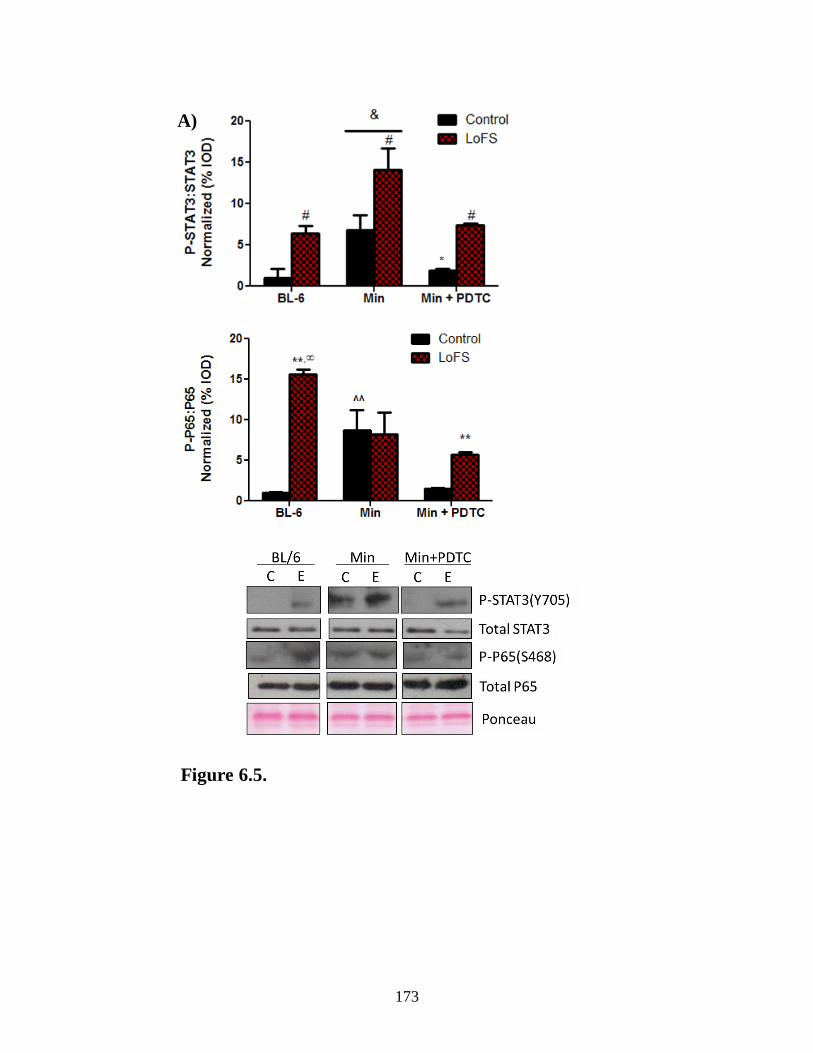
173
Figure 6.5.
A)

174
C)
B)
Figure 6.5. Effect of Pyrrolidine dithiocarbamate on cachectic muscle response to LoFS. Inflammatory signaling was blocked 24h prior to stimulation by acute PDTC administration A)
The ratio of phosphorylation:total STAT3 and P65 were measured 3h after acute contraction. B) mRNA targets of PGC-1α, NRF-1, TFAM, and cytochrome B (Cyto B) were measured in
mice administered PDTC. Data were normalized to the levels seen in the control leg of ApcMin/+
mice. The dotted line represents BL-6 control levels. C) The ratio of phosphorylated: total S6 was used as a marker of protein synthesis, and the protein levels of TFAM and cytochrome c
(Cyto C) were measured by western blot analysis and normalized to Min controls run on the
same gel. Lanes connected by a bar represent the control (C) and LoFS (L) leg from the same
animal. All comparisons were run on the same gel. * significantly different from Min based on pre-planned t-test. $ main effect PDTC, # main effect LoFS, & main effect genotype, **
significantly different from control leg within group, ^^ significantly different from all other
control groups, ∞ significantly different from all other LoFS comparisons, p<0.05.
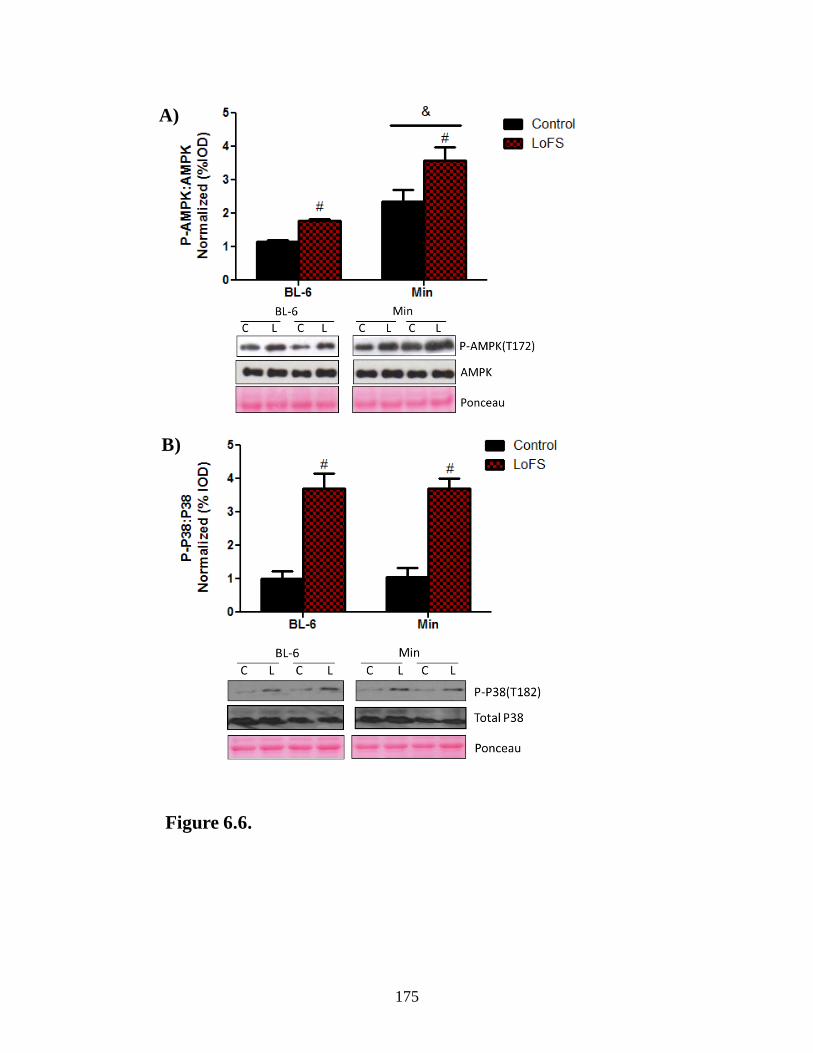
175
A)
B)
Figure 6.6.

176
C)
Figure 6.6. LoFS mediated regulators of mTOR. Known activators and suppressors of
mTOR were measured in gastrocnemius of BL-6 and Min mice 3 hours after LoFS. A)
AMPK B) P-38 and C) Akt phosphorylation was measured and graphed as a ratio of
phosphorylated to total protein. Lanes connected by a bar in the representative western
blots represent the control (C) and LoFS (L) leg from the same animal. All comparisons
were run on the same gel. # main effect LoFS, & main effect genotype, † significantly
different from all other comparisons, p<0.05.

177
CHAPTER 7
OVERALL DISCUSSION

178
Cachexia is defined as the unintentional loss of body weight including muscle
mass with or without adipose tissue loss given an underlying condition (Batista et al.,
2012; Bruera, 1997; Evans et al., 2008; Fearon et al., 2011). Cancer cachexia accounts
for approximately 20% of all cancer related deaths and 40% of deaths related to colon
cancer (Bruera, 1997; Tisdale, 2002). Given the complexity of the cachectic condition, it
is not diagnosed until after significant muscle loss and there are currently no approved
pharmaceutical interventions for the treatment of cachexia. While there are many models
of cachexia there is an underlying increase in systemic inflammation that is associated
with increased muscle protein degradation and functional decrements (Argiles et al.,
2003; Argiles et al., 2012; Fearon et al., 2013; Fortunati et al., 2007; Strassmann et al.,
1992; Strassmann and Kambayashi, 1995). Therefore the purpose of this dissertation was
to determine the role of inflammatory signaling through gp130/STAT3 signaling on the
regulation of muscle mass and mitochondrial content during cancer cachexia. We
hypothesized that inhibition of systemic STAT3 signaling would attenuate muscle mass
loss through inhibition of protein degradation and maintenance of mitochondria content
and that inhibition of skeletal muscle gp130 signaling would be sufficient for muscle
mass maintenance during cachexia.
The data presented support our hypothesis that inhibition of skeletal muscle
gp130 signaling can attenuate skeletal muscle protein degradation and improve muscle
oxidative capacity; however, muscle gp130 was unable to release cachexia-suppression
of muscle protein synthesis or the induction of mitochondrial fission. Additionally,
inhibition of trans IL-6 signaling attenuated cachexia and suppressed muscle
inflammatory signaling and activation of protein degradation pathways. Trans IL-6
179
inhibition maintained muscle mitochondrial content and alleviated the increase of
mitochondrial fission, but could not attenuate the suppression of mitochondrial fusion or
the suppression of muscle protein synthesis. Similarly systemic inhibition of
STAT3/NFκB signaling inhibited muscle protein degradation and mitochondrial loss;
however, STAT3/NFκB inhibition through PDTC administration increased muscle
protein synthesis in cachectic mice. Inhibition of STAT3 alone was unable to rescue
protein synthesis in LLC induced muscle atrophy suggesting that it is the systemic
actions of PDTC that act to improve muscle protein synthesis. Finally cachectic muscle
has an altered response to acute contraction. While contraction was able to induce
signaling which should increase muscle mitochondrial biogenesis, increases in
mitochondrial biogenesis were blunted in cachectic muscle. Inhibition of inflammatory
signaling attenuated the cachexia-block of contraction-induced mitochondrial biogenesis.
Regulation of mitochondrial biogenesis by inflammatory signaling during cachexia.
The loss of mitochondrial content and alterations in mitochondrial dynamics have
been reported during cancer cachexia (Fermoselle et al., 2013; Julienne et al., 2012;
Tisdale, 2002; Tzika et al., 2013; White et al., 2011a). Although cachexia is not
associated with decrements in the ability of individual mitochondria to produce ATP
(Julienne et al., 2012), the overall production is limited with the net loss of mitochondria.
This decrease in ATP will inhibit energy using pathways such as protein synthesis and
may ultimately lead to activation of energy saving/energy producing pathways such as
protein degradation. We have previously demonstrated that inhibition of systemic IL-6
signaling can attenuate the progression of skeletal muscle loss after the initiation of
cachexia and is associated with improved muscle mitochondrial content and dynamics

180
(White et al., 2013b; White et al., 2012c). Our initial studies blocked both classical and
trans IL-6 signaling. We now show that trans IL-6 signaling can attenuate muscle
mitochondrial loss potentially through the suppression of mitochondrial fission; however,
trans signaling was unable to rescue mitochondrial fusion. Muscle specific gp130
signaling inhibition also attenuated mitochondrial loss and was associated with increases
in mitochondrial fusion, but did not block mitochondrial fission. These data suggest that
mitochondrial fusion may be regulated through a gp130 independent pathway and may be
more closely related to alterations in systemic inflammatory signaling than muscle
specific inflammatory signaling. Alternatively the suppression of mitochondrial fusion
may be related to the disuse as activity generally declines prior to muscle loss in the Min
mouse (Baltgalvis et al., 2010). Disuse of skeletal muscle as well as aging are associated
with decreased mitochondrial fusion and increased fission (Iqbal et al., 2013). Long term
decreases in mitochondrial fusion are detrimental to skeletal muscle as fusion is required
for mitochondrial DNA stability and function and loss of MFN1/2 is associated with
mitochondrial myopathies and muscle loss (Chen et al., 2010). Further work is necessary
to understand the role of altered mitochondrial fusion on the progression of cachexia.
Increases in muscle mitochondrial fission are associated with inflammatory
signaling (White et al., 2012b). Additionally mitochondrial fission can regulate the
induction of protein degradation (Romanello et al., 2010; Romanello and Sandri, 2010)
and the suppression of mitochondrial fission may be one mechanism through which
repression of inflammation is acting to decrease protein degradation. While we see
inhibition of IL-6 trans signaling suppressed mitochondrial fission, the suppression of
systemic STAT3 and muscle gp130 signaling were unable to prevent FIS induction.

181
Interestingly inhibition of inflammatory signaling by all three methods resulted in
attenuation of muscle degradation signaling. One possible explanation for the induction
of fission and fusion with PDTC treatment and muscle gp130 inhibition is that there may
be higher mitochondrial turnover with these treatments. Interestingly inhibition of
STAT3 and muscle gp130 were not sufficient to suppress mitochondrial fission,
suggesting that the induction of mitochondrial fission may be independent of
inflammatory signaling and may not be regulating muscle protein breakdown during
cancer cachexia. Further work is necessary to determine the mechanism by which PDTC
administration and muscle gp130 inhibition attenuate protein degradation independently
of increases in mitochondrial fission.
Interestingly, mice over-expressing PGC-1α are not protected from the rapid
induction of muscle mass loss induced by LLC cachexia (Wang et al., 2012). A
limitation to this study was that circulating IL-6 was increased in animals with muscle
over-expression of PGC-1α, but not in wild type tumor bearing mice, and the suppression
of muscle mitochondrial content with cachexia was not demonstrated. Over-expression of
muscle PGC-1α4 can prevent LLC induced muscle wasting demonstrating the need for
further research examining the role of mitochondrial content in muscle wasting (Ruas et
al., 2012). We have shown that exercise training prior to development of cachexia can
increase mitochondrial capacity and attenuate cachexia induced fission and suppression
of fusion (White et al., 2012b). Acute contraction after the initiation of cachexia was
unable to increase markers of mitochondrial biogenesis; however, when basal
inflammation was suppressed mitochondrial biogenesis was increased. Inflammatory
signaling is a potent regulator of muscle mitochondrial content during cachexia, and

182
exercise has been shown to decrease inflammation. Although increased mitochondrial
content is not sufficient for the prevention of cachexia, it is unknown if the mitochondria
are functional. A buildup of dysfunctional mitochondria may be detrimental to the
cachectic condition. Further work is necessary to determine if functional increases in
muscle mitochondrial content can attenuate muscle loss associated with increased
inflammation and if exercise training after the initiation of cachexia can attenuate further
mitochondrial and muscle mass loss.
Regulation of muscle protein turnover by inflammatory signaling during cachexia
Much of the focus of cachexia research has been aimed towards the suppression
of cachexia induced muscle protein degradation. Inhibition of potential cachectic
mediators such as myostatin (Busquets et al., 2012; Murphy et al., 2011), FOXO (Reed et
al.), C/EBPβ (Zhang et al., 2011), mitochondrial fission (Romanello et al., 2010;
Romanello and Sandri, 2010), and STAT3 (Bonetto et al., 2012) have been shown to
attenuate muscle mass loss through suppression of protein catabolism pathways. We
further this research demonstrating that inhibition of systemic STAT3/NFκB signaling,
IL-6 trans signaling, and of muscle gp130 signaling can also attenuate the cachexia-
induction of muscle protein degradation pathways. Skeletal muscle gp130 may be
inhibiting degradation through a combination of STAT3 inhibition and inhibition of P38
which have both been implicated in muscle protein breakdown in models of cachexia
(Bonetto et al., 2012; Zhang and Li, 2012). Inhibition of muscle gp130 was sufficient to
inhibit muscle mass loss in the LLC model of cachexia, but not the Min model. The
induction of atrogin was suppressed in both models, and the suppression of protein
synthesis was unaltered by gp130 inhibition. Because the LLC is a rapid model of
183
cachexia, it is possible that the long term suppression of muscle protein synthesis in the
Min model is responsible for the overall muscle mass loss, whereas in the LLC there was
only a short term suppression of protein synthesis. Further work needs to be done to
determine if the inhibition of muscle gp130 delays the onset of cachexia in the Min
mouse. Many of the models currently used for cachexia research develop cachexia within
a matter of days-weeks suggesting that the effectiveness of many of the treatments
studied may only be beneficial for delaying the onset of cachexia in a slower model.
Further research needs to be done to examine the effectiveness of long term inhibition on
muscle protein degradation without improvements in synthesis for the prevention of
muscle loss with cachexia.
Induction of muscle protein degradation is one mechanism inducing the loss of
muscle mass with cachexia that has received much attention; however, cachexia is also
associated with a suppression of muscle protein synthesis which could independently
decrease muscle mass (Atherton et al., 2005; Dworzak et al., 1998; Goodman et al.,
2011b; Risson et al., 2009; White et al., 2011b). To date no treatments aside from
exercise have been shown to release the cachexia-suppression of muscle protein synthesis
and most studies have focused solely on protein breakdown. We have previously
demonstrated that exercise training prior to cachexia development can prevent IL-6
suppression of IGF-1 and mTOR signaling (White et al., 2013b). Our lab has also shown
that high frequency stimulation, mimicking resistance exercise, in muscle after the
initiation of cachexia can increase muscle protein synthesis (Sato, 2012).
One potential mechanism in which cachexia may be suppressing protein
synthesis is through the up regulation of AMPK. Inflammation has been shown to

184
increase AMPK activation in skeletal muscle. Interestingly we found inhibition of AMPK
activation in the Min mouse with skm-gp130 deletion, but did not see this in the LLC
model of cachexia. This may be due to the IL-6 dependent nature of the cachexia in the
Min mouse, whereas the LLC model has been shown to be dependent on either IL-6 or
TNFα which act through different signaling mechanism. Suppression of AMPK through
administration of IL-6r Ab, inhibition of gp130 signaling, or inhibition of IL-6 trans
signaling was not associated with improvements in muscle protein synthesis. REDD1 can
suppress protein synthesis regulator, mTORC1, through the dissociation of TSC2/14-3-3
complex (Ho et al., 2005) and REDD1 can suppress mTOR independently of AMPK
(Frost and Lang). The inhibition of skeletal muscle gp130 signaling did not alter
cachexia-induced REDD1 expression.
Another potential suppressor of protein synthesis could be through the up
regulation of glucocorticoids. Glucocorticoids have been shown to be increased during
cachexia and are implicated in muscle atrophy (Braun et al., 2013; Rivadeneira et al.,
1999; Schakman et al., 2013). Additionally glucocorticoids have been shown to suppress
protein synthesis (Kim and Kim, 1975). Global inhibition of glucocorticoids does not
prevent wasting; however, inhibition of muscle glucocorticoid receptor can attenuate
muscle mass loss (Braun et al., 2013; Rivadeneira et al., 1999). Not only did the muscle
deletion of the glucocorticoid receptor inhibit activation of protein degradation pathways,
it also prevented cachexia and LPS induction of REDD1. The role of glucocorticoids in
the suppression of muscle protein synthesis during cachexia requires further
investigation. Combination therapies in which glucocorticoid and inflammation levels are
suppressed may be crucial for long term protection from cancer-induced muscle wasting.

185
Interestingly we found that PDTC administration increased muscle protein
synthesis in wild type and cachectic mice. PDTC has been shown to decrease tumor
development as well at suppress atrogin expression in skeletal muscle of tumor bearing
mice (Nai et al., 2007; Puppa et al., 2013b). Additionally PDTC has been implicated in
the regulation of protein synthesis pathways (Song et al., 2011). Because of the inhibition
of degradation and the improvements in muscle protein synthesis, PDTC has promise as a
therapeutic intervention for the treatment of cachexia. Combination therapies that include
exercise may be the most beneficial for improved patient survival and quality of life.
Further work is necessary to identify potential pathways that PDTC may be acting
through to relieve the inhibition of muscle protein synthesis with cachexia.
Summary
In summary, we demonstrate that inhibition of gp130/STAT3 signaling may be
able to delay the onset of cachexia through suppression of muscle protein degradation
and improved muscle oxidative capacity, but were ineffective at improving muscle
protein synthesis. Additionally, the blunted exercise response seen in cachectic muscle
was attenuated with inhibition of inflammatory signaling. The mechanism through which
PDTC was able to abrogate the contraction response requires further investigation.
Further work is necessary to determine if these improvements are sufficient for long term
survival and quality of life in the cancer patient. Decreases in muscle atrogin expression
were associated with inhibition of STAT3 signaling. Further work is needed to identify
the regulation of alternative degradation pathways by gp130/STAT signaling during
cachexia and the long term implications of gp130/STAT3 inhibition on skeletal muscle
health.

186
Table 7.1. Summary of gp130/STAT3 regulation of muscle mass during cachexia.
Cachexia skm-gp130 sgp130Fc PDTC
STAT3 ↑ ↓ ↓ ↓
AMPK ↑ ↓/↔ ↓ ↓
Protein degradation ↑ ↓ ↓ ↓
Protein synthesis ↓ ↔ ↔ ↑
Mitochondrial content ↓ ↑ ↑ ↑
Mito fission ↑ ↔ ↓ ↔
Mito fusion ↓ ↑ ↔ ↑
Future Directions
The data collected for this dissertation has revealed several novel aspects in the
regulation of skeletal muscle mass by gp130/STAT3 during cancer cachexia; however,
there are still gaps in our understanding of the suppression of muscle protein synthesis
and the differential roles of systemic and muscle specific gp130 signaling on the
progression of cachexia. We demonstrated that improvements in mitochondrial content as
well as suppression of muscle degradation pathways and inflammation through gp130 is
not sufficient to prevent long term muscle wasting; however, it appears to delay muscle
loss in short term models. Further work is necessary to assess the mechanism through
which muscle wasting can still occur when muscle inflammatory signaling is inhibited.
Additionally, further work is required to understand if inhibitions of muscle inflammatory
signaling can enhance the anabolic response of cachectic muscle to contraction. We
found that PDTC administration was able to improve muscle protein synthesis in
cachectic mice; however the mechanism through which PDTC is acting is not well
understood. Understanding how PDTC is improving muscle protein synthesis may lead to
the development of pharmacological interventions for the treatment of cachexia.

187
REFERENCES
188
Acharyya, S. and Guttridge, D. C. (2007). Cancer Cachexia Signaling Pathways
Continue to Emerge Yet Much Still Points to the Proteasome. Clinical Cancer Research
13, 1356-1361.
Agustsson, T., Ryden, M., Hoffstedt, J., van Harmelen, V., Dicker, A.,
Laurencikiene, J., Isaksson, B., Permert, J. and Arner, P. (2007). Mechanism of
increased lipolysis in cancer cachexia. Cancer Res 67, 5531-7.
Akimoto, T., Pohnert, S. C., Li, P., Zhang, M., Gumbs, C., Rosenberg, P. B.,
Williams, R. S. and Yan, Z. (2005a). Exercise stimulates Pgc-1alpha transcription in
skeletal muscle through activation of the p38 MAPK pathway. J Biol Chem 280, 19587-
93.
Akimoto, T., Pohnert, S. C., Li, P., Zhang, M., Gumbs, C., Rosenberg, P. B.,
Williams, R. S. and Yan, Z. (2005b). Exercise stimulates Pgc-1α transcription in
skeletal muscle through activation of the p38 MAPK pathway. Journal of Biological
Chemistry 280, 19587-19593.
al-Majid, S. and McCarthy, D. O. (2001). Cancer-induced fatigue and skeletal muscle
wasting: the role of exercise. Biol Res Nurs 2, 186-97.
Ando, K., Takahashi, F., Motojima, S., Nakashima, K., Kaneko, N., Hoshi, K. and
Takahashi, K. (2013). Possible role for tocilizumab, an anti-interleukin-6 receptor
antibody, in treating cancer cachexia. J Clin Oncol 31, e69-72.
Argiles, J. M., Busquets, S. and Lopez-Soriano, F. J. (2003). Cytokines in the
pathogenesis of cancer cachexia. Curr Opin Clin Nutr Metab Care 6, 401-6.
Argiles, J. M., Lopez-Soriano, F. J. and Busquets, S. (2012). Counteracting
inflammation: a promising therapy in cachexia. Crit Rev Oncog 17, 253-62.
Asp, M. L., Tian, M., Wendel, A. A. and Belury, M. A. (2010). Evidence for the
contribution of insulin resistance to the development of cachexia in tumor-bearing mice.
Int J Cancer 126, 756-63.
Atherton, P. J., Babraj, J., Smith, K., Singh, J., Rennie, M. J. and Wackerhage, H. (2005). Selective activation of AMPK-PGC-1alpha or PKB-TSC2-mTOR signaling can
explain specific adaptive responses to endurance or resistance training-like electrical
muscle stimulation. FASEB J 19, 786-8.
Atreya, R., Mudter, J., Finotto, S., Mullberg, J., Jostock, T., Wirtz, S., Schutz, M.,
Bartsch, B., Holtmann, M., Becker, C. et al. (2000). Blockade of interleukin 6 trans
signaling suppresses T-cell resistance against apoptosis in chronic intestinal
inflammation: evidence in crohn disease and experimental colitis in vivo. Nature
Medicine 6, 583-8.
Aulino, P., Berardi, E., Cardillo, V. M., Rizzuto, E., Perniconi, B., Ramina, C.,
Padula, F., Spugnini, E. P., Baldi, A., Faiola, F. et al. (2010). Molecular, cellular and

189
physiological characterization of the cancer cachexia-inducing C26 colon carcinoma in
mouse. BMC Cancer 10, 363.
Baar, K., Wende, A. R., Jones, T. E., Marison, M., Nolte, L. A., Chen, M., Kelly, D.
P. and Holloszy, J. O. (2002). Adaptations of skeletal muscle to exercise: rapid increase
in the transcriptional coactivator PGC-1. FASEB J 16, 1879-86.
Baeza-Raja, B. and Muñoz-Cánoves, P. (2004). p38 MAPK-induced nuclear factor-κB
activity is required for skeletal muscle differentiation: role of interleukin-6. Molecular
biology of the cell 15, 2013-2026.
Bakkar, N., Wang, J., Ladner, K. J., Wang, H., Dahlman, J. M., Carathers, M.,
Acharyya, S., Rudnicki, M. A., Hollenbach, A. D. and Guttridge, D. C. (2008).
IKK/NF-kappaB regulates skeletal myogenesis via a signaling switch to inhibit
differentiation and promote mitochondrial biogenesis. J Cell Biol 180, 787-802.
Baltgalvis, K. A., Berger, F. G., Pena, M. M., Davis, J. M. and Carson, J. A. (2008a).
Effect of exercise on biological pathways in ApcMin/+ mouse intestinal polyps. J Appl
Physiol 104, 1137-43.
Baltgalvis, K. A., Berger, F. G., Pena, M. M., Davis, J. M. and Carson, J. A. (2009a).
The interaction of a high-fat diet and regular moderate intensity exercise on intestinal
polyp development in Apc Min/+ mice. Cancer Prev Res (Phila) 2, 641-9.
Baltgalvis, K. A., Berger, F. G., Pena, M. M., Davis, J. M., Muga, S. J. and Carson,
J. A. (2008b). Interleukin-6 and cachexia in ApcMin/+ mice. Am J Physiol Regul Integr
Comp Physiol 294, R393-401.
Baltgalvis, K. A., Berger, F. G., Pena, M. M., Davis, J. M., White, J. P. and Carson,
J. A. (2009b). Muscle wasting and interleukin-6-induced atrogin-I expression in the
cachectic Apc ( Min/+ ) mouse. Pflugers Arch 457, 989-1001.
Baltgalvis, K. A., Berger, F. G., Pena, M. M., Mark Davis, J., White, J. P. and
Carson, J. A. (2010). Activity level, apoptosis, and development of cachexia in
Apc(Min/+) mice. J Appl Physiol 109, 1155-61.
Barkhausen, T., Tschernig, T., Rosenstiel, P., van Griensven, M., Vonberg, R. P.,
Dorsch, M., Mueller-Heine, A., Chalaris, A., Scheller, J., Rose-John, S. et al. Selective blockade of interleukin-6 trans-signaling improves survival in a murine
polymicrobial sepsis model. Crit Care Med 39, 1407-13.
Barton, B. E. and Murphy, T. F. (2001). Cancer cachexia is mediated in part by the
induction of IL-6-like cytokines from the spleen. Cytokine 16, 251-7.
Batista, M. L., Jr., Peres, S. B., McDonald, M. E., Alcantara, P. S., Olivan, M.,
Otoch, J. P., Farmer, S. R. and Seelaender, M. (2012). Adipose tissue inflammation
and cancer cachexia: Possible role of nuclear transcription factors. Cytokine 57, 9-16.

190
Beck, S. A., Mulligan, H. D. and Tisdale, M. J. (1990). Lipolytic factors associated
with murine and human cancer cachexia. J Natl Cancer Inst 82, 1922-6.
Benard, G. and Karbowski, M. (2009). Mitochondrial fusion and division: Regulation
and role in cell viability. Semin Cell Dev Biol 20, 365-74.
Benrick, A., Wallenius, V. and Wernstedt Asterholm, I. (2012). Interleukin-6
mediates exercise-induced increase in insulin sensitivity in mice. Exp Physiol.
Bergeron, R., Ren, J. M., Cadman, K. S., Moore, I. K., Perret, P., Pypaert, M.,
Young, L. H., Semenkovich, C. F. and Shulman, G. I. (2001). Chronic activation of
AMP kinase results in NRF-1 activation and mitochondrial biogenesis. Am J Physiol
Endocrinol Metab 281, E1340-6.
Bing, C., Brown, M., King, P., Collins, P., Tisdale, M. J. and Williams, G. (2000).
Increased gene expression of brown fat uncoupling protein (UCP)1 and skeletal muscle
UCP2 and UCP3 in MAC16-induced cancer cachexia. Cancer Res 60, 2405-10.
Bing, C., Taylor, S., Tisdale, M. J. and Williams, G. (2001). Cachexia in MAC16
adenocarcinoma: suppression of hunger despite normal regulation of leptin, insulin and
hypothalamic neuropeptide Y. J Neurochem 79, 1004-12.
Bo, H., Zhang, Y. and Ji, L. L. Redefining the role of mitochondria in exercise: a
dynamic remodeling. Ann N Y Acad Sci 1201, 121-8.
Bolster, D. R., Crozier, S. J., Kimball, S. R. and Jefferson, L. S. (2002). AMP-
activated protein kinase suppresses protein synthesis in rat skeletal muscle through down-
regulated mammalian target of rapamycin (mTOR) signaling. J Biol Chem 277, 23977-
80.
Bonetto, A., Aydogdu, T., Jin, X., Zhang, Z., Zhan, R., Puzis, L., Koniaris, L. G. and
Zimmers, T. A. (2012). JAK/STAT3 pathway inhibition blocks skeletal muscle wasting
downstream of IL-6 and in experimental cancer cachexia. Am J Physiol Endocrinol
Metab.
Bonetto, A., Aydogdu, T., Kunzevitzky, N., Guttridge, D. C., Khuri, S., Koniaris, L.
G. and Zimmers, T. A. (2011). STAT3 activation in skeletal muscle links muscle
wasting and the acute phase response in cancer cachexia. PLoS One 6, e22538.
Bothe, G. W., Haspel, J. A., Smith, C. L., Wiener, H. H. and Burden, S. J. (2000).
Selective expression of Cre recombinase in skeletal muscle fibers. Genesis 26, 165-6.
Bradford, M. M. (1976). A rapid and sensitive method for the quantitation of microgram
quantities of protein utilizing the principle of protein-dye binding. Anal Biochem 72, 248-
54.

191
Bradley, R. L., Jeon, J. Y., Liu, F. F. and Maratos-Flier, E. (2008). Voluntary exercise
improves insulin sensitivity and adipose tissue inflammation in diet-induced obese mice.
Am J Physiol Endocrinol Metab 295, E586-94.
Braun, T. P., Grossberg, A. J., Krasnow, S. M., Levasseur, P. R., Szumowski, M.,
Zhu, X. X., Maxson, J. E., Knoll, J. G., Barnes, A. P. and Marks, D. L. (2013).
Cancer- and endotoxin-induced cachexia require intact glucocorticoid signaling in
skeletal muscle. FASEB J 27, 3572-82.
Briso, E. M., Dienz, O. and Rincon, M. (2008). Cutting edge: soluble IL-6R is
produced by IL-6R ectodomain shedding in activated CD4 T cells. J Immunol 180, 7102-
6.
Brozinick, J. T., Jr., Etgen, G. J., Jr., Yaspelkis, B. B., 3rd and Ivy, J. L. (1992).
Contraction-activated glucose uptake is normal in insulin-resistant muscle of the obese
Zucker rat. J Appl Physiol 73, 382-7.
Bruera, E. (1997). ABC of palliative care. Anorexia, cachexia, and nutrition. BMJ 315,
1219-22.
Busquets, S., Toledo, M., Orpi, M., Massa, D., Porta, M., Capdevila, E., Padilla, N.,
Frailis, V., Lopez-Soriano, F. J., Han, H. Q. et al. (2012). Myostatin blockage using
actRIIB antagonism in mice bearing the Lewis lung carcinoma results in the
improvement of muscle wasting and physical performance. J Cachexia Sarcopenia
Muscle 3, 37-43.
Cai, D., Frantz, J. D., Tawa Jr, N. E., Melendez, P. A., Oh, B.-C., Lidov, H. G.,
Hasselgren, P.-O., Frontera, W. R., Lee, J. and Glass, D. J. (2004a). IKKβ/NF-κB
activation causes severe muscle wasting in mice. Cell 119, 285-298.
Cai, D., Frantz, J. D., Tawa, N. E., Jr., Melendez, P. A., Oh, B. C., Lidov, H. G.,
Hasselgren, P. O., Frontera, W. R., Lee, J., Glass, D. J. et al. (2004b). IKKbeta/NF-
kappaB activation causes severe muscle wasting in mice. Cell 119, 285-98.
Carbo, N., Busquets, S., van Royen, M., Alvarez, B., Lopez-Soriano, F. J. and
Argiles, J. M. (2002). TNF-alpha is involved in activating DNA fragmentation in
skeletal muscle. Br J Cancer 86, 1012-6.
Carson, J. A. and Baltgalvis, K. A. (2010). Interleukin 6 as a Key Regulator of Muscle
Mass during Cachexia. Exercise and Sport Sciences Reviews 38, 168-176.
Cartoni, R., Leger, B., Hock, M. B., Praz, M., Crettenand, A., Pich, S., Ziltener, J.
L., Luthi, F., Deriaz, O., Zorzano, A. et al. (2005). Mitofusins 1/2 and ERRalpha
expression are increased in human skeletal muscle after physical exercise. J Physiol 567,
349-58.
192
Catalano, M. G., Fortunati, N., Arena, K., Costelli, P., Aragno, M., Danni, O. and
Boccuzzi, G. (2003). Selective up-regulation of tumor necrosis factor receptor I in tumor-
bearing rats with cancer-related cachexia. Int J Oncol 23, 429-36.
Chabicovsky, M., Prieschl-Grassauer, E., Seipelt, J., Muster, T., Szolar, O. H.,
Hebar, A. and Doblhoff-Dier, O. (2010). Pre-clinical safety evaluation of pyrrolidine
dithiocarbamate. Basic Clin Pharmacol Toxicol 107, 758-67.
Chen, H., Vermulst, M., Wang, Y. E., Chomyn, A., Prolla, T. A., McCaffery, J. M.
and Chan, D. C. (2010). Mitochondrial fusion is required for mtDNA stability in skeletal
muscle and tolerance of mtDNA mutations. Cell 141, 280-9.
Chomentowski, P., Coen, P. M., Radikova, Z., Goodpaster, B. H. and Toledo, F. G.
Skeletal muscle mitochondria in insulin resistance: differences in intermyofibrillar versus
subsarcolemmal subpopulations and relationship to metabolic flexibility. J Clin
Endocrinol Metab 96, 494-503.
Costelli, P., Carbo, N., Tessitore, L., Bagby, G. J., Lopez-Soriano, F. J., Argiles, J.
M. and Baccino, F. M. (1993). Tumor necrosis factor-alpha mediates changes in tissue
protein turnover in a rat cancer cachexia model. J Clin Invest 92, 2783-9.
Costelli, P., Muscaritoli, M., Bossola, M., Penna, F., Reffo, P., Bonetto, A., Busquets,
S., Bonelli, G., Lopez-Soriano, F. J., Doglietto, G. B. et al. (2006). IGF-1 is
downregulated in experimental cancer cachexia. Am J Physiol Regul Integr Comp Physiol
291, R674-83.
Cunningham, J. T., Rodgers, J. T., Arlow, D. H., Vazquez, F., Mootha, V. K. and
Puigserver, P. (2007). mTOR controls mitochondrial oxidative function through a YY1-
PGC-1alpha transcriptional complex. Nature 450, 736-40.
Cuzzocrea, S., Chatterjee, P. K., Mazzon, E., Dugo, L., Serraino, I., Britti, D.,
Mazzullo, G., Caputi, A. P. and Thiemermann, C. (2002). Pyrrolidine dithiocarbamate
attenuates the development of acute and chronic inflammation. Br J Pharmacol 135, 496-
510.
D'Souza, D., Lai, R. Y., Shuen, M. and Hood, D. A. (2012). mRNA stability as a
function of striated muscle oxidative capacity. Am J Physiol Regul Integr Comp Physiol
303, R408-17.
Das, S. K., Eder, S., Schauer, S., Diwoky, C., Temmel, H., Guertl, B., Gorkiewicz,
G., Tamilarasan, K. P., Kumari, P., Trauner, M. et al. (2011). Adipose triglyceride
lipase contributes to cancer-associated cachexia. Science 333, 233-8.
De Larichaudy, J., Zufferli, A., Serra, F., Isidori, A. M., Naro, F., Dessalle, K.,
Desgeorges, M., Piraud, M., Cheillan, D., Vidal, H. et al. (2012). TNF-alpha- and
tumor-induced skeletal muscle atrophy involves sphingolipid metabolism. Skelet Muscle
2, 2.

193
Deans, C. and Wigmore, S. J. (2005). Systemic inflammation, cachexia and prognosis
in patients with cancer. Curr Opin Clin Nutr Metab Care 8, 265-9.
Dehoux, M., Gobier, C., Lause, P., Bertrand, L., Ketelslegers, J. M. and Thissen, J.
P. (2007). IGF-I does not prevent myotube atrophy caused by proinflammatory cytokines
despite activation of Akt/Foxo and GSK-3beta pathways and inhibition of atrogin-1
mRNA. Am J Physiol Endocrinol Metab 292, E145-50.
Dianliang, Z. (2009). Probing cancer cachexia-anorexia: recent results with knockout,
transgene and polymorphisms. Curr Opin Clin Nutr Metab Care 12, 227-31.
Dickinson, J. M., Fry, C. S., Drummond, M. J., Gundermann, D. M., Walker, D. K.,
Glynn, E. L., Timmerman, K. L., Dhanani, S., Volpi, E. and Rasmussen, B. B.
(2011). Mammalian target of rapamycin complex 1 activation is required for the
stimulation of human skeletal muscle protein synthesis by essential amino acids. J Nutr
141, 856-62.
Ding, H., Jiang, N., Liu, H., Liu, X., Liu, D., Zhao, F., Wen, L., Liu, S., Ji, L. L. and
Zhang, Y. Response of mitochondrial fusion and fission protein gene expression to
exercise in rat skeletal muscle. Biochim Biophys Acta 1800, 250-6.
Dumas, J. F., Goupille, C., Pinault, M., Fandeur, L., Bougnoux, P., Servais, S. and
Couet, C. (2010). n-3 PUFA-enriched diet delays the occurrence of cancer cachexia in
rat with peritoneal carcinosis. Nutr Cancer 62, 343-50.
Duncan, G. E., Perri, M. G., Theriaque, D. W., Hutson, A. D., Eckel, R. H. and
Stacpoole, P. W. (2003). Exercise training, without weight loss, increases insulin
sensitivity and postheparin plasma lipase activity in previously sedentary adults. Diabetes
Care 26, 557-62.
Dworzak, F., Ferrari, P., Gavazzi, C., Maiorana, C. and Bozzetti, F. (1998). Effects
of cachexia due to cancer on whole body and skeletal muscle protein turnover. Cancer
82, 42-8.
Ernst, M. and Jenkins, B. J. (2004). Acquiring signalling specificity from the cytokine
receptor gp130. Trends Genet 20, 23-32.
Esper, D. H. and Harb, W. A. (2005). The cancer cachexia syndrome: a review of
metabolic and clinical manifestations. Nutr Clin Pract 20, 369-76.
Evans, W. J., Morley, J. E., Argiles, J., Bales, C., Baracos, V., Guttridge, D., Jatoi,
A., Kalantar-Zadeh, K., Lochs, H., Mantovani, G. et al. (2008). Cachexia: a new
definition. Clin Nutr 27, 793-9.
Faldt, J., Wernstedt, I., Fitzgerald, S. M., Wallenius, K., Bergstrom, G. and Jansson,
J. O. (2004). Reduced exercise endurance in interleukin-6 deficient mice. Endocrinology
145, 2680-2686.
194
Fearon, K., Arends, J. and Baracos, V. (2013). Understanding the mechanisms and
treatment options in cancer cachexia. Nat Rev Clin Oncol 10, 90-9.
Fearon, K., Strasser, F., Anker, S. D., Bosaeus, I., Bruera, E., Fainsinger, R. L.,
Jatoi, A., Loprinzi, C., MacDonald, N., Mantovani, G. et al. (2011). Definition and
classification of cancer cachexia: an international consensus. Lancet Oncol 12, 489-95.
Febbraio, M. A. (2007). Gp130 receptor ligands as potential therapeutic targets for
obesity. Journal of Clinical Investigation 117, 841-849.
Febbraio, M. A. and Pedersen, B. K. (2005). Contraction-induced myokine production
and release: is skeletal muscle an endocrine organ? Exerc Sport Sci Rev 33, 114-9.
Fentem, P. H. (1994). ABC of sports medicine. Benefits of exercise in health and
disease. BMJ 308, 1291-5.
Fermoselle, C., Garcia-Arumi, E., Puig-Vilanova, E., Andreu, A. L., Urtreger, A. J.,
de Kier Joffe, E. D., Tejedor, A., Puente-Maestu, L. and Barreiro, E. (2013).
Mitochondrial dysfunction and therapeutic approaches in respiratory and limb muscles of
cancer cachectic mice. Exp Physiol 98, 1349-65.
Fernandez-Marcos, P. J. and Auwerx, J. (2011). Regulation of PGC-1alpha, a nodal
regulator of mitochondrial biogenesis. Am J Clin Nutr 93, 884S-90.
Figueras, M., Busquets, S., Carbo, N., Almendro, V., Argiles, J. M. and Lopez-
Soriano, F. J. (2005). Cancer cachexia results in an increase in TNF-alpha receptor gene
expression in both skeletal muscle and adipose tissue. Int J Oncol 27, 855-60.
Fortunati, N., Manti, R., Birocco, N., Pugliese, M., Brignardello, E., Ciuffreda, L.,
Catalano, M. G., Aragno, M. and Boccuzzi, G. (2007). Pro-inflammatory cytokines
and oxidative stress/antioxidant parameters characterize the bio-humoral profile of early
cachexia in lung cancer patients. Oncol Rep 18, 1521-7.
Fox, K. M., Brooks, J. M., Gandra, S. R., Markus, R. and Chiou, C. F. (2009).
Estimation of Cachexia among Cancer Patients Based on Four Definitions. J Oncol 2009,
693458.
Frost, R. A., Huber, D., Pruznak, A. and Lang, C. H. (2009). Regulation of REDD1
by insulin-like growth factor-I in skeletal muscle and myotubes. J Cell Biochem 108,
1192-202.
Frost, R. A. and Lang, C. H. mTor signaling in skeletal muscle during sepsis and
inflammation: where does it all go wrong? Physiology 26, 83-96.
Frost, R. A., Lang, C. H. and Gelato, M. C. (1997). Transient exposure of human
myoblasts to tumor necrosis factor-alpha inhibits serum and insulin-like growth factor-I
stimulated protein synthesis. Endocrinology 138, 4153-9.
195
Fujita, J., Tsujinaka, T., Ebisui, C., Yano, M., Shiozaki, H., Katsume, A., Ohsugi, Y.
and Monden, M. (1996). Role of interleukin-6 in skeletal muscle protein breakdown and
cathepsin activity in vivo. Eur Surg Res 28, 361-6.
Gallagher, I. J., Stephens, N. A., MacDonald, A. J., Skipworth, R. J., Husi, H.,
Greig, C. A., Ross, J. A., Timmons, J. A. and Fearon, K. C. (2012). Suppression of
skeletal muscle turnover in cancer cachexia: evidence from the transcriptome in
sequential human muscle biopsies. Clin Cancer Res 18, 2817-27.
Garnier, A., Fortin, D., Zoll, J., N'Guessan, B., Mettauer, B., Lampert, E., Veksler,
V. and Ventura-Clapier, R. (2005). Coordinated changes in mitochondrial function and
biogenesis in healthy and diseased human skeletal muscle. FASEB J 19, 43-52.
Gerovasili, V., Stefanidis, K., Vitzilaios, K., Karatzanos, E., Politis, P., Koroneos, A.,
Chatzimichail, A., Routsi, C., Roussos, C. and Nanas, S. (2009). Electrical muscle
stimulation preserves the muscle mass of critically ill patients: a randomized study. Crit
Care 13, R161.
Glass, D. J. (2005). Skeletal muscle hypertrophy and atrophy signaling pathways. Int J
Biochem Cell Biol 37, 1974-84.
Goodman, C. A., Frey, J. W., Mabrey, D. M., Jacobs, B. L., Lincoln, H. C., You, J.
S. and Hornberger, T. A. The role of skeletal muscle mTOR in the regulation of
mechanical load―induced growth. The Journal of physiology 589, 5485-5501.
Goodman, C. A. and Hornberger, T. A. Measuring protein synthesis with SUnSET: a
valid alternative to traditional techniques? Exerc Sport Sci Rev.
Goodman, C. A., Kotecki, J. A., Jacobs, B. L. and Hornberger, T. A. (2012). Muscle
fiber type-dependent differences in the regulation of protein synthesis. PLoS One 7,
e37890.
Goodman, C. A., Mabrey, D. M., Frey, J. W., Miu, M. H., Schmidt, E. K., Pierre, P.
and Hornberger, T. A. (2011a). Novel insights into the regulation of skeletal muscle
protein synthesis as revealed by a new nonradioactive in vivo technique. FASEB J 25,
1028-39.
Goodman, C. A., Mayhew, D. L. and Hornberger, T. A. (2011b). Recent progress
toward understanding the molecular mechanisms that regulate skeletal muscle mass. Cell
Signal 23, 1896-906.
Goodyear, L. J., Giorgino, F., Sherman, L. A., Carey, J., Smith, R. J. and Dohm, G.
L. (1995). Insulin receptor phosphorylation, insulin receptor substrate-1 phosphorylation,
and phosphatidylinositol 3-kinase activity are decreased in intact skeletal muscle strips
from obese subjects. J Clin Invest 95, 2195-204.

196
Gordon, J. W., Rungi, A. A., Inagaki, H. and Hood, D. A. (2001). Effects of
contractile activity on mitochondrial transcription factor A expression in skeletal muscle.
J Appl Physiol 90, 389-96.
Grossberg, A. J., Scarlett, J. M. and Marks, D. L. (2010). Hypothalamic mechanisms
in cachexia. Physiol Behav 100, 478-89.
Grosvenor, M., Bulcavage, L. and Chlebowski, R. T. (1989). Symptoms potentially
influencing weight loss in a cancer population. Correlations with primary site, nutritional
status, and chemotherapy administration. Cancer 63, 330-4.
Guttridge, D. C., Mayo, M. W., Madrid, L. V., Wang, C. Y. and Baldwin, A. S., Jr. (2000). NF-kappaB-induced loss of MyoD messenger RNA: possible role in muscle
decay and cachexia. Science 289, 2363-6.
Haan, C., Heinrich, P. C. and Behrmann, I. (2002). Structural requirements of the
interleukin-6 signal transducer gp130 for its interaction with Janus kinase 1: the receptor
is crucial for kinase activation. Biochem J 361, 105-11.
Haddad, F., Zaldivar, F., Cooper, D. M. and Adams, G. R. (2005). IL-6-induced
skeletal muscle atrophy. J Appl Physiol 98, 911-7.
Handberg, A., Vaag, A., Damsbo, P., Beck-Nielsen, H. and Vinten, J. (1990).
Expression of insulin regulatable glucose transporters in skeletal muscle from type 2
(non-insulin-dependent) diabetic patients. Diabetologia 33, 625-7.
Hariri, G., Yan, H., Wang, H., Han, Z. and Hallahan, D. E. (2010). Radiation-guided
drug delivery to mouse models of lung cancer. Clin Cancer Res 16, 4968-77.
Hawley, J. A. (2004). Exercise as a therapeutic intervention for the prevention and
treatment of insulin resistance. Diabetes Metab Res Rev 20, 383-93.
Hawley, J. A. and Lessard, S. J. (2008). Exercise training-induced improvements in
insulin action. Acta Physiol (Oxf) 192, 127-35.
Hayashi, A. A. and Proud, C. G. (2007). The rapid activation of protein synthesis by
growth hormone requires signaling through mTOR. Am J Physiol Endocrinol Metab 292,
E1647-55.
Hayashi, T., Hirshman, M. F., Kurth, E. J., Winder, W. W. and Goodyear, L. J. (1998). Evidence for 5' AMP-activated protein kinase mediation of the effect of muscle
contraction on glucose transport. Diabetes 47, 1369-73.
He, H. J., Zhu, T. N., Xie, Y., Fan, J., Kole, S., Saxena, S. and Bernier, M. (2006).
Pyrrolidine dithiocarbamate inhibits interleukin-6 signaling through impaired STAT3
activation and association with transcriptional coactivators in hepatocytes. J Biol Chem
281, 31369-79.

197
Heinrich, P. C., Behrmann, I., Haan, S., Hermanns, H. M., Muller-Newen, G. and
Schaper, F. (2003). Principles of interleukin (IL)-6-type cytokine signalling and its
regulation. Biochem J 374, 1-20.
Heinrich, P. C., Behrmann, I., Muller-Newen, G., Schaper, F. and Graeve, L. (1998).
Interleukin-6-type cytokine signalling through the gp130/Jak/STAT pathway. Biochem J
334 ( Pt 2), 297-314.
Hirata, H., Tetsumoto, S., Kijima, T., Kida, H., Kumagai, T., Takahashi, R., Otani,
Y., Inoue, K., Kuhara, H., Shimada, K. et al. (2013). Favorable Responses to
Tocilizumab in Two Patients With Cancer-Related Cachexia. J Pain Symptom Manage.
Ho, R. C., Hirshman, M. F., Li, Y., Cai, D., Farmer, J. R., Aschenbach, W. G.,
Witczak, C. A., Shoelson, S. E. and Goodyear, L. J. (2005). Regulation of IκB kinase
and NF-κB in contracting adult rat skeletal muscle. American Journal of Physiology-Cell
Physiology 289, C794-C801.
Holloszy, J. O. (1967). Biochemical adaptations in muscle. Effects of exercise on
mitochondrial oxygen uptake and respiratory enzyme activity in skeletal muscle. J Biol
Chem 242, 2278-82.
Holloszy, J. O. and Coyle, E. F. (1984). Adaptations of skeletal muscle to endurance
exercise and their metabolic consequences. J Appl Physiol 56, 831-8.
Hood, D. A., Irrcher, I., Ljubicic, V. and Joseph, A. M. (2006). Coordination of
metabolic plasticity in skeletal muscle. J Exp Biol 209, 2265-75.
Hoppeler, H. (1986). Exercise-induced ultrastructural changes in skeletal muscle. Int J
Sports Med 7, 187-204.
Houmard, J. A., Shaw, C. D., Hickey, M. S. and Tanner, C. J. (1999). Effect of short-
term exercise training on insulin-stimulated PI 3-kinase activity in human skeletal
muscle. Am J Physiol 277, E1055-60.
Huang, J., Kaminski, P. M., Edwards, J. G., Yeh, A., Wolin, M. S., Frishman, W. H.,
Gewitz, M. H. and Mathew, R. (2008). Pyrrolidine dithiocarbamate restores endothelial
cell membrane integrity and attenuates monocrotaline-induced pulmonary artery
hypertension. Am J Physiol Lung Cell Mol Physiol 294, L1250-9.
Iqbal, S., Ostojic, O., Singh, K., Joseph, A. M. and Hood, D. A. (2013). Expression of
mitochondrial fission and fusion regulatory proteins in skeletal muscle during chronic use
and disuse. Muscle Nerve 48, 963-70.
Iwase, S., Murakami, T., Saito, Y. and Nakagawa, K. (2004). Steep elevation of blood
interleukin-6 (IL-6) associated only with late stages of cachexia in cancer patients. Eur
Cytokine Netw 15, 312-6.

198
Jager, S., Handschin, C., St-Pierre, J. and Spiegelman, B. M. (2007). AMP-activated
protein kinase (AMPK) action in skeletal muscle via direct phosphorylation of PGC-
1alpha. Proc Natl Acad Sci U S A 104, 12017-22.
James, D. E., Burleigh, K. M., Kraegen, E. W. and Chisholm, D. J. (1983). Effect of
acute exercise and prolonged training on insulin response to intravenous glucose in vivo
in rat. J Appl Physiol 55, 1660-4.
James, D. E., Kraegen, E. W. and Chisholm, D. J. (1984). Effect of exercise training
on whole-body insulin sensitivity and responsiveness. J Appl Physiol 56, 1217-22.
Jones, S. A., Horiuchi, S., Topley, N., Yamamoto, N. and Fuller, G. M. (2001). The
soluble interleukin 6 receptor: mechanisms of production and implications in disease.
FASEB J 15, 43-58.
Jones, S. A., Scheller, J. and Rose-John, S. (2011). Therapeutic strategies for the
clinical blockade of IL-6/gp130 signaling. J Clin Invest 121, 3375-83.
Julienne, C. M., Dumas, J. F., Goupille, C., Pinault, M., Berri, C., Collin, A.,
Tesseraud, S., Couet, C. and Servais, S. (2012). Cancer cachexia is associated with a
decrease in skeletal muscle mitochondrial oxidative capacities without alteration of ATP
production efficiency. J Cachexia Sarcopenia Muscle 3, 265-75.
Kahn, B. B. (1992). Facilitative glucose transporters: regulatory mechanisms and
dysregulation in diabetes. J Clin Invest 89, 1367-74.
Kalra, P. R. and Tigas, S. (2002). Regulation of lipolysis: natriuretic peptides and the
development of cachexia. Int J Cardiol 85, 125-32.
Kamoshida, S., Watanabe, K., Suzuki, M., Mizutani, Y., Sakamoto, K., Sugimoto,
Y., Oka, T., Fukushima, M. and Tsutsumi, Y. (2006). Expression of cancer cachexia-
related factors in human cancer xenografts: an immunohistochemical analysis. Biomed
Res 27, 275-81.
Kelly, M., Keller, C., Avilucea, P. R., Keller, P., Luo, Z. J., Xiang, X. Q., Giralt, M.,
Hidalgo, J., Saha, A. K., Pedersen, B. K. et al. (2004). AMPK activity is diminished in
tissues of IL-6 knockout mice: the effect of exercise. Biochem Biophys Res Commun 320,
449-454.
Kennedy, J. W., Hirshman, M. F., Gervino, E. V., Ocel, J. V., Forse, R. A., Hoenig,
S. J., Aronson, D., Goodyear, L. J. and Horton, E. S. (1999). Acute exercise induces
GLUT4 translocation in skeletal muscle of normal human subjects and subjects with type
2 diabetes. Diabetes 48, 1192-7.
Kim, S., Takahashi, H., Lin, W. W., Descargues, P., Grivennikov, S., Kim, Y., Luo,
J. L. and Karin, M. (2009). Carcinoma-produced factors activate myeloid cells through
TLR2 to stimulate metastasis. Nature 457, 102-6.

199
Kim, Y. S. and Kim, Y. (1975). Glucocorticoid inhibition of protein synthesis in vivo
and in vitro. J Biol Chem 250, 2293-8.
King, P. A., Betts, J. J., Horton, E. D. and Horton, E. S. (1993). Exercise, unlike
insulin, promotes glucose transporter translocation in obese Zucker rat muscle. Am J
Physiol 265, R447-52.
Kishimoto, T., Akira, S., Narazaki, M. and Taga, T. (1995). Interleukin-6 family of
cytokines and gp130. Blood 86, 1243-54.
Klover, P. J., Zimmers, T. A., Koniaris, L. G. and Mooney, R. A. (2003). Chronic
exposure to interleukin-6 causes hepatic insulin resistance in mice. Diabetes 52, 2784-9.
Kondo, T., Kobayashi, I. and Murakami, M. (2006). Effect of exercise on circulating
adipokine levels in obese young women. Endocr J 53, 189-95.
Koshiba, T., Detmer, S. A., Kaiser, J. T., Chen, H., McCaffery, J. M. and Chan, D.
C. (2004). Structural basis of mitochondrial tethering by mitofusin complexes. Science
305, 858-62.
La Rosa, G., Cardali, S., Genovese, T., Conti, A., Di Paola, R., La Torre, D.,
Cacciola, F. and Cuzzocrea, S. (2004). Inhibition of the nuclear factor-kappaB
activation with pyrrolidine dithiocarbamate attenuating inflammation and oxidative stress
after experimental spinal cord trauma in rats. J Neurosurg Spine 1, 311-21.
Lai, R. Y., Ljubicic, V., D'Souza, D. and Hood, D. A. Effect of chronic contractile
activity on mRNA stability in skeletal muscle. Am J Physiol Cell Physiol 299, C155-63.
Lai, R. Y., Ljubicic, V., D'Souza, D. and Hood, D. A. (2010). Effect of chronic
contractile activity on mRNA stability in skeletal muscle. Am J Physiol Cell Physiol 299,
C155-63.
Lantier, L., Mounier, R., Leclerc, J., Pende, M., Foretz, M. and Viollet, B.
Coordinated maintenance of muscle cell size control by AMP-activated protein kinase.
The FASEB Journal 24, 3555-3561.
Lanza, I. R. and Nair, K. S. (2009). Functional assessment of isolated mitochondria in
vitro. Methods Enzymol 457, 349-72.
Lee, D. F. and Hung, M. C. (2007). All roads lead to mTOR: integrating inflammation
and tumor angiogenesis. Cell Cycle 6, 3011-4.
Li, P., Waters, R. E., Redfern, S. I., Zhang, M., Mao, L., Annex, B. H. and Yan, Z. (2007). Oxidative phenotype protects myofibers from pathological insults induced by
chronic heart failure in mice. Am J Pathol 170, 599-608.

200
Liesa, M., Borda-d'Agua, B., Medina-Gomez, G., Lelliott, C. J., Paz, J. C., Rojo, M.,
Palacin, M., Vidal-Puig, A. and Zorzano, A. (2008). Mitochondrial fusion is increased
by the nuclear coactivator PGC-1beta. PLoS One 3, e3613.
Liesa, M., Palacin, M. and Zorzano, A. (2009). Mitochondrial dynamics in mammalian
health and disease. Physiol Rev 89, 799-845.
Lin, L., Hutzen, B., Li, P. K., Ball, S., Zuo, M., DeAngelis, S., Foust, E., Sobo, M.,
Friedman, L., Bhasin, D. et al. (2010). A novel small molecule, LLL12, inhibits STAT3
phosphorylation and activities and exhibits potent growth-suppressive activity in human
cancer cells. Neoplasia 12, 39-50.
Lin, L., Liu, A., Peng, Z., Lin, H. J., Li, P. K., Li, C. and Lin, J. (2011). STAT3 is
necessary for proliferation and survival in colon cancer-initiating cells. Cancer Res 71,
7226-37.
Llovera, M., Garcia-Martinez, C., Lopez-Soriano, J., Carbo, N., Agell, N., Lopez-
Soriano, F. J. and Argiles, J. M. (1998). Role of TNF receptor 1 in protein turnover
during cancer cachexia using gene knockout mice. Mol Cell Endocrinol 142, 183-9.
Lo, C. W., Chen, M. W., Hsiao, M., Wang, S., Chen, C. A., Hsiao, S. M., Chang, J.
S., Lai, T. C., Rose-John, S., Kuo, M. L. et al. (2011). IL-6 trans-signaling in formation
and progression of malignant ascites in ovarian cancer. Cancer Res 71, 424-34.
Lorite, M. J., Cariuk, P. and Tisdale, M. J. (1997). Induction of muscle protein
degradation by a tumour factor. Br J Cancer 76, 1035-40.
Maddocks, M., Byrne, A., Johnson, C. D., Wilson, R. H., Fearon, K. C. and Wilcock,
A. Physical activity level as an outcome measure for use in cancer cachexia trials: a
feasibility study. Support Care Cancer 18, 1539-44.
Matthys, P., Heremans, H., Opdenakker, G. and Billiau, A. (1991). Anti-interferon-
gamma antibody treatment, growth of Lewis lung tumours in mice and tumour-associated
cachexia. Eur J Cancer 27, 182-7.
Mattusch, F., Dufaux, B., Heine, O., Mertens, I. and Rost, R. (2000). Reduction of the
plasma concentration of C-reactive protein following nine months of endurance training.
Int J Sports Med 21, 21-4.
McClung, J. M., Judge, A. R., Powers, S. K. and Yan, Z. (2010). p38 MAPK links
oxidative stress to autophagy-related gene expression in cachectic muscle wasting. Am J
Physiol Cell Physiol 298, C542-9.
Mehl, K. A., Davis, J. M., Clements, J. M., Berger, F. G., Pena, M. M. and Carson,
J. A. (2005). Decreased intestinal polyp multiplicity is related to exercise mode and
gender in ApcMin/+ mice. J Appl Physiol 98, 2219-25.
201
Menshikova, E. V., Ritov, V. B., Fairfull, L., Ferrell, R. E., Kelley, D. E. and
Goodpaster, B. H. (2006). Effects of exercise on mitochondrial content and function in
aging human skeletal muscle. J Gerontol A Biol Sci Med Sci 61, 534-40.
Mingrone, G., Manco, M., Calvani, M., Castagneto, M., Naon, D. and Zorzano, A.
(2005). Could the low level of expression of the gene encoding skeletal muscle
mitofusin-2 account for the metabolic inflexibility of obesity? Diabetologia 48, 2108-14.
Mole, P. A., Oscai, L. B. and Holloszy, J. O. (1971). Adaptation of muscle to exercise.
Increase in levels of palmityl Coa synthetase, carnitine palmityltransferase, and palmityl
Coa dehydrogenase, and in the capacity to oxidize fatty acids. J Clin Invest 50, 2323-30.
Monitto, C. L., Berkowitz, D., Lee, K. M., Pin, S., Li, D., Breslow, M., O'Malley, B.
and Schiller, M. (2001). Differential gene expression in a murine model of cancer
cachexia. Am J Physiol Endocrinol Metab 281, E289-97.
Mori, M., Yamaguchi, K., Honda, S., Nagasaki, K., Ueda, M., Abe, O. and Abe, K. (1991). Cancer cachexia syndrome developed in nude mice bearing melanoma cells
producing leukemia-inhibitory factor. Cancer Res 51, 6656-9.
Morino, K., Petersen, K. F. and Shulman, G. I. (2006). Molecular mechanisms of
insulin resistance in humans and their potential links with mitochondrial dysfunction.
Diabetes 55 Suppl 2, S9-S15.
Moser, A. R., Pitot, H. C. and Dove, W. F. (1990). A dominant mutation that
predisposes to multiple intestinal neoplasia in the mouse. Science 247, 322-4.
Mulligan, H. D., Mahony, S. M., Ross, J. A. and Tisdale, M. J. (1992). Weight loss in
a murine cachexia model is not associated with the cytokines tumour necrosis factor-
alpha or interleukin-6. Cancer Lett 65, 239-43.
Murphy, K. T., Chee, A., Gleeson, B. G., Naim, T., Swiderski, K., Koopman, R. and
Lynch, G. S. Antibody-directed myostatin inhibition enhances muscle mass and function
in tumor-bearing mice. American Journal of Physiology-Regulatory, Integrative and
Comparative Physiology 301, R716-R726.
Murphy, K. T., Chee, A., Gleeson, B. G., Naim, T., Swiderski, K., Koopman, R. and
Lynch, G. S. (2011). Antibody-directed myostatin inhibition enhances muscle mass and
function in tumor-bearing mice. Am J Physiol Regul Integr Comp Physiol 301, R716-26.
Murphy, K. T. and Lynch, G. S. (2009). Update on emerging drugs for cancer cachexia.
Expert Opin Emerg Drugs 14, 619-32.
Murphy, K. T. and Lynch, G. S. (2012). Editorial update on emerging drugs for cancer
cachexia. Expert Opin Emerg Drugs 17, 5-9.
Muscaritoli, M., Anker, S. D., Argiles, J., Aversa, Z., Bauer, J. M., Biolo, G., Boirie,
Y., Bosaeus, I., Cederholm, T., Costelli, P. et al. (2010). Consensus definition of

202
sarcopenia, cachexia and pre-cachexia: joint document elaborated by Special Interest
Groups (SIG) "cachexia-anorexia in chronic wasting diseases" and "nutrition in
geriatrics". Clin Nutr 29, 154-9.
Mustian, K. M., Morrow, G. R., Carroll, J. K., Figueroa-Moseley, C. D., Jean-
Pierre, P. and Williams, G. C. (2007). Integrative nonpharmacologic behavioral
interventions for the management of cancer-related fatigue. Oncologist 12 Suppl 1, 52-
67.
Nachlas, M. M., Tsou, K. C., De Souza, E., Cheng, C. S. and Seligman, A. M. (1957).
Cytochemical demonstration of succinic dehydrogenase by the use of a new p-
nitrophenyl substituted ditetrazole. J Histochem Cytochem 5, 420-36.
Nader, G. A. and Esser, K. A. (2001). Intracellular signaling specificity in skeletal
muscle in response to different modes of exercise. J Appl Physiol 90, 1936-42.
Nai, Y. J., Jiang, Z. W., Wang, Z. M., Li, N. and Li, J. S. (2007). Prevention of cancer
cachexia by pyrrolidine dithiocarbamate (PDTC) in colon 26 tumor-bearing mice. JPEN
J Parenter Enteral Nutr 31, 18-25.
Nechemia-Arbely, Y., Barkan, D., Pizov, G., Shriki, A., Rose-John, S., Galun, E. and
Axelrod, J. H. (2008). IL-6/IL-6R axis plays a critical role in acute kidney injury. J Am
Soc Nephrol 19, 1106-15.
Niehof, M., Streetz, K., Rakemann, T., Bischoff, S. C., Manns, M. P., Horn, F. and
Trautwein, C. (2001). Interleukin-6-induced tethering of STAT3 to the LAP/C/EBPbeta
promoter suggests a new mechanism of transcriptional regulation by STAT3. J Biol
Chem 276, 9016-27.
Nowell, M. A., Richards, P. J., Horiuchi, S., Yamamoto, N., Rose-John, S., Topley,
N., Williams, A. S. and Jones, S. A. (2003). Soluble IL-6 receptor governs IL-6 activity
in experimental arthritis: blockade of arthritis severity by soluble glycoprotein 130. J
Immunol 171, 3202-9.
O'Gorman, P., McMillan, D. C. and McArdle, C. S. (1998). Impact of weight loss,
appetite, and the inflammatory response on quality of life in gastrointestinal cancer
patients. Nutr Cancer 32, 76-80.
Oh, H. M., Yu, C. R., Dambuza, I., Marrero, B. and Egwuagu, C. E. (2012). STAT3
protein interacts with Class O Forkhead transcription factors in the cytoplasm and
regulates nuclear/cytoplasmic localization of FoxO1 and FoxO3a proteins in CD4(+) T
cells. J Biol Chem 287, 30436-43.
Ohe, Y., Podack, E. R., Olsen, K. J., Miyahara, Y., Miura, K., Saito, H., Koishihara,
Y., Ohsugi, Y., Ohira, T., Nishio, K. et al. (1993). Interleukin-6 cDNA transfected
Lewis lung carcinoma cells show unaltered net tumour growth rate but cause weight loss
and shortened survival in syngeneic mice. Br J Cancer 67, 939-44.

203
Oscai, L. B. and Holloszy, J. O. (1971). Biochemical adaptations in muscle. II.
Response of mitochondrial adenosine triphosphatase, creatine phosphokinase, and
adenylate kinase activities in skeletal muscle to exercise. J Biol Chem 246, 6968-72.
Parkington, J. D., Siebert, A. P., LeBrasseur, N. K. and Fielding, R. A. (2003).
Differential activation of mTOR signaling by contractile activity in skeletal muscle. Am J
Physiol Regul Integr Comp Physiol 285, R1086-90.
Penna, F., Busquets, S., Pin, F., Toledo, M., Baccino, F. M., Lopez-Soriano, F. J.,
Costelli, P. and Argiles, J. M. Combined approach to counteract experimental cancer
cachexia: eicosapentaenoic acid and training exercise. J Cachexia Sarcopenia Muscle 2,
95-104.
Persson, C. and Glimelius, B. (2002). The relevance of weight loss for survival and
quality of life in patients with advanced gastrointestinal cancer treated with palliative
chemotherapy. Anticancer Res 22, 3661-8.
Petersen, A. M. and Pedersen, B. K. (2005). The anti-inflammatory effect of exercise. J
Appl Physiol 98, 1154-62.
Peterson, J. M. and Guttridge, D. C. (2008). Skeletal muscle diseases, inflammation,
and NF-kappaB signaling: insights and opportunities for therapeutic intervention. Int Rev
Immunol 27, 375-87.
Pfeilschifter, W., Czech, B., Hoffmann, B. P., Sujak, M., Kahles, T., Steinmetz, H.,
Neumann-Haefelin, T. and Pfeilschifter, J. Pyrrolidine dithiocarbamate activates p38
MAPK and protects brain endothelial cells from apoptosis: a mechanism for the
protective effect in stroke? Neurochemical research 35, 1391-1401.
Pilegaard, H., Ordway, G. A., Saltin, B. and Neufer, P. D. (2000). Transcriptional
regulation of gene expression in human skeletal muscle during recovery from exercise.
Am J Physiol Endocrinol Metab 279, E806-14.
Pilegaard, H., Saltin, B. and Neufer, P. D. (2003). Exercise induces transient
transcriptional activation of the PGC-1alpha gene in human skeletal muscle. J Physiol
546, 851-8.
Puppa, M., Gao, S., Narsale, A. and Carson, J. (2013a). Skeletal muscle glycoprotein
130’s role in Lewis Lung Carcinoma induced cachexia. FASEB J (in press).
Puppa, M. J., Gao, S., Narsale, A. A. and Carson, J. A. (2013b). Skeletal muscle
glycoprotein 130's role in Lewis lung carcinoma-induced cachexia. FASEB J.
Puppa, M. J., White, J. P., Baltgalvis, K. A., Sato, S., Baynes, J. W. and Carson, J.
A. (2011a). The effect of exercise on IL-6 induced cachexia in the ApcMin/+ mouse. J
cachexia, Sarcopenia, and Muscle.

204
Puppa, M. J., White, J. P., Sato, S., Cairns, M., Baynes, J. W. and Carson, J. A. (2011b). Gut barrier dysfunction in the Apc(Min/+) mouse model of colon cancer
cachexia. Biochim Biophys Acta 1812, 1601-6.
Puppa, M. J., White, J. P., Sato, S., M.A., C., Baynes, J. W. and Carson, J. A.
(2011c). Gut barrier dysfunction in the ApcMin/+ mouse model of colon cancer cachexia.
Biochemica et Biophysica Acta.
Puppa, M. J., White, J. P., Velazquez, K. T., Baltgalvis, K. A., Sato, S., Baynes, J.
W. and Carson, J. A. (2011d). The effect of exercise on IL-6-induced cachexia in the
Apc ( Min/+) mouse. J Cachexia Sarcopenia Muscle.
Qiu, H., Lizano, P., Laure, L., Sui, X., Rashed, E., Park, J. Y., Hong, C., Gao, S.,
Holle, E., Morin, D. et al. (2011). H11 kinase/heat shock protein 22 deletion impairs
both nuclear and mitochondrial functions of STAT3 and accelerates the transition into
heart failure on cardiac overload. Circulation 124, 406-15.
Ramaswamy, S., Nakamura, N., Sansal, I., Bergeron, L. and Sellers, W. R. (2002). A
novel mechanism of gene regulation and tumor suppression by the transcription factor
FKHR. Cancer Cell 2, 81-91.
Reed, S. A., Sandesara, P. B., Senf, S. M. and Judge, A. R. Inhibition of FoxO
transcriptional activity prevents muscle fiber atrophy during cachexia and induces
hypertrophy. FASEB J 26, 987-1000.
Reed, S. A., Sandesara, P. B., Senf, S. M. and Judge, A. R. (2012). Inhibition of FoxO
transcriptional activity prevents muscle fiber atrophy during cachexia and induces
hypertrophy. FASEB J 26, 987-1000.
Risson, V., Mazelin, L., Roceri, M., Sanchez, H., Moncollin, V., Corneloup, C.,
Richard-Bulteau, H., Vignaud, A., Baas, D., Defour, A. et al. (2009). Muscle
inactivation of mTOR causes metabolic and dystrophin defects leading to severe
myopathy. J Cell Biol 187, 859-74.
Rivadeneira, D. E., Naama, H. A., McCarter, M. D., Fujita, J., Evoy, D., Mackrell,
P. and Daly, J. M. (1999). Glucocorticoid blockade does not abrogate tumor-induced
cachexia. Nutr Cancer 35, 202-6.
Rodriguez, C., Grosgeorge, J., Nguyen, V. C., Gaudray, P. and Theillet, C. (1995).
Human gp130 transducer chain gene (IL6ST) is localized to chromosome band 5q11 and
possesses a pseudogene on chromosome band 17p11. Cytogenet Cell Genet 70, 64-7.
Romanello, V., Guadagnin, E., Gomes, L., Roder, I., Sandri, C., Petersen, Y., Milan,
G., Masiero, E., Del Piccolo, P., Foretz, M. et al. Mitochondrial fission and remodelling
contributes to muscle atrophy. EMBO J 29, 1774-85.

205
Romanello, V., Guadagnin, E., Gomes, L., Roder, I., Sandri, C., Petersen, Y., Milan,
G., Masiero, E., Del Piccolo, P., Foretz, M. et al. (2010). Mitochondrial fission and
remodelling contributes to muscle atrophy. EMBO J 29, 1774-85.
Romanello, V. and Sandri, M. Mitochondrial biogenesis and fragmentation as
regulators of muscle protein degradation. Curr Hypertens Rep 12, 433-9.
Romanello, V. and Sandri, M. (2010). Mitochondrial biogenesis and fragmentation as
regulators of muscle protein degradation. Curr Hypertens Rep 12, 433-9.
Rose-John, S. (2003). Interleukin-6 biology is coordinated by membrane bound and
soluble receptors. Acta Biochim Pol 50, 603-11.
Rose-John, S. (2012). IL-6 trans-signaling via the soluble IL-6 receptor: importance for
the pro-inflammatory activities of IL-6. Int J Biol Sci 8, 1237-47.
Rose-John, S., Scheller, J., Elson, G. and Jones, S. A. (2006). Interleukin-6 biology is
coordinated by membrane-bound and soluble receptors: role in inflammation and cancer.
J Leukoc Biol 80, 227-36.
Ruas, J. L., White, J. P., Rao, R. R., Kleiner, S., Brannan, K. T., Harrison, B. C.,
Greene, N. P., Wu, J., Estall, J. L., Irving, B. A. et al. (2012). A PGC-1alpha isoform
induced by resistance training regulates skeletal muscle hypertrophy. Cell 151, 1319-31.
Russell, A. P., Hesselink, M. K., Lo, S. K. and Schrauwen, P. (2005). Regulation of
metabolic transcriptional co-activators and transcription factors with acute exercise.
FASEB J 19, 986-8.
Saini, A., Al-Shanti, N. and Stewart, C. E. (2006). Waste management - cytokines,
growth factors and cachexia. Cytokine Growth Factor Rev 17, 475-86.
Saito, M., Yoshida, K., Hibi, M., Taga, T. and Kishimoto, T. (1992). Molecular
cloning of a murine IL-6 receptor-associated signal transducer, gp130, and its regulated
expression in vivo. J Immunol 148, 4066-71.
Sato, S. (2012). The effect of sex and exercise training during the progression of cancer
cachexia in the apc min/+ mouse. In Exercise Science, vol. PhD (ed., pp. 310. Columbia:
University of South Carolina.
Schakman, O., Kalista, S., Barbe, C., Loumaye, A. and Thissen, J. P. (2013).
Glucocorticoid-induced skeletal muscle atrophy. Int J Biochem Cell Biol 45, 2163-72.
Schiaffino, S. and Mammucari, C. (2011). Regulation of skeletal muscle growth by the
IGF1-Akt/PKB pathway: insights from genetic models. Skelet Muscle 1, 4.
Schieke, S. M., Phillips, D., McCoy, J. P., Jr., Aponte, A. M., Shen, R. F., Balaban,
R. S. and Finkel, T. (2006). The mammalian target of rapamycin (mTOR) pathway
206
regulates mitochondrial oxygen consumption and oxidative capacity. J Biol Chem 281,
27643-52.
Schmidt, E. K., Clavarino, G., Ceppi, M. and Pierre, P. (2009). SUnSET, a
nonradioactive method to monitor protein synthesis. Nat Methods 6, 275-7.
Schreck, R., Meier, B., Mannel, D. N., Droge, W. and Baeuerle, P. A. (1992).
Dithiocarbamates as potent inhibitors of nuclear factor kappa B activation in intact cells.
J Exp Med 175, 1181-94.
Schwantner, A., Dingley, A. J., Ozbek, S., Rose-John, S. and Grotzinger, J. (2004).
Direct determination of the interleukin-6 binding epitope of the interleukin-6 receptor by
NMR spectroscopy. J Biol Chem 279, 571-6.
Scott, H. R., McMillan, D. C., Brown, D. J., Forrest, L. M., McArdle, C. S. and
Milroy, R. (2003). A prospective study of the impact of weight loss and the systemic
inflammatory response on quality of life in patients with inoperable non-small cell lung
cancer. Lung Cancer 40, 295-9.
Serrano, A. L., Baeza-Raja, B., Perdiguero, E., Jardi, M. and Munoz-Cinoves, P. (2008). Interleukin-6 is an essential regulator of satellite cell-mediated skeletal muscle
hypertrophy. Cell Metabolism 7, 33-44.
Shi, X., Leonard, S. S., Wang, S. and Ding, M. (2000). Antioxidant properties of
pyrrolidine dithiocarbamate and its protection against Cr(VI)-induced DNA strand
breakage. Ann Clin Lab Sci 30, 209-16.
Siddiqui, R. A., Hassan, S., Harvey, K. A., Rasool, T., Das, T., Mukerji, P. and
DeMichele, S. (2009). Attenuation of proteolysis and muscle wasting by curcumin c3
complex in MAC16 colon tumour-bearing mice. Br J Nutr 102, 967-75.
Soda, K., Kawakami, M., Kashii, A. and Miyata, M. (1995). Manifestations of cancer
cachexia induced by colon 26 adenocarcinoma are not fully ascribable to interleukin-6.
Int J Cancer 62, 332-6.
Solheim, T. S., Fearon, K. C., Blum, D. and Kaasa, S. (2013). Non-steroidal anti-
inflammatory treatment in cancer cachexia: A systematic literature review. Acta Oncol
52, 6-17.
Song, S., Abdelmohsen, K., Zhang, Y., Becker, K. G., Gorospe, M. and Bernier, M.
(2011). Impact of pyrrolidine dithiocarbamate and interleukin-6 on mammalian target of
rapamycin complex 1 regulation and global protein translation. J Pharmacol Exp Ther
339, 905-13.
Soriano, F. X., Liesa, M., Bach, D., Chan, D. C., Palacin, M. and Zorzano, A. (2006).
Evidence for a mitochondrial regulatory pathway defined by peroxisome proliferator-
activated receptor-gamma coactivator-1 alpha, estrogen-related receptor-alpha, and
mitofusin 2. Diabetes 55, 1783-91.

207
Stahl, N., Boulton, T. G., Farruggella, T., Ip, N. Y., Davis, S., Witthuhn, B. A.,
Quelle, F. W., Silvennoinen, O., Barbieri, G., Pellegrini, S. et al. (1994). Association
and activation of Jak-Tyk kinases by CNTF-LIF-OSM-IL-6 beta receptor components.
Science 263, 92-5.
Steinberg, G. R., Watt, M. J., McGee, S. L., Chan, S., Hargreaves, M., Febbraio, M.
A., Stapleton, D. and Kemp, B. E. (2006). Reduced glycogen availability is associated
with increased AMPKalpha2 activity, nuclear AMPKalpha2 protein abundance, and
GLUT4 mRNA expression in contracting human skeletal muscle. Appl Physiol Nutr
Metab 31, 302-12.
Stitt, T. N., Drujan, D., Clarke, B. A., Panaro, F., Timofeyva, Y., Kline, W. O.,
Gonzalez, M., Yancopoulos, G. D. and Glass, D. J. (2004). The IGF-1/PI3K/Akt
pathway prevents expression of muscle atrophy-induced ubiquitin ligases by inhibiting
FOXO transcription factors. Mol Cell 14, 395-403.
Strassmann, G., Fong, M., Freter, C. E., Windsor, S., D'Alessandro, F. and Nordan,
R. P. (1993). Suramin interferes with interleukin-6 receptor binding in vitro and inhibits
colon-26-mediated experimental cancer cachexia in vivo. J Clin Invest 92, 2152-9.
Strassmann, G., Fong, M., Kenney, J. S. and Jacob, C. O. (1992). Evidence for the
involvement of interleukin 6 in experimental cancer cachexia. J Clin Invest 89, 1681-4.
Strassmann, G. and Kambayashi, T. (1995). Inhibition of experimental cancer
cachexia by anti-cytokine and anti-cytokine-receptor therapy. Cytokines Mol Ther 1, 107-
13.
Tan, B. H. and Fearon, K. C. (2008). Cachexia: prevalence and impact in medicine.
Curr Opin Clin Nutr Metab Care 11, 400-7.
Tazaki, E., Shimizu, N., Tanaka, R., Yoshizumi, M., Kamma, H., Imoto, S., Goya,
T., Kozawa, K., Nishina, A. and Kimura, H. (2011). Serum cytokine profiles in
patients with prostate carcinoma. Exp Ther Med 2, 887-891.
Tessitore, L., Bonelli, G. and Baccino, F. M. (1987). Early development of protein
metabolic perturbations in the liver and skeletal muscle of tumour-bearing rats. A model
system for cancer cachexia. Biochem J 241, 153-9.
Tisdale, M. J. (2001). Cancer anorexia and cachexia. Nutrition 17, 438-42.
Tisdale, M. J. (2002). Cachexia in cancer patients. Nat Rev Cancer 2, 862-71.
Tisdale, M. J. (2003). The 'cancer cachectic factor'. Support Care Cancer 11, 73-8.
Tisdale, M. J. (2005). Molecular pathways leading to cancer cachexia. Physiology
(Bethesda) 20, 340-8.
Tisdale, M. J. (2009). Mechanisms of cancer cachexia. Physiol Rev 89, 381-410.
208
Toledo-Corral, C. M. and Banner, L. R. Early changes of LIFR and gp130 in sciatic
nerve and muscle of diabetic mice. Acta Histochem 114, 159-65.
Tzika, A. A., Fontes-Oliveira, C. C., Shestov, A. A., Constantinou, C., Psychogios,
N., Righi, V., Mintzopoulos, D., Busquets, S., Lopez-Soriano, F. J., Milot, S. et al.
(2013). Skeletal muscle mitochondrial uncoupling in a murine cancer cachexia model. Int
J Oncol 43, 886-94.
Uguccioni, G. and Hood, D. A. The importance of PGC-1alpha in contractile activity-
induced mitochondrial adaptations. Am J Physiol Endocrinol Metab 300, E361-71.
Vavvas, D., Apazidis, A., Saha, A. K., Gamble, J., Patel, A., Kemp, B. E., Witters, L.
A. and Ruderman, N. B. (1997). Contraction-induced changes in acetyl-CoA
carboxylase and 5'-AMP-activated kinase in skeletal muscle. J Biol Chem 272, 13255-61.
von Haehling, S., Lainscak, M., Springer, J. and Anker, S. D. (2009). Cardiac
cachexia: a systematic overview. Pharmacol Ther 121, 227-52.
Waetzig, G. H. and Rose-John, S. (2012). Hitting a complex target: an update on
interleukin-6 trans-signalling. Expert Opin Ther Targets 16, 225-36.
Wallenius, V., Wallenius, K., Ahren, B., Rudling, M., Carlsten, H., Dickson, S. L.,
Ohlsson, C. and Jansson, J. O. (2002). Interleukin-6-deficient mice develop mature-
onset obesity. Nature Medicine 8, 75-79.
Walsh, D., Donnelly, S. and Rybicki, L. (2000). The symptoms of advanced cancer:
relationship to age, gender, and performance status in 1,000 patients. Support Care
Cancer 8, 175-9.
Wang, X., Pickrell, A. M., Zimmers, T. A. and Moraes, C. T. (2012). Increase in
muscle mitochondrial biogenesis does not prevent muscle loss but increased tumor size in
a mouse model of acute cancer-induced cachexia. PLoS One 7, e33426.
Wang, X. H., Du, J., Klein, J. D., Bailey, J. L. and Mitch, W. E. (2009). Exercise
ameliorates chronic kidney disease-induced defects in muscle protein metabolism and
progenitor cell function. Kidney Int 76, 751-9.
Washington, T. A., White, J. P., Davis, J. M., Wilson, L. B., Lowe, L. L., Sato, S. and
Carson, J. A. (2011). Skeletal muscle mass recovery from atrophy in IL-6 knockout
mice. Acta Physiol (Oxf) 202, 657-69.
Watt, M. J., Dzamko, N., Thomas, W. G., Rose-John, S., Ernst, M., Carling, D.,
Kemp, B. E., Febbraio, M. A. and Steinberg, G. R. (2006). CNTF reverses obesity-
induced insulin resistance by activating skeletal muscle AMPK. Nature Medicine 12,
541-548.
209
White, J., Puppa, M., Gao, S., Sato, S., Welle, S. and Carson, J. (2012a). Disrupted
mTOR Signaling During Cancer Cachexia. American Journal of Physiology -
Endocrinology and Metabolism (in review).
White, J. P., Baltgalvis, K. A., Puppa, M. J., Sato, S., Baynes, J. W. and Carson, J.
A. Muscle oxidative capacity during IL-6-dependent cancer cachexia. Am J Physiol
Regul Integr Comp Physiol 300, R201-11.
White, J. P., Baltgalvis, K. A., Puppa, M. J., Sato, S., Baynes, J. W. and Carson, J.
A. (2011a). Muscle oxidative capacity during IL-6-dependent cancer cachexia. Am J
Physiol Regul Integr Comp Physiol 300, R201-11.
White, J. P., Baynes, J. W., Welle, S. L., Kostek, M. C., Matesic, L. E., Sato, S. and
Carson, J. A. (2011b). The regulation of skeletal muscle protein turnover during the
progression of cancer cachexia in the Apc(Min/+) mouse. PLoS One 6, e24650.
White, J. P., Gao, S., Puppa, M. J., Sato, S., Welle, S. L. and Carson, J. A. (2013a).
Testosterone regulation of Akt/mTORC1/FoxO3a signaling in skeletal muscle. Mol Cell
Endocrinol 365, 174-86.
White, J. P., Puppa, M. J., Gao, S., Sato, S., Welle, S. L. and Carson, J. A. (2013b).
Muscle mTORC1 suppression by IL-6 during cancer cachexia: A role for AMPK. Am J
Physiol Endocrinol Metab.
White, J. P., Puppa, M. J., Sato, S., Gao, S., Price, R. L., Baynes, J. W., Kostek, M.
C., Matesic, L. E. and Carson, J. A. (2012b). IL-6 regulation on skeletal muscle
mitochondrial remodeling during cancer cachexia in the ApcMin/+ mouse. Skelet Muscle
2, 14.
White, J. P., Reecy, J. M., Washington, T. A., Sato, S., Le, M. E., Davis, J. M.,
Wilson, L. B. and Carson, J. A. (2009). Overload-induced skeletal muscle extracellular
matrix remodelling and myofibre growth in mice lacking IL-6. Acta Physiologica 197,
321-332.
White, J. P., Sato, S., Puppa, M., Baynes, J. W., Kostek, M. C., Matesic, L. E. and
Carson, J. A. (2012c). IL-6 Regulation of Muscle Mitochondrial Biogenesis and
Fission/Fusion Dynamics During the Progression of Cacner Cachexia. Skelet Muscle In
Press.
Widegren, U., Jiang, X. J., Krook, A., Chibalin, A. V., Björnholm, M., Tally, M.,
Roth, R. A., Henriksson, J., Wallberg-henriksson, H. and Zierath, J. R. (1998).
Divergent effects of exercise on metabolic and mitogenic signaling pathways in human
skeletal muscle. The FASEB Journal 12, 1379-1389.
Wu, Z., Puigserver, P., Andersson, U., Zhang, C., Adelmant, G., Mootha, V., Troy,
A., Cinti, S., Lowell, B., Scarpulla, R. C. et al. (1999). Mechanisms controlling
mitochondrial biogenesis and respiration through the thermogenic coactivator PGC-1.
Cell 98, 115-24.

210
Wu, Z., Woodring, P. J., Bhakta, K. S., Tamura, K., Wen, F., Feramisco, J. R.,
Karin, M., Wang, J. Y. and Puri, P. L. (2000). p38 and extracellular signal-regulated
kinases regulate the myogenic program at multiple steps. Molecular and cellular biology
20, 3951-3964.
Yaffe, M. P. (1999). The machinery of mitochondrial inheritance and behavior. Science
283, 1493-7.
Yoshida, K., Taga, T., Saito, M., Suematsu, S., Kumanogoh, A., Tanaka, T.,
Fujiwara, H., Hirata, M., Yamagami, T., Nakahata, T. et al. (1996). Targeted
disruption of gp130, a common signal transducer for the interleukin 6 family of
cytokines, leads to myocardial and hematological disorders. Proc Natl Acad Sci U S A 93,
407-11.
Zhang, G., Jin, B. and Li, Y. P. (2011). C/EBPbeta mediates tumour-induced ubiquitin
ligase atrogin1/MAFbx upregulation and muscle wasting. EMBO J 30, 4323-35.
Zhang, G. and Li, Y. P. (2012). p38beta MAPK upregulates atrogin1/MAFbx by
specific phosphorylation of C/EBPbeta. Skelet Muscle 2, 20.
Zhang, G., Lin, R. K., Kwon, Y. T. and Li, Y. P. (2013). Signaling mechanism of
tumor cell-induced up-regulation of E3 ubiquitin ligase UBR2. FASEB J 27, 2893-901.
Zhang, P., Chen, X. and Fan, M. (2007). Signaling mechanisms involved in disuse
muscle atrophy. Med Hypotheses 69, 310-21.
Zhao, L., Hart, S., Cheng, J., Melenhorst, J. J., Bierie, B., Ernst, M., Stewart, C.,
Schaper, F., Heinrich, P. C., Ullrich, A. et al. (2004). Mammary gland remodeling
depends on gp130 signaling through Stat3 and MAPK. J Biol Chem 279, 44093-100.
Zinna, E. M. and Yarasheski, K. E. (2003). Exercise treatment to counteract protein
wasting of chronic diseases. Curr Opin Clin Nutr Metab Care 6, 87-93.
Zinzalla, V., Stracka, D., Oppliger, W. and Hall, M. N. (2011). Activation of
mTORC2 by association with the ribosome. Cell 144, 757-68.
Zong, H., Ren, J. M., Young, L. H., Pypaert, M., Mu, J., Birnbaum, M. J. and
Shulman, G. I. (2002). AMP kinase is required for mitochondrial biogenesis in skeletal
muscle in response to chronic energy deprivation. Proc Natl Acad Sci U S A 99, 15983-7.

211
APPENDIX A
SUPPLEMENTAL DATA

212
COXIV
Cyto C
PGC-1α
PGC-1α
Cyto C
TFAM
NDUFS
FIS1
FIS1
MFN1
MFN1
COXIV
LLC LLC+PDTC LLC+IL-6rAb
LLC skm-gp130 skm-gp130 LLCBL-6
A)
B)
Figure A.1. Effect of inflammation inhibition on the regulation
of muscle oxidative capacity in LLC-induced cachexia. Western
blot analysis of mitochondrial content and dynamics markers in LLC
mice treated with A) acute IL-6r Ab or PDTC for one week after
tumor development, and B) in mice lacking skeletal muscle gp130.

213
Figure A-2.
*
Figure A.2. Effect of skm-gp130 inhibition on mitochondrial
content in LLC-induced cachexia. Skeletal muscle mitochondrial
content was measured as the ratio of mitochondrial DNA to genomic
DNA. Two-way ANOVA was run to determine the effects of LLC x
skm-gp130. Pre-planned t-test was used to determine the effects of
LLC in BL/6 mice. * significant from BL/6 control, P<0.05.
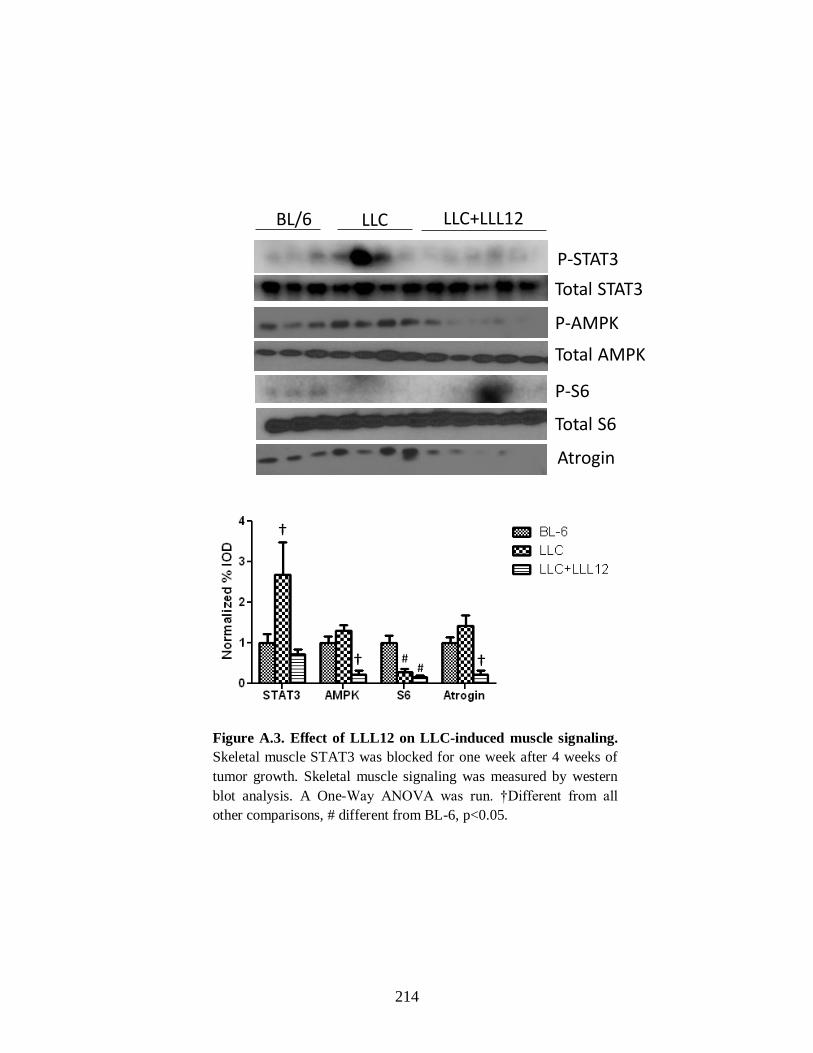
214
Atrogin
P-AMPK
BL/6 LLC LLC+LLL12
P-STAT3
P-S6
Total S6
Total STAT3
Total AMPK
†
† ## †
Figure A.3. Effect of LLL12 on LLC-induced muscle signaling.
Skeletal muscle STAT3 was blocked for one week after 4 weeks of
tumor growth. Skeletal muscle signaling was measured by western
blot analysis. A One-Way ANOVA was run. †Different from all
other comparisons, # different from BL-6, p<0.05.

215
A)
B)
Figure A.4. Effect of skm-gp130 inhibition on LoFS induced PGC-1α
and GLUT4 mRNA in LLC-induced cachexia. Skeletal muscle A)
PGC-1α and B) GLUT4 mRNA was measured in gastrocnemius of mice
3h post a novel bout of low frequency stimulated contraction. Repeated
measures two-way ANOVA was used to examine gp130 x LLC in control
and LoFS muscle. # signifies main effect of LoFS, p<0.05.

216
A)
B)
Figure A.5.

217
C)
Figure A.5. Effect of skm-gp130 inhibition on LoFS induced PGC-1α targets in
LLC-induced cachexia. Skeletal muscle A) TFAM B) cytochrome B and C) NRF-
1 mRNA was measured in gastrocnemius of mice 3h post a novel bout of low
frequency stimulated contraction. Repeated measures two-way ANOVA was used
to examine gp130 x LLC in control and LoFS muscle. # signifies main effect of
LoFS, & signifies main effect of skm-gp130, * different from BL/6 control, **
different from control leg within group, p<0.05.

218
APPENDIX B
DETAILED PROTOCOLS

219
RNA Isolation
1. Clean work area thoroughly with alcohol
2. Label 3 sets of sterile RNAase free 1.5mL eppendorf tubes
3. Homogenize samples in 1mL of Trizol on ice using the polytron
4. Transfer homogenate to a sterile 1.5mL tube
5. Let samples sit at RT for 5 minutes
6. Add 200ul of chloroform to each tube
7. Shake tubes (DO NOT VORTEX) for 15-30s (should be the color of pepto
bismal)
8. Let samples sit at RT for 2-3min
9. Spin samples at max speed for 15 minutes at 4°C
10. Clean gloves and pipette with RNAase AWAY
11. Transfer clear supernatant to new tube (Do NOT disturb the protein interface,
white layer)
12. Add 500ul of isopropanol and invert to mix
13. Incubate on ice for 20-30 minutes
14. Spin samples at max speed for 15 minutes at 4°C
15. Dump the supernatant being careful not to lose the pellet
16. Add 1mL 75% EtOH in DEPC to RNA pellet invert to break loose
17. Spin at 9500rpm for 5 min at 4°C
18. Dump supernatant and remove all liquid with pipette
19. Repeat steps 18-20 once or twice

220
20. Air dry tubes upside down in hood for 10-20 minutes
21. Add ~20ul of DEPC water to dissolve pellet (Keep track of the amount of
DEPC added)
22. Pipette to mix
23. Heat in dry bath at 60°C for 10 minutes
24. Pipette to mix
25. Read on spec(1-2ul RNA+800ul dH2O) in quartz cuvette/NANO DROP and
record 260/280/and 230 measurements
26. Calculate RNA concentration
RNA= (OD260*40*0.8)/ volume RNA added to cuvette
27. Do not use samples with 260/280 below 1.6

221
RNA Gel
1. Label a set of 200ul tubes
2. Prepare 100ml 1% agarose gel as follows:
a. Measure 1.0g Agarose
b. Add to 72 mL dH2O
c. Melt agarose in dH2O in microwave
d. Add 10mL of 10X MOPS
e. Allow to cool under hood
f. Add 18mL of 37% Formaldehyde
g. Pour gel
3. Prepare 1X MOPS for running buffer
4. Prepare sample buffer
Reagent ul/sample
10X MOPS 1.5
37% Formaldehyde 2.6
Formamide 7.5
EtBr 0.2
Total 11.8
5. Pull out 1ul of RNA and dilute with DEPC water to load total of 0.5 - 1ug of
RNA
6. Add sample buffer 11.8ul/sample + 3.2ul RNA
7. Heat samples at 65 for 15 minutes then quickly ice
8. Add 2ul of RNA loading dye to each tube
9. Centrifuge to collect sample to bottom
10. Load and run gel at 80V for ~1h

222
cDNA synthesis
1.) Prepare reverse transcriptase cocktail as follows and keep on ice:
Reagent ul/sample
DEPC 4.2
10X RT bx 2.0
dNTP mix 0.8
10X Random Primers 2.0
Reverse Transcriptase 1.0
Total 10.0
2.) In a cold block add 3ug of RNA in a 200ul PCR tube and volume to 10ul with
DEPC water
3.) Add 10ul of reverse transcriptase cocktail to each tube
4.) Put in thermocycler on Program #25
a. 25°C for 10 min
b. 42°C for 50 min
c. 70°C for 15 min
d. 4°C Hold
5.) Store all samples in -20°C

223
RT PCR
1. Dilute cDNA 1:10 and 1:100
2. Fill out plate template so samples are in duplicate
3. Prepare master mix solutions
Reagent ul/sample
Syber Green Mix 12.5
Forward Primer (20uM) 1.0
Reverse Primer (20uM) 1.0
Sterile dH2O 0.5
Total 15.0
4. Load 15ul of Master Mix solution
5. Load 10ul of cDNA to each well as per template and pipette to mix
6. Cover plate with plate cover sheet
7. Spin plate in centrifuge in environmental genomics core
8. Put plate RT machine (Dr. Davis Lab)
9. Add dissociation step and set volume to 25ul
10. Start analysis
11. Turn OFF machine when finished

224
PCR on thermocycler
1. Dilute cDNA 1:10 and 1:100
2. Prepare master mix solutions
3. Load 5ul of cDNA
4. Load 10ul Master Mix
5. Pipette to mix
6. Spin in centrifuge to collect all sample
7. Place in thermocycler on appropriate cycle setting
Reagent ul/sample
Go Taq 10
Forward Primer (20uM) 0.4
Reverse Primer (20uM) 0.4
Sterile dH2O 9.2
Total 20.0

225
DNA Gel (PCR Product)
1. Make 1X TAE for running buffer
2. Make 1% agarose gel as follows:
a. Use autoclave tape to tape sides of plastic mold
b. Test mold with water to ensure good seal and pour out water
c. Mix 1g agarose with 100mL 1xTAE in a 150mL flask
d. Microwave for 30s swirl
e. Repeat step d
f. Add 5ul of EtBr and swirl
g. Repeat step d
h. Allow Flask to cool to the touch
i. Pour gel into mold and insert comb
j. Allow to sit until solidified (approximately 20 min)
3. Prepare samples with loading buffer
a. Add 5ul of 6X loading buffer and 5ul of sample to a 200ul tube
b. Vortex and spin to collect sample
4. Load gel
5. Run at 80V for ~ 30min (Gel runs from Black to Red)
6. Use UV imager to take a picture of the gel
7. Save picture, log off computer, and turn off UV light

226
DNA Isolation
1. Homogenize sample in 1mL DNAzol on ice using glass on glass (or Teflon)
for ~5-10s
2. Centrifuge samples at room temperature 10G for 10 minutes
3. In a new sterile set of tubes transfer the supernatant, discard the pellet
4. Add 500ul of 95% EtOH to each sample and mix by gentle inversion (DO
NOT VORTEX or PIPETTE VIGEROUSLY)
5. Allow to sit at room temperature for at least 5 minutes (DNA will be a cloudy
precipitate).
6. Centrifuge samples at room temperature for 10 min at 4G
7. Discard the supernatant, be sure not to lose the pellet
8. Add 1mL of 75% EtOH to the tubes containing the DNA pellet, and mix by
gentle inversion.
9. Centrifuge for 5 min at 4G at room temp
10. Repeat steps 7-9
11. Air dry the samples after removing the supernatant
12. Re-suspend the DNA in 8mM NaOH and pipette gently to mix.
13. Read on spec(1-2ul DNA+1mL 8mM NaOH) in quartz cuvette/NANO DROP
and record 260/280/and 230 measurements
14. Calculate DNA concentration if used spec
DNA= (OD260*50*1)/ volume DNA added to cuvette
15. Store in -20°C

227
Primer Dilution
1. Find the nMol concentration from the tube, it should be in the range of ~33 nMol.
2. Add TE bx to the tube by a factor of 10. (Ex for a 33.20 nMol primer as 330ul of
TE bx.) This will result in the primer concentration to be 100uM.
3. Dilute primers to working concentration of 20uM. Do this by combining 20 ul of
the 100uM primer with 80 ul of dH20. This is a 1:5 dilution giving you the
working 20uM stock.
4. Place the 100uM primer in the appropriate box, most likely Mouse Primers and
put the 20uM stock solution in the clear plastic box named 20uM working
primers.
TE bx reagents
300ml solution
1ml Tris HCl 1M
200ul EDTA 0.5M
98.8ul dH20
pH to 8.0

228
Protein Isolation
1. Make Mueller and Diluent buffer
2. Weigh out the samples to be used and place weighted portion into an ependorf
tube labeled with the sample and M.
3. Add 10ul/mg tissue of Mueller buffer to the homogenization tube and add sample.
4. Homogenize in glass on glass tissue homogenizer keeping the sample in ice while
homogenizing. (homogenize ~30s check sample repeat if needed)
5. Transfer solution back to ependorf tube
6. Spin samples at 13,000rpm for 10min at 4°C
7. Transfer supernatant to clean ependorf tube labeled with sample and D, discard
the pellet
8. Add 5ul/mg tissue of Diluent buffer to the D tube and vortex
9. Run protein assay
10. Dilute samples down to a working concentration in a new tube labeled with the
sample and the working concentration. Keep the D tube.
Muller Buffer Stock
concentration
Desired
concentration
Volume of stock
needed(ul)
Hepes 500mM 50mM 600
Triton-X 100% 0.10% 6
EGTA (pH 8.0) 500mM 4mM 48
EDTA (pH 8.0) 500mM 10mM 120
Na4P2O7 100mM 15mM 900
β-glycerophosphate 2M 100mM 300
NaF 500mM 25mM 300
NaVO4 1M 5mM 30
dH2O - - 3585
Protease Inhibitor - - 60

229
Diluent Buffer Stock
concentration
Desired
concentration
Volume of stock
needed(ul)
glycerol 100% 50% 1500
Na4P2O7 100mM 50mM 1500
EGTA (pH 8.0) 500mM 2.5mM 15
β-mercaptoethanol 500mM 1mM 6
Protease Inhibitor - - 30

230
Protein Assay (Bradford Assay)
1. Make a stock of 1mg/ml BSA in PBS
2. In a clear flat bottom 96 well plate create a standard curve with the 1ug/ul BSA
solution from 0-14ug in duplicate or triplicate
3. Dilute samples 1:5 in a new tube with water (5ul sample: 20ul dH20)
4. Add 5ul of the diluted samples to the wells of the plate being sure to run them in
duplicate or triplicate
5. Make a 1:5 dilution of Bradford reagent. You will need enough for 300ul/well Be
sure to clean the glassware well before you use it with soap and water.
6. Add 300ul of diluted Bradford reagent to each well.
7. Let sit in dark drawer for 15 minutes
8. Read in plate reader at 595nm
9. Calculate protein concentration based on standard curve
a. Create curve being sure to subtract out the zero value from both curve and
samples.
b. Calculate protein concentration using y=mx+b equation
(sample=con*slope+intercept -> con=(sample-intercept)/slope)
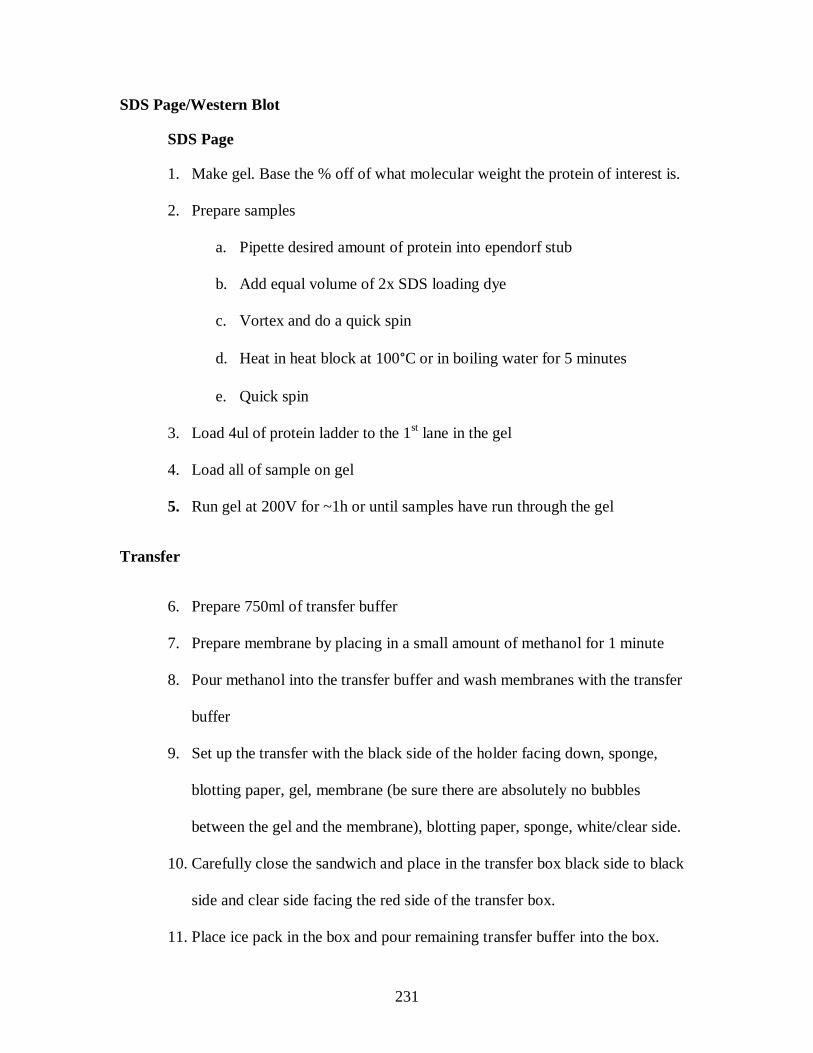
231
SDS Page/Western Blot
SDS Page
1. Make gel. Base the % off of what molecular weight the protein of interest is.
2. Prepare samples
a. Pipette desired amount of protein into ependorf stub
b. Add equal volume of 2x SDS loading dye
c. Vortex and do a quick spin
d. Heat in heat block at 100°C or in boiling water for 5 minutes
e. Quick spin
3. Load 4ul of protein ladder to the 1st lane in the gel
4. Load all of sample on gel
5. Run gel at 200V for ~1h or until samples have run through the gel
Transfer
6. Prepare 750ml of transfer buffer
7. Prepare membrane by placing in a small amount of methanol for 1 minute
8. Pour methanol into the transfer buffer and wash membranes with the transfer
buffer
9. Set up the transfer with the black side of the holder facing down, sponge,
blotting paper, gel, membrane (be sure there are absolutely no bubbles
between the gel and the membrane), blotting paper, sponge, white/clear side.
10. Carefully close the sandwich and place in the transfer box black side to black
side and clear side facing the red side of the transfer box.
11. Place ice pack in the box and pour remaining transfer buffer into the box.

232
12. Transfer either overnight at 70mA or for 200min at 200mA making sure to
pack well with ice.
Probing
13. Prepare 5% milk in TBST solution
14. Remove membrane from transfer and place in ponceau solution for 3-5
minutes
15. Rinse off excess ponceau with dH2O and place membrane in plastic sheet and
scan into computer
16. Wash off ponceau with 1XTBST
17. Block the membrane for 1h in 5% TBST milk solution (made in step 13)
18. Incubate in primary antibody in milk solution
19. Wash membranes 3x with 1xTBST for 5 minutes each
20. Incubate in secondary antibody in milk solution for 1 hour
21. Wash membranes 3x with 1xTBST for 5 minutes each
22. Develop with ECL or ECL quantum

233
Protocol for IHC (vibratome sections) Puromycin
1. Mount sections in acrylamide block and wait 30-60 minutes for block to set
2. Cut sections at 150um-300um thick sections
3. Wash 3x in PBS/0.01M Glycine/0.1% triton-X, 30 min each wash
4. Block in 5% BSA/PBS for 1h
5. Block in 5% Normal Goat Serum in 1%BSA/PBS for 1h
6. Block in FAB (1:100) in 1% BSA/PBS for 1h
7. Incubate in Primary antibody (1:100) ON @ 4°C
8. Wash samples 2x with 1%BSA/PBS, 15 min each wash
9. Block samples in 5% Normal Goat Serum in 1%BSA/PBS for 1h
***From this point forward keep samples covered with foil***
10. Incubate samples with Secondary antibody Cy3_Alexa 488 IgG2a (1:100) in 1%
BSA/PBS for 1h @37°C
11. Wash 2x with 1%BSA/PBS, 15 min each wash
12. Wash 1x in 1xPBS for 15 min
13. Incubate for 15 minutes in DAPI in PBS (1:5000)
14. Wash 2x in 1xPBS for 15 min each
15. Mount with Dabco
a. Using glass shards place a shard on either side of the sample
b. Add ~80ul of Dabco on top of the sample
c. Very slowly add the cover slip making sure that there are NO BUBBLES
and the Dabco goes all the way to the edges
d. Seal coverslip with nail polish (be liberal to get very good seal)
e. Store in a sealed container (keep in the dark) @ 4°C

234
Protocol for SDH Staining
1. Prepare stock solutions
a. Succinic dehydrogenase solution
0.59 g Succinic acid
10 ml dH2O
Adjust pH to 7.0 (use low heat to get into solution if necessary
b. NBT (must be made fresh each time)
2. Using slides cut at 10µm, remove slides from -80°C freezer and air dry for 10
minutes (make up the incubation solution during this time)
a. Incubation solution
3. Place slides on a tray and incubate slides in incubation solution at 37°C for 45
minutes
4. Wash slides in running tap water for 3 minutes (do not let the water hit
directly on the samples on the slide
5. Dehydrate slides in 50% EtOH for 2 minutes
6. Mount with mounting media and dry
7. Take pictures of slides once media is dry (Next day)
8. Count SDH positive fibers (dark stained) as any that are 2x above the standard
deviation of the background
10 mg Nitroblue tetrazolium (NBT)
2.5 ml dH2O
2.5 ml Nitroblue tetrazolium (NBT)
3.5 ml dH2O
2.5 ml Tris buffer (0.2M, pH 7.4)
0.5 ml MgCl2 (0.1M)
1.0 ml Succinic dehydrogenase solution

235
Protocol for IHC (vibratome sections) Myosin Heavy Chain 2A
1. Wash 3x in PBS/0.01M Glycine/0.1% triton-X, 30 min each wash
2. Block in 5% BSA/PBS for 1h
3. Block in 5% Normal Horse Serum in 1%BSA/PBS for 1h
4. Incubate in Primary antibody (1:5) ON @ 4°C
5. Wash samples 2x with 1%BSA/PBS, 15 min each wash
6. Block samples in 5% Normal Goat Serum in 1%BSA/PBS for 1h
***From this point forward keep samples covered with foil***
7. Incubate samples with Secondary antibody Cy3 IgG (1:100) in 1% BSA/PBS for
1h @37°C
8. Wash 2x with 1%BSA/PBS, 15 min each wash
9. Wash 1x in 1xPBS for 15 min
10. Incubate for 15 minutes in DAPI in PBS (1:5000)
11. Wash 2x in 1xPBS for 15 min each
12. Mount with Dabco
a. Using glass shards place a shard on either side of the sample
b. Add ~80ul of Dabco on top of the sample
c. Very slowly add the cover slip making sure that there are NO BUBBLES
and the Dabco goes all the way to the edges
d. Seal coverslip with nail polish (be liberal to get very good seal)
e. Store in a sealed container (keep in the dark) @ 4°C

236
Mouse Tailing/Genotyping
Print out a Genotyping log sheet
Materials needed:
Genotyping sheet. cages, food, water, cage lids, cage cards/card holders, ear puncher,
scissors, 1.5ml ependorf tubes, 15ml falcon tube, PCR tubes, Pipettes (p1000, p100, p20),
pipette tips, primers, master mix, nuclease free water, thermocycler.
1. Turn on a water bath to approximately 55 ºC with 1-2 inch of water in the bottom
2. Wean pups- once mice are 4-5 weeks of age wean the pups by separating the
male and the females into new cages (limit 5 mice/ cage).
3. On the genotyping sheet fill out the date of birth and the cross that the pups came
from. Also write out animal numbers for the mice.
4. Punch the ear of the mouse and write down the ear and mouse number on both
the genotyping sheet and the cage card.
5. Once the ear is punched, pinch the tip of the tail and snip just above your finger
nails (do not take more than 2-4mm) and put into an ependorf tube labeled with
the animal number (not the ear punch).
6. Once this is complete for all of the animals make up the tail digest buffer. In a
large (15ml) falcon tube add 200ul of tail buffer/ sample
and 5ul of proteinase K/ sample. Mix by inversion.
7. Add 200ul of tail digest buffer to each ependorf tube containing the tail and place
in a blue tube rack.
8. Place tube rack in the water bath over night (be sure the water covers the bottom
of the tubes)

237
9. Turn Dri-bath to 95ºC
10. Label PCR tubes
11. Once bath is at 95 place ependorf tubes with tail digest into heat block for 10
minutes.
12. Set up PCR reaction.
gp130 Flox Amount/sample
Master Mix (Go Taq) 12.5ul
Forward Primer-
ACGTCACAGAGCTGAGTGATGCAC
0.5ul
Reverse Primer-GGCTTTTCCTCTGGTTCTTG 0.5ul
dH2O 10.5ul
Tail digest (DNA) 1ul
Load 24ul of the PCR reaction and 1ul of DNA
95°C-5 min
95°C-3 min
65°C-1 min
5X 72°C-30s
95°C-30s
35X 95°C-30s
60°C-1 min
72°C-30s
72°C- 10 min
4°C hold

238
Cre reaction: To determine mlc cre heterozygosity two seperate pcr reactions must be
run.
mlc Cre F+R Amount/sample
Master Mix (Go Taq) 12.5ul
Forward Primer-
AAGCCCTGACCCTTTAGATTCCATTT
0.5ul
Reverse Primer-
AAAACGCCTGGCGATCCCTGAAC
0.5ul
dH2O 10.5ul
Tail digest (DNA) 1ul
For each of the two reactions add 24 ul of PCR reaction and 1ul of tail digest (DNA)
94°C-2 min
94°C-1 min
35X 56°C-1 min
72°C-1 min
72°C- 1 min
4°C hold
mlc cre F+WT Amount/sample
Master Mix (Go Taq) 12.5ul
Forward Primer-
AAGCCCTGACCCTTTAGATTCCATT
0.5ul
WT Primer-
GCGGGCTTCTTCACGTCTTTCTTT
0.5ul
dH2O 10.5ul
Tail digest (DNA) 1ul
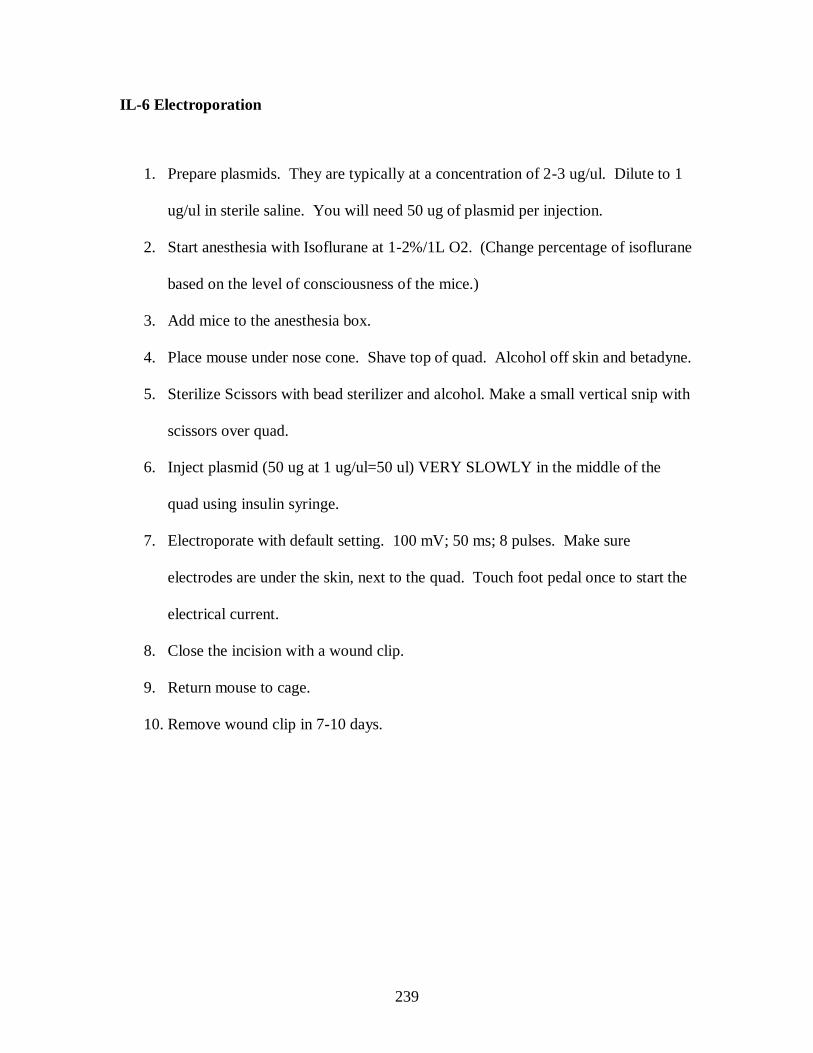
239
IL-6 Electroporation
1. Prepare plasmids. They are typically at a concentration of 2-3 ug/ul. Dilute to 1
ug/ul in sterile saline. You will need 50 ug of plasmid per injection.
2. Start anesthesia with Isoflurane at 1-2%/1L O2. (Change percentage of isoflurane
based on the level of consciousness of the mice.)
3. Add mice to the anesthesia box.
4. Place mouse under nose cone. Shave top of quad. Alcohol off skin and betadyne.
5. Sterilize Scissors with bead sterilizer and alcohol. Make a small vertical snip with
scissors over quad.
6. Inject plasmid (50 ug at 1 ug/ul=50 ul) VERY SLOWLY in the middle of the
quad using insulin syringe.
7. Electroporate with default setting. 100 mV; 50 ms; 8 pulses. Make sure
electrodes are under the skin, next to the quad. Touch foot pedal once to start the
electrical current.
8. Close the incision with a wound clip.
9. Return mouse to cage.
10. Remove wound clip in 7-10 days.

240
Rotorod Protocol:
1. Make sure that the rotorod is plugged into the computer. Turn on computer then
turn on the rotorod
2. Open Rotomex program. Go to Experiment then Run then check that the
program is correct
3. Program:
Start Speed: 1rpm
End Speed: 25rpm
Acceleration: 0.5rpm/ 2 sec
Duration: 180sec
Keep delay set at 2 sec.
4. Record what mouse is in each lane
5. Click Start Experiment on computer
6. On rotorod push button for each lane that has a mouse in it then hit Enter on the
rotorod and the rotorod will start
7. Record Total Time and Max speed from the computer on the log for each mouse
8. Move mouse to a new lane and run the trial again do this for a total of 3 trials
9. Clean rotorod with sponge or paper towel and turn off computer and rotorod

241
Grip Strength Protocol:
1. Weigh mice to get current body weight
2. Plug in and turn on meter
3. Zero out the meter
4. Place mouse on the top of the bars and gently pull down at a constant velocity
5. Record measure and move to the next mouse
6. Once through the mice in a cage (4-5 mice) go back through the mice in the same
order
7. Repeat this for a total of 2 runs of 5 trials each
8. Turn off meter
9. Clean up any mess
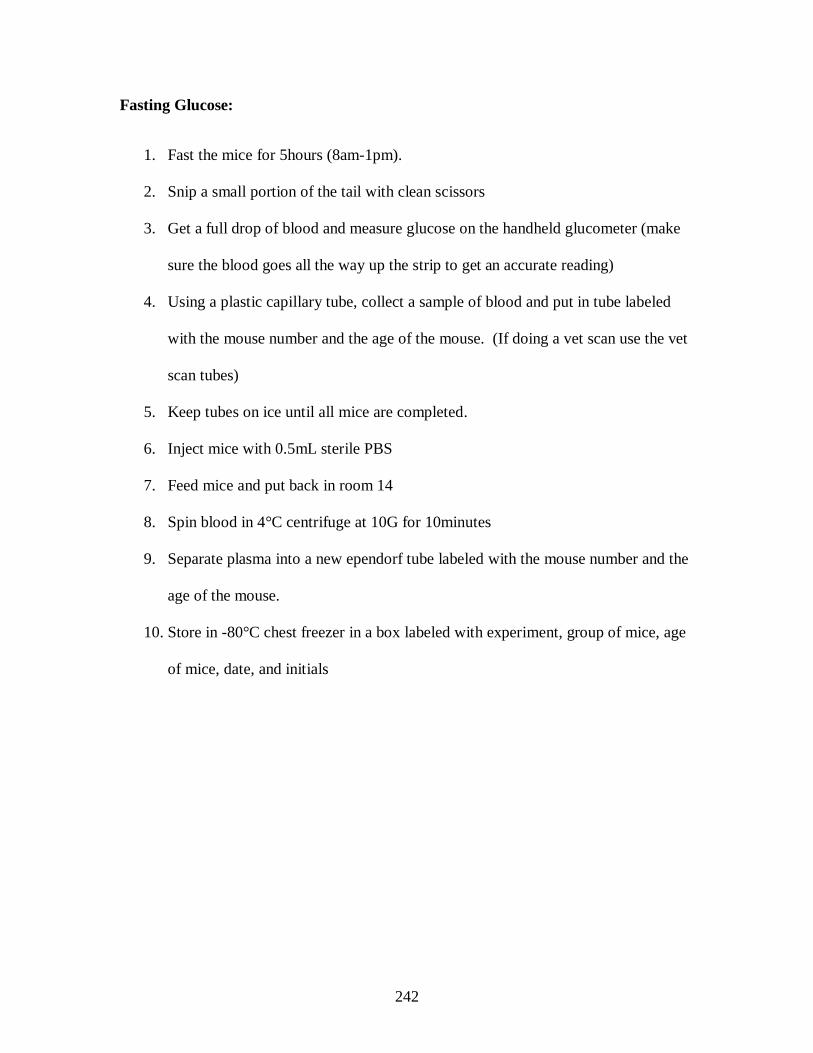
242
Fasting Glucose:
1. Fast the mice for 5hours (8am-1pm).
2. Snip a small portion of the tail with clean scissors
3. Get a full drop of blood and measure glucose on the handheld glucometer (make
sure the blood goes all the way up the strip to get an accurate reading)
4. Using a plastic capillary tube, collect a sample of blood and put in tube labeled
with the mouse number and the age of the mouse. (If doing a vet scan use the vet
scan tubes)
5. Keep tubes on ice until all mice are completed.
6. Inject mice with 0.5mL sterile PBS
7. Feed mice and put back in room 14
8. Spin blood in 4°C centrifuge at 10G for 10minutes
9. Separate plasma into a new ependorf tube labeled with the mouse number and the
age of the mouse.
10. Store in -80°C chest freezer in a box labeled with experiment, group of mice, age
of mice, date, and initials

243
Glucose gavage:
1. Fast the mice for 5hours (8am-1pm)
2. Make a fresh tube of 20% glucose (2g D+ Glucose volume up in sterile water and
filtered with 2um syringe)
3. Snip a small portion of the tail with clean scissors
4. Get a full drop of blood and measure glucose on the handheld glucometer (make
sure the blood goes all the way up the strip to get an accurate reading)
5. Using a plastic capillary tube, collect a sample of blood and put in tube labeled
with the mouse number and the age of the mouse. (If doing a vet scan use the vet
scan tubes)
6. Place a small amount of isofluorane into a bell jar on a paper towel
7. Put mouse in bell jar until just is knocked out (too long will kill the mouse)
8. Using a gavage needle gavage the mouse with 2g/kg of glucose (made is step 2)
9. Wait 30 minutes
10. Wipe of tip of tail and repeat step 4-5
11. Inject mouse with 0.5ml of sterile PBS.
12. Feed mice and put back in room 14.
13. Spin blood in 4°C centrifuge at 10G for 10minutes
14. Separate plasma into a new ependorf tube labeled with the mouse number and the
age of the mouse.
15. Store in -80°C chest freezer in a box labeled with experiment, group of mice, age
of mice, date, and initials

244
DEXA protocol:
1. Plug in the DEXA machine and connect to the computer
2. Turn on the DEXA and then turn on the computer
3. Open PIXIMUS software
4. Calibrate the DEXA machine
a. Place the phantom mouse on the scanner
b. Press F6 for quality control
c. Press F3 and then click ok (this will run the quality control)
d. Exit the room and wait until the scan is completed
5. Anesthetize mice in the isoflurane chamber for several minutes on ~2.5%
isoflurane/L O2/min
6. Set up nose cone so that it is on the edge of the scanning platform
7. Place mouse belly down with the four limbs spread out and the nose in the nose
cone, be sure to keep the mouse within the designated area
8. Select “analyze new subject” or press F3
9. Enter in the subject ID and the body weight and press ok
10. Press F3 to start the scan
11. Exit the room and wait until the scan is complete (a colored outline will appear on
the computer screen when the scan is complete.
12. To adjust the region of interest press the F3 key twice
13. Use the arrow keys to adjust the green circle (the area excluded from the
results)
14. Press enter

245
15. Record your data in your lab notebook
16. Press F8 twice to go back to the main menu for the next scan
*Calibration only needs to be done prior to the first mouse measurement

246
Run to Fatigue:
1. Acclimate mice to the treadmill by placing mice in the lanes 10-15 minutes prior
to the start of the warm-up
2. Run the warm-up protocol
5min at 5m/min, 5min at 10m/min, 5min at 15m/min
3. Start the fatigue test running mice at 20m/min
4. After 30 minutes increase the speed to 25m/min
5. Use gentle hand prodding to keep mice running
6. Fatigue will be defined as the time at which mice are no longer able or willing to
keep up with the treadmill despite gentle hand prodding for a period of 1min.
7. Clean the treadmill and the area around it with a sponge or paper towels. Sweep
the floor around the treadmills. There should be no feces on the treadmill, the
treadmill cart, or the floor when you leave.

247
APPENDIX C
DOCTORAL DISSERTATION PROPOSAL
The regulation of skeletal muscle mass and mitochondrial biogenesis by gp130/STAT
signaling during cancer cachexia
by
Melissa J Puppa
March 31, 2013

248
C.1 Specific Aims
Cancer cachexia accounts for approximately 20% of all cancer related deaths and
about 40% of deaths related to colon cancer (Bruera, 1997; Tisdale, 2002). Cachexia is
defined as the unintentional loss of body weight with an underlying disease present
(Evans et al., 2008; Fearon et al., 2011; Muscaritoli et al., 2010). While cachexia consists
of the loss of both skeletal muscle and adipose tissue, maintenance of skeletal muscle
mass has proven to be of importance. A potential mediator of skeletal muscle mass
during cachexia is the inflammatory cytokine interleukin 6 (IL-6). Inflammation is a
prominent feature during the promotion and progression of colon cancer cachexia, and
high IL-6 levels are correlated with cachexia in late stage cancer patients (Iwase et al.,
2004). Over-expression of IL-6 in tumor bearing mice can decrease skeletal muscle mass
in a dose dependent manner (White et al., 2012a). Inhibition of IL-6 signaling via an IL-6
receptor antibody or by knocking out IL-6 attenuates skeletal muscle wasting in the
ApcMin/+
mouse model of cachexia; however it is unclear whether these actions are from
the systemic inhibition of IL-6 signaling or whether they are dependent on the local
inhibition of IL-6 signaling in the muscle itself (Baltgalvis et al., 2008b; White et al.,
2011b).
IL-6 is a pleotropic cytokine secreted from many different tissues including
skeletal muscle. IL-6 has both pro-inflammatory and anti-inflammatory properties as well
as the ability to activate target genes for cell proliferation, differentiation, and apoptosis
(Heinrich et al., 2003). During cachexia, IL-6 may act on the tumors, stimulating growth
and differentiation, or IL-6 may act directly on peripheral tissues, such as skeletal muscle,
that are atrophying. The initiation and progression of cachexia in both of these models is

249
directly related to tumor burden and circulating IL-6 levels (Baltgalvis et al., 2008b;
White et al., 2011b). IL-6 signals through the glycoprotein 130 (gp130/CD130) receptor
to activate downstream signaling. This occurs by binding with the membrane IL-6
receptor and forming a complex with the gp130 receptor to activate downstream
signaling including the JAK/STAT, RAS/ERK, and MAPK pathways during classical
signaling (Ernst and Jenkins, 2004). Alternatively it can bind the soluble IL-6 receptor
and interact with the membrane bound gp130 receptor which is called trans signaling.
Trans signaling can activate downstream signaling in tissues that do not express the IL-6
receptor, or express IL-6 receptor in very low levels such as the kidney (Nechemia-
Arbely et al., 2008), as well as enhance the actions of IL-6 on tissues that express the IL-
6 receptor. Bonetto et. al. showed that muscle STAT3 signaling, a downstream mediator
of inflammatory and IL-6-gp130 signaling, is sufficient for inflammation and cancer-
induced muscle wasting in some tumor bearing mice (Bonetto et al., 2012; Bonetto et al.,
2011). STAT3 inhibition can attenuate muscle loss suggesting that the JAK/STAT
pathway is an important downstream effector of IL-6-gp130 signaling in skeletal muscle
during cachexia (8). The role of classical and trans IL-6 signaling and whether IL-6 is
acting through local or systemic STAT3 activation during cancer cachexia remains
uninvestigated.
Mitochondrial biogenesis and function, is associated with a muscle’s metabolic
capacity and substrate utilization flexibility (Chomentowski et al.). Muscle mitochondrial
function is related to muscle apoptosis, autophagy, and protein turnover thus mediating
skeletal muscle mass (Romanello and Sandri, 2010). We have shown that when IL-6 is
administered to C2C12 myotubes mitochondrial content decreases and, mitochondrial

250
fission increases (White et al., 2012c). There is also an IL-6 induced decrease in myotube
diameter (White et al., 2012c). Mitochondria are dysregulated in the skeletal muscle of
rodents with cancer cachexia (White et al., 2011a; White et al., 2012c). Many studies
have shown that the dysregulation of muscle mitochondrial signaling including decreased
mitochondrial biogenesis, altered dynamics, and decreased function can lead to muscle
loss (Romanello et al., 2010). These results have been extended to the cachexia field by
our experiments in the ApcMin/+
mouse which show a loss of mitochondrial content with
the progression of cachexia and IL-6 overexpression (White et al., 2011a; White et al.,
2012c). We have shown that systemic inhibition of IL-6 signaling after the initiation of
cachexia can attenuate mitochondrial dysfunction in the ApcMin/+
mouse (White et al.,
2012c). Exercise training, which is known to increase mitochondrial plasticity, can
prevent mitochondrial dysfunction even in the presence of increased circulating IL-6
(Puppa et al., 2011d). While IL-6 signaling appears to be a regulator of mitochondrial
function during cachexia, it is unclear whether these actions involve direct signaling in
the muscle through the gp130 or if IL-6 action on alternative tissues leads to
dysregulation of skeletal muscle mitochondria.
Inhibition of either STAT3 or IL-6 attenuates muscle loss with cancer (Baltgalvis
et al., 2008b; Bonetto et al., 2012; Bonetto et al., 2011; White et al., 2011b; White et al.,
2012c). While there is evidence showing that IL-6 inhibition preserves skeletal muscle
quality related to mitochondrial biogenesis and function, it is unclear if these actions are
from local inhibition at the level of the skeletal muscle or if systemic inhibition of IL-6
signaling is important for the protection of muscle quality. While STAT3 inhibition
preserves skeletal muscle mass during cancer cachexia, STAT3 regulation of muscle
251
mitochondrial plasticity during cancer cachexia remains to be established. The overall
goal of this proposal is to determine the regulation of skeletal muscle mass and
mitochondrial biogenesis by IL-6 signaling and muscle contraction during cancer
cachexia. Our central hypothesis is that IL-6 signaling through gp130 and STAT3 will
suppress muscle mass and mitochondrial biogenesis during cachexia, and gp130/STAT3
inhibition will attenuate muscle mass loss and increase mitochondrial plasticity resulting
in an enhanced response to contraction.
Specific Aim #1 will determine if attenuation of systemic trans IL-6
signaling/STAT3 or local IL-6 signaling through gp130 can prevent mitochondrial
loss and altered mitochondrial dynamics during cancer cachexia.
Rational: We have previously shown that systemic inhibition of IL-6 signaling in
the ApcMin/+
mouse can repress increases in mitochondrial fission and attenuate the loss of
mitochondrial content (White et al., 2012c). We have also shown that inhibition of IL-6
signaling decreases protein degradation, but does not appear to have a potent affect on
protein synthesis (White et al., 2011b). Thus we would like to investigate if the actions of
IL-6 inhibition are due to attenuation of systemic trans IL-6 signaling.
Hypothesis #1: The inhibition of systemic IL-6 trans signaling/STAT3 in Min mice will
increase mitochondrial fusion and decrease fission and prevent the loss of oxidative
capacity.

252
Hypothesis #2: The inhibition of skeletal muscle gp130 signaling Min mice will attenuate
the loss of skeletal mitochondrial oxidative capacity and inhibited mitochondrial
biogenesis.
Hypothesis #3: The inhibition of IL-6 trans signaling will attenuate the induction of
muscle protein degradation, but will have no effect on skeletal muscle protein synthesis.
Specific Aim #2 will determine if IL-6 signaling through muscle gp130 receptor/
STAT3 regulates the disruption of muscle mass in the cachectic muscle.
Rational: We have previously shown the induction of skeletal muscle protein
degradation and suppression of protein synthesis during IL-6 induced cachexia (White et
al., 2011b; White et al., 2013b). Additionally, STAT3, a downstream mediator of IL-
6/gp130 signaling, can attenuate skeletal muscle wasting in cancer-induced cachexia
(Bonetto et al., 2012; Bonetto et al., 2011); however the actions of local IL-6 signaling
and the role of systemic STAT3 signaling on muscle mass regulation during cachexia is
unknown. IL-6 and STAT3 clearly regulate muscle mass during cachexia, but it is
unclear whether these actions are from systemic activation or local activation of the
gp130/STAT3 pathway.
Hypothesis #1: The loss of skeletal muscle gp130 receptor signaling will prevent
cachexia-induced decreases in skeletal muscle protein synthesis attenuated increases in
protein degradation during cancer cachexia.
Hypothesis #2: The inhibition of systemic STAT3 signaling will suppress cachexia-
induced decreases in skeletal muscle protein synthesis attenuated increases in protein
degradation.

253
Hypothesis #3: The loss of STAT3 signaling will attenuate increased protein degradation,
but not alter protein synthesis during cancer cachexia.
Specific Aim #3 will determine if the transcription and translation of proteins
regulating mitochondrial biogenesis are altered with acute contraction during
cachexia.
Rational: We have previously shown that exercise training prior to the initiation
of cachexia attenuates the loss of skeletal muscle mitochondrial content in the ApcMin/+
mouse (Puppa et al., 2011d). Our preliminary data suggests that cachectic muscle has the
capacity to up-regulate nuclear encoded mitochondrial gene (NUGEMPs) transcription
after a novel bout of contraction, but this increase in transcription is not associated with
an increase in translation of the proteins. It is unclear if cachectic skeletal muscle has
altered mitochondrial plasticity in response to an acute contraction bout. Understanding
the ability of cachectic muscle to respond to contraction will have therapeutic value for
the treatment of cachectic patients.
Hypothesis #1: The translational response of NUGEMPs and mitochondrial proteins to an
acute endurance-like contraction bout will be blunted in cachectic mice, while the
transcriptional response of NUGEMPSs and mitochondrial genes will remain unaltered.
Hypothesis #2: Inhibition of systemic inflammation will alleviate the suppression of
NUGEMP translation after an acute contraction bout.

254
C.2 Limitations and Pitfalls
1) The use of a soluble gp130 fusion protein allows for the examination of inhibition of
IL-6 trans signaling; however, there are currently no muscle specific knockouts of the
membrane bound IL-6 receptor to determine the effects of classical IL-6 signaling
during cancer cachexia.
2) The use of the gp130 fusion protein inhibits global trans signaling. Results from these
experiments must be interpreted as such since IL-6 signaling will be repressed in
multiple tissue types which could have effects on skeletal muscle mitochondrial
biogenesis and dynamics.
3) A muscle specific IL-6 receptor knockout mouse has not yet been developed, so we
chose to develop a muscle specific gp130 knockout mouse. Many cytokines act
through the gp130, several which are elevated during cancer cachexia including IL-6,
leukemia inhibitory factor (LIF), and ciliary neurotrophic factor (CNTF). The
inhibition of all IL-6 family of cytokines must be taken into consideration when
interpreting the results from these experiments.
4) The use of the compound PDTC has been shown to decrease the production of IL-6
as well as inhibit STAT3 activation and NFκB activation. While we are less interested
in the inhibition of NFκB it must be considered when interpreting the results.
5) STAT3 signaling will be globally inhibited by PDTC administration. Further
experiments would be needed to examine the direct role of STAT3 on skeletal muscle
mitochondrial biogenesis and dynamics.
255
6) Only one time point will be used to examine the acute effects of contraction on
skeletal muscle mitochondrial plasticity. Further experiments would be needed to
determine if a delayed response is present.
7) It is unknown if mice with a skeletal muscle deletion of gp130 will respond to acute
contraction normally. Experiments using IL-6KO mice have shown a differential
response to contraction compared to wild type animals. While an altered response in
the wild type mice would prove interesting they would have to be taken into
consideration since the aim of the study is to determine if there are improvements
with cancer cachexia.
8) Only the effects of the treatments on mitochondrial biogenesis and dynamics will be
assessed. Conclusions pertaining to mitochondrial function can only be made related
to these variables although it is likely that changes in mitochondrial respiration and
ATP production may exist.

256
C.3 Preliminary Data
The role of IL-6 on cachexia development and skeletal muscle protein turnover
has been studied extensively by our lab. We have characterized the progression of
cachexia in the Min model of colon cancer cachexia in relation to protein turnover and
skeletal muscle mitochondrial content (White et al., 2011b; White et al., 2013b). The Min
mouse displays increases in muscle protein degradation, decreases in muscle protein
synthesis and mitochondrial content, and alterations in mitochondrial dynamics with the
progression cachexia (White et al., 2011a; White et al., 2013b; White et al., 2012c).
Importantly we have shown that the Min mouse develops and IL-6 dependent cachexia
and inhibition of IL-6 prevents the progression of cachexia (Baltgalvis et al., 2008b;
Baltgalvis et al., 2009b).
We have published that global inhibition, that is both inhibition of classical and
trans IL-6 signaling together, can attenuate muscle mass loss and mitochondrial
dysfunction in the ApcMin/+ mouse (White et al., 2011a; White et al., 2012c). We have
preliminary data showing increases in the soluble IL-6 receptor prior to weight loss
(Figure C.1) leading us to believe that IL-6 trans signaling is playing a vital role in the
progression of cachexia. Dr. Rose-John has successfully developed a fusion protein to
specifically inhibit IL-6 trans signaling both in vitro and in vivo (Atreya et al., 2000;
Barkhausen et al.; Jones et al., 2011; Lo et al., 2011; Nechemia-Arbely et al., 2008;
Nowell et al., 2003; Rose-John, 2012; Waetzig and Rose-John, 2012). To further explore
the role of IL-6 signaling on skeletal muscle mass regulation we have developed a mouse
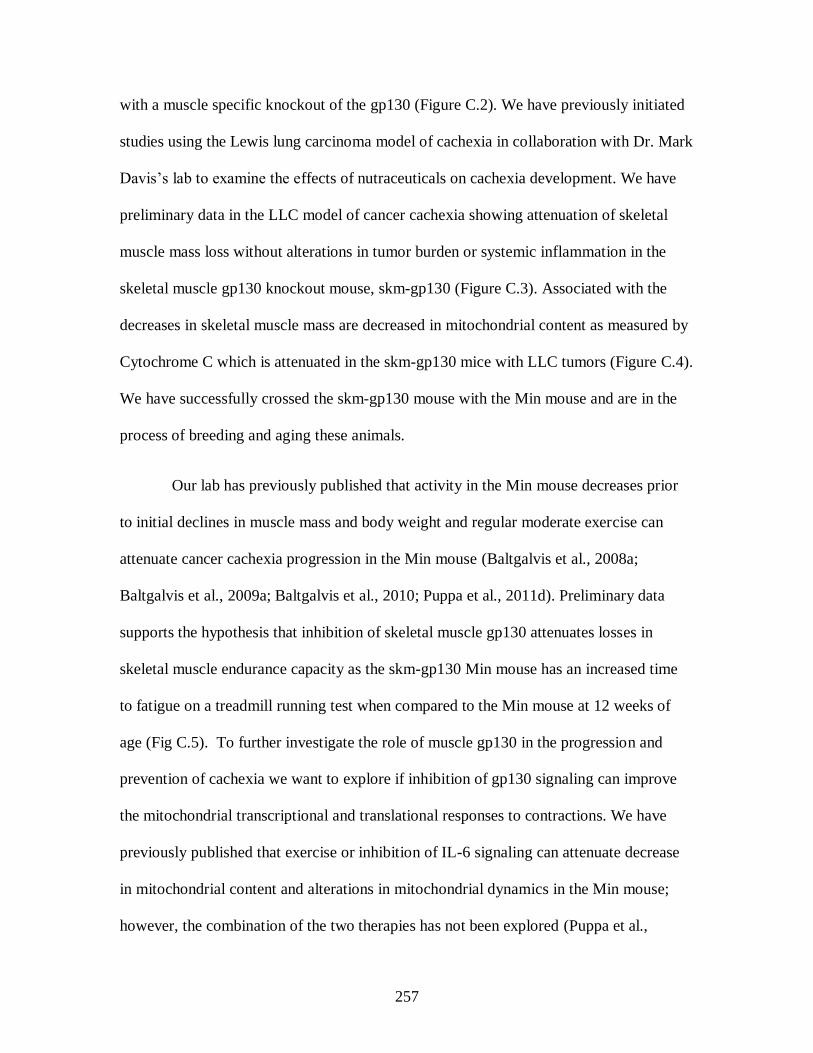
257
with a muscle specific knockout of the gp130 (Figure C.2). We have previously initiated
studies using the Lewis lung carcinoma model of cachexia in collaboration with Dr. Mark
Davis’s lab to examine the effects of nutraceuticals on cachexia development. We have
preliminary data in the LLC model of cancer cachexia showing attenuation of skeletal
muscle mass loss without alterations in tumor burden or systemic inflammation in the
skeletal muscle gp130 knockout mouse, skm-gp130 (Figure C.3). Associated with the
decreases in skeletal muscle mass are decreased in mitochondrial content as measured by
Cytochrome C which is attenuated in the skm-gp130 mice with LLC tumors (Figure C.4).
We have successfully crossed the skm-gp130 mouse with the Min mouse and are in the
process of breeding and aging these animals.
Our lab has previously published that activity in the Min mouse decreases prior
to initial declines in muscle mass and body weight and regular moderate exercise can
attenuate cancer cachexia progression in the Min mouse (Baltgalvis et al., 2008a;
Baltgalvis et al., 2009a; Baltgalvis et al., 2010; Puppa et al., 2011d). Preliminary data
supports the hypothesis that inhibition of skeletal muscle gp130 attenuates losses in
skeletal muscle endurance capacity as the skm-gp130 Min mouse has an increased time
to fatigue on a treadmill running test when compared to the Min mouse at 12 weeks of
age (Fig C.5). To further investigate the role of muscle gp130 in the progression and
prevention of cachexia we want to explore if inhibition of gp130 signaling can improve
the mitochondrial transcriptional and translational responses to contractions. We have
previously published that exercise or inhibition of IL-6 signaling can attenuate decrease
in mitochondrial content and alterations in mitochondrial dynamics in the Min mouse;
however, the combination of the two therapies has not been explored (Puppa et al.,

258
2011d; White et al., 2011a; White et al., 2012c). We have preliminary data showing that
skeletal muscle of cachectic mice is capable of responding to an acute bout of contraction
through increased gene expression (Figure C.6); however, it is unknown if an acute bout
of contraction is capable of increasing genes regulating mitochondrial biogenesis in
cachectic muscle and if the increases in gene expression result in increases in the protein
levels.

259
BL-6 WS Severe0
5
10
15
20
25
sIL
-6R
(n
g/m
l)
Figure C.1. Plasma sIL-6R levels in the Min mouse.
Soluble IL-6 receptor (sIL-6R) was measured in plasma
taken from wild type BL-6 mice, weight stable Min mice at 12 weeks of age (WS), and severely cachectic mice at 20
weeks of age (Severe).

260
A)
B)
C)
Figure C.2. Characterization of the muscle specific gp130 receptor
knockout mouse (skm-gp130). A) PCR analysis of gp130 mRNA
(643bp product size) in quadriceps muscle of wild type (Cre -/-) and skm-gp13 (cre +/+) mice. B) Differential expression of gp130 mRNA
in the soleus (sol), gastrocnemius (gas), tibialis anterior (TA), and
quadriceps (Quad) muscles of gp130 floxed mice with heterozygous or homozygous cre expression. C) gp130 mRNA expression in the liver,
kidney and heart.

261
Figure C.3. The effect of skm-gp130 on development of cancer induced cachexia. At 8
weeks of age wild type BL-6 mice and skm-gp130 mice expressing heterozygous cre (skm-gp130) were implanted with LLC tumor cells. Tumors were allowed to grow until 13
weeks of age. A) tumor weights and B) muscle mass of gastrocnemius (gastroc), tibialis
anterior (TA) and quadriceps (quad) and C) spleen weight were measured at the time of
sacrifice.

262
Figure C.4. The effect of skm-gp130 on muscle mitochondrial capacity in the LLC tumor implant model. Western blots of cytochrome C, P-AMPK,
total AMPK and ponceau stain.

263
C57
BL/6
Min
/+
Apc
skm
-gp13
0r
Min
/+
skm
-gp13
0r A
pc
0
50
100
150
200p=0.07
p=0.002
n=5
n=3
n=4 n=3
Tim
e t
o f
ati
gu
e (
min
)
Figure C.5. Run to fatigue in Min mice lacking skm-gp130. At 12 weeks of age mice underwent a run to fatigue test. Mice were acclimated to the treadmill for 30 minutes prior to
the test. The warm up consisted to 15 minutes of running (5min @ 5m/min, 5min@ 10m/min,
and 5min@ 15m/min). The time started when the treadmill speed was increased to 20m/min. Mice ran at 20m/min for 30min and then 25m/min for the remainder of the test. Mice were
removed when they no longer ran for a duration of 1min despite gentle hand prodding.
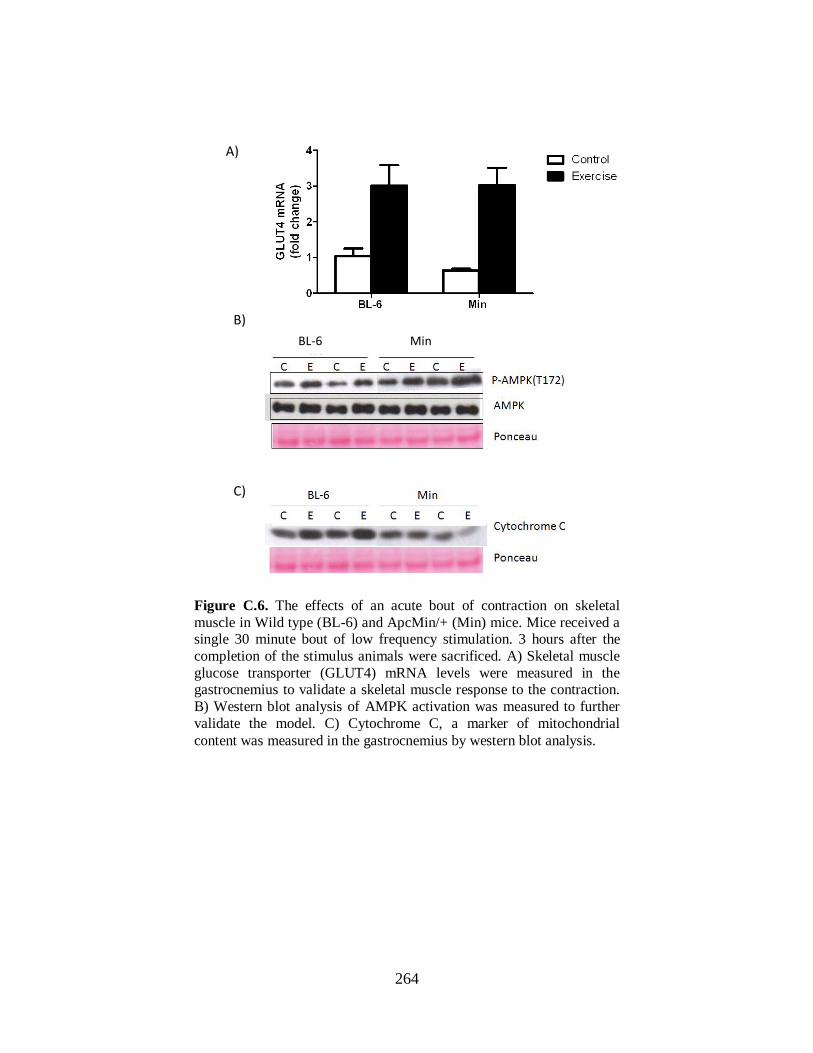
264
Figure C.6. The effects of an acute bout of contraction on skeletal
muscle in Wild type (BL-6) and ApcMin/+ (Min) mice. Mice received a single 30 minute bout of low frequency stimulation. 3 hours after the
completion of the stimulus animals were sacrificed. A) Skeletal muscle
glucose transporter (GLUT4) mRNA levels were measured in the gastrocnemius to validate a skeletal muscle response to the contraction.
B) Western blot analysis of AMPK activation was measured to further
validate the model. C) Cytochrome C, a marker of mitochondrial
content was measured in the gastrocnemius by western blot analysis.
A)
B)
C)
BL-6 Min
265
C.4 Research Design and Methods
Specific Aim #1 will determine if attenuation of trans IL-6 signaling can prevent the
loss of mitochondrial biogenesis and altered mitochondrial dynamics associated with
cancer cachexia.
Rational: We have previously shown that systemic inhibition of IL-6 signaling
through administration of an IL-6 receptor antibody in the ApcMin/+
mouse can repress
increases in mitochondrial fission and attenuate the loss of mitochondrial content (White
et al., 2012c). Because the IL-6 receptor antibody blocks both classical and trans IL-6
signaling it is unknown if the inhibition of classical or trans signaling is responsible for
the improvements in skeletal muscle mitochondrial content in cachectic mice. Inhibition
of IL-6 trans signaling has been shown to decrease tumor formation in cancer (Lo et al.,
2011; Rose-John et al., 2006); however the mechanisms underlying this are unknown. It
is also unknown if inhibition after the formation of the tumors and initiation of cachexia
will be protective. In this aim we would like to investigate if the actions of improved
mitochondrial biogenesis and dynamics, and suppressed protein degradation during
cachexia are due to attenuation of trans IL-6 signaling.
Experimental design for specific aim #1. Experiment 1 will determine the role of IL-6
trans signaling on skeletal muscle mitochondrial biogenesis and dynamics during
cachexia.
At approximately age 16wk of age mice will be randomized to a control group or
treatment group. An IL-6 fusion protein (sgp130Fc) will be injected once weekly for two
weeks starting at approximately 16wk of age. Control mice will receive an injection of

266
sterile PBS once weekly for two weeks. Min mice have initiated body weight loss by 15-
16 weeks of age making it an ideal time point to the role of IL-6 trans signaling on
cachexia progression. All mice will be housed in standard cages until the time of
sacrifice. Body weight food consumption and body temperature will be measured before
and during treatment with sgp130Fc or PBS. At sacrifice skeletal muscles, epidydimal
fat, intestines, plasma, and tibia will be collected. Skeletal muscle will be weighted and
frozen for tissue analysis of mitochondrial content, dynamics, and biogenesis by protein,
RNA, and enzyme activity via succinate dehydrogenase (SDH) staining. Polyp counts of
the intestines will be conducted to determine tumor burden. Tibia length will be measured
to normalize mice to body size.
Experiment #1 will determine if inhibition of IL-6 trans signaling in ApcMin/+
mice will
increase mitochondrial fusion decrease fission and improve mitochondrial oxidative
capacity.
Animals. ApcMin/+
male mice on a C57BL/6 background will be bred with female
C57BL/6 mice in the USC animal resource facility. Animals will be genotyped as
heterozygous for the Apc gene. All mice will be provided with standard rodent chow
(Harlan Teklad Rodent Diet, #8604, Madison, WI) and water ad libitum. Body weights
will be measured weekly throughout the course of the study. At 16 weeks of age mice
will be assigned to one of two groups; control or sgp130Fc. A soluble gp130 fusion
protein, provided by Dr. Stefan Rose-John (Conaris, Germany), will be used to inhibit IL-
6 trans signaling and sterile PBS will be used as a control. sgp130Fc will be administered
to mice intraparotaneally once weekly at a dose of 150ug in a volume of 100ul per mouse
for a total of two weeks. All mice will be sacrificed at 18 weeks of age after two weeks of

267
the respective treatment. Based on data using the IL-6 receptor antibody 6 mice per group
is sufficient to detect a 5% difference in markers of mitochondrial fission. A subset of
wild type C57BL/6 mice (n=3/group) will receive an acute exposure to LPS, which has
been shown to induce IL-6 trans signaling, with or without the Sgp130Fc. LPS has been
extensively published to rely on IL-6 trans signaling. The kidney will be used as a control
to show that IL-6 trans signaling is suppressed as the kidney has very low expression
levels of the IL-6 receptor.
Table C-1. Animal treatment groups for
experiment #1.
Strain Treatment Age
(weeks) n
C57BL/6 PBS 16-18 5-6
C57BL/6 sgp130Fc 16-18 5-6
C57BL/6 skm-gp130 16-18 5-6
ApcMin/+
PBS 16-18 5-6
ApcMin/+
sgp130Fc 16-18 5-6
ApcMin/+
skm-gp130 16-18 5-6
Primary outcomes:
Mitochondrial Biogenesis:
Mitochondrial Biogenesis will be measured by examining the levels of PGC-1α, a co-
activator of many genes regulating mitochondrial biogenesis, and Mitochondrial
Transcription Factor A (TFAM). An upstream regulator of PGC-1 that is known to be
altered during cachexia is AMP-activated protein kinase (AMPK) and will be measured
at the phosporylation site T172 as well as total levels.
Mitochondrial Content:
Mitochondrial content will be measured by examining levels of mitochondrial electron
268
transport chain complex COX IV or cytochrome c via western blot analysis. Content will
be further validated by measurement of mitochondrial DNA (cytochrome B gene)
normalized to genomic DNA (GAPDH gene). Succinate dehydrogenase staining of
myofibers will be used to analyze the percentage of highly oxidative fibers, an indicator
of mitochondrial content, in the tibialis anterior muscle.
Mitochondrial Dynamics:
Mitochondrial dynamics will be measured using western blot analysis of mitofusin 1
(MFN1), a marker of mitochondrial fusion, and mitochondrial fission 1 (FIS), a marker of
mitochondrial fission as well as mRNA levels of MFN1/2 and FIS1.
Secondary outcomes:
Protein turnover: Markers of protein synthesis including p-S6: total S6 will be measured
via western blot analysis as well as incorporation of puromycin into muscle protein.
Atrogin-1 will be measured as a marker of protein degradation.
Inflammation: Markers of skeletal muscle inflammation p-STAT3:STAT3 and p-
AMPK:AMPK will be measured via western blot analysis.
Specific Methodology Aim #1:
Animals. ApcMin/+
male mice on a C57BL/6 background will be bred with the gp130 fl/fl
mice provided by Dr. Colin Stuart’s lab in collaboration with Dr. Hennighausen (NCI)
(Zhao et al., 2004). Fl/fl ApcMin/+
male mice will then be bred with cre-expressing mice
driven by myosin light chain which were secured from Dr. Steven Burden (NYU) (Bothe
et al., 2000). The resulting fl/fl cre/cre and fl/fl cre/cre ApcMin/+
mice will have a skeletal

269
muscle deletion of the gp130 protein. ApcMin/+
and C57BL/6 males will be used for
controls. Offspring will be genotyped for cre recombinase, floxed gp130, and the Apc by
taking tail snips at the time of weaning. All animals will be housed in standard cages and
the room will be maintained on a 12:12 light:dark cycle with the light period starting at
0700. Mice will be provided with ad libitum access to water and standard rodent chow
(Harlan Teklad Rodent Diet #8604). Food consumption will be monitored during the
course of the study. Body weight will be measured weekly and animals losing more than
20% body weight will be promptly removed from the study and euthanized. All animal
experimentation is approved by the University of South Carolina’s Institutional Animal
Care and Use Committee.
Genotyping: All animals will be genotyped using a tail snip. At 4-5 weeks of age animals
a weaned, numbered, and a small tail snip (~1-2mm) collected. The tail snip is digested in
200ul of tail digest buffer and 5ul of proteinase K. Tails are incubated overnight in a
water bath set at 37°C. After incubation samples are heat shocked at 95°C in a dri-bath
for 10 minutes. Heterozygousity of the Apc gene will be determined via a PCR reaction
(Apc forward 5’ TGAGAAAGACAGAAGTTA 3”, reverse 5’ TTCCACTTTGGCATAAGGC
3’). PCR products are run out on a 1% agarose gel and exposed to UV light. Presence of a
band indicates heterozygosity of the Apc gene.
Tissue Collection: Mice will be anesthetized with a subcutaneous injection of
ketamine/acepromazine/xylazine cocktail (1.4mL/kg BW). Blood will be collected from
the retro-orbital sinus using a capillary tube. Blood will be spun at 4°C, 10,000rpm, for
10 minutes. Plasma will then be pipetted off and stored at -80°C until analysis.
Gastrocnemius (gas), plantaris (pla), soleus (sol), tibialis anterior (TA), extensor
270
digitorum longus (EDL), and quadriceps (quad) will be excised rinsed in PBS, weighed,
snap frozen in liquid nitrogen, and stored at -80°C until further analysis. Epididymal fat
pads and tibia length will also be measured. Tibia length will be used as a measure of
body size and a correction factor for skeletal muscle and body weight measures. The
small intestine will be dissected distally to the stomach and proximal to the cecum.
Intestine will be cut into four sections rinsed with PBS and opened longitudinally.
Sections will be fixed in 10% formalin for 24h and stored in 70% ethanol and used for
tumor counts in the ApcMin/+
mice.
Plasma IL-6: Plasma IL-6 will be measured using a mouse specific ELISA kit.
Approximately 25-50ul of plasma will be incubated. A standard curve will be used to
determine the levels of circulating IL-6 in all samples before and after treatment with the
sgp130Fc. An ELISA plate will be coated with capture antibody using a coating buffer
and set to incubate in 4°C overnight. After washing the plate 100ul of blocking solution
is added for 1h. After three washes 100ul of standard or diluted sample is added to the
wells in duplicate and incubated for 2 hours at room temperature. After washes 100ul of
the detector antibody solution is added and incubated for 1h. After 7 washes 100ul of
TMB cocktail is added to each well and stored in the dark for 30 minutes. Fifty
microliters of Stop solution is added to the wells and the plate is read at 450nm and
570nm according to the manufacturer’s instructions.
Polyp count: Intestinal polyps will be performed as previously described (Baltgalvis et
al., 2008b). At the time of sacrifice intestines will be carefully dissected out and
mesenteric fat will be removed. Intestines will be cleaned in PBS cut into 5 sections from
the proximal to the distal end and opened longitudinally. All sections will be laid flat and
271
fixed in formalin for 24 hours and stored in 70% ethanol until analyzed. Sections will be
stained with 0.1% methylene blue. Using a dissecting microscope and tweezers all
intestinal polyps will be counted and categorized as <1mm, 1-2mm, >2mm in size.
mtDNA: Mitochondrial DNA will be used to determine relative mitochondrial number.
DNA will be isolated from 20-30mg of skeletal muscle using DNAzol (Invitrogen) and
resuspended in 8mM NaOH. Purity and quantity of DNA will be determined from the
260/280 ratio. PCR will be run with the DNA sample with cytochrome B forward: 5′-
ATT CCT TCA TGT CGG ACG AG-3′; cytochrome B reverse: 5′-ACT GAG AAG
CCC CCT CAA AT-3′; Gapdh forward: 5′-TTG GGT TGT ACA TCC AAG CA-3′;
Gapdh reverse, 5′-CAA GAA ACA GGG GAG CTG AG-3′.
RNA isolation: RNA will be isolated from skeletal muscle using TRIzol reagent (Life
Technologies, Grand Island, NY). Isolated RNA absorbance will be measured at 260nm
and 280nm to determine RNA purity and quantity. RNA quality will be analyzed by
running samples out on an agarose gel. CDNA will be synthesized using 1ug of RNA in a
10ul volume will be added to 10ul of cocktail consisting of 10X RT buffer, dNTP mix,
10X random primers, and reverse transcriptase.
Real-time PCR: Real time PCR will be used to measure mRNA levels of genes related to
mitochondrial biogenesis, dynamics, and content. All real-time PCR reactions will be
carried out in 25ul reactions consisting of 2x SYBR green PCR buffer 0.1ul cDNA,
RNase free water and 60nM of each primer. Samples will be run using ABI 7300
Sequence detection system. Reactions will be incubated for 2 minutes at 50 and 10 min at
95 then 50 cycles of 15s denaturing at 95 1-minute annealing at 60. Cycle threshold (CT)

272
will be calculated using the ABI software and is the cycle at which the SYBR emission if
halfway between detection level and saturation level.
Gene Forward Primer Reverse Primer Size
(bps)
Reference
PGC-1α 5′-GAC CAC AAA
CGA TGA CCC TCC-
3′
5′-CCT GAG AGA
GAC TTT GGA GGC-
3′
635 (Lai et al.)
PGC-1β 5′-AAC CCA ACC
AGT CTC ACA GG-3′
5′-TGC TGC TGT
CCT CAA ATA CG-3′
371 (Uguccioni
and Hood)
TFAM 5′-ATG GCG CTG
TTC CGG GGA ATG
TGG G-3′
5′-TTA ATT CTC
AGA GAT GTC TCC
CGG G-3′
735 (Lai et al.)
NRF-1 5′-GTA GCG CAG
CCG CTC TGA GG-3′
5′-GGG TCA CTC
CGT GCT CCT CC-3′
201 (Uguccioni
and Hood)
MFN1 5’-TGT TTT GGT
CGC AAA CTC TG-3’
5’-CTG TCT GCG
TAC GTC TTC CA-3’
88
FIS1 5’-AAG TAT GTG
CGA GGG CTG T-3’
5’-TGC CTA CCA
GTC CAT CTT TC -3’
(Romanello
et al., 2010)
Protein extraction: Skeletal muscle samples will be weighted and homogenized using a
glass on glass homogenization system. Müller buffer will be used (10ul/mg of tissue) to
homogenize samples in. Following centrifugation for 10 minutes at 13,000rmp at 4°C
supernatant is placed in a new ependorf tube and diluent buffer is added at 5ul/mg of
tissue. Protein content is determined using the Bradford Assay (Bradford, 1976). All
samples are diluted to a working concentration of 3ug/ul using a solution of 2:1 müller
buffer: diluent buffer and stored at -80°C.
Western blot: Protein extracts will be run out on SDS-page gels and transferred to PVDF
membrane. FIS, MFN1, Cytochrome C, AMPK, STAT3, and PGC-1 will be probed for.
Muscle homogenates, 20-40 µg are fractionated on 6% to 12% SDS-polyacrylamide gels.
The gels are transferred to PVDF membrane overnight at 70mA then stained with

273
ponceau to ensure equal loading. Membranes are blocked in 5% Tris-buffered saline with
0.1% Tween 20 (TBST) milk for 1 h at room temperature and placed in primary antibody
at dilutions of 1:1000 to 1:5000 in 1% TBST milk overnight at 4°C overnight. Secondary
anti-rabbit or anti-mouse IgG-conjugated secondary antibodies are incubated with the
membranes at 1:2,000 to 1:5,000 dilutions for 1 h in 1% TBST milk at room temperature.
Enhanced chemiluminescence is used to visualize the antibody-antigen interactions and
develop the blot by autoradiography. Digitally scanned blots are analyzed by measuring
the integrated optical density (IOD) of each band using digital imaging software (Scion
Image, Frederick, MD).
Succinate Dehydrogenase Staining Transverse sections (~10 μm) will be cut from the
midbelly of the tibialis anterior on a cryostat at −20°C, and slides stored at −80°C until
SDH staining. The frozen sections will be dried at room temperature for 10 min. Sections
will be incubated in a solution made up of 0.2 M phosphate buffer (pH 7.4), 0.1 M
MgCl2, 0.2 M succinic acid, and 2.4 mM nitroblue tetrazolium at 37°C for 45 min. The
sections will then be washed in deionized water for 3 min, dehydrated in 50% ethanol for
2 min, and mounted for viewing with mounting media. Digital photographs will be taken
from each section at a ×200 magnification with a Nikon spot camera, and fibers traced
with imaging software (Scion Image, Frederick, MD). Approximately 150 fibers/animal
will be traced at a ×25 magnification in a blinded fashion. The percentage of SDH
positive fibers will be determined based on a criteria integrated optical density value and
categorized as stained or non-stained.

274
Specific Aim #2. To determine if IL-6 signaling through muscle gp130 receptor/
STAT3 regulates the disruption of muscle mass in the cachectic muscle.
Rationale. We have previously shown the induction of skeletal muscle protein
degradation and suppression of protein synthesis during IL-6 induced cachexia (White et
al., 2011b; White et al., 2013b). Additionally, STAT3, a downstream mediator of IL-
6/gp130 signaling, can attenuate skeletal muscle wasting in cancer-induced cachexia
(Bonetto et al., 2012; Bonetto et al., 2011); however the actions of local IL-6 signaling
and the role of systemic STAT3 signaling on muscle mass regulation during cachexia is
unknown. IL-6 and STAT3 clearly regulate muscle mass during cachexia, but it is
unclear whether these actions are from systemic activation or local activation of the
gp130/STAT3 pathway.
Experimental design for specific aim #2.
Experiment 2 will examine if loss of the skeletal muscle gp130 prevents the
disruption of protein degradation and protein synthesis during cachexia in the LLC model
of cancer cachexia. The LLC tumor implanted mice will have tumors implanted for 30
days after which they will be sacrificed and tissues harvested. At sacrifice skeletal
muscles, epididymal fat, intestines, plasma, and tibia will be collected. Skeletal muscle
will be weighted and frozen for tissue analysis including protein, RNA, and SDH
staining. Tumors will be weighted from the LLC mice to indicate tumor burden. Tibia
length will be measured to normalize mice to body size.
Experiment #2 will determine if the inhibition of muscle gp130 or systemic IL-6/STAT3
signaling can attenuate cancer cachexia in the LLC model.

275
Animals. Mice on a C57BL/6 background will be bred with the gp130 fl/fl mice provided
by Dr. Colin Stuart’s lab in collaboration with Dr. Hennighausen (NCI) (Zhao et al.,
2004). Fl/fl mice will then be bred with cre-expressing mice driven by myosin light chain
which were secured from Dr. Steven Burden (NYU) (Bothe et al., 2000). The resulting
fl/fl cre/cre mice will have a skeletal muscle deletion of the gp130 protein. fl/fl or
C57BL/6 males will be used for controls. Offspring will be genotyped for cre
recombinase and floxed gp130 by taking tail snips at the time of weaning. All animals
will be housed in standard cages and the room will be maintained on a 12:12 light:dark
cycle with the light period starting at 0700. Mice will be provided with ad libitum access
to water and standard rodent chow (Harlan Teklad Rodent Diet #8604). Food
consumption will be monitored during the course of the study. Body weight will be
measured weekly and animals losing more than 20% body weight will be promptly
removed from the study and euthanized. All animal experimentation is approved by the
University of South Carolina’s Institutional Animal Care and Use Committee.
Table C-2. Animal treatment groups for
experiment #2.
Strain/Treatment
Age
(weeks) n
C57BL/6 8-13 6-8
C57BL/6 LLC 8-13 6-8
skm-gp130 8-13 6-8
skm-gp130 LLC 8-13 6-8

276
Experiment #2b will determine if loss of STAT3 signaling will attenuate decreases in
muscle mass during cachexia or alter protein turnover.
Animals. Body weights will be measured weekly throughout the course of the study. At
13 weeks of age mice will be assigned to one of three groups; control, IL-6r Ab, or
PDTC. PDTC will be used to inhibit global STAT3 signaling and will be administered to
mice daily at a dose of 100ug/mg BW for 1 week in LLC mice. As a control a subset of
mice will receive the specific STAT3 inhibitor LLL12 (Lin et al., 2010) administered at a
dose of 5mg/kg BW as previously reported in vivo (Lin et al., 2011) for one week in LLC
implanted mice. All mice will be sacrificed after the respective treatment at ~13 weeks of
age. All animals will be housed in standard cages and the room will be maintained on a
12:12 light:dark cycle with the light period starting at 0700. Mice will be provided with
ad libitum access to water and standard rodent chow (Harlan Teklad Rodent Diet #8604).
Food consumption will be monitored during the course of the study. Body weight will be
measured weekly and animals losing more than 20% body weight will be promptly
removed from the study and euthanized. All animal experimentation is approved by the
University of South Carolina’s Institutional Animal Care and Use Committee.
Table C-3. Animal treatment groups for experiment
#2b.
Strain Treatment
Age
(weeks) n
C57BL/6 LLC 8-13 5
C57BL/6 LLC+PDTC 8-13 5
C57BL/6 LLC+IL-6r Ab 8-13 5

277
Primary outcomes:
Cachexia:
Cachexia will be measured as the loss in body weight and muscle mass over the course of
the study. Body weigh will be measured weekly to monitor the health of the animal.
DEXA measurements will be conducted before tumor implantation and that the time of
sacrifice as an indicator of fat loss. Fat and muscle will be measured at the time of
sacrifice and tumor free body weight will be measured.
Inflammatory Signaling:
Markers of skeletal muscle inflammation pSTAT3:STAT3, pAMPK:AMPK, pP65:P65
and pP38:P38 will be measured by western blot analysis. Circulating IL-6 will be
measured in LLC implanted mice.
Protein Turnover: Markers of protein synthesis p-S6: total S6 will be measured via
western blot analysis. FOXO and Atrogin-1 will be measured as a marker of protein
degradation.
Specific Methodology Aim #2
Genotyping: All animals will be genotyped using a tail snip. At 4-5 weeks of age animals
a weaned, numbered, and a small tail snip collected. The tail snip is digested in 200ul of
tail digest buffer and 5ul of proteinase K. Tails are incubated overnight in a water bath set
at 37°C. After incubation samples are heat shocked at 95°C in a dri-bath for 10 minutes.
A separate PCR reaction is used to determine the presence or absence of floxed gp130
and cre recombinase. Offspring will be genotyped for cre recombinase (forward 5’ AAG
CCC TGA CCC TTT AGA TTC CAT TT 3’, reverse 5’ AAA ACG CCT GGC GAT

278
CCC TGA AC 3’, wild type 5’ GCGGGCTTCTTCACGTCTTTCTTT 3’), floxed gp130
(forward 5’ ACG TCA CAG AGC TGA GTG ATG CAC 3’, reverse 5’ GGC TTT TCC
TCT GGT TCT TG 3’), and the Apc gene (forward 5’ TGAGAAAGACAGAAGTTA 3”,
reverse 5’ TTCCACTTTGGCATAAGGC 3’) by taking tail snips at the time of weaning.
Tissue Collection: Mice will be anesthetized with a subcutaneous injection of
ketamine/acepromazine/xylazine cocktail (1.4mL/kg BW). Blood will be collected from
the retro-orbital sinus using a capillary tube. Blood will be spun at 4°C, 10,000rpm, for
10 minutes. Plasma will then be pipetted off and stored at -80°C until analysis.
Gastrocnemius (gas), plantaris (pla), soleus (sol), tibialis anterior (TA), extensor
digitorum longus (EDL), quadriceps (quad), and tumors from the LLC mice will be
excised rinsed in PBS, weighed, snap frozen in liquid nitrogen, and stored at -80°C until
further analysis. Epididymal fat pads and tibia length will also be measured. Tibia length
will be used as a measure of body size and a correction factor for skeletal muscle and
body weight measures.
Plasma IL-6: Plasma IL-6 will be measured using a mouse specific ELISA kit. A high
sensitivity IL-6 ELISA (Invitrogen) will be used to analyze the data from the LLC study.
The assay will be carried out according to the manufacturer’s instructions. IL-6 will be
measured as described in Aim 1.
RNA isolation: RNA will be isolated from skeletal muscle using TRIzol reagent as
described in Aim 1.
Real-time PCR: Real time PCR will be used to measure mRNA levels of genes related to
mitochondrial biogenesis, and dynamics as described in Aim 1.

279
Protein extraction: Skeletal muscle samples will be weighted and homogenized using a
glass on glass homoginazation system as described in Aim 1. Protein content will be
determined using the Bradford Assay.
Western blot: Protein extracts will be run out on SDS-page gels and transferred to PVDF
membrane. FIS, MFN1, Cytochrome C, COXIV, TFAM, PGC-1, p-S6, p-STAT3, and p-
AMPK will be probed for as described in Aim 1.
Protein synthesis: To directly measure protein synthesis mice will be injected with
phenylalanine or puromycin (0.04mM/kg) 30 minutes prior to sacrifice. Muscle
homogenates will be analyzed via western blot when appropriate using an anti-puromycin
antibody for alterations in the amount of puromycin incorporated into the proteins. This
method has been widely published as a valid measurement of the rate of protein synthesis
(Goodman and Hornberger; Goodman et al., 2012; Goodman et al., 2011a; Schmidt et al.,
2009).
Specific Aim #3 will determine if the transcription and translation of proteins
regulating mitochondrial biogenesis are altered with acute contraction during
cachexia.
Specific Aim #3 Rational: We have previously shown that exercise training prior to the
initiation of cachexia attenuates the loss of skeletal muscle mitochondrial content in the
Min mouse (Puppa et al., 2011d). Our preliminary data suggests that cachectic muscle
has the capacity to up-regulate nuclear encoded mitochondrial gene (NUGEMPs)
transcription after a novel bout of contraction, but this increase in transcription is not
associated with an increase in translation of the proteins. It is unclear if cachectic skeletal

280
muscle has decreased mitochondrial plasticity to an acute contraction bout, and if
inhibition of inflammation can regulate contraction mediated mitochondrial plasticity in
cachectic muscle.
Experimental Design for specific aim #3: In this experimental aim C57BL/6 mice and
ApcMin/+
will be used. Mice will be implanted with aged to approximately 18-20 weeks
old at which point Min mice will have lost significant body weight and will be cachectic.
To inhibit inflammatory signaling, PDTC will be administered to a subset of Min mice 24
hours prior to stimulation. All mice will undergo an acute 30 minute bout of low
frequency electrical stimulation (10Hz, 90ms delay, 1ms pulse) at 18-20 weeks of age.
The stimulation will mimic an acute endurance bout of exercise. Only the left leg will be
stimulated and the right leg will serve as an internal control. All mice will be sacrificed 3
hours after the completion of the 30 minutes exercise bout. Mice will be housed in
standard cages until the time of sacrifice. At sacrifice skeletal muscles, epididymal fat,
intestines, plasma, and tibia will be collected. Skeletal muscle will be weighted and
frozen for tissue analysis including protein, and RNA. Tibia length will be measured to
normalize mice to body size. Five animals will be used for each group to give a power of
99.4% with a 5% probability of incorrectly rejecting the null hypothesis that there is no
difference in transcription of PGC-1α with stimulation. Analysis is based on preliminary
data from ApcMin/+
mice.

281
Table 1-4. Animal treatment groups for
experiment #3.
Strain Age Treatment n
(wks) Right leg Left Leg
C57BL/6 13 Stim Con 5-7
ApcMin/+
13 Stim Con 5-7
ApcMin/+
+PDTC 13 Stim Con 5-7
Primary Outcomes:
Transcriptional response of NUGEMPs: The transcriptional response of NUGEMPs will
be measured by real time PCR. TFAM, a prominent nuclear gene encoding a
mitochondrial protein, will be measured as well as PGC-1 and NRF1 which are known
regulators of NUGEMP transcription.
Translational response of NUGEMPs: Skeletal muscle translational response of
NUGEMPs will be measured by western blot analysis of several proteins. TFAM and
PGC-1 protein content will be measured in muscle three hours after the contraction bout.
Changes in AMPK activation will be used to examine upstream regulation of NUGEMP
transcription and translation. Activation of S6 ribosomal protein will be measured as a
marker of protein synthesis which should be increased during translation of proteins. The
incorporation of puromycin will be used to directly measure protein synthesis in vivo.
Specific Methodology Aim #3
Genotyping: All animals will be genotyped using a tail snip. At 4-5 weeks of age animals
a weaned, numbered, and a small tail snip collected. The tail snip is digested in 200ul of
tail digest buffer and 5ul of proteinase K. Tails are incubated overnight in a water bath set

282
at 37°C. After incubation samples are heat shocked at 95°C in a dri-bath for 10 minutes.
A separate PCR reaction is used to determine the presence or absence of floxed gp130
and cre recombinase.
Electrical Stimulation: Prior to stimulation food will be restricted for 5 hours, but animals
will have ad libitum access to water. Animal will be anesthetized with Isoflurane in a
chamber at 2-5% and remained anesthetized using a cone hooked up to the
isoflurane/oxygen. Gas will be scavenged using carbon filters that will be replaced after
an increase of 50g in weight. Animals will be placed on a heat pad and the left hind limb
will be shaved free of hair and cleaned with alcohol followed by betadine. Electrodes will
be placed on both sides of the siatic nerve and stimulated posterior to the knee via
subcutaneous needle. The stimulating electrode will be positioned proximal to the
bifurcation of the sciatic nerve, thus contractions occurred in all compartments of the leg.
Proper electrode position will be confirmed by observing plantarflexion at the ankle joint.
This protocol will elicit an overall effect of plantar flexion and will result in tapping of
the foot. The voltage will be applied by Grass S88 stimulator (Grass technologies, RI).
Stimulation will be delivered at a frequency of 10 Hz, 5 V, 10-ms duration, 90-ms delay,
there will be 1s stimulation followed by 1s rest for a total time of 30 min. During
recovery period, animals will remain on a heat pad and be closely monitored.
Tissue Collection: Mice will be anesthetized with a subcutaneous injection of
ketamine/acepromazine/xylazine cocktail (1.4mL/kg BW). Blood will be collected from
the retro-orbital sinus using a capillary tube. Blood will be spun at 4°C, 10,000rpm, for
10 minutes. Plasma will then be pipetted off and stored at -80°C until analysis.
Gastrocnemius (gas), plantaris (pla), soleus (sol), tibialis anterior (TA), and extensor

283
digitorum longus (EDL) will be excised rinsed in PBS, weighed, snap frozen in liquid
nitrogen, and stored at -80°C until further analysis. Epididymal fat pads and tibia length
will also be measured. Tibia length will be used as a measure of body size and a
correction factor for skeletal muscle and body weight measures. The tumor will be
dissected away and weighed to give the tumor burden.
RNA isolation: RNA will be isolated from skeletal muscle using Trizol reagent. Isolated
RNA absorbance will be measured at 260nm and 280nm to determine RNA purity and
quantity. RNA quality will be analyzed by running samples out on an agarose gel.
Real-time PCR: Real time PCR will be used to measure mRNA levels of genes related to
mitochondrial biogenesis.
Protein extraction: Skeletal muscle samples will be weighted and homogenized using a
glass on glass homoginazation system. Müller buffer will be used (10ul/mg of tissue) to
homogenize samples in. Protein content will be determined using the Bradford Assay.
Western blot: Protein extracts will be run out on SDS-page gels and transferred to PVDF
membrane as described in Aim 1. Cytochrome C, COXIV, TFAM, AMPK, S6 ribosomal
protein, and PGC-1 will be probed for using dilutions of 1:1000-1:5000 in 1% TBST
milk.
Protein synthesis: To directly measure protein synthesis mice will be injected with
phenylalanine 30 minutes prior to sacrifice. Muscle homogenates will be analyzed via
western blot using an anti-puromycin antibody for alterations in the amount of puromycin
incorporated into the proteins. This method has been widely published as a valid
measurement of the rate of protein synthesis.

284
APPENDIX D
RAW DATA

285
MouseGeno
Treatm
ent
Peak
BW
Post
BW R.Sol L.Sol
R.
Plant
L.
Plant R. Gas L. Gas
R.
EDL
L.
EDL R. TA L. TA R. RF L. RF
2831 BL/6 control 25.4 25.4 7 8 7.5 16 16 16 117 122 119.5 10 10 10 47 47 47 93 na 93
2832 BL/6 control 24.7 24.7 8 8 8 13 16 14.5 115 126 120.5 10 8 9 39 47 43 98 112 105
2833 BL/6 control 26.9 26.9 8 9 8.5 16 19 17.5 136 135 135.5 12 13 12.5 46 50 48 117 105 111
2622 BL/6 control 29.3 29.3 12 11 11.5 22 23 22.5 153 147 150 14 12 13 48 52 50 118 119 118.5
2662 BL/6 control 27.4 27.4 9 10 9.5 20 22 21 144 140 142 15 13 14 41 44 42.5 123 101 112
2628 BL/6 control 27.4 27.4 9 9 9 21 23 22 147 156 151.5 10 7 8.5 61 57 59 103 107 105
2784 BL/6 control 27.5 27.5 11 12 11.5 19 23 21 139 146 142.5 15 15 15 54 52 53 102 103 102.5
2785 BL/6 control 28.7 28.7 12 10 11 24 20 22 152 141 146.5 13 12 12.5 53 56 54.5 116 111 113.5
2624 BL/6 control 28.7 28.7 13 10 11.5 21 20 20.5 140 146 143 12 9 10.5 52 53 52.5 104 105 104.5
mean 27.3 27.3 9.8 19.7 139.0 11.7 49.9 107.2
stdev 1.5 1.5 1.6 2.9 11.8 2.3 5.4 7.5
se 0.5 0.5 0.5 1.0 3.9 0.8 1.8 2.5
3207 BL/6
sgp130
Fc 28.5 27.4 7 9 8 20 17 18.5 145 139 142 12 10 11 54 52 53 101 98 99.5
3209 BL/6
sgp130
Fc 27.7 27.7 11 11 11 18 19 18.5 138 142 140 11 11 11 54 61 57.5 99 106 102.5
3218 BL/6
sgp130
Fc 25.9 25.8 10 10 10 18 21 19.5 134 139 136.5 14 14 14 47 54 50.5 102 100 101
3221 BL/6
sgp130
Fc 27.9 27.9 11 9 10 21 21 21 144 143 143.5 13 11 12 50 55 52.5 97 104 100.5
mean 27.5 27.2 9.8 19.4 140.5 12.0 53.4 100.9
stdev 1.1 1.0 1.3 1.2 3.0 1.4 3.0 1.3
se 0.56 0.48 0.63 0.59 1.51 0.71 1.48 0.63
2803 BL/6
skm-
gp130 28.5 28.5 13 11 12 21 23 22 136 135 135.5 13 15 14 55 56 55.5 106 113 109.5
2804 BL/6
skm-
gp130 26.3 26.3 12 11 11.5 18 20 19 121 124 122.5 12 12 12 52 47 49.5 89 88 88.5
2805 BL/6
skm-
gp130 28.4 28.4 11 12 11.5 21 24 22.5 146 146 146 14 14 14 51 48 49.5 107 111 109
2854 BL/6
skm-
gp130 31.4 31.4 12 11 11.5 22 22 22 161 166 163.5 14 14 14 61 66 63.5 121 123 122
2855 BL/6
skm-
gp130 24.2 24.2 9 8 8.5 14 17 15.5 129 131 130 12 10 11 45 45 45 94 83 88.5
mean 27.8 27.8 11.0 20.2 139.5 13.0 52.6 103.5
stdev 2.7 2.7 1.4 3.0 15.9 1.4 7.1 14.7
se 1.2 1.2 0.6 1.3 7.1 0.6 3.2 6.6
Mouse Geno Treatment Liver Spleen Epi Fat Testes Heart TL(mm)
2831 BL/6 control 1302 75 337 204 120 17.2
2832 BL/6 control 1200 67 261 210 118 16.9
2833 BL/6 control 1233 70 408 216 123 17.2
2622 BL/6 control 1143 96 709 199 114 17.2
2662 BL/6 control 1087 89 583 170 110 17.1
2628 BL/6 control 1037 81 345 210 112 17
2784 BL/6 control 1153 91 565 209 120 17
2785 BL/6 control 1134 143 406 207 102 17.4
2624 BL/6 control 1120 85 569 212 106 17.1
mean 1156.6 88.6 464.8 204.1 113.9 17.1
stdev 79.1 22.6 147.2 13.7 7.0 0.1
se 26.4 7.5 49.1 4.6 2.3 0.0
3207 BL/6 sgp130Fc 1303 84 309 203 110 17
3209 BL/6 sgp130Fc 1226 86 420 201 110 17.2
3218 BL/6 sgp130Fc 1153 86 301 214 103 16.9
3221 BL/6 sgp130Fc 1167 79 432 211 116 16.7
mean 1212.3 83.8 365.5 207.3 109.8 17.0
stdev 68.3 3.3 70.1 6.2 5.3 0.2
se 34.14 1.65 35.05 3.12 2.66 0.10
2803 BL/6 skm-gp130 1512 111 480 227 142 17.3
2804 BL/6 skm-gp131 1354 88 456 234 110 16.8
2805 BL/6 skm-gp132 1525 136 373 226 128 17.1
2854 BL/6 skm-gp133 1388 93 392 245 134 17.5
2855 BL/6 skm-gp134 1133 60 295 216 116 17
mean 1382.4 97.6 399.2 229.6 126.0 17.1
stdev 158.2 28.2 73.1 10.7 13.0 0.3
se 70.8 12.6 32.7 4.8 5.8 0.1

286
MouseGeno Treat Peak BW Sac BW %change
2896Min control 23.0 19.3 -16%
660Min control 24.6 19.6 -20%
2919Min control 25.8 21.8 -16%
659Min control 24.3 21.6 -11%
663Min control 23.1 18.3 -21%
2741Min control 23.1 18.8 -18.6%
2740Min control 23.6 17.2 -27.1%
2626Min control 26.1 19.7 -24.5%
2830Min control 23 17 -26.1%
2829Min control 23.1 20 -13.4%
2623Min control 26.1 23.5 -10.0%
mean 24.2 19.7 -18.50%
stdev 1.3 2.0 5.87%
se 0.4 0.6 1.77%
3049Min sgp130Fc 24.4 22.1 1.4%
3112Min sgp130Fc 23.2 23.4 2.6%
3113Min sgp130Fc 22.7 22 3.3%
3114Min sgp130Fc 25.9 25.3 1.2%
3111Min sgp130Fc 23 18.2 -12.5%
3137Min sgp130Fc 25.3 25.8 2.0%
mean 24.1 22.8 -0.3%
stdev 1.3 2.8 6.0%
se 0.54 1.12 2.5%
2758Min skm-gp130 22.4 21.9 -2.2%
2759Min skm-gp130 25.9 23.5 -9.3%
2902Min skm-gp130 23.2 19.4 -16.4%
3058Min skm-gp130 21.4 17.1 -20.1%
3035Min skm-gp130 20.5 18.3 -10.7%
3059Min skm-gp130 25.8 21.7 -15.9%
23.2 20.3 -12.43%
2.2 2.4 6.37%
0.9 1.0 2.6%

287
MouseGeno Treat
R.
Sol
L.
Sol avg sol R. Plant L. Plant
avg
Plant R. Gas L. Gas avg Gas R. EDL L. EDL
avg
EDL R. TA L. TA avg TA R. RF L. RF avg RF
2896Min control 6 5 5.5 7 10 8.5 51 56 53.5 5 6 5.5 21 22 21.5 37 36 36.5
660Min control 8 7 7.5 15 13 14 93 92 92.5 8 9 8.5 30 34 32 70 74 72
2919Min control 6 6 6 9 9 9 72 68 70 5 6 5.5 20 21 20.5 48 44 46
659Min control 8 7 7.5 12 11 11.5 91 89 90 6 7 6.5 29 34 31.5 63 66 64.5
663Min control 8 7 7.5 13 13 13 92 91 91.5 6 4 5 36 34 35 75 65 70
2741Min control 8 7 7.5 13 13 13 88 82 85 7 5 6 29 30 29.5 49 47 48
2740Min control 6 7 6.5 9 10 9.5 63 68 65.5 6 6 6 24 20 22 45 42 43.5
2626Min control 6 4 5 8 10 9 70 73 71.5 4 6 5 21 22 21.5 50 38 44
2830Min control 6 6 6 12 10 11 91 73 82 6 6 6 34 31 32.5 62 59 60.5
2829Min control 6 7 6.5 10 10 10 77 - 77 5 5 5 23 31 27 55 48 51.5
2623Min control 8 8 8 11 13 12 86 82 84 8 6 7 30 31 30.5 62 67 64.5
mean 6.7 11.0 78.4 6.0 27.6 54.6
stdev 1.0 1.9 12.2 1.0 5.3 12.1
se 0.3 0.6 3.7 0.3 1.6 3.6
3049Min sgp130Fc 8 8 8 13 11 12 82 84 83 7 7 7 31 33 32 61 63 62
3112Min sgp130Fc 7 6 6.5 14 15 14.5 104 118 111 11 10 10.5 37 torn 37 73 na 73
3113Min sgp130Fc 8 9 8.5 15 13 14 106 82 94 9 7 8 32 33 32.5 72 74 73
3114Min sgp130Fc 9 8 8.5 14 12 13 114 108 111 9 6 7.5 32 22 27 77 67 72
3111Min sgp130Fc 5 5 5 8 8 8 93 94 93.5 7 5 6 26 24 25 51 47 49
3137Min sgp130Fc 5 8 6.5 19 17 18 132 132 132 10 5 7.5 40 30 35 97 101
mean 7.2 13.3 104.1 7.8 31.4 65.8
stdev 1.4 3.3 17.5 1.5 4.6 10.5
se 0.57 1.34 7.15 0.62 1.88 4.68
2758Min skm-gp130 11 7 9 14 12 13 83 70 76.5 5 6 5.5 34 28 31 51 45 48
2759Min skm-gp130 8 8 8 9 10 9.5 64 67 65.5 5 4 4.5 36 32 34 51 38 44.5
2902Min skm-gp130 8 8 8 10 10 10 63 71 67 8 7 7.5 29 32 30.5 50 48 49
3058Min skm-gp130 6 6 6 8 8 8 60 55 57.5 5 na 5 24 24 35 31 33
3035Min skm-gp130 7 6 6.5 9 10 9.5 68 71 69.5 7 6 6.5 22 24 23 48 43 45.5
3059Min skm-gp130 6 7 6.5 10 9 9.5 55 64 59.5 7 6 6.5 30 27 28.5 45 43 44
mean 7.3 9.9 65.9 5.9 28.5 44.0
stdev 1.2 1.7 6.9 1.1 4.3 5.7
se 0.5 0.7 2.8 0.5 1.7 2.3

288
MouseGeno Treatment liver Spleen epi fat testes heart
Tibia
Length
2896Min control 1405 645 0 40 100 16.1
660Min control 1161 296 0 170 102 17.2
2919Min control 1399 590 0 101 130 16.1
659Min control 1447 521 0 180 113 16.8
663Min control 1635 628 0 178 116 16.8
2741Min control 1082 530 0 136 107 16.3
2740Min control 756 210 0 85 96 17
2626Min control 889 386 0 108 90 16.6
2830Min control 992 207 0 153 91 16.8
2829Min control 1399 528 0 139 93 16.7
2623Min control 1777 430 52 178 131 17
mean 1267.5 451.9 4.7 133.5 106.3 16.7
stdev 317.3 158.6 15.7 45.5 14.7 0.4
se 95.7 47.8 4.7 13.7 4.4 0.1
3049Min sgp130Fc 1656 696 52 158 101 16.6
3112Min sgp130Fc 1571 338 179 191 112 16.5
3113Min sgp130Fc 1429 492 138 194 102 16.4
3114Min sgp130Fc 1604 528 39 197 122 17
3111Min sgp130Fc 1099 344 0 104 121 16.5
3137Min sgp130Fc 1372 318 319 211 122 16.6
mean 1455.2 452.7 121.2 175.8 113.3 16.6
stdev 205.1 148.0 117.5 39.3 9.9 0.2
se 83.7 60.4 48.0 16.0 4.0 0.09
2758Min skm-gp130 1379 438 13 133 160 16.7
2759Min skm-gp130 1560 714 10 149 120 16.5
2902Min skm-gp130 989 492 0 156 100 16
3058Min skm-gp130 1043 494 0 50 120 16.4
3035Min skm-gp130 1158 424 0 109 122 16.6
3059Min skm-gp130 1258 480 0 87 123 17
mean 1231 507.0 3.8 114.0 124.2 16.5
stdev 215 105.5 6.0 40.5 19.5 0.3
se 88 43.1 2.5 16.5 8.0 0.1

289
Sample cyto B GAPDH dct ddct 2^ddct normalized
2662 10.68 20.16 -9.48 0.80 -0.80 0.57 0.55
2628 13.35 23.84 -10.49 -0.21 0.21 1.16 1.10
2785 13.39 24.29 -10.90 -0.62 0.62 1.54 1.46
2622 13.00 23.12 -10.12 0.16 -0.16 0.90 0.85
2624 12.64 23.05 -10.41 -0.13 0.13 1.09 1.04
2855 11.34 23.59 -12.25 -1.97 1.97 3.92 3.73
2803 12.10 23.59 -11.49 -1.21 1.21 2.31 2.20
2854 12.07 22.64 -10.57 -0.29 0.29 1.22 1.16
2805 11.83 23.38 -11.55 -1.27 1.27 2.41 2.29
2804 10.19 23.37 -13.18 -2.90 2.90 7.46 7.10
2829 19.95 27.92 -7.97 2.31 -2.31 0.20 0.19
2626 14.16 23.18 -9.02 1.26 -1.26 0.42 0.40
2741 12.74 20.77 -8.03 2.25 -2.25 0.21 0.20
2537 13.02 23.16 -10.14 0.14 -0.14 0.91 0.86
2830 17.76 26.63 -8.87 1.41 -1.41 0.38 0.36
2902 10.45 21.02 -10.57 -0.29 0.29 1.22 1.16
3136 12.67 23.05 -10.38 -0.10 0.10 1.07 1.02
3155 14.56 22.21 -7.65 2.63 2.63 6.19 5.89
3120 14.26 24.12 -9.86 0.42 -0.42 0.75 0.71
mtDNA:gDNA Mean SEM
BL-6 1.00 0.15
Min 0.44 0.12
skm-gp130 3.30 1.03
skm-gp130Min 2.20 1.10

290
Sample PGC-1α GAPDH dct ddct 2^ddct normalized
2622 23.16 19.3 3.86 -0.81 0.57 0.53
2628 23.06 18.46 4.6 -0.07 0.95 0.88
2784 22.31 16.73 5.58 0.91 1.87 1.74
2785 21.61 17.05 4.56 -0.11 0.92 0.86
2624 22.37 17.6 4.77 0.10 1.07 0.99
2758 22.13 18.52 3.61 -1.06 0.48 0.44
2759 23.41 18.6 4.81 0.14 1.10 1.02
2902 21.19 19.28 1.91 -2.76 0.15 0.14
3058 23.05 18.14 4.91 0.24 1.18 1.09
3059 23.16 18.91 4.25 -0.42 0.75 0.69
2803 23.53 17.87 5.66 0.99 1.98 1.84
2805 22.66 17.75 4.91 0.24 1.18 1.09
2854 21.3 16.98 4.32 -0.35 0.78 0.73
2855 23.29 18.07 5.22 0.55 1.46 1.36
2537 22.69 17.58 5.11 0.44 1.35 1.26
2741 22.67 20 2.67 -2.00 0.25 0.23
2626 22.09 20.17 1.92 -2.75 0.15 0.14
2829 22.07 19.89 2.18 -2.49 0.18 0.16
2627 22.29 19.48 2.81 -1.86 0.27 0.26
PGC-1α Mean SEM
BL-6 1.00 0.20
Min 0.20 0.02
skm-gp130 1.25 0.18
skm-gp130Min 0.68 0.18

291
Sample TFAM GAPDH dct ddct 2^ddct normalized
2622 27.17 19.3 7.87 -0.27 0.83 0.81
2628 26.49 18.46 8.03 -0.11 0.93 0.91
2784 25.09 16.73 8.36 0.22 1.17 1.14
2785 25.68 17.05 8.63 0.49 1.41 1.37
2624 25.39 17.6 7.79 -0.35 0.79 0.77
2758 25.52 18.52 7 -1.14 0.46 0.44
2759 26.27 18.6 7.67 -0.47 0.72 0.71
2902 26.14 19.28 6.86 -1.28 0.41 0.40
3058 26.11 18.14 7.97 -0.17 0.89 0.87
3059 27.04 18.91 8.13 -0.01 1.00 0.97
2803 25.6 17.87 7.73 -0.41 0.75 0.74
2805 25.34 17.75 7.59 -0.55 0.68 0.67
2854 25.52 16.98 8.54 0.40 1.32 1.29
2855 26.05 18.07 7.98 -0.16 0.90 0.88
2537 25.87 17.58 8.29 0.15 1.11 1.09
2741 26.16 20 6.16 -1.98 0.25 0.25
2626 26.08 20.17 5.91 -2.23 0.21 0.21
2829 26.09 19.89 6.2 -1.94 0.26 0.26
2627 26.22 19.48 6.74 -1.40 0.38 0.37
TFAM Mean SEM
BL-6 1.00 0.11
Min 0.27 0.03
skm-gp130 0.93 0.11
skm-gp130Min 0.68 0.11
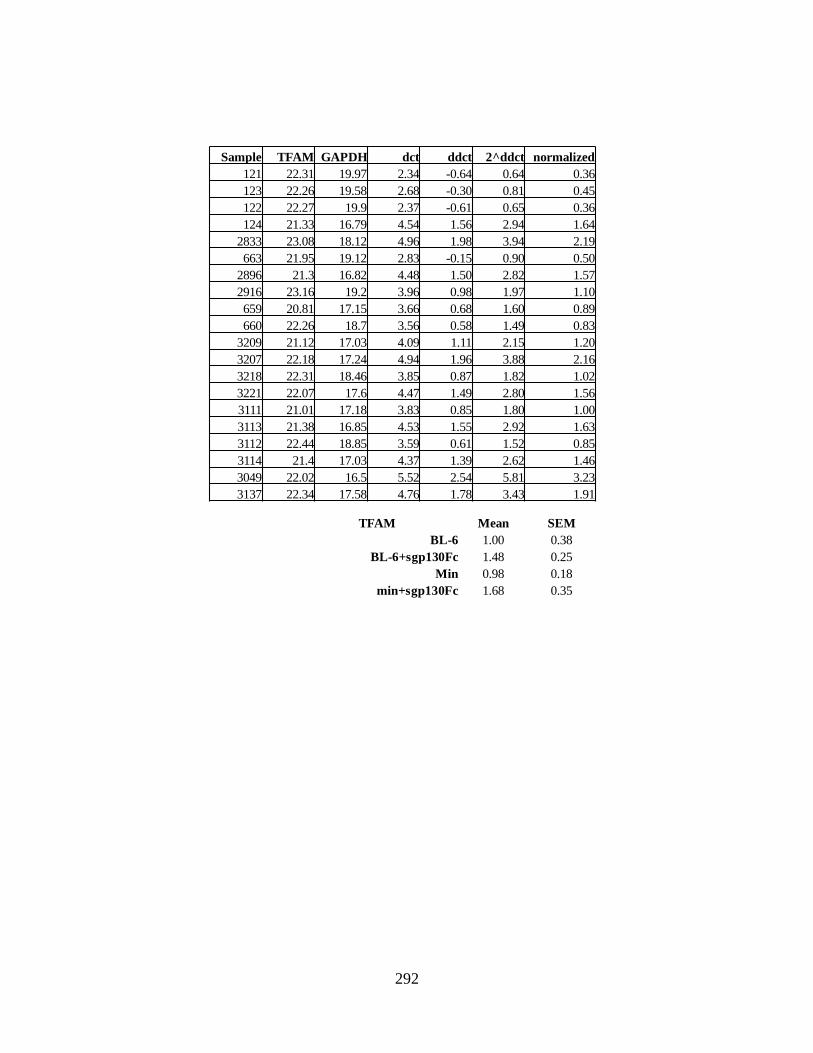
292
Sample TFAM GAPDH dct ddct 2^ddct normalized
121 22.31 19.97 2.34 -0.64 0.64 0.36
123 22.26 19.58 2.68 -0.30 0.81 0.45
122 22.27 19.9 2.37 -0.61 0.65 0.36
124 21.33 16.79 4.54 1.56 2.94 1.64
2833 23.08 18.12 4.96 1.98 3.94 2.19
663 21.95 19.12 2.83 -0.15 0.90 0.50
2896 21.3 16.82 4.48 1.50 2.82 1.57
2916 23.16 19.2 3.96 0.98 1.97 1.10
659 20.81 17.15 3.66 0.68 1.60 0.89
660 22.26 18.7 3.56 0.58 1.49 0.83
3209 21.12 17.03 4.09 1.11 2.15 1.20
3207 22.18 17.24 4.94 1.96 3.88 2.16
3218 22.31 18.46 3.85 0.87 1.82 1.02
3221 22.07 17.6 4.47 1.49 2.80 1.56
3111 21.01 17.18 3.83 0.85 1.80 1.00
3113 21.38 16.85 4.53 1.55 2.92 1.63
3112 22.44 18.85 3.59 0.61 1.52 0.85
3114 21.4 17.03 4.37 1.39 2.62 1.46
3049 22.02 16.5 5.52 2.54 5.81 3.23
3137 22.34 17.58 4.76 1.78 3.43 1.91
TFAM Mean SEM
BL-6 1.00 0.38
BL-6+sgp130Fc 1.48 0.25
Min 0.98 0.18
min+sgp130Fc 1.68 0.35

293
Sample PGC-1α 18S dCT ddCT 2^ddct Normalized
121 30.395 21.43 8.965 -0.12 0.92 0.90
123 29.855 20.435 9.42 0.34 1.26 1.24
122 30.015 20.62 9.395 0.31 1.24 1.22
124 29.485 20.66 8.825 -0.26 0.84 0.82
2833 28.08 19.26 8.82 -0.26 0.83 0.82
663 29.2 23.22 5.98 -3.11 0.12 0.11
2916 29.08 26.65 2.43 -6.66 0.01 0.01
659 27.555 21.27 6.285 -2.80 0.14 0.14
660 28.225 23.665 4.56 -4.53 0.04 0.04
3209 29.965 20.18 9.785 0.70 1.62 1.60
3207 30.54 21.045 9.495 0.41 1.33 1.31
3218 28.955 20.495 8.46 -0.63 0.65 0.64
3221 29.24 20.495 8.745 -0.34 0.79 0.78
3111 17.825 18.935 9.34 0.26 1.19 1.17
3112 28.445 19.485 8.96 -0.12 0.92 0.90
3113 28.37 20.905 7.465 -1.62 0.33 0.32
3114 28.615 18.89 9.725 0.64 1.56 1.53
PGC-1α Mean SEM
BL-6 1.00 0.23
Min 0.08 0.03
BL-6 + sgp130Fc 1.08 0.22
Min + sgp130Fc 1.01 0.26

294
Sample FIS GAPDH dct ddct 2^ddct normalized
121 26.88 19.96 6.92 0.27 1.20 1.18
123 25.9 19.69 6.21 -0.44 0.74 0.72
122 25.92 19.85 6.07 -0.58 0.67 0.65
124 24.59 17.18 7.41 0.76 1.69 1.65
2833 26.02 19.65 6.37 -0.28 0.82 0.80
663 26.68 17.62 9.06 2.41 5.31 5.18
2896 25.72 16.16 9.56 2.91 7.50 7.33
2916 26.94 18.91 8.03 1.38 2.60 2.54
659 25.08 17.37 7.71 1.06 2.08 2.03
660 26.05 18.15 7.9 1.25 2.37 2.32
3209 24.49 17.42 7.07 0.42 1.34 1.30
3207 24.44 17.39 7.05 0.40 1.32 1.29
3218 25.67 18.56 7.11 0.46 1.37 1.34
3221 25.13 17.75 7.38 0.73 1.66 1.62
3111 24.26 17.02 7.24 0.59 1.50 1.47
3113 24.25 17.1 7.15 0.50 1.41 1.38
3112 25.44 19.18 6.26 -0.39 0.76 0.74
3114 24.48 17.22 7.26 0.61 1.52 1.49
3049 24.58 16.56 8.02 1.37 2.58 2.52
3137 24.4 17.97 6.43 -0.22 0.86 0.84
FIS Mean SEM
BL-6 1.00 0.19
BL-6+sgp130Fc 1.39 0.08
Min 3.88 1.03
min+sgp130Fc 1.41 0.26

295
Sample MFN 18S dCT ddCT 2^ddct Normalized
121 24.84 20.58 4.26 -4.83 0.035 1.91
123 24.11 21.14 2.98 -6.11 0.014 0.78
122 23.64 20.58 3.07 -6.02 0.015 0.83
124 22.34 19.27 3.08 -6.01 0.016 0.84
2833 23.50 20.81 2.69 -6.40 0.012 0.64
663 23.97 22.59 1.38 -7.71 0.005 0.26
2896 22.76 20.04 2.72 -6.37 0.012 0.66
2916 23.04 21.01 2.03 -7.06 0.008 0.41
659 23.12 21.84 1.28 -7.81 0.004 0.24
660 25.29 24.05 1.24 -10.33 0.001 0.04
3209 22.59 19.85 2.74 -6.35 0.012 0.66
3207 24.33 21.24 3.09 -5.99 0.016 0.85
3218 24.24 21.50 2.74 -6.35 0.012 0.66
3221 23.22 20.55 2.67 -6.42 0.012 0.63
3111 24.01 21.87 2.14 -6.95 0.008 0.44
3112 23.49 20.69 2.80 -6.29 0.013 0.69
3113 24.36 22.03 2.33 -6.76 0.009 0.50
3114 23.89 22.18 1.72 -7.37 0.006 0.33
3049 22.71 19.93 2.79 -6.30 0.013 0.69
3137 24.19 22.70 1.49 -7.60 0.005 0.28
MFN1 Mean SEM
BL-6 1.00 0.23
Min 0.32 0.10
BL-6 + sgp130Fc 0.70 0.05
Min + sgp130Fc 0.49 0.07

296
PGC-1 PGC-1 -bg Normalized PGC-1 PGC-1 -bg Normalized
B6 153.446 13.536 1.118 B6 155.964 26.56 1.22
B6 154.586 14.676 1.212 B6 150.323 20.92 0.96 Mean SEM
B6 145.382 5.472 0.452 B6 143.623 14.22 0.65 BL-6 1.000 0.08
Min 148.029 8.119 0.670 Min 137.052 7.65 0.35 Min 0.365 0.06
Min 141.564 1.654 0.137 Min 133.325 3.92 0.18 Fc 0.889 0.14
Min 145.77 5.860 0.484 Min 139.175 9.77 0.45 skm 1.181 0.05
skm 153.117 13.207 1.091 Fc 141.202 11.80 0.54 skmMin 1.235 0.18
skm 155.67 15.760 1.301 Fc 146.918 17.51 0.80 FcMin 0.998 0.07
skm 153.427 13.517 1.116 Fc 159.03 29.63 1.36
skmMin 157.346 17.436 1.440 FcMin 153.009 23.60 1.08
skmMin 149.576 9.666 0.798 FcMin 152.673 23.27 1.07
skmMin 158.962 19.052 1.573 FcMin 147.275 17.87 0.82
B6 152.615 12.705 1.049 B6 149.905 20.50 0.94
B6 154.076 14.166 1.170 B6 155.993 26.59 1.22
Min 147.503 7.593 0.627 Min 139.071 9.67 0.44
Min 141.598 1.688 0.139 Min 133.068 3.66 0.17
skm 155.602 15.692 1.296 Fc 145.941 16.54 0.76
skm 153.231 13.321 1.100 Fc 150.623 21.22 0.98
skmMin 149.5 9.590 0.792 FcMin 154.675 25.27 1.16
skmMin 158.959 19.049 1.573 FcMin 147.907 18.50 0.85
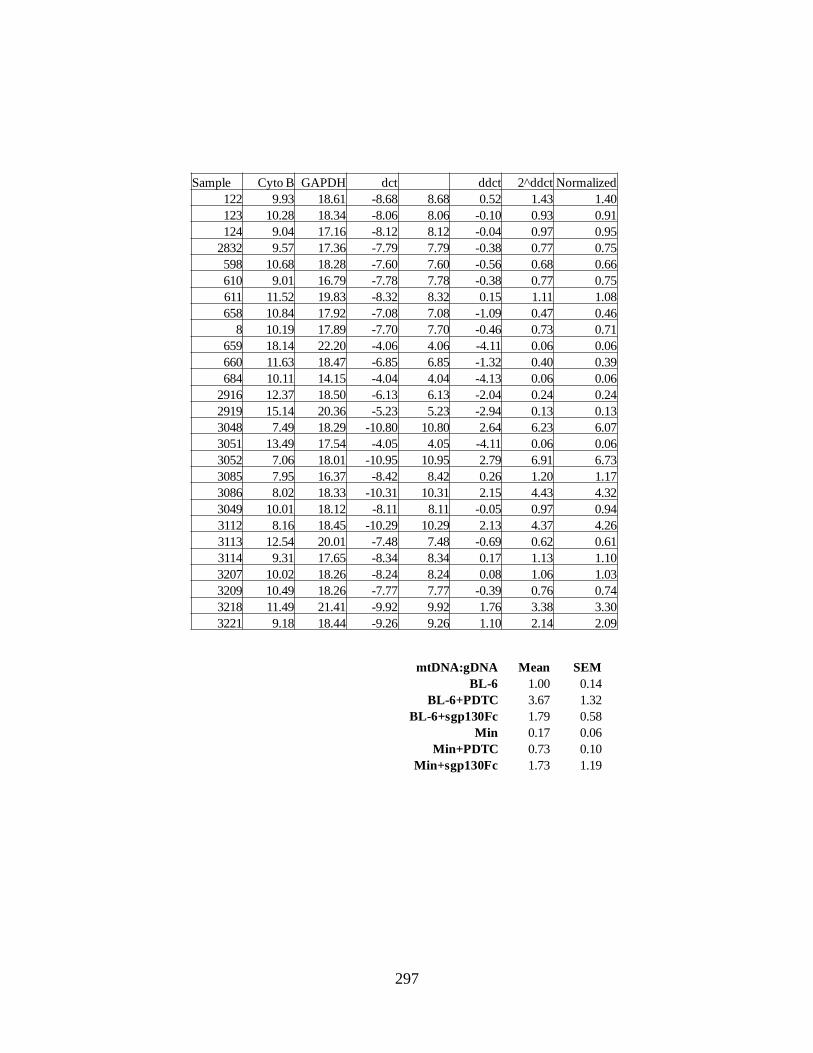
297
Sample Cyto B GAPDH dct ddct 2^ddct Normalized
122 9.93 18.61 -8.68 8.68 0.52 1.43 1.40
123 10.28 18.34 -8.06 8.06 -0.10 0.93 0.91
124 9.04 17.16 -8.12 8.12 -0.04 0.97 0.95
2832 9.57 17.36 -7.79 7.79 -0.38 0.77 0.75
598 10.68 18.28 -7.60 7.60 -0.56 0.68 0.66
610 9.01 16.79 -7.78 7.78 -0.38 0.77 0.75
611 11.52 19.83 -8.32 8.32 0.15 1.11 1.08
658 10.84 17.92 -7.08 7.08 -1.09 0.47 0.46
8 10.19 17.89 -7.70 7.70 -0.46 0.73 0.71
659 18.14 22.20 -4.06 4.06 -4.11 0.06 0.06
660 11.63 18.47 -6.85 6.85 -1.32 0.40 0.39
684 10.11 14.15 -4.04 4.04 -4.13 0.06 0.06
2916 12.37 18.50 -6.13 6.13 -2.04 0.24 0.24
2919 15.14 20.36 -5.23 5.23 -2.94 0.13 0.13
3048 7.49 18.29 -10.80 10.80 2.64 6.23 6.07
3051 13.49 17.54 -4.05 4.05 -4.11 0.06 0.06
3052 7.06 18.01 -10.95 10.95 2.79 6.91 6.73
3085 7.95 16.37 -8.42 8.42 0.26 1.20 1.17
3086 8.02 18.33 -10.31 10.31 2.15 4.43 4.32
3049 10.01 18.12 -8.11 8.11 -0.05 0.97 0.94
3112 8.16 18.45 -10.29 10.29 2.13 4.37 4.26
3113 12.54 20.01 -7.48 7.48 -0.69 0.62 0.61
3114 9.31 17.65 -8.34 8.34 0.17 1.13 1.10
3207 10.02 18.26 -8.24 8.24 0.08 1.06 1.03
3209 10.49 18.26 -7.77 7.77 -0.39 0.76 0.74
3218 11.49 21.41 -9.92 9.92 1.76 3.38 3.30
3221 9.18 18.44 -9.26 9.26 1.10 2.14 2.09
mtDNA:gDNA Mean SEM
BL-6 1.00 0.14
BL-6+PDTC 3.67 1.32
BL-6+sgp130Fc 1.79 0.58
Min 0.17 0.06
Min+PDTC 0.73 0.10
Min+sgp130Fc 1.73 1.19

298
Cyto C -bg Normalized Cyto C -bg Normalized
B6 144.424 73.654 0.863 B6 185.36 56.66 1.066
B6 147.951 77.181 0.905 B6 174.151 45.451 0.855 Mean SEM
B6 175.874 105.104 1.232 B6 188.745 60.045 1.129 BL-6 1.000 0.05
Min 91.685 20.915 0.245 Min 140.939 12.239 0.230 Min 0.462 0.11
Min 92.42 21.65 0.254 Min 157.445 28.745 0.541 Fc 1.222 0.06
Min 87.102 16.332 0.191 Min 188.933 60.233 1.133 skm 0.860 0.03
skm 149.66 78.89 0.925 Fc 196.015 67.315 1.266 skmMin 0.695 0.02
skm 140.177 69.407 0.814 Fc 186.64 57.94 1.090 FcMin 1.074 0.11
skm 142.703 71.933 0.843 Fc 199.795 71.095 1.337
skmMin 134.99 64.22 0.753 FcMin 202.745 74.045 1.393
skmMin 126.158 55.388 0.649 FcMin 173.773 45.073 0.848
skmMin 129.044 58.274 0.683 FcMin 195.547 66.847 1.257
B6 174.151 45.451 0.855
B6 186.92 58.22 1.095
Min 165.218 36.518 0.687
Min 150.892 22.192 0.417
Fc 185.91 57.21 1.076
Fc 200.074 71.374 1.342
FcMin 182.099 53.399 1.004
FcMin 174.782 46.082 0.867

299
MFN -bg Normalized MFN -bg Normalized
B6 205.32 66.78 1.65 B6 162.58 28.21 1.23
B6 177.90 39.36 0.97 B6 163.99 29.62 1.29 Mean SEM
B6 167.08 28.54 0.70 B6 145.30 10.94 0.48 BL-6 1.000 0.13
Min 141.11 2.58 0.06 Min 139.66 5.30 0.23 Min 0.413 0.07
Min 164.24 25.70 0.63 Min 142.90 8.53 0.37 Fc 2.154 0.36
Min 155.65 17.11 0.42 Min 148.01 13.65 0.60 skm 1.032 0.09
skm 173.72 35.18 0.87 Fc 180.78 46.41 2.02 skmMin 0.913 0.11
skm 185.75 47.22 1.16 Fc 199.14 64.78 2.83 FcMin 0.366 0.10
skm 192.24 53.70 1.33 Fc 171.32 36.95 1.61
skmMin 181.18 42.64 1.05 FcMin 141.13 6.77 0.30
skmMin 181.11 42.57 1.05 FcMin 139.98 5.61 0.24
skmMin 157.08 18.54 0.46 FcMin 147.16 12.80 0.56
B6 177.89 39.35 0.97
B6 167.14 28.60 0.71
Min 164.85 26.32 0.65
Min 151.99 13.46 0.33
skm 173.92 35.39 0.87
skm 176.19 37.66 0.93
skmMin 180.34 41.80 1.03
skmMin 177.95 39.41 0.97
FIS -bg Normalized FIS -bg Normalized
B6 88.004 17.27 1.16 B6 153.619 19.26 0.90
B6 80.798 10.06 0.67 B6 150.154 15.79 0.74 Mean SEM
B6 87.396 16.66 1.11 B6 163.683 29.32 1.37 BL-6 1.000 0.09
Min 150.25 79.51 5.32 Min 159.215 24.85 1.16 Min 5.034 1.39
Min 193.273 122.54 8.20 Min 177.273 42.91 2.00 Fc 0.783 0.12
Min 230.887 160.15 10.72 Min 165.115 30.75 1.43 skm 2.853 0.29
skm 123.844 53.11 3.55 Fc 149.087 14.73 0.69 skmMin 4.348 0.51
skm 104.023 33.29 2.23 Fc 148.096 13.73 0.64 FcMin 0.358 0.13
skm 112.238 41.50 2.78 Fc 156.319 21.96 1.02
skmMin 141.091 70.35 4.71 FcMin 145.35 10.99 0.51
skmMin 152.369 81.63 5.46 FcMin 144.252 9.89 0.46
skmMin 116.5 45.76 3.06 FcMin 136.531 2.17 0.10
B6 86.517 15.78 1.06
Min 166.401 95.66 6.40
skm 107.402 36.66 2.45
skmMin 132.817 62.08 4.16

300
Atrogin -bg Normalized Atrogin -bg Normalized
B6 110.094 19.03 0.82 B6 93.917 2.86 0.52
B6 115.139 24.08 1.04 B6 95.047 3.99 0.72 Mean SEM
B6 117.691 26.63 1.15 B6 100.764 9.70 1.76 BL-6 1.000 0.14
Min 162.956 71.90 3.10 Min 136.821 45.76 8.30 Min 5.248 1.10
Min 166.068 75.01 3.24 Min 143.883 52.82 9.58 Fc 1.872 0.96
Min 140.822 49.76 2.15 Min 130.366 39.31 7.13 skm 0.780 0.02
skm 109.857 18.80 0.81 Fc 98.371 7.31 1.33 skmMin 1.110 0.09
skm 108.091 17.03 0.73 Fc 111.702 20.64 3.74 FcMin 1.734 1.18
skm 109.462 18.40 0.79 Fc 94.077 3.02 0.55
skmMin 122.723 31.66 1.37 FcMin 113.487 22.43 4.07
skmMin 114.48 23.42 1.01 FcMin 96.166 5.11 0.93
skmMin 117.156 26.10 1.13 FcMin 92.215 1.16 0.21
B6 114.019 22.96 0.99
Min 166.401 75.34 3.25
skm 107.402 16.34 0.71
skmMin 112.817 21.76 0.94
S6 Phospho Total
Phos:
total Normalized S6 Phospho Total
Phos:
total Normalized
B6 38.15 149.22 0.26 0.96 B6 12.33 49.49 0.25 0.53
B6 35.55 160.44 0.22 0.83 B6 26.43 42.64 0.62 1.32 Mean SEM
B6 48.91 151.11 0.32 1.21 B6 20.85 38.59 0.54 1.15 BL-6 1.000 0.12
Min 5.84 160.47 0.04 0.14 Min 6.06 30.40 0.20 0.42 Min 0.396 0.08
Min 16.98 150.66 0.11 0.42 Min 9.03 31.48 0.29 0.61 Fc 1.000 0.34
Min 7.82 167.77 0.05 0.17 Min 9.52 33.24 0.29 0.61 skm 0.708 0.16
skm 16.67 155.77 0.11 0.40 Fc 13.69 31.99 0.43 0.91 skmMin 0.250 0.12
skm 32.39 152.97 0.21 0.79 Fc 5.34 24.73 0.22 0.46 FcMin 0.520 0.16
skm 37.67 151.90 0.25 0.93 Fc 15.28 19.98 0.76 1.63
skmMin 21.09 162.52 0.13 0.49 FcMin 7.12 33.60 0.21 0.45
skmMin 5.54 163.29 0.03 0.13 FcMin 14.02 36.38 0.39 0.82
skmMin 5.90 163.29 0.04 0.14 FcMin 4.54 33.58 0.14 0.29
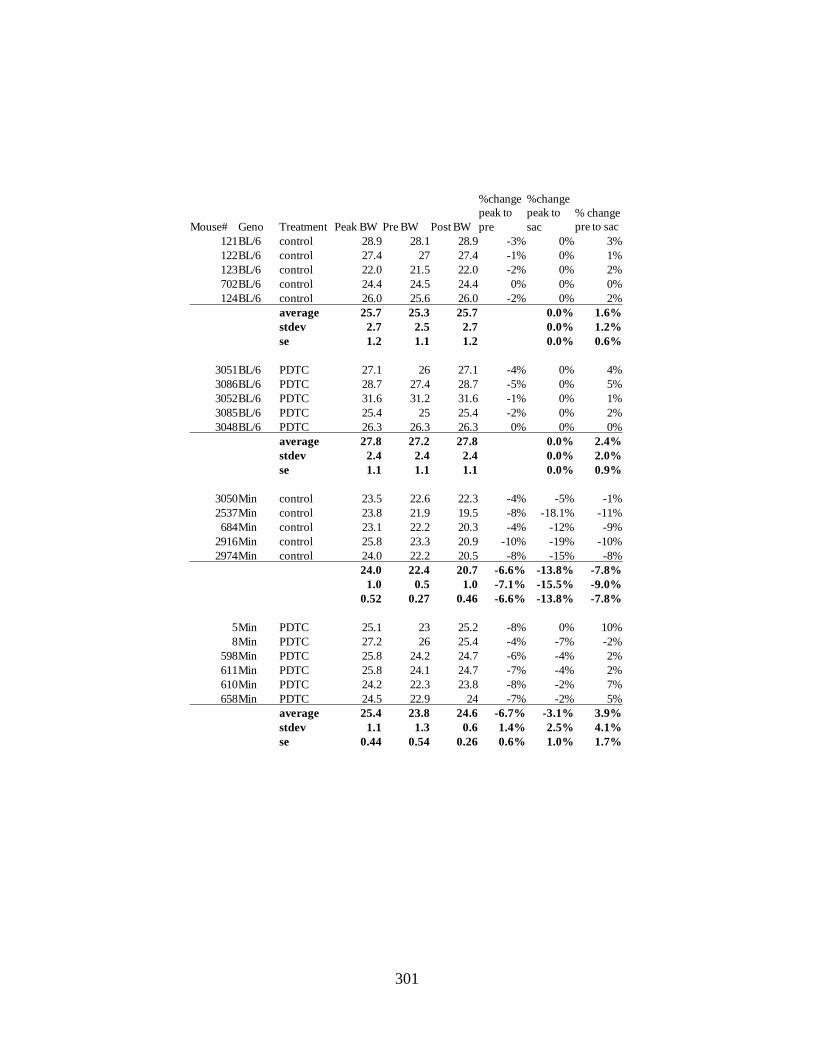
301
Mouse# Geno Treatment Peak BW Pre BW Post BW
%change
peak to
pre
%change
peak to
sac
% change
pre to sac
121BL/6 control 28.9 28.1 28.9 -3% 0% 3%
122BL/6 control 27.4 27 27.4 -1% 0% 1%
123BL/6 control 22.0 21.5 22.0 -2% 0% 2%
702BL/6 control 24.4 24.5 24.4 0% 0% 0%
124BL/6 control 26.0 25.6 26.0 -2% 0% 2%
average 25.7 25.3 25.7 0.0% 1.6%
stdev 2.7 2.5 2.7 0.0% 1.2%
se 1.2 1.1 1.2 0.0% 0.6%
3051BL/6 PDTC 27.1 26 27.1 -4% 0% 4%
3086BL/6 PDTC 28.7 27.4 28.7 -5% 0% 5%
3052BL/6 PDTC 31.6 31.2 31.6 -1% 0% 1%
3085BL/6 PDTC 25.4 25 25.4 -2% 0% 2%
3048BL/6 PDTC 26.3 26.3 26.3 0% 0% 0%
average 27.8 27.2 27.8 0.0% 2.4%
stdev 2.4 2.4 2.4 0.0% 2.0%
se 1.1 1.1 1.1 0.0% 0.9%
3050Min control 23.5 22.6 22.3 -4% -5% -1%
2537Min control 23.8 21.9 19.5 -8% -18.1% -11%
684Min control 23.1 22.2 20.3 -4% -12% -9%
2916Min control 25.8 23.3 20.9 -10% -19% -10%
2974Min control 24.0 22.2 20.5 -8% -15% -8%
24.0 22.4 20.7 -6.6% -13.8% -7.8%
1.0 0.5 1.0 -7.1% -15.5% -9.0%
0.52 0.27 0.46 -6.6% -13.8% -7.8%
5Min PDTC 25.1 23 25.2 -8% 0% 10%
8Min PDTC 27.2 26 25.4 -4% -7% -2%
598Min PDTC 25.8 24.2 24.7 -6% -4% 2%
611Min PDTC 25.8 24.1 24.7 -7% -4% 2%
610Min PDTC 24.2 22.3 23.8 -8% -2% 7%
658Min PDTC 24.5 22.9 24 -7% -2% 5%
average 25.4 23.8 24.6 -6.7% -3.1% 3.9%
stdev 1.1 1.3 0.6 1.4% 2.5% 4.1%
se 0.44 0.54 0.26 0.6% 1.0% 1.7%

302
# Geno Treat R.Sol L.Sol
R.
Plant
L.
Plant
R.
Gas
L.
Gas
R.
EDL
L.
EDL R. TA L. TA R. RF L. RF
121BL/6 control 10 10 10 19 18 18.5 149 134 141.5 14 14 14 57 51 54 113 100 106.5
122BL/6 control 8 9 8.5 19 14 16.5 139 137 138 12 11 11.5 39 48 43.5 100 95 97.5
123BL/6 control 6 6 6 15 15 15 111 109 110 10 10 10 38 40 39 65 78 71.5
702BL/6 control 9 8 8.5 17 17 17 124 126 125 10 11 10.5 44 43 43.5 81 81 81
124BL/6 control 10 8 9 17 17 17 133 137 135 11 12 11.5 46 49 47.5 104 115 109.5
averag
e 8.4 16.8 129.9 11.5 45.5 93.2
stdev 1.5 1.3 12.7 1.5 5.6 16.4
se 0.7 0.6 5.7 0.7 2.5 7.4
3051BL/6 PDTC 11 12 11.5 22 22 22 155 159 157 15 14 14.5 57 51 54 120 122 121
3086BL/6 PDTC 11 13 12 20 23 21.5 146 144 145 14 12 13 53 55 54 100 96 98
3052BL/6 PDTC 12 13 12.5 23 24 23.5 155 145 150 16 15 15.5 56 56 56 115 107 111
3085BL/6 PDTC 11 11 11 19 17 18 126 129 127.5 12 13 12.5 51 49 50 96 89 92.5
3048BL/6 PDTC 10 10 10 19 18 18.5 129 131 130 11 12 11.5 46 49 47.5 90 91 90.5
averag
e 11.4 20.7 141.9 13.4 52.3 102.6
stdev 1.0 2.4 12.8 1.6 3.5 13.0
se 0.43 1.06 5.71 0.71 1.55 5.83
3050Min control 7 8 7.5 16 15 15.5 98 100 99 8 7 7.5 37 36 36.5 75 76 75.5
2537Min control 5 6 5.5 10 8 9 75 73 74 6 9 7.5 29 33 31 56 na 56
684Min control 7 7 7 12 11 11.5 68 75 71.5 7 6 6.5 27 28 27.5 53 51 52
2916Min control 8 8 8 14 13 13.5 91 89 90 8 7 7.5 36 31 33.5 67 67 67
2974Min control 6 7 6.5 11 10 10.5 79 82 80.5 6 7 6.5 31 34 32.5 58 54 56
averag
e 6.9 12.0 83.0 7.1 32.2 62.6
stdev 1.0 2.5 11.5 0.5 3.3 10.7
se 0.43 1.14 5.12 0.24 1.48 4.77
5Min PDTC 7 9 8 12 15 13.5 85 94 89.5 8 9 8.5 27 39 33 63 68 65.5
8Min PDTC 9 8 8.5 16 14 15 112 106 109 10 9 9.5 43 na 43 73 66 69.5
598Min PDTC 8 7 7.5 13 13 13 91 90 90.5 9 8 8.5 37 37 37 60 54 57
611Min PDTC 7 7 7 15 16 15.5 104 104 104 7 8 7.5 34 38 36 67 69 68
610Min PDTC 8 6 7 18 13 15.5 94 84 89 7 7 7 30 29 29.5 71 64 67.5
658Min PDTC 8 7 7.5 15 14 14.5 98 100 99 9 7 8 31 32 31.5 76 87 81.5
averag
e 7.6 14.5 96.8 8.2 35.0 68.2
stdev 0.6 1.0 8.5 0.9 4.8 7.9
se 0.24 0.43 3.46 0.36 1.96 3.22

303
Mouse# Geno Treatment Liver Spleen Epi Fat Testes Heart Mes Fat TL(mm)
121BL/6 control 913 119 299 197 117 406 16.7
122BL/6 control 1149 78 330 218 107 329 17.1
123BL/6 control 953 151 146 178 93 258 16.5
702BL/6 control 1198 86 267 192 97 16.6
124BL/6 control 964 97 394 199 113 334 16.4
average 1035.4 106.2 287.2 196.8 105.4 331.8 16.7
stdev 128.7 29.4 91.8 14.4 10.2 60.5 0.3
se 57.5 13.2 41.1 6.4 4.6 30.2 0.1
3051BL/6 PDTC 1548 114 535 230 133 501 17.5
3086BL/6 PDTC 1215 88 415 208 115 391 17.1
3052BL/6 PDTC 1442 94 528 215 128 425 17.4
3085BL/6 PDTC 1149 73 275 193 104 349 17
3048BL/6 PDTC 1113 73 393 184 119 366 17
average 1293.4 88.4 429.2 206.0 119.8 406.4 17.2
stdev 191.3 17.0 107.5 18.1 11.3 60.1 0.2
se 85.57 7.62 48.09 8.11 5.07 26.89 0.10
3050Min control 1072 219 203 198 96 233 16.6
2537Min control 1338 427 0 177 91 230 16.7
684Min control 1512 642 0 126 107 228 16
2916Min control 1439 397 0 174 110 276 17
2974Min control 1327 436 0 169 101 227 16.7
average 1337.6 424.2 40.6 168.8 101.0 238.8 16.6
stdev 166.8 150.4 90.8 26.4 7.8 20.9 0.4
se 74.62 67.24 40.60 11.79 3.48 9.36 0.16
5Min PDTC 2058 662 157 102 125 337 16.7
8Min PDTC 1999 678 336 167 145 162 16.5
598Min PDTC 1594 674 34 131 156 317 17
611Min PDTC 1905 604 106 185 127 308 17
610Min PDTC 1879 701 92 156 151 248 16.8
658Min PDTC 1718 648 86 158 111 326 17.1
average 1858.8 661.2 135.2 149.8 135.8 283.0 16.9
stdev 174.3 33.1 106.0 29.3 17.5 67.0 0.2
se 71.14 13.51 43.27 11.94 7.15 27.33 0.09

304
-bg Norm P:total
PSTAT BL-6 122.175 4.10 0.84 0.93
BL-6 124.971 6.90 1.41 1.37
BL-6 121.719 3.64 0.75 0.70
BL-6+PDTC 122.086 4.01 0.82 0.55
BL-6+PDTC 119.768 1.69 0.35 0.38
BL-6+PDTC 120.602 2.53 0.52 0.35
Min 126.097 8.02 1.64 1.81
Min 138.388 20.31 4.16 4.48
Min 130.061 11.99 2.46 2.81
Min 132.059 13.98 2.87 3.62
Min+PDTC 124.047 5.97 1.22 1.50
Min+PDTC 121.018 2.94 0.60 0.93
Min+PDTC 120.17 2.09 0.43 0.37
Min+PDTC 123.541 5.47 1.12 1.20
Total STAT3 BL-6 99.748 13.17 0.91
BL-6 101.56 14.98 1.03
BL-6 102.049 15.47 1.06
BL-6+PDTC 108.306 21.73 1.49
BL-6+PDTC 99.896 13.32 0.92
BL-6+PDTC 108.04 21.46 1.48
Min 99.766 13.19 0.91
Min 100.087 13.51 0.93
Min 99.294 12.72 0.87
Min 98.102 11.52 0.79
Min+PDTC 98.449 11.87 0.82
Min+PDTC 95.963 9.39 0.65
Min+PDTC 103.23 16.65 1.15
Min+PDTC 100.157 13.58 0.93

305
-bg norm phos:total norm
PAMPK BL-6 109.007 0.80 0.40 0.54 0.57
BL-6 109.844 1.64 0.82 0.73 0.77
BL-6 111.739 3.53 1.77 1.58 1.67
BL-6+PDTC 109.45 1.24 0.63 0.36 0.38
BL-6+PDTC 116.723 8.52 4.28 6.78 7.14
BL-6+PDTC 114.074 5.87 2.95 2.79 2.94
Min 129.468 21.26 10.68 8.84 9.32
Min 134.588 26.38 13.25 12.08 12.72
Min 145.193 36.99 18.58 11.83 12.46
Min 123.8 15.59 7.83 6.88 7.25
Min+PDTC 110.257 2.05 1.03 1.36 1.44
Min+PDTC 111.118 2.91 1.46 0.98 1.03
Min+PDTC 108.824 0.62 0.31 0.29 0.30
Min+PDTC 108.803 0.60 0.30 0.24 0.25
TAMPK BL-6 84.106 5.84 0.75
BL-6 87.074 8.81 1.13
BL-6 87.022 8.76 1.12
BL-6+PDTC 91.923 13.66 1.75
BL-6+PDTC 83.187 4.92 0.63
BL-6+PDTC 86.504 8.24 1.06
Min 87.686 9.42 1.21
Min 86.824 8.56 1.10
Min 90.514 12.25 1.57
Min 87.142 8.88 1.14
Min+PDTC 84.161 5.89 0.76
Min+PDTC 89.948 11.68 1.50
Min+PDTC 86.671 8.40 1.08
Min+PDTC 87.957 9.69 1.24

306
-bg norm
Atrogin BL-6 150.773 18.57 1.21
BL-6 152.718 20.52 1.33
BL-6 139.281 7.08 0.46
BL-6+PDTC 139.151 6.95 0.45
BL-6+PDTC 140.18 7.98 0.52
BL-6+PDTC 144.672 12.47 0.81
Min 160.432 28.23 1.83
Min 165.272 33.07 2.15
Min 163.25 31.05 2.02
Min 155.108 22.91 1.49
Min+PDTC 144.834 12.64 0.82
Min+PDTC 152.346 20.15 1.31
Min+PDTC 141.968 9.77 0.63
Min+PDTC 133.642 1.44 0.09
-bg Norm
puromycin BL-6 133.59 67.748 0.797733
BL-6 149.425 83.583 0.98419
BL-6 169.288 103.446 1.218077
BL-6+PDTC 176.093 110.251 1.298206
BL-6+PDTC 179.97 114.128 1.343858
BL-6+PDTC 175.439 109.597 1.290505
Min 87.5 21.658 0.255023
Min 107.642 41.8 0.492195
Min 106.985 41.143 0.484459
Min 101.962 36.12 0.425313
Min+PDTC 115.336 49.494 0.582792
Min+PDTC 152.724 86.882 1.023036
Min+PDTC 147.7 81.858 0.963878
Min+PDTC 151.67 85.828 1.010625
Mean SEM
BL-6 1.00 0.27
BL-6+PDTC 0.59 0.11
Min 1.87 0.14
Min+PDTC 0.71 0.25
Mean SEM
BL-6 1.00 0.12
BL-6+PDTC 1.31 0.02
Min 0.41 0.06
Min+PDTC 0.90 0.10

307
Normalized
MFN BL-6 152.26 1.01
BL-6 150.27 0.99
BL-6 151.83 1.00
BL-6+PDTC 137.70 0.91
BL-6+PDTC 165.84 1.09
BL-6+PDTC 183.64 1.21
Min 146.35 0.97
Min 129.52 0.86
Min 130.29 0.86
Min+PDTC 159.89 1.06
Min+PDTC 180.88 1.19
Min+PDTC 174.37 1.15
FIS BL-6 59.35 0.94
BL-6 61.72 0.98
BL-6 68.69 1.09
BL-6+PDTC 68.11 1.08
BL-6+PDTC 66.83 1.06
BL-6+PDTC 71.96 1.14
Min 69.63 1.10
Min 74.51 1.18
Min 73.46 1.16
Min+PDTC 73.21 1.16
Min+PDTC 71.14 1.12
Min+PDTC 68.37 1.08
CytoC BL-6 189.13 0.95
BL-6 205.99 1.04
BL-6 201.25 1.01
BL-6+PDTC 205.73 1.03
BL-6+PDTC 197.90 1.00
BL-6+PDTC 183.23 0.92
Min 127.00 0.64
Min 154.23 0.78
Min 128.37 0.65
Min+PDTC 185.33 0.93
Min+PDTC 199.57 1.00
Min+PDTC 196.84 0.99
Mean SEM
BL-6 1.00 0.04
BL-6+PDTC 1.09 0.02
Min 1.15 0.02
Min+PDTC 1.12 0.02
Mean SEM
BL-6 1.00 0.00
BL-6+PDTC 1.07 0.09
Min 0.89 0.04
Min+PDTC 1.13 0.04
Mean SEM
BL-6 1.00 0.03
BL-6+PDTC 0.98 0.03
Min 0.69 0.04
Min+PDTC 0.98 0.02

308
Mouse# Geno Treatment 8wk BW Pre BW Post BW Sac-tumor BW change
110 BL/6 + LLC Control 20.6 23.5 28.1 21.583 4.8
3143 BL/6 + LLC Control 22.1 22.9 22.4 20.337 -8.0
3138 BL/6 + LLC Control 23.1 24.7 26 22.455 -2.8
3142 BL/6 + LLC Control 21.4 20.1 17.1 16.14 -24.6
avg 21.8 22.8 23.4 20.1 -7.6
stdev 1.1 1.9 4.8 2.8 12.4
n 4.0 4.0 4.0 4.0 4.0
se 0.5 1.0 2.4 1.4 6.2
Mouse# Geno Treatment 8wk BW Pre BW Post BW Sac-tumor BWchange
108 BL/6 + LLC PDTC 21.6 22.8 27.9 22.75 5.3
3103 BL/6 + LLC PDTC 21.2 23.2 23.6 22.259 5.0
3104 BL/6 + LLC PDTC 24.3 24.5 24.4 23.58 -3.0
3110 BL/6 + LLC PDTC 20.8 21.0 21.7 19.957 -4.1
avg 22.0 22.9 24.4 22.1 0.8
stdev 1.6 1.4 2.6 1.6 5.0
n 4.0 4.0 4.0 4.0 4.0
se 0.8 0.7 1.3 0.8 2.5
Mouse# Geno Treatment 8wk BW Pre BW Post BW Sac-tumor BWchange
105 BL/6 + LLC IL-6rAb 24.9 26.2 27.2 24.115 -3.2
109 BL/6 + LLC IL-6rAb 22.1 24.6 27.8 22.082 -0.1
3149 BL/6 + LLC IL-6rAb 23.8 24.9 26.2 24.15 1.5
3148 BL/6 + LLC IL-6rAb 24.7 25.9 23.6 22.115 -10.5
avg 23.9 25.4 26.2 23.1 -3.1
stdev 1.3 0.8 1.9 1.2 5.3
n 4.0 4.0 4.0 4.0 4.0
se 0.6 0.4 0.9 0.6 2.6
0.523
Mouse# Geno Treatment 8wk BW Pre BW Post BW Sac-tumor BWchange
116fc BL/6 + LLC sgp130Fc 22.2 23.7 21.8 20.655 -7.0
166fc BL/6 + LLC sgp130Fc 22.4 24.6 23.8 20.389 -9.0
167fc BL/6 + LLC sgp130Fc 21.9 23.1 24.4 21.43 -2.1
118fc BL/6 + LLC sgp130Fc 21.5 23.4 23 21.174 -1.5
120fc BL/6 + LLC sgp130Fc 22.9 26.3 27.3 23.674 3.4
avg 22.2 24.2 24.1 21.5 -3.2
stdev 0.5 1.3 2.1 1.3 4.9
n 5.0 5.0 5.0 5.0 5.0
se 0.2 0.6 0.9 0.6 2.2
Mouse# Geno Treatment 8wk BW Pre BW Post BW Sac-tumor BWchange
3175 BL/6 + LLC LLL12 25.2 26.1 25.8 21.709 -13.9
3182 BL/6 + LLC LLL12 22 23.7 22.6 22.267 1.2
3185 BL/6 + LLC LLL12 23.9 23.2 22.3 21.229 -11.2
3184 BL/6 + LLC LLL12 23.9 23.9 23.5 21.329 -10.8
3183 BL/6 + LLC LLL12 23 25.1 21.8 21.148 -8.1
3176 BL/6 + LLC LLL12 24.2 23.3 24 22.35 -7.6
avg 23.7 24.2 23.3 21.7 -8.4
stdev 1.1 1.1 1.5 0.5 5.2
n 6.0 6.0 6.0 6.0 6.0
se 0.4 0.5 0.6 0.2 2.1
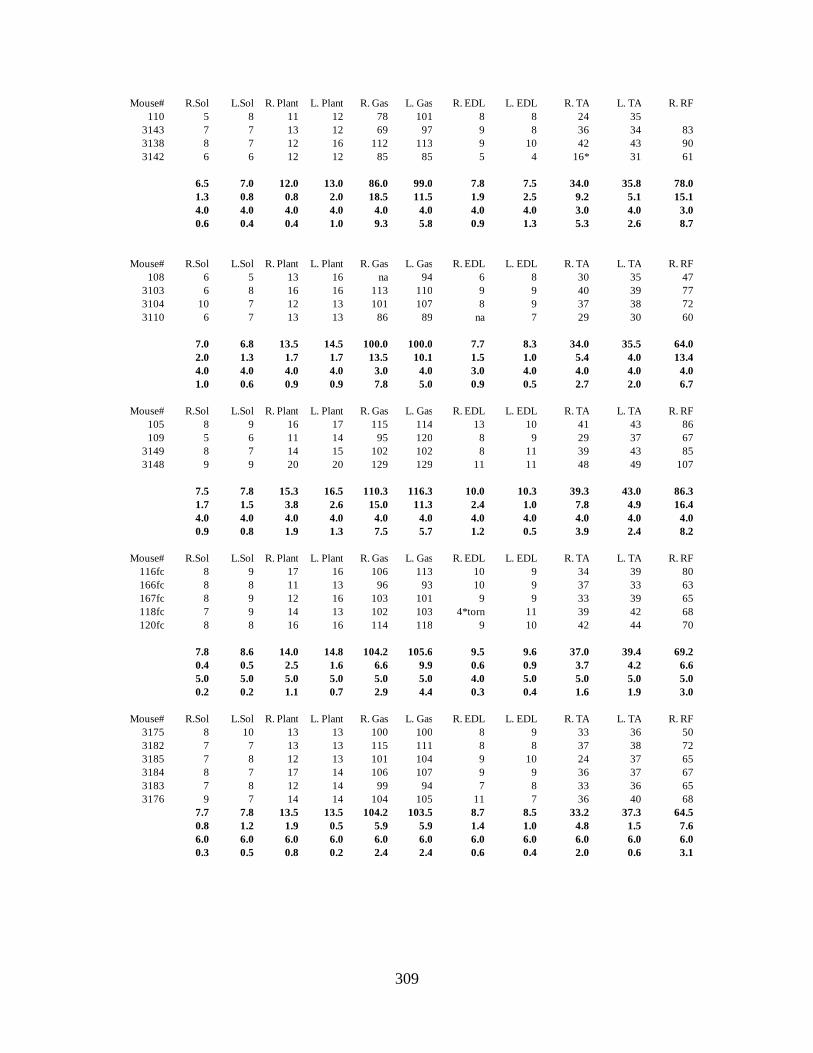
309
Mouse# R.Sol L.Sol R. Plant L. Plant R. Gas L. Gas R. EDL L. EDL R. TA L. TA R. RF
110 5 8 11 12 78 101 8 8 24 35
3143 7 7 13 12 69 97 9 8 36 34 83
3138 8 7 12 16 112 113 9 10 42 43 90
3142 6 6 12 12 85 85 5 4 16* 31 61
6.5 7.0 12.0 13.0 86.0 99.0 7.8 7.5 34.0 35.8 78.0
1.3 0.8 0.8 2.0 18.5 11.5 1.9 2.5 9.2 5.1 15.1
4.0 4.0 4.0 4.0 4.0 4.0 4.0 4.0 3.0 4.0 3.0
0.6 0.4 0.4 1.0 9.3 5.8 0.9 1.3 5.3 2.6 8.7
Mouse# R.Sol L.Sol R. Plant L. Plant R. Gas L. Gas R. EDL L. EDL R. TA L. TA R. RF
108 6 5 13 16 na 94 6 8 30 35 47
3103 6 8 16 16 113 110 9 9 40 39 77
3104 10 7 12 13 101 107 8 9 37 38 72
3110 6 7 13 13 86 89 na 7 29 30 60
7.0 6.8 13.5 14.5 100.0 100.0 7.7 8.3 34.0 35.5 64.0
2.0 1.3 1.7 1.7 13.5 10.1 1.5 1.0 5.4 4.0 13.4
4.0 4.0 4.0 4.0 3.0 4.0 3.0 4.0 4.0 4.0 4.0
1.0 0.6 0.9 0.9 7.8 5.0 0.9 0.5 2.7 2.0 6.7
Mouse# R.Sol L.Sol R. Plant L. Plant R. Gas L. Gas R. EDL L. EDL R. TA L. TA R. RF
105 8 9 16 17 115 114 13 10 41 43 86
109 5 6 11 14 95 120 8 9 29 37 67
3149 8 7 14 15 102 102 8 11 39 43 85
3148 9 9 20 20 129 129 11 11 48 49 107
7.5 7.8 15.3 16.5 110.3 116.3 10.0 10.3 39.3 43.0 86.3
1.7 1.5 3.8 2.6 15.0 11.3 2.4 1.0 7.8 4.9 16.4
4.0 4.0 4.0 4.0 4.0 4.0 4.0 4.0 4.0 4.0 4.0
0.9 0.8 1.9 1.3 7.5 5.7 1.2 0.5 3.9 2.4 8.2
Mouse# R.Sol L.Sol R. Plant L. Plant R. Gas L. Gas R. EDL L. EDL R. TA L. TA R. RF
116fc 8 9 17 16 106 113 10 9 34 39 80
166fc 8 8 11 13 96 93 10 9 37 33 63
167fc 8 9 12 16 103 101 9 9 33 39 65
118fc 7 9 14 13 102 103 4*torn 11 39 42 68
120fc 8 8 16 16 114 118 9 10 42 44 70
7.8 8.6 14.0 14.8 104.2 105.6 9.5 9.6 37.0 39.4 69.2
0.4 0.5 2.5 1.6 6.6 9.9 0.6 0.9 3.7 4.2 6.6
5.0 5.0 5.0 5.0 5.0 5.0 4.0 5.0 5.0 5.0 5.0
0.2 0.2 1.1 0.7 2.9 4.4 0.3 0.4 1.6 1.9 3.0
Mouse# R.Sol L.Sol R. Plant L. Plant R. Gas L. Gas R. EDL L. EDL R. TA L. TA R. RF
3175 8 10 13 13 100 100 8 9 33 36 50
3182 7 7 13 13 115 111 8 8 37 38 72
3185 7 8 12 13 101 104 9 10 24 37 65
3184 8 7 17 14 106 107 9 9 36 37 67
3183 7 8 12 14 99 94 7 8 33 36 65
3176 9 7 14 14 104 105 11 7 36 40 68
7.7 7.8 13.5 13.5 104.2 103.5 8.7 8.5 33.2 37.3 64.5
0.8 1.2 1.9 0.5 5.9 5.9 1.4 1.0 4.8 1.5 7.6
6.0 6.0 6.0 6.0 6.0 6.0 6.0 6.0 6.0 6.0 6.0
0.3 0.5 0.8 0.2 2.4 2.4 0.6 0.4 2.0 0.6 3.1

310
Mouse# Liver Spleen Epi Fat Testes Heart tumor (g) Mes Fat TL(mm)
110 1300 286 83 171 92 6.517 191 16.4
3143 1135 376 122 172 93 2.063 232 16.4
3138 1395 364 149 201 101 3.545 266 16.6
3142 902 564 88 171 103 0.96 190 16.2
1183.0 397.5 110.5 178.8 97.3 3.3 219.8 16.4
215.9 118.0 31.0 14.8 5.6 2.4 36.5 0.2
4.0 4.0 4.0 4.0 4.0 4.0 4.0 4.0
108.0 59.0 15.5 7.4 2.8 1.2 18.3 0.1
Mouse# Liver Spleen Epi Fat Testes Heart tumor Mes Fat TL(mm)
108 1667 255 141 160 98 5.15 254 16.5
3103 1436 183 302 175 97 1.341 331 16.4
3104 1301 577 127 185 144 0.82 315 16.6
3110 1259 403 91 155 102 1.743 216 16.3
1415.8 354.5 165.3 168.8 110.3 2.3 279.0 16.5
183.7 174.3 93.6 13.8 22.6 2.0 53.5 0.1
4.0 4.0 4.0 4.0 4.0 4.0 4.0 4.0
91.9 87.2 46.8 6.9 11.3 1.0 26.8 0.1
Mouse# Liver Spleen Epi Fat Testes Heart tumor Mes Fat TL(mm)
105 1371 243 217 181 116 3.085 331 16.5
109 1258 240 69 190 89 5.718 210 16.6
3149 1093 479 112 167 109 2.05 285 16.6
3148 1169 147 266 186 104 1.485 349 16.8
1222.8 277.3 166.0 181.0 104.5 3.1 293.8 16.6
119.6 141.7 91.2 10.0 11.4 1.9 62.0 0.1
4.0 4.0 4.0 4.0 4.0 4.0 4.0 4.0
59.8 70.8 45.6 5.0 5.7 0.9 31.0 0.1
(g)
Mouse# Liver Spleen Epi Fat Testes Heart tumor Mes Fat TL(mm)
116fc 1068 296 190 185 97 1.145 278 16.3
166fc 1228 307 74 180 101 3.411 289 16.7
167fc 1266 434 116 177 109 2.97 290 16.4
118fc 1123 372 90 151 102 1.826 267 16.6
120fc 1267 268 274 92 91 3.626 291 16.7
1190.4 335.4 148.8 157.0 100.0 2.6 283.0 16.5
90.2 67.0 82.9 38.6 6.6 1.1 10.4 0.2
5.0 5.0 5.0 5.0 5.0 5.0 5.0 5.0
40.3 30.0 37.1 17.3 3.0 0.5 4.6 0.1
Mouse# Liver Spleen Epi Fat Testes Heart tumor Mes Fat TL(mm)
3175 1194 275 45 186 114 4.091 243 16.6
3182 1195 282 221 203 99 0.333 295 16.7
3185 1107 262 125 201 100 1.071 283 16.5
3184 1102 328 77 194 113 2.171 271 16.6
3183 1160 355 22 175 106 0.652 253 16.9
3176 1214 456 85 191 108 1.65 268 16.8
1162.0 326.3 95.8 191.7 106.7 1.7 268.8 16.7
47.8 72.6 70.7 10.3 6.3 1.4 19.0 0.1
6.0 6.0 6.0 6.0 6.0 6.0 6.0 6.0
19.5 29.7 28.9 4.2 2.6 0.6 7.8 0.1

311
Mouse Genotype treatment Pre BW BW at Sac BW-tumor % change BW
% change from
control
988 BL/6 13wk control 20.9 23.6 23.6 13%
989 BL/6 13wk control 24.6 26.3 26.3 7%
990 BL/6 13wk control 23.4 25.3 25.3 8%
991 BL/6 13wk control 23.1 25.1 25.1 9%
992 BL/6 13wk control 24.4 25.7 25.7 5%
Average 23.3 25.2 25.2 8.4%
SE 0.7 0.4 0.4 1.3%
2518 skm-gp130 13wk control 25.6 26.7 26.7 4%
2524 skm-gp130 13wk control 26.2 28 28 7%
2574 skm-gp130 13wk control 24.5 27.5 27.5 12%
2575 skm-gp130 13wk control 23.9 26.1 26.1 9%
2598 skm-gp130 13wk control 25.7 27.8 27.8 8%
Average 25.2 27.2 27.2 8.2%
SE 0.4 0.4 0.4 1.3%
1794 BL/6 LLC 17.4 23.3 21.8 25% -14%
1 BL/6 LLC 23.2 28.7 22.7 -2% -10%
2792 BL/6 LLC 22.1 22.5 22.2 1% -12%
2791 BL/6 LLC 23.8 26.5 24.7 4% -2%
1793 BL/6 LLC 18.6 23.7 21.1 13% -16%
1792 BL/6 LLC 19.1 21.8 21.6 13.0% -14%
Average 20.7 24.4 22.4 9.0% -11.3%
SE 1.1 1.1 0.5 4.1% 2.1%
2669 skm-gp130 LLC 22.1 26 23.5 6% -14%
2634 skm-gp130 LLC 25.6 29.7 26.3 3% -3%
2635 skm-gp130 LLC 24.5 25.4 24.2 -1% -11%
2636 skm-gp130 LLC 26.2 27.6 25.3 -4% -7%
9715 skm-gp130 LLC 23.3 26.5 23.7 2% -13%
9716 skm-gp130 LLC 24.2 29.7 27.6 14% 1%
Average 24.3 27.5 25.1 3.3% -7.8%
SE 0.6 0.8 0.7 2.5% 2.4%
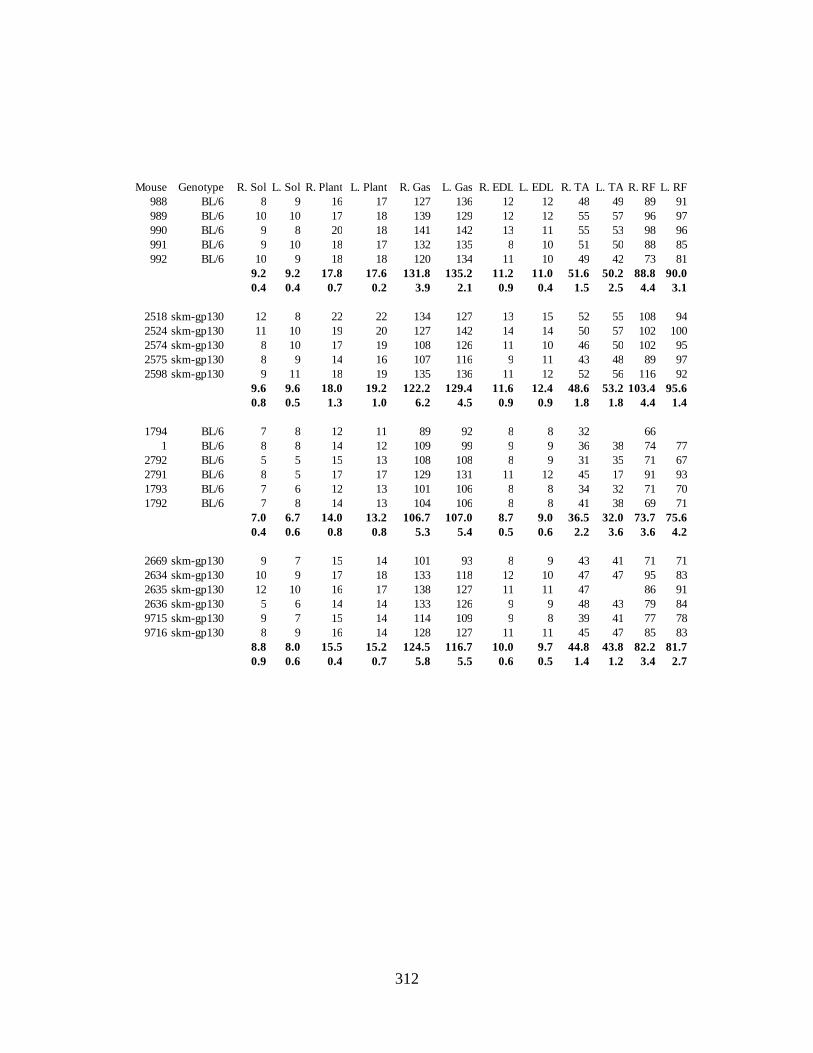
312
Mouse Genotype R. Sol L. Sol R. Plant L. Plant R. Gas L. Gas R. EDL L. EDL R. TA L. TA R. RF L. RF
988 BL/6 8 9 16 17 127 136 12 12 48 49 89 91
989 BL/6 10 10 17 18 139 129 12 12 55 57 96 97
990 BL/6 9 8 20 18 141 142 13 11 55 53 98 96
991 BL/6 9 10 18 17 132 135 8 10 51 50 88 85
992 BL/6 10 9 18 18 120 134 11 10 49 42 73 81
9.2 9.2 17.8 17.6 131.8 135.2 11.2 11.0 51.6 50.2 88.8 90.0
0.4 0.4 0.7 0.2 3.9 2.1 0.9 0.4 1.5 2.5 4.4 3.1
2518 skm-gp130 12 8 22 22 134 127 13 15 52 55 108 94
2524 skm-gp130 11 10 19 20 127 142 14 14 50 57 102 100
2574 skm-gp130 8 10 17 19 108 126 11 10 46 50 102 95
2575 skm-gp130 8 9 14 16 107 116 9 11 43 48 89 97
2598 skm-gp130 9 11 18 19 135 136 11 12 52 56 116 92
9.6 9.6 18.0 19.2 122.2 129.4 11.6 12.4 48.6 53.2 103.4 95.6
0.8 0.5 1.3 1.0 6.2 4.5 0.9 0.9 1.8 1.8 4.4 1.4
1794 BL/6 7 8 12 11 89 92 8 8 32 66
1 BL/6 8 8 14 12 109 99 9 9 36 38 74 77
2792 BL/6 5 5 15 13 108 108 8 9 31 35 71 67
2791 BL/6 8 5 17 17 129 131 11 12 45 17 91 93
1793 BL/6 7 6 12 13 101 106 8 8 34 32 71 70
1792 BL/6 7 8 14 13 104 106 8 8 41 38 69 71
7.0 6.7 14.0 13.2 106.7 107.0 8.7 9.0 36.5 32.0 73.7 75.6
0.4 0.6 0.8 0.8 5.3 5.4 0.5 0.6 2.2 3.6 3.6 4.2
2669 skm-gp130 9 7 15 14 101 93 8 9 43 41 71 71
2634 skm-gp130 10 9 17 18 133 118 12 10 47 47 95 83
2635 skm-gp130 12 10 16 17 138 127 11 11 47 86 91
2636 skm-gp130 5 6 14 14 133 126 9 9 48 43 79 84
9715 skm-gp130 9 7 15 14 114 109 9 8 39 41 77 78
9716 skm-gp130 8 9 16 14 128 127 11 11 45 47 85 83
8.8 8.0 15.5 15.2 124.5 116.7 10.0 9.7 44.8 43.8 82.2 81.7
0.9 0.6 0.4 0.7 5.8 5.5 0.6 0.5 1.4 1.2 3.4 2.7
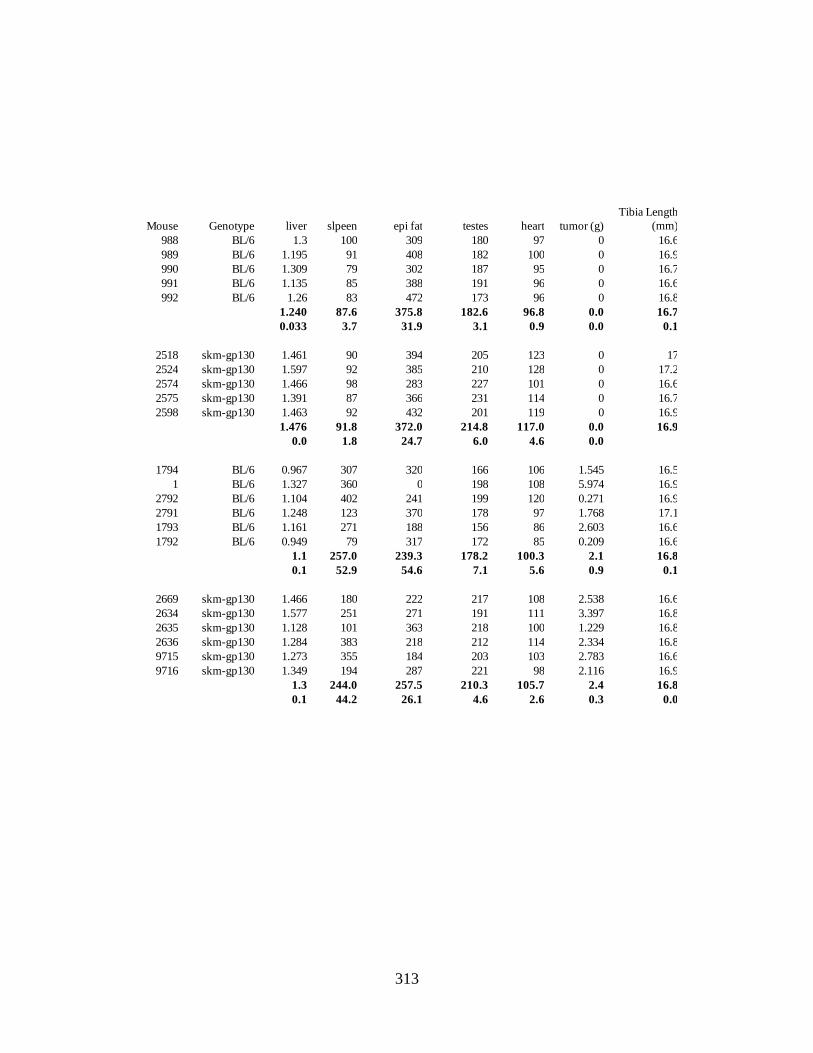
313
Mouse Genotype liver slpeen epi fat testes heart tumor (g)
Tibia Length
(mm)
988 BL/6 1.3 100 309 180 97 0 16.6
989 BL/6 1.195 91 408 182 100 0 16.9
990 BL/6 1.309 79 302 187 95 0 16.7
991 BL/6 1.135 85 388 191 96 0 16.6
992 BL/6 1.26 83 472 173 96 0 16.8
1.240 87.6 375.8 182.6 96.8 0.0 16.7
0.033 3.7 31.9 3.1 0.9 0.0 0.1
2518 skm-gp130 1.461 90 394 205 123 0 17
2524 skm-gp130 1.597 92 385 210 128 0 17.2
2574 skm-gp130 1.466 98 283 227 101 0 16.6
2575 skm-gp130 1.391 87 366 231 114 0 16.7
2598 skm-gp130 1.463 92 432 201 119 0 16.9
1.476 91.8 372.0 214.8 117.0 0.0 16.9
0.0 1.8 24.7 6.0 4.6 0.0
1794 BL/6 0.967 307 320 166 106 1.545 16.5
1 BL/6 1.327 360 0 198 108 5.974 16.9
2792 BL/6 1.104 402 241 199 120 0.271 16.9
2791 BL/6 1.248 123 370 178 97 1.768 17.1
1793 BL/6 1.161 271 188 156 86 2.603 16.6
1792 BL/6 0.949 79 317 172 85 0.209 16.6
1.1 257.0 239.3 178.2 100.3 2.1 16.8
0.1 52.9 54.6 7.1 5.6 0.9 0.1
2669 skm-gp130 1.466 180 222 217 108 2.538 16.6
2634 skm-gp130 1.577 251 271 191 111 3.397 16.8
2635 skm-gp130 1.128 101 363 218 100 1.229 16.8
2636 skm-gp130 1.284 383 218 212 114 2.334 16.8
9715 skm-gp130 1.273 355 184 203 103 2.783 16.6
9716 skm-gp130 1.349 194 287 221 98 2.116 16.9
1.3 244.0 257.5 210.3 105.7 2.4 16.8
0.1 44.2 26.1 4.6 2.6 0.3 0.0

314
Sample IGF-1 GAPDH dct ddct 2^ddct normalized
988 22.04 23.01 -0.62 -0.28 0.83 0.80
989 22.78 22.57 0.21 0.56 1.47 1.43
990 21.56 22.15 -0.59 -0.24 0.84 0.82
991 22.00 22.15 -0.15 0.20 1.15 1.12
992 21.48 22.06 -0.58 -0.23 0.85 0.83
1794 21.90 22.91 -1.02 -0.67 0.63 0.61
2792 21.62 22.59 -0.97 -0.62 0.65 0.63
2791 21.86 22.62 -0.77 -0.42 0.75 0.73
1793 21.55 22.72 -1.18 -0.83 0.56 0.55
1792 21.23 21.85 -0.97 -0.63 0.65 0.63
2518 23.17 23.04 0.13 0.48 1.39 1.35
2524 23.26 22.94 0.32 0.67 1.59 1.55
2574 22.25 22.35 -0.10 0.25 1.19 1.15
2575 22.23 23.07 -0.84 -0.50 0.71 0.69
2598 22.75 22.43 0.31 0.66 1.58 1.54
2669 22.07 23.71 -1.64 -1.30 0.41 0.40
2634 22.48 22.74 -0.26 0.09 1.06 1.03
2635 22.51 23.38 -0.87 -0.52 0.70 0.68
2636 22.18 23.02 -0.84 -0.50 0.71 0.69
9715 22.24 22.75 -0.50 -0.16 0.90 0.87
9716 22.21 22.56 -0.34 0.00 1.00 0.97
IGF-1 Mean sem
BL-6 1.00 0.12
LLC 0.63 0.03
skm-gp130 1.26 0.16
skm-gp130+LLC 0.77 0.10

315
Sample IL-6 18S dCT dddct 2^ddct Normalized
988 35.62 16.34 19.28 0.47 1.38 1.32
989 34.64 15.65 18.99 0.18 1.13 1.08
990 34.44 16.31 18.14 -0.67 0.63 0.60
991 34.64 16.22 18.43 -0.38 0.77 0.73
992 35.07 15.85 19.22 0.41 1.33 1.27
1974 34.54 15.71 18.83 0.02 1.02 0.97
2792 34.30 15.59 18.72 -0.09 0.94 0.90
2791 34.51 14.02 20.49 1.68 3.21 3.06
1793 33.26 14.45 18.82 0.01 1.00 0.96
1792 34.72 14.53 20.19 1.38 2.61 2.49
2518 34.93 14.93 20.00 1.19 2.28 2.18
2524 34.94 17.10 17.84 -0.97 0.51 0.49
2474 34.47 14.06 20.41 1.60 3.03 2.89
2575 34.52 14.68 19.84 1.03 2.04 1.95
2598 35.01 14.46 20.56 1.75 3.36 3.20
2669 33.39 15.73 17.67 -1.14 0.45 0.43
2634 33.45 15.39 18.06 -0.75 0.60 0.57
2635 34.43 15.59 18.85 0.04 1.03 0.98
2636 35.59 17.48 18.11 -0.70 0.61 0.59
9715 33.29 16.27 17.03 -1.78 0.29 0.28
9716 34.55 15.08 19.47 0.66 1.58 1.51
IL-6 mean sem
bl-6 1.00 0.14
bl-6+llc 1.68 0.46
skmgp130 0.73 0.18
skmgp130+llc 2.14 0.47

316
Sample REDD1 GAPDH dct ddct 2^ddct Normalizezd
9716 15.46 19.12 -3.66 1.212 2.317 2.299
9715 15.26 18.68 -3.42 1.452 2.736 2.715
2636 14.405 18.775 -4.37 0.502 1.416 1.405
2635 14.53 19.09 -4.56 0.312 1.241 1.232
2634 13.215 18.42 -5.205 -0.333 0.794 0.788
2669 14.575 19.27 -4.695 0.177 1.131 1.122
1792 14.055 18.545 -4.49 0.382 1.303 1.293
1793 14.05 18.665 -4.615 0.257 1.195 1.186
2792 13.915 18.745 -4.83 0.042 1.030 1.022
2791 14.085 18.11 -4.025 0.847 1.799 1.785
1 15.92 18.97 -3.05 1.822 3.536 3.509
2598 9.345 17.945 -8.6 -3.728 0.075 0.075
2575 12.955 18.54 -5.585 -0.713 0.610 0.605
2574 12.665 18.42 -5.755 -0.883 0.542 0.538
2524 11.75 18.225 -6.475 -1.603 0.329 0.327
2518 10.5 18 -7.5 -2.628 0.162 0.161
991 12.945 17.845 -4.9 -0.028 0.981 0.973
992 12.725 17.595 -4.87 0.002 1.001 0.994
990 12.855 17.585 -4.73 0.142 1.103 1.095
989 12.865 18.055 -5.19 -0.318 0.802 0.796
988 14.025 18.695 -4.67 0.202 1.150 1.142
REDD1 Mean SEM
BL-6 1.00 0.06
BL-6+LLC 1.76 0.46
skm-gp130 0.34 0.10
skm-gp130+LLC 1.59 0.31

317
Sample gp130 GAPDH dCT ddct 2^ddct
normalized
to gas
sol 30.76 17.87 12.89 -0.65 0.64 0.53
sol 30.8 17.99 12.81 -0.73 0.60 0.50
sol 30.42 17.88 12.54 -1.01 0.50 0.41
sol 29.96 17.14 12.82 -0.72 0.60 0.50
gas 29.96 15.85 14.11 0.57 1.48 1.23
gas 30.04 16.54 13.5 -0.04 0.97 0.80
gas 28.47 15.84 12.63 -0.91 0.53 0.88
gas 29.65 15.71 13.94 0.40 1.31 1.09
TA 31.15 16.5 14.65 0.86 1.81 1.66
TA 31.36 16.77 14.59 0.80 1.74 1.71
TA 31.09 16.62 14.47 0.68 1.60 1.57
TA 32.74 17.25 15.49 1.70 3.24 3.19
heart 28.72 17.06 11.66 -1.89 0.27 0.22
heart 28.59 17.57 11.02 -2.53 0.17 0.14
heart 31.41 18.47 12.94 -0.60 0.66 0.55
heart 28.45 17.33 11.12 -2.43 0.19 0.15
kid 28.22 18 10.22 -3.33 0.10 0.08
kid 26.66 16.99 9.67 -3.88 0.07 0.06
kid 26.56 16.97 9.59 -3.96 0.06 0.05
kid 27.16 17.39 9.77 -3.78 0.07 0.06
liver 29.23 19.29 9.94 -3.61 0.08 0.07
liver 28.74 18.53 10.21 -3.34 0.10 0.08
liver 30.26 19.01 11.25 -2.30 0.20 0.17
gp130 Mean SD SEM
sol 0.48 0.05 0.02
gas 1.00 0.19 0.10
TA 2.04 0.77 0.39
heart 0.27 0.19 0.09
kidney 0.06 0.01 0.01
liver 0.11 0.05 0.03

318
Plasma IL-6
Standard Abs1 Abs2 average stdev CV -bg
0 0.0992 0.1006 0.0999 0.00099 1% 0
7.8 0.112 0.116 0.114 0.002828 2% 0.0141
15.6 0.1404 0.1416 0.141 0.000849 1% 0.0411
31.2 0.1916 0.183 0.1873 0.006081 3% 0.0874
62.5 0.2888 0.2696 0.2792 0.013576 5% 0.1793
125 0.4614 0.4546 0.458 0.004808 1% 0.3581
250 0.8858 0.8652 0.8755 0.014566 2% 0.7756
500 1.4506 1.4864 1.4685 0.025314 2% 1.3686
Chromag
en Blank 0.0898 0.0926 0.0912 0.00198 2% -0.0087
LC 0.1544 0.1468 0.1506 0.005374 4% 0.0507
HC 0.8202 0.7472 0.7837 0.051619 7% 0.6838
Sample Abs1 Abs2 average stdev CV -bg
Concentr
ation
positive
con 0.246 0.243 0.244 0.00 0.01 0.14 48.32 96.64
988 0.121 0.115 0.118 0.00 0.03 0.02 3.11 6.21
989 0.112 0.099 0.106 0.01 0.09 0.01 -1.25 0
990 0.120 0.116 0.118 0.00 0.02 0.02 3.18 6.36
991 0.113 0.105 0.109 0.01 0.05 0.01 0.00 0.00
992 0.102 0.105 0.104 0.00 0.02 0.00 -2.00 0
2518 0.117 0.114 0.115 0.00 0.02 0.02 2.18 4.36
2524 0.107 0.103 0.105 0.00 0.03 0.01 -1.39 0
2574 0.110 0.103 0.107 0.01 0.05 0.01 -0.89 0
2575 0.106 0.106 0.01 -1.04 0
2598 0.102 0.102 0.00 -2.61 01
1794 0.147 0.146 0.146 0.00 0.01 0.05 13.32 26.64
1793 0.109 0.108 0.109 0.00 0.01 0.01 -0.18 0
1792 0.105 0.106 0.106 0.00 0.00 0.01 -1.29 0
2792 0.280 0.265 0.273 0.01 0.04 0.17 58.36 116.71
2791 0.115 0.120 0.118 0.00 0.03 0.02 3.00 6.00
2669 0.117 0.119 0.118 0.00 0.01 0.02 3.32 6.64
2634 0.204 0.202 0.203 0.00 0.01 0.10 33.64 67.29
2635 0.120 0.109 0.115 0.01 0.07 0.01 1.93 3.86
2636 0.116 0.113 0.115 0.00 0.02 0.01 1.96 3.93
9715 0.120 0.122 0.121 0.00 0.01 0.02 4.21 8.43
9716 0.124 0.123 0.124 0.00 0.01 0.02 5.18 10.36

319
STAT3 Phos total P:total norm Mean SEM
B6 85.63 43.36 1.98 0.81 BL-6 1.00 0.10
B6 90.11 34.29 2.63 1.08 LLC 1.55 0.29
B6 111.23 41.04 2.71 1.11 LLC+LLL12 0.87 0.15
LLC 133.57 37.57 3.56 1.46
LLC 226.58 55.51 4.08 1.67
LLC 164.07 29.82 5.50 2.26
LLC 95.29 47.18 2.02 0.83
LLC+LLL12 74.67 51.21 1.46 0.60
LLC+LLL12 84.31 51.87 1.63 0.67
LLC+LLL12 88.56 25.11 3.53 1.45
LLC+LLL12 100.60 52.41 1.92 0.79
LLC+LLL12 80.55 37.75 2.13 0.88
AMPK Phos total P:total norm Mean SEM
B6 22.67 36.88 0.61 1.33 BL-6 1.00 0.17
B6 13.47 38.81 0.35 0.75 LLC 1.30 0.15
B6 20.32 47.67 0.43 0.92 LLC+LLL12 0.23 0.09
LLC 34.94 43.55 0.80 1.73
LLC 24.85 47.15 0.53 1.14
LLC 35.12 60.24 0.58 1.26
LLC 26.25 52.97 0.50 1.07
LLC+LLL12 13.01 50.86 0.26 0.55
LLC+LLL12 1.83 37.80 0.05 0.10
LLC+LLL12 2.67 49.04 0.05 0.12
LLC+LLL12 6.03 51.72 0.12 0.25
LLC+LLL12 2.11 45.06 0.05 0.10
S6 Phos total P:total norm Mean SEM
B6 11.108 89.99 0.12 0.80 BL-6 1.00 0.12
B6 11.861 77.60 0.15 0.99 LLC 0.28 0.09
B6 16.785 89.44 0.19 1.21 LLC+LLL12 0.17 0.04
LLC 2.143 89.75 0.02 0.15
LLC 6.308 88.23 0.07 0.46
LLC 5.481 86.61 0.06 0.41
LLC 1.062 88.56 0.01 0.08
LLC+LLL12 4.4 84.84 0.05 0.34
LLC+LLL12 2.407 83.45 0.03 0.19
LLC+LLL12 1.142 83.00 0.01 0.09
LLC+LLL12 1.304 86.00 0.02 0.10

320
Atrogin -bg norm Mean SEM
B6 35.0 1.13 BL-6 1.00 0.16
B6 37.1 1.20 LLC 1.51 0.23
B6 21.0 0.68 LLC+LLL12 0.25 0.10
LLC 44.0 1.42
LLC 29.6 0.95
LLC 49.7 1.60
LLC 63.6 2.05
LLC+LLL12 18.4 0.59
LLC+LLL12 10.2 0.33
LLC+LLL12 2.8 0.09
LLC+LLL12 7.2 0.23
LLC+LLL13 0.5 0.02

321
FOXO3 -bg normtotal norm P:tot norm avg stdev se
BL-6 9424 195.156 18.84 0.71 0.89 0.80 0.81 BL-6 1.00 0.16 0.09
BL-6 9424 206.988 30.67 1.16 1.05 1.10 1.12
BL-6 9424 206.159 29.84 1.13 1.06 1.06 1.07
BL-6 + LLC 9424 206.237 29.92 1.13 0.98 1.15 1.16 BL-6 + LLC 1.08 0.11 0.06
BL-6 + LLC 9424 204.327 28.01 1.06 0.96 1.10 1.11
BL-6 + LLC 9424 202.545 26.22 0.99 1.05 0.94 0.95
skm-gp130 9424 200.594 24.27 0.92 1.13 0.81 0.82 fl/fl cre 0.73 0.17 0.10
skm-gp130 9424 200.014 23.69 0.90 1.09 0.82 0.83skm-gp130 9424 191.158 14.84 0.56 1.06 0.53 0.54Skm-gp130+ LLC 9424 196.553 20.23 0.77 0.57 1.34 1.35 fl/fl cre + LLC 1.09 0.24 0.12
Skm-gp130+ LLC 9424 203.569 27.25 1.03 1.04 0.99 1.00
Skm-gp130+ LLC 9424 201.924 25.60 0.97 0.82 1.18 1.19
Skm-gp130+ LLC 9424 191.985 15.66 0.59 0.75 0.79 0.80
p:total AMPK p:total p:total norm avg stdev se
BL-6 41.833 2.42 0.89 BL-6 1.00 0.22 0.13
BL-6 38.089 3.39 1.25
BL-6 35.117 2.32 0.86
BL-6 + LLC 38.759 11.26 4.16 BL-6 + LLC 3.79 0.76 0.44
BL-6 + LLC 37.623 12.60 4.66
BL-6 + LLC 29.526 8.96 3.31
skm-gp130 29.105 8.18 3.02 skm-gp130 1.07 1.23 0.71
skm-gp130 21.275 2.88 1.06
skm-gp130 19.097 2.00 0.74
skm-gp130 19.504 3.80 1.41 skm-gp130+LLC
2.71 0.61 0.35
skm-gp130 + LLC 17.477 8.28 3.06
skm-gp130 + LLC 13.645 5.45 2.01
skm-gp130 + LLC 20.494 8.29 3.06

322
ratio P:total P-STAT3 P-P65 P-AMPK P-P38 P-AKT P-S6 Atrogin
LLC 1.042 0.856 1.102 0.966 0.900 1.06 0.99
LLC 0.932 0.834 1.020 0.994 0.996 1.00 1.00
LLC 1.060 0.945 0.945 0.965 1.063 1.03 0.99
LLC 0.966 1.364 0.933 1.074 1.041 0.91 1.02
LLC+PDTC 0.332 0.041 0.983 1.100 0.999 3.40 1.01
LLC+PDTC 0.496 0.163 0.969 1.079 1.130 1.90 1.12
LLC+PDTC 0.227 0.358 0.965 1.084 1.077 3.00 1.05
LLC+PDTC 0.500 0.250 0.988 0.991 1.114 2.40 1.20
LLC+IL-6rAb 0.515 1.387 0.971 0.926 0.986 0.82 1.11
LLC+IL-6rAb 1.029 1.179 0.884 0.989 1.183 0.12 1.08
LLC+IL-6rAb 1.079 1.011 0.898 0.935 1.048 0.15 1.07
LLC+IL-6rAb 0.986 1.181 0.952 0.974 1.130 0.56 1.11
Normalized Puromycin
BL/6 1.019
BL/6 1.031
BL/6 0.951
LLC 0.504
LLC 0.353
LLC 0.088
LLC + PDTC 0.933
LLC + PDTC 1.364
LLC + PDTC 1.050
LLC + PDTC 0.508
LLC + IL-6r Ab 0.302
LLC + IL-6r Ab 0.210
LLC + IL-6r Ab 0.370
LLC + IL-6r Ab 0.072

323
S6 P:total normalized
b6 125.448 36.019 1.029414
b6 128.922 39.493 1.1287
b6 132.232 42.803 1.223299
b6 125.328 35.899 1.025985
b6 110.164 20.735 0.592601
B6+ LLC 110.194 20.765 0.593459
B6+ LLC 120.3 30.871 0.882286
B6+ LLC 110.9 21.471 0.613636
B6+ LLC 106.796 17.367 0.496345
B6+ LLC 109.429 20 0.571595
skm-gp130 123.234 33.805 0.966139
skm-gp130 121.571 32.142 0.918611
skm-gp130 124.734 35.305 1.009008
skm-gp130 121.803 32.374 0.925241
skm+LLC 74.601 39.82633 0.54087
skm+LLC 60.268 25.49333 0.346217
skm+LLC 78.416 43.64133 0.59268
skm+LLC 92.473 57.69833 0.783584
skm+LLC 77.578 42.80333 0.581299
Atrogin IOD -bg Normalized
b6 106.987 13.35267 0.44719
b6 119.49 25.85567 0.865923
b6 134.328 40.69367 1.362858
b6 129.61 35.97567 1.204849
b6 127.052 33.41767 1.11918
B6+ LLC 141.455 47.82067 1.601546
B6+ LLC 131.318 37.68367 1.262051
B6+ LLC 140.542 46.90767 1.570969
B6+ LLC 143.029 49.39467 1.65426
B6+ LLC 142.351 48.71667 1.631554
skm-gp130 95.438 23.69767 0.520539
skm-gp130 115.744 44.00367 0.966577
skm-gp130 123.487 51.74667 1.136658
skm-gp130 122.984 51.24367 1.125609
skm-gp130 128.675 56.93467 1.250617
skm+LLC 135.75 64.00967 1.406025
skm+LLC 119.497 47.75667 1.049015
skm+LLC 115.01 43.26967 0.950454
skm+LLC 118.175 46.43467 1.019976
skm+LLC 130.692 58.95167 1.294922

324
P-STAT P:total normalized
b6 145.053 41.09 0.95429
b6 154.367 50.404 1.170602
b6 157.145 53.182 1.235119
b6 149.513 45.55 1.057871
b6 129.028 25.065 0.582119
B6+ LLC 156.088 52.125 1.210571
B6+ LLC 176.25 72.287 1.678821
B6+ LLC 181.141 77.178 1.792411
B6+ LLC 174.771 70.808 1.644472
B6+ LLC 180.573 76.61 1.77922
skm-gp130 130.363 26.4 0.613124
skm-gp130 125.32 21.357 0.496003
skm-gp130 115.156 11.193 0.25995
skm-gp130 122.825 18.862 0.438058
skm-gp130 124 20.037 0.465347
skm+LLC 148.577 44.614 1.036132
skm+LLC 134.586 30.623 0.7112
skm+LLC 141.256 37.293 0.866107
skm+LLC 137.906 33.943 0.788305
skm+LLC 129.966 26.003 0.603904
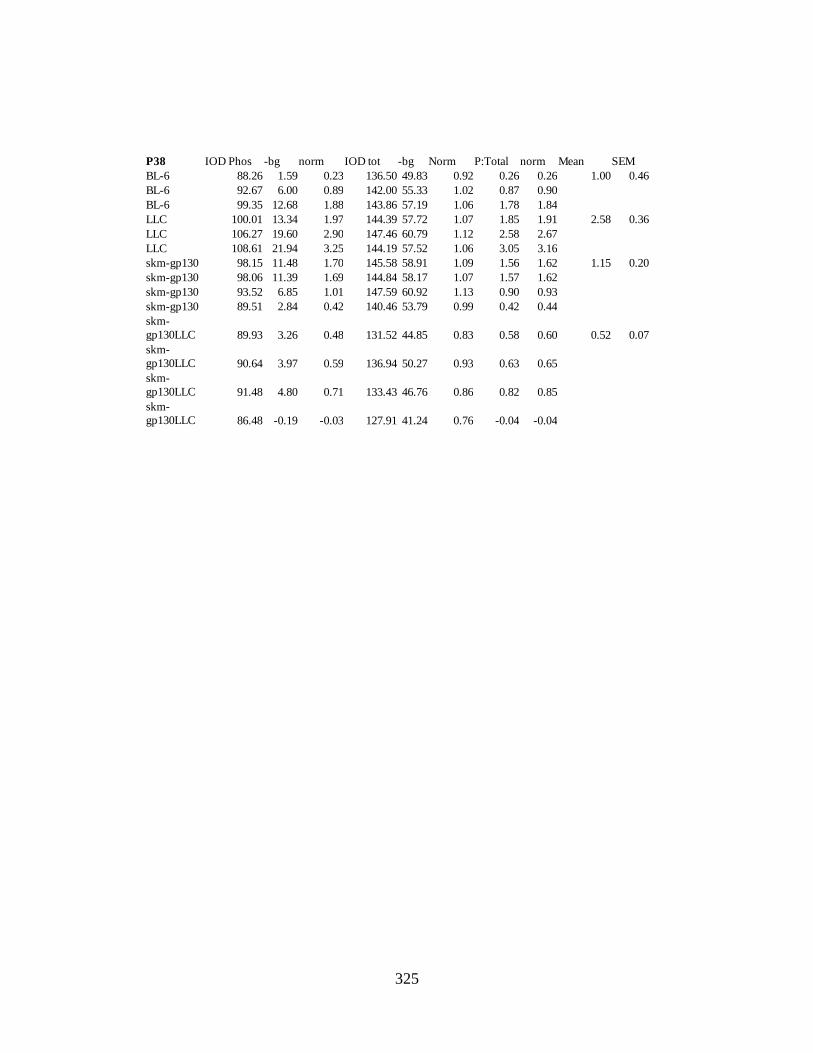
325
P38 IOD Phos -bg norm IOD tot -bg Norm P:Total norm Mean SEM
BL-6 88.26 1.59 0.23 136.50 49.83 0.92 0.26 0.26 1.00 0.46
BL-6 92.67 6.00 0.89 142.00 55.33 1.02 0.87 0.90
BL-6 99.35 12.68 1.88 143.86 57.19 1.06 1.78 1.84
LLC 100.01 13.34 1.97 144.39 57.72 1.07 1.85 1.91 2.58 0.36
LLC 106.27 19.60 2.90 147.46 60.79 1.12 2.58 2.67
LLC 108.61 21.94 3.25 144.19 57.52 1.06 3.05 3.16
skm-gp130 98.15 11.48 1.70 145.58 58.91 1.09 1.56 1.62 1.15 0.20
skm-gp130 98.06 11.39 1.69 144.84 58.17 1.07 1.57 1.62
skm-gp130 93.52 6.85 1.01 147.59 60.92 1.13 0.90 0.93
skm-gp130 89.51 2.84 0.42 140.46 53.79 0.99 0.42 0.44
skm-
gp130LLC 89.93 3.26 0.48 131.52 44.85 0.83 0.58 0.60 0.52 0.07
skm-
gp130LLC 90.64 3.97 0.59 136.94 50.27 0.93 0.63 0.65
skm-
gp130LLC 91.48 4.80 0.71 133.43 46.76 0.86 0.82 0.85
skm-
gp130LLC 86.48 -0.19 -0.03 127.91 41.24 0.76 -0.04 -0.04

326
Sacrifice DEXA Data
WEIGHTBone TISSUE
BMD BMC AREA LEAN FAT TOTAL %FAT
Geno LLC Mouse (g) (g/cm2) (g) (cm2) (g) (g) (g) %BL/6 control 988 23.6 0.0481 0.313 6.51 18 3 21 14.4BL/6 control 989 26.3 0.0532 0.375 7.05 19.9 3.2 23.1 14BL/6 control 990 25.2 0.0536 0.365 6.81 18.8 3.2 22.1 14.7BL/6 control 991 25.1 0.0501 0.335 6.69 18.1 3.6 21.7 16.7BL/6 control 992 25.7 0.0518 0.342 6.61 19 4.1 23.1 17.6
mean 25.18 0.05136 0.346 6.734 18.76 3.42 22.2 15.48se 0.45 0.00 0.01 0.09 0.34 0.20 0.41 0.71n 5 5 5 5 5 5 5 5
fl/fl cre/cre control 2518 26.1 0.0494 0.381 7.71 19.2 4.1 23.3 17.8
fl/fl cre/cre control 2524 28.4 0.0475 0.332 6.98 23.4 2.5 25.9 9.7
fl/fl cre/cre control 2574 25 0.0464 0.329 7.08 18.3 3.4 21.7 15.6
fl/fl cre/cre control 2575 25.6 0.0493 0.358 7.25 19.8 3.8 23.6 16.1
fl/fl cre/cre control 2598namean 26.275 0.04815 0.35 7.255 20.175 3.45 23.625 14.8se 0.74 0.00 0.01 0.16 1.12 0.35 0.87 1.76n 4 4 4 4 4 4 4 4
BL/6 LLC 1794NABL/6 LLC 1 28.7 0.0482 0.296 6.14 24.5 2.9 27.5 10.6BL/6 LLC 2792 22.5 0.0447 0.318 7.12 17.2 2.2 19.3 11.6BL/6 LLC 2791 26.5 0.051 0.352 6.91 19.7 3.3 22.9 14.2BL/6 LLC 1793 23.7 0.0438 0.281 6.42 19.4 2.4 21.7 10.9BL/6 LLC 1792 21.8 0.0458 0.29 6.34 16.6 2.9 19.5 14.9
mean 24.64 0.0467 0.3074 6.586 19.48 2.74 22.18 12.44se 1.29 0.00 0.01 0.18 1.39 0.20 1.49 0.88n 5 5 5 5 5 5 5 5
fl/fl cre/cre LLC 2669NA
fl/fl cre/cre LLC 2634NA
fl/fl cre/cre LLC 2635 25.4 0.0487 0.328 6.75 19.3 3.8 23.1 16.5
fl/fl cre/cre LLC 2636 27.6 0.0511 0.334 6.54 21.9 2.8 24.7 11.4
fl/fl cre/cre LLC 9715 26.5 0.0483 0.324 6.7 23.5 3.6 27 13.2
fl/fl cre/cre LLC 9716 29.7 0.0491 0.326 6.64 21 2.6 23.6 11.1mean 27.3 0.0493 0.328 6.6575 21.425 3.2 24.6 13.05se 0.92 0.00 0.00 0.05 0.88 0.29 0.87 1.24n 4 4 4 4 4 4 4 4
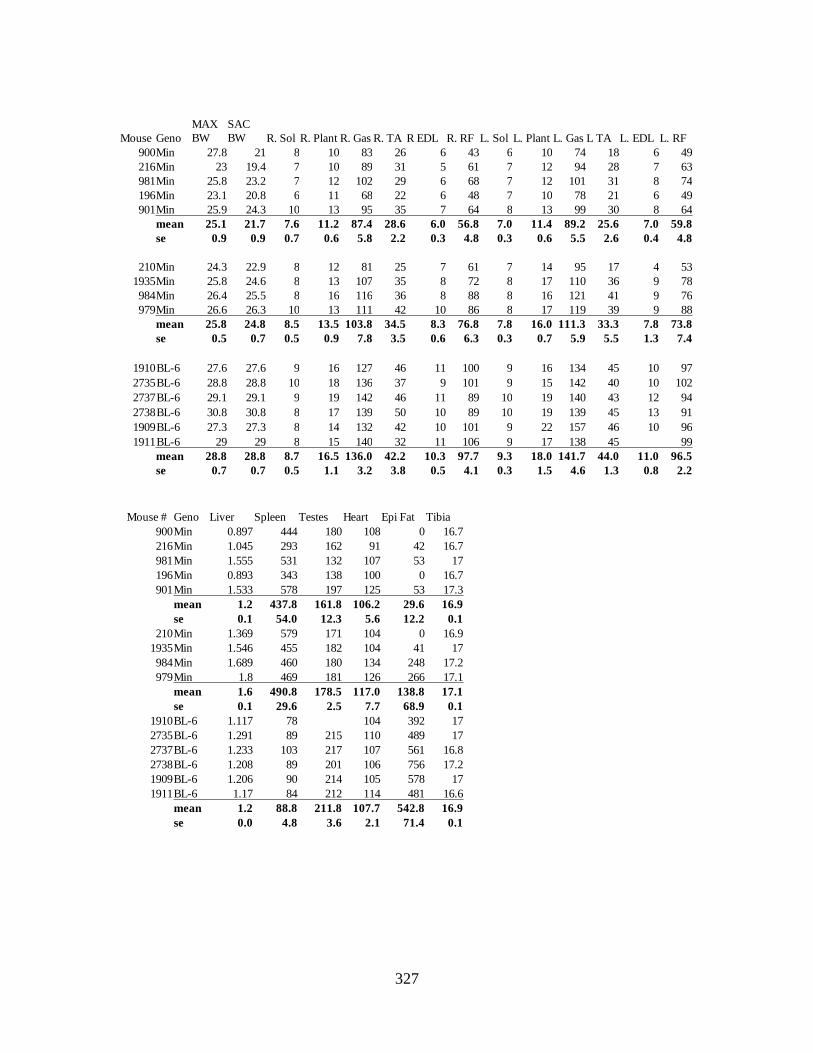
327
Mouse Geno
MAX
BW
SAC
BW R. Sol R. Plant R. Gas R. TA R EDL R. RF L. Sol L. Plant L. Gas L TA L. EDL L. RF
900Min 27.8 21 8 10 83 26 6 43 6 10 74 18 6 49
216Min 23 19.4 7 10 89 31 5 61 7 12 94 28 7 63
981Min 25.8 23.2 7 12 102 29 6 68 7 12 101 31 8 74
196Min 23.1 20.8 6 11 68 22 6 48 7 10 78 21 6 49
901Min 25.9 24.3 10 13 95 35 7 64 8 13 99 30 8 64
mean 25.1 21.7 7.6 11.2 87.4 28.6 6.0 56.8 7.0 11.4 89.2 25.6 7.0 59.8
se 0.9 0.9 0.7 0.6 5.8 2.2 0.3 4.8 0.3 0.6 5.5 2.6 0.4 4.8
210Min 24.3 22.9 8 12 81 25 7 61 7 14 95 17 4 53
1935Min 25.8 24.6 8 13 107 35 8 72 8 17 110 36 9 78
984Min 26.4 25.5 8 16 116 36 8 88 8 16 121 41 9 76
979Min 26.6 26.3 10 13 111 42 10 86 8 17 119 39 9 88
mean 25.8 24.8 8.5 13.5 103.8 34.5 8.3 76.8 7.8 16.0 111.3 33.3 7.8 73.8
se 0.5 0.7 0.5 0.9 7.8 3.5 0.6 6.3 0.3 0.7 5.9 5.5 1.3 7.4
1910BL-6 27.6 27.6 9 16 127 46 11 100 9 16 134 45 10 97
2735BL-6 28.8 28.8 10 18 136 37 9 101 9 15 142 40 10 102
2737BL-6 29.1 29.1 9 19 142 46 11 89 10 19 140 43 12 94
2738BL-6 30.8 30.8 8 17 139 50 10 89 10 19 139 45 13 91
1909BL-6 27.3 27.3 8 14 132 42 10 101 9 22 157 46 10 96
1911BL-6 29 29 8 15 140 32 11 106 9 17 138 45 99
mean 28.8 28.8 8.7 16.5 136.0 42.2 10.3 97.7 9.3 18.0 141.7 44.0 11.0 96.5
se 0.7 0.7 0.5 1.1 3.2 3.8 0.5 4.1 0.3 1.5 4.6 1.3 0.8 2.2
Mouse # Geno Liver Spleen Testes Heart Epi Fat Tibia
900Min 0.897 444 180 108 0 16.7
216Min 1.045 293 162 91 42 16.7
981Min 1.555 531 132 107 53 17
196Min 0.893 343 138 100 0 16.7
901Min 1.533 578 197 125 53 17.3
mean 1.2 437.8 161.8 106.2 29.6 16.9
se 0.1 54.0 12.3 5.6 12.2 0.1
210Min 1.369 579 171 104 0 16.9
1935Min 1.546 455 182 104 41 17
984Min 1.689 460 180 134 248 17.2
979Min 1.8 469 181 126 266 17.1
mean 1.6 490.8 178.5 117.0 138.8 17.1
se 0.1 29.6 2.5 7.7 68.9 0.1
1910BL-6 1.117 78 104 392 17
2735BL-6 1.291 89 215 110 489 17
2737BL-6 1.233 103 217 107 561 16.8
2738BL-6 1.208 89 201 106 756 17.2
1909BL-6 1.206 90 214 105 578 17
1911BL-6 1.17 84 212 114 481 16.6
mean 1.2 88.8 211.8 107.7 542.8 16.9
se 0.0 4.8 3.6 2.1 71.4 0.1

328
Grip Strength
Set 1 Set 2
mouse geno sex BW Trial 1 Trial 2 Trial 3 Trial 4 Trial 5 Trial 1 Trial 2 Trial 3 Trial 4 Trial 5
979Min Male 26.3 1.47 1.71 2.04 1.95 2.00 1.80 1.94 1.67 2.00 1.62
900Min Male 21 1.11 2.02 1.42 0.84 0.92 0.31 0.64 0.72 0.67 0.70
901Min Male 24.3 1.52 1.74 1.67 1.77 1.75 1.52 1.52 1.74 1.99 1.90
981Min Male 23.2 1.96 2.23 1.61 1.85 2.40 1.74 1.81 1.83 2.00 1.80
984Min Male 25.9 1.88 1.84 2.35 1.94 1.97 1.68 1.88 1.54 1.92 2.17
1935Min Male 24.8 1.69 1.56 2.45 2.08 2.00 1.65 1.72 2.10 2.10 2.08
1936Min Male 22.2 1.74 1.34 1.48 1.58 1.53 1.46 1.55 1.65 1.37 1.41
1912Min Male 22.5 1.38 1.96 1.54 1.72 1.72 1.57 2.07 1.16 1.38 1.62
1909BL6 Male 27.7 2.32 2.40 2.73 1.99 1.95 2.41 2.66 2.35 2.48 2.18
1910BL6 Male 27.3 2.18 2.61 2.18 1.79 1.85 1.86 1.83 2.07 1.58 2.69
1911BL6 Male 29.1 2.38 2.11 2.42 2.58 2.48 1.90 3.03 2.07 2.68 2.07
1913BL6 Male 30.8 2.35 2.57 2.31 1.97 2.73 2.02 2.15 1.99 2.59 2.39
Set 1 Set 2
mouse geno sex BW Average Max Set 1 Max Set 2 avg/bw max/bw max/bw
979Min Male 26.3 1.82 2.04 2.00 0.07 0.08 0.08
900Min Male 21 0.935 2.02 0.72 0.04 0.10 0.03
901Min Male 24.3 1.712 1.77 1.99 0.07 0.07 0.08
981Min Male 23.2 1.923 2.4 2.00 0.08 0.10 0.09
984Min Male 25.9 1.917 2.35 2.17 0.07 0.09 0.08
1935Min Male 24.8 1.943 2.45 2.10 0.08 0.10 0.08
1936Min Male 22.2 1.511 1.74 1.65 0.07 0.08 0.07
1912Min Male 22.5 1.612 1.96 2.07 0.07 0.09 0.09
1909BL6 Male 27.7 2.347 2.73 2.66 0.08 0.10 0.10
1910BL6 Male 27.3 2.064 2.61 2.69 0.08 0.10 0.10
1911BL6 Male 29.1 2.372 2.58 3.03 0.08 0.09 0.10
1913BL6 Male 30.8 2.307 2.73 2.59 0.07 0.09 0.08

329
Strain Treat p-P65 total P65 Phos:total Mean SEM
norm. norm.
BL-6 con 1.362 1.144 1.19 1.00 0.11
BL-6 con 0.787 0.973 0.81
BL-6 con 1.046 1.025 1.02
Min con 4.879 1.139 4.28 8.72 2.52
Min con 8.320 0.937 8.88
Min con 11.371 0.874 13.01
Min + PDTC con 2.139 1.329 1.61 1.55 0.03
Min + PDTC con 1.937 1.328 1.46
Min + PDTC con 1.792 1.147 1.56
Min + PDTC con 1.447 0.928 1.56
BL-6 stim 15.050 0.944 15.95 15.59 0.6
BL-6 stim 20.402 1.244 16.40
BL-6 stim 23.869 1.654 14.43
Min stim 2.536 0.937 2.71 8.18 2.77
Min stim 8.409 0.832 10.11
Min stim 17.477 1.492 11.71
Min + PDTC stim 7.385 1.340 5.51 5.76 0.21
Min + PDTC stim 5.933 1.043 5.69
Min + PDTC stim 6.785 1.239 5.48
Min + PDTC stim 5.302 0.832 6.37
Low frequency StimulationWestern Blots

330
Strain Treat p-STAT3 total STAT3 phos:total Mean SEM
norm. norm.
BL-6 con -1.243 1.114 -1.12 1.00 0.11
BL-6 con 1.131 0.933 1.21
BL-6 con 2.831 0.975 2.90
Min con 3.455 1.119 3.09 8.72 2.52
Min con 8.523 1.007 8.46
Min con 6.581 0.744 8.85
Min + PDTC con 2.504 1.319 1.90 1.55 0.03
Min + PDTC con 2.948 1.288 2.29
Min + PDTC con 1.824 1.127 1.62
BL-6 stim 6.429 0.844 4.74 15.59 0.6
BL-6 stim 8.246 1.184 7.62
BL-6 stim 18.259 1.62 6.96
Min stim 10.223 0.907 11.27 8.18 2.77
Min stim 15.832 0.822 19.26
Min stim 16.156 1.372 11.77
Min + PDTC stim 9.448 1.300 7.27 5.76 0.21
Min + PDTC stim 7.570 0.973 7.78
Min + PDTC stim 8.983 1.239 7.25
Strain Treat p-Akt total Akt phos:total Mean SEM
norm. norm.
BL-6 con 0.847 1.00 0.85 1.00 0.08
BL-6 con 1.152 0.95 1.22
BL-6 con 0.944 1.01 0.94
BL-6 con 1.046 1.04 1.00
Min con 3.605 0.99 3.65 4.12 0.17
Min con 4.064 0.95 4.27
Min con 4.098 0.92 4.45
Min con 3.865 0.94 4.12
BL-6 stim 1.468 0.92 1.59 1.63 0.66
BL-6 stim 1.738 1.03 1.69
BL-6 stim 1.513 0.94 1.61
Min stim 3.902 0.99 3.93 3.76 0.05
Min stim 3.868 1.04 3.70
Min stim 3.937 1.07 3.69
Min stim 3.644 0.98 3.73

331
Strain Treat p-p38 total p38 phos:totalMean SEM
norm. norm.
BL-6 con 0.643 0.960 0.67 1.00 0.17
BL-6 con 1.481 1.029 1.44
BL-6 con 0.894 1.003 0.89
Min con 0.797 1.008 0.79 1.05 0.27
Min con 0.902 1.015 0.89
Min con 0.668 1.000 0.67
Min con 1.849 0.995 1.86
BL-6 stim 3.076 0.960 3.09 3.71 0.38
BL-6 stim 4.374 0.966 4.56
BL-6 stim 3.369 0.913 3.49
Min stim 3.181 1.051 3.00 3.70 0.31
Min stim 3.159 1.007 4.49
Min stim 3.159 1.010 3.75
Min stim 4.525 0.996 3.55
Strain Treat p-AMPK
total
AMPK phos:total Mean SEM
norm. norm.
BL-6 con 1.095 1.050 1.04 1.00 0.05
BL-6 con 1.109 0.994 1.12
BL-6 con 0.948 1.029 0.92
BL-6 con 0.853 0.928 0.92
Min con 1.571 1.032 1.52 2.35 0.32
Min con 1.776 0.802 2.21
Min con 2.694 1.027 2.62
Min con 2.809 0.928 3.03
BL-6 stim 1.734 0.898 1.93 1.79 0.05
BL-6 stim 1.747 1.022 1.71
BL-6 stim 1.921 1.105 1.74
BL-6 stim 1.759 0.998 1.76
Min stim 4.191 1.054 3.97 3.44 0.37
Min stim 3.600 0.989 3.64
Min stim 2.568 1.098 2.34
Min stim 3.485 0.913 3.82
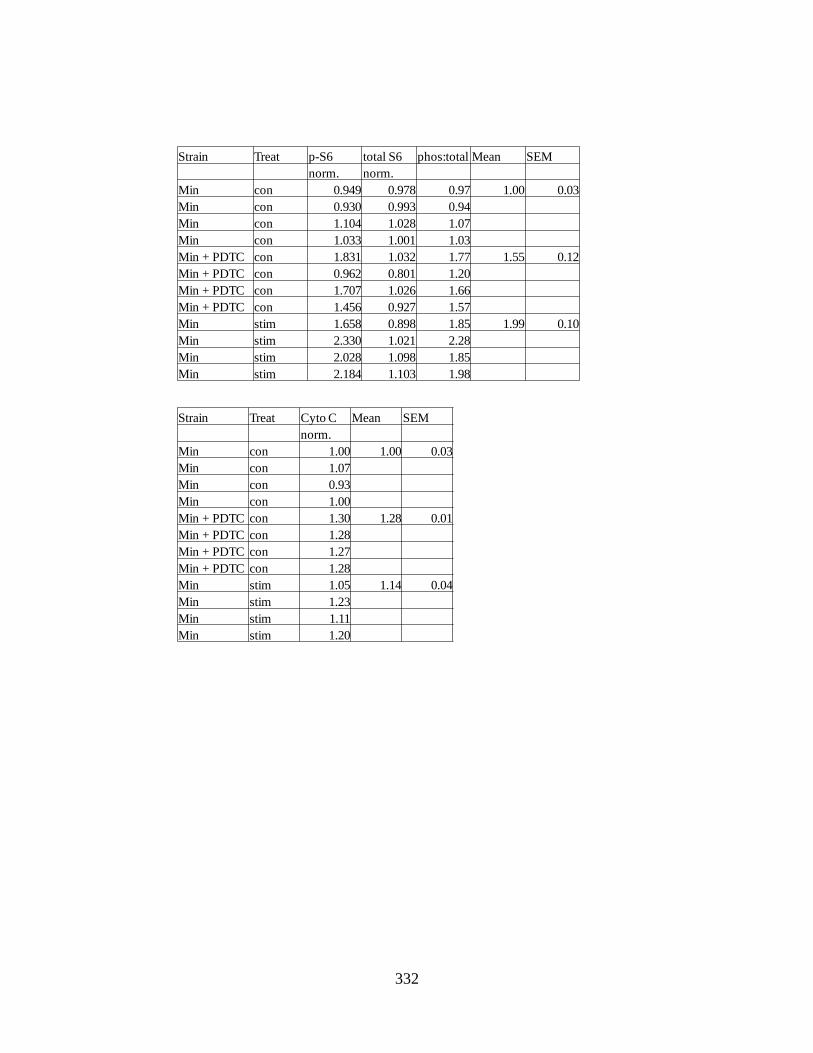
332
Strain Treat p-S6 total S6 phos:total Mean SEM
norm. norm.
Min con 0.949 0.978 0.97 1.00 0.03
Min con 0.930 0.993 0.94
Min con 1.104 1.028 1.07
Min con 1.033 1.001 1.03
Min + PDTC con 1.831 1.032 1.77 1.55 0.12
Min + PDTC con 0.962 0.801 1.20
Min + PDTC con 1.707 1.026 1.66
Min + PDTC con 1.456 0.927 1.57
Min stim 1.658 0.898 1.85 1.99 0.10
Min stim 2.330 1.021 2.28
Min stim 2.028 1.098 1.85
Min stim 2.184 1.103 1.98
Strain Treat Cyto C Mean SEM
norm.
Min con 1.00 1.00 0.03
Min con 1.07
Min con 0.93
Min con 1.00
Min + PDTC con 1.30 1.28 0.01
Min + PDTC con 1.28
Min + PDTC con 1.27
Min + PDTC con 1.28
Min stim 1.05 1.14 0.04
Min stim 1.23
Min stim 1.11
Min stim 1.20

333
Strain Treat TFAM Mean SEM
norm.
Min con 0.88 1.00 0.05
Min con 1.05
Min con 1.10
Min con 0.97
Min + PDTC con 2.23 2.21 0.01
Min + PDTC con 2.17
Min + PDTC con 2.22
Min + PDTC con 2.21
Min stim 2.28 1.97 0.25
Min stim 2.17
Min stim 2.20
Min stim 1.23
Strain Treat PGC-1α Mean SEM
norm.
BL-6 con 0.93 1.00 0.08
BL-6 con 0.90
BL-6 con 1.16
Min con 0.61 0.63 0.12
Min con 0.77
Min con 0.85
Min con 0.30
BL-6 stim 1.15 1.29 0.10
BL-6 stim 1.23
BL-6 stim 1.48
Min stim 0.74 0.84 0.10
Min stim 1.14
Min stim 0.80
Min stim 0.69
Strain Treat Cyto C Mean SEM
norm.
BL-6 con 0.88 1.00 0.06
BL-6 con 1.05
BL-6 con 1.06
Min con 0.84 0.86 0.09
Min con 1.13
Min con 0.79
Min con 0.69
BL-6 stim 1.43 1.42 0.10
BL-6 stim 1.58
BL-6 stim 1.25
Min stim 0.80 0.80 0.02
Min stim 0.82
Min stim 0.83
Min stim 0.76

334
Strain Treat P-S6 total S6 phos:total Mean SEM
norm. norm. norm.
BL-6 con 0.750 0.850 0.88 1.00 0.06
BL-6 con 0.938 0.890 1.05
BL-6 con 1.341 1.260 1.06
Min con 0.946 1.122 0.84 0.86 0.09
Min con 1.498 1.323 1.13
Min con 0.911 1.152 0.79
Min con 1.032 1.497 0.69
BL-6 stim 2.144 1.012 1.43 1.42 0.10
BL-6 stim 1.602 1.303 1.58
BL-6 stim 1.632 1.046 1.25
Min stim 1.310 1.145 1.00 1.18 0.12
Min stim 1.150 1.288 1.29
Min stim 2.171 1.474 1.47
Min stim 1.537 1.601 0.96
Strain Treat TFAM Mean SEM
norm.
BL-6 con 0.89 1.00 0.06
BL-6 con 1.01
BL-6 con 1.11
Min con 0.96 0.95 0.04
Min con 1.01
Min con 0.83
Min con 0.99
BL-6 stim 1.41 1.48 0.06
BL-6 stim 1.59
BL-6 stim 1.43
Min stim 0.93 0.87 0.11
Min stim 1.14
Min stim 0.73
Min stim 0.66

335
Control PGC-1B GAPDH dct ddct 2^ddct Normalized
210 25.67 24.305 1.365 -1.38 0.39 0.38
216 26.44 26.025 0.415 -2.33 0.20 0.19
979 26.06 23.84 2.22 -0.52 0.70 0.68
197 25.39 25.55 -0.16 -2.90 0.13 0.13
901 25.6 24.48 1.12 -1.62 0.33 0.32
900 25.205 24.68 0.525 -2.22 0.22 0.21
984 26.46 24.835 1.625 -1.12 0.46 0.45
981 25.29 23.725 1.565 -1.18 0.44 0.43
1910 25.425 22.545 2.88 0.14 1.10 1.07
1911 25.44 23.28 2.16 -0.58 0.67 0.65
1919 25.755 22.9 2.855 0.11 1.08 1.05
1913 25.87 22.8 3.07 0.33 1.26 1.22
Stim
210 26.955 25.83 1.125 -1.62 0.33 0.32
216 25.86 25.47 0.39 -2.35 0.20 0.19
979 26.595 23.2 3.395 0.65 1.57 1.53
197 26.82 26.305 0.515 -2.23 0.21 0.21
901 25.265 25.205 0.06 -2.68 0.16 0.15
900 26.875 26.95 -0.075 -2.82 0.14 0.14
984 25.955 24.725 1.23 -1.51 0.35 0.34
981 26.83 26.12 0.71 -2.03 0.24 0.24
1910 26.07 24.06 2.01 -0.73 0.60 0.59
1911 26.885 25.115 1.77 -0.97 0.51 0.50
1919 26.195 24.31 1.885 -0.86 0.55 0.54
Control average sem
Severe 0.26 0.05
Mild 0.50 0.09
BL/6 1.00 0.12
Stim average sem
Severe 0.19 0.02
Mild 0.73 0.40
BL/6 0.54 0.03
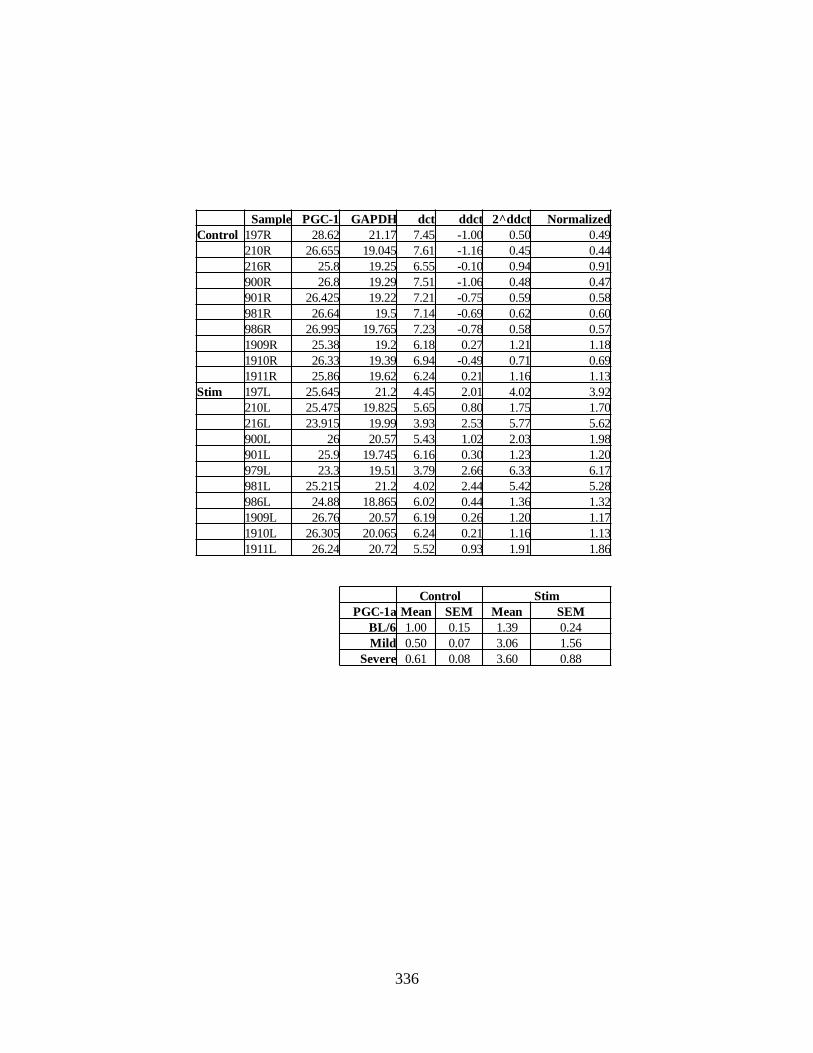
336
Sample PGC-1 GAPDH dct ddct 2^ddct Normalized
Control 197R 28.62 21.17 7.45 -1.00 0.50 0.49
210R 26.655 19.045 7.61 -1.16 0.45 0.44
216R 25.8 19.25 6.55 -0.10 0.94 0.91
900R 26.8 19.29 7.51 -1.06 0.48 0.47
901R 26.425 19.22 7.21 -0.75 0.59 0.58
981R 26.64 19.5 7.14 -0.69 0.62 0.60
986R 26.995 19.765 7.23 -0.78 0.58 0.57
1909R 25.38 19.2 6.18 0.27 1.21 1.18
1910R 26.33 19.39 6.94 -0.49 0.71 0.69
1911R 25.86 19.62 6.24 0.21 1.16 1.13
Stim 197L 25.645 21.2 4.45 2.01 4.02 3.92
210L 25.475 19.825 5.65 0.80 1.75 1.70
216L 23.915 19.99 3.93 2.53 5.77 5.62
900L 26 20.57 5.43 1.02 2.03 1.98
901L 25.9 19.745 6.16 0.30 1.23 1.20
979L 23.3 19.51 3.79 2.66 6.33 6.17
981L 25.215 21.2 4.02 2.44 5.42 5.28
986L 24.88 18.865 6.02 0.44 1.36 1.32
1909L 26.76 20.57 6.19 0.26 1.20 1.17
1910L 26.305 20.065 6.24 0.21 1.16 1.13
1911L 26.24 20.72 5.52 0.93 1.91 1.86
Control Stim
PGC-1a Mean SEM Mean SEM
BL/6 1.00 0.15 1.39 0.24
Mild 0.50 0.07 3.06 1.56
Severe 0.61 0.08 3.60 0.88
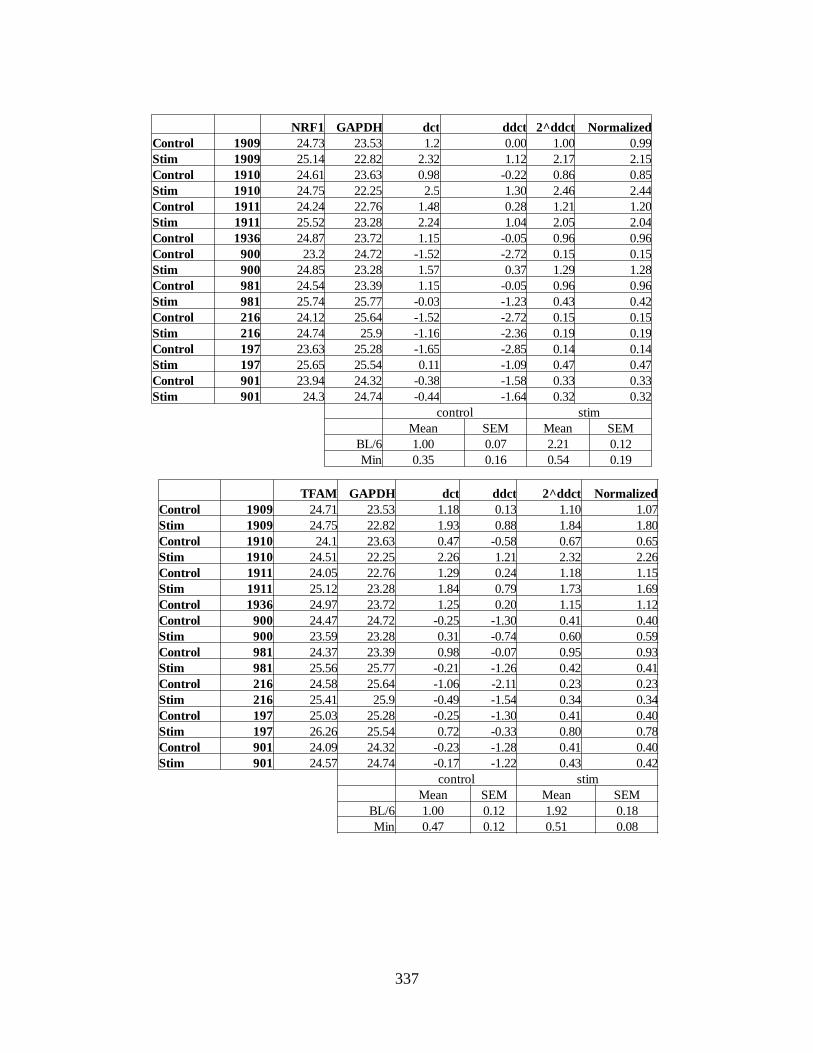
337
NRF1 GAPDH dct ddct 2^ddct Normalized
Control 1909 24.73 23.53 1.2 0.00 1.00 0.99
Stim 1909 25.14 22.82 2.32 1.12 2.17 2.15
Control 1910 24.61 23.63 0.98 -0.22 0.86 0.85
Stim 1910 24.75 22.25 2.5 1.30 2.46 2.44
Control 1911 24.24 22.76 1.48 0.28 1.21 1.20
Stim 1911 25.52 23.28 2.24 1.04 2.05 2.04
Control 1936 24.87 23.72 1.15 -0.05 0.96 0.96
Control 900 23.2 24.72 -1.52 -2.72 0.15 0.15
Stim 900 24.85 23.28 1.57 0.37 1.29 1.28
Control 981 24.54 23.39 1.15 -0.05 0.96 0.96
Stim 981 25.74 25.77 -0.03 -1.23 0.43 0.42
Control 216 24.12 25.64 -1.52 -2.72 0.15 0.15
Stim 216 24.74 25.9 -1.16 -2.36 0.19 0.19
Control 197 23.63 25.28 -1.65 -2.85 0.14 0.14
Stim 197 25.65 25.54 0.11 -1.09 0.47 0.47
Control 901 23.94 24.32 -0.38 -1.58 0.33 0.33
Stim 901 24.3 24.74 -0.44 -1.64 0.32 0.32
control stim
Mean SEM Mean SEM
BL/6 1.00 0.07 2.21 0.12
Min 0.35 0.16 0.54 0.19
TFAM GAPDH dct ddct 2^ddct Normalized
Control 1909 24.71 23.53 1.18 0.13 1.10 1.07
Stim 1909 24.75 22.82 1.93 0.88 1.84 1.80
Control 1910 24.1 23.63 0.47 -0.58 0.67 0.65
Stim 1910 24.51 22.25 2.26 1.21 2.32 2.26
Control 1911 24.05 22.76 1.29 0.24 1.18 1.15
Stim 1911 25.12 23.28 1.84 0.79 1.73 1.69
Control 1936 24.97 23.72 1.25 0.20 1.15 1.12
Control 900 24.47 24.72 -0.25 -1.30 0.41 0.40
Stim 900 23.59 23.28 0.31 -0.74 0.60 0.59
Control 981 24.37 23.39 0.98 -0.07 0.95 0.93
Stim 981 25.56 25.77 -0.21 -1.26 0.42 0.41
Control 216 24.58 25.64 -1.06 -2.11 0.23 0.23
Stim 216 25.41 25.9 -0.49 -1.54 0.34 0.34
Control 197 25.03 25.28 -0.25 -1.30 0.41 0.40
Stim 197 26.26 25.54 0.72 -0.33 0.80 0.78
Control 901 24.09 24.32 -0.23 -1.28 0.41 0.40
Stim 901 24.57 24.74 -0.17 -1.22 0.43 0.42
control stim
Mean SEM Mean SEM
BL/6 1.00 0.12 1.92 0.18
Min 0.47 0.12 0.51 0.08

338
Cyto B GAPDH dct ddct 2^ddct Normalized
Control 1909 11.16 23.53 -12.37 -0.31 0.81 0.79
Stim 1909 12.07 22.82 -10.75 1.32 2.49 2.44
Control 1910 11.32 23.63 -12.31 -0.24 0.84 0.83
Stim 1910 11.65 22.25 -10.6 1.47 2.76 2.71
Control 1911 10.87 22.76 -11.89 0.17 1.13 1.11
Stim 1911 12.27 23.28 -11.01 1.06 2.08 2.04
Control 1936 12.03 23.72 -11.69 0.38 1.30 1.27
Control 900 11.81 24.72 -12.91 -0.84 0.56 0.55
Stim 900 11.73 23.28 -11.55 0.51 1.43 1.40
Control 981 11.74 23.39 -11.65 0.41 1.33 1.31
Stim 981 12.15 25.77 -13.62 -1.56 0.34 0.33
Control 216 11.68 25.64 -13.96 -1.90 0.27 0.26
Stim 216 12.14 25.9 -13.76 -1.70 0.31 0.30
Control 197 12.45 25.28 -12.83 -0.77 0.59 0.58
Stim 197 12.99 25.54 -12.55 -0.48 0.71 0.70
Control 901 11.49 24.32 -12.83 -0.77 0.59 0.58
Stim 901 11.39 24.74 -13.35 -1.29 0.41 0.40
control stim
Mean SEM Mean SEM
BL/6 1.00 0.11 2.39 0.19
Min 0.65 0.17 0.63 0.21

339
Control PPAR-γ GAPDH dct ddct 2^ddct Normalized
1909 25.50 18.15 7.35 0.07 0.95 0.95
1910 25.26 18.30 6.97 -0.32 1.25 1.24
1911 25.40 18.04 7.36 0.07 0.95 0.94
1913 25.37 17.91 7.46 0.18 0.88 0.88
900 24.90 18.13 6.77 -0.52 1.43 1.42
981 25.43 18.30 7.13 -0.15 1.11 1.10
216 25.28 18.40 6.88 -0.41 1.33 1.31
197 25.24 18.37 6.88 -0.41 1.33 1.31
984 26.08 18.88 7.20 -0.08 1.06 1.05
Stim
1909 24.89 20.01 4.88 -2.40 5.29 5.24
1910 25.25 18.95 6.30 -0.99 1.98 1.97
1911 26.42 19.97 6.46 -0.83 1.77 1.76
1913 25.43 18.16 6.37 -0.91 1.88 1.87
900 25.00 20.15 4.86 -2.43 5.38 5.33
981 25.41 20.62 4.79 -2.50 5.65 5.60
216 25.24 19.19 6.05 -1.23 2.35 2.33
197 25.43 21.74 3.69 -3.60 12.10 12.00
984 24.63 19.26 5.38 -1.91 3.75 3.72
PPARγ mean sem
BL-6 Control 1.00 0.08
Exercise 2.99 1.13
Min Control 1.24 0.07
Exercise 5.79 1.66

340
Mean SEM
Min 0.35 0.16
Min+ PDTC 2.21 0.63
Min +
PDTC+ Stim 1.72 0.80
Mean SEM
Min 0.47 0.12
Min+ PDTC 2.66 0.62
Min +
PDTC+ Stim 1.95 0.73
Control NRF-1 GAPDH dct ddct 2^ddct Normalized
321 25.71 22.65 3.06 3.53 11.56 3.99
341 24.62 22.86 1.76 2.24 4.71 1.63
3153 24.22 23.03 1.19 1.67 3.17 1.10
3216 25.05 22.90 2.15 2.62 6.15 2.12
901 24.69 24.76 -0.07 0.41 1.33 0.46
197 24.13 25.75 -1.62 -1.14 0.45 0.16
216 24.69 24.43 0.26 0.74 1.67 0.58
Stim
321 25.58 24.36 1.22 1.70 3.24 1.12
341 24.61 23.23 1.38 1.86 3.62 1.25
3153 25.04 25.11 -0.07 0.40 1.32 0.46
3216 25.26 22.18 3.08 3.55 11.73 4.05
901 25.02 25.22 -0.20 0.28 1.21 0.42
197 25.84 23.28 2.56 1.10 2.14 0.32
216 25.00 24.99 0.01 0.20 1.15 1.58
Control TFAM GAPDH dct ddct 2^ddct Normalized
321 26.01 22.65 3.36 3.24 9.46 4.45
341 25.39 22.86 2.53 2.41 5.32 2.50
3153 25.25 23.03 2.22 2.10 4.29 2.02
3216 24.85 22.90 1.95 1.84 3.57 1.68
901 24.87 24.76 0.11 0.00 1.00 0.47
1911 24.27 23.22 1.05 0.94 1.91 1.00
197 25.40 25.75 -0.35 -0.46 0.73 0.34
216 25.01 24.43 0.58 0.47 1.38 0.65
Stim
321 25.38 24.36 1.02 0.90 1.87 0.88
341 25.20 23.23 1.97 1.85 3.61 1.70
3153 26.50 25.11 1.39 1.27 2.41 1.14
3216 25.41 22.18 3.23 3.12 8.67 4.08
901 25.48 25.22 0.26 0.15 1.11 0.52
197 26.63 23.28 3.35 3.24 9.43 4.44

341
Control Cyto B GAPDH dct ddct 2^ddct Normalized
321 12.69 22.65 -9.97 2.91 7.49 4.90
341 11.93 22.86 -10.94 1.94 3.82 2.50
3153 12.48 23.03 -10.55 2.32 4.99 3.27
3216 11.28 22.90 -11.62 1.25 2.38 1.56
901 11.69 24.76 -13.07 -0.20 0.87 0.57
197 12.74 25.75 -13.01 -0.14 0.91 0.59
216 11.90 24.43 -12.53 0.34 1.27 0.83
Stim
321 12.43 24.36 -11.94 0.94 1.91 1.25
341 12.24 23.23 -11.00 1.88 3.67 2.40
3153 12.95 25.11 -12.17 0.71 1.63 1.07
3216 12.38 22.18 -9.80 3.07 8.40 5.49
Mean sem
Min 0.65 0.17
Min+ PDTC 3.06 0.71
Min +
PDTC+ Stim 2.55 1.02
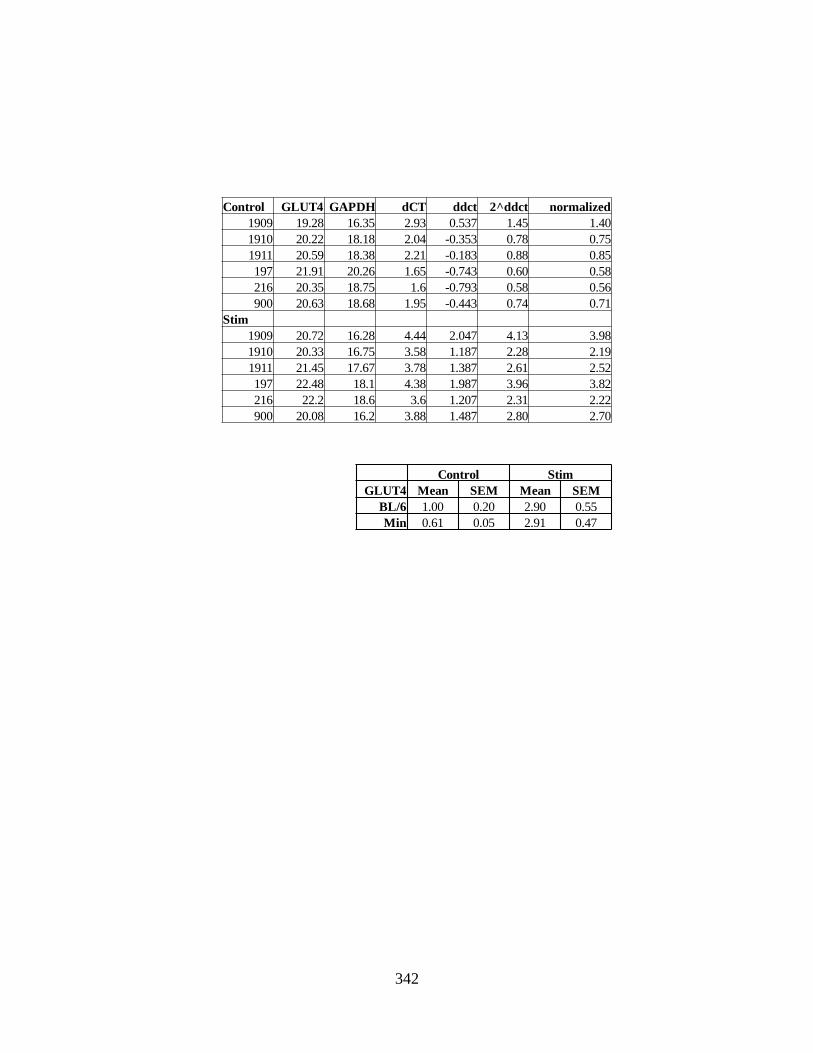
342
Control GLUT4 GAPDH dCT ddct 2^ddct normalized
1909 19.28 16.35 2.93 0.537 1.45 1.40
1910 20.22 18.18 2.04 -0.353 0.78 0.75
1911 20.59 18.38 2.21 -0.183 0.88 0.85
197 21.91 20.26 1.65 -0.743 0.60 0.58
216 20.35 18.75 1.6 -0.793 0.58 0.56
900 20.63 18.68 1.95 -0.443 0.74 0.71
Stim
1909 20.72 16.28 4.44 2.047 4.13 3.98
1910 20.33 16.75 3.58 1.187 2.28 2.19
1911 21.45 17.67 3.78 1.387 2.61 2.52
197 22.48 18.1 4.38 1.987 3.96 3.82
216 22.2 18.6 3.6 1.207 2.31 2.22
900 20.08 16.2 3.88 1.487 2.80 2.70
Control Stim
GLUT4 Mean SEM Mean SEM
BL/6 1.00 0.20 2.90 0.55
Min 0.61 0.05 2.91 0.47

343
APPENDIX E
PERMISSIONS TO REPRINT

344