the recovery of the brazilian economy · the economy reflects the adjusted policies booming capital...
TRANSCRIPT

WALTER BAÈRE FILHO
Deputy Executive Secretary of Planning, Development and Management
THE RECOVERY OF THE BRAZILIAN ECONOMY
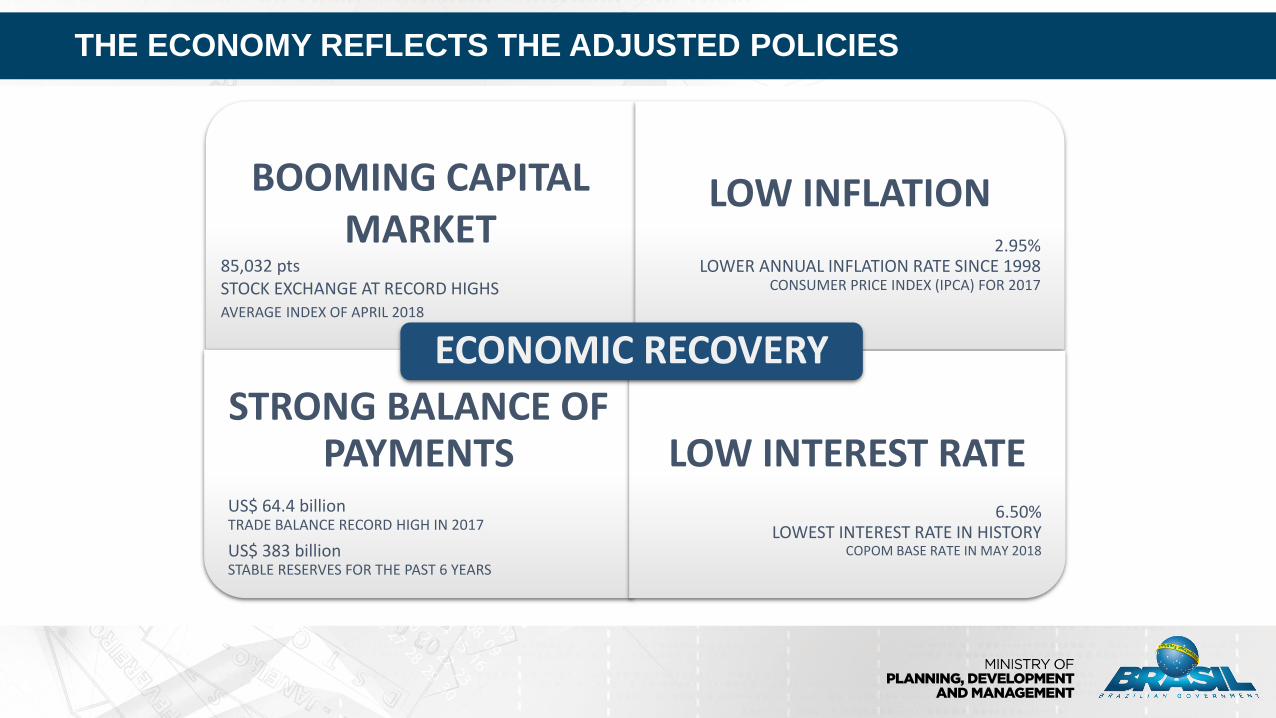
THE ECONOMY REFLECTS THE ADJUSTED POLICIES
BOOMING CAPITAL MARKET
85,032 ptsSTOCK EXCHANGE AT RECORD HIGHSAVERAGE INDEX OF APRIL 2018
LOW INFLATION2.95%
LOWER ANNUAL INFLATION RATE SINCE 1998CONSUMER PRICE INDEX (IPCA) FOR 2017
STRONG BALANCE OF PAYMENTS
US$ 64.4 billionTRADE BALANCE RECORD HIGH IN 2017
US$ 383 billionSTABLE RESERVES FOR THE PAST 6 YEARS
LOW INTEREST RATE6.50%
LOWEST INTEREST RATE IN HISTORYCOPOM BASE RATE IN MAY 2018
ECONOMIC RECOVERY
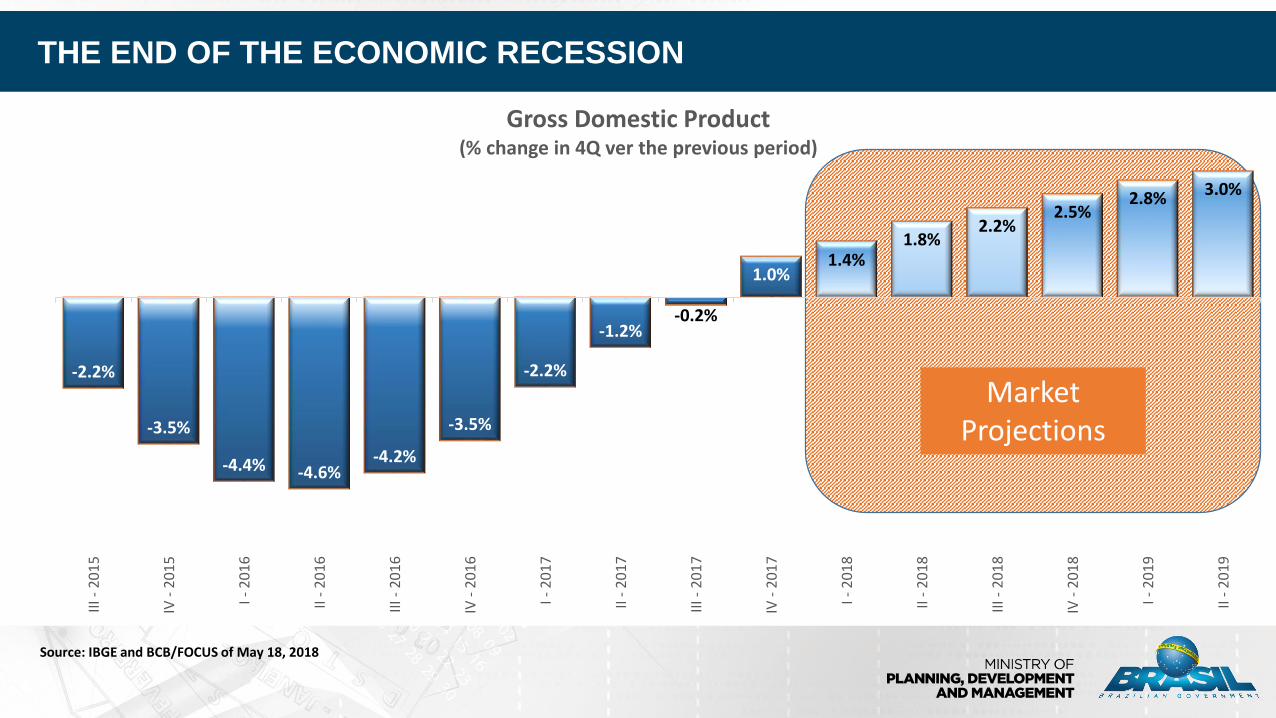
THE END OF THE ECONOMIC RECESSION
Source: IBGE and BCB/FOCUS of May 18, 2018
Market Projections
-2.2%
-3.5%
-4.4% -4.6%-4.2%
-3.5%
-2.2%
-1.2%-0.2%
1.0%1.4%
1.8%2.2%
2.5%2.8% 3.0%
III -
20
15
IV -
20
15
I - 2
01
6
II -
20
16
III -
20
16
IV -
20
16
I - 2
01
7
II -
20
17
III -
20
17
IV -
20
17
I - 2
01
8
II -
20
18
III -
20
18
IV -
20
18
I - 2
01
9
II -
20
19
Gross Domestic Product(% change in 4Q ver the previous period)

THE LABOR MARKET RECOVERS
4
Source: CAGED/MTE
2,629,827
2,026,571
1,372,5941,138,562
420,690
-1,534,989-1,326,558
-18,395
336,855
2010 2011 2012 2013 2014 2015 2016 2017 2018 - (JAN - APR)
Net Job Creation/Destruction (YTD)Number of People

5.90
4.31
5.91 6.50
5.84 5.91
6.41
10.67
6.29
2.95 3.50
4.01 4.00
-
2.00
4.00
6.00
8.00
10.00
12.00
2008 2009 2010 2011 2012 2013 2014 2015 2016 2017 2018 2019 2020
IPCA (acum. 12m) Meta de Inflação Limite para efeito de cumprimento da meta
Source: IBGE and BCB2017-2020: BCB/Focus of of May. 18, 2018
BRAZIL ADOPTED A SUCCESSFUL INFLATION TARGET REGIME
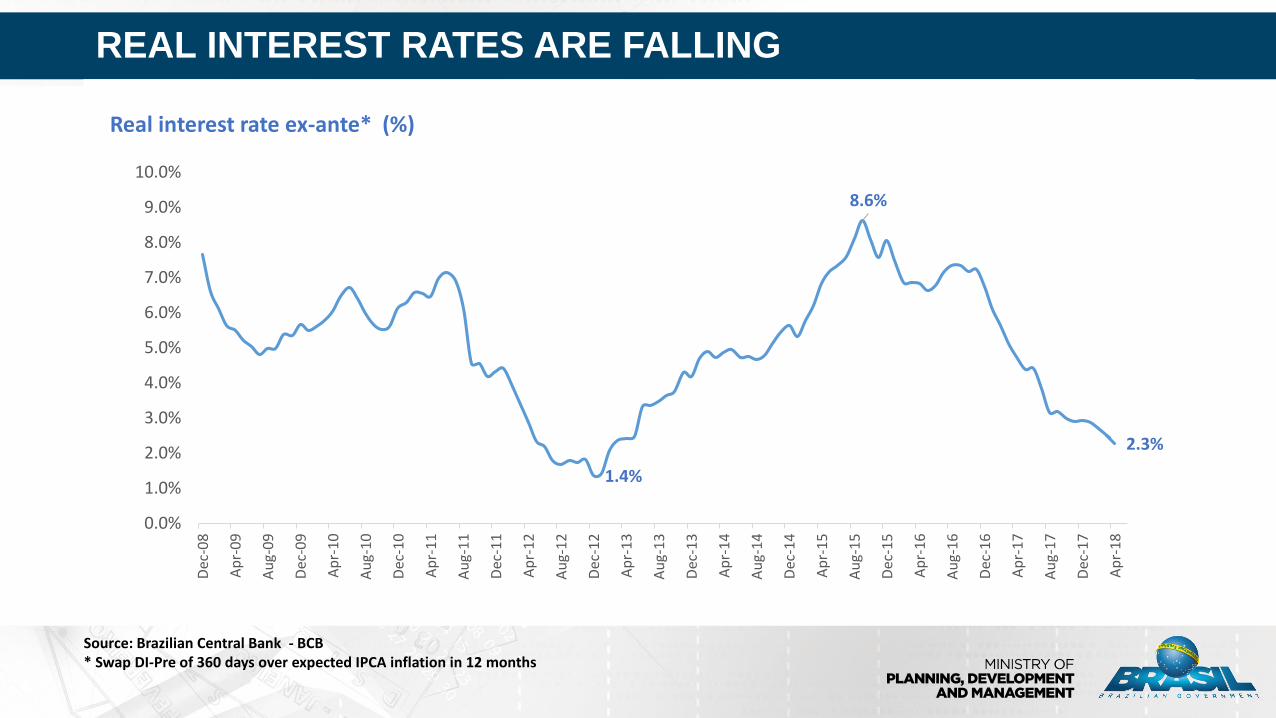
REAL INTEREST RATES ARE FALLING
Source: Brazilian Central Bank - BCB* Swap DI-Pre of 360 days over expected IPCA inflation in 12 months
1.4%
8.6%
2.3%
0.0%
1.0%
2.0%
3.0%
4.0%
5.0%
6.0%
7.0%
8.0%
9.0%
10.0%
Dec
-08
Ap
r-0
9
Au
g-0
9
Dec
-09
Ap
r-1
0
Au
g-1
0
Dec
-10
Ap
r-1
1
Au
g-1
1
Dec
-11
Ap
r-1
2
Au
g-1
2
Dec
-12
Ap
r-1
3
Au
g-1
3
Dec
-13
Ap
r-1
4
Au
g-1
4
Dec
-14
Ap
r-1
5
Au
g-1
5
Dec
-15
Ap
r-1
6
Au
g-1
6
Dec
-16
Ap
r-1
7
Au
g-1
7
Dec
-17
Ap
r-1
8
Real interest rate ex-ante* (%)

35000
45000
55000
65000
75000
85000
95000
Bo
vesp
a In
dex
THE STOCK EXCHANGE IS AT RECORD HIGHS
Source: Bloomberg
May 17, 2018 January 26, 2016 Change %
Ibovespa 83,622 37,497 123%
Petrobras (PETR3) 30.21 5.96 407%
Vale do Rio Doce (VALE3) 55.38 8.94 519%
Banco do Brasil (BBAS3) 32.86 12.89 155%
Eletrobras (ELET3) 18.98 4.88 289%
Closing prices as of Mar. 17, 2018

TRADE BALANCE AT RECORD HIGH
64,060
901
637
0
200
400
600
800
1000
1200
-10,000
0
10,000
20,000
30,000
40,000
50,000
60,000
70,000
80,000Fe
b-1
0A
pr-
10
Jun
-10
Au
g-1
0O
ct-1
0D
ec-1
0Fe
b-1
1A
pr-
11
Jun
-11
Au
g-1
1O
ct-1
1D
ec-1
1Fe
b-1
2A
pr-
12
Jun
-12
Au
g-1
2O
ct-1
2D
ec-1
2Fe
b-1
3A
pr-
13
Jun
-13
Au
g-1
3O
ct-1
3D
ec-1
3Fe
b-1
4A
pr-
14
Jun
-14
Au
g-1
4O
ct-1
4D
ec-1
4Fe
b-1
5A
pr-
15
Jun
-15
Au
g-1
5O
ct-1
5D
ec-1
5Fe
b-1
6A
pr-
16
Jun
-16
Au
g-1
6O
ct-1
6D
ec-1
6Fe
b-1
7A
pr-
17
Jun
-17
Au
g-1
7O
ct-1
7D
ec-1
7Fe
b-1
8A
pr-
18
Trade Balance Exports Imports
Trade BalanceAccumulated in 1 yearUS$ mm. FOB
Exports and ImportsDaily average accumulated in 1 year
US$ mm. FOB
Source: MDIC
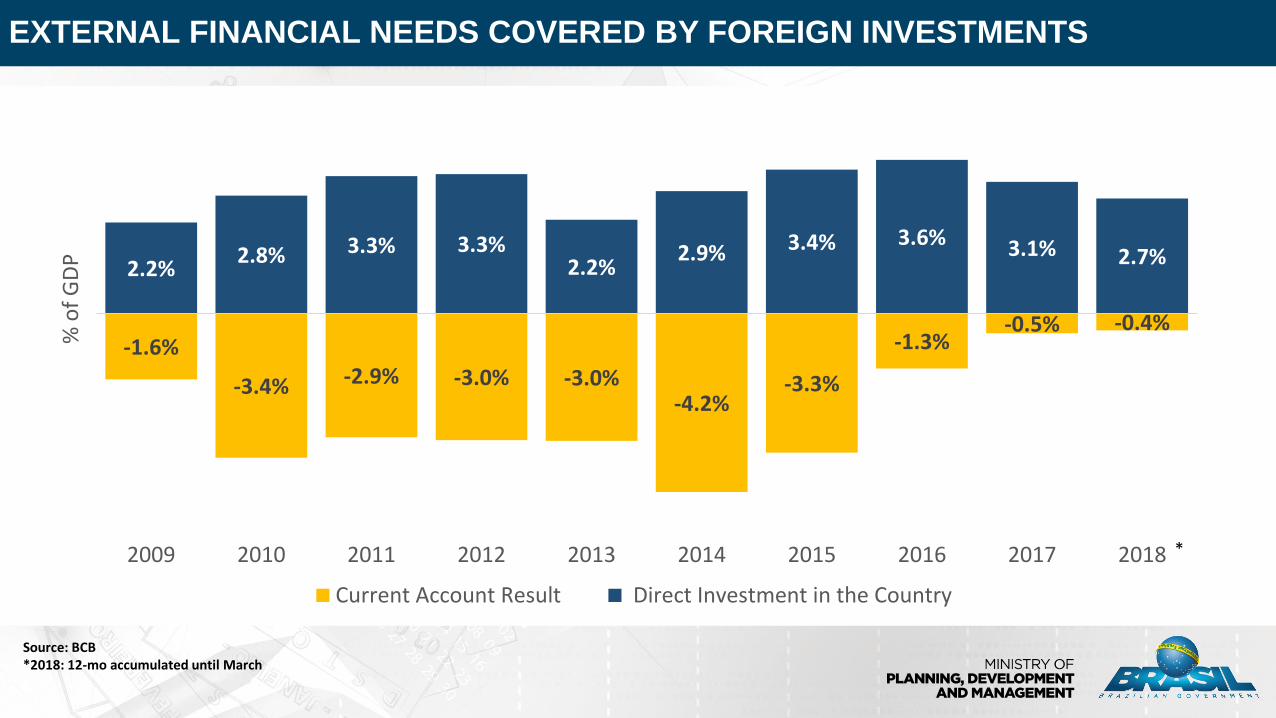
EXTERNAL FINANCIAL NEEDS COVERED BY FOREIGN INVESTMENTS
-0.4%-0.5%-1.3%
-3.3%-4.2%
-3.0%-3.0%-2.9%-3.4%
-1.6%
2.7%3.1%3.6%3.4%2.9%2.2%
3.3%3.3%2.8%2.2%
2018201720162015201420132012201120102009
% o
f G
DP
Current Account Result Direct Investment in the Country
Source: BCB*2018: 12-mo accumulated until March
*
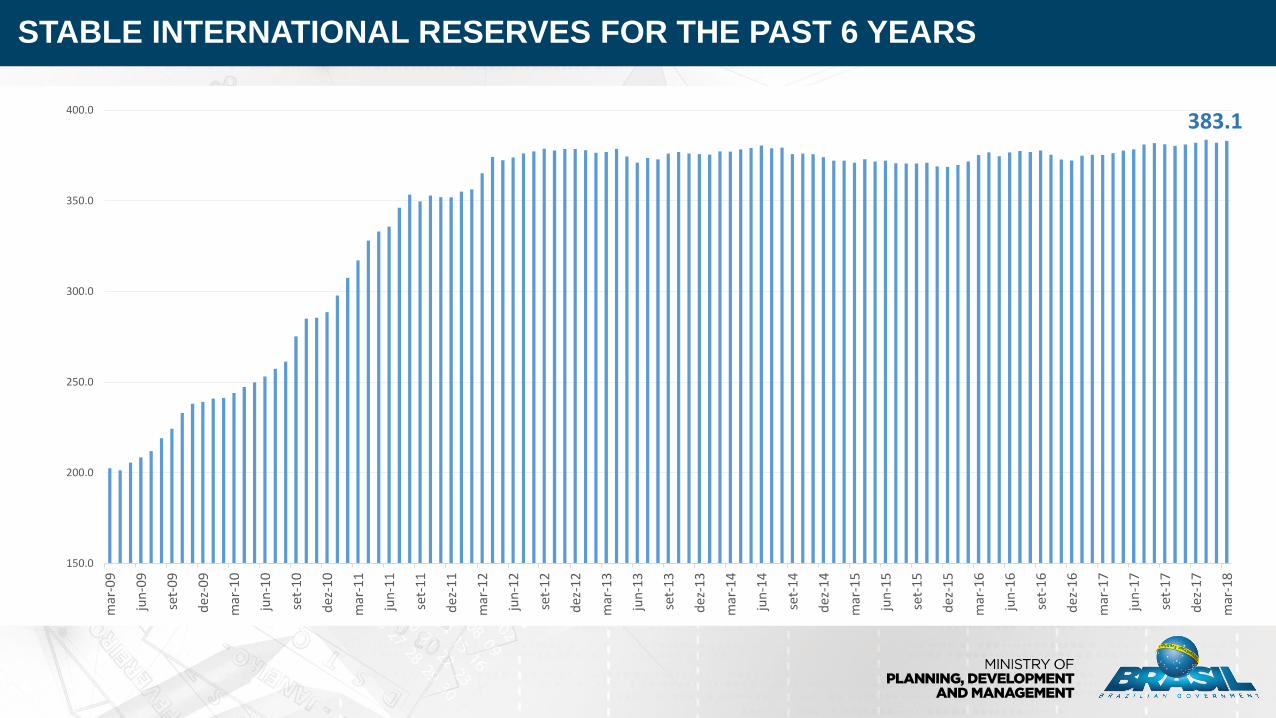
STABLE INTERNATIONAL RESERVES FOR THE PAST 6 YEARS
383.1
150.0
200.0
250.0
300.0
350.0
400.0m
ar-0
9
jun
-09
set-
09
dez
-09
mar
-10
jun
-10
set-
10
dez
-10
mar
-11
jun
-11
set-
11
dez
-11
mar
-12
jun
-12
set-
12
dez
-12
mar
-13
jun
-13
set-
13
dez
-13
mar
-14
jun
-14
set-
14
dez
-14
mar
-15
jun
-15
set-
15
dez
-15
mar
-16
jun
-16
set-
16
dez
-16
mar
-17
jun
-17
set-
17
dez
-17
mar
-18

ECONOMIC RECOVERY
Fiscal Consolidation Structural Reforms
Public-Private Partnership
Improvement of the regulatory framework and
business environment
ECONOMIC GROWTH

FISCAL CONSOLIDATION
New Fiscal Regime: Constitutional Amendment 95/2016 of the Public
Expenditure Cap.
Modernization of Public Management: improvement of electronic systems
and processes, strengthening and expanding Digital Government
practices.
Modernization of State Enterprises Management: Strict rules for
purchases, bids and for the appointment of managerial positions and
reduction in the effective staff of non-dependent state companies.
12
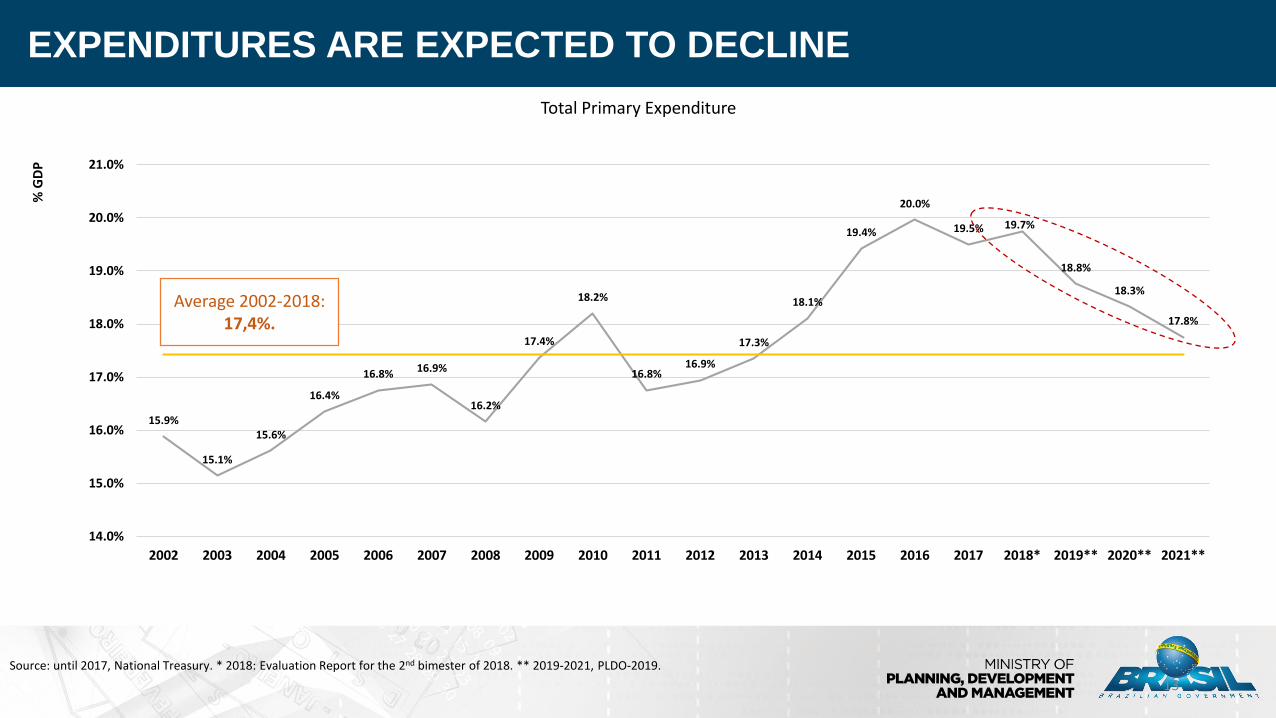
EXPENDITURES ARE EXPECTED TO DECLINE
13
15.9%
15.1%
15.6%
16.4%
16.8% 16.9%
16.2%
17.4%
18.2%
16.8%16.9%
17.3%
18.1%
19.4%
20.0%
19.5% 19.7%
18.8%
18.3%
17.8%
14.0%
15.0%
16.0%
17.0%
18.0%
19.0%
20.0%
21.0%
2002 2003 2004 2005 2006 2007 2008 2009 2010 2011 2012 2013 2014 2015 2016 2017 2018* 2019** 2020** 2021**
% G
DP
Total Primary Expenditure
Average 2002-2018:17,4%.
Source: until 2017, National Treasury. * 2018: Evaluation Report for the 2nd bimester of 2018. ** 2019-2021, PLDO-2019.
• Fiscal recovery of States
• Federal Government posts primary deficits since 2014: Fiscal challenges involve both expenditures and revenues. The fiscal crisis promotes the search for efficiency of public
expenditures. At the same time, the Federal Government implements an agenda of
modernization of public management. Better public services are related to the revision of public expenditures
and to the improvement in revenues.
THE FISCAL CHALLENGE
14
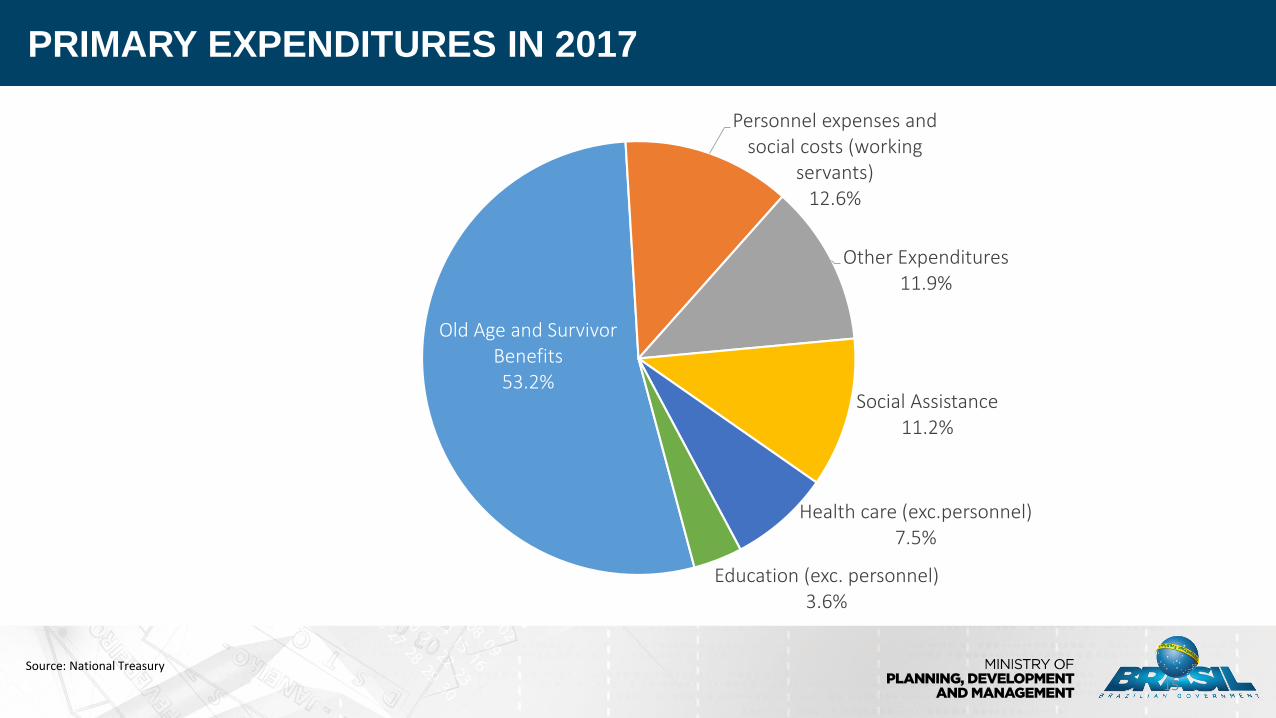
PRIMARY EXPENDITURES IN 2017
15
Source: National Treasury
Old Age and Survivor Benefits53.2%
Personnel expenses and social costs (working
servants)12.6%
Other Expenditures11.9%
Social Assistance 11.2%
Health care (exc.personnel)7.5%
Education (exc. personnel)3.6%

A REFORM OF THE SOCIAL SECURITY SYSTEM IS NEEDED
16
-1.2% -1.3% -1.1%-0.8% -0.8% -0.9% -1.0%
-1.4%
-2.4%-2.8% -2,9% -2.8% -2.9% -3.1%
5.3% 5.5% 5.5% 5.6% 5.7% 5.8% 5.8% 5.8% 5.7% 5.7% 5.6% 5.7% 5.7% 5.7%
6.4%6.7% 6.6% 6.4% 6.6% 6.7% 6.8%
7.3%
8.1%8.5% 8.5% 8.4% 8.6% 8.8%
-4.0%
-2.0%
0.0%
2.0%
4.0%
6.0%
8.0%
10.0%
2008 2009 2010 2011 2012 2013 2014 2015 2016 2017 2018* 2019** 2020** 2021**
% P
IB
Resultado RGPS Receita Líquida RGPS Despesa Líquida RGPS
% G
DP
Revenues Net RevenuesExpenditures
Source: until 2017, National Treasury. * 2018: Evaluation Report for the 2nd bimester of 2018. ** 2019-2021, PLDO-2019.
Result (RGPS)
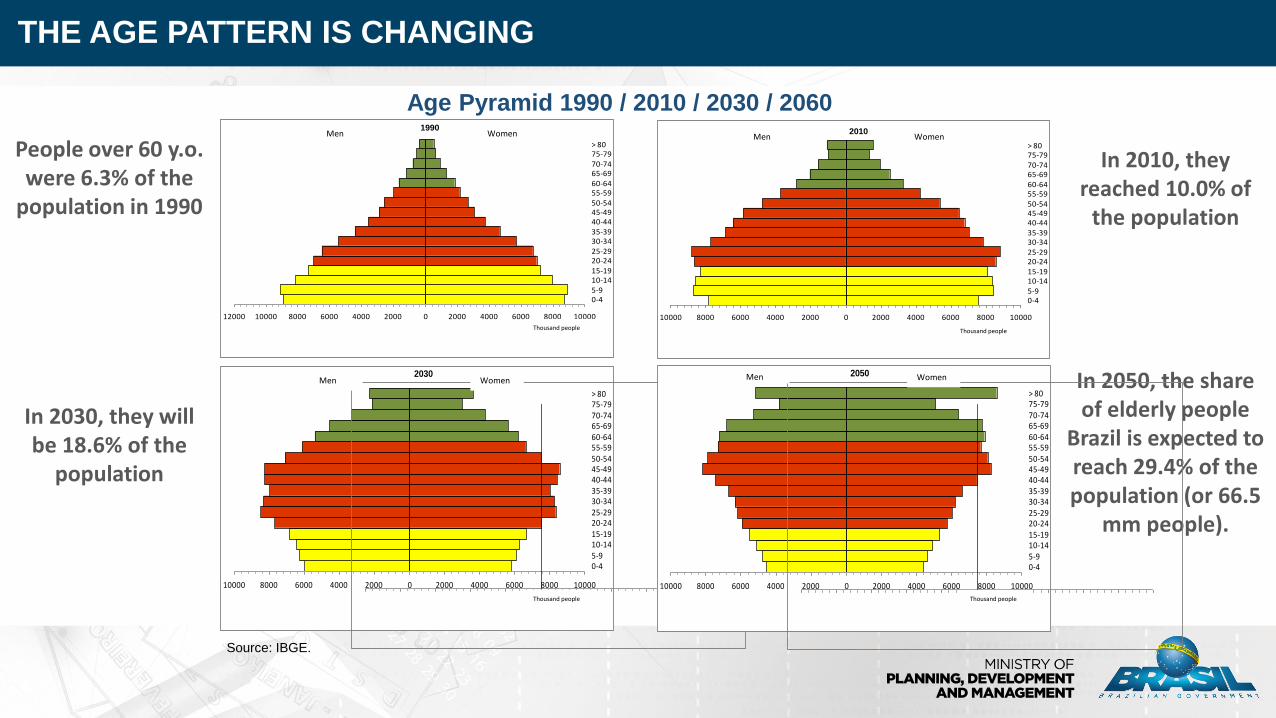
THE AGE PATTERN IS CHANGING
Age Pyramid 1990 / 2010 / 2030 / 2060
Source: IBGE.
People over 60 y.o. were 6.3% of the
population in 1990
In 2010, theyreached 10.0% of
the population
In 2030, they willbe 18.6% of the
population
In 2050, the shareof elderly people
Brazil is expected toreach 29.4% of thepopulation (or 66.5
mm people).
12000 10000 8000 6000 4000 2000 0 2000 4000 6000 8000 10000
0-45-910-1415-1920-2425-2930-3435-3940-4445-4950-5455-5960-6465-6970-7475-79> 80
Milhares
Homens Mulheres1990
10000 8000 6000 4000 2000 0 2000 4000 6000 8000 10000
0-45-910-1415-1920-2425-2930-3435-3940-4445-4950-5455-5960-6465-6970-7475-79> 80
Milhares
Homens Mulheres2010
10000 8000 6000 4000 2000 0 2000 4000 6000 8000 10000
0-45-910-1415-1920-2425-2930-3435-3940-4445-4950-5455-5960-6465-6970-7475-79> 80
Milhares
Homens Mulheres2030
10000 8000 6000 4000 2000 0 2000 4000 6000 8000 10000
0-45-910-1415-1920-2425-2930-3435-3940-4445-4950-5455-5960-6465-6970-7475-79> 80
Milhares
Homens Mulheres
10000 8000 6000 4000 2000 0 2000 4000 6000 8000 10000
0-45-910-1415-1920-2425-2930-3435-3940-4445-4950-5455-5960-6465-6970-7475-79> 80
Milhares
Homens Mulheres2050
10000 8000 6000 4000 2000 0 2000 4000 6000 8000 10000
0-45-910-1415-1920-2425-2930-3435-3940-4445-4950-5455-5960-6465-6970-7475-79> 80
Milhares
Homens Mulheres
Men Women
Thousand people
Men Women
Thousand people
Men Women
Thousand people
Men Women
Thousand people

GENERAL GOVERNMENT GROSS DEBT
Sources: BCB and National Treasury. *PLDO-2019.
18
56.0%59.2%
51.8% 51.3%53.7%
51.5%
56.3%
65.5%
70.0%
74.0%75.7%
77.7%79.7% 81.1%
0.0%
10.0%
20.0%
30.0%
40.0%
50.0%
60.0%
70.0%
80.0%
90.0%
% P
IB%
GD
P
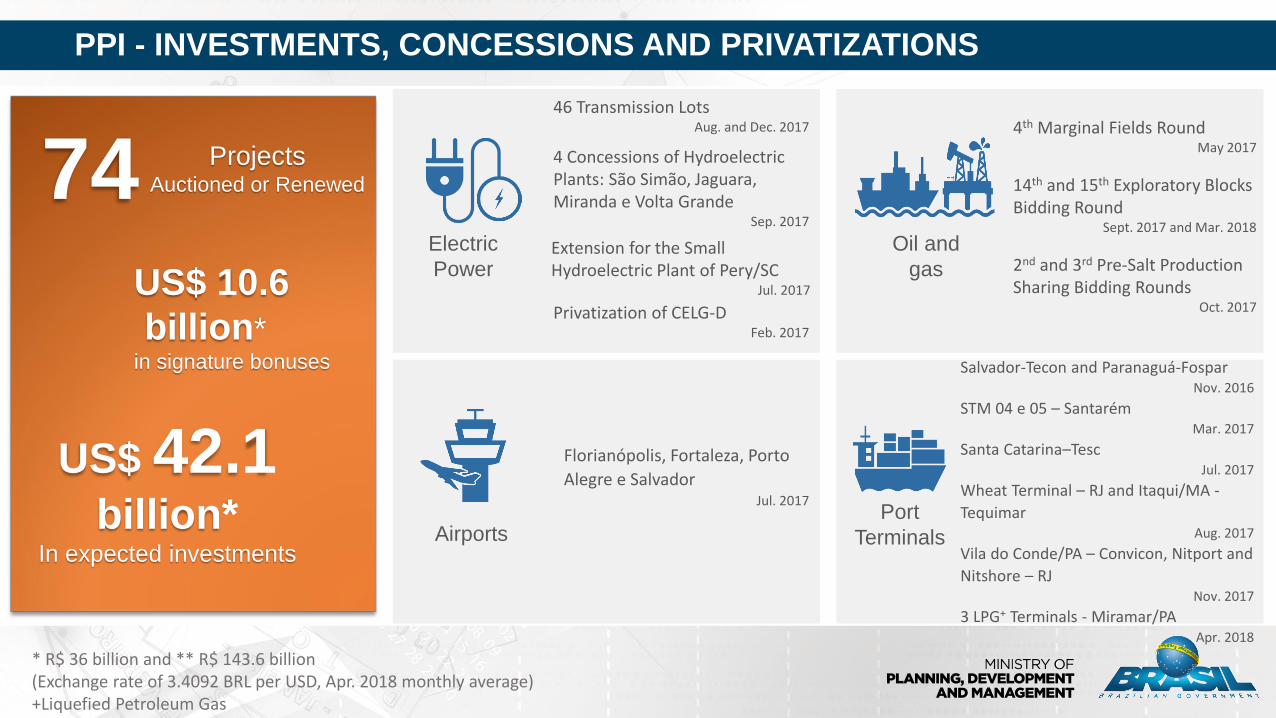
PPI - INVESTMENTS, CONCESSIONS AND PRIVATIZATIONS
US$ 10.6
billion*in signature bonuses
* R$ 36 billion and ** R$ 143.6 billion(Exchange rate of 3.4092 BRL per USD, Apr. 2018 monthly average)+Liquefied Petroleum Gas
74 ProjectsAuctioned or Renewed
US$ 42.1 billion*
In expected investments
Electric
Power
Privatization of CELG-DFeb. 2017
46 Transmission LotsAug. and Dec. 2017
4 Concessions of Hydroelectric Plants: São Simão, Jaguara, Miranda e Volta Grande
Sep. 2017
Extension for the Small Hydroelectric Plant of Pery/SC
Jul. 2017
Oil and
gas
4th Marginal Fields RoundMay 2017
14th and 15th Exploratory Blocks Bidding Round
Sept. 2017 and Mar. 2018
2nd and 3rd Pre-Salt Production Sharing Bidding Rounds
Oct. 2017
Port
Terminals
Florianópolis, Fortaleza, Porto
Alegre e SalvadorJul. 2017
Airports
Salvador-Tecon and Paranaguá-FosparNov. 2016
STM 04 e 05 – SantarémMar. 2017
Santa Catarina–TescJul. 2017
Wheat Terminal – RJ and Itaqui/MA -
TequimarAug. 2017
Vila do Conde/PA – Convicon, Nitport and
Nitshore – RJNov. 2017
3 LPG+ Terminals - Miramar/PAApr. 2018

ONGOING PROJECTS
20
101PPI Projects
US$ 39.4 billion*
in expected investmentsPort Terminals
25
Highways Railways
8 8Oil and gas
Electric PowerMining
21 Pre-salt sharing
1 Marginal accumulation
32UHE - 1 Extension
Privatization
6 Distributors and Eletrobras
Concession
24 Transmission Lots
4Concession to exploitation
of Mining areas
4 Biddings 5 Renewals
Lottery
1Concession of the
right to exploit
3 Biddings4 Studies
17Airports
13 Concessions
4 Shareholding selling
COMAER
1Public-Private Partnership
(PPP)
Currency House
1Privatization
Supply
2CEASAMINAS
CASEMGPrivatization
*R$ 134.3 billion(Exchange rate of 3.4092 BRL per USD, Apr. 2018 monthly average)

PRIORITY AGENDA
Tax simplification: Social Contribution Reform
Central Bank autonomy
New legal framework for tenders and public
procurements
New public finance law
Regulation on civil servants’ salaries
21
Business improvement and recovery program of
state-owned companies
New real estate purchase contracts law
Update of the General Telecommunications Law
Privatization of Eletrobras
Strengthening of Regulatory Agencies

High-level event for CEOs
2 full days of Panels with Ministers and CEOs
Macroeconomic Scenario
Investment Opportunities
Regulatory Framework
More information and pre-register: www.brasilinvestmentforum.com
BRASIL INVESTMENT FORUM 2018
May 29-30, in São Paulo, Brazil
Unique opportunity for direct meetings with high-level Brazilian authorities

WALTER BAÈRE FILHO
Deputy Executive Secretary of Planning, Development and Management
THANK YOU!