the recovery of biological particles in high … · the recovery of biological particles in...
TRANSCRIPT

THE RECOVERY OF BIOLOGICAL PARTICLES IN HIGH-SPEED CONTINUOUS CENTRIFUGES
WITH SPECIAL REFERENCE TO FEED-ZONE BREAK-UP EFFECTS
by
Klaus Mannweiler
A thesis submitted to the University of London for the Degree of
Doctor of Philosophy
October, 1989
BIBL.LONDIN.UNIV.
S.E.R.C. Centre for Biochemical Engineering
Department of Chemical and Biochemical Engineering
University College London
Torrington Place, London WC1E
1

Acknowledgements:
I wish to thank:
my supervisor Dr. Mike Hoare, for his continuous support and encouragement
throughout this work,
Prof. Peter Dunnill and Dr. Nigel Titchener-Hooker of University College for
providing me the benefit of their experience and knowledge,
Dipl.-Ing. W. Kohlstette of Westfalia Separator for providing me with
valuable and encouraging advice on operation and maintenance of the
centrifugation equipment,
Dipl.-Ing. P. BrUning, Dipl.-Ing. W. Mackel and Dipl.-Ing. U. Wrede of
Westfalia Separator AG for their valuable suggestions and technical
support provided during my stay at Westfalia Separator in Oelde, West
Germany,
Dipl.-Ing. H. Hemfort of Westfalia Separator for providing the financial
support without which this work would not have taken place,
John Betts, Don Montgomery, Clive Osborne and all the other workshop staff
of University College for the construction of equipment and their precious
technical assistance,
and last but by no means least, I wish to thank my girl-friend for her
substained encouragement, tolerance and invaluable assistance during the
many hours I spent working on this thesis at home.

Abstract
In the first part of this thesis the means are described by which an
industrial disc stack centrifuge may be scaled-down to process in a
meaningful fashion small volumes of particle suspensions. The centrifuge
separation characteristics so measured were suitable for direct scale-up
predictions of centrifuge performance. Experiments with a dye tracer and a
reduced number of discs indicated that the flow through the disc
centrifuge is influenced by the position of the separating discs within the
disc stack.
This influence was also reflected in the separation performance of a
particulate suspension. The results were shown to be in the range obtained
using a full-scale industrial disc centrifuge. Experiments also showed a
distinct trend that the flow rate and in particular the single passage
throughput influenced the separation performance. Using a non-linear
curve-fitting algorithm it was shown that the grade efficiency curve of a
disc centrifuge may be approximated by a two-parameter model equation.
In the second part of this thesis the means are described by which various
feed zones designs may be examined in respect to particle breakup using
small volumes of a diluted protein precipitate suspension. It has been
shown that in the high shear fields which are present in the feed zones to
centrifuges the precipitate particles are readily disrupted into smaller
fragments, the fragment size depending on the strength of the shear field.
Examination of three different feed zone types revealed that particle
breakup increased in the following order:
full-hermetic < hydro-hermetic < semi-hermetic
It has also been demonstrated that the bowl speed and in particular the
rotational velocity of the distributor ribs has a significant influence on
the level of particle breakup in the hydro-hermetic feed zone, while the
effects were less pronounced in the full-hermetic feed zone.
Based on the results obtained during the above studies the major mechanism
of particle breakup is thought to be due to a combination of turbulence
and collision of the particle suspension with the rotating distributor ribs.
It has been shown that the level of particle breakup is directly related to
the circumferential velocity of the distributor ribs.
-3-

Contents
Abstract 3
List of Contents, Tables and Figures 4
1. Introduction 12
1.1 Overview and aims of research 12
1.2 Solids recovery by centrifugal separation 13
12.1 Nozzle disc stack centrifuges 15
12.2 Self-cleaning disc centrifuges 15
1.2.3 Other types of centrifuges 16
1.3 Some theoretical aspects of centrifugal
separation 18
13.1 Separation in an ideal disc centrifuge 19
1.3.2 Separation in a real disc centrifuge 25
1.3.3 Problems associated with the centrifugal
recovery of biological solids 31
13.4 Biosafety aspects 36
1.4 Protein precipitation 38
1.4.1 Methods of protein precipitation 38
1.4.1.1 Salting out 38
Isoelectric precipitation 40
Precipitation by organic solvents 41
Other methods of protein precipitation 42
1.4.2 The theory of protein precipitate formation 42
1.4.3 Physico-chemical characteristics of soya
protein precipitate 45
Density of protein precipitate 45
1.432 Rheology of protein precipitate suspensions 48
1.4.4 Factors affecting aggregate size 49
1.5 Breakup of aggregates under turbulent shear 50
1.5.1 Mechanisms of aggregate breakup 52
1.5.2 Protein precipitate breakup in downstream
processing equipment 55
1.6 Choice of particle system 58
1.6.1 Evaluating the recovery performance of a disc
centrifuge 58-
1.6.2 Shear-associated particle breakup 60

2. Scale down of disc stack separators 61
2.1 Description of equipment and experimental
procedure 61
2.2 Measurements of solid properties 62
22.1 Particle size analysis 62
22.1.1 Electric zone sensing method 62
2.2.1.2 Photosedimentometer 64
2.2.2 Physico-chemical properties of solids and liquid
phase 69
2.23 Tracer studies 69
2.3 Results 76
23.1 Disc photosedimentometer studies 76
2.32 Tracer studies 82
2.3.3 Separation performance 83
2.33.1 General remarks on the preparation of the feed
suspension 83
23.3.2 Effects of scale down on the separation
performance 84
2.3.4 Mathematical formulation of the grade efficiency
curve 92
23.4.1 Two-parameter model of grade efficiency curve 99
2.3.5 Application of the grade efficiency correlation
function 108
23.6 Determination of the total separation efficiency
based on optical density measurements 112
3. Preliminary studies of aggregate breakup in feed
zones to disc stack centrifuges 114
3.1 Preparation of protein precipitate suspension 114
3.1.1 Total water extract 116
3.1.2 Isoelectric protein precipitation 116
3.2 Centrifuge operation 119
33 Particle size analysis 119
3.4 Physico-chemical properties of precipitate 120
3.5 Results 121
3.5.1 Preliminary experiments and results 121
3.5.2 Aggregate breakage in feed zone to disc
centrifuge 127
-5

352.1 Effect of particle breakup on mass yield
127
3.5.2.2 Estimation of sheared feed size distribution
using an inversion algorithm
133
4. The examination of various feed zone types to
centrifuges in respect to shear associated
particle breakup
139
4.1 Objective 139
4.2 Description of the various feed zone designs 139
42.1 The semi-hermetic disc centrifuge 139
4.2.2 The full-hermetic disc centrifuge 141
42.3 The hydro-hermetic disc centrifuge 143
4.3 Experimental 148
42.1 Preparation of feed suspension 148
43.1.1 Polyvinylacetate suspension 148
4.3.1.2 Isoelectric soya protein precipitate suspension 148
4.3.2 Experimental set-up 151
4.3.3 Experimental procedure 152
43.4 Scale-down of disc centrifuge 157
4.3.5 Particle size analysis 157
4.4 Results 159
4.4.1 Results obtained using polyvinylacetate particles 160
4.4,2. Results obtained using protein precipitate
particles 168
5. Discussion 177
5.1 Evaluation of the separation characteristics of a
scaled-down industrial disc centrifuge 177
5.2 Modelling of grade efficiency curve 181
5.3 Evaluation of shear breakup in feed zones
to disc centrifuges 188
6. Conclusions
195
List of symbols 197
References 207
Appendix 212
-6

List of Tables
Table 1.1: Physico-chemical characteristics of some biological products.
Table 1.2: Calculated hydraulic throughput capacities for complete
particle removal for an intermittent disc stack centrifuge
using solids of different specifications.
Table 1.3: Density determination of isoelectric soya protein precipitate.
Table 1.4: Physico-chemical constants of polyvinylacetate.
Table 2.1 Disc stack centrifuge design specifications.
Table 2.2: Summary of dye tracer study results.
Table 2.3: Summary of results obtained during grade efficiency
approximation using Equation 2.27 and experimental data.
Table 2.4: Separation of bakers yeast cells in a scaled-down disc stack
separator. Comparison of experimental and theoretically
predicted separation performance.
Table 3.1: Precipitation reactor dimensions.
Table 3.2: Some important physico-chemical properties of a soya protein
precipitate suspension at a temperature of 20 T.
Table 3.3: Predicted and measured mass yield for precipitate particles
separated in a full-hermetic disc centrifuge.
Table 3.4:
Predicted and measured median particle diameters of
polyvinylacetate particles in feed to disc centrifuge.
Table 35: Predicted median particle diameters of protein precipitate
before and after shear breakup in a full-hermetic feed zone.
Table 4.1: Examination of separation performance of disc centrifuge
equipped with different feed zone designs using protein
precipitate particles.
-7-

List of Figures
Figure 1.1: Classification of centrifugal separation equipment.
Figure 1.2: Design of five types of centrifuges commonly found in
downstream processing of fermentation products.
Figure 1.3: Flow through the disc space of an disc centrifuge.
Figure 1.4: Qualitative flow profile in disc spacing (8 long caulks)
observed by Brunner, 1979.
Figure 1.5: Critical Rossby-number as a function of dimensionless flow
parameter X.
Figure 1.6: Suspension loading (a) via disc periphery and (b) via feed
channels.
Figure 1.7: Grade efficiency T of an ideal and real disc stack separator.
Figure 1.8: Stokes sedimentation of spherical particles.
Figure 1.9: Relative settling velocities as a function of solids
concentration.
Figure 1.10: The effect of pH on the concentration of soya protein
remaining in solution expressed as a function of initial
concentration of total water extract (Virkar et al, 1982).
Figure 1.11: Deagglomeration of precipitated soya protein aggregates
exposed to laminar shear (Bell, 1982).
Figure 1.12: Schematic diagram of the transformation of a particle size
distribution due to particle breakup in the centrifuge feed
zone and particle separation in the disc stack (Bell et al,
1983).
Figure 2.1: Schematic diagram of the three different sizes of blank
aluminium inserts used to replace parts of the active discs
Inside a disc centrifuge.
Figure 2.2: Schematic diagram of experimental set-up.
Figure 2.3: The electric zone sensing principle.
Figure 2.4: Schematic diagram of disc photometer assembly.
Figure 2.5: Diagram of disc stack separator showing the position of the
active discs within the dummy disc stack.

Figure 2.6:
Figure 2.7:
Figure 2.8:
Figure 2.9:
Figure 2.10:
Figure 2.11:
Figure 2.12:
Figure 2.13:
Figure 2.14:
Figure 2.15:
Figure 2.16:
Figure 2.17:
Figure 2.18:
Figure 2.19:
Change of extinction coefficient with particle diameter and
wavelength at constant refractive index.
Change of extinction coefficient with particle diameter and
relative refractive index at constant wavelength.
Change of specific turbidity of a polyvinylacetate suspension
with particle diameter.
Cumulative volume oversize distribution of a polyvinylacetate
suspension determined using different particle size analysing
techniques.
Grade efficiency curve of disc stack separator - the effect
of disc location on separation performance. The number of
discs is 17; top position (A) of discs (see Figure 2.5).
Grade efficiency curve of disc stack separator - the effect
of disc location on separation performance. The number of
discs is 17; bottom position (13) of discs (see Figure 2.5).
Grade efficiency curve of disc stack separator - the effect
of disc location on separation performance. The number of
discs is 7; top position (A) of discs (see Figure 2.5).
Grade efficiency curve of disc stack separator - the effect
of disc location on separation performance. The number of
discs is 7; bottom position (13) of discs (see Figure 2.5).
Grade efficiency curve of disc stack separator - the effect
of disc location on separation performance. The number of
discs is 7; top of insert Ii (see Figure 2.5 C).
The change of grade efficiency T with increasing values of
did.. (k = constant).
The change of grade efficiency T with increasing values of
d/dc (n = constant).
Typical results sheet obtained after regression procedure.
Plot of grade efficiency against dimensionless particle size.
The effect of single passage throughput capacity on the
ratio of measured and calculated mass yield (k).
Figure 2.20: Plot of the mass yield determined by electric zone sensing
technique and optical density measurement.

Figure 3.1: Process flow sheet of experimental set-up.
Figure 3.2: Schematic diagram of the pilot scale vessel used for the
isoelectric precipitation of soluble soya protein.
Figure 32: Effect of shear rate and exposure time on particle breakup
in a laminar shear device.
Figure 3.4: The change in cumulative volume oversize from exposure to
shear in a diaphragm valve.
Figure 3.5: The effect of total protein concentration on the optical
density of precipitate samples = 695 nm).
Figure 3.6: The effect of median particle size on the optical density of
a protein precipitate of constant concentration.
Figure 3.7: Particle size distribution of protein precipitate entering the
disc centrifuge and grade efficiency curves for precipitate
particles at different flow rates calculated on the basis of
Equation 2.27 with the coefficients k= 0.865 and n = 2.08.
Figure 3.8: Shear breakup in centrifuge feed zone demonstrated in form
of dimensionless grade efficiency curves of polyvinylacetate
and precipitate particles.
Figure 3.9: Block diagram of the computer program used to solve Eqn. 3.6
in order to calculate the sheared feed size distribution.
Figure 4.1: Operating principle of centripetal pump.
Figure 4.2: Semi-hermetic version of intermittent disc stack centrifuge.
Figure 4.3: Full-hermetic version of intermittent disc stack centrifuge.
Figure 4.4: Hydro-hermetic version of intermittent disc stack centrifuge.
Figure 4.5: Practical operating area of hydro-hermetic disc stack
centrifuge.
Figure 4.16: Sectional view of rib-body design used in hydro-hermetic
disc centrifuge (design version ID.
Figure 4.7: Experimental set-up of total water extract preparation.
Figure 4.8: Experimental set-up for the study of the shear-associated
particle breakup in different feed zone designs.
Figure 4.9: Effect of feed zone design on separation performance. Plot of
grade efficiency against the dimensionless particle diameter

for three different feed zone designs using a
polyvinylacetate/water suspension as model product.
Figure 4.10: Effect of separation area scale on separation performance.
Plot of grade efficiency against the dimensionless particle
diameter for three different separation area sizes using a
polyvinylacetate/water suspension as model product.
Figure 4.11: Reproducibility of separation performance results. Plot of
grade efficiency against the dimensionless particle diameter
for three independent experimental trials using a
polyvinylacetate/water suspension as model product.
Figure 4.12: Comparison of the dimensionless grade efficiency curve of a
disc stack centrifuge operated at different bowl speeds
using a polyvinylacetate/water model suspension.
Figure 4.13: Relative mass yield obtained for a polyvinylacetate/water
suspension at different specific throughput capacities.
Figure 4.14: Reproducibility of a batch-prepared soya protein precipitate
applying constant preparation and precipitation conditions.
Figure 4.15: Mass yield obtained for the separation of soya protein
precipitate separated in a full-hermetic disc stack
centrifuge operated at two different throughput capacities.
Figure 4.16: Relative mass yield obtained for a protein precipitate
suspension separated in disc stack centrifuges of different
feed zone designs, throughput capacities and bowl speed.
Figure 4.17: Effect of rib-body design on the relative mass yield
obtained for the separation of a protein precipitate
suspension.
Figure 5.1: Comparison of grade efficiency curves of a disc stack with
reduced sedimentation area and a full set of discs of an
industrial disc centrifuge.
Figure 5.2: The effect of single passage throughput on the ratio of
measured and predicted mass yield (Rd. The predicted mass
yield was calculated using Equation 2.22 in conjunction with
Equation 4.1.
Figure 5.3: Simulated recovery of prochymosin inclusion bodies in an
industrial disc centrifuge and extent of removal of cell
debris from the inclusion bodies.

1. Introduction
1.1 Overview and aims of research
Recent advances in biological sciences have led to a
of the biotechnology-based industries. This growth has
demands of separation processes including high-speed
advantages of centrifuges include:
rapid development
led to increased
centrifuges. The
continuous processing
- small space requirements
- enclosed system
- aseptic product treatment
adaptation to different separation requirements by variation of
throughput
clean-in-place (CIP) operation possible
relatively insensitive to variation of process feed stream
composition and to presence of foulants or extreme operating
conditions.
However despite these advantages there are a series of problems associated
with the centrifugal recovery of biological products. Globular proteins, for
instance, tend to be unstable undergoing denaturation when subjected to
air/liquid interfaces, cooling of the separator is necessary to avoid
thermal damage to sensitive proteins and finally, loss of solids recovery
efficiency may occur due to breakup of aggregates in the centrifuge feed
zone. All of these factors may contribute to make a separator
inappropriate for a particular separation problem.
This thesis examines the degree of damage to precipitated protein
aggregates in the feed zone of a high speed disc centrifuge. The methods
of protein precipitation and the effect of shear have been studied by a
number of workers but little is known about the breakage of protein
aggregates in centrifuges. The aims of the research are basically
threefold:
(i) development of an experimental method to determine and quantify
the breakage of protein aggregates in centrifuges

(ii) examination of the relationship between aggregate breakage and
various machine operating parameters such as bowl speed and
throughput capacity
(iii) improvement, redesign and testing of different feed zone types.
The study will aim to increase the basic understanding of the nature of
breakup in centrifuges. The results will enable the manufacturer of
centrifugal separators to improve the separation performance of their
centrifuge thereby making them more economical. Alternatively the results
will point out the need for more research into ways of making particles
more resistant to shear.
1.2 Solids recovery by centrifugal separation
Solid-liquid separation based on centrifugal sedimentation relies on the
density difference between the solid and liquid phase. In a centrifuge the
solids particles are subjected to centrifugal forces which make them move
radially outwards provided they are more dense than the carrier liquid and
that their motion overcomes the Brownian motion.
For industrial applications five main types of centrifuges may be
distinguished according to the design of the bowl and the way by which the
solids are removed. Figure 1.1 shows a schematic classification of the
equipment including the mode of solids discharge and centrifuge operation.
One of the most common types of centrifuges found in biochemical
downstream processing is of the disc stack type. Disc stack centrifuges
contain a set of truncated, conical plates or discs separated by spacer
ribs, rotating at a very high angular velocity. The feed is introduced to
the rotating bowl by a stationary or a rotating feed pipe for non-nermetic
and hermetic (sealed) machines respectively, passes through the distributor
into the narrow disc spaces of the disc stack where separation and
clarification of suspended particles from the liquid phase takes place.
Solids are thrown radially outward by the centrifugal forces acting upon
them. After they reach the underside of one of the conical discs, the
particles slide downward and finally outward on the bottom side of the
discs into the sediment holding space. The clarified liquid flows to the
- 13 -

top of the bowl and leaves the bowl over the inner ring dam. Alternatively
a build-in centripetal pump is sometimes used for an enclosed discharge of
the liquid phase.
Centrifugal Sedimentation Equipment
Tubularcentrifuge
Muitichambercentrifu e
Imperforatebasket centrifuge
Decantercentrifuge
Disc stackcentrifuge
Solids
retaining
type
Solids
electing
type
Nozzle
type
Batch operation Continuous operation Continuous
operation
and discharge
Batch intermittent Continuous
operation discharge discharge
Figure 1.1: Classification of centrifugal separation equipment.
The solids that accumulate in the sediment holding space can be removed in
different ways. They can be retained in the bowl and when the space is
filled, the centrifuge can be stopped, the bowl dissembled and the solids
can be removed by hand. However, this method is only practical when the
amount of solids in the feed is very small. For feeds containing higher
solids concentration the following types of machines are widely used:
- 14 -

1.2.1 Nozzle disc stack centrifuges
Nozzle disc stack separators, Figure 1.2 c, continuously discharge solids in
form of a slurry through nozzles located at the outer diameter of the
bowl. The wet solids concentration in the feed can be up to 20 % (v/v) or
sometimes more depending on the flow characteristic of the ejected slurry.
Nozzle centrifuges are designed to minimize plugging and nozzle erosion,
and in fact they can handle solids that are too compact or sticky to
discharge from other types of centrifuges. Nozzle openings range from
about 0.5 to over 3 mm on the larger machines and there are up to 24
nozzles depending on the size of the machine. To avoid plugging of the
nozzles, the feed is typically screened to remove solids with sizes in the
order of 50 to 60% of the nozzle diameter. To protect against erosion,
nozzles are hard-faced with special alloys.
In general, nozzle separators are useful where the separation is fairly
easy and the quantity of solids to be handled is rather large. For
separation tasks involving varying or small quantities of solids, the
application of a nozzle disc stack separator would be unsuitable. A self-
cleaning disc stack centrifuge should be used instead.
1.2.2 Self-cleaning disc centrifuges
In self-cleaning separators, also known as intermittent discharge disc
stack centrifuges (Figure 1.2 d) the solid particles are ejected
periodically from the sediment holding space while the centrifuge continues
running almost at full speed and without interrupting the feed supply. The
bowls of these machines have a sediment-holding space in the form of a
double cone, in which the solids accumulate. When this sediment-holding
space is filled, ports in the periphery of the bowl are hydraulically
opened and the solids are ejected at full bowl speed.
Solids ejecting centrifuges can handle feed with a wet solids content up
to 10% by volume. A higher solids content in the feed phase requires
frequent solids ejection thereby exerting undue strain upon the bowl
opening mechanism. The maximum volume of solids that can be handled per
unit of time mainly depends on the size of the bowl.

1.2.3 Other types of centrifuges
Other types of centrifuges applied in the biotechnology-based industries
are the tubular bowl centrifuge, the multichamber centrifuge and the
decanter or scroll discharge centrifuge (Figure 12 a, b, e). Although the
machines are described in detail elsewhere (Sokolow, 1971; Bell et al.
1983) a brief summary of the basic principles and field of application
shall be given.
The tubular bowl centrifuge has a relatively simple design. The suspension
is pumped into the rotor via a nozzle through the bottom and solids are
sedimented to the rotor walls as the fluid flows upward. The supernatant
is discharged via an inner ring dam or by the use of a centripetal pump.
The solids that accumulate on the rotor wall need to be removed manually
which requires stopping the centrifuge and interrupting the separation
process. Despite its excellent clarification capabilities owing to its low
solids-collecting volume the application of the tubular bowl centrifuge is
limited to process fluids with low solids contents (<1% by volume).
In the downstream-processing of fermentation-based products the tubular
bowl centrifuges are often used for the final polishing of preclarified
solutions if a clear supernatant is required (e.g. prior to extraction or
chromatography).
The multichamber centrifuge is basically a solid-wall bowl centrifuge with
high solids capacity but manual discharge. The bowl is equipped with up to
five concentric chamber inserts, which have the effect of extending the
axial flow path and helping to improve the uniform solids distribution in
the bowl, hence leading to an optimum utilisation of the sediment-holding
space. The solids capacity of this bowl type varies from 1 to 65 litres of
centrifuged, packed solids. The product is fed into the centre of the bowl
via a closed-line system and is removed under pressure via a centripetal
pump. In the inner chamber only the coarser particles are removed from the
feed stream. On the way to the periphery the centrifugal force increases
proportionally to the distance from the central axis, hence finer solid
particles will be recovered.
The relatively low centrifugal force compared with tubular bowl or disc-
type centrifuges is compensated by the high residence time of the product
stream in the bowl. However long residence times require cooling of the
- 16 -

' Solids
a. Tubular bowl
4)1(
/IN
b Mullichamber
4)1 r
bowl when processing thermally sensitive products. The heat is generated
during operation by air friction at the outer bowl wall, liquid friction of
the centripetal pump, and mechanical friction from the clutch, gear box and
bearings.
The main field of application of this type of centrifuge lies in the
fractionation of human blood plasma according to the Cohn process (Foster
et al. 1980) where the application of a self-cleaning separator is not
suitable due to the susceptibility of the product.
a Disc, nozzle
e Scroll
1 4d Disc, intermittent
discharge
Figure 1.2: Design of five types of centrifuges commonly found in
downstream processing of fermentation products.

The design of the decanter centrifuge is derived from the tubular bowl
centrifuge with the modification that the solids discharge from the
horizontal bowl is accomplished by means of a conveyor screw which rotates
at a different speed from the bowl. The objective of this type of
centrifuge is usually to concentrate the solids in process liquids with
high solids content. In contrast to the disc-type centrifuges the
centrifugal force is small but the ability to handle various types of
solids at high concentrations and the versatility of the basic design for
use in liquid-solid, liquid-liquid-solid, and for liquid-liquid separation or
even extraction problems makes the decanter centrifuge very attractive for
many processes. Apart from the level of the centrifugal force the
performance of the decanter centrifuge is influenced by the transport of
the sediment out of the bowl. Its main application is its use as a primary
separation step for the clarification of fermentation broth and sludge
dewatering in the waste-water industry.
1.3 Some theoretical aspects of centrifugal separation
Generally Stokes' law is used in order to describe the sedimentation
process of a solid particle within a centrifugal field and is the starting
point for the theoretical understanding of all sedimentation processes.
Stokes' law assumes small, inert spheres, laminar flow conditions and
diluted particulate dispersions and although these conditions are rarely
met in practice, it is still the simplest model to describe the
sedimentation of a solid particle in a centrifugal field.
The sedimentation velocity v. of a solid particle settling in a centrifugal
field is related to the gravitational sedimentation velocity, v g , by:
6)2r
V, = Vg -
1 . 1
where a is the angular velocity of the bowl, r is the radius of rotation
and g is the gravitational constant. The gravitational sedimentation
velocity vg is calculated by:
Ap d2vg = 1.2
18 p
where d is the particle diameter, Ap is the density difference between
- 18 -

solid and liquid phase and p is the dynamic viscosity of the carrier liquid
or suspension.
Equations 1.1 and 1.2 are valid in the absence of hindered settling or of
turbulent settling (i.e. Re (= v..pd/p) < 0.5). For higher Reynolds numbers
equations have been derived by Sokolov (1971) and Hue (1981).
13.1 Separation in an ideal disc centrifuge
In order to describe the clarification process in a centrifuge the
general "Separation Area Concept" or Sigma Theory is applied. This concept
compares the settling area of a centrifuge calculated on the basis of the
geometry and speed of the centrifuge with the settling area of a gravity
settling tank capable of the same separation performance as the
centrifuge. The derived centrifugal settling area is therefore called
equivalent separation area A.. Theoretically a centrifuge with an
equivalent separation area of 10,000 m2 is capable of the same separation
performance as a 100x100 in rectangular gravity settling tank while the
dimension of the centrifuge are only of the order of 2x2 m.
It is important to be aware of the conditions and assumptions on which
derivation of the subsequent equations are based. These assumptions,
though necessary when analysing the problem, impose limitations to the
sedimentation area concept which should be fully recognized. These
assumptions may be divided into two groups:
a) Assumptions concerning the feed material
1. Particles are spherical in shape and and do not tend to
deaggregate or flocculate during their passage through the
centrifuge.
2. The particles are evenly distributed in the continuous liquid
phase and their concentration is low enough to exclude inter-
particle interferences, also known as hindered settling.
3. The settling velocity of the particles in the centrifugal field,
v., does not exceed the conditions laid down by Stokes law for
which the Reynolds number should be smaller than 0.5.
- 19 -

b) Assumptions concerning the fluid flow through the centrifuge
1. Laminar flow at all points of the disc space.
2. The continuous phase is assumed to divide evenly between all the
disc spaces.
3. Particle separation is irreversible (i.e. separated particles do not
reenter the liquid phase by remixing)
4. The velocity profile of the suspension normal to the disc surface
is symmetrical.
5. The flow lines of the continuous liquid phase is assumed to be
directed everywhere radially and that no tangential flow occurs.
In a disc stack centrifuge the separation area is enlarged by incorporating
a large number of truncated, conical discs. The gaps between two adjacent
discs vary according to the processed solids between 0.3 and 2.0 mm. The
number of such discs in a disc stack varies from approximately 40 for
small to over 250 for large centrifuges.
The general mode of separating a particle from a continuous liquid phase
in an ideal disc stack centrifuge is now considered (Figure 1.3). The flow
of the continuous liquid phase containing solid particles to be separated,
is assumed to be evenly divided between the spaces formed by discs. The
flow in each disc space is therefore Q/z where Q is the total flow through
the entire disc stack and z is the number of discs. The floc., of the liquid
phase is also assumed to be in a radial plane and directed parallel to the
surface of the rotating discs or, in other words, to have the same angular
velocity as the disc stack. Under these conditions the relationship between
the single passage throughput, q, and the meridian fluid velocity, v(h), is
given by:
Q/z = q = j 2nr v(h) dh
1.3
where z represents the number of discs, r describes a radial position in
the disc space and h is the gap width.
- 20 -

Figure 13: Flow through the disc space of an disc centrifuge.
In order to describe the separation capability of a disc centrifuge it is
convenient to calculate the gravitational sedimentation velocity, v,. of
those particles which will just be separated from the continuous liquid
phase when starting at the upper surface of the lower of the two discs
defining the disc space at the outer disc radius Rz and reaching the
settling wall, which is the lower surface of the upper of the two discs,
before the liquid leaves the disc space at the inner disc radius R.
The flow velocity as a function of the radius of rotation is given by:
1 dqv (h) =
1.42 xr dh
The particle trajectory in the disc spacing is composed of the radial
particle settling velocity:
ds dhvz =
1.5dt dt cos,
where 9 is the disc angle as defined in Figure 13, and the particle
-21 -

dq= v,
q = v,
velocity, v,, parallel to the disc surface which is approximately equal to
the velocity of the continuous liquid phase, v(h):
dL drv, a v(h) = 1.6
dt dt sine
Writing Equations 1.5 and 1.6 for dt gives the so called "Differential
Quotient" of the particle trajectory:
v(h)dr -
tamp dh 1.7vx
Substituting the liquid phase velocity, v(h), of Equation 1.7 by the
expression given in Equation 1.4 gives:
1 dqdr = tan, ----
1.82xr vx
writing Equation 1.8 for dq gives:
dq = vx 2xr cote dr 1.9
The settling of a particle of size d relative to the continuous phase
in the centrifugal field was defined earlier by Equation 1.2.
Therefore substituting the centrifugal settling velocity of a
particle, vx , in Equation 1.9 by the expression given in Equation 12
gives finally:
27E 6)2
r 2 dr 1.10g tane
Integrating Equation 1.10 between the two boundaries R. and R, results in
the relationship between the single passage throughput capacity, q, and the
gravitational settling velocity, v, , of those particles which are just
removed from the liquid phase in the disc space.
2x (o2
(12. 2 - R, 2 ) 1.113g tan,

Q = v,
For a disc stack containing z discs Equation 1.11 may be modified to:
2x z 6)2
(R.3 - R 1 2 ) 1.123g tan,
Consideration of Equation 1.12 shows that the first factor, v,, refers only
to the settling characteristics of the particles distributed in the
continuous liquid phase and the second factor refers exclusively to
geometric and mechanical features of the disc stack. Separation of these
two factors leads to the following relations:
Q = v, A. 1.13
where
2x z 6)2
A-
(12. 2 - R i s ) 1.143g tan,
Again, A. has the dimension of a length squared and corresponds to the
area of a gravity settling tank capable of the same separation performance
as the disc stack defined by the parameters included in Equation 1.14.
Defining a specific throughput capacity:
q. =
1.15A„
and comparing this expression with Equation 1.13 shows that all particles
with a gravitational settling velocity of v, q, are removed from the
continuous liquid phase in the disc stack.
cL2q. = vg.. =
1.16A. 18i
Only particles which have a gravitational settling velocity greater or
equal than v,„ will be certain to settle out in the disc stack. The
separation limit, also known as the critical particle size, may be obtained
after solving Equation 1.16 for the particle diameter:
dc =
\I 18 p Q
Ap A. g 1. 17
According to Equation 1.17 only particles which have a diameter greater or
- 23 -

fL = 1 1.21
equal than dc will be recovered in the disc centrifuge. However, in
contrast to a filter for which the separation limit is a more or less
absolute quantity, particles smaller than the critical particle diameter
will, to a certain extent, also be recovered. This is due to the fact that
the particles are thought to be evenly distributed across the entrance to
the disc space. Hence particles starting at the outer disc radius but not
necessarily at the upper surface of the lower of the two discs but
somewhere in between may be of a smaller diameter than d c and may still
be separated from the continuous liquid phase. The probability of particles
of gravitational settling velocity less than v., being recovered from the
continuous liquid phase in a disc centrifuge is given by the grade
efficiency, T (see also section 2.3.4):
T= 1.18
vg.e
The grade efficiency, T, increases linearly with the gravitational settling
velocity v, until it equals the specific throughput capacity (v. = v.. c =
q.). For particles for which the gravitational settling velocity, v., is
equal or greater than v„, the grade efficiency has a value of unity.
Owing to the square relationship between the settling velocity and the
particle size, Equation 1.18 can be formulated by:
T = (d/dc ) 2for d(dc1.19
T = 1 for d)dc
In modern centrifuges, for reasons which will be explained later (see
section 1.3.2), spacer ribs (usually eight ribs per disc) are used to
separate the discs from each other (Figure 1.4). Therefore a correction
factor, f,, may be introduced in order to account for the small reduction
of separation area due to the area occupied by the spacer ribs which are
typically 6 mm wide. The equivalent separation area for a complete disc
stack is then given by:
2na2
= z
(R. 3 - R 1 3 ) fL 1.203g tan,
where,
3 ZL b, 1-(R1/R.)2
4 it R. 1-(R/R)3
- 24 -

is the number of spacer ribs on a single disc and b t is their width. If
point spacers rather than spacer ribs are used then fL = 1. In order to
calculate the corresponding throughput capacity, Q, Equation 1.12 has to be
modified accordingly.
1.3.2 Separation in a real disc centrifuge
Predictions of the separation performance of a disc stack separator
using the equations introduced in the previous paragraph often lack
similarity to practical results (Sokolow, 1971). The main reasons for the
deviation between an ideal and a real separator are essentially three:
a) Flow through the disc spacing is not necessarily laminar over the
whole gap width and radius.
b) Particle sedimentation is not irreversible i.e. particles which have
already settled on the underside of the disc may be remixed into
the carrier liquid.
c) Unsymmetrical solids loading at the entrance to the disc and
disproportionate fluid flow within the disc spacing.
Using models which apply the Navier-Stokes description of the hydro-
dynamics in a disc separator (Sokolow, 1971; Bohman, 1974; Brunner, 1979),
It has been demonstrated that the velocity distribution across the disc
spacing depends on a dimensionless number, X
X = h (4) sinl/v) i* 1.22
where h is the disc spacing, ai is the angular velocity, ip is the half disc
opening angle and v is the kinematic viscosity.
If X is smaller than it, the velocity profile is parabolic. The value of X in
Industrial centrifuges is usually between 5 and 28 (Sokolow, 1971). Brunner
and Molerus (1979) and others have calculated profiles for a number of
different X values. The relative circumferential velocity increases from
the disc surfaces to the middle of the disc spacing, and becomes - for
large X values - X. times larger than the average radial velocity. This
velocity component splits at large X values into two thin layers, one near
to each disc surface. The velocity in these layers increases and their
- 25 -

thickness decrease with increasing X. The Reynolds number increases and
transition to turbulence can take place. The reason for this behaviour is
an interplay between Coriolis, frictional and centrifugal forces.
The influence of the sediment holding space on the separation efficiency
has been examined by Skortsov (1984). He showed that there is a non-
uniform distribution of the solids particles entering the stack
because coarse particles may already settle in the outer disc space.
However, because of the use of feed channels (see Figure 1.6) those
apparently beneficial effects of the sediment holding space are limited.
caulks marker hole
dead space
Figure 1.4: Qualitative flow profile in disc spacing (3 long caulks)
observed by Brunner, 1979.
Sokolov and Dolzhanova (1972) report that the separation performance of a
disc stack separator is a function of the angular velocity of the form m2k,
where k = 0.6-0.9, due to an appreciable lag of the liquid behind the rotor
in the peripheral direction and eddy formation in the spaces between the
discs and within the rotor. On this basis, Zastrow (1976) selected
vx = v0 (rm2/g) k1.23
as an expression for the settling velocity of a particle in a centrifugal
field. Under those conditions, the corresponding equivalent separation area
- 26 -

can be modified to:
A. = (2n/k+2) cot, z (02/g)k (R.k.2_Rik.2) 1.24
For k = 1 Equations 1.14 and 1.24 coincide. Good agreement between
theoretical and experimental results was obtained for the separation of a
polyvinylacetate/water suspension if k = 0.71 is used in Equation 1:24.
In advanced centrifuges, the discs have feed channels, from which the feed
liquid enters the disc stack. Around each feed channel a vortex is formed
due to Coriolis forces. The size of the vortex increases with bowl speed
and feed flowrate (Sokolow, 1971). When leaving the flow channels, the
liquid will flow in a direction counter to the bowl rotation. The existence
of large vortices in the flow were photographed by Willus and Fitch (1973)
who used a rotating camera to observe flow patterns in a disc centrifuge.
Coarse particles are preferentially remixed by the vortex resulting in
reduced separation efficiency. Similar studies on a model separator were
performed by Brunner (1979). The lid of the bowl of his model separator
was built of transparent perspex which made it possible to observe the
streamlines of a dye tracer flowing through the disc space (Figure 1.4).
Long, radial spacer ribs proved beneficial in respect to transition from
laminar into turbulent flow. They suppress fluid flow in the circum-
ferential direction and vortex formation resulting in higher critical
Rossby-numbers u./R. 0) (Brunner and Molerus, 1979). The Rossby-number
is a dimensionless flow parameter and its plot against X is generally used
to correlate the points of transition from laminar to turbulent flow for
different separator specifications and operating conditions (Greenspan,
1968). The visual examination of the fluid flow through the disc gap of a
centrifugal separator revealed also that the use of discs with point
spacers are unsuitable for particle separation because of the premature
transition from laminar to turbulent flow in the disc gap. These points of
transition for discs with and without spacer ribs are plotted in Figure
1.5. For small X-values (X < 2n) only minor differences between point and
rib spacers are observed. In contrast, for X-values > 2n the disc without
caulks shows a further decrease in the critical Ro-number while the Ro
remains constant at Ro s 8 . 10- 3 for discs with caulks. Corresponding
values calculated for typical operating conditions of industrial
centrifuges are indicated by the hatched area of the diagram.

1
ro.,33
0
• without
• with
Rea lit:
caulks
caulks
. A s h 14-11.1—.• ••
• .
•.
8.4.-‘. _... • • . •.
, ., . •
/,'"/. i //,',.: ,. n ,/,
i .<.! •,
25
20
15
10
5
I.
6
a
10 12 16 iN 16
Figure 1.5: Critical Rossby-number as a function of dimensionless
flow parameter X.
The role of the distribution holes is to limit the degree of backmixing of
solids sliding down the disc wall into the sediment holding space. Feeding
suspension from the periphery into the disc spacing (Figure 1.6 a) gives
rise to crossflow between solids on their way to the sediment holding
space and freshly supplied feed suspension. By using distribution holes
this cross flow situation can be avoided because the sliding solids are
able to bypass the incoming suspension (Figure 1.6 b). The inevitable loss
of equivalent separation area is compensated by considerably higher
absolute throughput capacities if a maximum separation efficiency is the
objective.
Recently, BrUning (1987) has demonstrated that owing to Coriolis forces,
the use of disc stacks with feed channels cause unsymmetrical solids
loading at entry to the discs and disproportionate fluid flow through the
disc space, subsequently producing the deviation between the grade
efficiency curve of a real and that of an ideal disc stack centrifuge. The
grade efficiency, T, as a function of particle settling velocity, v.. and
- 28 -

a)
solids
particle diameter, d, respectively, is plotted in Figure 1.7. The graph
shows that the grade efficiency approaches unity at particle velocities
larger than the critical settling velocity, v or the corresponding
particle sizes greater than d,.
Figure 1.6: Suspension loading (a) via disc periphery and (b) via
feed channels.
In a real disc centrifuge Coriolis forces and momentum conservation
cause the net flow at the front side (in direction of rotation) of the
caulk to be lower than the flow on the rear side of the leading caulk
(BrUning, 1987). As a result a particle settling near the rear side of
the leading caulk will be subjected to a higher hydraulic throughput
and hence will not be recovered even if the particles are of the same
size as the critical particle diameter defined by Equation 1.17. The
particle size, d l oo, defines those particles which are just completely
separated in a real disc stack centrifuge i.e. no particles greater
than d 100 will be present in the clarified liquid discharge stream. For a
well designed disc centrifuge, up to an equivalent separation area of up
- 29 -

grade efficiency T1
0.8
0.6
0.4
0.2
0
to 300 000 m 2 , the relationship between d,„ and the separation limit cL
is generally found to be:
ILdc z 0.5 1.25
(d100
Equation 125 is valid up to average specific throughput capacities q
Q/A.) of the order of 2 L/(.h m2 ). At higher values of q further non-
ideality of flow leads to grade efficiency values lower than 1 even at
high values of d/d.-
0.5 1 1.5 2
25dimensionless diameter d/dc
Figure 1.7: Grade efficiency T of an ideal and real disc stack
separator
It is important to have clearly in mind that the above discussion only
applies for dilute suspensions. Further deviations from ideality due to
operation of the disc centrifuge at higher solids concentrations will be
discussed later.
- 30 -

1.3.3 Problems associated with the centrifugal recovery of biological
solids
The problems associated with the mechanical separation of solid phase
bioproducts are mainly due to their small particle size, the small density
difference between solid and liquid phase, high suspension viscosity, and
the sensitivity of the particles to shear associated breakup effects. Also
damage due to thermal effects and the existence of air/liquid interfaces
must be considered. The density difference between cells and a nutrient
broth is generally in the order of 10 kg/m3 with a viscosity reaching
values of the order of 1 to 5 mPas. In general, bacteria exist in two
different shapes which are either a spherical or a rod-like structure, with
average sizes between 1 and 3 gm. Yeast cells are mainly spherical with
sizes between 4 and 8 pm and therefore are fairly easy to separate. Fungi,
although comparatively large in size (up to 25 pm), can be very difficult
to separate because of their very shear-sensitive, mycelial structure.
Major difficulties are associated with the separation of cell debris
produced during homogenisation of cells in order to get access to valuable
intracellular enzymes. The size of cell debris goes down to diameters of
the order of 02 gm (Olbrich et al, 1988) and the density difference
between solid and liquid phases depends on the lipid content of the debris
and may be as small as 10 kg/m 3 . Density and sizes of protein precipitate
differ considerably depending on the protein system used and on the
precipitation method applied (Bell and Dunnill, 1982).
Table 1.1: Physico-chemical characteristics of some biological products(Bender and Koglin, 1986).
Product
class
Example Particle Density
size difference
dpIpal ApCkg/13 1
Liquid
viscosity
p[mPasl
Settling speed
gray,
mm/h
cent,
mm/h
Bacteria
Cells E,coli 1,0-1,5 4-100 1-2 0.04-0,4 0,1-1
Yeast
Cell
Bakers Y,
E. coli
6-8 4-100 1-2 1,5-10 4-30
debris
Protein
ppt,
homogenate
isoelectric,
ppt, Soy P,
0,3-0,7
0,1-50
2-200
5-250
10
1-2
0,0004-0,02
0,002-200
0,001-0,05
0,007-700
ppt, = precipitate
-31 -

Typical values are 5 to 15 )im for the average aggregate size and 10 to
150 kg m- 3 for the average density difference between aggregate and
mother liquor. Table 1.1 lists some typical values of particle size dp„
density difference (pp-pi ), and liquid viscosity .t for suspensions of whole
cells (bacteria and yeast), cell debris and protein precipitate. In addition,
the gravitational and centrifugal sedimentation rates based on the
centrifuge specifications listed in Table 2.1 (section 2.1) are shown.
In practice however the actual feed rates, Q, are substantially less than
the theoretically calculated feed rates shown in Table 12. The differences
between the practical and theoretical values increases with increasing
solids concentration in the feed and increasing morphological complexity of
the feed solids (e.g. mycelial broth). Hence, for feed solids concentrations
(1-2% v/v) the practical flowrates are of the order of two thirds of the
theoretical values; at higher feed solids concentrations (ca. 5% v/v), feed
rates of the order of one half of the theoretical value are recommended.
Table 1.2 indicates that it becomes increasingly more difficult to remove
particles in the submicron range while still providing an acceptable level
of feed throughput. For instance, to remove cell debris from a homogenized
cell suspension, with sizes of the order of 0.5 p.m, the centrifuge has to
be operated at a capacity which is far below its nominal hydraulic
throughput capacity of 5 m 3 h-1.
Table 1.2: Calculated hydraulic throughput capacities, Q, for complete
particle removal for an intermittent disc stack centrifuge
using solids of different specifications. Calculation of the Q
is based on the centrifuge specifications given in Table 2.1.
Particle Solids Suspension Throughput
diameter density density viscosity capacity
11m kg m- 3kg m-3mPas L h-'
1.2 1050 1020 1.02 6141.0 1050 1020 1.02 4260.8 1050 1020 1.02 2730.4 1100 1020 1.02 37
The calculated settling velocities are the particle settling velocities of a
single, spherical particle and are only valid for very dilute monodispersed
- 32 -

c, 1.26
particle suspensions. For more concentrated suspensions," hindered settling
occurs and the settling velocity of the particle is reduced. At a solids
concentration of more than approximately 2% (v/v) the mean distance
between two particles 1. is such that the boundary flow layers overlap(Figure 1.8) and flow of displaced liquid is created in the direction
opposite to the settling particle. Hence, the particles do not sediment in
a stagnant fluid but in an upward flowing liquid and as a result the
settling velocity is reduced. This reduction increases with increase in
solids concentration of the suspension (Ruschelknautz, 1987).
Unhindered sedimentation
Hindered sedimentation
Figure 1.8: Stokes sedimentation of spherical particles.
The radial distance between two spherical particles can be calculated
using the volume concentration c,:
V n/6
Vcube (1,/d)3
to give:
)
X/6 1/3
lm = (------ d 1.27c,
Experimenting with mono-sized, rigid and spherical particles Richardson and
Zaki (1954) derived an empirical relationship between the terminal settling
- 33 -

v * = v 1.29
velocity and the solids concentration:
vc,* = v. (1 - c,)° 1.28
where v,* is the hindered settling velocity, v, is the unhindered settling
velocity given by Equation 1.2, c, i.e the volume concentration of aggregate
in suspension and a is a geometrical factor. For mono-sized, rigid and
spherical particles a = 4.6, whereas for non-rigid, non-spherical particles
a can vary from values of about 10 to 100 resulting in large errors where
Stokes law is assumed. For flocculated yeast suspensions measured values
for a range from about 12 to 20 (Datar, 1984).
According to Barnea (1973) correlation 128 does not completely reflect the
reduction in settling velocity for dilute suspensions because the effects
of wall hindrance are not considered. Data obtained by Ladenburg (1903)
and Francis (1933) showed considerable wall effects expressed as reduction
of settling velocity, when the vessel diameter was larger than particle
size by one or two orders of magnitude. This is caused by the dissipation
of energy as a result of friction between the the moving fluid and the
walls of the settling chamber and by the restriction of the liquid flow
around the particles. Incorporating effects such as the pseudo-hydrostatic
effect (the relative density between particles and suspension decreases
with increasing solids concentration), momentum transfer effects (the
viscosity of the suspension increases with solids concentration) the
gravitational settling velocity of a spherical particle is given by:
(1 + K3c, 1 / 3 ) expE(K1c,/(1-K2c,))
From experimental data for the creeping flow range (Re < 02) using a
variety of literature sources, K 2 and 1(3 are found to be equal to 1.0 and
K, has been obtained by linear regression as 5/3. Figure 1.9 compares the
settling velocities calculated according to Equation 1.28 using a = 46 and
with the data obtained using Equation 1.29.
In contrast it is also possible that clusters of neighbouring particles
sediment together resulting in higher settling velocities than v9 . In such
cases it can often be observed that with increasing particle concentration
the settling velocity increases accordingly and, after passing through a
maximum at a solids concentration of approximately 1% (v/v), the settling
velocity falls again as a result of the rising influence of the upward
- 34 -

relative settling velocity, V/Vo1
Richardson & Uhl
Barnes
0.8
0.8
04
0.2
flowing liquid (Koglin, 1972). These effects depend on the width and the
absolute position of the particle size distribution with narrow
distributions and fine particles being less affected by the velocity
increasing influences.
0.05 01 0.15 02
0.25
solids volume concentration, Cv
Figure 1.9: Relative settling velocities as a function of solids
concentration.
Before Equation 1.12 can be applied correctly to estimate the throughput
capacity of a disc stack centrifuge the physico-chemical properties of the
solids and liquid phase have to be known precisely (section 1.4.3). This is
the point where many problems start to emerge. For example one of the
properties required is the exact density difference between aggregates (13.)
and liquid phase (p/ ). Generally for aggregated particles the density
decrease with increasing aggregate size; examples include precipitated
protein aggregates (Bell et al, 1982), flocculated yeast cells Okohman and
McLoughlin, 1984) and other flocculated products (nmnbo and Watanabe,
1979). The relationship between floc density and particle size can be
expressed in the form of an empirical equation given by (see also section
- 35 -

1.4.3.1):
= K, 1.30
where d is the aggregate diameter. The constants Ko and n have to be
found experimentally requiring several particle characterisation techniques
which will be described later.
Flocs and precipitated aggregates are particularly sensitive to shear which
causes the breakup into smaller fragments or primary particles, resulting
in a significant loss of separation efficiency. Shear forces are
particularly high in the feed zone to centrifuges (Bell and Dunnill, 1982).
Research into the problem of particle breakup have led to new feed zone
designs with mechanical seals between the feed pipe, the discharge line
and the rotating bowl. This new design allows the bowl to be completely
filled with process liquid (Ihmnfort et al, 1985) thus removing any present
air/liquid interfaces which may cause denaturation of proteins (Virkar et
al, 1982). A detailed description of three common feed zone designs of disc
stack centrifuges can be found in section 4.2 of this thesis.
13.4 Biosafety aspects
In addition to the normal safety measures associated with recovery
processes in the chemical industry, biological production plants require
additional safety measures to guarantee aseptic processing of pathogenic
(asepsis) microorganisms and to ensure sterile product handling to avoid
infection (containment). These demands and in particular the suspicion and
resentment amongst the public against new technologies involving rDNA
containing organisms on the large scale (Ellmer, 1988) calls for industrial
centrifuges which can be sterilised and which will permit operation as
part of an entirely enclosed unit to avoid either contaminatipn of the
environment or degradation of the product. In particular the release of
aerosol during the processing of both whole and disrupted cells, which has
been very common in older types of intermittent discharge continuous disc
centrifuges, during solids discharge Uhinnill, 1982) need to be
circumvented. Further demands are due to the necessity to clean the
centrifuge from time to time in order to avoid contamination of the
product or to maintain a consistently good separation efficiency. Although
the centrifuge may be disassembled fairly quickly and cleaned easily,
clean-in-place (CIP) requirements have to be met in many cases to save
- 36 -

time, personnel cost and, especially in applications involving pathogenic
microorganisms, where the product has to be handled in strictly enclosed
systems.
These demands have led to the development of fully steam-sterilizable
hermetically sealed disc centrifuges. The rotor and the housing are parts
of a fully contained system that can be sterilized with steam of at least
121 T at 1 bar excess pressure. The sterilisation procedure which includes
sterilisation of the centrifuge, all pipelines, the sterile filters for air
and water, and the condenser in the condensate discharge line, takes
between 90 and 120 minutes and requires the flushing of the complete
system with sterile water after sterilisation and cooling of the rotor
(Brunner et al, 1988). Clean-in-Place operation is achieved by flushing the
centrifuge with hot water for a period of 20 to 30 minutes. Cleaning of
the rotor and the solids-catching chamber is enhanced by several full
discharges. Additional cleaning procedures include flushing the machine
with various diluted caustic solutions, solutions containing cleaning
additives and hot solutions of diluted nitric acid (1-1.5 vol%). Grinding
weldings and surfaces minimize solids build-up in the bowl or in the
sludge-catching chamber.
During operation infection of the environment is impossible as long as no
leaks occur in the system during processing. If work has to be performed
on very harmful organisms, then safety is greatly enhanced by placing the
equipment in separate rooms that are under a slight vacuum. A useful
alternative is the use of a flexible-film isolator also known as soft film
cabinet. It consist of a light framework around and under which a PVC film
is welded. The operator gains access to equipment via a polyvinylchloride
half-suit welded into the wall. The sealed chamber operates at a small
negative pressure so that leakage, should it occur, is inward and
immediately visible as a change of the chamber wall structure Dunnill,
1982).

1.4 Protein precipitation
Precipitation is a method commonly used for the isolation of proteins
from solution and is one of the major steps used in protein purification.
Protein precipitates are aggregates of protein molecules often large
enough to be visible and to be recovered by filtration or centrifugation.
Precipitation can be performed either in a continuous, semi-continuous
(fed-batch) or discontinuous (batch) fashion. The primary objective is to
obtain aggregates which are large in size, high in density and resistant to
deagglomeration forces without denaturing the structure of the protein.
The solubility of the protein in various solvents is determined by the
distribution of hydrophilic and hydrophobic residues on the surface of the
protein molecule. Altering the protein environment by addition of a
precipitating reagent such as salts, acids or organic solvents leads to a
reduction in the barrier preventing protein association and primary protein
particles emerge which grow further by diffusional transport of protein
molecules to the solid protein surface and diffusion-controlled aggregation
of the primary particles. Subsequently, the rate of aggregation is largely
determined by orthokinetic shear-related collision; these being promoted by
continued stirring or flow of the suspension and by higher concentrations.
The final aggregate size is limited by the hydrodynamic forces causing
disruption of the aggregates.
1.4.1 Methods of protein precipitation
1.4.1.1 Salting out
An extensive review of the subject of protein precipitation by salting
out methods has been performed by Bell et al, 1983 and for this reason
only a brief overview will be presented here. Salting out is largely
dependent on the hydrophobic properties of the protein. High concentrations
of neutral salts result in the precipitation of the protein from solution.
The precipitation is caused by interactions of hydrophobic patches (side
chains of Phe, Tyr, Trp, Leu, Ile, Met, Val) on the surface of the protein
molecule. As the salt ions become solvated, there is a greater tendency,
when freely available water molecules become depleted, to draw away water
molecules ordered around the hydrophobic patches, so enabling these to
interact with each other. The larger the number of hydrophobic patches on
- 38 -
the protein molecule the faster the aggregation process. The salting outprocess can generally be described in the form of an empirical formulasuggested by Cohn (1947):
log S = 0 - Kc 1.31
where S is the protein solubility, c is the salt concentration, and 0 and K
are constants. The constant, 0, varies considerably with the nature of the
protein, is essentially independent of the salt used but is strongly
dependent on pH and temperature of protein solution. Solubility is usually
highest around pH 7, where proteins have the most charged groups.Increasing temperature generally increases the solubility of the protein.
The slope, K, is found to be independent of pH and temperature but varieswith the salt and protein involved.
The relative effectiveness of neutral salts in the salting out process,depends on the anions and gives rise to a series termed the lyotropic or
Hofmeister series in which are, in order of effectiveness of precipitation,citrate > phosphate > sulphate > acetate = chloride > nitrate >
thiocyanate. The tendency for a salt to cause structural damage to theprotein is found to be inversely related to its position in the Hofmeister
series. Hence, sulphate ions tend to stabilise the protein structure duringprecipitation.
The salts most frequently used for protein precipitation are ammonium
sulphate and sodium sulphate. Ammonium sulphate has the advantage of
being inexpensive, of high solubility in aqueous solution even at lowtemperatures and of its stabilising effects on some proteins (Dixon et al,1979). However, it does tend to become more acidic on storage and willrelease ammonia at higher pH. As a result of its high nitrogen content italso causes high levels of BOD (Biological Oxygen Demand - guidance forthe water authorities as to what extent waste water is polluted) in thewaste water. Disposal is a problem since it is highly corrosive to metals
and concrete. Sodium sulphate does not have these disadvantages but mustbe used at 35 - 40 T. to attain adequate solubility. This may be damagingto many proteins because of their tendency to be unstable at highertemperatures. Another problem to be considered when choosing a salt for
protein precipitation is its heat of solution. It is undesirable to generateexcessive heating while dissolving the salt. Also the density of the final
salt solution needs to be considered, since centrifugation relies on thedensity difference between the aggregate and the solvent.
- 39 -

80
532 7
70 -
80 -
50-
40
30 -
20-
10-
0 1 4
PH
1.4.1.2 Isoelectric precipitation
The different proportions of basic and acidic groups on the protein
surface gives rise to a pH value at which the net charge of the protein
becomes zero. At this point the solubility of a protein becomes a minimum
(Figure 1.10) and for a pure protein this minimum will be very sharp, with
greatly increased solubility at even 0.5 pH units either side of the
minimum
% protein In solution
Figure 1.10: The effect of pH on the concentration of soya protein
remaining in solution expressed as a fraction of initial
concentration of total water extract (Virkar et al, 1982).
Precipitation of protein occurs because at the isoelectric point the
electrostatic charges causing repulsion of protein molecules are removed
resulting in electrostatic attraction of molecules to each other and
increases the collision effectiveness of primary protein particles to form
larger aggregates. Precipitation performed at acidic pH's has the advantage
of the cheapness of the mineral acids, their ease of use and the fact that
several are acceptable in protein food products, e.g., phosphoric,
hydrochloric and sulphuric acids. Damaging effects on the protein by the
used acids were found to be more severe for hydrochloric acid than for
sulphuric acid or other acids with polyvalent anions (Salt, 1982).
- 4.0 -
1.4.1.3 Precipitation by organic solvents
The principal effect of precipitation is the reduction in water
activity. Addition of an organic solvent to an aqueous protein solution
will lower the dielectric constant and thus creates a medium less like the
polar protein surface. At a low dielectric constant aggregation is promoted
by increased electrostatic interactions between the dipolar protein
molecules. Hydrophobic interactions are less involved because of the
solubilizing influence of the organic solvent on these areas. The change of
protein solubility at its isoelectric point with a change in the effective
dielectric constant of the solvent can be described by:
log S = K/D.2 + log S. 1.32
where D. is the dielectric constant of the solvent/water mixture, K is a
constant embracing the dielectric constant of the original aqueous medium
and S is the extrapolated protein solubility.
Organic solvent precipitation has the advantage that it gives a very
refined method of protein fractionation. However, its major disadvantage is
the tendency of the organic solvent to cause structural damage to the
protein due to the danger of protein refolding. Because refolding
especially occurs at higher temperatures, low temperature processes are
required for this kind of precipitation. Refolding at high temperatures is
caused by small organic molecules which penetrate through 'cracks' in the
surface of the protein molecule and attach themselves through hydrophobic
forces to internal amino acid residues resulting in destabilisation of the
protein. These 'cracks' occur due to natural flexing of the protein
molecule structure. At low temperatures the lack of natural flexibility
means that solvent molecules are unable to enter the internal protein
structure. Although process cooling turns out to be rather expensive, the
overall process of protein recovery by using an organic solvent can be
economical in terms of process costs if one can easily recover the
precipitating agent and re-use it. A typical example for the successful
application of precipitation by organic solvents is the process of plasma
protein fractionation. In this process and despite the introduction of
other techniques ethanol precipitation is most widely applied and has been
developed into a highly automated computer-controlled system (Foster et
al, 1980).

1.4.1.4 Other methods of protein precipitation
Other precipitation methods involve non-ionic polymers, ionic polymers
and metal ions. Dextrans and polyethylene glycol are among the non-ionic
polymers most widely studied. The precipitation mechanism which has been
described in great detail by Kula et al. (1977) and by Hao at al. (1980)
assumes an exclusion effect of the polymer on access between protein
molecule and water.
Ionic polyelectrolytes appear to act in a way similar to flocculating
agents with some salting out and molecular exclusion action. Precipitation
of the protein comes about by formation of electrostatic complexes between
the polyelectrolyte and positively charged proteins at low pH values. The
low pH requirement is a disadvantage because many enzymes are unstable at
low pH values risking irreversible denaturation of the protein. Widely used
are polyacrylic acid salts and polysaccharides such as carboxymethyl
cellulose. Polyelectrolytes, even at low concentrations, tend to increase
the viscosity of the solvent, therefore making downstream solid-liquid
separation unit operations, such as centrifugation, more difficult.
Precipitation by metal ions is based on the formation of protein-metal
salt complexes having reduced solubility. The advantage of some metal ions
is their greater precipitation power with respect to proteins in dilute
solutions.
1.4.2 The theory of protein precipitate formation
As discussed in the previous section, the initial stage of precipitate
growth can be described as the result of collisions of protein molecules
to form small Im-imary l particles of protein precipitate.
The process of growth may be described using simplified models considering
only aggregate growth but neglecting aggregate breakup. One of the models
describing aggregate growth is the perikinetic growth theory in which
aggregate growth is diffusion controlled. Von Smoluchowski (1917) first
derived the basic kinetic expressions for the collision frequencies of
suspended, spherical particles under Brownian motion and laminar flow
regimes. He showed that for a monodispersed dispersion the initial rate of
primary particle disappearance dN/dt may be described in the form of a
- 42 -

second order equation:
dN/dt = - 'CA N2
1.33
where the rate constant 'CA is given by:
4 KE, T...
KA -3 p
where Ke, is the Boltzman constant, T.,. is the absolute temperature and p
is the dynamic viscosity. The theory assumes that the interacting particles
are of similar size and is therefore only applicable for systems with a
narrow particle size distribution and rapid coagulation conditions. Kruyt
(1952) reports that the collision rate between particles of dissimilar size
is considerably faster. Colloid particles in the micron range will collect
submicron particles by an order of magnitude faster than is expected from
perikinetic growth theory.
To account for the long range forces of particle attraction (Van der Waals
forces) and inter-particle repulsion, Smoluchowski's theory has been
modified by Fuchs (1964) to give:
4nDN2
- dN/dt - 1.34co
J exp(V/K9T...)/R 2 dR
where R is the distance between two particle centres, V is the potential
energy of particle interaction, KA is the Boltzman constant, D is the
diffusivity and d is the particle diameter.
Perikinetic particle growth is only significant for particles less than
approximately 1 pm in size, aggregating in the presence of a shear field
of less than 10 s- 1 and it does not contribute significantly to the
collision mechanism of particles above 1 pm in size (Levich, 1962).
Camp and Stein (1943) generalised von Smoluchowski's equation to account
for turbulent flow conditions. In the turbulent environment aggregate
collision is not only due to random Brownian motion but to a much greater
extent due to turbulent velocity fluctuations leading to turbulent shear
fields, differences in the individual aggregate velocities and hence, to a
greater chance of particle collision. Growth theories in which fluid
motion promotes aggregation are classified as orthokinetic growth theories.
- 43 -

For spherical particles of similar size the rate of decrease of particle
number concentration due to aggregation is given by:
- dN/dt = 2/3 Km„ 0 N 2 G
1.35
which may be rewritten
- dN/dt = 4/x Km„ G c, N
1.36
The success of flocculation is proportional to the product of collision
effectiveness factor the floc volume fraction c, (= N nd 3 /6) or the
floc concentration present in the flocculator, the residence time of the
floc in the flocculator and the specific energy input defined by Camp and
Stein (1943) as the root-mean-square velocity gradient G (P/pV)1'2)
where P is the dissipated power, IL is the dynamic viscosity of the
suspension and V is the volume of the precipitation vessel.
Equation 1.35 applies strictly only to laminar flow. For turbulent
conditions it needs to be modified to CLevich, 1962):
12 7C
- dN/dt - [Cif, G d 3 N 2 1.37/15
The collision effectiveness factor Kwff is introduced to explain such
effects as interparticle repulsion and orientation requirements. It may be
estimated by studying the rate of decrease of particle number during
perikinetic aggregation. Based on a detailed analysis of the hydrodynamics
of colliding particles, van de Ven and Mason (1977) suggest that the
effectiveness of aggregate collision is a function of shear rate and
particle diameter. They suggest that K, f , is proportional to G-0 •"3 and
approximately proportional to d- c) 73 for colloidal particles.
More sophisticated growth models include aggregate breakage terms to
account for deagglomeration due to hydrodynamic forces acting on the
aggregate surface. Aggregate breakup may be attributed to primary particle
erosion, aggregate fragmentation and rupture as a result of bulgy
deformation. The simplest correlation for breakup usually relates the
maximum stable floc size, d m., to the degree of turbulence expressed in
terms of the root-mean-square (Nns) velocity gradient, G:
dm. = C G-rb 1.38
where C is a floc strength constant and n is an exponent depending on the
- 44 -

hydraulic regime and type of floc involved. Experimental values for n range
from 0.1 for filamentous, biological flocs (Glasgow et al, 1983) and 0.8 for
Clay-Aluminium flocs (rambo and Hozumi, 1979) to 1.1 for isoelectric soya
protein precipitate (Bell et al, 1982).
Twineham et al. (1984) proposes that precipitate growth will continue until
a dynamic equilibrium state between shear-controlled aggregation and
shear-controlled aggregate breakup is reached.
1.4.3 Physico chemical characteristics of soya protein precipitate
1.4.3.1 Density of protein precipitates
The knowledge of the effective settling density of the solid phase is
an important factor in the design of protein precipitate recovery
processes. Protein recovery processes on the large scale often involve unit
operations requiring settling of the solid phase in a gravitational or
centrifugal field such as gravity settling tanks or disc stack centrifuges.
Since protein precipitate growth involves aggregation of small protein
particles, the aggregate density will be determined by its fluid voidage
and the density of the protein solid phase. Koglin (1978) proposed that the
mean porosity of an aggregate will increase with increasing degree of
agglomeration. In the course of agglomeration the individual particles will
first combine into primary agglomerates which then form larger
agglomerates, the void fraction increasing during this process.
The aggregate density may be calculated using:
P. = P. - T. (P. P*)
1.39
where p. is the density of the floc, pp is the density of the solids phase,
pf is the density of the liquid phase and 9. is the porosity of the floc.
Despite its importance to centrifugal separation only little research has
been performed on the subject of protein precipitate density. Generally,
aggregate density decreases as aggregate size increases due to the fact
that with increasing aggregate size more liquid is entrapped within the
aggregate.

The aggregate density, p. (kg m- 3 ) can be related to the aggregate
diameter, d (pm) over a narrow size range by an empirical relationship
given by:
p. = p f + Kod- r, 1.40
where pc is the liquor density, kg m- 3 . The constant Ko depends on the
nature of the solid phase and the n is a function the number of primary
particles comprising the aggregate. The size at which the aggregate
density is equal to the buoyant density is not defined in the equation and
will depend on the molecular structure and density of the primary
particles. For isoelectric soya protein precipitate the density-size
relationship can be expressed in form of an empirical correlation given by:
p. = 1004 + 246 d-0.40° 1 < d < 35 pm
Similarly for casein precipitate prepared by salting out with 1.8 M
ammonium sulphate the relationship may be written as
p. = 1136 + 31 d-° .44 ' 1 < d < 27 pm
In both cases p. is the aggregate density in kg M-3 and d is the
aggregate diameter in pm. The aggregate density may be determined using a
wide variety of methods but unfortunately each method gives a different
aggregate density value. Some of the average results obtained by Bell
(1982) for isoelectric soya protein precipitates applying various density
determination methods are shown in Table 1.3.
A density-size relationship is a common characteristic of a majority of
solids formed as a result of a precipitation or flocculation process. Tambo
and Hozumi (1979) for instance report that the density of aluminium flocs,
although much larger in size than the typical protein precipitate
aggregate, is size dependent. The use of a density based on the buoyant
density would overestimate the Stokes' settling velocity while assuming a
constant density difference based on the density of large aggregates
underestimates Stokes' law. In both cases this would result in either an
over- or an underestimation of the throughput capacity of the centrifuge.
A possible solution to determine the aggregate density is to fit the
volumetric median particle size (measured by the electrical sensing zone
method) to the photosedimentometer volumetric median particle size and
then to calculate the density difference according to Stokes' law. The
- 46 -

measured aggregate density may then be used to predict the required
throughput capacity of a centrifuge.
Table 1.3: Density determination of isoelectric soya protein
precipitate (particle size 6-8 pm mean diameter)
Method of densitydetermination density in kg m-s
Gradient centrifugation
a) CsC1 1292 1.5b) sucrose/Csel 1292 ±5
Immiscible solvent centrifugation 1080 ±15Tracer dilution 1056 ±80Settling velocity 1120 ±20Coulter counter total volume 1154 ±15
Another important factor to be considered, when separating biological
aggregates is the aggregate strength. Breakup of solid aggregates in
hydrodynamic shear fields can adversely influence their recovery. The
aggregate strength will be determined by the structure of the aggregate.
Generally, aggregate strength will increase with increasing compactness of
the aggregate. As for the density-size relationship a similar expression
may be formulated for the relationship between aggregate size and
strength. Since aggregate strength will decrease with increasing aggregate
size large aggregates tend to breakup in the centrifuge thereby reducing
its apparent solids recovery efficiency. The strength-size relationship is
of greater importance to solids recovery processes than is apparent from
examining the relevant equations. A low density difference between solid
and liquid phase may be overcome by producing particles which are large in
diameter. Stokes' law indicates that the sedimentation rate of a single
agglomerate is proportional to the square of its diameter but only
linearly dependent on the density difference between solid and liquid
phase. Therefore, large particles will always be recovered even if the
density difference is small. However, if the large aggregate is not strong
then it will rupture when subjected to the intense hydrodynamic forces
Inside a centrifugal separator. As a consequence smaller agglomerates will
emerge which are more difficult to recover. For this reason the objective
in any agglomeration process prior to a subsequent solids recovery stage
must be the production of large and dense aggregates which are resistant
to shear-induced breakup.
- 47 -

1.4.3.2 Rheologv of protein precipitate suspensions
The importance of suspension viscosity on centrifugal solid-liquid
separation is clear from Stokes' equation. Treatment of a more viscous
particle suspension results in an inversely proportional reduction of
throughput capacity if the separation efficiency of the centrifuge is to be
maintained constant. For protein concentrations up to 22 kg m- 3 in the
liquid phase (not precipitated soya protein) the dynamic viscosity may be
approximated by (Deveraux, 1986):
p = 1.00x10- 3 + 10- s c, at 25 *C
and
p = 0.55x10- 3 + 10- s c. at 50 *C
where p is the dynamic viscosity (Pas) and c, is the soluble protein
concentration (kg m- 3 ) in the liquid phase.
At higher protein concentrations pseudoplastic behaviour is observed. A
high value of apparent viscosity of the sediment will hinder sediment flow
from continuous or intermittent discharge machines. However for isoelectric
precipitates, protein concentration higher than approximately 20 kg m- 3 are
very unlikely to appear in the liquid phase of a precipitate suspension
since on average, approximately 80-85% (v/v) of the soluble proteins will
precipitate.
An important property of a protein precipitate with respect to recovery is
its resistance to movement from rest. This property effects the dewatering
characteristics of the sediment. If the protein sludge inside the bowl of
an intermittent discharge centrifuge is dewatered in excess, then it will
be of a very plastic nature (comparable with rubber) and will tend to
block the discharge nozzles. Excessive dewatering also can lead to a non-
homogeneous sediment which is difficult to handle in subsequent
processing. For this reason the sediment phase must always be wet enough
to allow passage through the discharge nozzles. However, the water content
of the protein sludge will affect the costs of unit operations downstream
to the centrifuge and hence, an optimum water content of the protein
sediment has to be obtained to ensure a good overall process performance.

ldtA Factors affecting aggregate size
For reasons described in the section on centrifugation, the aggregate
size has a major influence on the solids recovery efficiency of a solid-
liquid separator. Since with increasing aggregate size the ease of solids
recovery increases and recovery cost decreases, the production of large,
dense and strong particles must be the primary objective in any
precipitation process. The size and strength of a protein precipitate will
be affected by:
a) mode of precipitation, batch or continuous
b) choice of precipitating agent
C) protein concentration in mother liquor
d) degree of mixing (power input per unit volume)
e) mean residence time in reactor
f) pH and ionic strength
The effect of the mode of precipitation on the aggregate mean size has
been examined by Bell and Dunnill (1982). Precipitate prepared in a
continuous tubular reactor with short residence times (30-90 s) was found
to be less resistant to shear associated aggregate breakup compared to
precipitate prepared in a stirred tank. The difference is thought to arise
from the action of a batch-turbine stirred reactor where the precipitate
is exposed to high shear forces in the region near the impeller. This leads
to the development of compact, regularly-shaped aggregates as compared
with the loose irregularly-shaped ones obtained in a tubular one. To
improve the strength of aggregates prepared in continuous precipitation
processes an ageing stage is suggested where the newly formed precipitate
is subjected to high shear rates for short residence times.
Chan et al. (1986) examined the effect of different precipitating agents on
the kinetics of protein precipitation in a tubular flow reactor. The final
mean diameter of the precipitate varied with precipitating agent used in
the order: sulphuric acid (12.5 pm) > ethanol (7.5 pm) calcium ion (7.2
pm) > ammonium sulphate (3.1 pm).
The effect of the protein concentration on the final aggregate mean size
has been examined by Virkar et al. (1982) and Petenate et al. (1983). Both
researchers observed no effect of protein concentration on aggregate size
BIBLLON DIN.UNIV.
up to a concentration of 15 kg m-3.
- 49 -

Increasing the chance of collision may also be achieved by increasing the
stirrer speed or the mean residence time of precipitate in the reactor. The
maximum stable particle size is controlled by the rate of aggregate
breakup. With higher stirrer speeds higher shear forces will result in the
formation of smaller particles.
1.5 Breakup of aggregates under turbulent shear
The process of aggregate breakup under turbulent shear has been known
for many years, but in contrast to flocculation processes, has received
little attention. One reason for this may be the difficult nature of the
agglomerates which may be considered as a loose, irregular, three-
dimensional cluster of particles. The physico-chemical characteristics of
such aggregates, for instance aggregate density and aggregate strength,
are normally unclear and difficult to define.
The approaches that have been taken in the breakup studies are varied,
ranging from simple deterministic models, e.g., Healy and La Mer (1964), to
very complex population balances with multiple parameters, e.g., Pandya and
Spielman (1982). Most of the research performed in this field is based on
the breakage of polymer flocs, e.g., kaolin-polymer, kaolin-Fe-' 3 and Clay-
polymer. Less is known about the breakage of precipitated protein
aggregates and literature about it is scarce. The mechanisms for aggregate
breakup in turbulent flow can be summarized as follows:
1) deformation and rupture due to pressure differences on
opposite sides of the aggregate (bulgy rupture),
2) erosion of primary particles due to hydrodynamic shear,
3) erosion of particles larger than primary particles due to hydro-
dynamic shear,
4) fragmentation of aggregate by viscous drag or local shear, and
5) breakage by collisional fragmentation.
For analysis of floc breakup, the Kolmogoroff universal equilibrium range
theory has proved very useful. The universal equilibrium range is defined
as the range of eddies close to a characteristic microscale, where, both
viscous energy dissipation and convection are the rule. The range has been
further divided into a low eddy size region, the viscous dissipation sub-
range, and a larger size region, the inertial convective subrange. The two
- 50 -

subranges are divided by the Kolmogoroff microscale (Broadkey, 1966)
n (v 3 /e) 4. 1.41
In the equilibrium range theory it is assumed that the energy containing
eddies and the energy dissipating eddies have widely different scales
which are independent from each other (Batchelor, 1958). In addition
turbulence is assumed to be homogeneous and isotropic. The energy dissi-
pated per unit mass e of fluid is given by:
co
e = 2 (p/p) 5 k 2 E(k,t) dk 1.42
where p is the dynamic fluid viscosity, p is the fluid density, k is the
wave number (= X- 1 ) and E(k,t) represents the turbulent energy spectrum or
change of total kinetic energy of turbulence.
Since there are no external energy sources, this change in kinetic energy
must be equal to the energy dissipated at the wavenumber k. The rate of
energy removal in the high wave number range must be equal to the rate of
energy insertion by inertial transfer at the lower end of the universal
equilibrium range of turbulence. The relationship between e and the more
frequently used root mean square velocity gradient, G, is given by the
expression:
G = (e/v)"I 1.43
For the range of eddy scales in the inertial convective subrange, Batchelor
(1958) has shown that when L > X > q, the energy spectrum E(k,t) is:
E(k,t) = k / e2 /3 X5/31.44
where k l is a constant. For eddies in the viscous dissipation subrange,
Obukhoff and Yaglom (1951) obtained for X < n, the relationship:
E(k,t) = k2 (Ely ) X 31.45
where k2 is a constant. The constants k, = 0:73 in accordance with Hinze
and k2 = 4/15 in accordance with Obukhoff.

The mean eddy velocity, u,, is a measure for the intensity of turbulence.
It's relationship with the energy spectrum E(k,t) is given by:
0
u,2 = Iu(x+X,t)-u(x,t)]2 = 2/3 5 E(k,t) dk
1.46
By knowing the mean eddy velocity, it is possible to estimate the forces
acting on a floc. A great majority of models describing floc breakup
mechanisms are based on calculation of the mean eddy velocity, u,. Parker
and Kaufman (1972) suggest that the eddies of a scale similar to the
aggregate diameter have the greatest effect in terms of hydrodynamic
shear. Combining Equations 1.44, 1.45 and 1.46 and replacing X by the
particle diameter d gives:
(ed)"2d > o (inertial subrange)
= (ep/p)wid d < n (viscous subrange)
where u„ is the mean eddy velocity, e is the energy dissipated per unit
mass, v is the kinematic viscosity, n is the microscale of turbulence, 0 and
8 are constants with values of unity and (1/15), respectively (Fuchs,
1964).
1.5.1 Mechanisms of aggregate breakage
As mentioned earlier, most of the mechanisms found in the literature
about this subject are concerned with the turbulent shear disruption of
flocs aggregates which are much larger (of the order of 1 mm) than the
typical protein precipitate particle which is just 5 to 50 um in size. Only
little is reported on the breakup mechanisms of precipitated protein
aggregates. Much of the early information appearing in the literature
concerning breakage in dispersed-phase systems, dealt with the
hydrodynamic splitting of liquid drops in immiscible liquids (Hinze, 1955).
One of the first significant contributions to appear was the breakup
analysis performed by Thomas (1964), which was based on Levich's (1962)
theory of droplet splitting in two immiscible liquids. His model assumes
that under turbulent flow conditions the mechanism leading to rupture is
pressure difference on opposite sides of the floc. This pressure gradient
Is thought to cause bulgy deformation and subsequent rupture due to
random velocity fluctuations of turbulent flow. Thomas suggests that the
maximum stable floc size, i.e. the size of those flocs which are
- 52 -

stable and which are not further disrupted at the given shear-conditions,
can be written in terms of the more convenient root-mean-square velocity
gradient by:
dm., = C, G-5
d n 1.47
dm., = C2 G-1
d n 1.48
for the inertial convective and the viscous dissipation subrange,
respectively. The constants C I and C2 are complex and depend on the
physico-chemical state of the floc, such as floc density and floc strength
and on the environment the floc is subjected to, e.g., pH-value, viscosity
and temperature. It is very difficult to define or estimate these constants
analytically. The severe dependence of d..„ on G for the inertial subrange
is surprising. Thomas justifies this by suggesting that at a critical value
of G, a step change in aggregate size occurs. However, one would expect
the function
dm., = f(G) 1.49
to become more continuous in the case of large aggregates for which the
expression is derived. Parker et al. (1972) suggest that floc disruption is
primarily due to surface erosion of primary particles from the floc
surface. The study is based on Argaman and Kaufman's suggestion that the
principle mode of floc breakup is surface erosion caused by turbulent drag
forces acting on the floc surface. The rate at which primary particles are
stripped from a floc should be proportional to the floc surface area and
the shearing stress on the surface.
By assuming that the relevant eddy scales responsible for surface erosion
are in the range of the floc diameter, then the maximum stable floc size
for the inertial convective subrange is given by:
dm., = C G-2
1.50
For the viscous dissipation subrange d..„ is given by:
dm., = C G-I
1.51
Again, as before in the Thomas model, the floc strength constant is a
function of floc density, floc size and the method of flocculation. Tambo
and Hozumi (1979) have proposed that a floc binding force, F,, is
proportional to the net cross sectional area A, at the plane of rupture.
The binding force can be thought of as a measure for the hydrodynamic
forces acting on the floc.
- 53 -

By introducing a strength constant, a, the relationship between the floc
binding force, F,, and the net sectional area, A, , can be written as:
= a An 1.52
Presumably a is dependent on floc size and structure. The assumption, that
rupture of flocs is brought about by forces accelerating the flocs and
that these forces act in opposite directions, results in another expression
for the maximum stable floc size:
drn.n = C G-142 1.53
The floc strength constant and the value of the exponent are determined
experimentally by plotting the floc size as a function of the root-mean-
square velocity. Using Equation 1.52 the applicable microscale of
turbulence can be determined and regression gives the value of the
exponent and of the floc strength constant.
1 00
095
090.e-12
OM
000
0455 112
2
5
10•1
2
Average time of exposure. $
Figure 1.11: Deagglomeration of precipitated soya protein aggregates
exposed to laminar shear (Bell, 1982).
The effect of shear disruption on soya protein precipitate particles was
examined by Bell (1982). From experimental results using a capillary shear
device it was concluded that for protein precipitate the mechanism for
aggregate breakage is fragmentation with erosion occurring to a smaller
extent. Aggregate disruptions in a laminar flow field was observed to be
dependent not only on the applied shear rate but also on the exposure time
of aggregate to shear. Figure 1.11 shows the size reduction of isoelectric
- 54-

precipitated soya protein aggregates subjected to different levels of shear
and varying exposure times.
Petenate and Glatz (1982) proposed a breakage mechanism for soya
precipitate which involves the splitting of aggregates. It was concluded
that breakup of protein precipitate deagglomeration is not due to bulgy
deformation as adopted from droplet breakage in emulsion formation, but
due to local shear fields resulting in a breakage rate proportional to the
product of parent aggregate volume and number concentration of aggregate.
Twineham et al. (1984) found evidence for collisional breakage of soya
protein aggregates in Couette flow. Evidence is based on the observation
that precipitate deagglomeration rate increased with precipitate
concentration while extrapolated final sizes first decreased with
concentration before ultimately rising again. In a paper prepared for
presentation at the Annual Conference of the AIChE in Chicago, Brown and
Glatz (1985) confirmed Twineham's results. In their experimental studies
they found a concentration dependence of both the breakage rate constant,
and the extent of breakup at various concentrations. Models of a second
order rate equation were used to describe the removal of large aggregates
from the initial particle size distribution.
1.5.2 Protein precipitate breakup in downstream processing equipment
Protein precipitation followed by the separation of the precipitate from
the mother liquor, forms the basis of a group of unit operations commonly
used for the recovery and fractionation of proteins. One unit operation
involves transportation of the precipitate suspension from the
precipitation vessel to a separator in order to concentrate the protein
suspension. For batch precipitation reactors and ageing vessels this
normally requires the use of a pump, while for continuous reactors, direct
feed to a separator may be possible if the necessary pressure head
required to move the fluid can be developed upstream the reactor. This has
the advantage of avoiding any shear controlled damage or breakup within
the pumping devices. The effect of pumps on aggregate breakage of soya
protein precipitate has been examined by Hoare et al. (1982). A very rapid
breakup of precipitate particles was observed in centrifugal, mono, and
gear pumps over the first few passes, whereas no breakup was observed in
peristaltic pumps.
- 55 -

Another location of concern in respect to aggregate breakage is the feed
zone of centrifuges. Breakage of large aggregates into smaller fragments
results in reduced solids recovery because, as shown in section 1.2, theseparation efficiency of a centrifugal separator is strongly dependent on
the aggregate size. The assumption that most of the breakup takes place in
the feed zone and not in the bowl or between the discs is supported bythe observation that the relative volume of unrecovered particles broken
by shear increases as the clarification efficiency is reduced by increasing
the throughput. The increased throughput corresponds with a reduced
residence time in the bowl which would have resulted in fewer sheardisrupted unrecovered particles if disruption was primarily due to the
turbulence in the bowl (Bell and Dunnill, 1982). Although it is widely
known that aggregate deagglomeration occurs in the feed zone only very
little detailed research is actually done on this subject. The main reason
for that may be the difficulties involved in actually measuring the degree
of breakup in quantitative terms. The problem is that two separate
processes happen while a solids aggregate passes through the centrifuge.
These two processes are: (i) breakup of large aggregate in feed zone and
(ii) particle separation.
The nature of the centrifuge gives only very limited information of the
state of the particle suspension, i.e. particle concentration and size
distribution, before and after the separator. It is not possible for
instance, to collect a sample of feed suspension leaving the feed zone and
before entering the disc stack, which would give a direct measure for the
rate of breakup. Therefore, from the limited data of inlet and outlet flow
one has, somehow, to derive the required information about the breakage of
aggregates indirectly.
In any event, the relationship between the number and size of disrupted
aggregates and the centrifuge parameters such as bowl speed and feed zone
dimensions are rather complex. GOsele (1980) suggests that, based on the
laws of momentum conservation, half of the power consumed by a disc
separator is used to accelerate the fluid while the other half is lost as
a result of power dissipation in the feed zone. The dissipated power P f is
given by:
Pf = 1/2 Q p. 6)2 1- 1 2 1.54
where Q is the feed rate, o is the angular velocity, r 2 is the radius of
liquid discharge and p. is the density of the particle suspension.
- 56 -

Bell et al. (1983) has shown that for protein flocs breakup is proportional
to the square root of the dissipated power:
ln(N/No) = k P t 1.55
For N < Nm.x , where N is the number of aggregates after exposure time t,
No is the initial number of aggregates, and Nmax is the maximum possible
number of primary particles making up the aggregate, the following
relationship between the power dissipated in the centrifugal feed zone
and aggregate breakage rate using precipitated polyvinylacetate flocs in a
decanter centrifuge was developed:
ln(NGF/No) = 0.57 (15 1 ) 4 + 0.42 1.56
where NGF is the number of newly generated flocs. Rearranging Equation
1.54 and substituting the total power dissipated, P f , by the power
dissipated per unit mass (Equation 1.43) results in an expression for the
mean velocity gradient, G, which is frequently used to describe aggregate
disintegration processes:
G = (Watp/p) vg or, 1.57
where G is the mean velocity gradient, t is the exposure time to shear
equivalent to the mean residence time of the aggregate in the feed zone, p
is the kinematic viscosity and mr is the circumferential velocity at the
point of liquid discharge.
As already mentioned in section 1.2 of this thesis, it is difficult to
obtain quantitative data on the level of particle breakup in centrifuge
feed zones by virtue of the fact that particle breakup and particle
separation cannot be divided physically. The only variables which can be
measured are the particle concentration and size distribution in the feed
stream to the centrifuge and in
centrifuge. Figure 1.12 illustrates
distribution of the feed stream may
the supernatant stream leaving the
schematically how the particle size
be transformed into the particle size
distribution in the overflow due to aggregate breakup in the feed zone and
clarification. The task is to explore a method by which the particle size
distribution of the feed stream can be measured after it leaves the feed
zone, before entering the disc stack. The figure expresses the particle
size distribution in the feed stream in form of a frequency number
distribution. Once the particle suspension enters the feed zone large
particles are broken into smaller fragments By mechanismsthat are rather
ill-defined in terms of the flow field in the feed zone of the centrifuge.
- 57 -

flocculated feedclarified liquiddischarge
die die
nnnn
feed zonefloc
breakage
centrifugeseparation
characteristics
sheared feed
The resulting fragments are separated in the disc stack according to a
defined separation curve leading to the size distribution in the clarified
liquid discharge. More details on the mathematical evaluation of this
sheared feed size distribution and the associated problems are described
in section 3.5.22 of this thesis.
Figure 1.12: Schematic diagram of the transformation of a particle
size distribution due to particle breakup in the
centrifuge feed zone and particle separation in the disc
stack (Bell et al, 1983).
1.6 Choice of particle systems
1.6.1 Evaluating the recovery performance of a disc centrifuge
To measure the particle recovery performance of an industrial disc
stack separator it is necessary to choose a particle system which allows
the grade efficiency curve of the separator to be obtained over a wide
range of particle sizes. The particles should be able to withstand high
tensile stresses in order .to avoid breakup inside the separator. The
particle must be stable in aqueous suspension and in order to obtain
theoretical separation limits within measurable particle size ranges the
— 58 —

particle size distribution should be ideally in the order of 0.5 to 5 pm
with a solids density close to the density of water.
Polyvinylacetate (PVAc) fulfils these demands. A comprehensive review on
polyvinylacetate is given by W. Daniels (1983) and only some of the main
characteristics will be described here. Polyvinylacetate is prepared on an
industrial scale by emulsion polymerisation of vinylacetate monomers.
Typical emulsions are milk-white liquids containing approximately 50 %
(4/w) polyvinylacetate, the remainder being water and small quantities of
wetting agents or protective colloids. Some typical physical characteristics
of polyvinylacetate are listed in Table 1.4
Table 1.4: Physico-chemical constants of polyvinylacetate
Property Value
Particle settling_
Particle size, pm 0.5 - 3
Density, kg/m3 at 20 'C 1191
25 'C 1190
Particle breakup
Compressibility, cm3 /(g kPa) 17.8.10-6
Elongation at break (at 20 'C and 0% rh), % 10 - 20
Surface tension (at 20 'C), N/m 0.0365
Tensile strength, MPa 29.4 - 49.0
Others
Decomposition temperature, 'C 150
Softening temperature, 'C 35 - 50
Surface resistance, 0 cm- 15.1011
The two most important physical characteristics of polyvinylacetate as far
as the separation process is concerned are the particle density and the
tensile strength. The particle density of 1190 kg m- 3 is close to the
density of water which has a density of 998 kg m- 3 at 20 IC, and the
tensile strength values are high (in the range between 30 to 50 MPa)
indicating high resistance against shear forces.
- 59 -

1.6.2 Shear-associated particle breakup
In order to study the shear-associated breakup of particles in the feed
zone to disc centrifuges a suitable particle system, which is susceptible
to breakup had to be obtained. Apart from the required features described
earlier, some restrictions on the particle size distribution of the model
system had to be made. The difficulty was finding a suitable particle size
range. It was most important that the difference in particle size before
and after disruption was significant and yet the particle size of the
sheared product was large enough to be analysed by the electric zone
sensing method and small enough not to be completely recovered in the disc
stack centrifuge. It was also important that the particle size of the
sheared product was related to the level of shear in the feed zone.
Lsoelectric soya protein precipitate, for which an extensive review is
given by Bell et al. (1983), fulfils these conditions and is a widely
examined biological particle systems. The major protein fractions making-up
soya protein are glycinin and 8-conglycinin (Fisher and Glatz, 1986).
Glycinin, represented in the 11S fraction by ultracentrifugal analysis,
constitutes about 50% of the total protein, and 0-conglyc1n1n, represented
in the 75 fraction, constitutes approximately 18%. Glycinin has a total
molecular weight of approximately 32 • 10 s D and exists in its native form
as a dodecamer of associated subunits, while B-Conglycinin exists as a
trimer of circa 1.5 . 10 3 D. The remaining components making up soya protein
are 2S and other proteins 0 15S), fat, carbohydrates, fibre, ash, water and
other tracer components.
Extreme precipitation conditions affects the 11S fraction of the protein
(Nash et al, 1971) and causes irreversible denaturation of the protein.
Studies by Wolf et al.(1964) demonstrated that both the 7S and 11S
fractions are denatured by high concentrations of aqueous isopropanol. The
2S fraction was only denatured at higher temperatures (> 50 •), although
at a slower rate than the other fractions.
In summary soya protein is a convenient and suitable system to use due to
its availability in large quantity and the ease with which a simple protein
solution can be extracted from the crude soya flour. Most importantly the
nature of its manufacture is such that the product is largely reproducible.

2. Scale-down of disc stack centrifuges
In the following paragraphs the experimental procedure of centrifuge
scale-down will be introduced and different types of experiments are
presented. The experimental results are formulated and discussed and an
empirical model is set up to allow predictions of the separation
performance of an industrial disc stack centrifuge.
The objective is to evaluate the feasibility of scale-down of a high speed
disc stack centrifuge in order to use small quantities of test material by
replacing a large portion of the active discs with solid body aluminium
blocks (Figure 2.1).
2.1 Description of experimental procedure
Throughout this chapter all experimental work was performed using a
Westfalia BSB 7-47-476 high speed stainless steel disc stack centrifuge
(Westfalia Separator AG, 4740 Oelde, West Germany) equipped with a full-
hermetic feed zone (see section 4.2.2 for further details). Some important
centrifuge specifications are listed in Table 2.1. The experimental
procedure is illustrated in Figure 2.2 and it can be summarised as follows:
For each trial 0.22 kg of polyvinylacetate emulsion (Hoechst AG, Frankfurt,
West Germany) was diluted in 4 L of distilled water and ultrasonicated for
approximately 1 hour. The conditioned particle suspension was diluted into
400 L of soft water in a 1000 Litre Chemap fermenter vessel (Chemap AG,
Switzerland) to give a final particle concentration of approximately 0.05 %
(4/w). The pressure inside the vessel was increased to 1.5 bar (gauge) in
order to push the suspension through the disc stack centrifuge. By this
means it was possible to avoid the use of valves and pumps in the feed
line to the centrifuge. At least three throughput settings in the range of
300 to 700 L/h were examined. For each measurement, a total suspension
mass of 15 kg were carried through the separator prior to the sampling
process. In order to avoid cross contamination the separator was rinsed
and totally discharged at least three times using clear water from the
mains water supply. A magnetic-inductive flowmeter (Turbo AG, West
Germany) was used for measuring the feed rate to the centrifuge. Such a
flow meter has the advantage of being highly accurate (± 0.5% of full
- 61 -

scale deflection) and independent of the physico-chemical nature of the
fluid provided it has a conductivity of at least 5 mS.
2.2 Measurement of solid properties
To quantify the separation performance of a disc stack separator
various physico-chemical constants of the feed suspension must be
evaluated. These are (i) the density and kinematic viscosity of the carrier
liquid in which the particles are suspended, (ii) the density of the
particles, and (iii) the size distribution and particle concentration in the
feed to the separator and in the clarified liquid discharge.
2.2.1 Particle size analysis
2.2.1.1 Electric zone sensing method
The Coulter Counter is based on the electric zone sensing principle
originally developed by W. H. Coulter in 1952. Although this method of
particle sizing has been around for a relatively long period of time its
basic principles and potential sources of error are still subject of many
investigations. An extensive literature survey on the Coulter Counter
principle can be obtained from Coulter Counter Ltd. Figure 2.3 illustrates
the principle behind the electric zone sensing method of particle size
analysis. The particle suspension is sucked from the beaker through the
sizing orifice into the interior of the tube. During the passage of a
particle, exhibiting a considerably different electrical conductivity from
that of the suspending electrolyte, there will be a change in electrical
resistance across the orifice. The constant current flowing from the
current source through the platinum electrode, the orifice to the second
electrode converts the resistance change into a pulse shaped electrical
signal which subsequently is picked up by a signal amplifier. The number
of pulses is equal to the number of particles crossing the orifice and the
height of the pulse is related to the particle volume by the relationship:
E2 fAU = AV 2.1
p, I
where AV is the particle volume, f is a shape factor, p, is the resistivity
- 62 -

of the suspending electrolyte, I is the electric current and E is the
electric field strength.
Simultaneous measurement of particle size distribution and concentration is
achieved using the electrical sensing zone method (Elzone 80XY, Particle
Data Limited, England). The instrument is equipped with a statistics
computing accessory (C. H. Hintze BOXY Particle Counter Support System,
Version 6.4K). Size analysis was performed using a 18 pm tube, calibrated
with latex standards (Particle Data Ltd.) of sizes 1.1 and 2.2 pm. Prior to
size analysis the polyvinylacetate suspension was accurately diluted in 10%
(4/w) sodium chloride and then analysed for 20 seconds at constant vacuum
pressure (160 mbar). The counting procedure was repeated twice and the
total number of particle counts was normalised to the average of three
individual counts lasting 20 seconds each. In order to minimize coincidence
effects (i.e. two or more particles are counted as one single particle) the
counting rate did not exceed a value of more than approximately 1000
counts/second. Good dispersion was maintained during the procedure of
analysis and foreign particles were excluded. Particle size data were
corrected for electrolyte background count. Owing to the small density
difference between the polyvinylacetate particles and the suspending
electrolyte, particle sedimentation during analysis was negligible.
Special care was required for the preparation of the electrolyte since the
presence of very small particles caused extensive background noise
problems. In our case the application of Sartobran Filter Capsules
(Sartorius AG, GOttingen, West Germany), with an average pore diameter of
0.2 pm, was sufficient in order to remove most of these small particles
from the prepared electrolyte. Owing to the large filtration area (> 50
m2 ) only little hydrostatic pressure was required to transport the
electrolyte through the filter. The application of this technique was a
major improvement compared with the earlier use of dead-end membrane
filters which required considerably high pumping pressures and vacuum
degassing of the filtered electrolyte. At this point it is worth mentioning
that it is considered good practice not to use a freshly prepared
electrolyte (unfiltered) before it had sufficient time (approximately two
days) to lose most of the air introduced during the process of electrolyte
preparation.
While the electric zone sensing technique is now well developed for
particle size analysis there are still several potential sources of error
- 63 -

which should be addressed. Accuracy of size analysis may be affected by
several factors namely particle material (Ullrich, 1966), particle porosity
(Horak, 1982) and particle shape (Kachel, 1986).
For some classes of particles, charge transport by electrons inside the
particle may occur (i.e. particle is conductive) thereby reducing the total
resistance of the circuit. As a result the voltage pulse does not represent
the true particle volume causing underestimation of the real particle size
by the analyser. Polyvinylacetate has a very high surface resistance (5 x
10 11 Ohm/cm) and therefore the chance of charge transport is remote, even
when using high aperture current, small orifice diameter or low specific
resistance of the electrolyte.
Particle porosity effects are negligible. Polyvinylacetate particles are
virtually non-porous. Owing to their high tensile strength effects of
particle shape and deformation can be excluded as a source of error during
the size analysis process.
The lower and upper size limit lies roughly in the range between 2% and
40% of used aperture diameter. The lower size limit arises due to
electrical background noise. The upper limit arises due to the non-
linearity of response to the particle volume and the increased danger of
aperture blockage. A 18 gm orifice tube was used to give a measurable
particle size range between 0.6 to 6 um.
2.2.1.2 Disc photosedimentome ter
The disc centrifuge photosedimentometer has been widely applied for
particle size analysis on a variety of dispersed phase systems ranging
from polymer latices to herbicides and pigment. The design and operation
of the sizing equipment has been described in detail elsewhere (Joyce-
Loebl disc photosedimentometer manual, Vickers Co, Langer, G. (1979), Burt
M. W. (1967)) and shall be recalled here only very briefly. A schematic
diagram on the design and the basic operating principle of the
photosedimentometer is shown in Figure 2.4. Light emitted by a mercury
vapour lamp (1) is conditioned by passing it through an optical assembly
consisting of a lens (2), diaphragm (3) and a 90 0 turnabout prism (4). At
an exactly defined distance from the rotational axis of the disc the light
beam crosses the disc rotor (5). The intensity of the light beam is
- 64 -

attenuated by particles passing through the beam while sedimenting in the
centrifugal field. The change in light intensity is detected by a light
sensitive photo diode (6), the resulting electrical signal amplified (7),
filtered in an electronic filter circuit (8) and finely registered on a Yt-
pen recorder (9). Two modes of particle size analysis can be applied:
(i) The layer method in which all particles start from the same
position.
(ii) The suspension method in which all the particles are initially
uniformly distributed.
Both methods are explained in more detail in publications by Alex et al.
(1974) and Brugger (1975). Owing to the mathematical difficulties
associated with the suspension method the thin layer or line start method
is the one mostly applied for particle size analysis using the disc
photosedimentometer. A small amount of suspension (approximately 1 ml) is
injected onto an exactly known volume of sedimentation fluid spinning at
the same speed as the disc rotor. Near the outer edge of the rotor disc
the particles cross the already described light assembly producing an
electrical signal proportional to the optical density (turbidity) of the
fluid in the light beam. Assuming Stokes Law, the corresponding particle
diameter can be calculated from the required settling time of a particle
travelling from the surface of the sedimentation fluid to the optical
detector assembly. The centrifugal sedimentation rate at constant angular
velocity, 6), increases proportionally to the distance from the axis of
rotation, r.
dr Ap d22.2
dt 18 p
where Ap is the density difference between the solids and liquid phase and
p is the dynamic viscosity of the sedimentation fluid. The required
settling time of a spherical particle can be obtained by rearranging and
integration of Equation 2.2 resulting in:
apeln(R./R1)
t
2.318 p
where R. and R, are the start and settling radii, respectively.
- 65 -

In practice the settling time is recorded on a pen recorder and the
particle diameter, d, is calculated after rearranging Equation 23 to give:
s
18 11
d = ln(R./R,)
2.4Ap (o2 t
Determination of the particle size distribution from the pen deflection on
the pen recorder trace is more complex. Because of the finite size range
of the particles in the cross section of the light beam the beam
attenuation is proportional to the mass of the particles and not to the
particle surface (Treasure, 1981):
T(t) = f3 (d) a d3f.(d)
2.5
From Equation 2.4 we have:
t a 1/d2
2.6
which by differentiation gives:
dt a dd/d3
2.7
Integrating the turbidity, TM, over the settling time, t, gives:
T(t) dt a f3 (d) dd/d 3 a f(d) dd
2.8
Hence the area under the pen recorder deflection trace represents a number
distribution. Therefore integration of Equation 2.8 gives the number
fraction, F.(d), of particles greater than or equal to size d, given by the
expression:
f T(t) dt
F0 (d) - 2.9co
f ¶(t) dt
The corresponding volume- or mass (for particles where density is not a
function of size) distribution can be obtained directly from the pen
recorder deflection trace.

For this purpose the time axis must be transformed into a size axis via
Equation 2.4.
1(d) dd
F3 (d) = 2.10co
t(d) dd
where F3 (d) is the volume or mass fraction of particles greater than or
equal to size d.
An additional level of complication is introduced if corrections for optical
effects have to be included. The turbidity, T, in Equations 2.9 and 2.10 has
to be divided by a particle specific extinction coefficient, K.„,, which is
defined as the ratio of light obscured by a particle to the light which it
would have obscured if the law of geometric optics were valid for the
system under consideration. If the extinction coefficient is constant, i.e.
particle size independent, then its influence on the particle size
distribution can be neglected. The same is valid for a narrow size
distribution but a size dependent extinction coefficient (Langer, 1979). In
other cases the extinction coefficient may be related to the particle size
by an empirical expression developed by Kerker (1969):
= 2 - (4/r)sinr + ( 4/r 2 )(1-cosr) 2.11
where,
r ,rd/X(m-1)
where X is the wavelength of light in the medium (= X.,/n, where X„, is the
wavelength of light in vacuum and n is the refractive index of the medium)
and m is the relative refractive index.
In order to examine the optical effects of the particle on the light
attenuation, the settling characteristics of polyvinylacetate particles in a
disc photosedimentometer were examined, after its particle size
distribution was analysed using the electric zone sensing method. For these
experiments an ultrasonically conditioned, aqueous polyvinylacetate
suspension was used. Centrifugal sedimentation was performed in a Joyce-
Loebl disc photosedimentometer equipped with a turbidity meter (Vickers
Instruments Co.). Instead of applying the so-called buffered line start
method (recommended by the instrument manufacturer), in which a layer of
- 67 -

pure solvent is introduced on top of the solute containing spin fluid
followed by mixing the two layers, a method proposed by Langer (1979) and
by Alex and co-workers (1974) was used. In this method a preformed
density gradient overcomes the difficulties associated with unstable
sedimentation effects (e.g. streaming) inherent with the thin Layer method.
The gradient preparation technique has been adopted from Coll (1985).
Sucrose gradients were prepared in a Buchler gradient apparatus (Buchler
GmbH, Switzerland) that consists of two identical wells. Well No. 1 was
filled with 10 mL of distilled water and well No. 2 contained 10 mL of the
higher density solution (5% (w/w) sucrose) stirred by means of a rotating
spiral. The gradient solution was pumped by means of a peristaltic pump,
into a holding tube made of glass (350 mm long, 10 mm inner diameter)
mounted at an angle of approximately 75 0 . The gradient liquid (20 mL) was
injected into the rotating hollow disc of the photosedimentometer by
gravitational flow. After gradient injection a thin layer of dodecane
(approximately 0.5 - 1 ml..) was injected on top of the sucrose/water
gradient using a microsyringe, with the purpose of preventing fluid from
evaporation from the gradient surface. Finely, 1 mL of suspension sample
was injected on top of the dodecane layer and the sedimentation curve was
recorded. To calculate the particle sizes from the sedimentation curve the
arithmetic averages of spin fluid density and viscosity were used as
proposed by Alex et al. (1974).
Acquisition of the optical density data and calculation of the
corresponding particle size distribution was performed using a 12 bit
analog-to-digital converter (Xcalibur XAD 2, 3D Digital Design &
Development Ltd, England) in conjunction with an Apple Ile microcomputer.
The analog signal emitted from the photoreceptor was amplified, fed to a
pen recorder and from there to a 12 bit analog-to-digital converter in
which the analog signal was digitized and read from a microcomputer (Apple
He). The pen recorder served merely as a control instrument giving a
visual guide as when to terminate the data acquisition process. Before
injecting a sample on the gradient Layer the output current of the
photoreceptor was adjusted to zero on the build-in LCD display of the
photosedimentometer. This corresponds to a reading below 5 mV on the
computer VDU. After the sample was injected two relais associated with the
analog-to-digital converter were closed by a computer controlled relays
control circuit. The converted light intensity signal was fed directly into
the microcomputers Random Access Memory whereby the computer was
- 68 -
acquisition process
was given, then the
data were recalled
evaluation
was terminated with a punch command. If this command
software-controlled relays were opened and the stored
from the computer memory, conditioned and used for
of the particle size distribution. The final particle size
programmed in such a way that a software-controlled timer allowed storage
of signal readings every two seconds, practically copying the pen recorder
deflection trace into the computer memory.
In order to maximize accuracy and signal resolution of the analog-to-
digital converter and to allow measurements over a wide range the signal
amplification factor was varied under software control. The data
distribution in form of either number or volume (-mass) oversize
distribution was visualized on the computer monitor or plotted as a graph
or in form of a table on a DOT matrix printer (Mannesmann Tally). For
documentation purposes the data were stored on a floppy disc together
with all the necessary sample and operation parameters used during the
process of particle size analysis.
2.2.2 Physico - chemical properties of the solids and liquid phase
The density of the carrier liquid phase was that of water which is
998.2 kg m- 3 at 20 C. The density of the solids phase was determined by
gradient centrifugation using a sucrose-water gradient. A particle density
of 1190 kg m- 3 was determined confirming the density figure given in
Table 1.4. The viscosity of the carrier fluid was assumed to be the same
as water at the corresponding temperature which is 1.005 mPa .s at a
temperature of 20 C.
22.3 Tracer studies
A small amount of dye tracer (approximately 2 mL of methylene blue
containing 10 g dye L- 1 ) was added to the in-going stream during a period
of time which was very short compared with the overall residence time of
the fluid in the system. The dye concentration in the exit stream was
monitored on-line using a flaw through colorimeter operated at a
wavelength of X = 546 nm and a cuvette pathlength of 5 mm (Isco Optical
Units, Instrument Specialities Co, England). The continuous change in light
absorbance was converted into an electrical current, amplified and
- 69 -
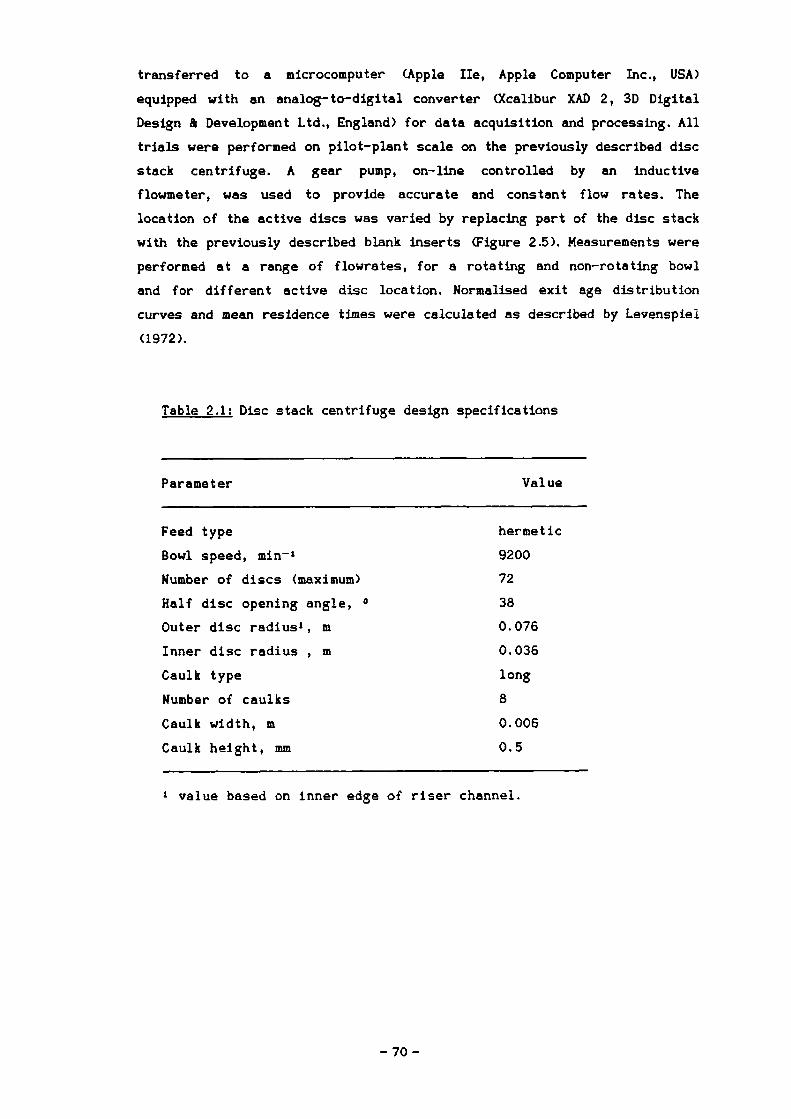
transferred to a microcomputer (Apple Ile, Apple Computer Inc, USA)
equipped with an analog-to-digital converter (Xcalibur XAD 2, 3D Digital
Design & Development Ltd, England) for data acquisition and processing. All
trials were performed on pilot-plant scale on the previously described disc
stack centrifuge. A gear pump, on-line controlled by an inductive
flowmeter, was used to provide accurate and constant flow rates. The
location of the active discs was varied by replacing part of the disc stack
with the previously described blank inserts (Figure 2.5). Measurements were
performed at a range of flowrates, for a rotating and non-rotating bowl
and for different active disc location. Normalised exit age distribution
curves and mean residence times were calculated as described by Levenspiel
(1972).
Table 2.1: Disc stack centrifuge design specifications
Parameter Value
Feed type hermetic
Bowl speed, min- 19200
Number of discs (maximum) 72
Half disc opening angle, 0 38
Outer disc radius', m 0.076
Inner disc radius , m 0.036
Caulk type long
Number of caulks 8
Caulk width, in 0.006
Caulk height, mm 0.5
1 value based on inner edge of riser channel.

I 3
I 2
Ii
Figure 2.1: Schematic diagram of the three different sizes of blank
aluminium inserts used to replace parts of the active
discs inside a disc centrifuge.

PIV3 V4
Exl Ca3rr1 l
VSMains water
PI
Al
Bal -7
Si
drain
Figure 2.2 .; Schematic diagram of experimental setup.
Al: 1500 L feed vessel; Si: BSB 7-47-476 disc stack
centrifuge (z=variable, R1=0.036 m, Ra=0.076 m, h=0.5 mm,
n=9300 min- I , q>=38'); VI, V2, V3, V6: Saunders diaphragm
valves; V4, V5: Ball valves; V7: 3-way ball valve; PI:
pressure gauges; Fl: magnetic-inductive flow meter.

Electrodes
1-
Vacuum pump nCal
Capillary
N HP 9000
Orifice a
Powersupply
Particle suspension
Figure 2.3: The electric zone sensing principle.

spin fluid
324 1suspension
rotor
. 1 •OIMMV
.. • .• . • •
Mk 1 6n1 ..\\I I
Figure 2.4 Schematic diagram of disc photosedimentometer assembly
(Langer, 1979). (1) mercury vapour lamp, (2) optical lens,
(3) diaphragm, (4) 90 turnabout prism, (5) disc rotor, (6)
photo diode, (7) signal amplifier, (B) electronic filter
circuit, (9) Yt-pen recorder.

Figure 2.5: Diagram of disc stack separator showing the position of
the active discs within the dummy disc stack. (A) top
position; (B) bottom position; (C) top of small insert.

2.3 Results
2.3.1 Disc photosedimentometer studies
Figure 2.6 shows the extinction coefficient K , as a function of the
particle diameter for polyvinylacetate particles at four wavelengths
ranging from 400 to 700 nm. Calculation of the extinction coefficient is
based on Equation 2.11 and a relative refractive index of in = 1.1. For
small particles, the extinction coefficient rises rapidly with increasing
particle diameter and then passes through a series of maxima and minima
until subsequently approaching a value of K.. = 2. For higher wavelength
the maxima and minima are shifted to larger particle diameters.
Figure 2.7 shows the extinction coefficient as a function of the particle
diameter and relative refractive index. The calculation is based on
Equation 2.11 and a constant wavelength of 690 nm is assumed. The course
of the extinction curve is similar to the previous plot. For small
particles the extinction coefficient rises sharply with increasing particle
size, then passes through a series of maxima and minima and finally
converges to a value of K = 2 for large particle sizes (> 10 pm). The
effect of the relative refractive index is such that with increasing
refractive index the maxima of the extinction coefficient curve are shifted
to smaller particle diameters.
The specific turbidity of polyvinylacetate particles as a function of
particle diameter is illustrated in Figure 2.8. Gregory (1984) has shown
that the specific turbidity I of a suspension is given by:
3 K.2,t2.12
c., 2 d
where c, is the particle volume concentration and d is the particle
diameter. Calculation of the extinction coefficient is based on Equation
2.11 and the relative refractive index for a polyvinylacetate/water
suspension has a value of in = 1.1 which is obtained from dividing the
refractive index of polyvinylacetate, given in Table 1.4 (= 1.4669 at 20
•C) by the refractive index of water (1334). For small particle sizes the
specific turbidity rises sharply with increasing particle size. After
passing through a distinct maxima at about 2.5 pm it goes through a series
of maxima and minima which are less pronounced than those in the
extinction efficiency curves. For large particle diameters (> 10 pm) for
- 76 -

which the extinction coefficient is constant the specific turbidity falls to
1/d.
Figure 2.9 shows particle size distribution curves of polyvinylacetate
particles suspended in water. The curves were obtained by using two
different particle sizing methods, namely an electric sensing zone method
and a centrifugal sedimentation method (Joyce-Loebl photosedimentometer).
The diagram shows the cumulative volume oversize distribution curve. In
contrast to a number distribution the particle volume is plotted as a
function of particle diameter. All particles had a particle diameter larger
than approximately 0.6 pm and no particles bigger than about 225 pm were
detected in the examined samples. The curves obtained by using different
size analysis techniques are all similar. For the electric zone sensing
method a volume median diameter of 1.16 pm was measured while for the
centrifugal sedimentation method a particle diameter of 1.10 pm was found.
Included in Figure 2.9 is a trace determined theoretically using the
specific turbidity values shown in Figure 2.8 and the corresponding volume
fractions determined by applying the electric zone sensing method. Equation
2.12 was applied to calculate the turbidity of the various size fractions
and the normalised turbidity data were plotted. By using this method the
calculated median particle diameter was approximately 121 pm. As indicated
in Figure 2.6 the extinction coefficient is strongly dependent on the
wavelength used for its calculation. To examine the effect of different
wavelength on the turbidity distribution similar calculations as Just
described were performed. These calculations showed that the effect
wavelength on the cumulative turbidity distribution of polyvinylacetate
particles is negligible.

extinction coefficient, Kext
0 1 iiiiii i 1 1 10 0.5 1 1.5 2 2.5 3 3.5 4 4.5 5 5.5 6
particle diameter, d (urn)
Figure 2.6; Change of extinction coefficient with particle diameter
and wavelength at constant refractive index.

4
3.5 -
2.5 -
1.5 -
0.5 -
extinction coefficient, Kext
O 0.5 1 1.5 2 2.5 3 3.5 4 4.5 5 5.5 6
particle diameter, d (urn)
Figure 2.7: Change of extinction coefficient with particle diameter
and relative refractive index at constant wavelength
(X=600 nm).

specific turbidity (arbitary units)
0
1
2 3 4
5
6particle diameter, d (urn)
Figure 2.8: Change of the specific turbidity of a polyvinylacetate
suspension with particle diameter.
Wavelength k=690 run, relative refractive index m=1.1

1
0.8
0.6
0.4
0.2
0
cumulative volume oversize
0
0.5
1
1.5
2
2.5
particle diameter (urn)
Figure 2.9: Cumulative volume oversize distribution of a
polyvinylacetate suspension determined using different
particle size analysing techniques.
ap Electric zone sensing method (Elzone)
(D) Photo sedimentometer (Joyce Loebl)
(A) Calculated using Equation 2.12.
- 81-

2.3.2 Tracer studies
Before examining the effects of settling area reduction on the
separation performance of the centrifuge it was necessary to obtain
information on the fluid flow pattern in the machine. Of particular
interest was the tracer hold-up inside the separator and the time required
for all the tracer to pass through the machine. The main results of these
studies are summarized in Table 2.2. The effects of bowl rotation and
active disc location on the hold-up volume and mean residence time is
shown for a representative flowrate of 8.33 L min- 1 . For other flowrates
(300 and 400 L h- 1 ) the trends observed are very similar. Firstly,
concentrating on the top and bottom arrangement ( see Figure 2.5 A and B
respectively) of the active discs two main trends may be detected. For a
rotating bowl, a Lower mean residence time with decreased dispersion is
observed when the active discs are located at the bottom. When the bowl is
not rotating larger mean residence times are noticed independent of active
disc location, and equivalent to the longest residence time for a rotating
bowl. These trends are attributed to the dispersion of fluid into the
sediment holding space when the active discs are located at the top or
when the bowl is not rotating.
The fluid volume required for nearly all the tracer material to be removed
from the separator, V„, is approximately 8.2 L independent of the active
disc position. Hence steady state conditions may be assumed when more than
8 L of liquid have passed through the centrifuge which is equivalent to
more than five volume changes. For particulate suspensions approximately
15 L flow is allowed before steady state is assumed.
From this observation, the conclusion is that if the bowl rotates at full
speed and the discs are located at the bottom of the dummy disc stack
then the fluid does not enter the solid holding space, whilst it is not
prevented from doing so if the bowl is not rotating. The fluid in the
sediment holding space is basically stagnant relative to the spinning bowl
and the fluid exchange between liquid leaving the distributor and liquid
occupying the sediment holding space is very poor. Removing the pressure
from the sediment holding space by removing the centrifugal force field
apparently opens the sediment holding space for the incoming liquid. Now
the sediment holding space acts like a region of very stagnant fluid, or
'dead space'. Although most of the fluid passes through the centrifuge with
- 82 -

no delay, part of the fluid enters the deadwater region and is delayed
causing an increase in the mean residence time.
Table 2.2: Summary of tracer study results
t„
VP,
V99
Bottom Top
(rpm) 0 9200 0 9200
(L/min) 8.33 8.33 8.33 8.33
(s) 21.0 16.8 22. 2 22.8
(L) 2.92 2.33 3.08 3. 17
(L) 8.2 8.2 6.8 8. 2
tm = mean residence time
V, = holdup volume
V„= throughput volume at which 99% of tracer material is removed
from the centrifuge
top and bottom refers to position of active discs (see Figure 2.5 A, B)
2.3.3 Separation performance
232.1 General remarks on the preparation of the feed suspension
Before it is possible to use the polyvinylacetate suspension to measure
the separation performance of the disc stack centrifuge (see section 2.1)
it is necessary to destroy any agglomerates that may be present. This task
was performed by ultrasonicating the diluted polyvinylacetate suspension
for approximately 60 minutes. The application of ultrasonics in a liquid
creates the phenomenon known as cavitation. Areas of compression and
rarefaction occur and cavities, which form in the areas of rarefaction,
rapidly collapse as the area changes to one of compression. The vapour
bubbles produced in the cavities are thus compressed to several thousands
of bars and on their collapse shock waves are generated which are thought
to be responsible for the breakup of potential polyvinylacetate
agglomerates (Scawen et al, 1986). Monitoring the dynamics of
deagglomeration during the ultrasonication process showed a steady
- 83 -

reduction of the median particle size of the suspension from 35 pm to
roughly 1.3 to 1.7 pm after 40 minutes. The final particle size was found
to be dependent on the age of the polyvinylacetate concentrate. Freshly
delivered polyvinylacetate concentrate gave smaller particle sizes after
ultrasonic conditioning than somewhat older concentrate after it has been
stored in the fridge at 4 T. for three months. Although the final particle
size achievable by ultrasonic conditioning was already reached after about
40 minutes, it was considered good practice to leave the suspension for a
further 20 minutes before using it.
The other question to be considered is whether the particle size of the
polyvinylacetate suspension changes while it is being stirred in the feed
vessel. Measuring various samples over a time period of 4 hours showed no
indication of this happening. Generally, it appeared that the distribution
was stable in respect to its size distribution provided it was constantly
stirred. However, leaving the suspension over a long period, say more than
24 hours, resulted in a significant increase of the median particle size.
Hence, it was essential to prepare a fresh batch of polyvinylacetate
suspension prior to every experiment.
The particle sizes obtained by ultrasonic conditioning are by no means the
final particle sizes. In order to reach the stage of only primary particles
being left in the suspension, more drastic methods such as high pressure
homogenisation are required. Nevertheless, a range of high shear
experiments (such as capillary shear devices, centrifugal and gear pumps
operated at high backpressure) using ultrasonically conditioned
polyvinylacetate particles showed no significant change of the particle
size distribution.
2.3.3.2 Effects of scale-down on the separation performance
The separation performance of a disc centrifuge has been examined for
three operating parameters:
(i) fractional reduced settling area
(ii) active disc location
(iii)throughput capacity

In order to compare the results obtained at various operating conditions
it is convenient to plot the grade efficiency curve as a function of the
dimensionless diameter d/d c . The value of the critical particle size dc is
determined using Equation 1.17. Any changes in the grade efficiency profile
may be attributed directly to a change in the hydrodynamic behaviour of
the fluid passing through the separator. Theoretically, if there are no
effects of throughput capacity, separation area reduction or disc location
on the separation performance then no change in the profile of the
efficiency curve should occur.
The effects of a 75% reduction in the available separation area on the
grade efficiency curve is illustrated in Figure 2.10. The number of discs
in the stack were reduced from 72 to 17 discs and the discs were located
on top of the blank inserts (Figure 2.5 A). The change in the profile of
the grade efficiency curve due to changing the disc position is plotted
using data for three flowrates in the range of 300 to 700 L h-1.
The diagram shows the expected deviation from the theoretical grade
efficiency curve calculated on the basis of Stokes Law (Equation 1.19). The
observed grade efficiency curve reaches a value of 0:74 at the separation
limit (d/dc = 1), and approaches unity at approximately twice the
separation limit. There is no observed trend of change in separation
efficiency with change in flow rate. It was not possible to obtain grade
efficiency values below a dimensionless particle size of approximately 0.6.
However, it appears that there is an approach to the theoretical grade
efficiency curve for lower dimensionless particle diameters.
For the same number of active discs placed at the bottom of the disc stack
(Figure 2.5 B) the grade efficiency is clearly shifted to larger
dimensionless particles diameters (Figure 2.11) indicating a reduction in
the separation performance although again the separation curve is
apparently independent of flow rate. The grade efficiency curve does not
approach the theoretical curve.
The effect of a 90% reduction of separation area on the grade efficiency
curve is shown in Figure 2.12. The overall trend of the grade efficiency
curve is similar to the trend observed for a 75 % reduction of separation
area. For active discs located at the top of the disc stack (Figure 2.5 A)
the curve follows closely the theoretical grade efficiency curve for small
dimensionless particle diameters and deviates from the theoretical curve
- 85 -

for larger particle sizes. Also a slight effect of flow rate on the grade
efficiency is observed. At the separation limit the grade efficiency has a
value of 0.70 which is a little below the value of 0.74 observed for 17
discs.
Figure 2.13 shows the grade efficiency curve of 7 discs located at the
bottom of the disc stack. The trends already observed are amplified and
show an increased reduction of efficiency if the disc location is switched
from the top to the bottom position. At the separation limit the grade
efficiency decreases with increasing flow rate from an average of 0.70 to
a value as low as 0.4.
Since the aim was to avoid separation of solids in the sediment holding
space but at the same time to ensure T(d) * f(Q) the active discs were
placed on top of the small blank insert (II) located at the bottom of the
disc stack (Figure 2.5 C). The effect of this measure on the grade
efficiency is illustrated in Figure 2.14. As expected the grade efficiency
was better than for disc position B (bottom arrangement) but worse than
for position A (top arrangement) due to the decreased separation area
available. At the separation limit a value of 0.6 is obtained which is
lower than for the top position (0:74) but much higher than for the bottom
position (0.40). The effect of flow rate may still be observed although the
variation is considerably reduced when compared with the bottom disc
arrangement. Scattering of the data points is less pronounced.

Stokes
4r.0
A.
t;iAr
/4..
pro mm-a--7-A '
AMN
vs
IgAa
121t.•
la4.I"
I
A_
0
,L,
Q • 300 L/h, dc • 0.7 urn
0 .500 L/h, dc • 0.9 urn
Q •700 L/h, dc-1.1 urn
I I I
1
0.8
0.6
0.4
0.2
0
grade efficiency T
0 0.5 1 1.5 2
2.5dimensionless diameter d/dc
Figure 2.10: Grade efficiency curve of disc stack separator - the
effect of disc location on separation performance. The
number of discs is 17; top position (A) of discs (see
Figure 2J5).

1
0.8
0.6
0.4
0.2
0
grade efficiency T
StokesE
r2..•AL
Pi
icipprilSI
COA
•1111
p-al1
AAL.
illsa
At
0'a
!I,
A_,
'p
0
Q • 300 L/h, dc • 0.7 um
0 Q • 500 L/h, dc • 0.9 urn
L\ 0 n 700 L/h, dc-1.1 urn
I 1 1
0 0.5 1 1.5 2
2.5
dimensionless diameter d/dc
Figure 2.11: Grade efficiency curve of disc stack separator - the
effect of disc location on separation performance. The
number of discs is 17; bottom position (B) of discs (see
Figure 2.5).
0=4

Stokes • 6e: L
0 L
vaN IL&-
E0I.
OA
I
A'm
A .Pi
4i
, 0
0I
4411
Q•300 L/h, dc-1.2 urn
0 0 • 500 L/h, dc-1.5 urn
L Q •700 L/h, dc • 1.8 um
I I I
I
0.8
0.6
0.4
0.2
0
grade efficiency T
0
0.5
1
1.5
2
2.5
dimensionless diameter d/dc
Figure 2.12: Grade efficiency curve of disc stack separator - the
effect of disc location on separation performance. The
number of discs is 7; top position (A) of discs (Figure
2.5).

Stokes I
0
PI!
Co
E e0
n to
VI 0 •
Ill
II AIA
VI 0 A
0
A
AYIPAt
el ArA
Ai t
0
f,Fra.CO
0•300 L/h, dc • 1.2 um
0 0 • 500 L/h, dc-1.5 urn
L. P • 700 L/h, dc • 1.8 urn
I I
1
0.8
0.6
0.4
0.2
grade efficiency T
0
0.5
1
1.5
2
2.5
dimensionless diameter d/dc
Figure 2.13: Grade efficiency curve of disc stack separator - the
effect of disc location on separation performance. The
number of discs is 7; bottom position (13) of discs (see
Figure 2.5).

Stokes
-6
ri
1.11
PA.L., ......n dr
RIgz;LJ 0r• A
at,
Om, _ _
CI
0 L
PI...4
741,
Pri
te•n
PP,
IP
Ak
•a
ok
7X
A
(>300 L/h, dc • 1.2 urn
0 Q • 400 L/h, dc • 1.5 urn
L 0 • 500 L/h, dc-1.8 urn
I I I
1
0.8
0.6
0.4
0.2
0
grade efficiency T
0
0.5
1
1.5
2
2.5
dimensionless diameter d/dc
Figure 2.14: Grade efficiency curve of disc stack separator - the
effect of disc location on separation performance. The
number of discs is 7; top of insert Ii (see Figure 2.5 C).

2.3.4 Mathematical formulation of the grade efficiency curve
The separation performance of a centrifugal separator depends on the
combination of three product parameter such as particle size, particle
density and particle shape. Since the mass yield ET, defined in Equation
2.13, depends very much on the settling characteristics of the feed solids,
it is unsuitable as a general criterion for the efficiency of a separator.
A single value of the mass yield cannot be used to describe the separation
capability of the separation equipment for any materials other than the
actual test material. The mass yield of a centrifuge is given by:
111,
ET = 1
2.13th
where dx1 is the mass flow rate of solids in the clarified liquid discharge
and dic, is the mass of solids in the feed suspension.
For a self-cleaning disc stack centrifuge the relationship between the
mass flow rate, di, and the solids concentration in the feed phase, and
in the clarified liquid phase, c m ,/ , is given by:
and
= ib cm,
The above relationship assumes that the mass flow rate of the fluid
leaving the separator is approximately equal to the mass flow rate
entering the machine. The amount of fluid lost through the solids
discharge is considered to be negligible. Therefore, Equation 2.13 may be
simplified to:
cm,/ET = 1
2.14Cm, c,
However, this simplification can not be applied for nozzle type disc stack
separators because the flow of the sedimented solids through the discharge
takes place continuously and is not negligible.
In order to describe the separation performance quantitatively and
independently of the solids properties, the grade efficiency, T(x), is
- 92 -

introduced:
1112(x)T(x) = 2.15
to(x)
where fil2 (x) is the mass flow rate of solids of separation property x in
the solids discharge (coarse fraction), da.(x) is the mass flow rate of
solids of separation property x in the feed (feed fraction). The variable x
describes the separation property according to which separation takes
place. In a centrifugal separator x is represented by the settling velocity
of the particles. Since the particle density and the fluid viscosity are
usually assumed constant for a given separation process the grade
efficiency may be rewritten using:
1112(d)T(d) = 2.16
k0 (d)
Since die (d) = th,(d) + dt,(d), where th,(d) is the mass flow rate of solids of
size d in the supernatant fraction, Equation 2.16 may be expressed in
terms of the size distribution in the clarified liquid phase:
F 1 (d)T(d) = 1 - (1 - ET ) 2.17
AFe(d)
where F, (d) is the particle size distribution in the clarified liquid
discharge and AFe (d) is the particle size distribution in the feed to the
centrifuge expressed in terms of the percent-in-range distribution
respectively which means that the sum over all size fractions making up
the particle size distribution is 100%.
At this point a few remarks on the representation of particle size
distributions need to be made. Particles size distributions can be
represented as number distributions if the type of quantity used is a
number, as weight distributions if the type of quantity is a mass, or as
area distributions if the type of quantity is a surface area. For a
constant particle density, weight distributions and volume distributions
are equal. Since number and volume distributions of the same particle
suspension may differ considerably, the type of quantity measured or
chosen when representing particle size distribution data has to be stated.
Throughout this thesis the type of quantity measured or chosen for
- 93 -

representing particle size data is the particle volume if not stated
otherwise.
Particle size distributions may be expressed as the so-called density
distribution f(d), which represents the first derivative of the cumulative
distribution, F(d), given by:
clF(d)f (d) - 2.18
dd
During particle size analysis the volume of particles within a finite size
range is usually measured and plotted in form of a distribution histogram.
The difference of two values of the cumulative distribution F(d) between
two particle diameters d l and d2=d0-kid is given by:
dF(d„d2 ) AS AF (d„ d2 ) = F (d, ) - F(d2 ) 2.19
representing the so-called 'percent-in-range' distribution. Since AF (d) is
obtained directly from particle size analysis it may be used in combination
with Equation 2.17 to give the grade efficiency curve. The grade efficiency
is obtained in the form of discrete grade efficiency values based on the
arithmetic mean particle size ((d,+d2)/2) of the chosen size interval.
Plotting the grade efficiency as a function of particle size and joining of
the data points gives the grade efficiency curve.
The value of the grade efficiency is a probability rather than a certainty
because different particles of similar size are subjected to different
conditions when passing through the separator. A single particle of size d
passing through the separator will either be separated or it will pass
through with the fluid. The grade efficiency will, therefore, be either 0%
or 100%. If two particles of the same size enter the separator, the grade
efficiency may either be 0%, 50% or 100% depending upon whether the
separator will separate neither, one or both particles. If a large amount
of similar particles enter the separator then a certain probable amount of
particles will be separated. The reasons for the probability character of
the grade efficiency are:
(i) The finite dimensions of the input and output of the separator
(ii) The uneven conditions of separation at different points
(iii) The different surface properties of particles of the same size.
- 94 -

At this point the question arises about how the width of the size interval
is to be selected. Theoretically, the smaller the chosen size intervals the
more exact the grade efficiency curve. However, in practice the amount of
scattering of the measured quantity within a given size interval Ad needs
to be considered. These fluctuations depend on the total mass of solids
analysed and the smaller the number of particles the larger the size range
to be selected, hence the lower the resolution. The relative error
increases with decreasing quantity of measured material in a given size
range. In practice it is often necessary to combine several tadJacent,
narrow size bands into larger size intervals in order to obtain meaningful
grade efficiency curves.
The Elzone particle sizer gives both the density volume (or number) and
the cumulative volume (or number) distribution as a function of particle
size logarithmically divided into 128 size channels. Owing to the reasons
described earlier, these 128 size channels were subsequently reduced to 26
larger size intervals before the grade efficiency of each size interval was
evaluated. Not only does this procedure reduce the relative error within
small size intervals but also results in a certain degree of smoothing of
the data points. Furthermore and without any loss of accuracy, 26 larger
size intervals can be handled and be visualized more easily than 128 size
channels.
The evaluation of the grade efficiency curve may be carried out
graphically, in a table or by using a computer. Tabular and graphical
procedures are cumbersome and time consuming and therefore a computer has
been used to perform this task instead.
One exception to the rule of representing grade efficiency curves has to
be stressed. Usually the independent variable is plotted on the abscissa
describing the physical property chosen to characterise the size of the
particles. The dependent variable, which describes the grade efficiency, is
plotted on the ordinate. This would mean that for every separation process,
using the same type of equipment, a new grade efficiency curve needs to
be plotted if the settling velocity of the particles or if the operating
conditions of the separator changes. Therefore, in order to make the grade
efficiency curve invariant to solids properties, operating conditions and
separator specifications the grade efficiency is plotted as a function of a
dimensionless particle size (d/d,), where d represents the critical
particle size or the theoretical separation limit. The significance and
- 95 -

F 1 (d)
derivation of the theoretical separation limit for disc stack separators
has been described in detail in chapter 13 of this thesis. Changes in the
trend of this so-called dimensionless grade efficiency curve occur only if
the flaw pattern in the separator changes.
Once the grade efficiency curve has been determined in its graphical or
tabular form it is often necessary for its further application that the
grade efficiency curve is expressed in the form of a mathematical
equation. Since the grade efficiency curve can be regarded as a key
parameter of a separator, the curve in its mathematical form can be used
as an essential part of an algorithm allowing computer simulated studies
of the solids recovery process in a centrifuge for a wide range of
operating conditions and solids properties.
As far as mathematical modelling of centrifugal separation is concerned,
this is comparatively simple. The two main objectives are the evaluation of
the separation efficiency of the separator and the associated particle size
distribution of the particle suspension leaving the machine after
separation. Knowing the particle size distribution and the quantity of
material in the clarified liquid discharge is important for the design and
operation of subsequent downstream processing stages. Some numerical
examples on the mathematical modelling of centrifugal separation will be
given in chapter 2.3.5 after the mathematical routines of grade efficiency
curve fitting have been introduced.
The mass yield, which may be calculated from the grade efficiency curve,
T(d), and the size distribution in the feed, F.(d), is given by:
dm.„ET = 1 - Z [1-T(d)] AF0(d)
2.20dmi,
where dmi, and dm., are the minimum and maximum particle size present in
the feed suspension. The particle size distribution in the clarified liquid
discharge is given by:
1 - T (d)AF.(d) 2.21
1 ET
while the particle size distribution in the solids discharge phase, F2 (d),
is given by:
- 96 -

T(d)AF2 (d) = F.„(d) 2.22
ET
Since the mass yield is required for both the prediction of the particle
size distribution in the clarified liquid overflow and the particle size
distribution in the solids discharge phase, it always needs to be evaluated
first using Equation 2:20.
For reasons described previously the grade efficiency curves need to be
transformed into a mathematical expression describing the curve accurately
with only few parameters. It is known that particle size distributions can
be conveniently approximated by empirically determined distribution
functions. Special graph paper has been developed where cumulative
distributions following these functions follow straight lines. Owing to the
similarity of form and shape of a cumulative distribution and the grade
efficiency curve it is probable that the same curve fitting routines for
particle size distributions should also apply to grade efficiency curves.
For completeness three of the best known analytical distribution function
shall be summarized briefly (see also Leschonski, 1984).
a) The power function
The power function, also known as the Gaudin-Schumann distribution:
F(d) = (d/cP) n2.23
The spread parameter, n, is the slope of the straight line obtained by
plotting the above function on a log F(d) - log d paper. The position
parameter, d, is determined from the intercept of the straight line with
the ordinate log F(d).
b) RRSB function
The Rosin-Rammler-Sperling-Bennet (RRSB) function is given by:
1 - F(d) = exp(-(d/cP)r")
2.24
where d' represents the position parameter and n represents the slope of
the straight line obtained when plotting Inln(l/R), where R = 1-F(d), on
the ordinate and In d on the abscissa.
- 97 -

C) Normal distribution
The third analytical function is the normal distribution given here inits general form:
1
f(z) = exp(-z 2 ) 2.25lit
with z being a dimensionless variable describing the particle size. The
standard deviation a will be defined later in this section.
The cumulative distribution is obtained from:
F(z) =J f(z) dz
2.26
Normal distributions differ according to the definition of the variable z.
The Gaussian normal distribution with linear abscissa:
z = (d - dm )/(i2 a)
where dm represents the median of the cumulative size distribution F(d)
and a represents the standard deviation or the spread of the distribution.
For narrow distributions a is small and for wide distributions a is large
and is obtained on probability graph paper when plotting F(d) on the
ordinate and d on the abscissa. For Gaussian normal distributions with
linear abscissa a is given by:
a = 0.5 (de, - d 16 ) = dm - d16
The log-normal distribution:
z = lin(d/dm )/(12 a)
The standard deviation a can be obtained when plotting the cumulative
distribution data on log-probability paper. For log-normal distributions, a
can be calculated using:
a = 0.5 ln(d„/d 16 ) = ln(dm/d,6)
The corresponding particle sizes can be acquired from a log-probability
plot as described previously.
- 98 -

A slightly different form of the log-normal distribution is given by
Herdan (1960) where the standard deviation a is replaced by the geometric
standard deviation ag given by:
a = Ina,
and therefore,
z = ln(d/dm)/(12 lna,)
By substituting the particle diameter d by the dimensionless diameter
(d/d,) the same curve fitting procedures applied for particle size
distributions may be used for fitting an analytical function to grade
efficiency curves. In the remainder of this chapter, results will be
presented obtained by using a two-parameter model based on the RRSB-
function and a Three-parameter model based on a modified log-normal
distribution function.
2.3.4.1 Two-parameter model of grade efficiency curve
In order to approximate the grade efficiency curve by an expression
defined only by two independent parameters the RRSB-distribution function
is rewritten in a slightly modified form:
T(d) = 1 - exp[-(k d/d,) n l 2.27
where k and n are the parameters describing the grade efficiency curve, d
is the particle size and d, is the critical particle size. Using Equation
2.27 and taking the logarithm twice an expression describing a straight
line can be obtained.
DIC-ln(1-T(d))] = n ln(k) + n ln(d/d,)
The first parameter n is obtained from the slope of the straight line,
while the second parameter k is calculated using the intercept of the line
with the ordinate:
k = exp(intercept/n)
Figure 2.15 shows the change of grade efficiency, plotted as a function of
dimensionless particle size, for four values of n. The value of k remained
constant (k = 0.8) for this calculation. The values chosen for n ranged
from 1.5 to 3.0. The curve describes a so-called sigmoidal course, starting
- 99 -

off at zero and converging to unity for large particle diameters which
agrees with practical experiences. The smaller the particles the lower the
grade efficiency while the larger the particles the higher the achievable
recovery of the latter. With increasing values of n the curve becomes
steeper and the convergence improves. As it is common for exponential
functions all curves have a common point of intersection. Since this
condition is only fulfilled if (k •d/dc ) = 1 the coordinates of the point of
intersection are a function of k. The corresponding value on the abscissa
is given by k- 1 . The corresponding ordinate value is independent of the
coefficients k and n and may be calculated using Equation 2.27. In
conclusion, a band of curves based upon the exponential equation (Equation
2:27) will have a common point of intersection given by the coordinates:
(d/dc ; T). = (k- 1 ; 0.632)
where (did, ; T). describes the coordinate of the common point of
intersection. Owing to its good convergence to unity the practical error
involved using the introduced two-parameter approximation of the grade
efficiency curve is negligible.
Figure 2.16 shows the predicted course of a correlated grade efficiency
curve for different values of k. The value of n remained constant (in = 2.0)
during calculation. For small particles the curve increases rapidly with
increasing particle size and approaches unity more rapidly for larger
values of k. The graph shows a strong dependence of the grade efficiency
approximation on k enhancing the requirement for special care and high
accuracy during its evaluation.
The evaluation of the coefficients k and n from experimental data was
performed by linear regression on a standard personal computer. In order
to reduce the risk of error grade efficiencies T(d/d c ) ) 0.98 were not
included in the regression process. The reason for doing so becomes clear
by looking at the axis division on RRSB graph paper. The effect of change
of d/dc on the grade efficiency is most effective between 0.05 < T > 0.98.
In this range a small change of d/dc results in a considerable change of
the grade efficiency. However, at T(d/d c ) ) 0.98 a considerable increase of
the abscissa value gives only a small rise of the grade efficiency and
consequently does not contribute a great deal to the overall error of the
curve approximation. Therefore, the linear regression procedure should
-100-

concentrate on those data points contributing mostly to the overall error
of the curve fitting process. For T(d/d c ) ( 0.05 the same rules as above
apply. However, such low grade efficiencies are rarely measured in
practice.
For evaluation of experimental data linear regression is followed by a
non-linear regression step in order to optimise the correlation
coefficients. This procedure uses the experimental data and varies the
coefficients k and n of Equation 2.27 until the deviation between measured
grade efficiency
that the SUM of
minimum:
and correlated grade efficiency is minimal. That means
errors squared in the following equation must be a
S = 2 (T i.theor Tiomeas)21=1
S = E g(x i , k,n) - 2 where x i = (di/dc)1=1
The minimum condition is fulfilled if the partial derivatives of the above
equations become zero:
-0
Although defining the conditions to be met is simple, the actual solution
of the problem is complicated and involves complex programming techniques.
A numerical solution of non-linear regression analysis has been presented
by Ebert (1983). The algorithm has been modified in order to correlate the
coefficient k and n of Equation 2.27. The program requires initial guesses
before it starts the calculation. For good convergence of the algorithm
those initial guesses need to be fairly close (1.. 20%) to the final values
of the correlated parameters. For this reason, non-linear regression is
preceded by a linear regression procedure in order to provide good initial
starting values of k and n. Furthermore, for non-linear regression all
experimental data, including grade efficiency values of T(d/d c ) ) 0.98, are
included in the correlation procedure.
A typical example of a computer print out following such a correlation
process in presented in Figure 2.17 with information of experimental
conditions on top, followed by the results of the regression analysis and a
table comparing experimental values (T (d).") with correlated grade
-101-

efficiency values (T(d)ee)l • Values of particle diameter, corresponding
grade efficiency and separation limit are fed into the computer and the
values of the coefficients k and n are determined by linear regression and
are optimised by a non-linear regression algorithm. The experiment chosen
as a typical representative for all other experimental trial is Run-No.
V31, in which 7 discs were placed on top of insert Il (small insert)
followed by blank inserts 12 and 13. The flow rate was 400 L h- 1 and the
separation limit was 1.32 pm. The mean error of the fitted line provides
an indication of how well the model equation is able to approximate the
experimental data. This mean error includes all experimentally obtained
grade efficiency values and is given by:
= I cr(d),.... - T(d)i.c.1)2
n - 2 i=1
2.28
where m is the number of size classes on which the calculation of the
grade efficiency T(d) o„ is based.
Figure 2.18 presents the correlated grade efficiency curve together with
the measured grade efficiency values demonstrating visually the overall
goodness of the curve fitting procedure. A summary of the results obtained
during the curve fitting procedures applied on the grade efficiency data
of various experiments are presented in Table 2.3.

able 2.3 .Summary of results obtained during grade efficiency
approximation using Equation 2.27 and experimental data.
Run-No. z Q Pos. k n re ee
V18 17 A 1.174 2.037 0.991 0.026
V19 7 A 1.115 1.883 0.990 0.028
V20a 7 300 B 0.859 2.332 0.998 0.012
7 500 B 0.830 1.893 0.998 0.014
7 700 B 0.745 1.717 0.990 0.029
V20b 17 B 0.976 2.679 0.987 0.034
V21 7 300 B 0.853 2.435 0.998 0.018
7 500 B 0.787 2.435 0.999 0.015
7 700 B 0.716 2.177 0.989 0.014
V28 7 C 0.846 2.054 0.989 0.020
V29 7 C 0.906 1.934 0.995 0.013
V30 7 C 0.869 2.127 0.999 0.012
V31 7 C 0.839 2.205 0.997 0.016
average V28...V31 0.865 2.080
0.03) 0.11)
z: number of separation discs
Q: throughput capacity C. h- 1 ); if no item is given then data
represent averages over a range of flow rates.
Pos: position of separating discs (see Figure 2.5).
k,n: coefficients obtained by regression analysis.
re : Pearson correlation coefficient
s e : mean error of estimate given by Equation 2.28.

0.0 0 0 0:51:0 1:5 2:0 2:5 30
dimensionless diameter d/dc
Figure 2.15: The change of grade efficiency T with increasing values
of did„ Calculation based on T(d) = 1-expE-(k d/dc rl, k =
0.8 (constant).
2.0;), n = 1.5; ( ), n =
n = 2.5; (- -), n = 3.0
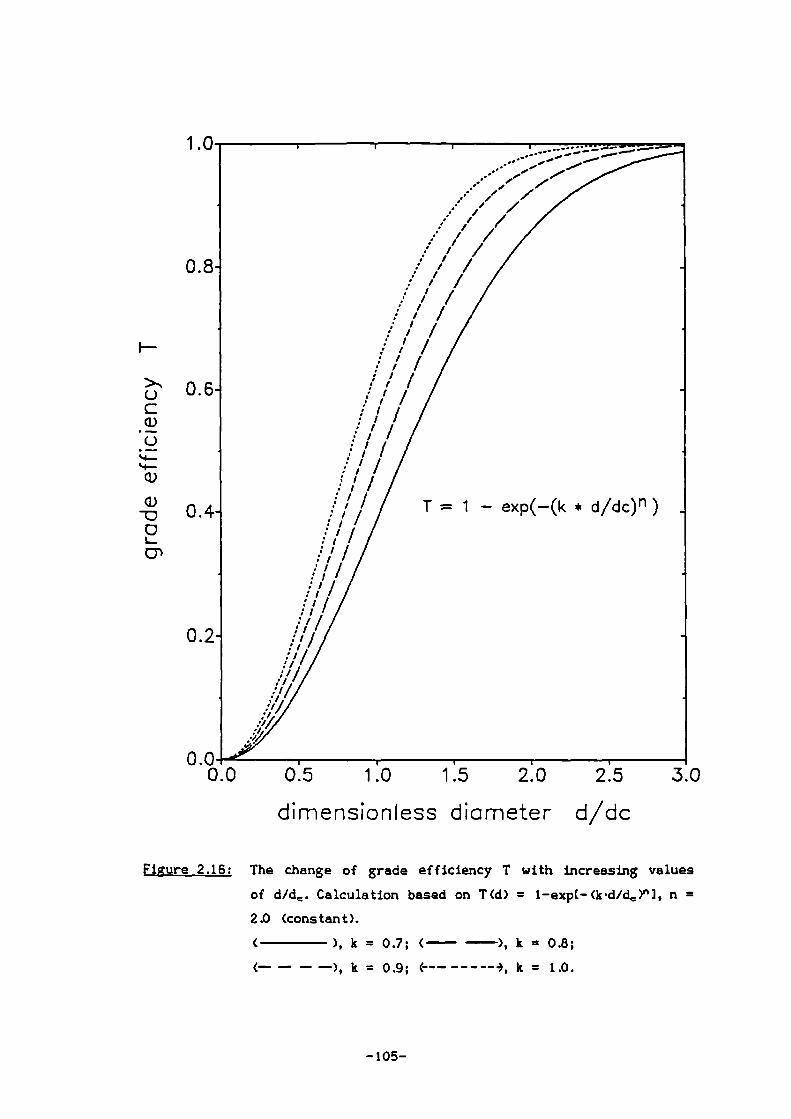
1.0
-
T = 1 — exp(—(k * cifcic) ) _
0 .8-
0.2-
0.00.0 0:5 1.0 1.5 2.0 2:5 30
dimensionless diameter d/dc
Figure 2.16: The change of grade efficiency T with increasing values
of d/dc . Calculation based on T(d) = 1-exp(-(k .d/d)n 1, n =
2.0 (constant).
( ), k = 0.7; (— ), k = 0.8;
(— — — —), k = 0.9; (-------), k = 1.0.

Run-Yo.: V31 Datum: 18.12.1986Product: PVAc Separator type: BSB 7-47-476Number of discs: 7
Position of discs: C
Flow rate: 400 L/hSeparation area: 600 m"2Specific throughput: 0.67 L/(12 m"2)Separation limit: 1.32 um
Regression line: T(d) = 1 - expC-1*(k*d/dc) 3
Coefficients : k = 0.869n= 2.194
d/dc T(d) abs T(d) cal Error
um abs.
0.792 0.600 0.192 0.213 -0.0210.924 0.700 0.245 0.285 -0.0401.056 0.800 0.352 0.363 -0.0111.188 0.900 0.464 0.442 0.0221.320 1.000 0.539 0.520 0.0191.452 1.100 0.606 0.596 0.0101.584 1.200 0.697 0.666 0.0311.716 1.300 0.746 0.729 0.0171.848 1.400 0.779 0.785 -0.0061.980 1.500 0.816 0.833 -0.0172.112 1.600 0.869 0.873 -0.0042.244 1.700 0.887 0.905 -0.0182.376 1.800 0.913 0.931 -0.0182.508 1.900 0.939 0.950 -0.0112.640 2.000 0.958 0.965 -0.007
an error of fitted line: 2.061708E-02
Figure 2.17: Typical results sheet obtained after regression procedure.

1 .0
0.8-
T = 1 — exp(—(k * d/dc) n) _
k = 0.869
n = 2.194
0.2-
0:5 1:0 1:5 2.0 2.5 30
dimensionless diameter d/dc
Figure 2.18: Plot of grade efficiency against dimensionless particle
Solid circles represent experimental data pointssize.
while the solid curve represents the best-fit line
obtained after non-linear regression using Equation 2.27.
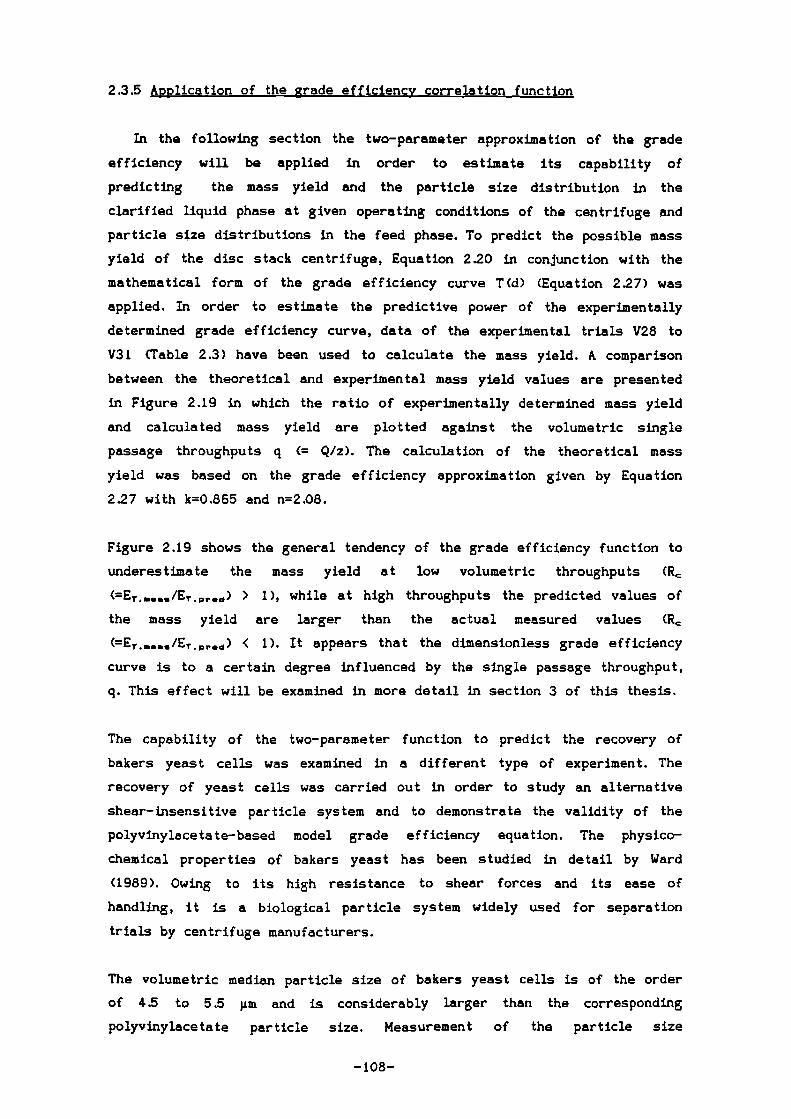
2.3.5 Application of the grade efficiency correlation function
In the following section the two-parameter approximation of the grade
efficiency will be applied in order to estimate its capability of
predicting the mass yield and the particle size distribution in the
clarified liquid phase at given operating conditions of the centrifuge and
particle size distributions in the feed phase. To predict the possible mass
yield of the disc stack centrifuge, Equation 2.20 in conjunction with the
mathematical form of the grade efficiency curve T(d) (aviation 227) was
applied. In order to estimate the predictive power of the experimentally
determined grade efficiency curve, data of the experimental trials V28 to
V31 (Table 2.3) have been used to calculate the mass yield. A comparison
between the theoretical and experimental mass yield values are presented
In Figure 2.19 in which the ratio of experimentally determined mass yield
and calculated mass yield are plotted against the volumetric single
passage throughputs q Q/z). The calculation of the theoretical mass
yield was based on the grade efficiency approximation given by Equation
2.27 with k=0.865 and n=2.08.
Figure 2.19 shows the general tendency of the grade efficiency function to
underestimate the mass yield at low volumetric throughputs (Rc
(=Er.m..../ET.pre,d) 1), while at high throughputs the predicted values of
the mass yield are larger than the actual measured values (Rc
(=ET...../Er.pr.d) < 1). It appears that the dimensionless grade efficiency
curve is to a certain degree influenced by the single passage throughput,
q. This effect will be examined in more detail in section 3 of this thesis.
The capability of the two-parameter function to predict the recovery of
bakers yeast cells was examined in a different type of experiment. The
recovery of yeast cells was carried out in order to study an alternative
shear-insensitive particle system and to demonstrate the validity of the
polyvinylacetate-based model grade efficiency equation. The physico-
chemical properties of bakers yeast has been studied in detail by Ward
(1989). Owing to its high resistance to shear forces and its ease of
handling, it is a biological particle system widely used for separation
trials by centrifuge manufacturers.
The volumetric median particle size of bakers yeast cells is of the order
of 4.5 to 5.5 pm and is considerably Larger than the corresponding
polyvinylacetate particle size. Measurement of the particle size
-108-

distribution using the electric sensing method gives varying particle sizes
depending on the ionic strength of the electrolyte (Ward, 1989). At a high
ionic strength of the electrolyte (> 1% (w/w) aqueous saline solution) the
cell shrinks as a result of cell water diffusing out of the cell and into
the surrounding fluid. At a low ionic strength (< 1% (w/w) aqueous saline
solution) causes water to diffuse into the cell thereby increasing the
volume of the cell. For this reason it is recommended to disperse the
yeast cells in a buffer of the same ionic strength as the electrolyte used
for particle size analysis. Therefore the described experiment was
performed in a buffer made of 0.15 M sodium chloride (NaC1) and 0.10 M
potassiumdihydrogen-phosphate (KH 2PO4 ) adjusted to pH 6.5 using 2.5 M
aqueous sodium hydroxide solution (NaOH). For the trials 0.35 kg bakers
yeast were suspended into 350 L of buffer giving a final yeast
concentration in the feed suspension of 0.1 % 04/W. According to Ward
(1989) the density of the yeast cells suspended in a phosphate buffer is
1120 kg m- 3 and the density of the buffer being 1015 kg m- 3 . The
viscosity of the buffer was assumed similar to the viscosity of water at
20 'C. The experiments were performed according to the same procedure
applied for polyvinylacetate described in section 2.1 of this thesis. The
separation area was reduced to 10 % of its original value by replacing
most of the discs with blank inserts, leaving 7 separating discs located on
top of insert Ii (see also arrangement C in Figure 2.5)
Table 2.4 shows the main results obtained in those experiments and
compares the measured separator performance expressed as mass yield with
the theoretically predicted performance. The theoretical mass yield was
calculated using Equation 2:20. The grade efficiency curve was approximated
using a two-parameter model equation (Equation 2.27) with the parameters n
(= 2.08) and k 0.865). The particle size distribution of the unrecovered
particles in the centrifuge AF i (d) was determined by using the mass yield
calculated with Equation 2.20 and inserting the particle size distribution
In the feed phase AF0 (d) into Equation 2.21. From the limited data, it
seems there is no significant difference between the measured and the
predicted median particle diameter for various throughputs.

Table 2.4: Separation of bakers yeast cells in a scaled-down disc
stack separator. Comparison of experimental and
theoretically predicted separation performance.
dc
experimental theoretical
ET dm(2) ET"' dm42)
L • 11- 1 1...11-1 Pm Pm PM
500 71.4 1.97 0.995 3.76 0.987 3.93
600 85.7 2.15 0.983 4.10 0.977 4.01
700 100.0 2.33 0.975 4.20 0.963 4.18
calculated using Equation 2.21 in conjunction with
Equation 2.27.
dm represents the median particle size of the
particles remaining in the clarified liquid discharge
phase.

0E..]
0
1.2
1.1
1
0.9
0.8
efficiency correction factor, Rc
0 20 40 60 80 100
120
single passage throughput Q/z (L/h)
Figure 2.19: The effect of single passage throughput on the ratio of
measured and calculated mass yield (Rd. The theoretical
mass yield was calculated using Equations 2.20 and 2.27
with k = 0.865 and n = 2.08. Each point represents the
mean of four measurements (SD = i 0.03).

2.3.6 Rapid procedure of mass yield determination
The mass yield ET is of primary importance when describing the
separation performance of a centrifuge because it is one of the parameters
which decides whether a particular machine is suitable for a given
separation problem. Any deviations from normality during a separation
procedure will be reflected in a change of the mass yield, usually giving a
lower value. It is the first sign during a separation process which will
tell the operator if something is not going according to plan. Therefore it
may serve as a valuable tool in studies on separation performance.
Changes of the mass yield are sensitive to changes in the operating
conditions, hydrodynamics and product quality. For example during the
studies on the scale down of a disc stack separator it was often necessary
to get a quick overview on how certain changes in machine operation affect
the solids recovery or the mass yield.
The mass yield of an intermittent disc stack separator may be determined
by measuring the mass of solids in the clarified liquid phase and the mass
of solids in the feed phase. At low concentrations this task was usually
performed by measuring the particle concentration of a known sample
volume using the electric zone sensing method. However, determination of
the mass yield by using this method is complicated and slow. Therefore, a
fast and reliable method of mass yield determination was required.
The turbidity of a sample is, by first approximation, proportional to the
particle concentration. Unfortunately, other factors such as particle size,
wavelength and detector geometry also affect the turbidity reading.
However, based on the experience gained during the photosedimentometer
studies of polyvinylacetate particles (chapter 23.1), there was reasonable
ground for the application of turbidity measurements for mass yield
determination. In order to evaluate the possibility of using turbidity
measurements to estimate the mass yield of a centrifugation process, feed
and supernatant samples were collected for each experimental trial
performed with polyvinylacetate. Turbidity measurement was carried out by
measuring the reduction of the intensity of a light beam passing through
the sample.
The ratio of the intensity of the light beam after passing through the
suspension and the incident light intensity was used as a measure for the
turbidity CUmnbert Beer's Law). In order to calculate the mass yield it was
-112-

assumed that the turbidity is directly related to the volume (= mass if
particle density is constant) of suspended particles. Hence, the mass yield
was calculated by inserting the corresponding turbidity readings into
Equation 2.15. Rectangular plastic cuvettes (10 mm) were used for the
measurement of the optical density. The wavelength of the incident light
beam was 695 nm.
The result of this investigation is presented as a plot of the mass yield
determined by using turbidity measurements (or optical density) versus the
mass yield based on measurements using the electric zone sensing principle
(Elzone) in Figure 220. It can be seen that the mass yield readings follow
closely a 45 '-line confirming the possibility of using turbidity readings
at 695 nm to estimate the mass yield of a separation process. The mean
error of the optically determined mass yield in respect to the mass yield
determined by the electric zone sensing method was t 3% absolute.
Practical experience has shown that in order to get good agreement
between mass yields determined by the two described techniques it is
essential to avoid settling of the particles in the sample flasks and to
measure the turbidity as soon as possible. Tiny air bubbles interfere with
turbidity readings and should be avoided.
1
0.8
0.8
0.4
0.2
0
ET(00 696)
0
02 04 08
08ET(Elsone)
Figure 220: Plot of the mass yield determined by electric zone
sensing technique and optical density measurement.
-113-

3. Preliminary studies of aggregate breakup in feed zones to disc stack
centrifuges
In the following paragraphs the experimental procedure of examining the
level of aggregate breakup in a disc centrifuge will be presented. The
model system used for the studies is introduced and the associated
problems are discussed. The objective is to use the experience gained
during centrifuge scale-down and to test the particle system described in
section 1.6.2 in respect to breakup when subjected to hydrodynamic shear
forces inside a disc stack centrifuge.
3.1 Preparation of the protein precipitate suspension
The overall experimental set-up is illustrated in Figure 3.1 which
shows the various experimental stages such as total water extract
preparation, protein precipitation and centrifuge operation in the form of
a process flow sheet.
Defatted soya flour was suspended in an extraction vessel (Al) and the
protein dissolved by adjusting the suspension to pH 9.2 using an aqueous
sodium hydroxide solution from reservoir (81). Insoluble proteins and
carbohydrates were removed using batch centrifuge (Si) and the supernatant
containing the soluble proteins and carbohydrates was diluted into the
precipitator (A2). Precipitation was performed by pumping sulphuric acid
(P1) from the reservoir (82) into the precipitator until pH 4.8 was
reached. On completion of the precipitation the precipitate suspension was
aged and then diluted into 0.07 M sodium acetate buffer (pressure vessel
A3). By means of air pressure inside the feed vessel the precipitate
suspension was pushed through the disc stack centrifuge (S2). Samples of
the precipitate suspension were collected from the feed and supernatant
stream, analysed and examined for possible particle breakup. Protein
concentrations were determined using the Biuret technique with bovine
serum albumin as calibration standard (ESA: Fraction V, 96-99% Albumin).
This method of protein measurement is based on the reaction of peptide
bonds with copper ions in alkali leading to the formation of a violet-
coloured complex which can be quantified photometrically (Kresze, 1980).

82
S1 P1 Sat** 2
Ireion
81
Figure 3.1: Process flow sheet of experimental setup.
Al: protein extraction vessel (V=2 L); A2: precipitation
vessel (11=40 L); A3: feed vessel (V=1500 L); Bl, 132: alkali
and acid containers, respectively; Si: bench top
centrifuge; 52: disc stack centrifuge (z=variable, R1=0.036
m, Ra=0.076 m, h=0.5 mm, n=9300 min- 1 , T=38 1 ); Pl: positive
displacement pump (Z=9 mL min-1 ); PI: pressure gauges; Fl:
magnetic-inductive flow meter; pH: pH-meters; TI:
theromcouples, LI: liquid level indicators.

3.1.1 Total water extract
The total water extract (rwE) was prepared in a 2.7 L baffled vessel
(I.D. 125 mm, height 220 mm, four baffles; width 5mm) equipped with a 6-
blade Rushton turbine impeller (I.D. 50 ram), temperature sensor, pH-probe
and impeller speed control. 0.25 kg of defatted soya flour (Soya fluff
200W, Interfood Ltd, England) was dispersed in 2 L of distilled water at
maximum impeller speed (1500 rpm). In order to extract the soluble protein
approximately 20 mL of 10 % (w/w) sodium hydroxide solution (NaOH) were
added until pH 9.2 was reached. The suspension was aged for 0.5 hours
prior to removal of the insoluble carbohydrates (raffinose, stachyose, etc.
- Salt, 1980) in a refrigerated centrifuge (Mistral 4L, MEE Ltd, London)
operated at 2200 rpm and 15 •: for two hours. After centrifugation the
solids fraction containing the insoluble carbohydrates and proteins was
discarded. The supernatant containing the soluble proteins and
carbohydrates, also known as 'total water extract', was stored for about 12
hours in a fridge at a temperature of 4 C. In order to restrict bacterial
growth, approximately 1 mg of sodium azide (NaN 3) was added to the total
water extract. The overall yield of extract was about 1.5 L per batch with
an average protein content of 60-65 kg m-3.
3.1.2 Isoelectric protein precipitation
Protein precipitation was performed in a purpose-build precipitation
vessel (Figure 3.2), equipped with a temperature sensor, pH-probe and
impeller speed control. The design specifications of the precipitation
vessel are listed in Table 3.1. The total water extract was diluted into an
appropriate volume of soft water adjusted to pH 9.2 (10% (w/w) sodium
'hydroxide solution) to give a protein concentration of 3-3.5 kg m-3.
Protein precipitation was initiated by adding sulphuric acid (30% v/v) at a
constant rate using a small piston pump (Micro Pump Series II, Head Size 3,
F.A. Hughes & Co. Ltd, Surrey, U.K.; flow rate 9 mL min- 1 ) at an impeller
speed of 250 rpm. To ensure rapid dispersion in the vessel, the acid was
added via a capillary syringe just below the rotating impeller. When the pH
of the suspension reached pH 4.8, acid addition was stopped and the
suspension was aged for 0.5 hours at a reduced impeller speed of 200 rpm.
The suspension temperature was approximately 20 1: throughout protein
precipitation. Typically 75-83% of the soluble protein in the total water
extract were precipitated.
-116-

3.1
Table 3.1: Precipitation reactor dimensions
Diameter T (= Depth H) 0.37 m
Volume 0.035 10
Impeller clearance ratio, h/H 0.33
Impeller/Tank ratio, D/T 0.33
Baffles (4 off) 0.1 T
Base Flat
Material Perspex'
Poly (methyl meth-acrylat) (EMMA)
Bell and Dunnill (1981) have shown that the maximum strength of protein
precipitate prepared in a batch precipitator is obtained at an aging
parameter, G .t, greater than 1 . 10 5 where G is the root-mean-square
velocity gradient (see section 1.4):
where P is the power dissipated in the liquid by a rotating agitator, V is
the volume of the liquid in which the agitation power is dissipated and p
is the dynamic viscosity of the liquid. For low viscosity fluids, this power
is closely related to the agitator diameter Di and speed n by the
relationship
P = Po p n 5 D i s3.2
where n is the impeller rotational speed in revs s- 1 , Di is the impeller
diameter in m. The power number Po is a function of mixing Reynolds
number (= onDi5 /p), the Froud number Om n5 Di/g) and other geometrical data.
For geometrically similar, fully baffled vessels without a centrifugal
vortex and turbulent conditions (Re ) 2 • 10 4 ) the power number is a
constant independent of the Reynolds number but dependent on the agitator
type. A collection of power numbers for Rushton disc turbines (6 blades)
obtained by BuJalski (1987) shows a vast variation of the Po values
obtained by different workers, ranging from values as low as 2.74 to
values as high as 6.3. In order to be consistent with work already
performed by Bell and Dunnill (1982) on the isoelectric precipitation of
soya proteins, Po = 4.5 was used for the calculation of the rms velocity
-117-

-C ". 220V
gradient. Under the experimental conditions, the ageing parameter G . t was
about 6 • 10 5 and the root-mean-square velocity gradient G was in the order
of 345 s-1.
After completion of the precipitation and ageing stage the protein
precipitate suspension was then withdrawn from an 8 mm port at the vessel
base and immediately diluted into 400 L of sodium acetate buffer (ionic
strength 0.07 M, pH 4.8L The final particle concentration was approximately
10 9 particles/L with a median particle diameter of 53 ± 0.4 pm (by
volume).
Figure 3.2: Schematic diagram of the pilot scale vessel used for the
isoelectric precipitation of soluble soya protein.
-118-

3.2 Centrifuge operation
The separator was started up with mains water flowing through the
machine as described in the operation manual. The suspension storage tank
was pressurised and the suspension gently stirred and fed to the
centrifuge using air pressure (maximum pressure 1.5 bar gauge). An average
bowl speed of 9150 rpm was used for all experiments. Samples were
collected at the feed inlet and directly from the clarified liquid
discharge. A by-pass system was used to avoid potential particle breakup
during the sampling process. For each trial four throughput capacities in
the range between 300 and 600 L h- 1 were evaluated. For each flow setting
15 kg of suspension were carried through the centrifuge before a
supernatant sample was collected (steady state condition). Feed samples
were collected after the feed was switched back to mains water. Prior to
each new flow setting the collected solids were discharged and the machine
was rinsed three times with water. A magnetic-inductive flow meter was
used for the monitoring of the throughput capacities. The average
temperature of the feed suspension was 20 C.
3.3 Particle size analysis
All size distributions were measured on an Elzone particle sizing
instrument by means of the electric zone sensing principle. A 30 pm
orifice tube was used for measuring the particle size distribution. Samples
were accurately diluted to an appropriate concentration in sodium acetate
buffer (0.07 M, pH 4.8) which was filtered using 0.2 pm Sartobran Filter
Capsules (Sartorius AG, West Germany). Otherwise particle size analysis was
performed as described for polyvinylacetate (section 2.2.1).
Mass balance studies of particle size distributions (Virkar et al, 1982)
measured after varying times of precipitate dilution showed that the
precipitate particles did not redissolve in the electrolyte solution to a
measurable extent. Preliminary studies on samples recycled after a particle
size measurement showed that no significant breakup of aggregates
occurred during the passage of the electrolyte through the orifice.
Treweek (1977) has demonstrated that owing to the effect of aggregate
porosity on the particle conductivity the electronic counter measures only
the particulate matter within a aggregate which is smaller than justified
by the actual particulate content. However, Bell and co-workers (1982)
-119-

showed that on the basis of particle size analysis using different
techniques the electric zone sensing method accounts for at least 93% of
the diameter of 6 pm precipitate particles. The small effect of
conductivity on the size measurement of precipitate particles is explained
by the theory that free electrolyte in a pore closed at one or both ends
will be non-conductive.
3.4 Physico-chemical properties of protein precipitate
The main physico-chemical properties of the soya protein precipitate
are listed in Table 3.2. The protein density was determined by measuring
the settling velocity of the precipitate particles using the Joyce Loebl
disc photosedimentometer and fitting the obtained settling velocity
distribution data to the particle size distribution (volume basis)
determined using the electric zone sensing principle. The viscosity of the
carrier liquid was determined using an Ostwald capillary viscosity meter
calibrated with distilled water at 20 C.
Table 3.2: Some important physico-chemical properties of a soya
protein precipitate suspension (20 'C). Values given
represent the mean of three measurements.
Precipitate density' 1092 kg m- 3 ±10
Density of carrier liquid 1002 kg m- 3 1.1
Viscosity of carrier liquid 0.001 Pass ±5s10-3
I assumes that particles are spherical.

3.5 Results
3.5.1 Preliminary experiments and results
a) Effect of laminar shear on large scale processed soya precipitate
The field of aggregate breakup in laminar shear fields has been
extensively studied and presented in the thesis by Bell (1982). However, in
order to characterize the shear associated properties of the precipitate
prepared on a larger scale than the precipitate used by Bell some
preliminary shear experiments were performed. To examine the resistance
to shear disruption, the precipitate was subjected to capillary shear in an
Instron 1141 Food Tester (Instron LTd, High Wycombe, Bucks, England)
modified to house a range of capillary tubes of different length and bore
width. To test the protein aggregate an average shear rate of 9 . 10 4 s- 1 at
exposure times between 0.004 and 0.022 s were chosen. The tube bore
diameter was 330 pm. To examine the shear damage at lower shear rates one
single trial was performed at an average shear rate of 1.7 . 10 4 s- 1 and an
exposure time of 0.044 s. In this case a 575 pm tube bore diameter was
used. The precipitate was prepared as described in section 3.1.
As already demonstrated by Bell (1982), at high shear rates (9 . 10 4 s-1),
the ratio dm /dm (where dm° represents the median particle size before
shear breakup and dm represents the median particle size after shear
exposure) decreases proportionally with increasing exposure times. However,
in contrast to Bell a significantly stronger dependence of dm /dm on the
exposure time was observed (Figure 3.3). The reason for this deviation is
explicable by different precipitate preparation conditions. Bell used a
smaller precipitation vessel (0.69 L) and much higher protein
concentrations (30 kg m- 3 ). Using the highest exposure time of 0.022 s the
final volume median diameter was reduced to 3.5 pm. At the lowest shear
rate of 1.7 • 10 4 s- 1 (575 pm tube bore) little aggregate breakup was
observed even for long exposure times. The initial volume median diameter
changed only slightly from 6204 pm to 6.101 pm.
b) Effect of dia hra m valve on shear disrui . tion in feed to centrifu e
In order to control the flow rate to the centrifuge it was necessary to
establish whether a valve in the feed line to the disc centrifuge causes
any shear associated damage to the protein aggregates. The precipitate was
-121-

prepared as described in section 3.1. The centrifuge was passed by using a
short cut between feed pipe and the bypass assembly. The feed vessel was
pressurised to 0.5 bar (gauge) and the flow rate was adjusted to four
values between 300 and 600 L h- 1 using a diaphragm valve. Special care
was taken to avoid any particle disruption during the sampling process.
The result of this experiment is illustrated in Figure 3.4, which shows the
cumulative volume oversize distribution at various flow rates plotted
against the particle diameter. The initial particle size was 4.9 pm and the
protein concentration prior to precipitation was 3 kg m- 3 . The non-shear
flow condition (i.e. valve completely open) is represented by the solid
squares. A considerable reduction of the volume median size is observed at
flowrates of Q = 300 L h- 1 and Q = 600 L h- 1 in which the size of the
precipitate particles are reduced to 2.7 and 3.4 pm respectively.
From these results it becomes evident that valves in the feed line to the
disc centrifuge must strictly be avoided if particle breakup shall only be
restricted to the centrifuge feed zone. Therefore it was necessary to
control the feed rate entirely by the pressure level inside the pressure
vessel and a needle valve which is located after the by-pass assembly.
c) Optical density of soya precipitate suspensions
In section 2.3.6 the optical density (or turbidity) was used to obtain
the overall mass yield ET. The optical density of a dilute polyvinylacetate
suspension was linearly proportional to the solids concentration of the
examined suspension and the mass yield ET was obtained by:
ET = 1 - OD(supern)/0D(feed) at X = 695 nm
Applying the same principle for protein precipitate showed that the mass
yield based on optical density measurement deviates considerably from the
mass yield derived using the Elzone particle size analyser. The potential
source of this behaviour is demonstrated in Figure 3.5 and 3.6.
In Figure 3.5 the total protein concentration is plotted against the
optical density at a wavelength of the incident beam of X = 695 nm for a
series of samples obtained from the centrifugation trials involving soya
precipitate. Up to an optical density of approximately 0.25 the particle
volume increases linearly proportional to the optical density. However, at
-122-

higher optical densities the total particle volume is no longer
proportional to the optical density but rises exponentially.
Optical densities below readings of 0.25 arise from supernatant samples
exhibiting particle size distributions similar to each other. In the feed
samples, however, corresponding particle concentrations give quite
different optical density values depending on the volume based median
particle diameter. This behaviour indicates that the turbidity of a soya
aggregate suspension of constant concentration changes significantly with
particle size and is particularly influenced by large aggregates.
This trend is further supported by a plot shown in Figure 3.6 where the
optical density is plotted against the volume based median particle
diameter at a constant precipitate concentration. It can be seen that the
optical density falls with increasing particle diameter. The reason for
this relationship between optical density and particle size may be
explained with a denser, more homogeneous structure of smaller aggregates
leading to higher turbidity values.
0.001 0.01 0.1
average exposure time (s)
Figure 3:3: Effect of shear rate and exposure time on particle
breakup in a laminar shear device - d.. 0 and d. are the
median particle diameters before and after shear,
respectively. Total protein concentration prior to protein
precipitation was 3 kg m-3.
-123-

0.8
0.6
0.4
0.2
cumulative volume oversize
0 1 2 3 4 5 6 7 8 9 10
particle diameter, d (urn)
Figure 3.4: The change in cumulative volume oversize from exposure
to shear in a diaphragm valve. dm° = 4.9 pm. Total
protein concentration prior to protein precipitation was 3
kg m-3.

Total particle volume (1E-13 nr3)
0.1
0.2
0.3
0.4
optical density
Figure 3.5: The effect of total protein concentration on the optical
density of precipitate samples. X = 695 nm.
20
18 -
16 -
14 -
12 -
10 -
8 -
6 -
4 -
2 -

optical density
3 3.5 4 4.5 5 5.5 6 6.5 7
volume based median diameter (urn)
Figure 3.6: The effect of median particle size on the optical density
of a protein precipitate of constant concentration.

3.5.2 Aggregate breakup in feed zone to disc centrifuge
3.5.2.1 Effect of particle breakup on mass yield.
Figure 3:7 shows a typical percent-in-range particle size distribution
(volume) of soya precipitate measured in the feed phase entering the disc
centrifuge. Included in Figure 3.7 is the corresponding grade efficiency
curve as a function of particle size for throughput capacities of 300, 400
and 500 L h- I . The grade efficiency curve was calculated on the basis of
the two-parameter function given in section 23.4.1 with the coefficients k
= 0.865 and n = 2.08. The graph indicates that most of the precipitate
particles should be recovered in the disc centrifuge under the given
operating conditions. However, computing the mass yield on the basis of the
particle size distribution in the feed to the centrifuge and the
mathematised form of the grade efficiency curve (Equation 2.20) shows a
significant deviation between theoretical to experimental values of the
mass yield. Table 3.3 lists the mass yields obtained from such a
calculation and compares the results with experimental data.
Table 33: Predicted and measured mass yields for precipitate
particles separated in a full-hermetic disc centrifuge.
ET,prod ET.mmas
L h -1
300 0.985 0.795
400 0.973 0.680
500 0.957 0.531
600 0.938 0.466
Figure 3.8 shows the result of calculating the dimensionless grade
efficiency curve using the precipitate distribution in the feed to the
centrifuge and in the supernatant leaving the centrifuge. Included in
Figure 3.8 is the dimensionless grade efficiency curve obtained using
shear-insensitive polyvinylacetate particles.

The grade efficiency for precipitate particles is better than the
polyvinylacetate curve for large values of d/d c followed by a sharp decline
for smaller values of d/dc . The precipitate curve actually extends further
down into the negative region indicating the formation of smaller
fragments which were not present in the feed suspension. Breakup of larger
aggregates leads to apparently better grade efficiencies at the top end of
the grade efficiency curve while the fragments which are more difficult to
recover cause the loss of recovery efficiency at smaller particle sizes.
At this point it needs to be recalled that in reality the dimensionless
grade efficiency curve of the disc centrifuge has not changed at all. As a
matter of fact the grade efficiency curve based on precipitate particles
uses only the wrong basis of calculation. Owing to particle breakup the
particle size distribution in the feed is different from the particle size
distribution entering the disc stack. Since particles are subjected to
breakup forces while travelling through the feed zone, larger aggregates
will break into smaller fragments which are more difficult to recover. If
this size distribution entering the disc stack was known then the grade
efficiency curve would essentially be the same as for polyvinylacetate
particles.
In the full-hermetic disc stack centrifuge the clarified liquid is
discharged by means of an in-built centrifugal pump with an impeller
diameter of 50 mm. This discharge pump is necessary to provide enough
backpressure to enable the lip seals, separating the supernatant side from
the feed side, to function properly. In addition, the pump transforms the
rotational energy of the fluid into kinetic and pressure energy used to
transport the fluid away from the centrifuge. The effect of pumps and in
particular of centrifugal pumps to particle breakup has been examined in
detail by Narendranathan (1981) who demonstrated that particles are broken
almost immediately in centrifugal pumps to give uniform particle size
distributions. If aggregates are not broken in the feed zone but in the
clarified liquid discharge a grade efficiency curve similar to the one
shown in Figure 3.8 would be obtained. However since the overall particle
volume is conserved during breakup, breakup of particles due to shear
action of the discharge pump cannot explain the observed loss of mass
yield. This reduction is only possible if the size of the particles in the
feed suspension has been altered in the feed zone prior to particle
separation. Any further particle breakup (e.g. discharge pump) has no
effect on the overall mass yield of the separator.
-128-

Therefore, the particle size distribution of the precipitate after the feed
zone affects the separation efficiency or the overall mass yield of the
disc centrifuge. If it was possible to determine this distribution then it
could be used as a measure of particle breakup. Furthermore, from the
particle size distribution conclusions could be drawn on the mechanisms
responsible for particle breakup. The remainder of this section will be
devoted to this problem.
The two processes of particle breakup and particle recovery may be divided
into two distinct processes as shown in the diagram below:
supernatant
F1 (d), m,
feedBreakup T(d)
AF,,(d), AF.(d), m, F,(d),solids
Provided that the overall particle volume before and after particle breakup
is preserved and the grade efficiency curve of the centrifuge under
examination is known then Equation 221 of section 2.3.4, allowing the
calculation of the supernatant particle size distribution, may be
rearranged to give the sheared feed size distribution AF.(d):
1 - El-AF.(d) - AF(d) 3.3
1 - T(d)
which represents the particle size distribution of the feed suspension
after the feed zone but before the suspension is entering the disc stack
for phase separation. Of course, since the breakup term in the above
diagram disappears for shear insensitive particles, Equation 3.3 may also
be used to determine the feed size distribution AFc.(d) from the particle
size distribution in the clarified liquid discharge AF 1 (d) and the mass
yield, ET, of the disc centrifuge.

tI I I1 1
Q-300 L/h
Q •400 L/h
Q •500 L/hfeed distribution
.
,
0.8
0.6
0.4
0.2
,
\
1 10
fraction
particle diameter, d (um)
Figure 3.7: Particle size distribution of protein precipitate entering
the disc centrifuge and grade efficiency curves for
precipitate particles at different flow rates calculated
on the basis of Equation 2.25 with the coefficients k =
0.865 and n = 2.08.

grade efficiency T
PVAc-particles
protein precipitate
0.2 -
0 0.5 1 1.5 2
2.5
dimensionless diameter d/dc
0.8 -
0.6 -
0.4 -
Figure 3J8: Shear breakup in centrifuge feed zone demonstrated in
form of dimensionless grade efficiency curves of
polyvinylacetate and precipitate particles.

Unfortunately, Equation 3.3 does not hold what it promises. In practice it
is very difficult to obtain a meaningful form of the sheared feed size
distribution using the derived equation. As a matter of fact, even using
particle size distributions F 1 (d) of shear insensitive particles such as
polyvinylacetate it is not possible to obtain the corresponding, measured
feed size distribution. For instance although it was possible to predict
the mass yield and the supernatant particle size of baker's yeast particles
after separation in a disc centrifuge (see section 2.3.5) which agreed well
with the measured data, it was not possible to use the actual measured
cell distribution of the supernatant and to calculate the corresponding
feed size distribution via Equation 33. The calculated feed distribution
showed no resemblance to the actual measured yeast cell distribution.
The reasons for this disagreement between the measured and calculated
distributions lie in the high sensitivity of Equation 3.3 to small errors
in the supernatant particle size distribution AF, (d) which are unavoidable
in practice. As the grade efficiency curve approaches unity the value of
AF.(d) becomes very large when the supernatant contains only a few
particles more than should be present theoretically. Integration of the
sheared feed size distribution, dFs (d), over all particle sizes gives:
dm.„I dF.(d) > 1
dmi,
An additional problem is that Equation 3.3 is also sensitive to particle
breakup in the clarified liquid discharge. If breakup of aggregates occurs
during supernatant discharge then smaller particles than should be present
are measured in the supernatant and backcalculation of the sheared feed
size distribution results in:
dm.„I dF.(d) < 1
dmi,
These problems highlight the need for a new approach to estimate the
sheared feed size distribution which is insensitive to variation of the
particle size distribution in the clarified liquid discharge. A possible
solution is provided by the mass yield, since particle breakup in the feed
zone will always be accompanied by a significant reduction of the mass
yield which will be the lower the higher the degree of breakup.
Nevertheless some caution is necessary when interpreting the mass yield
results. For instance Table 3.3 shows an increase between the estimated
-132-

and measured mass yield with flow rate. However, this increase does not
necessarily mean that particle breakup is a function of flow rate, rising
with increasing throughput capacities. In practise the relative difference
between estimated and measured mass yield values will increase even if
particle breakup is invariant to flow rate, because the sheared feed size
distribution, containing a larger fraction of small particles is affected
differently by the grade efficiency curve, compared to the original feed
size distribution upon which calculation of the estimated mass yield is
based. In the first case (sheared feed size distribution) a small change of
flow rate results in a significant change of the mass yield while in the
second case (unsheared feed size distribution) a similar change in the
throughput hardly reflects in the mass yield because the particle sizes of
the original feed distribution are on average significantly larger than the
critical particle size de (i.e. sizes above the separation limit) while the
particle size distribution after shear breakup is on average close or
smaller than the separation limit.
3.5.2.2 Estimation of sheared size distribution using an inversion algorithm
The use of an inversion algorithm as an indirect means to obtain a
particle size distribution originates from examinations of the size
distributions of natural aerosols in the submicron size range. The common
problem is the determination of size distributions from a limited number
of experimental observations represented by the weighted integrals of the
distribution over all particle sizes. In general the problem can be
characterised by the equation:
G(y) = J to(x,y 1 ) f (x) dx
3. 4
where 0(x,y 1 ) is designated as the kernel, f(x) the size distribution
function and G(5,) the value of the integral.
Replacing G(y) by the mass yield ET (d), 0(x,y 1) by the grade efficiency
function T(d,de ) and f(x) dx by the feed size distribution (1F0(d) illustrates
that the problem of solving Equation 3.4 is similar to the problem of
solving Equation 2.20 which expresses the mass yield as a function of feed
size distribution and grade efficiency. In respect to centrifugal separation
the basic idea is to measure the emerging mass yield E T (de) 1 , ET (de)2 ... for
-133--
different grade efficiency functions T(dodc) 1 , T(doi)2-. and therefrom, by
suitable mathematical manipulation, the particle size distribution dF(d).
The problem lies in finding a suitable mathematical manipulation which
allows inversion of the data set ET (dc ),, ET(d.)2.- E,. (d to obtain dF(d).
In fact one cannot obtain a unique particle size distribution dF(d) and in
some way a most acceptable solution from many possibilities needs to be
selected. Nevertheless, by means of suitable constraints, solutions can be
obtained which give tolerable results if substituted back into the integral
on the right-hand-side of Equation 3.4 to give values of ET (d) i very
close to the real values.
A comparison of generic inversion algorithms for characterising particle
size distribution has been introduced by Yu and co-workers (1987).
Examples of other algorithms and their application are given by Twomey
(1975 and 1981) and Gras (1983).
The 'apparent size' method is the algorithm used here in order to obtain
the sheared feed size distribution. The chosen algorithm is the simplest to
apply but, in some respect, is the most restricted, for in its most widely
used form it assumes that the particle size distribution fits to an
analytical distribution function such as a normal- or log-normal (see also
section 2.3.4). It relies on mean or average values to characterise the
particle size distribution and is therefore unsuitable for the detection of
bi- or polymodal size distributions.
The solution of Equation 3.4 is given by the roots of the expression:
G(y i ).... - f 0(x,y i ) f(xw a.) dx = 0
3.5a
or as far as centrifugal separation is concerned, by:
ET- ET (d.,cr.) = 0 3.6
where ET (dg) represents the estimated mass yield of a feed size
distribution (Equation 220) characterised by the geometric mean size d.
and the standard deviation a.. For a log-normal particle size distribution
the geometric mean size d. and the median size dm are identical.

If the conditions,
(i) dF.(d) is log-normal
(ii) a. of the unknown distribution is available or instead, if
the particle size distribution in the clarified liquid
discharge can be obtained
(iii) T(d) is a stable and steady function of particle size
(iv) ET can be obtained accurately
are met, then the sheared feed size distribution may be determined
numerically by obtaining the roots of Equation 3.6. In order to perform
this task a computer program was written for an microcomputer using
Microsoft Basic as a programming language. The block diagram of the
program is given in Figure 3.9. The median particle diameter of the
sheared feed size distribution is determined by varying d„., using the
Regula Falsi Algorithm (Bartsch, 1977), until the condition of Equation 3.6
is fulfilled. The results are presented in form of the parameters which
characterise the feed size distribution such as median particle size and
geometric standard deviation.
In order to verify the possible use of such an inversion algorithm to
obtain an estimate of the particle size after feed zone breakup the
algorithm was first tested using the data obtained for the separation of
polyvinylacetate. Since in this case no breakup of particles occurs the
retrieved median particle size should ideally correspond to the one
obtained from the measured feed size distribution. The results of this
calculation are presented in Table 3.4 which illustrates the good agreement
between the median particle sizes of the measured and predicted feed size
distribution.
Table 3.5 lists the results obtained for isoelectric protein precipitate and
compares the predicted sheared feed size distribution which represents the
state of the particle size distribution before entering the disc stack. The
results presented show a considerable reduction of the particle size due
to particle breakup in the feed zone to the centrifuge. The median particle
diameter of the protein precipitate in the feed distribution is reduced by
about 44% from 5.3 pm to 2.3 pm while passing through the feed zone.
-135-

Regula Fats!
(d 11 _ di) ET()
ET (d1+1 ) - E (d )T i
d1+2
. d1
0Outputda
Stop
Start
Calculation of the predictedmass yield using an initialvalue ford, d
S c
'I
/
Input of/E T,meas
Figure 3.9: Block diagram of the computer program used to solve
Equation 3.6 in order to calculate the sheared feed size
distribution.
-136-

Table 3.4: Predicted and measured median particle diameters of poly-
vinylacetate particles in feed to disc centrifuge.
Run do.pr.d do.nve doomeas
L/h ilm jim 121n
1128 300 1.33
400 1.31 1.31 1.33
500 1.29
600 1.37
V29 300 1.25
400 1.22 1.21 1.21
500 1.22
600 1.21
1130 300 1.57
400 1.70 1.65 1.63
500 1.65
V31 300 1.56
400 1.61 1.61 1.62
500 1.60
600 1.64
d...r.d = predicted median particle size of PVAc in feed
do..v. = arithm. average of
d0 _ measured median particle size of PVAc in feed
inversion was based on: A. = 598 m2
Ap = 190 kg m-3
p = 1.0 cP

Table 3.5: Predicted median particle diameters of isoelectric protein
precipitate before and after shear breakup in full-
hermetic feed zone to disc centrifuge.
Run Q d,,, ds.ave,
L/h pm Pm Pm
V36 300 2.59
400 2.24 2.35 5.26
500 2.32
600 2.23
V38 300 2.42
400 2.42 2.31 5.38
500 2.20
600 2.20
= sheared median particle size
= arithm. average of sheared median size, d.
= median size of protein precipitate in feed
inversion was based on: A. = 598 ma
Ap = 90 kg m-3
p = 1.0 cP

4. The examination of different feed zone designs in respect to shear associated particle breakup
4.1 Objective
The objective of this section is to apply the two model particle
systems to compare the full-hermetic with the semi-hermetic and a newly
developed hydro-hermetic feed zone design. The aim is to quantify the
separation performance of disc centrifuges equipped with various feed zone
designs using shear sensitive particles and in particular to examine the
separation performance of the newly designed hydro-hermetic feed zone in
respect to particle breakup.
4.2 Description of the various feed zone designs
The feed zone to a centrifuge is composed of mainly two parts, the
cylindrical feed pipe and the distributor. The feed suspension is fed into
the rotating bowl via a cylindrical feed pipe, is then tangentially
accelerated in the cylindrical part of the distributor (distributor neck)
and by radial ribs located in the conical part of the distributor
(distributor foot) and finally, the feed suspension is distributed evenly
across the disc stack. According to the design of the feed and clarified
liquid discharge zone three types of intermittent discharge disc stack
centrifuges may be distinguished.
42.1 The semi-hermetic disc centrifuge
This type of centrifuge is called semi-hermetic because it is only
hermetic in respect to the clarified liquid discharge. The ingoing
suspension is fed into the rotating bowl via a stationary feed pipe
(Figure 4.1). Discharge of the clarified liquid is aided by means of a
stationary centripetal pump which is immersed into the rotating
supernatant. The fluid flows through channels from the outside to the
Inside of the disc and the rotational energy of the fluid is transformed
into pressure energy. The pressure produced is a function of rotational
speed of the bowl, the external diameter of the centripetal pump and the
depth of immersion of the stationary centripetal pump into the rotating
-139-

liquid circle. An increase of the hydraulic throughput capacity will also
increase the depth of immersion which in turn results in an increased
pumping rate of the centripetal pump, i.e. within certain limits the
centripetal pump adjusts itself automatically to changes of the hydraulic
throughput capacity. Figure 4.2 shows a schematic diagram of a semi-
hermetic disc centrifuge. By means of a throttle valve in the discharge
line - a back-pressure is created which suppresses foam formation and avoids
the release of aerosols into the environment. The distributor itself is not
completely filled with suspension but only to a radius which depends on
the depth of immersion of the centripetal pump and the hydraulic
resistance of bowl and disc stack to fluid flow. The higher the back-
pressure the deeper the immersion of the centripetal pump. However, the
level of back-pressure is limited by overflow of the discharge liquid into
the space surrounding the bowl (centripetal pump overflow).
stationary
/Wang Ilquld
centripetal pump
Figure 4.1: Operating principle of centripetal pump.
Attention needs also be paid to the hydraulic capacity of the centrifuge
which determines the flow that can be handled Just before the distributor
starts overflowing (distributor overflow). The physical meaning of this is
that as the hydraulic throughput capacity is increased the radius of the
air/liquid interface in the open distributor will move towards the axis of
rotation until it becomes smaller than the inner radius of the distributor.
The results is overflow of the distributor and, as described before, liquid
discharge into the space surrounding the bowl.

Figure 4.2: Semi-hermetic version of intermittent disc-stack
centrifuge (Type BSB 7, Westfalia Separator, Germany).
The merits of the semi-hermetic feed zone design is the absence of seals
allowing the machine to run dry, i.e. without feed suspension flowing
through it, and the ease of operation. Air-liquid interfaces in the outlet
line are reduced to a very small area represented by the cylindrical
surface of the rotating liquid ring. Its major disadvantage is the fact
that the feed suspension is subjected to very harsh conditions inside the
distributor which includes air-liquid interfaces, impingement of the feed
suspension on the rotating stainless steel walls and sudden acceleration
at and along the ribs of the distributor which are thought to inflict
significant damage and breakup of shear sensitive material entering the
centrifuge.
4.2.2 The full-hermetic disc centrifuge
The main characteristic of the full-hermetic disc centrifuge is the
mechanical seals used to separate the feed and outlet lines from each
other and from the space surrounding the bowl (Figure 43). Contact
between the two liquid streams is avoided by the use of three rubber
seals. A further characteristic of the full-hermetic design is the rotating,
cylindrical feed pipe which together with the mechanical seals enables the
-141-

centrifuge to be completely filled with liquid to the centre of the bowl at
all times (except during solids discharge) thereby avoiding air-liquid
interfaces. Other advantages of the full-hermetic feed zone design may be
summarised as follows:
1. it may be used in pressurized process lines
2. it is better for use where the suspension is: (i) susceptible to
oxidation, (ii) of low volatility, or (iii) contains dissolved gases.
3. it offers a gentler feed system for shear sensitive solids because the
initial impact upon the particles entering the rotating bowl is avoided.
4. the potential foaming of fluid systems containing soluble proteins is
completely suppressed. Foaming is caused by protein-oxygen-compounds
which arise from the destruction of natural protein-OH-compounds in the
presence of air-liquid interfaces (Hemfort, 1987).
Figure 4.3: Full-hermetic version of intermittent disc-stack
centrifuge (Type BSB 7, Westfalia Separator, Germany).
-142-

Discharge of the clarified liquid is performed at the top of the bowl near
the centre line via a rotating discharge pump. The action of the discharge
pump is similar to that of a centrifugal pump. The fluid flows through the
vanes of a rotating impeller from a small diameter to a larger diameter
Increasing the kinetic energy of the discharge liquid. Using a throttle
valve located in the discharge line the kinetic energy is transformed into
pressure energy which causes the lip seals located in the outlet line to
be pressed against the rotating feed pipe thereby facilitating sealing of
the feed and outlet lines from each other. Furthermore, the discharge pump
also enables the transport of the fluid away from the centrifuge. Reducing
the pressure in the outlet line below a certain minimum value
(approximately 1 bar gauge) causes penetration of air into the discharge
liquid from the space surrounding the bowl. The entry of air into the
system can easily be detected by the presence of air bubbles in the outlet
line.
The major disadvantage of this type of centrifuge is that it relies on the
sealing power of the mechanical seals. In practice the rubber lip seals
need to be cooled at all times by the feed suspension and are susceptible
to wear and tear and require regular attention. Damaged seals cause
liquid to flow from the region of high pressure (usually the discharge
line) to the region of low pressure (the feed line) causing internal liquid
circulation and as a result loss of separation performance. Under no
circumstances should the centrifuge be allowed to operate dry i.e. in a
state without feed or water running through it, because this causes
considerable damage to the lip seals and necessitates their immediate
replacement. In practice a minimum flow rate of 50 L h- 1 is required to
provide sufficient cooling of the lip seals.
4.2.3 The hydro-hermetic disc centrifuge
The hydro-hermetic version combines both the advantages of the full-
hermetic and of the semi-hermetic disc centrifuge. As for the semi-
hermetic feed zone design the feed suspension is fed into the rotating
bowl via a stationary feed pipe. Discharge of the clarified liquid is
performed by means of a centripetal pump. However, in contrast to the
semi-hermetic feed version the bowl is filled to the centre with feed
sUspension, just like the full-hermetic centrifuge, but with the advantage
of no mechanical seals being present which are used to separate the feed
-143-
and outlet streams. Since the feed suspension is injected into a liquid
filled distributor the conditions experienced by the entering suspension
are thought to be far less violent compared with the semi-hermetic feed
zone design. The formation of air-liquid interfaces is also reduced to a
small area created by the free surface of the liquid circle around the
rip-body in the upper neck section of the distributor.
The basic design of hydro-hermetic disc centrifuge type is very similar to
the semi-hermetic centrifuge. The only significant difference lies in the
so-called rib-body and the hydro-hermetic disc which are located in the
neck-section of the distributor (Figure 44). This rip-body enables the
feed suspension to fill the space underneath the hydro-hermetic disc to
the centre and to immerse the stationary feed pipe into the feed
suspension. Diagrams showing different rib-body designs are given in the
experimental section of this chapter. Furthermore and in contrast to the
full- and semi-hermetic feed types, the walls in the neck-section of the
distributor are not equipped with axial ribs and are very smooth.
The function of the rib-body is to compensate the pressure generated by
the radial ribs located in the conical foot-section of the distributor.
Otherwise this pressure would cause overflow of the feed suspension out
of the distributor. Due to the ribs of the rib-body the fluid rotates with
the same angular velocity as the bowl generating a sealing liquid circle
above the hydro-hermetic disc between the wall of the distributor and the
stationary feed pipe.
In order to ensure proper functioning of the hydro-hermetic feed zone the
centrifuge has to be operated within distinct boundaries which are
determined by the pressure in the feed and discharge line and the
hydraulic throughput capacity at which the machine is operated. Operation
is limited by the following events:
(i) the feed pipe is not immersed in the feed suspension because the
feed pressure is too low.
(ii) distributor overflow occurs because the feed pressure is too high.
(iii) centripetal pump overflow occurs because the clarified liquid
discharge pressure is too high.
-144-

Fi7ure 4.4: Hydro-hermetic version of intermittent disc-stack
centrifuge (Type BSB 7, Westfalia Separator, Germany).
The typical range of operation of a BSB 7 type centrifuge equipped with a
hydro-hermetic feed zone is illustrated in Figure 4.5. The disc centrifuge
can be operated safely in respect to separation performance within the
hatched area of the two diagrams. As the diagram indicates overflow of the
discharge pump is more likely at low hydraulic capacities while distributor
overflow occurs mainly for high throughput capacities. In practice the
machine should be operated between the two boundary conditions given by
the immersion of the hydro-hermetic disc and overflow of the feed or
discharge liquid. For example at a hydraulic throughput capacity of 750 L
h- 1 the minimum feed pressure at which the centrifuge can be operated is
approximately 0.5 bar (gauge), whereas the maximum feed pressure is
approximately 1.7 bar (gauge). For the same conditions the discharge
pressure may vary between the boundaries given by 0.7 bar and 2.5 bar
(gauge) respectively. If the machine is operated in the middle of these
boundary conditions then small changes in the pressure conditions have no
effect on the operation of the centrifuge. During the examination of the
hydro-hermetic feed disc stack centrifuge in respect to shear-associated
particle breakup three design models of the rib-body were investigated.
Considering the flow of the feed suspension in, out and around the vicinity
of the rip-body it is thought that the it may act like an impeller which
is rotating at a very high velocity (more than 9000 rpm) causing even more
-145-

o erflow centri . stal p mp
Imi,inol.Iwo.--wm.111.1111.7
I
Arr
AgL
AwseraA:Ao'
ZAirarZhiglin42'
:mu
EmEtagurns
.Ar.011111
a= low distributor
IIWZ' AV A" 12- 4ropr Fr r
3 250 500 758 1000 1250 1500 1750 2000 2250 251
5
4.5
4
3.5
3
2.5
2
1.5
1
.5
9
•
.overFlow di charge pump overflow eistribttor .
1111.1
"
kali=1111EMMIREPPl atiml
:4_ IANdriehr:stgliveren
, n:n34.X\
SAW\
IT.len
NiN, 1010101"--NlEiiiiii:
:3281:11press re loss feed fi-e
3 250 500 750 1000 1250 1500 1750 2000 2250 251 0
5
4.5
4
3.5
3
2.5
2
1.5
1
.5
a
damage to shear-sensitive particles than the distributor without the
hydro-hermetic assembly. Therefore three different types of rib-body
designs, of which one is shown in Figure 4.6, were manufactured and tested
using shear-sensitive protein precipitate particles. The different rib-body
design are conveniently defined as follows:
1) Rib-body design A which has the same dimensions as the design
illustrated in Figure 4.6 but consists of 6 long ribs with sharp edges.
2) Rib-body design B which is the one actually illustrated in Figure 4.6
and in contrast to design A consists of four long ribs with rounded
edges.
3) Rib-body design C which again is similar to the one shown but this time
the rib-body consists of four short ribs (Length: 25 mm) with rounded
edges.
throughput capacity CL/h)
throughput capacity (1./h)
Figure 45: Practical operating area of hydro-hermetic disc stack
centrifuge (Type BSB 7, Westfalia Separator, Germany).
—146—

7-
046.481
so 4,0,9 roe/
0361 hg
103-49",4
4,1
02'3
042,9 -44
Figure 4.6: Sectional view of rib-body used in hydro-hermetic disc
centrifuge (Design version B).

43 Experimental
43.1 Preparation of feed suspension
4.3.1.1 Polyvinylacetate suspension
The feed suspension containing approximately 0.5 g L- 1 polyvinylacetate
was prepared as follows.
0.125 kg of polyvinylacetate (Mowilith D 50, Hoechst AG, Frankfurt, W.-
Germany) were dispersed in 0.8 L of water (purified by reverse osmosis)
and then diluted in an ultrasonic bath to give a final liquid volume of 8
L. Potential agglomerates of polyvinylacetate particles were disrupted by
ultrasonic conditioning of the suspension for approximately one hour. In
order to reduce heating of the suspension during the conditioning process
the suspension was cooled by means of a cooling device circulating coolant
through a heat exchanger placed in the suspension (coolant temperature:
OT). Prior to experimentation the suspension was diluted further in a
pressure vessel (working volume: 400 L) containing 250 L of tap water. A
slowly rotating paddle impeller (90 rpm) was used to ensure adequate
dispersion of polyvinylacetate particles in the suspension.
4.3.1.2 Isoelectric soya protein precipitate suspension
Total water extract
Preparation of the water extract containing approximately 3 kg m-3
soluble protein was performed as follows: 0.25 kg of soya flour (Soya
Fluff Basic, Interfood Ltd, Hemel Hempstead, U.K.) was dispersed in 5 L of
water (from reverse osmosis) by means of a 6-blade Rushton turbine
impeller (i.d. 50 mm) rotating at an impeller speed of 1000 rpm. To extract
the soluble protein approximately 20 mL of 10% WM sodium hydroxide
solution (Merck Chemicals, Darmstadt, W.-Germany) was added until pH 92
was reached (Knick pH-meter, Model PORTACON 652-1X, Berlin, W.-Germany).
Then the impeller speed was reduced to 800 rpm and the suspension was
aged for further 0.5 hours.
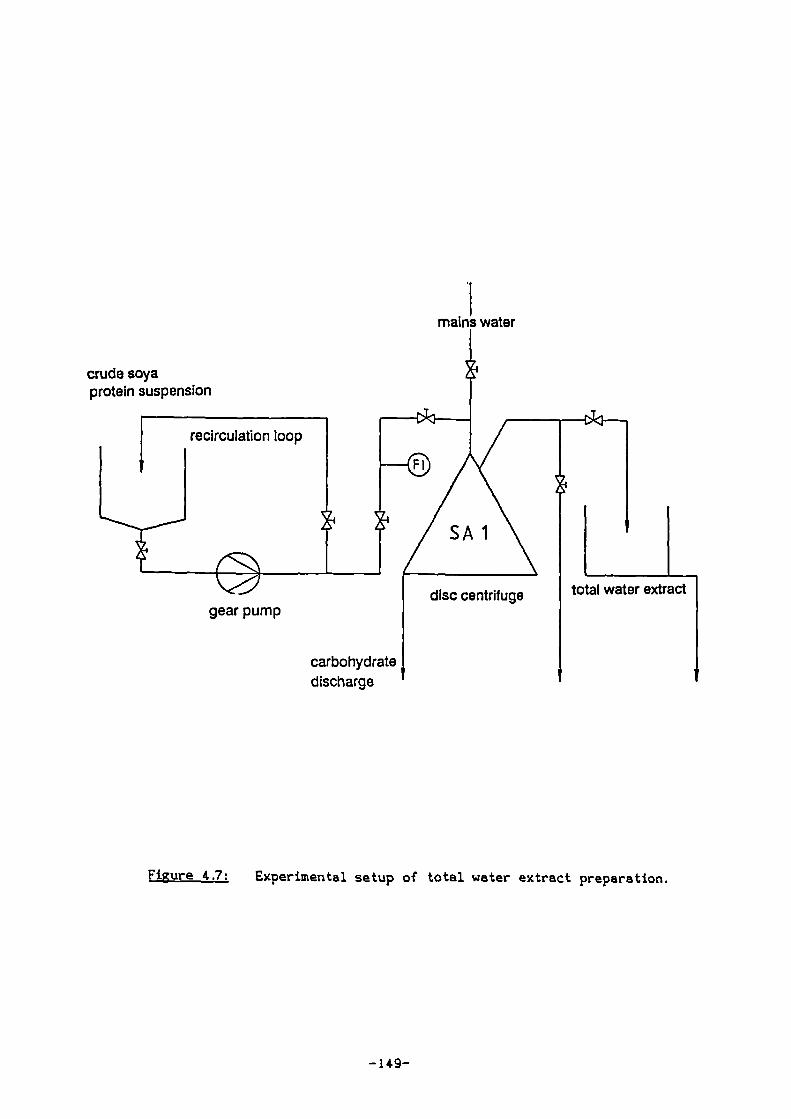
recirculation loop
1
crude soyaprotein suspension
gear pump
.1
mains water
SA 1
disc centrifuge total water extract
carbohydrate1discharge
Figure 4:7: Experimental setup of total water extract preparation.
-149-

V.- Vt..
The experimental setup used to separate the insoluble carbohydrates and
proteins from the soluble protein fraction is shown in Figure 4.7 which
consists of a small intermittent disc centrifuge (Model SA 1, Westfalia
Separator, Oelde, W.-Germany), a gear pump, a feed and discharge collecting
vessel and a rotameter to monitor the hydraulic throughput through the
separator. At first the whole system was cleaned with water circulating
through the centrifuge and the connecting pipe work. After cleaning of the
centrifuge the water was removed by discharging the machine several times.
Then the feed tank was filled with 5 L of clean tap water and the pH of
the water adjusted to 9.2 using a few drops of concentrated sodium
hydroxide solution while it was circulating through the centrifuge. During
water circulation the clarified liquid discharge was fed back into the feed
vessel. The flow rate of 40 L h- 1 was maintained using a by-pass control
loop with one branch leading back to the feed vessel and the other branch
leading to the disc centrifuge (Figure 4.7). The discharge pressure was
adjusted and kept constant at a value of 1 bar.
Once water circulation was stable, 5 L of the prepared protein extract
were diluted into the feed vessel. Mixing of the feed vessel was
maintained by the circulating feed suspension. After 5 L of suspension had
passed through the centrifuge, samples of the feed and the clarified liquid
discharge were collected and analysed for their solids content. Then the
flow of suspension was switched to tap water and the solids were removed
from the sediment holding space using the intermittent discharge mechanism
of the centrifuge.
After displacing the water from the sediment holding space, separation of
the insoluble solids fraction continued until all the suspension was used
up. The protein content of the clarified liquid discharge was determined
using the Biuret technique. On average the feed to the disc stack
centrifuge contained approximately 5 to 6 vol% solids (wet weight) while
the solids content in the clarified liquid discharge was < 0.03 vol%. The
protein content of the prepared total water extract was approximately 9 to
11 kg m- 1 . The water extract was diluted further to the required protein
concentration using tap water (pH=9.2). The amount of water required was
determined by:
• Ci..
c.
where V. is the required water volume (L), V. is the volume of the
-150-

protein extract (L), Ci.. is the protein concentration of the prepared
water extract (mg/ml) and C„, is the required protein concentration after
dilution (ng/m1).
Isoelectric precipitation of soya protein
Isoelectric precipitation of the soluble soya protein was performed
according to the same technique which has already been described in
section 3.3.2.2 of this thesis. The efficiency of precipitation which is
defined as the ratio of the soluble protein concentration after acid
addition to the concentration of soluble protein before precipitation was
in the order of 75 to 80%.
After precipitation and ageing for 0.5 hours, the precipitate suspension
was diluted in 250 L of 0.07 M sodium acetate buffer (pH 4.8) which was
prepared by dissolving 400 g of sodium hydroxide pellets in 250 L of tap
water and the addition of approximately 1.8 - 2.0 L of glacial acetic acid
Merck Chemicals, Darmstadt, W.-Germany) until pH 4.8 was reached. In order
to minimize particle breakup transfer of the precipitate suspension from
the precipitator (see Figure 32) into the feed vessel was carried out via
a wide diameter pipe (i.d. 50 mm) which was immersed into the buffer
solution.
4.3.2 Experimental setup
In order to examine different feed zone designs independent of the
exact physico-chemical nature of the testing material two separators of
exactly the same specifications were setup in such a way that they could
be supplied with the suspension from the same feed vessel (Figure 4J5).
Since it was not possible to feed the same suspension to two different
feed zone designs at the same time the machines were operated in
sequence. For this reason it was necessary to ensure a very rapid switch-
over from one machine to the other. In view of the use of shear sensitive
particles transport of the feed suspension to the centrifuge was designed
as soft as possible. Pumps and valves were avoided in the feed line and
the feed suspension was pushed through the centrifuges by using air to
pressurise the feed vessel. The hydraulic throughput capacity was
-151-

controlled by means of increasing or reducing the feed pressure and a
valve situated in the clarified liquid discharge line.
In order to limit the time necessary to obtain stable operation of the
machines basic pressure and throughput adjustment were performed while
water (from tap) was flowing through the centrifuges. Afterwards, by
operating a ball valve, feed was switched rapidly from water to product
flow. In order to avoid product damage during the sampling process it was
necessary to collect feed and discharge samples by means of a by-pass
assembly.
4.3.3 Experimental procedure
In the following section the experimental procedure, which is invariant
of the feed suspension, will be explained in detail using a specific
example. In order to ensure consistent feed product specifications only one
hydraulic throughput capacity was examined for both machines at a time. In
other words for a given flow rate samples were collected for both machines
and analysed before a new flow rate was adjusted. Since the operating and
product conditions are exactly the same for both centrifuge versions,
potential difference of separation performance when using shear sensitive
particles may then solely be attributed to the varying level of shear of
the different feed zone designs.
For convenience the disc centrifuge equipped with the full-hermetic feed
version shall simply be termed SEP1 in the subsequent text while the disc
centrifuge with either the hydro-hermetic or with the semi-hermetic feed
version shall simply be called SEP2. As mentioned earlier in order to avoid
damage the lip seals (used to separate the feed from the outlet line from
each other and from the space surrounding the bowl in the full-hermetic
disc centrifuge) need to be constantly cooled with liquid and the pressure
in the clarified liquid discharge line should not exceed 8 bar (gauge). The
hydraulic throughput capacity through the centrifuges was measured using
magnetic-inductive flow meters (Fischer & Porter, G8ttingen, W.-Germany).
The corresponding pressure in the feed and outlet lines were measured
using electric pressure transducers. The valve position belonging to the
various centrifuge operating stages given by (i) start-up of disc
centrifuges with fresh water, (ii) feed zone examination using SEP2, (iii)
feed zone examination using SEP1 are best summarised in tabular form.
-152-

02VU)
[NJ a
Vy .
4
v7
11 l 111
V7 V9
0-
0-ch
V16
DV
7
V2
Fitzure 4.13:, Experimental setup for the study of the shear associated
particle breakup in different feed zone designs.

(i) Start-up of disc centrifuges using fresh water
Valve No closed open Valve No closed open
3 i * V9 *
3 2 * V 10 *
3 3 * V 11 *
3 4 * V12 *
3 5 * V13 *
3 6 * V14 *
3 7 * V15 *
3 8 * V16 *
Three way
valve No
direction x
direction y direction z
DV 1 * *
DV 2 * *
DV 3 * *
DV 4 * *
DV 5 * *
DV 6 * *
DV 7 *
The hydraulic throughput capacity of fresh water flowing through both
centrifuges was approximately 400 L h- 1 . The clarified liquid discharge
pressure of SEP1 was adjusted to approximately 4 bar (gauge) using valve
V 6 which is located in the discharge line.

(ii) Feed zone examination of SEP2
Valve No closed open Valve No closed open
3 i * V9 *
3 2 * V 10 *
3 3 * Vii *
3 4 * V12 *
3 5 * V13 *
3 6 * V 14 *
3 7 * V15 *
3 8 * V16 *
3-way
valve No
direction x
direction y direction z
DV 1 * *
DV 2 * *
DV 3 * *
DV 4 * *
DV 5 * *
DV 6 * *
DV 7 *
In order to examine the effect on particle breakup of the hydro-hermetic
feed zone, pressure inside the feed vessel was increased to 0.6 bar
(gauge). The permissible pressure range depends on the working area of the
hydro-hermetic disc centrifuge (Figure 4J5). After switching valve V 7 from
water to product flow valve V15 is used to adjust and regulate the
hydraulic product flow rate through the centrifuge. Then the 3-way valve
DV 7 is switched from direction x - z to x - y. Once approximately 20 L of
liquid has passed through the centrifuge feed, discharge samples are
collected. For this purpose the two 3-way valves DV 5 and DV 6 are
switched in direction x - z and z - y. The discharge sample is collected
-155-

first by opening valve V 13 (vent) and then by opening valve V 14. The
feed sample is collected accordingly by switching the 3-way valves DV 1
and DV 2 in direction x - z and z - y and opening of valves V 4 (vent)
and V 5. This procedure ensures that potential particle breakup during the
sampling process is reduced to a minimum.
After the samples are collected the valves are switched back to fresh
water operation and the separator is rinsed and completely discharged
(solids discharge line) for at least three times. Vessel B 2 which is used
to collect and measure the volume of the clarified liquid discharge is
emptied by opening valve V16.
Examination of the semi-hermetic feed zone version is performed according
to exactly the same procedure. However, the pressure in the feed vessel is
only increased to approximately 0.2 bar (gauge) since otherwise overflow
of the clarified liquid discharge occurs.
(iii) Feed zone examination of SEP1
In order to examine the full-hermetic feed zone version the pressure
inside the feed vessel is increased to approximately 2.4 bar (gauge).
Before feed is switched from fresh water to product valve V 6 is opened
completely and the required hydraulic throughput capacity is adjusted
using valve V 15. After switching to product flow the centrifuge is vented
and the hydraulic throughput capacity is re-adjusted to its desired value.
The 3-way valve DV 7 is switched from direction x - z to x - y. Once
approximately 20 L of liquid have passed through the centrifuge feed and
discharge samples are collected. For this purpose the 3-way valves DV 5
and DV 6 are switched in direction x - z and z - y. The discharge sample
is collected first by opening valve V 13 (vent) and then by opening valve
V 14. The feed sample is collected by switching the 3-way valves DV 1 and
DV 2 in direction x - z and z - y and opening of valve V 4 (vent) and V 5.
After the samples are collected the valves are switched back to fresh
water operation and the separator is rinsed and completely discharged
(solids discharge line) for at least three times. Vessel B 2 which is used
to collect and measure the volume of the clarified liquid discharge is
emptied again by opening valve V 16.
-156-

Valve No closed open Valve No closed open
3 i * Vg *
3 2 * V 10 *
3 3 * Vii *
3 4 * V12 *
3 5 * V13 *
3 6 * V14 *
3 7 * V15 *
3 8 . V16 *
3-way
valve No
direction x
direction y direction z
DV 1
DV 2
DV 3
DV 4
DV 5
DV 6
DV 7
43.4 Scale-down of disc centrifuge
Scale-down of the disc centrifuge was accomplished by using the same
method and materials already described in section 2 of this thesis. In
order to use small quantities of testing material the equivalent
separation area was reduced from originally 6400 m 2 to 625 m 2 , 1250 m2
and 1875 m 2 respectively by replacing parts of the separating discs with
blank aluminium inserts (see Figure 2.1.). In order to maintain a constant
specific throughput capacity in the range of 03 L/(h m 2 ) to 0.8 L/(11 m2),
the throughput capacity was also raised with increasing separation area.
-157-

Based on the experience gained on the previously described scale-down
trials, the position of the separating discs was kept constant on top of
the small blank insert (Figure 2.5 C) for all experiment.
43.5 Particle size analysis
Particle size analysis was performed using an Elzone 180 XY particle
sizing instrument (Particle Data Europe, A.A.1741-, Luxemburg) applying the
electric zone sensing technique (see section 221.1).
Particle size analysis of the polyvinylacetate suspension was accomplished
by dispersing 1 mL of the particle sample in 50 ml.. of 10% (w/w) sodium
chloride electrolyte (0.02 pm filtered) and by using a 12 pm orifice
capillary. Measurement was performed at a vacuum pressure of 160 mbar and
a automatic stop time was 20 s giving a measurable particle size range in
the order of 0.5 to 5 pm.
Particle size analysis of the protein precipitate particles was performed
by dispersing 1 mL of the particle sample in 50 mL of 0.07 M sodium
acetate buffer (pH 4.8, 0.02 pm filtered) and by using a 24 pm orifice
capillary. As previously, the vacuum pressure was adjusted to 160 mbar and
the automatic stop time was 20 s giving a measurable particle size range
in the order of 0.8 to 12 pm.
Evaluation of the particles size analysis data, including calculation of the
mass yield and the grade efficiency curve, was performed automatically
using a Hewlett-Packard workstation (HP 9000 series).

4.4 Results
As mentioned earlier the primary objective of this investigation was to
examine the contribution of the feed zone design to particle breakup. In
section 3.52.1 it has been shown that the degree of particle breakup is
directly reflected in a comparable loss of mass yield. Therefore if two
separators of exactly the same specification are operated using identical
operating conditions, the same feed product, but equipped with different
feed zones then the difference in the mass yield could then be used as a
measure for the level of particle breakup in the respective feed system.
It is obviously not' possible to apply this approach if the feed zone
changes the grade efficiency curve measured using shear-insensitive
polyvinylacetate particles. From theoretical considerations the feed zone
should have no influence on the performance of the disc stack centrifuge.
In practice, however, different designs may alter the conditions of the
feed suspension on entry to the disc stack. For these reasons extensive
examination of the effect of feed zone design and centrifuge operation on
the grade efficiency curve were necessary prior to the studies using
protein precipitate.
Among the parameters examined were different levels of equivalent
separation area ranging from 625 m2 to 1875 m2 , different hydraulic
throughput capacities (200 L h- 1 to 1200 L h- 1 ), and for the hydro-
hermetic feed zone different rib-body designs and two bowl speed settings
of 7800 rpm and 9350 rpm. Another important feature was to examine the
reproducibility of the grade efficiency curve trials. Obviously there was
little point in applying this method of mass yield comparison if
reproducibility i.e. similar grade efficiency curves for the same
experimental conditions, could not be guaranteed.
Owing to the way the experiments were performed and the use of the
relative mass yield (full-hermetic feed zone = 1) to describe the level of
particle breakup, the exact physical nature of the protein precipitate was
irrelevant to evaluation and interpretation of the results.

4.4.1. Results obtained using polyviRylacetate particles
Table Al given in the Appendix lists the various operating conditions
applied during the separation of a polyvinylacetate suspension using BSB 7
type disc centrifuges equipped with different feed zone types. Included in
the table are all important results related to the separation performance
of the centrifuge.
Figure 4.9 shows the grade efficiency curves obtained for the full-
hermetic, hydro-hermetic and semi-hermetic disc centrifuge operated at
various specific throughput capacities ranging from 0.32 L/(h m 2 ) to 0.64
L/ (h m 2 ). Included in the graph is the theoretical grade efficiency curve
determined according to Equation 1.19 (Stokes Law). The symbols represent
the arithmetic mean value of at least three grade efficiency values for a
given feed zone design and specific throughput capacity. The regression
curve drawn through the data points was obtained by taking the arithmetic
average of the corresponding values of the correlation model parameters k
and n which were calculated utilising the two-parameter fitting routine
described in section 2.3. The curves indicate that for a given specific
throughput capacity, the grade efficiency curve is invariant to the design
of the feed zone, as there is very little noticeable deviation of the data
points from a single line. Comparing the curves obtained for different
specific throughput capacities shows that the grade efficiency decreases
slowly with increasing values of q.. This observation is supported by a
corresponding drop of the correlation parameter k and n. The deviation of
the grade efficiency curve from the Stokes curve is typical for the used
position (position C; Figure 25) of the blank inserts and compares well
with earlier results described in section 2.33.
Plotting the two model parameters k and n of all experiments against the
specific throughput capacity on semi-logarithmic paper then the following
relationship can be obtained:
k = -0.116 ln(q.) + 0.7184.1
n = -0.863 ln(q.) + 1.687
for 20 L/(h m2 ) 4 q. ( 100 L/Ch m2)
In order to calculate the mass yield based on separator specifications,
operating conditions and the physical properties of feed product
(polyvinylacetate suspension) Equation 4.1 was used in conjunction with
-160-

Equation 2.22. The results of this calculation is compared with the
measured mass yield obtained in all trials and is given in Table Al
(Appendix).
Figure 4.10 shows the grade efficiency curves obtained for three
equivalent clarification area sizes increasing from 625 m 2 to 1875 m2 . The
change of the separation area was brought about by varying the number of
separating discs in the disc stack. The Figures are similar to the one
shown previously since Figures 4.10 implicitly contains changes of the
equivalent clarification area dimension.
The disc centrifuges were operated at various specific throughput
capacities ranging from 0.32 L/(h m 2 ) to 0.64 I./(11 m 2 ). Included in the
graph is the theoretical grade efficiency curve determined according to
Equation 1.2.19 (Stokes Law). The symbols represent the grade efficiency
values of a chosen feed zone design determined for this particular
specific throughput capacity and equivalent separation area. The regression
curve drawn through the data points was obtained using the corresponding
values of the correlation parameters k and n.
The curves indicate that in accordance with theory, for a given specific
throughput capacity, the grade efficiency curve is invariant to the number
of separating discs in the disc stack i.e. the separation area. As before,
comparing the curves obtained for different specific throughput capacities
reveals that the grade efficiency decreases slowly with increasing values
of q..
The experimental reproducibility is illustrated in Figure 4.11 which shows
the grade efficiency curves obtained at different days of experimentation
but applying the same experimental conditions. The figures show some
representative examples of different feed zone designs, equivalent
separation area dimension and specific throughput capacities. The
regression line was calculated using the arithmetic average of the
corresponding model parameters It and n.
It appears that the reproducibility of the performed grade efficiency
determination experiments is sufficiently good in order to ensure the
correct application of the dimensionless grade efficiency function. It is
observed that the scatter of the grade efficiency values increases with
increasing specific throughput capacities. However, calculations have shown
-161-

that the effect of data scattering on the calculation of the overall mass
yield is negligible.
Another approach to reduce the equivalent separation area is to decrease
the centrifugal force acting upon the settling particle by operating the
centrifuge at a lower angular bowl velocity. The corresponding
dimensionless grade efficiency curve obtained in such an experiment is
illustrated in Figure 4.12 which shows the grade efficiency as a function
of the dimensionless particle diameter and angular bowl velocity. In the
described experiments the bowl speed was decreased from 9350 rpm (A. =
625 m2 ) to 7800 rpm (A. = 435 m 2 ) using a frequency-controlled variable
speed drive.
The results shown in Figure 4.12 indicate that for both the full-hermetic
as well as for the hydro-hermetic disc centrifuge a reduction of the
angular bowl velocity has no consequences on the course of the
dimensionless grade efficiency curve. In terms of the relative mass yield,
Er„. 1 , the results obtained so far mean, that for a given shear insensitive
particle suspension, separated in disc centrifuges of exactly the same
specification, but fitted with different feed zone designs, operated at
comparable operating conditions, the relative mass yield should be close to
unity. This conclusion is illustrated in Figure 4.13, where the relative
mass yield obtained using the semi-hermetic and hydrohermetic disc
centrifuge is plotted for different specific throughput capacities.

room olielsom T
Mame
•
lornesse
o Itlaellerestle
Sesemmeler
llowseass lbw
0.2
ILO
0.4
gradeawTI
SION•
•. - 1.J
•
11.4 .
•
SA
•
04
2.2
...,
• ,—,0 lOsm•fie
0 womoo•roolle
A isomemene
'-• 111•Olemelso Wpm
S
A
Stokes
,
A
•
•"•
!
•••
V
a
.•
.4,
•1
1.4
—0
0.6.
Hermetic
Hydrohirintic
fiefolhermetio
Regression line
Ls
is•
1
0.5
0.0
0.4
0.2
0.41 1.2 a • 2
Ilorasissiess Nunlet Wee
eftemisages gramme Wag
grad. efficiency T
05 1 15 2 2.5
3
dimensionless diameter dide
Figure 4.9: Effect of feed zone design on separation performance.
Plot of grade efficiency against the dimensionless
particle diameter for three different feed zone designs
using a polyvinylacetate/water suspension as model
product.
(A): specific throughput capacity, q„ =0.32 L/(h m2).
(3): specific throughput capacity, 4:6=0.48 L/Ch m2).
(0: specific throughput capacity, q,=0.64 L/Ch m2).
-163-

StokesI
I
•
...
• ,.
0 '
..••
i.
-;,
ir
0&7
—
Ae.1211 re2
Ae.1260 m'2
Ae.11376 m"2
Regression line
•..
1
0.8
0.8
0.4
0.2
AOrms arnmeow
1-11NM
0 IWO& sitA ADONIS WI7 airenT We
iimpassion
v ottioNsunr T
111NE'r' i
eil/111
WI.....' Ea rO 0.4 1 tO 1 2.2
•
▪
0.11 1 1.0 2 2.0ilmaremors ebtarlar dna erisismrs dierftr Wes
wade efficiency T
05 1 1.5 2 2.5
3dimensionless diameter &do
Figure 4.10: Effect of separation area scale on separation performance.
Plot of grade efficiency against the dimensionless
particle diameter for three separation area sizes using a
polyvinyl-acetate/water suspension as model product.
(A):q0.32 L/(h m 2 ), full-hermetic feed zone.
(B):q.=0.48 L/(h m 2 ), hydro-hermetic feed zone.
(C):q„=0.64 L/(h m2 ), full-hermetic feed zone.
-164-

0.0
0.0
0.4
0.2
Stokes-
A
I.
'..
AlA0-626 al^21
v0
4
;;
—0 Run 06 MOT 581
A Run 32 (01.08.86)
7 Run 36 (02.06.65)
— Regression line
..,a
v '.
1
0.8
0.8
0.4
0.2
0.
e.
2101•11
,
I i
I °
0 Pm No (21.21An
A Ilis V 212.2TMI
7 am 41 wasas)
'. 11101•••n•11 NM
I 7
0 0.0 1 tal 2111101111011011••• OMB
grade WVYam. T
iii MINIIIF•
WI
•A0....140
E21 t 2-: -21..]0.1 1.4 2 2.1
Ilso•ew dAlls
grade efficiency T
05 1 1.5 2 2.5
3
dimensionlese diameter d/dc
Figure 4.11: Reproducibility of separation performance results.
Plot of grade efficiency against the dimensionless
particle diameter for three independent experimental
trials using a polyvinylacetate/water suspension as model
product.
(A):q.=0.32 L/(h m 2 ), full-hermetic feed zone.
(B):q.=0.48 L/011 m2 ), hydro-hermetic feed zone.
(C):q•=0.64 L/Ch m2 ), hydro-hermetic feed zone.
-165-

Stokes
4
P11e •PA
%
"WEL
NO
-
IN.
IlAk
PT
A
IA
z
4ra
13
AA
-wr
fb
n-9300
0 n •7800
L n •7800
rpm hydroherm
rpm hydroherm
rpm hermetic
line— Regression
I I
1
0.8
0.6
0.4
0.2
0
grade efficiency T
0
0.5
1 1.5
2 2.5
3dimensionless diameter didc
Figure 4.12: Comparison of the dimensionless grade efficiency curve of
a disk stack centrifuge operated at different bowl speeds
using a polyvinylacetate/water model suspension.
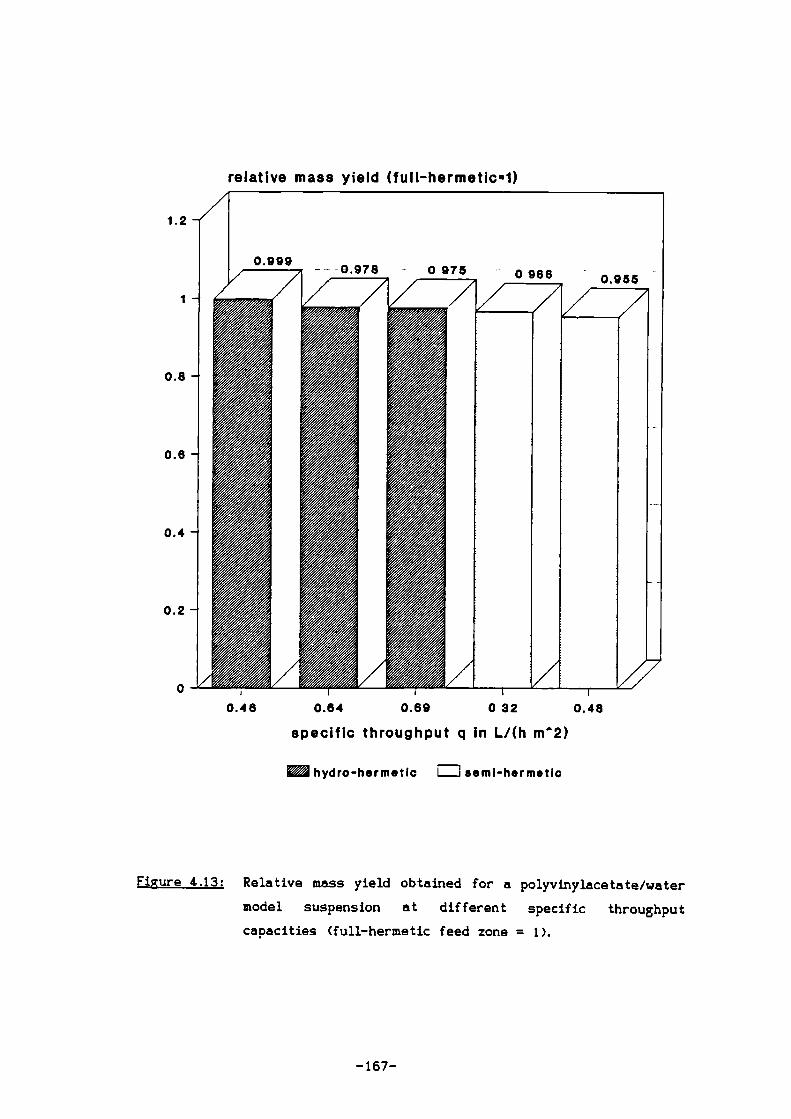
relative mass yield (full-hermetic•1)
0.46 0.84 0.69 0 32 0.48
specific throughput q in Lgh rn^2)
hydro-hermetic =semi-hermetic
Figure 4.13: Relative mass yield obtained for a polyvinylacetate/water
model suspension at different specific throughput
capacities (full-hermetic feed zone = 1).

4.4.2 Results obtained using protein precipitate particles
In the previous section it has been shown that the design of the feed
zone has no or only a minor effect on the separation performance. In order
to examine the effects of feed zone design on particle breakup a protein
precipitate suspension was separated in a disc centrifuge applying exactly
the same procedure which has already been used for the separation of
polyvinylacetate particles. From previous studies (see section 3.5) it was
known that protein precipitate particles are readily disrupted in the
strong shear fields generated in feed zones to centrifuges. It was also
known that the degree of particle breakup is related to the rate of shear
experienced by the particle (Bell, 1982). Consequently, if different feed
zone designs exert different levels of shear then this difference should
be reflected in the relative recovery performance of the centrifuges. The
higher the shear rate the smaller the resulting particles and therefore,
since particle recovery is proportional to the square of the particle
diameter, the poorer the mass yield.
In section 352.2 it is demonstrated how the sheared particle size
distribution (i.e. the particle size distribution of the feed suspension
leaving the feed zone before entering the disc gap) can be calculated
indirectly using the mass yield and a mathematical inversion algorithm.
However in order to apply this algorithm correctly the exact physico-
chemical properties of the suspension has to be available which is not
always the case in practice. For example, it is very likely that the
particle density and the particle strength varies from batch to batch of
prepared precipitate. Although there are means to determine these
fluctuations, they are far too laborious and too time consuming to be
performed for each batch of protein precipitate. Additionally the
experiments were far too important to rely solely on the reproducibility
of the protein precipitate preparation technique assuming that the product
is of constant specification and then argue that differences in the
separation performance are only due to feed zone effects rather than
altered precipitate properties.
Therefore, for reasons of importance and reliability of the performed
experiments, queries relating to the physico-chemical nature of the product
were eliminated by using two disc centrifuges equipped with different feed
zones and operated almost simultaneously (see section 42). Additionally
using the relative mass yield where the mass yield of the full-hermetic
-168-
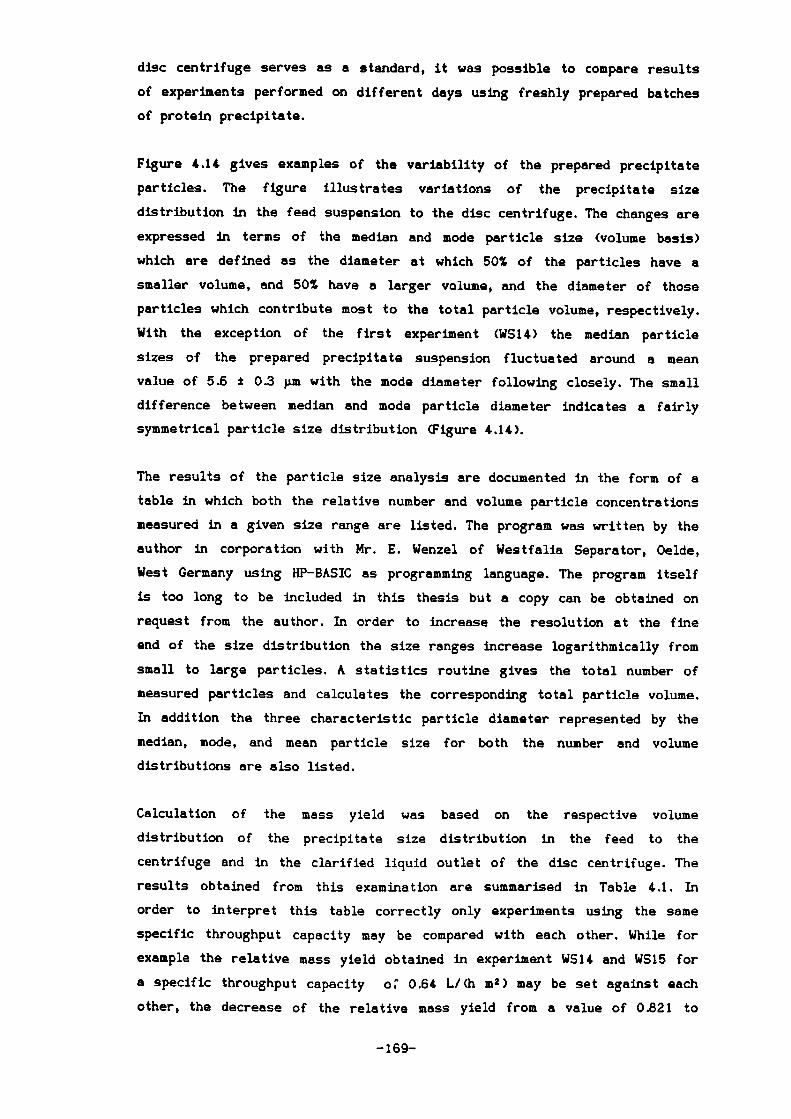
disc centrifuge serves as a standard, it was possible to compare results
of experiments performed on different days using freshly prepared batches
of protein precipitate.
Figure 4.14 gives examples of the variability of the prepared precipitate
particles. The figure illustrates variations of the precipitate size
distribution in the feed suspension to the disc centrifuge. The changes are
expressed in terms of the median and mode particle size (volume basis)
which are defined as the diameter at which 50% of the particles have a
smaller volume, and 50% have a Larger volume, and the diameter of those
particles which contribute most to the total particle volume, respectively.
With the exception of the first experiment (WS14) the median particle
sizes of the prepared precipitate suspension fluctuated around a mean
value of 5.6 ± 0.3 pm with the mode diameter following closely. The small
difference between median and mode particle diameter indicates a fairly
symmetrical particle size distribution (Figure 4.14).
The results of the particle size analysis are documented in the form of a
table in which both the relative number and volume particle concentrations
measured in a given size range are listed. The program was written by the
author in corporation with Mr. E. Wenzel of Westfalia Separator, Oelde,
West Germany using HP-BASIC as programming language. The program itself
is too long to be included in this thesis but a copy can be obtained on
request from the author. In order to increase the resolution at the fine
end of the size distribution the size ranges increase logarithmically from
small to large particles. A statistics routine gives the total number of
measured particles and calculates the corresponding total particle volume.
In addition the three characteristic particle diameter represented by the
median, mode, and mean particle size for both the number and volume
distributions are also listed.
Calculation of the mass yield was based on the respective volume
distribution of the precipitate size distribution in the feed to the
centrifuge and in the clarified liquid outlet of the disc centrifuge. The
results obtained from this examination are summarised in Table 4.1. In
order to interpret this table correctly only experiments using the same
specific throughput capacity may be compared with each other. While for
example the relative mass yield obtained in experiment WS14 and WS15 for
a specific throughput capacity (:);* 0.64 L/G1 m2 ) may be set against each
other, the decrease of the relative mass yield from a value of 0.821 to
-169-

0.701 if the specific throughput capacity is increased from a value of 0.64
L/ (h m2 ) to 0.96 L/ (h m2 ) does not necessarily mean that the particles are
subjected to greater shear forces at higher flow rates. The reason for
this becomes clear if the sheared particle size distribution of the full-
hermetic and the hydro-hermetic feed zone is computed using the inversion
algorithm introduced in section 3.3.2.2. The Inversion technique can safely
be applied here since only the relative change within a single experiment
is of interest.
Experiment WS17 examines the effect of flow rate on particle breakup in
such a way that the flow rate was doubled while the specific throughput
remained constant at a value of 0.64 L/ (h m 2 ). If the relative mass yields
obtained for the hydro-hermetic feed zone operated at a flow rate of 400
and 800 L h- 1 are averaged then a small drop from a value of 0.802 to
0.759 can be noted. The loss of mass yield for the full-hermetic feed zone
in absolute terms is illustrated in Figure 4.15. The figure compares the
mass yield obtained in various experiments operated at different flow
rates using the same specific throughput capacity.
The effect of feed pressure has been examined in experiment WS20. Since
the radius of the liquid circle inside the rib-body above the hydro-
hermetic disc is a function of the feed pressure it was interesting to
find out whether this pressure had a significant effect on particle
breakup. The hydro-hermetic disc centrifuge was operated at a feed
pressure of 1.15 and 0.75 bar. The mass yields indicate no significant loss
of separation performance with feed pressure variation. The mass yields
were in of order of 0.555 and 0.556 respectively.
For reasons described in section 4.2.3 experiments WS18, WS20 and WS21
analyse the possible effect of rib-body design on particle breakup using
rib-body design A, B, and C respectively (see Figure 4.6). The results are
shown in Figure 4.16 and no influence of the rib-body design on particle
breakup emerges from the diagram. The relative mass yield is plotted for
three different rib-body designs. the centrifuges were operated at a
specific throughput capacity of 0.64 L/(11 m2).
Experiment WS20 included examination of possible effects of bowl speed on
particle breakup. Therefore both the full-hermetic and hydro-hermetic disc
centrifuges were operated at 7800 rpm. The specific throughput capacity of
0.64 L/(h m 2 ) was maintained by an appropriate reduction in flow rate. The
-170-

change from 9350 rpm to 7800 rpm resulted in a significant rise of the
relative mass yield hence decreasing levels of shear breakup in the hydro-
hermetic feed zone. The relative mass yield increased from a value of
0.752 at 9350 rpm to a value of 0.937 at 7800 rpm. In absolute terms, the
mass yield obtained in the hydro-hermetic centrifuge increased from a
value of 0.555 to 0:743 at 9350 rpm and 7800 rpm respectively while,
although to a smaller extent, the mass yield increased from a value of
0.738 to 0:793 in the full-hermetic centrifuge. A similar trend was noted
in experiment WS18 where similar trials were performed but in contrast to
WS20 different specific throughput capacities were used.
The effect of the semi-hermetic feed zone design on particle breakup was
examined in experiment WS22 and WS23. The relative mass yields observed
for the semi-hermetic feed zone were reduced even further compared to
those values obtained for the hydro-hermetic centrifuge. In both
experiments the operating conditions of the centrifuges were exactly the
same and, not surprisingly, the relative mass yields were 0.654 and 0.660
respectively. Compared to the hydro-hermetic feed zone this result
indicates an even higher level of shear in this type of feed zone.
In Figure 4.17 the effect of feed zone design, flow rate and bowl speed on
the extent of particle breakup is expressed in terms of relative mass
yield. Since it has been shown earlier that for shear-insensitive particles
the relative mass yields obtained using the hydro-hermetic and semi-
hermetic centrifuge are close to unity (Figure 4.13) the figure quantifies
correctly the levels of shear as a function of operating condition and
feed zone design.

Table 4.1: Examination of separation performance of disc centrifuge
No
VS15
WS17
WS18
VS20
VS21
WS22
W523
equipped with different feed
precipitate particles.
zone designs using protein
Type pt. P... Q I z et...1 A. q. d... ET ET.rol
/ by by L 'C / rpm al al pm
HH 0,70 2,34 400 17,2 7 9350 625 0,64 6,35 0,620H 2,32 5,49 400 17,1 7 9350 625 0,64 6,45 0,791 0,784
HH 0,82 2,57 400 17,3 7 9350 625 0,64 5,61 0,652H 1,97 5,07 400 17,4 7 9350 625 0,64 5,62 0,794 0,821H 2,07 5,03 600 17,3 7 9350 625 0,96 5,64 0,739 0,701NH 0,71 1,87 600 17,5 7 9350 625 0,96 5,64 0,518
HH 0,97 1,59 800 16,6 14 9350 1250 0,64 5,76 0,571H 2,30 5,00 800 16,7 14 9350 1250 0,64 5,76 0,740 0,772
H 3,40 5,10 800 16,1 14 9350 1250 0,64 5,38 0,757 0,754
NH 1,20 1,70 800 16,2 14 9350 1250 0,64 5,45 0,571HH 1,05 1,47 670 16,2 14 7800 870 0,77 5,45 0,685H 2,20 4,80 670 16,3 14 7800 870 0,77 5,45 0,771 0,888
HH 1,15 1,64 800 15,9 14 9350 1250 0,64 5,76 0,555H 2,43 5,12 800 15,9 14 9350 1250 0,64 5,81 0,738 0,752
HH 0,75 1,33 800 16,1 14 9350 1250 0,64 5,84 0,556
NH 0,80 1,46 560 16,4 14 7800 870 0,64 5,84 0,743
H 2,35 5,15 560 16,4 14 7800 870 0,64 5,81 0,793 0,937
NH 0,97 1,51 800 16,4 14 9350 1250 0,64 5,10 0,515
H 2,17 5,08 800 16,4 14 9350 1250 0,64 5,16 0,681 0,756
S 0,20 1,60 400 16,1 7 9350 625 0,64 5,58 0,538H 2,20 5,40 400 16,2 7 9350 625 0,64 5,68 0,823 0,654
S 0,15 1,90 400 15,6 7 9350 625 0,64 5,96 0,543H 2,40 5,40 400 15,9 7 9350 625 0,64 6,10 0,823 0,660
No: Number of experimentType: feed zone (distributor) type (i) H = full-hermetic; (ii) HH =
hydro-hermetic; (iii) S = semi-hermeticfeed pressure
pout: discharge pressureQ: throughput capacity or feed flow rate8: temperature of feed suspensionz: number of separating discsnbowl : rotational velocity of bowlA.: equivalent separation or clarification area (Equation 1.14),
relevant centrifuge specifications are listed in Table 2.1.specific throughput capacity (= Q/A.)median size of particle size distribution in feed to centrifuge
ET : mass yieldET,rea relative mass yield (full-hermetic feed zone = 1)
Remarks: WS18: rib-body design A; WS20: rib-body design B; WS21: rib bodydesign C.
-172-

3 Y
5
1
-
_
-
-
-
i
particle diameter (urn)
W814 WS15 W818 WS17 WS18 WS19 WS20 WS21 W822
run number
=mode diameter , median diameter
Figure 4.14: Reproducibility of a batch-prepared soya protein
precipitate applying constant preparation and
precipitation conditions as described in section 4.3.1.2.

400 L/h, 9300 rpm = SOO L/h, 9300 rpm'
mass yield
experiment
Figure 4.15: Mass yield obtained for the separation of soya protein
precipitate separated in a full-hermetic disc stack
centrifuge operated at two different throughput
capacities (q. 2 0,64 Lith al).

relative mass yield (full-hermetic•l)
Design A
Design B
Design C
rib body design
Figure 4.16: Effect of rib-body design (Figure 4.6) on the relative
mass yield obtained for the separation of a protein
precipitate suspension (Full-hermetic = 1).
Design A: 6 ribs, long, sharp edges
Design B: 4 ribs, long, rounded edges
Design C: 4 ribs, short, rounded edges
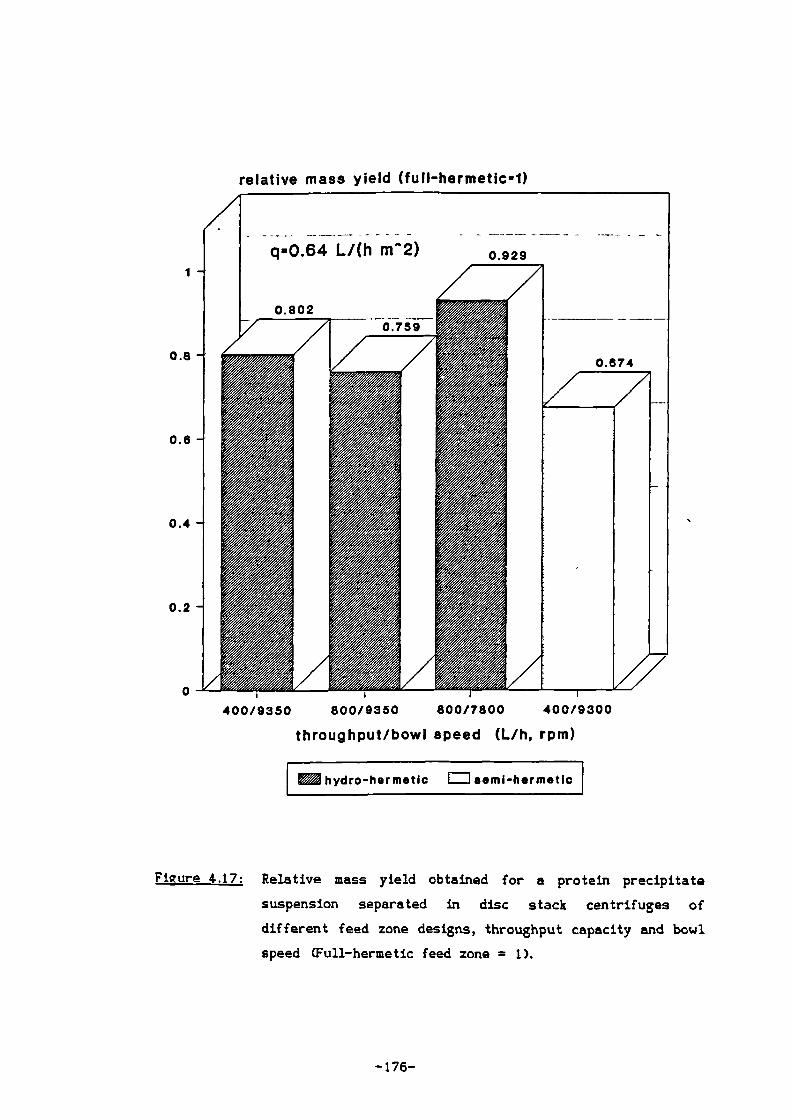
800/7800400/9350 800/9350
relative mass yield (full-hermetic.1)
,
throughput/bowl speed (L/h, rpm)
hydro-hermetic =I semi-hermetic
Figure 4.17: Relative mass yield obtained for a protein precipitate
suspension separated in disc stack centrifuges of
different feed zone designs, throughput capacity and bowl
speed (Full-hermetic feed zone = 1).

5. Discussion
5.1 Evaluation of the separation characteristics of a scaled-down
industrial disc centrifuge
In downstream processing it is often necessary to develop scale-down
techniques to model or simulate the operation of larger, pilot or
production scale, equipment. If reliable simulation techniques are
available, the biochemical engineer could then more quickly and less
expensively screen both product preparation conditions and operating
conditions that affect capital and operating cost and to a certain degree
optimise the clarification process.
In order to evaluate the use of disc centrifuges for a particular process
duty it is necessary to use a centrifuge of such size that scale-up to
industrial machines is possible. One main limitation is the ability to
control solids discharge and such a restriction leads to the use of a
centrifuge capable of operating at high hydraulic throughput capacities of
> 1000 L h- 1 . Such a throughput is considerably larger than that available
in many development facilities.
The aim of the first part of this thesis was to examine how the
separation performance of an industrial centrifuge may be assessed using
relatively small amounts of process fluid. This necessitated scale-down of
the centrifuge and for this purpose the reduction in the active proportion
of disc stacks available for separation was examined.
The study has shown that in scale-down the degree of scale-down and the
location of the active discs (discs with spaces between) have a marked
effect on the profile of the dimensionless grade efficiency curve. Firstly,
the effect of altering the disc location on the residence time of a dye
tracer can be appreciated from the data given in Table 2.2. The change of
the discs from position B (bottom) to position A (top) involves an increase
in the mean residence time of almost 36%. At a flow rate of 500 L h-',
this corresponds to an increase of the hold-up volume of approximately
0.85 L. In order to confirm this observation a series of trials were
performed at different volumetric flow rates. The hold-up volumes obtained
were 3.35 L (±0.15 L) and 2.43 L (.1- 0.06 L) for disc position A (Figure
2.5) and for disc position B respectively again a difference of
approximately 0.9 L. This increased hold-up volume is assumed to be
-177-
provided by the sediment holding space the volume of which totals about
1.5 L. The data presented are limited to the mean residence time and hold-
up volume. The dispersion number (Levenspiel, 1972), a measure of the
degree of dispersion of the flow within the centrifuge indicated a
considerable extent of fluid mixing; within the feed zone, the sediment
holding space, the disc gap and the exit zone all giving rise to partially
mixed regions. The relative error of the dispersion numbers was too high
to allow more meaningful interpretation of the data.
The results show that the incoming fluid is dispersed to a certain degree
at the foot of the distributor. Upward flow towards the top discs is not
limited to the peripheral distribution channels but involves parts of the
sediment holding space. Thus, because the grade efficiency curve plotted as
a function of the dimensionless diameter d/d, is only dependent on the
flow pattern inside the disc centrifuge it should show a distinct
difference depending on the position of the active discs in the stack. The
results obtained using a polyvinylacetate/water suspension were as
predicted from the dye tracer studies studies. In general, the grade
efficiency curve based on the top position of the active discs is
considerably better than the bottom based curve. The dimensionless median
cut size, corresponding to the dimensionless particle size at 50%
separation, increases by about 60% in relative terms from (d/de )so = 0.8 to= 1.25 if the discs are transfered from the top (position A) to
the bottom position B. This is not to say that the discs in the top
position are more effective as separators but rather that the theory
should take into account the settling that occurs in the sediment holding
space. Since this will become negligible for a completely active disc stack
it is preferred not to modify the theory but rather to choose the
arrangement where such settling is minimized. In practice it must always
be better to slightly underestimate the separation performance during
process development and to be on the safe side during scale-up.
Placing the discs in position C (Figure 2.5) is a compromise between the
two other possibilities. For scale-down purposes this location is favoured,
since it does not exhibit the significant effect of flow rate experienced
by a settling particle at the bottom position (B) and settling of large
particles in the sediment holding space is avoided.

grade efficiency T
0.8
0.6
0.4
0.2
0
0 0.5 1 1.5 2
2.5
dimensionless diameter d/dc
Figure 5.1: Comparison of grade efficiency curves of a disc stack with
reduced sedimentation area and a full set of discs of an
industrial disc stack centrifuge. (0) reduced disc stack; 7
discs; position C (see Figure 2.5), (A) Data obtained by
Brunner (1979) using an industrial disc centrifuge (z=57,
R1 =0.045 m., R0.1 m, 11=0.8 mm, n=6300 min-1).

How those data compare with a full disc stack is illustrated in Figure 5.1.
The data for the full stack were obtained by Brunner (1979) who used an
industrial disc centrifuge containing a set of 57 discs.
The graph indicates that the grade efficiency curves obtained using a
reduced disc stack (90% reduction of separation area, position C) compares
reasonably well with the curve of a full stack. For the scaled-down
version of an industrial disc centrifuge the loss of efficiency near the
separation limit is not of concern when examining the operation of the
centrifuge for full particle recovery (d/d, > 2).
The figure shows that a disc centrifuge may be scaled down to 10% of its
total available separation area in order to examine particle recovery. If
the centrifuge is to be used such that a high proportion of a particle
species are to appear in the overflow than subsequent scale-up will lead
to an underestimation of performance (e.g. approximately 20%
underestimation of flow rate for 40% recovery of particles in the
overflow). If the centrifuge is to be used for almost complete (> 95%)
particle recovery, as is normally the case, then the prediction of the
required throughput will be only slightly (< 1%) underestimated. On this
basis large scale operation may be simulated on a much smaller and less
expensive scale by reducing the equivalent separation area, batch size and
flow rates etc. by the same factor. Once fully optimized on a smaller
scale, the extrapolation to a larger scale for particle recovery should be
predictable and reliable. The other main function of a centrifuge such as
dewatering and solids discharge were not a feature of this study.
The grade efficiency profiles presented are not atypical for disc stack
separators with peripheral flow distribution channels (BrUning, 1987).
Earlier in the paper it was mentioned that the limiting particle diameter
of a well designed separator, d 100 , is given by:
dloo = /2 dc
Figure 2.11 which shows the dimensionless grade efficiency curve for the
top arrangement (position A) reveals that the limiting particle diameter of
discs with peripheral distribution channels is rather given by:
dloo = /3 dc
In contrast, due to the dependency of the grade efficiency profile on the
-180-

throughput capacity for the bottom arrangement (position B) no clear
statement on the separation limit can be made.
In subsequent experiments (see section 43) the effect of feed zone design
on separation performance was examined in more detail. Based on the
experiences gained during method development (section 23) the active discs
were placed on top of the small blank insert (position C; Figure 2.5). The
data obtained reveal no significant differences between type of feed zone
and different scales expressed in terms of equivalent separation area
available for particle separation. However, in contrast to the previous
data (see Figure 2.16) the results showed a distinctive trend of the
dimensionless grade efficiency curve towards a reduced separation
performance of the centrifuge at increased specific throughput capacities.
Generally it was observed that lower specific throughput capacities
increased the steepness of the grade efficiency curve. For example the
(d/d,).90 , at which 90% of particles of the given dimensionless size are
separated, increased from 1.60 at q. = 0.32 L/Ch m 2 ) to a value of 220 at
the higher specific throughput capacity of q, = 0.64 L/Ch m 2 ). Since no
differences in the separation performance were observed for the different
feed zone designs this result may be regarded as typical for all
separation experiments performed using a polyvinylacetate suspension. This
trend is also reflected in the value of the correlation parameters which
were used to express in a functional form the relationship between the
grade efficiency, the particle diameter, centrifuge specifications and
operating conditions. It is this dimensionless grade efficiency function
which will be discussed further.
5.2 Modelling of grade efficiency curve
The merits of using the grade efficiency curve in the form of a
mathematical expression have been discussed in section 23A. Various
possible approaches to model the grade efficiency curve were introduced
such as the simple two-parameter model which expresses the grade
efficiency by means of an exponential function involving two-parameters
and the more complex three-parameter model which assumes a log-
probability relationship between the dimensionless particle diameter and
the grade efficiency.

Subsequent application of the two grade efficiency models revealed that
the two-parameter model was sufficiently accurate to predict the
separation performance of the machine. The absolute errors made by
predicting the mass yield from the physico-chemical properties of the
solids suspension, the feed particle size distribution, the centrifuge
specifications and the throughput capacity was in the order of ± 0.03. No
additional accuracy was gained using the three-parameter model. Apart from
its simplicity the parameters k and n of the two-parameter model were
very sensitive to changes of the separation performance caused by
secondary effects such as disc stack configuration (Table 2.3) and
throughput capacity (Table Al and Equation 4.1).
Analysis of Table 2.3 indicates that the correlation-parameter k approaches
values in the range of 0.9 to 1.2 for a good grade efficiency curve
obtained for the experiments V18 and V20b where 17 active discs were
placed on top of the disc stack (position A; Figure 2.5). A good grade
efficiency curve may be defined as the grade efficiency curve which
follows the Stokes' separation curve over a wide range of dimensionless
particle diameters. A bad grade efficiency curve (Figure 2.15) shows
smaller values of k which are typically of the order of 0.70 to 0.75.
In a diagram plotting the grade efficiency against the dimensionless
particle diameter a shift of the grade efficiency curve towards the left-
hand-side indicates an improvement of the separation performance of the
centrifuge and is accompanied by an increase of the correlation parameter
k. A shift towards the right-hand-side indicates a drop in the separation
performance and is accompanied by a decrease of k.
The corresponding effects on the correlation parameters n are less obvious
mainly because changes of n have a much smaller effect on the grade
efficiency curve than variations of k (Figure 2.17 and 2.18). Basically n
may be regarded as a measure of the steepness of the grade efficiency
curve. A large value of n is a sign for a steep grade efficiency curve
while a small value indicates a flat curve extending over a wide range of
particle sizes.
The Stokes' separation curve may to a certain extent also be approximated
by the two-parameter correlation. The parameters, and in particular the
value of k, may be regarded as a measure for the deviation from the
experimentally determined separation performance from Stokes' separation.
-182-

Since Stokes separation is regarded as the maximum achievable separation
performance of the centrifuge a value of km.). = 1.3 may be used to define
the upper limit of the parameter k, i.e. if the dimensionless grade
efficiency curve follows close to the Stokes' curve the parameter k of the
two-parameter correlation equation (Equation 2.27) will be close to a value
of 13 while it decreases with reduced separation performance.
For a value of n * 2.5 the relationship between k and the dimensionless
grade efficiency curve may be summarised as follows:
(1) 1.2 < k < 1.3:
(2) 1.0 < k < 1.2:
(3) 0.6 < k < 1.0:
Grade efficiency curve follows Stokes' Law over a
wide range of particle diameters. Minor deviations
between Stokes separation curve and grade efficiency
curve occur for particles for which (d/dc ) >
Grade efficiency curve follows Stokes' Law over a
small range of particle diameters. Deviations between
Stokes separation curve and grade efficiency curve
occur for particles for which (d/dd >
Grade efficiency curve does not follow Stokes' Law.
Considerable deviation between Stokes separation
curve and grade efficiency curve in such that grade
efficiency curve is always worse.
It needs to be stressed that the boundaries of k given in the above
summary represent approximate values. The lower limit of k km„) is of
the order of 0.6 which is imposed by experimental restrictions. In practice
such small values of k have never been observed during experimentation
(see Table Al in the appendix).
The significance of n, which may be regarded as a measure of the slope of
the grade efficiency curve, is less obvious and for the approximation of
the Stokes separation curve a value of n = 3.0 may be used. However, since
changes in n do not effect the course of the grade efficiency curve as
much as changes in k the parameter n may, in some instances, approach
values larger than this. A large value of n does not necessarily imply that
the centrifuge exhibits a good separation performance since it only refers
to the slope and not to the position of the grade efficiency curve in
respect to the Stokes separation curve. In practice values of n ranging
-183-

from 2.0 to 3.0 are most common (Table Al). Smaller values of n indicate
inadequacy of the centrifuge to separate large particles with
dimensionless particles sizes of (d/d,) > 2.5; this is undesirable.
In the early stage of method development a correction factor R, was
introduced in order to account for the deviations between measured and
theoretically determined mass yield (section 23J5). Calculation of the
correction factors of the experiments V28 to V31 using the correlation
parameters It = 0.865 and n = 2.08 showed a steady decline of R. with
increasing flow per active disc gap, q. The linear relationship between the
correction factor R, and q is also illustrated in Figure 2.19 in which R,,
expressed as the arithmetic mean of all R.-values calculated for each
single passage throughput, is plotted as a function of q on semi-
logarithmic paper.
Figure 5.2 expresses the data obtained for the correction factor R e as a
function of the single passage throughput capacity, q, in which the
theoretical mass yield (Em . „..) was calculated using 4.1 in conjunction
with Equation 2.20 and the given separator specifications, operating
conditions and physico-chemical properties of the feed suspension. As can
be seen the relationship between R., expressed as the arithmetic mean of
all Re-values and q is described by a horizontal line with a mean value of
Re close to unity. These results confirm that the determined correlation
between the parameters k and n (Equation 4.1) and the single passage
throughput is sufficient to correct theoretical mass yield calculations for
secondary flow effects.
The grade efficiency diagram may be used to examine the effect of altering
the operating conditions required in the recovery of so-called protein
inclusion bodies, insoluble particles of partially folded foreign protein
which often occur when rDNA techniques are employed. They appear in cross
sections of microorganisms viewed by electron microscopy as dark masses.
When the cell has been disrupted the inclusion bodies must be separated
from the resulting cell debris but inclusion bodies are very small. The
size distribution of y-interferon and calf prochymosin inclusion bodies
were examined by (Taylor et al, 1986) and the median diameters were of
the order of 0.8 pm and 1.3 pm respectively.

efficiency correction factor, Rc1.2
1 .1 -
_1
0 .9 -
0
El
0.8 1 I I
0
20
40
60
80
single passage throughput Q/z (L/h)
Figure 5.2: The effect of single passage throughput on the ratio of
measured and predicted mass yield (R e ). The predicted mass
yield was calculated using Equation 2.20 in conjunction
with Equation 4.1. Each point represents the mean of three
measurements (SD = 0.03).

Separate experiments showed voidages accessible to suspending fluid of 70%
for y-interferon and 85% for prochymosin. To recover the inclusion bodies
free from the debris on a large-scale requires operation of industrial disc
centrifuges based on this analytical work. Based on simulating the
separation process by using the grade efficiency curve the performance of
such a centrifuge has been examined (Figure 5.3). At Low flow rate through
the rotor there is a good recovery of the inclusion bodies but poor
removal of cell debris which is also sedimented under these conditions. At
high throughput the inclusion bodies are only partially recovered, but
separation from debris is good because it is too small to sediment. The
optimum lies at a now rate of 200 L h- 1 for this machine. Subsequent
experimental studies confirmed the simulated results (01brich et al, 1988).
recovery or removal, 16
0 200
400 800
800
1000
flaw rate CL/h)
Figure 5.3: Simulated recovery of prochymosin inclusion bodies in
an industrial disc centrifuge and extent of removal
of cell debris from the inclusion bodies.
So far it has been shown that an industrial disc centrifuge can
successfully be scaled-down to approximately 10% of its original
separation area without affecting the hydrodynamics and settling
characteristics inside the machine. In order to characterize and pre-
-186-

calculate the separation performance a two-parameter correlation equation
was formulated and applied successfully. However, despite these apparent
successes the question as to what causes the effect of single passage
throughput on the course of the dimensionless grade efficiency curve
remains to be answered.
One possibility to explain these single passage throughput effects would
be to argue that it may be caused as a result of inadequate particle size
analysis. However the trends observed have been confirmed by good
agreement between the mass yield values based on particle size analysis
and the mass yield values based on optical density measurement (section
During his studies on the separation performance of a disc centrifuge
operated under a variety of conditions, Brunner (1979) has also shown that
a polyvinylacetate/water suspension is highly sensitive to changes of the
hydrodynamic conditions experienced by the particle suspension. With
Increasing throughput capacity a significant reduction of separation
performance was observed. The reason for this reduction lies to a great
extent in the level of cross-flow at the disc periphery. Partially
confirmed by dye tracer studies, not all of the suspension is fed into the
disc gaps via the peripheral flow distribution channels but some is fed
via the periphery of the disc. This causes separated solids to be partially
remixed into the freshly supplied feed suspension flowing into the next
disc gap on top. As a consequence the solids are only partly separated
(Figure 1.6). This hypothesis explains the flow rate dependency of the
separation results since the level of cross-flow increases with increasing
single passage throughput.
In this respect the findings presented so far are in line with observations
made by other research workers. However in order to confirm this
hypothesis more detailed experiments regarding the effects of peripheral
suspension loading on separation efficiency are needed. In particular it is
recommended to avoid entry of the feed suspension into the solids holding
space and by the use of internal feed distribution channels.

5.3 Evaluation of shear breakup in feed zones to disc centrifuges
The effect of shear on suspensions of protein precipitates and its
influence on particle recovery was studied in three different types of
centrifugal feed zones. As described in section 1.5 a precipitate particle
will be disrupted if placed in a shear field exceeding a critical stress
value. The rate and mechanism of breakup is a complex function of particle
strength and size and the hydrodynamic properties of the shear field. Since
particle strength is related to particle size, the larger the aggregate the
lower the yield strength and consequently larger aggregates are more
susceptible to shear associated breakup than smaller ones which have
higher critical strengths. Hence, the rate of particle breakup is faster at
higher rates of shear and larger aggregates breakup faster than smaller
ones.
Therefore, if different feed zones exert different levels of shear then as
observed in section 4.4.2 the separation performance of the centrifuge will
be the lower the higher the shear rate in the feed zone. The results
showed that most shear breakup occurred in the semi-hermetic, followed by
the hydro-hermetic feed zone design. The least amount of particle breakup
was observed for the full-hermetic feed zone. In contrast to the hydro-
and full-hermetic feed zone versions the semi-hermetic feed zone comprises
a variety of locations which may contribute more or less to the breakup
effects (Van der Linden, 1987).
(1) The primary contact between the centrifuge and the feed suspension
takes place at the lock-nut, which, because of its conical shape,
deflects the liquid flow, which is ejected from the stationary feed
pipe with high velocity. Owing to the short contact time little
momentum is expected to be transfered in angular direction.
(2) The second location comprises the acceleration ribs in the
distributor where intensive contact between the distributor and the
feed suspension takes place.
(3) The third location is thought to be the trajectory in between the
distributor rib and the liquid surface situated at the pressure side
of the guiding rib.

(4) Fourth location is the inner wall of the distributor where axial
shear becomes predominant when the feed liquid surface radius is
positioned outwards resulting in low liquid depths.
(5) Finely the fifth location for particle breakup is the conical shaped
lower end of the distributor where high shear rates may occur.
In practice breakup is probably the result of the combined action of all
the locations just described each contributing more or less to the level of
breakup.
From the point of view of the equipment manufacturer evaluation of the
location which brings about most of the particle disruption seems to be
the most formidable task whereas the mechanisms of breakup are of less
importance.
Examining the disruption data of the full-hermetic feed zone shows a
considerable reduction in the possible solids recovery efficiency caused by
a substantial drop in the feed particle size distribution as a result of
aggregate disruption in the centrifugal feed zone. The initial volume
median size falls from 5.1 pm in the original feed size distribution to
approximately 2.3 pm after the feed zone which represents a size reduction
of almost 55%. This is surprising because this type of feed zone is
classified as 'soft feed' designed to be especially gentle on aggregates.
The questions are what level of shear is experienced by the solids
aggregate inside the full-feed zone and which factors contribute to this
high level of particle size reduction.
In order to obtain some impressions on the level of shear inside the
centrifuge feed zone the first step is to calculate the root-mean-square
velocity gradient, G. As mentioned in section 13.5 the breakup of
aggregates in a fluid suspension generally is directly associated with the
hydrodynamic state of the fluid as for example: laminar or turbulent flow,
scale of turbulence ana the size of the energy transferring eddies.
However in order to calculate the root-mean-square velocity gradient, G, it
is first necessary to determine the dissipated power per unit volume of
liquid which is used to approximate the intensity of turbulence in an
agitated liquid. This principle has proved useful in the scale-up of
agitator vessels, where geometrically similar vessels and agitator

arrangements of differently sized equipment require constant power per
unit volume in order to produce the same homogenisation of suspension.
In a full-hermetic disc centrifuge the power dissipated inside the feed
zone is related to the pressure drop across the distributor. Applying the
power - pressure drop relationship given by:
Ps = Q
5.1
then the the power dissipated in the centrifuge can be calculated. In
respect to particle breakup, only the power dissipated in the feed zone is
of interest. The pressure drop across the disc centrifuge is the sum of
the pressure drop across the disc stack, the distributor and the liquid
discharge line. If the Latter is neglected then the pressure drop across
the distributor Ap,,., may be estimated by:
= AN - 5.2
The disc pressure drop can be estimated using an expression derived by
Brunner (1956) during his studies on the centrifugal separation of
oil/water emulsions. For disc stacks equipped with long caulks Carlsson
(1986) suggests:
AP.i.c N°(X)2 4 sin, ln(12+1) M°0025.3
Ap.v. 11002 - M(X) 2 zL ln(Ra/Ri) 144'002 + W002
p, m Q ln(R./R,)AP.y. =
5.4
x h z N°00
where p is the density of the precipitate suspension, m is the angular
bowl velocity, Q is the throughput capacity, h is the gap width, z is the
number of discs and 144'00 is the tangential fluid velocity profile.
The meridian and tangential velocity profiles M0 (X) and N4qA) can be
obtained using:
1 sinh(X) - sin(X)N°00 =
5.5
cosh(A) + cos(X)
and

1 sinh(X) + sin(X)M°(X) = 1 5.6
X cosh(X) + cos(X)
where
III a sineX - h
For values of X > 10 the above equations can be simplified to
N°(X) = 1/X
and M°(X) = 1 - 1/X 5.8
Subsequent calculation using the specifications listed in Table 2.1 showed
that the pressure drop, Apdi.c , across a full disc stack (z = 72) is very
small and therefore the pressure drop across the disc centrifuge may
directly be used to express the pressure drop across the distributor which
finally can be applied to determine the power dissipation:
15 .11.t = APs Q 5.9
The root-mean-square velocity gradient G is then given by:
= (/),...d1.-t/W/2 5.10
where 1:1„.di.* represents the power dissipated per unit volume of liquid (=
Pdt. .t/Vdt..e). Numerical evaluation of the above equations (Q = 300 L h-1,
* 0.5 bar, Vd,. .t * 0.3 L) shows that the mean power dissipated per
unit volume in the distributor of a disc stack centrifuge equipped with a
full-hermetic feed zone is of the order of 15 kW/m 3 , which corresponds to
a high degree of turbulence. For similar scales of power dissipation
considerable breakup of protein precipitates has been found in centrifugal
pumps by Narendranathan (1981).
Alternatively the specific power dissipated in the entry zone may be
estimated from the momentum balance and the law of conservation of energy
applied to the liquid entering and leaving the centrifuge. The liquid mass
m enters the centrifuge with no kinetic energy or momentum and leaves the
centrifuge at the discharge radius r d , with the rotational speed equal to
that of the bowl, i.e. a velocity u in the tangential direction. The angular
momentum is then:
L = m rd u 5.11
According to the laws of momentum conservation this increase in angular
5.7
-191-

momentum is equal to a driving torque given by:
T = 111 rd u
5.12
which corresponds to a driving power:
P. = To = :11 u2
5.13
or, written in a more convenient form given by:
PO = Qp02r02
5.14
where Q is the flow rate of the discharge stream and p is the fluid
density.
Equation 5.14 shows that a bowl discharging the fluid at a radius r d = 0
requires ideally no power. Actually, viscous drag of the fluid in the
passage of the bowl is present and has to be overcome by an external
source since no energy is available from the centrifuge. In practice the
stream is discharged at a radius other than zero and a small part of the
power computed by Equation 5.14 is consumed to overcome the viscous drag
resulting from the flow of that stream through the centrifuge. A second
part appears as kinetic energy in the discharge fluid and the rest of this
power is dissipated in heat and turbulence. G8ssele (1980) suggests that
approximately half the driving power is transformed into kinetic energy of
the fluid discharge while the other half is dissipated within the feed zone
of the centrifuge.
Pdist = 1/2 P. = 1/2 Qpo 2 r, 25.15
Using the experimentally determined, effective fluid discharge radius (r d =
040109 m) of the full-hermetic feed zone, a flow rate of 300 L h- 1 and a
angular bowl velocity of 965 s- 1 a power value Pdist of roughly 4.6 W can
be calculated. On the basis of a distributor volume of 0.3 L it is possible
to calculate the specific power dissipated in the full-hermetic feed zone.
The value of Pv,dist = 15.4 kW/m 3 is of the same order of magnitude as the
value calculated before using the pressure-drop approach.
The major disadvantage in applying the power dissipation per unit volume
approach in order to explain the various levels of particle breakup lies in
the difficulties to measure the dissipated power in feed zones other than
the full-hermetic and in the problem to define the liquid into which
volume the power is actually dissipated. However, comparing the hydro-
-192-

hermetic and the semi-hermetic feed zone versions, it would appear that a
similar amount of power is dissipated In a smaller volume of liquid. As a
consequence the levels of particle breakup increase. Calculating the root-
mean-square velocity gradient according to Equation 1.43, shear levels of
the order of G„., m 3700 s- 1 are obtained. These levels of shear are
approximately four times greater than those of a precipitation reactor
where considerable particle breakup was observed (Glatz et al, 1986).
Particle breakup as a result of particle collision with the distributor
ribs seems to be the most likely cause for particle breakup. This would
also explain, apart from the different levels of power dispersion, the
considerable differences in terms of particle breakup between the hydro-
hermetic and full-hermetic feed zone versions. The rotational velocity of
the distributor rib is given by:
V, 110 =
5.16
where rri, is the inner rib radius. Since the frequency and the impact of
collision with the rib will be proportional to the circumferential velocity
of the rib, particle breakup should be a function of the bowl speed and
the rib radius, i.e. particle breakup should be reduced if v ri, is
decreased. On the other hand similar levels of particle breakup should be
observed if vri, remains constant.
Examining the hermetic and hydro-hermetic feed zone versions shows that
the effective rib-radius of the full-hermetic feed zone is roughly 0.021 m,
while the effective rib-radius for the hydro-hermetic feed zone is of the
order of 0.0275 m. Hence, provided the assumptions made earlier are
correct, then it is not surprising that for the same angular bowl velocity,
considerably more particle breakup is observed for the hydro-hermetic feed
zone compared with the full-hermetic feed zone.
As a matter of fact, reducing the rib-velocity of the hydro-hermetic
distributor to a value close to the rib-velocity of the full-hermetic
distributor, increases the relative mass yield to values close to unity
provided the specific throughput capacity is kept constant (see mass yield
data of WS20, Table 4.1).
Since the observed level of particle breakup was even higher for the semi-
hermetic feed zone, these additional levels of breakup are attributed to
impingement of the feed suspension onto the rotating distributor walls
after deflection from the lock nut and in particular the impact with the
-193-

rotating tips of the distributor ribs which, according to Van der Linden
(1987) contribute considerably towards higher levels of shear-associated
particle damage.
One aspect which so far has not yet been considered is the effect of flow
rate on the level of particle breakup. Although Figure 4.15 indicates a
trend to more particle breakup at higher flow rates the data have to be
treated carefully since the experiments were not performed using the same
batch of precipitate particles. The results shown would only be in
correspondence with Equation 5.15 which, if correct, implies that the
higher the flow rate the greater the power dissipated and hence the higher
the levels of particle breakup. On the other hand, however, it is important
to remember that particle breakup is also a function of the time a
particle is exposed to shear (Bell, 1982) which in itself is inversely
proportional to the flow rate, Q. Therefore, it may well be that the
increase of shear is partly offset by a reduction of the corresponding
shear exposure time.
In conclusion the study of the behaviour of suspensions of protein
precipitate in feed zones to disc centrifuges has provided valuable
information which are useful for quantifying the levels of particle
disruption and for the design of new, IOW shear feed zone versions.
In order to confirm the above findings a detailed examination of the
effect of the distributor-rib diameter on the level of particle breakup is
currently under way. Based on the results presented in this thesis new
distributor types allowing acceleration of the feed suspension close to the
centre axis of rotation are being build and tested by centrifuge
manufacturers.

6. Conclusions
The separation performance has been studied for a scaled-down version of
an industrial disc centrifuge. It has been shown that a disc centrifuge
may be scaled down to 10% of its total available separation area in order
to examine particle recovery. It has also been shown that the separation
performance of the scaled-down disc centrifuge is influenced by the
location of the active discs within the partially blanked disc stack.
The most unfavourable location of the active discs in respect to
separation performance was found to be near the distributor foot where
the feed suspension leaves the distributor and enters the spacing in
between the discs. Secondary effects of the flow rate on the separation
performance are observed showing a decrease in the performance of the
disc centrifuge with increasing single passage throughputs.
Effects of scale on the separation performance due to variation of the
number of active discs were not observed. It has been shown that a two-
parameter equation can be used successfully in order to express the grade
efficiency curve in a mathematical form which is very useful for computer
simulation purposes.
When placed in a shear field protein precipitates are readily fragmented
into smaller particles of which the fragment size is related to the size of
the particle, the particle strength and the strength of the shear field.
Using these properties it has been show that in the high shear fields of
feed zones to centrifuges precipitate particles are easily disrupted into
smaller particles resulting in a considerable loss of separation
performance.
-195-

It has also been shown that the level of particle breakup is related to
the design of the feed zone. A high level of particle breakup has been
observed for the semi-hermetic feed zone while far less shear damage was
observed for the full-hermetic feed zone.
In respect to particle breakup the hydro-hermetic feed zone design showed
less particle breakup than the semi-hermetic but more breakup than the
full-hermetic feed zone versions. When the bowl speed is reduced the level
of particle disruption is also decreased resulting in an improved
performance of the disc centrifuges. The exact mechanism of aggregate
rupture in feed zones has not been solved yet but collision forces between
particles and the rotating distributor ribs together with turbulence seem
to be the most likely cause for particle breakup.

List of symbols
dimension
A. equivalent separation area
effective equivalent separation area m2
An net sectional area R2
bL. caulk width
floc strength constant
Cifloc strength constant (inertial
convective subrange) —
C2 floc strength constant (viscous
dissipation subrange)
solids concentration in feed kg m-3
Cm .1 solids concentration in supernatant kg m-3
cm a solids concentration in solids
discharge kg m-3
c. soluble protein concentration kg m-3
c, volumetric solids concentration kg m-3
diffusivity cm2 s-1
D iimpeller diameter
D. dielectric constant -
d particle diameter
d, critical particle diameter
d loo particle diameter of 100% recovery
drn median particle diameter
d... maximum particle diameter
d,, sheared particle diameter
ds..v. arithmetic average of sheared
particle diameters
do.seas median particle diameter in feed
to centrifuge
electric field strength V m-I
E(k,t) energy spectrum
ET mass yield
ET.probd predicted mass yield
ET,swas measured mass yield

dimension
F. floc binding force
shape factor
f0number frequency distribution
f, volume frequency distribution
F. cumulative number distribution
F3 cumulative volume distribution
AF. (d) normalised volume frequency
distribution in feed
F 1 (d) normalised volume frequency
distribution in supernatant
AF2 (d) normalised volume frequency
distribution in solids discharge
fLcorrection factor
gravity constant (= 9.81 ms-2)
root-mean-square velocity gradient s-1
Gcliwt root-mean-square velocity gradient
in distributor s-1
height
current A
wavenumber (= X-1)
constant -
K, constant
constant -
K, constant
KA rate constant
Kleff collision efficiency factor -
K.,*extinction coefficient
K0constant
Ke Boltzman constant (= 1381 . 10- 21 J K-1)
length scale of energy dissipating
eddies
4 central distance between particles
In mass kg
In number of size classes -
In relative refractive index
mass flow rate kg s-1
mass flow rate of feed kg s-1
-198-

dimension
A /mass flow rate of supernatant kg s-1
ha mass flow rate of solids discharge kg s-1
MD (X) meridian fluid flow profile in s-1
n impeller rotational speed rev s-1
N number of particles -
N. initial number of particles _
Nmax maximum possible number of primary
particles in an aggregate -
N° (X) tangential fluid velocity profile in s-1
P dissipated power W
Po power number -
P. dissipated power in feed zone W
Pv.dist dissipated power per distributor
unit volume W m-3
Ap. pressure drop across separator bar
4.11.t pressure drop across distributor bar
APdinc pressure drop across disc stack bar
Q hydraulic throughput capacity m3 s-1
q single passage throughput m3 s-1
q. specific throughput capacity L m-2h-1
3 radius in
r. Pearson correlation coefficient -
r, liquid discharge radius in
rri, inner rib radius in
R particle radius in
R. outer disc radius in
Re Reynold number -
R iinner disc radius in
Ro Rosby number -
S protein solubility kg m-3
S. extrapolated protein solubility kg m-3
t time s
t shear exposure time s
tmmean residence time s

dimension
grade efficiency
T.,. absolute temperature
Ti.thwor calculated grade efficiency value
Ti.mess measured grade efficiency value
circumferential bowl velocity it s-1
u. fluid velocity at outside radius
of disc it s-1
u, mean eddy velocity it s-I
aU voltage pulse V
3 volume m3
3 potential energy of interaction J M-1
Vdist volume of distributor m3
gravitational settling velocity it s-I
3* hindered settling velocity it s-1
.
•
c critical settling velocity it s-I
V, holdup volume m'
3 meridian particle velocity it s-I
v(h) fluid velocity profile across
width of disc it S-1
Vrib circumferential velocity of
distributor rib at rri„ m s-I
v, centrifugal settling velocity it 5-1
Vcubm volume of a cube m3
V spf-tarrm volume of a sphere m3
number of discs
dimensionless variable
z, number of caulks

Greek Symbols
dimension
0 constant
A difference -
e energy dissipated per unit mass W kg-1
ecmean error -
I microscale -
X stream parameter -
X wave length m
X. wavelength of light in vacuum In
v kinematic viscosity Pa•s
m 3.14159 -
p density kg m-3
P. density of aggregates kg m-3
PI density of liquid phase kg m-3
P. density of solids kg m-3
PR electric resistivity 0
Ap density difference kg m-3
a yield strength constant N M-2
a arithmetic standard deviation m
ac, geometric standard deviation m
T turbidity -
V half disc opening angle
m angular velocity tad s-1

References
Alex V., Koglin B. and Leschonski K, Te1lchengrii0enanalyse, Chemie-
Ingenieur-Technik, 46 (1974) pp 729-732.
Ambler C.M., The evaluation of Centrifuge performance, Chemical Engineering
Progress, 3 (1952) pp 150-158.
Argaman Y. and Kaufman W.J., Turbulence and Flocculation, Journal of the
Sanit. Eng. Div, ASCE, Vol. 96, No SA2, Proc. Paper 7201, (April 1970) pp
223-241.
Aronson A. and Quilter J, Design and Installation of Disc Stack Separators
for Biotechnology, priv. corn. 1986
Barnes E. and Mizrahi J., A Generalized Approach to the Fluid Dynamics of
Particulate Systems - Part 1: General Correlation for Fluidization and
Sedimentation in Solid Multiparticle Systems, The Chemical Engineering
Journal, 5 (1973) pp 171-189.
Bartsch ILL: Mathematische Formeln. VEB Fachbuchverlag Leipzig, 1977.
Batchelor G.K.: The Theory of Homogeneous Turbulence, Cambridge Univ. Press,
Cambridge, England, 1958.
Bell DJ., Ph.D. Thesis, University of London, 1982
Bell D.J. and Dunnill P, Shear Disruption of Soya Protein Precipitate
Particles and the Effect of Aging in a Stirred Tank, Biotechnology and
Bioengineering, 24 (1982) pp 1271-1285.
Bell DJ., Hoare M. and Dunnill P, The Formation of Protein Precipitates and
their Centrifugal Recovery, Advances in Biochemical Engineering
/Biotechnology, 26 (1983) pp 1-72.
Bell DJ., Heywood-Waddington D. and Hoare M, The Density of Protein
Precipitates and its Effect on Centrifugal Sedimentation, Biotechnology and
Bioengineering, 24 (1982) pp 127-141.
-202-

Bender W. and Koglin B, Mechanische Trennung von Bioprodukten, Chemie-
Ingenieur-Technik, 58 (1986) pp 565-577.
Bott E.W., Clarification as an Alternative to Filtration in the Wine
Industry, Filtration & Separation, Sept./Oct. 1980, pp 426-451.
Bohan H, Hydrodynamics of the Liquid in the Disc Stack of a Centrifugal
Separator, First European Conference on Mixing and Centrifugal Separation,
9th-llth September 1974, Paper F3.
Brown L.D. and Glatz E.C., Aggregate Breakage in Protein Precipitation, Paper
prepared for presentation at the Annual Meeting of the AIChE, Chicago,
Illinois, November, 1985.
Brugger K, The Particle Size Determination of Pigments with the Disc
Centrifuge, Powder Technology, 13 (1976) pp 215-221.
Brunner A., Ph.D. Thesis, University of ZUrich, Switzerland, 1956.
Brunner LB., Ph.D. Thesis, University of Erlangen, W.-Germany, 1979.
Brunner LB., Separators in Biotechnology, Westfalia Separator AG, Germany.
Brunner K.H. and Molerus 0., Partikelbewegung is Tellerseparator, vt
Verfahrenstechnik, 11 (1977) pp 538-541.
Brunner K.H. and MoIerus O., Theoretical and Experimental Investigation of
Separation Efficiency of Disc Centrifuges, German Chemical Engineering 2
(1979) 228-233.
Bufalski W., Nienaw Chatwin S. and Cooke M, The Dependency on Scale
of Power Numbers of Rushton Disc Turbines, Chemical Engineering Science,
Vol. 42, " (1987) pp 317-326.
Burt M.W.G., The Accuracy and Precision of the Centrifugal-Disc Photosedi-
mentometer Method of Particle Size Analysis, Powder Technology, 1 (1967)
pp 103-115.
Camp T.R. and Stein P.C., Journal of the Boston Society of Civil Engineers,
30 (1943) p 219.
-203-
Carlsson C.G., Ph.D. Thesis, University of Goteborg, Sweden, 1979.
Coll H. and Searles C.G., Use of Density Gradients in a Disk Centrifuge, J.
of Colloid and Interface Science, 110 (1986) pp 67-72.
Coll H. and Searls C.G., Particle Size Analysis with the Joyce-Loebl Disk
Centrifuge: A Comparison of the Line-Start with the Homogeneous-Start
Method, J. of Colloid and Interface Science, 115 (1987) pp 121-129.
Coulter W.11., Means for Counting Particles suspended in a fluid, U.S. Patent
2 656 508 (1953).
Daniels W., Polyvinylacetate, Kirk-Othmer Encyclopedia of Chemical
Technology, 3rd Edition, 23 (1983) pp 817-847.
Dater R, Centrifugal and Membrane Filtration Methods in Biochemical
Separation, Filtration & Separation, Nov./Dec. 1984, pp 402-404.
Devereux N, Hoare M. and Dunnill P, Membrane Separation of Protein
Precipitates: Unstirred Batch Studies, Biotechnology and Bioengineering, 28(1986) pp 88-96.
Dixon M. and Webb EL.: Enzymes. Longmans, London (1979).
Ebert K. and Ederer Computeranwendungen in der Chemie. Verlag Chemie,
Weinheim (1983).
Erikson R.A., Disc Stack Centrifuges in Biotechnology, Chemical Engineering
Progress, December 1984 pp 51-54.
Foster P. and Watt LG.: The CSUM fractionation process. In "Methods of
Plasma Fractionation" (Ed. J. Curling), Academic Press London and New York
(1980) pp 17-31.
Fisher RJR, Glatz, C.E. and Murphy P.A., Effects of Mixing During Acid
Addition on Fractionally Precipitated Protein, Biotechnology and
Bioengineering 28 (1986) pp 1056-1063.
Frampton GA., Evaluating the Performance of Industrial Centrifuges,
Chemical Process Engineering, August 1983, pp 401-412.
-204-

Francis A.W., Physics, 4 (1933) p 403.
Fuchs LA.: The Mechanics of Aerosols, Pergamon Press, Oxford, 1964, p 334.
Glasgow L.A. and Barkley A.W., Particle Size Reduction by Breakage in
Biological Waste Water Treatment, Biotechnology and Bioengineering, 25
(1983) pp 901-918.
Glasgow L.A. and Hsu P.J., An Experimental Study of Floc Strength, AlChE
Journal, 28 (1982) 5 pp 779-785.
Glasgow L.A. and Luecke H.R., Mechanisms of Deaggregation for Clay-Polymer
Flocs in Turbulent Systems, Industrial Engineering Chemical Fundamentals,
19 (1980) pp 143-156.
Glatz C.E., Hoare M. and Landa-Vertiz J., The Formation and Growth of
Protein Precipitates in a Continuous Stirred-Tank Reactor, AIChE Journal 32
(1986) pp 1196-1204.
Gras J1-, An Investigation of a Non-Linear Iteration Procedure for
Inversion of Particle Size Distributions, Atmospheric Environment 17 (1983)
4 pp 883-894.
Greenspan H.P.: The theory of rotating fluids, Cambridge University Press,
England, 1968.
Gregory J., Turbidity Fluctuations in Flowing Suspensions, Journal of
Colloid & Interface Science, 105 (1985) 2 pp 357-371.
Gupta S.K., Scale-up Procedures for Disc Stack Centrifuges, Chemical
Engineering Journal, 22 (1981) pp 43-49.
Gbsele W., Scale-up of Helical Conveyor Type Decanter Centrifuges, German
Chemical Engineering, 3 (1983) pp 353-359.
Han YI-, Ingham K.C. and Wickerhauser M.: Fractional precipitation of
proteins with polyethylene glycol. In "Methods of Plasma Protein
Fractionation" (Ed. J. Curling), Academic Press, London and New York (1980)
pp 57-74.
-205-

Hemfort H. and Kohlstette W, Chemical Industry, (DUsseldorf) 37 (Juni 1985)
pp 3-7.
Hemfort H. and Kohlstette V., Entwicklungstendenzen im Separatoren- und
Dekanterbau, Vortrage des VLT Seminars zum Thema: Trenntechniken, 19/20
Februar 1987 in Flein, pp 121-147.
Herdan, G.: Small Particle Statistics. Butterworth, London (1960)
Hinze J.O.: Turbulence, 2nd ed., McGraw Hill, New York, 1975, pp 222, 305-
310.
Hoare M. and Dunnill P, Biochemical Engineering Process Design for the
Recovery and Fractionation of Proteins by Precipitation, Paper presented at
the Third European Congress on Biotechnology, Munich, 10th-14th Sept. 1984.
Hoare M. and DunniI1 P, Precipitation of Food Proteins and their Recovery
by Centrifugation and Ultrafiltration, Journal of Chemical Technology
Biotechnology 34B (1984) pp 199-205.
floret D, Peska J. Svek T. and Steinberg J, Powder Technology, 31 (1982) p
263
Huck P14. and Keith L.M., Kinetic Model for Flocculation with Polymers,
Journal of the Environmental Engineering Division, EE4, Paper 13950 (August
1978) pp 767-784.
Hsu H.W.: Separations by centrifugal phenomena. Techniques of Chemistry,
Vol. XVI (1983), John Wiley & Sons.
Kachel V, Investigation into Coulter Sizing of Biological Particles;
Theoretical Background and Instrumental Improvements, Particle
Characterisation 3 (1986) pp 45-55.
Kerker M.: The Scattering of Light and Other Electromagnetic Radiation.
Academic Press New York, 1969.
Koglin B, Experimentelle Untersuchungen zur Sedimentation von Teilchen-
komplexen in Suspensionen, Chemie-Ingenieur-Technik 44 (1972) pp 515-521.
-206-

Kresze Ga.: Methods for Protein Determination; in Bergmeyer: Methods of
Enzymatic Analysis. Vol. II, 3rd. Edition (1980) pp 84-98.
Kruyt, H.R., Colloid Science, 1 (1952) Elsevier Amsterdam
Kula Mi., Honig W. and Foellmer, H.: Polyethylene glycol precipitation. In
"Proceedings of International Workshop on Technology for Protein Separation
and Improvement of Blood Plasma Fractionation" (Ed. N.E. Sandberg), National
Institute of Health Puplication No 78-1422, Washington DC USA (1977) pp
361-371.
Ladenburg 12, Analen der Physik, 20 (1903) p 287.
Langer G., Zur Sedimentationsanalyse wariger Kunststoffdispersionen mit
der Scheibenzentrifuge, Colloid & Polymer Science, 257 (1979) pp 522-532.
Levenspiel Ch: Chemical Reaction Engineering 2 (1972).
Leschonskt K, Representation and Evaluation of Particle Size Analysis Data,
Particle Characterisation, 1 (1984) pp 89-95.
Levich V.G.: Physico-Chemical Hydrodynamics, Prentice Hall Inc, Englewood
Cliffs, NJ., 1962.
Luther H, Claus A, BUttner W. and Schuster E, Untersuchungen zur
Separation aufgeschlossener Hefesuspensionen, Acta Biotechnologica 3 (1983)
2 pp 133-142.
Matsuo T. and Unno H, Forces Acting on Floc and Strength of Floc, Journal
of the Sanitary Engineering Division, ASCE, Vol. 107, No EE3, Proc. Paper
16300 (June 1981) pp 527-545.
Murkes J. and Carlsson C.G., Mathematical Modelling and Optimisation of
Centrifugal Separation, Filtration & Separation, Jan./Feb. 1978 pp 18-22
Murray Kit., The Effect of Flow Reversal through the Disc Stack of a High
Speed Disc Centrifuge, First European Conference on Mixing and Centrifugal
Separation, 9th-llth September, 1974, Paper F4.

Muscheiknautz E, Laufende Grundlagenuntersuchungen in Bereich der
Hochschulen, in GVC - Preprints: Mechanische FlUssigkeitsabtrennung (1987)
pp 223-243.
Narendranathan TJ., Ph.D. Thesis, University of London, 1981.
Nash A.M., Kwolek W.F. and Wolf W.I., Denaturation of Soybean Proteins by
Isoelectric Precipitation, Cereal Chemistry 48 (1971) pp 360-368.
Nelson C.D. and Glatz C.E., Primary Particle Formation in Protein
Precipitation, Biotechnology and Bioengineering, 27 (1985) pp 1434-1444.
Obukhoff A.M. and Yaglom A14, Prikladnaya Matematica i Mekhanika, 15
(1951) 3.
Oibridh R, Mannweiler K, Fish N.M. and Hoare M, The Separation and
Reduction of E.coli Cell Debris from Protein Inclusion Bodies, to be
pup lished.
Pandya J.D. and Spielman L.A., Floc Breakage in Agitated Suspensions: Effect
of Agitation Rate, Chemical Engineering Science, 38 (1983) 12 pp 1983-1992.
Parker DI., Kaufman W.J. and Jenkins DJ., Floc Breakup in Turbulent
Flocculation Processes,Journal of the Sanitary Engineering Division, ASCE,
Vol. 98, No SA1, Proc. Paper 8702 (Febr. 1972) pp 79-99.
Patterson I. and [anal R./4, Shear Deagglomeration of Solid Aggregates
Suspended in Viscous Liquids, The Canadian Journal of Chemical Engineering,
52 (1974) pp 306-315.
Pearse 14.J. and Barnett I, Chemical Treatments for Thickening and
Filtration, The Second World Filtration Congress, 1979.
Petenate A.M. and Glatz CJE, Isoelectric Precipitation of Soy Protein: I.
Factors Affecting Particle Size Distribution, Biotechnology and
Bioengineering, 25 (1983) pp 3049-3058.
Petenate A.M. and Glatz CE., Isoelectric Precipitation of Soy Protein: II.
Kinetics of Protein Aggregate Growth and Breakage, Biotechnology and
Bioengineering 25, (1983) pp 3059-3078.
-208-

Richardson J.F. and 2aki ICH, Transaction of the Institution of Chemical
Engineers. 32 (1954) pp 35-53.
Salt DJ., Leslie RIL, Lillford PJ. and Dunnill P, Factors Influencing
Protein Structure During Acid Precipitation: A Study of Soya Protein, Europ.
Journal of Applied Microbial Biotechnology 14 (1982) pp 144-148.
Scewen M.D. and Hammond P.M.: Protein Recovery. In ."Bioactive Microbial
Products 3 - Downstream Processing" (Ed. J.D. Stowell et al.), Academic
Press, London and New York (1986) pp 77-101.
Skvortsov L.S., A Study of Separation in the Settling Space of a
Centrifugal Cleaner-Separator, Theoretical Foundations of Chemical
Engineering, 18 (1984) 3, pp 226-233.
Skvortsov L.S. and Rachitskil V.A., Estimating the Flow Rate of Solids
Particles in the Rotor of a Centrifugal Separator, Theoretical Foundations
of Chemical Engineering, 12 (1978) pp 526-529.
Smith D.K.W. and Kitchner LA., The Strength of Aggregates Formed in
Flocculation, Chemical Engineering Science, 33 (1978) pp 1631-1639.
Smith Tig, Recovery Fractions in Centrifuges, Chemical Engineering Journal,
13 (1977) pp 21-26.
Sokolov V.I. and Dolihanova G.A., Influence of the angular velocity of
Centrifuge and Separator Rotors on Separation Efficiency, Theoretical
Foundations of Chemical Engineering, 45 (1972) pp 1063-1066.
Sokolov Va., Rusakova A.A. and Gorbunova Influence of Solids-Phase
Concentration in Suspension on Process of Thin-Layer Centrifugal
Separation, Theoretical Foundations of Chemical Engineering 9, (1975) 4, pp
537-543.
Sokolov Semenov E.V. and Gorbunova V.V., Calculating the Throughput
Capacity of a Centrifuge Separator, Theoretical Foundations of Chemical
Engineering, 11 (1977) pp 220-224.
Sokolnw Moderne Industriezentrifugen, VEB Technik Verlag, Berlin 1971.
-209-

Stanley J.H. and Locke WI., Continuous Centrifugation in a Disc Centrifuge,
AIChE Journal, 3 (1957) pp 480-483.
Tambo N. and Watanabe Y, Physical Characteristics of Flocs: I. The Floc
Density Function and Aluminium Floc, Water Research, 13 (1979) pp 409-419.
Tambo N. and Watanabe Y, Physical Aspects of Flocculation Process -I.
Fundamental Treatise, Water Research, 13 (1979) pp 429-439.
Taabo N. and Hozumi H, Physical Characteristics of Flocs: II. Strength of
Floc, Water Research, 13 (1979) pp 421-427.
Thomas D.C., Turbulent Disruption of Flocs in Small Particle Size
Suspensions, AIChE Journal, 10 (July 1964) pp 517-523.
Toni D.T. and Bagster Dir., A Model of Floc Strength under Hydrodynamic
Forces, Chemical Engineering Science, 30 (1975) pp 269-278.
Tomi D.T. and Bagster D.F., The Behaviour of Aggregates in Stirred Vessels:
Part II- An Experimental Study of the Flocculation of Gelena in a Stirred
Tank, Transactions of the Institution of Chemical Engineers, 56 (1978) pp
9-19.
Treasure C.R.G., in T. Allen: Particle Size Measurement, Chapman and Hall
London, 3rd Edition, 1981.
Treweek, G.P. and Morgan Li., Size Distributions of Flocculated Particles:
Application of Electronic Particle Counters, Environmental Science
Technology, 11 (1977) 7 pp 707-714.
Twinehan M., Hoare M. and Bell, DJ., The Effects of Protein Concentration on
the Breakup of Protein Precipitate by Exposure to Shear, Chemical
Engineering Science, 39 (1984) pp 509-513.
Twomey S.A., Comparison of Constrained Linear Inversion and an Iterative
Nonlinear Algorithm Applied to the Indirect Estimation of Particle Size
Distributions, Journal of Computational Physics, 18 (1975) pp 188-200.

Twomey S.A. and Zalabsky LA., Multifilter Technique for Examination of the
Size Distribution of the Natural Aerosol in the Submicrometer Size Range,
Environmental Science & Technology, 15 (1981) 2 pp 177-184.
Ullrich W.I., Modern Developments in Powder Metall, Vol. 1, Fundamentals and
Methods, Rhenum (1966) p 125.
Van der Linden JP., Ph.D. Thesis, University of Delft, Netherlands, 1987.
Virkar, PD., Hoare M., than M.Y.Y. and Dunnill P, Kinetics of the Acid
Precipitation of Soya Protein in a Continuous-Flow Tubular Reactor,
Biotechnology and Bioengineering, 24 (1982) pp 871-887.
Ward P, Ph.D. Thesis, University of London 1989
Willus CA. and Fitch, B, Flow Patterns in a Disc Centrifuge, Chemical
Engineering Progress, 69 (1973) 9, pp 73-74.
Wolf Wi., Dayle AS. and Babcock G.E., Denaturation of Soybean Globulins by
Aqueous Isopropanol, Cereal Chemistry, 41 (1961) pp 328-339.
Yu P.Y. and Gentry J, Comparison of Generic Inversion Algorithms for
Characterising Particle Size Distributions, Powder Technology, 50 (1987) pp
79-89.
Zastrow J, Theoretical Calculation of the Performance of Disc Centrifuges,
International Chemical Engineering, 16 (1976) 3, pp 515-518.
Zimmels 7, Hindered Motion of Particulate System in Newtonian Fluids -
Acceleration and Steady Regime, Powder Technology, 34 (1983) pp 191-202.

Appendix
-212-

Table Al; Examination of separation performance of disc centrifuge
equipped with different feed zone designs using polyvinylacetate
particles.
No Type pis pout Q Ps PI
bar bar L h- 1 'C kg M7 3 kg M73
1 H 2.31 5.23 300 20 1190 998.22 HR 0.50 2.45 300 16 1190 998.93 H 2.40 5.20 300 16 1190 998.94 HR 0.58 2.56 300 15 1190 999.15 HH 0.55 2.23 400 15 1190 999.16 HR 0.53 1.90 500 15 1190 999.17 H 1.80 3.40 400 18 1190 998.68 s 0.10 1.50 200 17 1190 998.89 s 0.10 1.40 300 16 1190 998.910 s 0.20 1.50 400 16 1190 998.911 H 2.25 4.95 800 14 1190 999.212 H 2.30 5.15 600 14 1190 999.213 H 2.15 4.80 600 14 1190 999.214 HR 0.61 2.44 400 17 1190 998.815 HR 0.54 2.00 400 17 1190 998.816 HR 0.60 1.90 600 17 1190 998.817 HR 0.65 1.40 800 17 1190 998.818 H 2.48 5.34 400 17 1190 998.819 HR 0.58 1.94 600 17 1190 998.820 HR 1.00 1.36 600 18 1190 998.621 HR 0.69 1.03 900 17 1190 998.822 H 2.40 5.25 600 18 1190 998.623 H 2.40 5.22 900 18 1190 998.624 H 2.40 5.10 1200 18 1190 998.625 HR 0.90 2.15 900 18 1190 998.626 H 2.20 4.40 300 18 1190 998.627 H 2.20 5.22 400 18 1190 998.628 H 1.82 4.73 200 16 1190 998.929 H 2.09 5.45 300 16 1190 998.930 HR 0.59 2.52 200 16 1190 998.931 HR 0.58 2.43 300 16 1190 998.932 HR 0.65 2.20 400 16 1190 998.933 H 2.11 5.16 300 16 1190 998 934 HR 0.65 2.52 300 16 1190 998.935 H 2.03 5.10 400 16 1190 998.936 HH 0.65 2.19 400 16 1190 998.937 H 1.80 3.87 200 16 1190 998.938 HR 0.50 1.87 200 16 1190 998.939 H 2.27 3.65 300 17 1190 998.840 HR 0.51 1.53 300 17 1190 998.841 H 1.90 4.80 400 15 1190 999.142 s 0.10 1.50 400 15 1190 999.143 s 0.30 1.35 600 15 1190 999.144 H 2.14 4.90 600 15 1190 999.1
The density data of the carrier liquid (water) were obtained from the
Chemiker Kalender, 2nd Edition, Springer-Verlag, Heidelberg (1974)
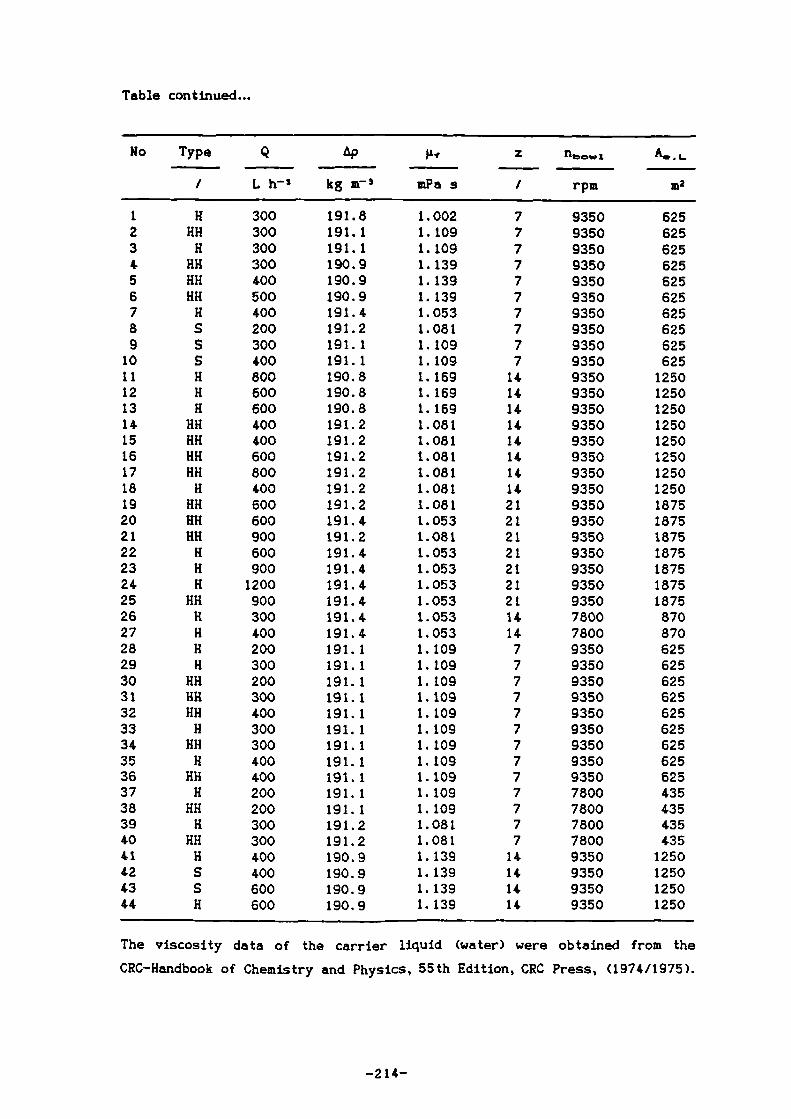
Table continued.-
No Type Q sse.c..01
/ L h- s kg M-3 mPa s / rpm m2
1 H 300 191.8 1.002 7 9350 6252 HR 300 191.1 1.109 7 9350 6253 H 300 191.1 1.109 7 9350 6254 HR 300 190.9 1.139 7 9350 6255 HH 400 190.9 1.139 7 9350 6256 HH 500 190.9 1.139 7 9350 6257 H 400 191.4 1.053 7 9350 6258 s 200 191.2 1.081 7 9350 6259 s 300 191.1 1.109 7 9350 625
10 s 400 191.1 1.109 7 9350 62511 H 800 190.8 1.169 14 9350 125012 H 600 190.8 1.169 14 9350 125013 H 600 190.8 1.169 14 9350 125014 HR 400 191.2 1.081 14 9350 125015 HH 400 191.2 1.081 14 9350 125016 HR 600 191.2 1.081 14 9350 125017 HH 800 191.2 1.081 14 9350 125018 H 400 191.2 1.081 14 9350 125019 HH 600 191.2 1.081 21 9350 187520 HR 600 191.4 1.053 21 9350 187521 HR 900 191.2 1.081 21 9350 187522 H 600 191.4 1.053 21 9350 187523 H 900 191.4 1.053 21 9350 187524 H 1200 191.4 1.053 21 9350 187525 HR 900 191.4 1.053 21 9350 187526 H 300 191.4 1.053 14 7800 87027 H 400 191.4 1.053 14 7800 87028 H 200 191.1 1.109 7 9350 62529 H 300 191.1 1.109 7 9350 62530 HR 200 191.1 1.109 7 9350 62531 HR 300 191.1 1.109 7 9350 62532 HH 400 191.1 1.109 7 9350 62533 H 300 191.1 1.109 7 9350 62534 HH 300 191.1 1.109 7 9350 62535 H 400 191.1 1.109 7 9350 62536 HH 400 191.1 1.109 7 9350 62537 H 200 191.1 1.109 7 7800 43538 HR 200 191.1 1.109 7 7800 43539 H 300 191.2 1.081 7 7800 43540 HH 300 191.2 1.081 7 7800 43541 H 400 190.9 1.139 14 9350 125042 S 400 190.9 1.139 14 9350 125043 S 600 190.9 1.139 14 9350 125044 H 600 190.9 1.139 14 9350 1250
The viscosity data of the carrier liquid (water) were obtained from the
CRC-Handbook of Chemistry and Physics, 55th Edition, CRC Press, (1974/1975).

Table continued.-
No Type Q q. dc El, E.,..,* ET,K
/ L h- 1 L/ (h m2 ) pm / / /
1 li 300 0.48 1.21 0.602 0.248 0.5882 HR 300 0.48 1.21 0.630 0.223 0.6453 H 300 0.48 1.21 0.639 0.228 0.6384 NH 300 0.48 1.21 0.626 0.222 0.6455 HH 400 0.64 1.40 0.603 0.313 0.4816 NH 500 0.80 1.57 0.608 0.359 0.4107 H 400 0.64 1.35 0.624 0.302 0.5168 s 200 0.32 0.95 0.652 0.226 0.6539 s 300 0.48 1.20 0.652 0.372 0.429
10 s 400 0.64 1.38 0.656 0.470 0.28411 H 800 0.64 1.42 0.602 0.377 0.37412 H 600 0.48 1.23 0.598 0.324 0.45813 H 600 0.48 1.23 0.598 0.323 0.46014 HR 400 0.32 0.97 0.588 0.159 0.73015 HH 400 0.32 0.97 0.588 0.159 0.73016 HR 600 0.48 1.19 0.586 0.278 0.52617 HR 800 0.64 1.37 0.586 0.350 0.40318 li 400 0.32 0.97 0.587 0.159 0.72919 HR 600 0.32 0.97 0.575 0.137 0.76220 HR 600 0.32 0.95 0.556 0.120 0.78421 HR 900 0.48 1.19 0.572 0.226 0.60522 H 600 0.32 0.96 0.574 0.103 0.82123 /1 900 0.48 1.19 0.574 0.189 0.67124 li 1200 0.64 1.37 0.574 0.253 0.55825 HR 900 0.48 1.18 0.576 0.227 0.60126 li 300 0.34 0.99 0.596 0.165 0.72327 li 400 0.32 0.95 0.605 0.155 0.74428 H 200 0.32 0.97 0.603 0.143 0.76329 H 300 0.48 1.19 0.603 0.252 0.58230 NH 200 0.32 0.97 0.607 0.151 0.75131 HH 300 0.48 1.19 0.608 0.271 0.55432 HR 400 0.64 1.37 0.602 0.348 0.42233 H 300 0.48 1.19 0.521 0.208 0.60134 HH 300 0.48 1.19 0.521 0.205 0.60735 H 400 0.64 1.38 0.518 0.262 0.49436 HR 400 0.64 1.38 0.520 0.271 0.47937 H 200 0.46 1.17 0.514 0.195 0.62138 HH 200 0.46 1.17 0.513 0.196 0.61839 H 300 0.69 1.42 0.518 0.277 0.46540 HR 300 0.69 1.42 0.515 0.282 0.45241 H 400 0.32 0.99 0.602 0.208 0.65442 s 400 0.32 0.99 0.601 0.222 0.63143 s 600 0.48 1.21 0.600 0.355 0.40844 H 600 0.48 1.21 0.597 0.327 0.452

Table continued-.
No Type Q d... k n E,12 ET.pren1
/ L h-1 Pm / / / /
1 H 300 1.53 0.771 2.017 0.610 0.6412 HR 300 1.59 0.841 2.046 0.672 0.6573 H 300 1.59 0.853 2.119 0.683 0.6564 HR 300 1.48 0.837 2.340 0.656 0.6245 HH 400 1.44 0.799 2.064 0.519 0.4996 HR 500 1.44 0.790 1.952 0.460 0.4297 H 400 1.45 0.769 1.867 0.539 0.506a S 200 1.14 0.844 2.705 0.643 0.6359 S 300 1.15 0.799 2.132 0.448 0.445
10 S 400 1.15 0.751 2.412 0.302 0.35211 H 800 1.25 0.750 2.120 0.390 0.40812 H 600 1.28 0.752 2.377 0.477 0.52213 H 600 1.25 0.793 2.435 0.496 0.50514 HR 400 1.32 0.851 2.896 0.721 0.72315 HR 400 1.42 0.808 2.894 0.732 0.76916 HH 600 1.31 0.794 2.815 0.543 0.56117 HH 800 1.31 0.745 2.535 0.410 0.45518 H 400 1.44 0.794 2.537 0.727 0.77319 HH 600 1.45 0.851 2.649 0.764 0.77320 HR 600 1.57 0.773 2.938 0.781 0.82221 HH 900 1.59 0.738 2.340 0.623 0.67622 H 600 1.61 0.845 2.417 0.813 0.82923 H 900 1.60 0.790 2.200 0.674 0.68024 H 1200 1.63 0.751 2.274 0.569 0.57925 HH 900 1.52 0.762 2.454 0.619 0.65626 H 300 1.27 0.901 2.407 0.713 0.68227 H 400 1.23 0.921 2.392 0.739 0.69328 H 200 1.29 0.909 2.500 0.757 0.71129 H 300 1.28 0.861 1.980 0.592 0.54130 HH 200 1.29 0.889 2.662 0.741 0.71331 HR 300 1.29 0.820 2.098 0.562 0.54332 HH 400 1.27 0.752 1.998 0.423 0.43133 H 300 1.36 0.843 1.965 0.617 0.58234 HR 300 1.36 0.795 2.041 0.580 0.58135 H 400 1.37 0.799 1.874 0.512 0.48036 HR 400 1.36 0.797 1.971 0.500 0.47237 H 200 1.36 0.849 2.175 0.623 0.59938 HR 200 1.36 0.875 2.336 0.632 0.59539 H 300 1.36 0.796 1.715 0.495 0.45540 HH 300 1.36 0.785 1.821 0.482 0.45241 H 400 1.27 0.866 2.563 0.689 0.68542 S 400 1.26 0.847 2.617 0.666 0.68343 S 600 1.27 0.740 2.290 0.458 0.51644 H 600 1.25 0.760 2.249 0.479 0.512

Key to Table Al:
No: Number of experiment
Type: feed zone (distributor) type (i) H = full-hermetic
(ii) HH = hydro-hermetic
(iii) S = semi-hermetic
Pin : feed pressure
pout: discharge pressure
Q: throughput capacity or feed flow rate
8: temperature of feed suspension
density of solids phase
pi : density of liquid phase
Ap: density difference between solids and liquid phase Om p.-p,)
Pf : dynamic viscosity of liquid phase
z: number of separating discs
nnowl : rotational velocity of bowl
equivalent separation or clarification area (Equation 1.20),
relevant centrifuge specifications are listed in Table 2.1.
qs : specific throughput capacity Om Q/A.)
dc :critical particle diameter Equation 1.17)
Es.: extinction reading of feed suspension at X=695 nm
ED..: extinction reading of clarified liquid discharge at X=695 nm
E,.E: extinction based mass yield of separation process 0= 1 —
(EctutlEin))
d...: median particle size of the solids size distribution In the feed
to centrifuge
k: parameter of grade efficiency curve correlation function
n: parameter of grade efficiency curve correlation function
ET.Elz : size distribution based mass yield of separation process
ET.pred : predicted mass yield based on the corresponding feed size
distribution and grade efficiency function expressed by the
expression T = 1 - expl-(k .d/der], where k, n = f(q.) (ain. 4.1).